Managing Growing Pains for the Sustainable Growth of ... - MDPI
24
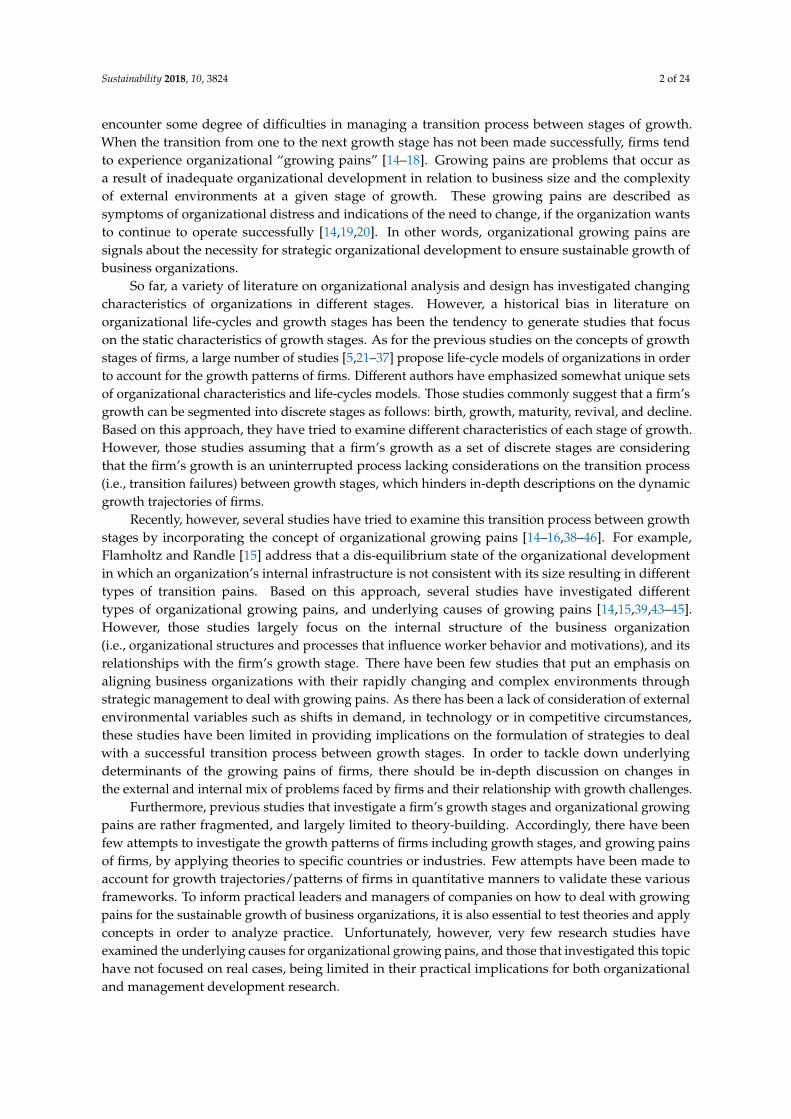
sustainability Article Managing Growing Pains for the Sustainable Growth of Organizations: Evidence from the Growth Pathways and Strategic Choices of Korean Firms Yeongjun Yeo 1 and Chansoo Park 2, * 1 Technology Management, Economics, and Policy Program, College of Engineering, Seoul National University, Gwanak-gu, Seoul 151-742, Korea; [email protected] 2 Science and Technology Policy Institute (STEPI), 370 Sicheong-daero, Sejong-si 30147, Korea * Correspondence: [email protected]; Tel.: +82-44-287-2165; Fax: +82-44-287-2068 Received: 3 August 2018; Accepted: 18 October 2018; Published: 22 October 2018 Abstract: Life-cycle literature suggests that business organizations evolve in consistent and predictable manners, implying that organizational structures and strategies evolve as firms move through growth stages. The sustainable growth of firms involves successful transitions between growth stages through managing different types of organizational growing pains and maintaining sustainable competitive positions, suggesting shifts in the strategic orientation of the firms as the firms grow. Based on this approach, this study proposes a holistic framework to account for linkages between determinants of a firm’s growing pains and key areas of organizational development, based on a synthesis of qualitative and quantitative findings. From statistical analyses, Korean firms are found to have proceeded through distinct stages of growing pains as they reached organizational sizes as follows: 20, 100, 300, and 500 million USD in sales revenue. Furthermore, qualitative findings suggest that business strategies evolve to deal with different types of growing pains in life-cycle stages from the systemization of management system to the revitalization process. Our results expect to provide extensive knowledge on the role of strategic management to deal with firm’s growing pains, considering both internal and external factors governing organizations. Furthermore, this study expects to provide an insightful and practical framework for managing organizational growing pains and transitions required to build sustainably successful organizations. Keywords: firm’s growth; growing pains; growth stage; business strategy; sustainable growth JEL Classification: D20; L20; M10 1. Introduction Organizational life-cycle models suggest that the development of any business organization tends to follow predictable patterns [1,2]. One of the key assumptions underlying life-cycle models is that there are regularities of organizational development process, which can be segmented into discrete stages from birth to death like every living organism [3–5]. It also refers to the expected sequences of advancements experienced by an organization, as opposed to a randomized occurrence of events. Another assumption is that organizational structures in one stage are not same as those in other stages. Thus, each stage of growth would have different sets of challenges under different operating contexts. Firms face different sets of internal and external environmental variables as they move from one to another stage of growth. External variables include shifts in demand, in technology or in competitive circumstances, while internal variables describe the conditions of a firm’s resources, capabilities, and internal organizational system. Changes in the external and internal mix of problems for companies provide different sets of strategic challenges [6–13]. As a result, organizations Sustainability 2018, 10, 3824; doi:10.3390/su10103824 www.mdpi.com/journal/sustainability
-
Upload
khangminh22 -
Category
Documents
-
view
1 -
download
0
Transcript of Managing Growing Pains for the Sustainable Growth of ... - MDPI
sustainability
Article
Managing Growing Pains for the Sustainable Growthof Organizations: Evidence from the GrowthPathways and Strategic Choices of Korean Firms
Yeongjun Yeo 1 and Chansoo Park 2,*1 Technology Management, Economics, and Policy Program, College of Engineering,
Seoul National University, Gwanak-gu, Seoul 151-742, Korea; [email protected] Science and Technology Policy Institute (STEPI), 370 Sicheong-daero, Sejong-si 30147, Korea* Correspondence: [email protected]; Tel.: +82-44-287-2165; Fax: +82-44-287-2068
Received: 3 August 2018; Accepted: 18 October 2018; Published: 22 October 2018�����������������
Abstract: Life-cycle literature suggests that business organizations evolve in consistentand predictable manners, implying that organizational structures and strategies evolve as firmsmove through growth stages. The sustainable growth of firms involves successful transitions betweengrowth stages through managing different types of organizational growing pains and maintainingsustainable competitive positions, suggesting shifts in the strategic orientation of the firms as the firmsgrow. Based on this approach, this study proposes a holistic framework to account for linkagesbetween determinants of a firm’s growing pains and key areas of organizational development,based on a synthesis of qualitative and quantitative findings. From statistical analyses, Korean firmsare found to have proceeded through distinct stages of growing pains as they reached organizationalsizes as follows: 20, 100, 300, and 500 million USD in sales revenue. Furthermore, qualitative findingssuggest that business strategies evolve to deal with different types of growing pains in life-cycle stagesfrom the systemization of management system to the revitalization process. Our results expect toprovide extensive knowledge on the role of strategic management to deal with firm’s growing pains,considering both internal and external factors governing organizations. Furthermore, this studyexpects to provide an insightful and practical framework for managing organizational growing painsand transitions required to build sustainably successful organizations.
Keywords: firm’s growth; growing pains; growth stage; business strategy; sustainable growth
JEL Classification: D20; L20; M10
1. Introduction
Organizational life-cycle models suggest that the development of any business organization tendsto follow predictable patterns [1,2]. One of the key assumptions underlying life-cycle models is thatthere are regularities of organizational development process, which can be segmented into discretestages from birth to death like every living organism [3–5]. It also refers to the expected sequencesof advancements experienced by an organization, as opposed to a randomized occurrence of events.Another assumption is that organizational structures in one stage are not same as those in other stages.Thus, each stage of growth would have different sets of challenges under different operating contexts.
Firms face different sets of internal and external environmental variables as they move fromone to another stage of growth. External variables include shifts in demand, in technology or incompetitive circumstances, while internal variables describe the conditions of a firm’s resources,capabilities, and internal organizational system. Changes in the external and internal mix of problemsfor companies provide different sets of strategic challenges [6–13]. As a result, organizations
Sustainability 2018, 10, 3824; doi:10.3390/su10103824 www.mdpi.com/journal/sustainability
Sustainability 2018, 10, 3824 2 of 24
encounter some degree of difficulties in managing a transition process between stages of growth.When the transition from one to the next growth stage has not been made successfully, firms tendto experience organizational “growing pains” [14–18]. Growing pains are problems that occur asa result of inadequate organizational development in relation to business size and the complexityof external environments at a given stage of growth. These growing pains are described assymptoms of organizational distress and indications of the need to change, if the organization wantsto continue to operate successfully [14,19,20]. In other words, organizational growing pains aresignals about the necessity for strategic organizational development to ensure sustainable growth ofbusiness organizations.
So far, a variety of literature on organizational analysis and design has investigated changingcharacteristics of organizations in different stages. However, a historical bias in literature onorganizational life-cycles and growth stages has been the tendency to generate studies that focuson the static characteristics of growth stages. As for the previous studies on the concepts of growthstages of firms, a large number of studies [5,21–37] propose life-cycle models of organizations in orderto account for the growth patterns of firms. Different authors have emphasized somewhat unique setsof organizational characteristics and life-cycles models. Those studies commonly suggest that a firm’sgrowth can be segmented into discrete stages as follows: birth, growth, maturity, revival, and decline.Based on this approach, they have tried to examine different characteristics of each stage of growth.However, those studies assuming that a firm’s growth as a set of discrete stages are consideringthat the firm’s growth is an uninterrupted process lacking considerations on the transition process(i.e., transition failures) between growth stages, which hinders in-depth descriptions on the dynamicgrowth trajectories of firms.
Recently, however, several studies have tried to examine this transition process between growthstages by incorporating the concept of organizational growing pains [14–16,38–46]. For example,Flamholtz and Randle [15] address that a dis-equilibrium state of the organizational developmentin which an organization’s internal infrastructure is not consistent with its size resulting in differenttypes of transition pains. Based on this approach, several studies have investigated differenttypes of organizational growing pains, and underlying causes of growing pains [14,15,39,43–45].However, those studies largely focus on the internal structure of the business organization(i.e., organizational structures and processes that influence worker behavior and motivations), and itsrelationships with the firm’s growth stage. There have been few studies that put an emphasis onaligning business organizations with their rapidly changing and complex environments throughstrategic management to deal with growing pains. As there has been a lack of consideration of externalenvironmental variables such as shifts in demand, in technology or in competitive circumstances,these studies have been limited in providing implications on the formulation of strategies to dealwith a successful transition process between growth stages. In order to tackle down underlyingdeterminants of the growing pains of firms, there should be in-depth discussion on changes inthe external and internal mix of problems faced by firms and their relationship with growth challenges.
Furthermore, previous studies that investigate a firm’s growth stages and organizational growingpains are rather fragmented, and largely limited to theory-building. Accordingly, there have beenfew attempts to investigate the growth patterns of firms including growth stages, and growing painsof firms, by applying theories to specific countries or industries. Few attempts have been made toaccount for growth trajectories/patterns of firms in quantitative manners to validate these variousframeworks. To inform practical leaders and managers of companies on how to deal with growingpains for the sustainable growth of business organizations, it is also essential to test theories and applyconcepts in order to analyze practice. Unfortunately, however, very few research studies haveexamined the underlying causes for organizational growing pains, and those that investigated this topichave not focused on real cases, being limited in their practical implications for both organizationaland management development research.
Sustainability 2018, 10, 3824 3 of 24
Considering these limitations of previous studies, this study aims to propose a holistic frameworkto account for growth trajectories of firms in terms of the transition process between growth stagesand growing pains encountered by firms. The academic institution behind this approach is thata firm’s sustainable growth over the long term involves a dynamic process incorporating periods ofgrowing pains, and a successful transition process, which is not described as a series of distinctivediscrete stages [47]. In developing a conceptual framework, this study extends the definition oforganizational growing pains beyond the previous literature. We define organizational growing painsas “transition failures resulting from inadequate organizational development in relation to businesssize and complexity of the external environment at a given stage of growth”. Based on this extendeddefinition of organizational growing pains, we investigate the underlying causes of organizationalgrowing pains encountered by Korean firms, and the key developmental areas of organizationaldevelopment required to deal with growing pains. As a result, we highlight the importance ofthe formulation of business strategies to align a firm’s internal infrastructure with their rapidlychanging and complex environments in dealing with organizational growing pains.
To be specific, we synthesize two approaches in developing a conceptual framework to accountfor linkages between determinants of a firm’s growing pains and the formulation of business strategiesin terms of key areas of organizational development. The first approach is to identify quantitativelyand explore stages of growing pains encountered by Korean firms from the 1990s to 2010s usingthe statistical analysis of 1788 companies in Korea from 17 industries between 1990 and 2013. Based onquantitative findings drawn from the statistical analysis, we formalize the proposed conceptualframework to account for a business organization’s life-cycle in terms of organizational growingpains and key developmental areas with the consideration of the industry-specific and institutionalconditions of Korea. The second approach is to examine case examples to highlight the importanceof firm’s strategies in dealing with organizational problems appropriately in order to overcomegrowing pains. Through the case studies, we will explore the underlying causes of the growingpains encountered by Korean firms from the 1990s to 2010s, focusing on external and internal factors,and highlight the importance of the business management strategies to overcome growing pains.From the case studies, we stress the importance of strategic management to overcome growing painsduring the growth paths of firms. Based on the qualitative findings drawn from the case studies,we expect to offer evidence to complement and enhance the accountability of our proposed framework.
Different sets of internal and external environmental variables governing the businessorganizations result in different types of challenges and transition failures that firms are likelyto meet as they proceed to the next stages of growth. From this perspective, we argue thatthe sustainable growth of firms involves successful transitions between growth stages throughmanaging different types of organizational growing pains and maintaining sustainable competitivepositions. In other words, this suggests shifts in the strategic orientation of the firms as the firmsgrow. Therefore, it is important for managers and founders of companies to understand the differentaspects of the transitions over the life-cycle of business organizations in order to secure the sustainablegrowth of firms. Our study is significant, in that it is devoted to an analysis where theories areput into practice by suggesting a new conceptual framework based on a synthesis of qualitativeand quantitative findings. Ultimately, this study expects to provide comprehensive insights formanagers to understand the underlying causes of growing pains and to proactively determine effectivemeasures to continue to grow organizations successfully.
The rest of the paper is structured as follows: Section 2 provides descriptions of the statisticaldata analysis and our proposed framework; Section 3 presents case studies for companies to provideextensive explanations on the role of strategies to deal with growing pains; and lastly, the summaryand concluding remarks are provided in Section 4.
Sustainability 2018, 10, 3824 4 of 24
2. Quantitative Methods and Findings
2.1. Data and Methodology
As a first step for quantitatively identifying the growing pains of firms, we collected firm-leveldata from Total Solution 2000 (TS2000) of Korea Companies Information (KOCOinfo, Seoul, Korea)provided by the Korea Listed Companies Association. The KOCOinfo database provides a shortcompany profile, some basic firm information (e.g., establishment year, ownership and managementstructure), a set of general financial figures (e.g., equity capital, market capitalization), and a setof time-variant indicators that are usually reported on an annual basis (e.g., number of employees,revenue). We use additional data sources from a repository of Korea’s corporate filings provided bythe Financial Supervisory Service’s (FSS) of the Data Analysis, Retrieval and Transfer System (DART,Seoul, Korea) to complete the missing data in our sample. Based on these raw data sources, we constructdatasets on an annual basis which contain information on 1788 companies from 17 industries from 1990to 2013.
Even though a number of studies have tried to examine a firm’s growth by calculating actualgrowth in annual revenues applied to actual data on annual basis [36,48,49], this approach hasa high possibility to entail outlier problems with high volatility in actual growth in annual revenues.Accordingly, we apply the Hodrick–Prescott (HP) filtering technique to calculate smoothed trendsof a firm’s revenue growth. The HP filter is a spline-smoothing method to identify the trend effectsbased on the assumption that the time-series effect can be decomposed into a trend componentand a cyclical component [50] (The HP filtering method assumes that time-series variable (yt) can bedecomposed into a trend component (τt) and a cyclical component (ct), such that yt = τt + ct.This algorithm smooths the original time-series yt to estimate its trend components, τt by solvingthe following equation: min
τ
(∑T
t=1(yt − τt)2 + λ ∑T−1
t=2 [(τt+1 − τt)− (τt − τt−1)]2)
. The value of λ
determines the degree of penalizing the cyclical component, and we set the level of λ = 100 inthis study). The data-smoothing method has been widely used to remove the effects of measurementerror and reveal the underlying trend in the data. The HP filtering method has been used extensively inapplied economics to detrend data, particularly to assist in the measurement of business cycles [51,52].
Applying this methodological approach, we examine the growth paths of firms throughsmoothing the actual growth rates of firms’ revenues. For the analysis, we use the three-yearmoving averages of annual revenues of firms when calculating annual growth rates of firms’ revenues.The moving-average method is useful in smoothing a time-series to see its trend, and measuringthe seasonal fluctuations in the actual data. To avoid outlier problems with high volatility inactual growth in the annual revenues of firms, we apply the moving-average method and HPfilter method for the analysis. We exclude companies with missing values for the annual revenuesover four years from the sample. After excluding companies with missing data from the sample,we conduct statistical analyses for 745 companies in the sample, based on time-series sales revenueinformation from 1990 to 2013. In addition, we have tried to reclassify the companies in the sampleinto nine industries for simplicity in the analysis. (We consider nine industrial sectors consistingof six manufacturing sectors and three non-manufacturing sectors (i.e., manufacturing sectors:(1) Food products and beverages; (2) Textiles, sewn wearing apparel, pulp, paper and paper products;(3) Chemical products except pharmaceuticals, medicinal chemicals; (4) Pharmaceuticals, medicinalchemicals and botanical products; (5) Transport equipment, metal products, and non-metallicmineral products; and (6) Electronic components, optical instruments and electrical equipment;non-manufacturing sectors: (7) Electricity, gas, steam, water supply, and construction; (8) Wholesale,retail trade, information and communications; and (9) Other services sectors.) The brief informationon descriptive statistics of the sample is presented in Appendix A.
To trace the growing pains encountered by firms as they pass through growth stages, firstly we haveplotted the annual growth rates of sales revenues of firms in terms of their organizational sizes ina longitudinal manner. Following other studies’ [48,53–56] approaches, the size of annual revenues earned
Sustainability 2018, 10, 3824 5 of 24
by each firm is used as a proxy variable to describe the firm’s size. One of the key underlying assumptionsbehind this methodological approach is that organizational problems tend to change markedly as firms’sizes increase [30]. After plotting the smoothed trends of annual growth rates of sales revenue inrelation to the organizational sizes of firms in the sample, we consider the inflection point (i.e., period)of declination and stagnation of sales growth rates as the periods of growing pains encountered by firms.When sales revenue of the firm or its growth rate falls, we consider that the growing pain stage is observed.On the other hand, when the annual growth rates of sales revenue increase after stages of growing pains,we consider those firms having overcome their organizational growing pains.
The growth rates of sales revenues are one of conventional indicators that represent the abilitiesof firms to maintain/reduce/increase the level of their market competitiveness [57–60]. In addition,this indicator is described as the outcome and the measure of effectiveness of business organizationsassociated with the conditions of firms’ strategies aligning their internal infrastructure with externalenvironments [57]. Furthermore, the inflection point of the growth rates of sales revenues can beunderstood as signals that affected firms must make certain fundamental changes with the formulationof strategies in order to continue to growth and proceed to the next growth stages. In this study,we extend the definition of the organizational growing pains by defining it as a transitionfailure resulting from the inadequate organizational development in relation to business sizeand the complexity of the external environment at a given stage of growth. Accordingly, we think it isreasonable to consider the inflection point (i.e., period) of declination and stagnation of sales growthrates identified from the statistical analysis as the periods of growing pains encountered by firms.
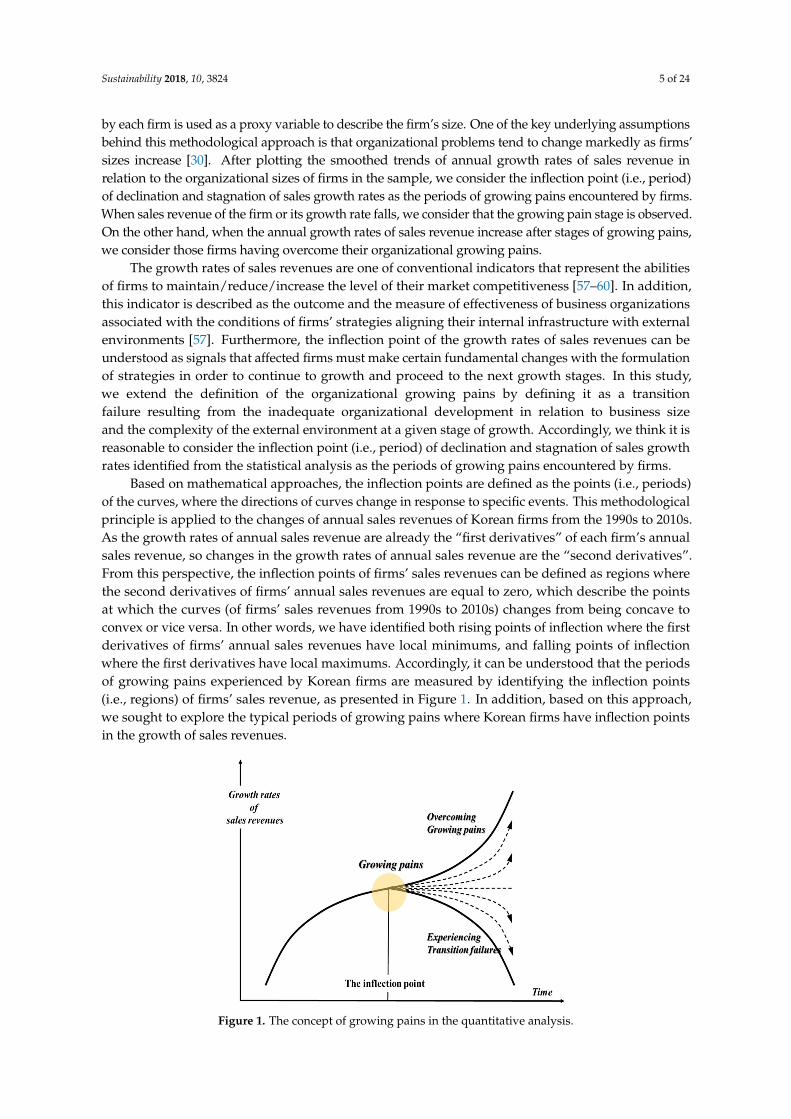
Based on mathematical approaches, the inflection points are defined as the points (i.e., periods)of the curves, where the directions of curves change in response to specific events. This methodologicalprinciple is applied to the changes of annual sales revenues of Korean firms from the 1990s to 2010s.As the growth rates of annual sales revenue are already the “first derivatives” of each firm’s annualsales revenue, so changes in the growth rates of annual sales revenue are the “second derivatives”.From this perspective, the inflection points of firms’ sales revenues can be defined as regions wherethe second derivatives of firms’ annual sales revenues are equal to zero, which describe the pointsat which the curves (of firms’ sales revenues from 1990s to 2010s) changes from being concave toconvex or vice versa. In other words, we have identified both rising points of inflection where the firstderivatives of firms’ annual sales revenues have local minimums, and falling points of inflectionwhere the first derivatives have local maximums. Accordingly, it can be understood that the periodsof growing pains experienced by Korean firms are measured by identifying the inflection points(i.e., regions) of firms’ sales revenue, as presented in Figure 1. In addition, based on this approach,we sought to explore the typical periods of growing pains where Korean firms have inflection pointsin the growth of sales revenues.
Figure 1. The concept of growing pains in the quantitative analysis.
Sustainability 2018, 10, 3824 6 of 24
2.2. Key Findings on Stages of Growing Pains
Based on these assumptions for the statistical analysis, we plot smoothed trends of annual growthrates of sales revenues in accordance with organizational sizes of firms in the sample using the HP filtermethod. Our HP filtering analysis suggests that growing pains tend to appear as Korean companiesreach organizational sizes of around 20, 100, 300, and 500 million USD in terms of sales revenue.Each stage of growing pains found in an inflection point of stagnation or declination of revenuegrowth is strongly associated with the growth trajectories of firms. Organizational growing painsmight be signals that organizations have reached new stages in their development and must makemajor, qualitative changes. In this regard, each stage of growing pains should be understood inaccordance with the external and internal variables governing the growth stages, as well as the phase oforganizational development. Awareness of both internal factors and external conditions in each stage ofgrowth can help us understand the origin and underlying causes of growing pains. Considerations onindustry-specific and institutional conditions of Korea are also reflected in our interpretations on eachstage of growing pains.
2.2.1. The First Stage of Growing Pains: 20 Million USD of Company Size
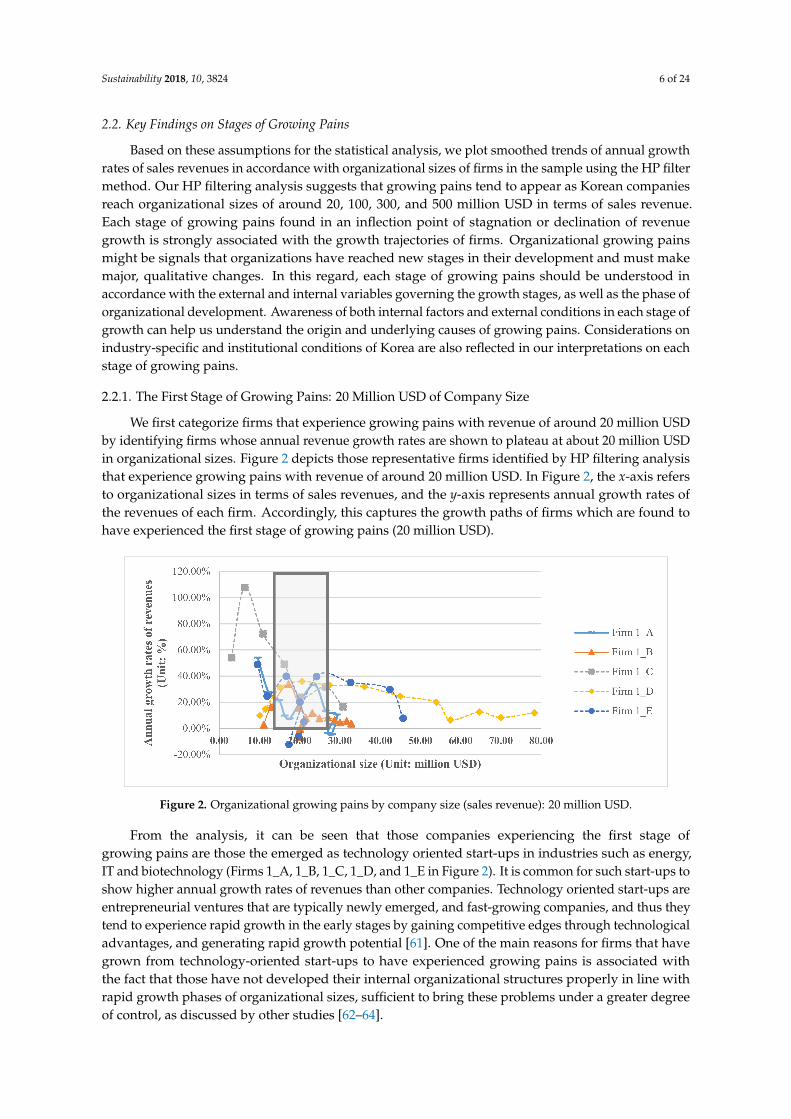
We first categorize firms that experience growing pains with revenue of around 20 million USDby identifying firms whose annual revenue growth rates are shown to plateau at about 20 million USDin organizational sizes. Figure 2 depicts those representative firms identified by HP filtering analysisthat experience growing pains with revenue of around 20 million USD. In Figure 2, the x-axis refersto organizational sizes in terms of sales revenues, and the y-axis represents annual growth rates ofthe revenues of each firm. Accordingly, this captures the growth paths of firms which are found tohave experienced the first stage of growing pains (20 million USD).
Figure 2. Organizational growing pains by company size (sales revenue): 20 million USD.
From the analysis, it can be seen that those companies experiencing the first stage ofgrowing pains are those the emerged as technology oriented start-ups in industries such as energy,IT and biotechnology (Firms 1_A, 1_B, 1_C, 1_D, and 1_E in Figure 2). It is common for such start-ups toshow higher annual growth rates of revenues than other companies. Technology oriented start-ups areentrepreneurial ventures that are typically newly emerged, and fast-growing companies, and thus theytend to experience rapid growth in the early stages by gaining competitive edges through technologicaladvantages, and generating rapid growth potential [61]. One of the main reasons for firms that havegrown from technology-oriented start-ups to have experienced growing pains is associated withthe fact that those have not developed their internal organizational structures properly in line withrapid growth phases of organizational sizes, sufficient to bring these problems under a greater degreeof control, as discussed by other studies [62–64].
Sustainability 2018, 10, 3824 7 of 24
In other words, there is a high possibility that the resources and capacity within the organizationthat can support the growth rate of the company would be limited and managed ineffectively.If a proper foundation for scaling from a start-up stage has been established, the firm will be positionedto ride the momentum of an expanding market as far as and as fast as is competitively achievable.If not, organizational growing pains lie ahead [65]. During the start-up stage, entrepreneurial venturesare heavily dependent upon informal, even intuitive decision-making process. As the firms grow,however, this informal communication and decision-making processes becomes unwieldy. The rapidgrowth of the entrepreneurial ventures places considerable demands on the functional specialistsand operational systems [63,65,66]. Therefore, the main challenges for those firms are to ensure thatinternal control and management systems are developed and coordinated systematically, in line withthe rapid growth of organizational sizes.
In addition, firms grown from technology-oriented start-ups to mid-sized firms would have beenexcluded from benefits received at the stage of start-ups [67]. It is expected that those companieswould have felt the limitations of their existing internal control systems, as incentive offerings fromgovernments are reduced because they made the transition from start-ups to mid-sized enterprises.Accordingly, we can expect that critical tasks for the majority of companies experiencing the firststage of growing pains are related to the systemization of management systems, and organizationalinnovation. In other words, it can be inferred that the key strategic choices for companies toovercome growing pains at 20 million USD in organizational sizes are focused on implementingnew organizational methods in undertaking business practices, and developing newly establishedmanagement systems required to make transitions toward the next stage of growth.
2.2.2. The Second Stage of Growing Pains: 100 Million USD of Company Size
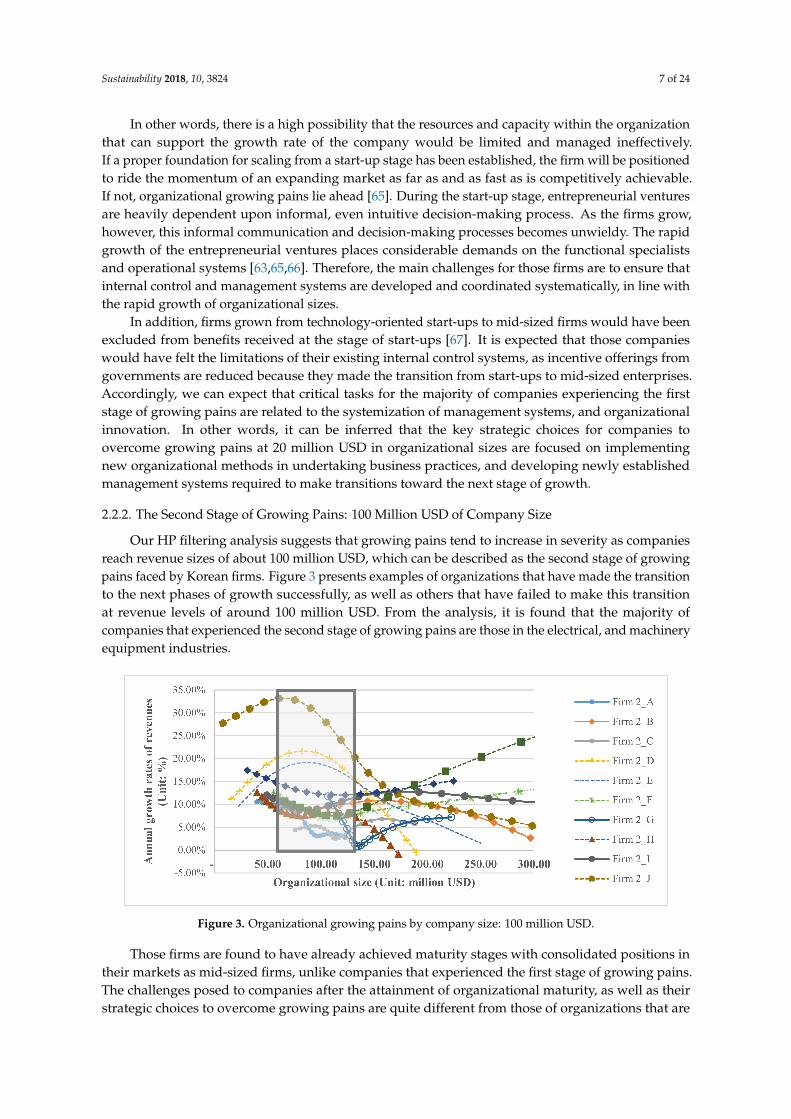
Our HP filtering analysis suggests that growing pains tend to increase in severity as companiesreach revenue sizes of about 100 million USD, which can be described as the second stage of growingpains faced by Korean firms. Figure 3 presents examples of organizations that have made the transitionto the next phases of growth successfully, as well as others that have failed to make this transitionat revenue levels of around 100 million USD. From the analysis, it is found that the majority ofcompanies that experienced the second stage of growing pains are those in the electrical, and machineryequipment industries.
Figure 3. Organizational growing pains by company size: 100 million USD.
Those firms are found to have already achieved maturity stages with consolidated positions intheir markets as mid-sized firms, unlike companies that experienced the first stage of growing pains.The challenges posed to companies after the attainment of organizational maturity, as well as theirstrategic choices to overcome growing pains are quite different from those of organizations that are
Sustainability 2018, 10, 3824 8 of 24
found to have experienced the first stage of growing pains. As noted by Flamholtz and Randle [14],companies typically attempt to diversify product lines after the maturity and consolidation stages,either because the organization’s product life-cycle has reached maturity as a result of marketsaturation, or because the core products have created new opportunities.
We can infer that after the consolidation stage of growth, firms are likely to face increasedcompetition in the market and inevitably attempt to gain competitive advantages with the developmentof new products [68–71]. The presence of competition decreases the firm’s profit margins and erodesits market share over time, resulting in growing pains experienced by companies with consolidatedmarket positions. Especially for companies whose businesses are focused on products in fast-movingmarkets (e.g., high-tech industries including electronic, and machinery equipment industries),sourcing necessary resources for the development of new products is one of the important tasks to enterniche markets. Therefore, it can be understood that for those companies that pass through the secondstage of growing pains, key developmental challenges are associated with the development of newproducts for niche markets and acquisition of necessary resources for it. Accordingly, we can inferthat those firms with the second stage of growing pains could have difficulties in acquiring resourcesand developing core capabilities to diversify product lines, and explore new markets for products,having been locked in routines associated with the development of the companies’ original productsor product lines.
2.2.3. The Third Stage of Growing Pains: 300 Million USD of Company Size
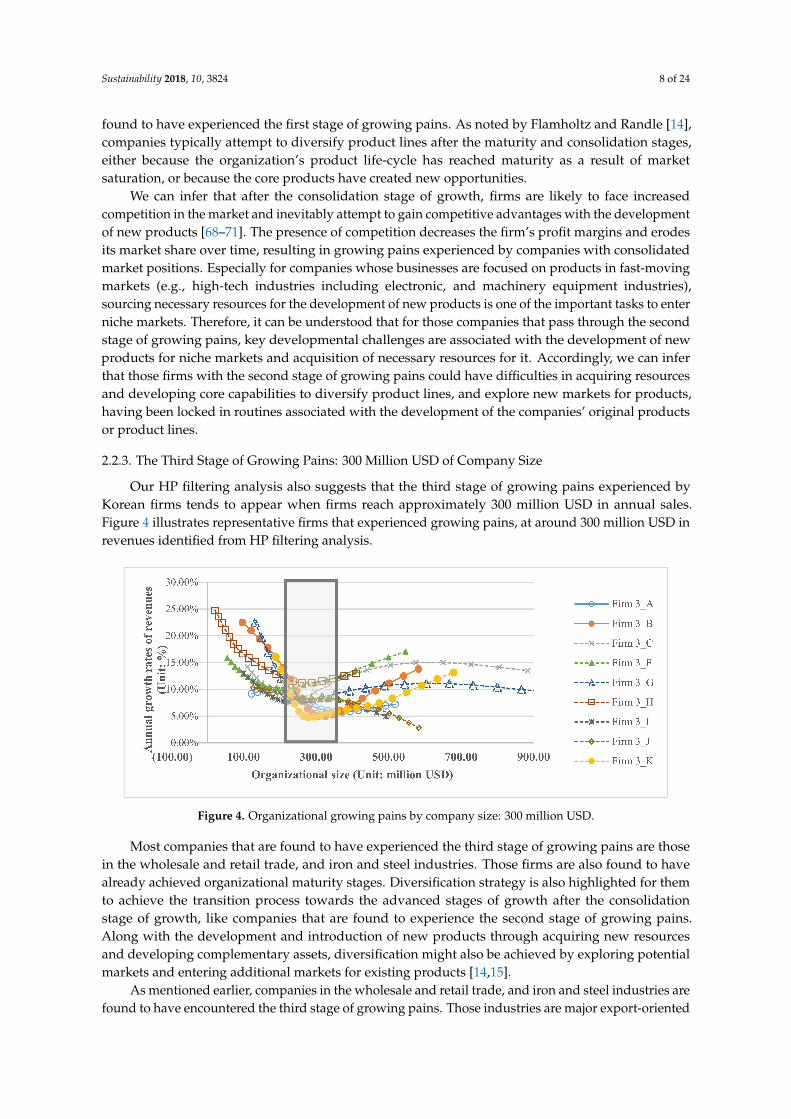
Our HP filtering analysis also suggests that the third stage of growing pains experienced byKorean firms tends to appear when firms reach approximately 300 million USD in annual sales.Figure 4 illustrates representative firms that experienced growing pains, at around 300 million USD inrevenues identified from HP filtering analysis.
Figure 4. Organizational growing pains by company size: 300 million USD.
Most companies that are found to have experienced the third stage of growing pains are thosein the wholesale and retail trade, and iron and steel industries. Those firms are also found to havealready achieved organizational maturity stages. Diversification strategy is also highlighted for themto achieve the transition process towards the advanced stages of growth after the consolidationstage of growth, like companies that are found to experience the second stage of growing pains.Along with the development and introduction of new products through acquiring new resourcesand developing complementary assets, diversification might also be achieved by exploring potentialmarkets and entering additional markets for existing products [14,15].
As mentioned earlier, companies in the wholesale and retail trade, and iron and steel industries arefound to have encountered the third stage of growing pains. Those industries are major export-oriented
Sustainability 2018, 10, 3824 9 of 24
industries in Korea, and described as mature and well-established industries. Many key firms inthe iron and steel industry have built reputations for themselves as specialists in niche markets withestablished core technological competencies. On the other hand, with saturation of the domestic marketand a push for internationalization it can be tempting for companies in the wholesale and retail tradeindustry to focus on outward investments. Those facts highlight the importance of a firm’s capabilitiesin identifying and effectively entering new markets with market knowledge. Outward investmentsprovide opportunities to expand businesses in markets with higher growth potential. From HP filteringanalysis, we find that most companies that experienced the third stage of growing pains had difficultiesexploring new markets for their existing products, entering new potential markets, and expandingtheir market shares.
Accordingly, we infer that most Korean companies that experienced the third stage of growingpains have faced organizational problems caused by external conditions, such as saturation ofthe domestic market and less global demand with the global economic crisis, and by internalconditions, including lack of marketing capabilities and capabilities to secure marketing channels.Thus, firms under such situations can make strategic choices to enter new potential marketsand expand niche markets. Indeed, we find that the firms shown in Figure 4, which overcamegrowing pains with revenues around 300 million USD, actively attempted to diversify their businessesso they were no longer dependent on their original markets.
2.2.4. The Fourth Stage of Growing Pains: 500 Million USD of Company Size
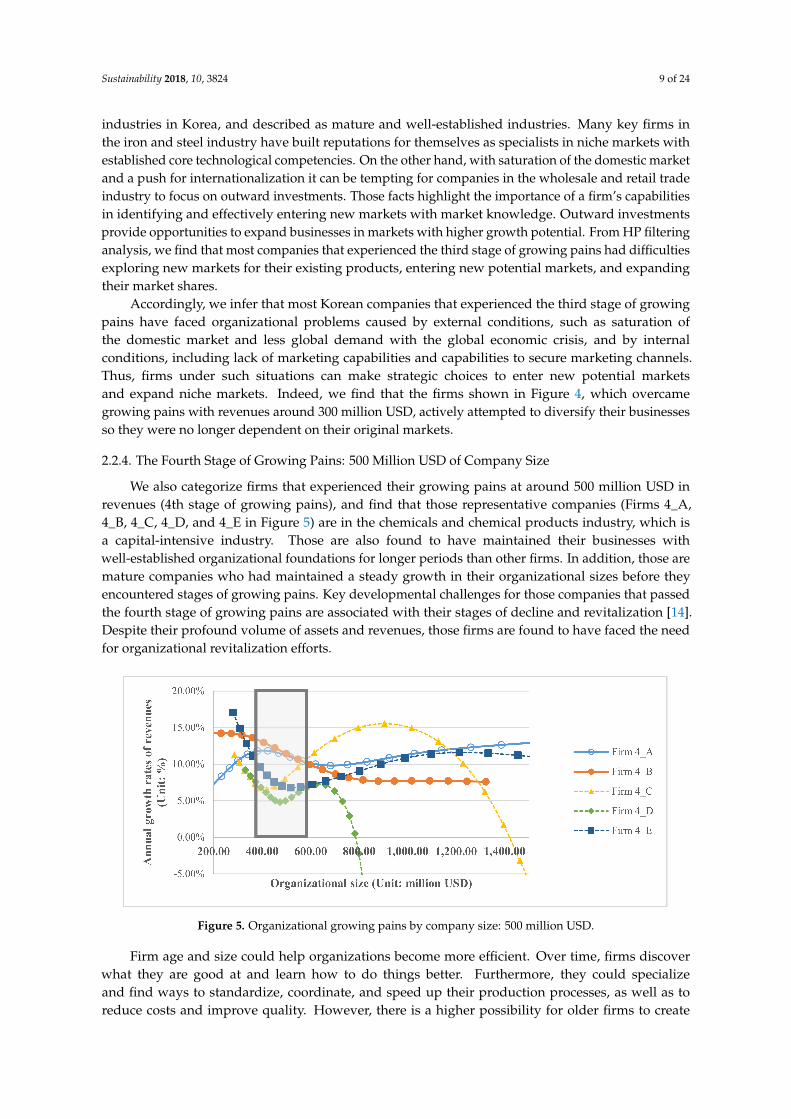
We also categorize firms that experienced their growing pains at around 500 million USD inrevenues (4th stage of growing pains), and find that those representative companies (Firms 4_A,4_B, 4_C, 4_D, and 4_E in Figure 5) are in the chemicals and chemical products industry, which isa capital-intensive industry. Those are also found to have maintained their businesses withwell-established organizational foundations for longer periods than other firms. In addition, those aremature companies who had maintained a steady growth in their organizational sizes before theyencountered stages of growing pains. Key developmental challenges for those companies that passedthe fourth stage of growing pains are associated with their stages of decline and revitalization [14].Despite their profound volume of assets and revenues, those firms are found to have faced the needfor organizational revitalization efforts.
Figure 5. Organizational growing pains by company size: 500 million USD.
Firm age and size could help organizations become more efficient. Over time, firms discoverwhat they are good at and learn how to do things better. Furthermore, they could specializeand find ways to standardize, coordinate, and speed up their production processes, as well as toreduce costs and improve quality. However, there is a higher possibility for older firms to create
Sustainability 2018, 10, 3824 10 of 24
a certain degree of resistance to change. In addition, an organization’s age might make knowledge,abilities, and skills obsolete and induce organizational decay [72,73]. A possible reason is that successinduces firms to codify their approaches and routines through organization and processes over time.This routinization of organizational behaviors seems increasingly to entangle firms in structuraland process-related rigidities that are difficult to discard [30,71,74]. In other words, the organizationalsuccess that comes with increases in the organization’s size and age could create a certain degree ofresistance to change [75]. In such conditions, those firms have high possibilities to be reluctant toshift into new activities, and be unable to respond quickly to changing environmental conditions,creating lengthy delays between the time the organizations identify new opportunities, and the timethey take action. This suggests that for those companies that pass through the fourth stage of growingpains, successful turnaround strategies can be implemented by revitalization efforts which covera wide range of key organizational development issues (i.e., revitalizing business concepts, markets,products, operational systems, management systems, corporate culture, etc.) to change and revitalizetheir entire businesses [14].
2.3. Development of Conceptual Framework
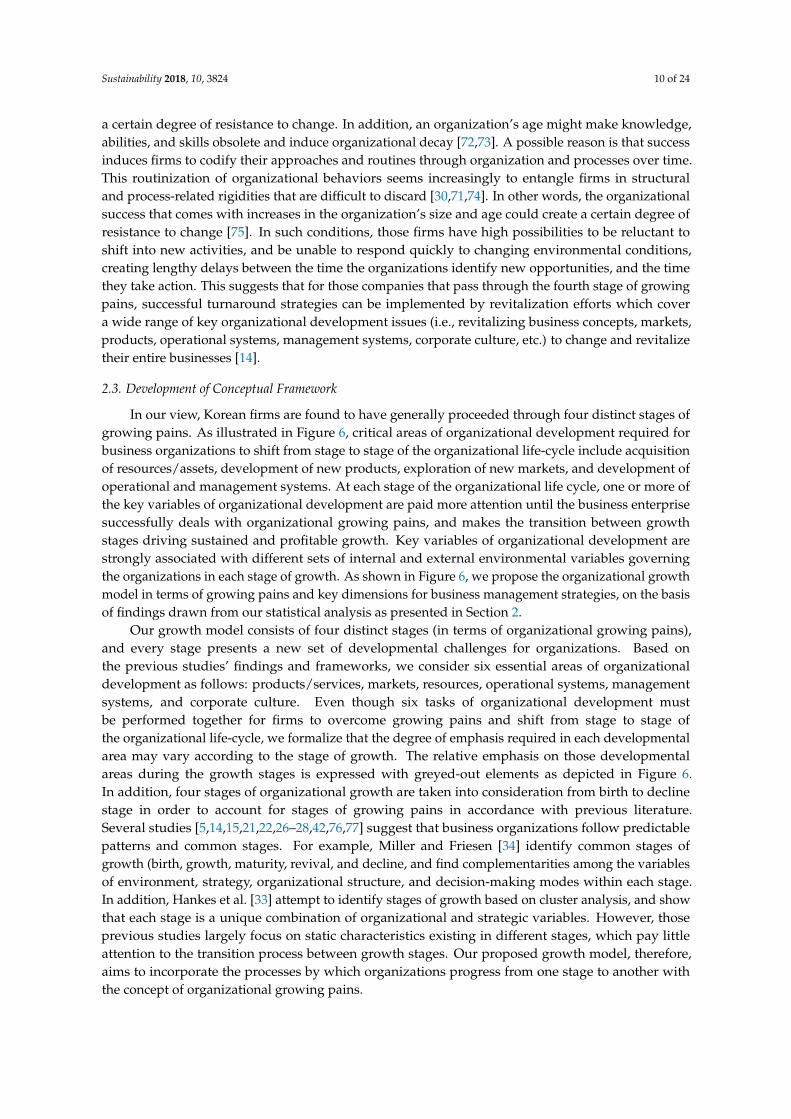
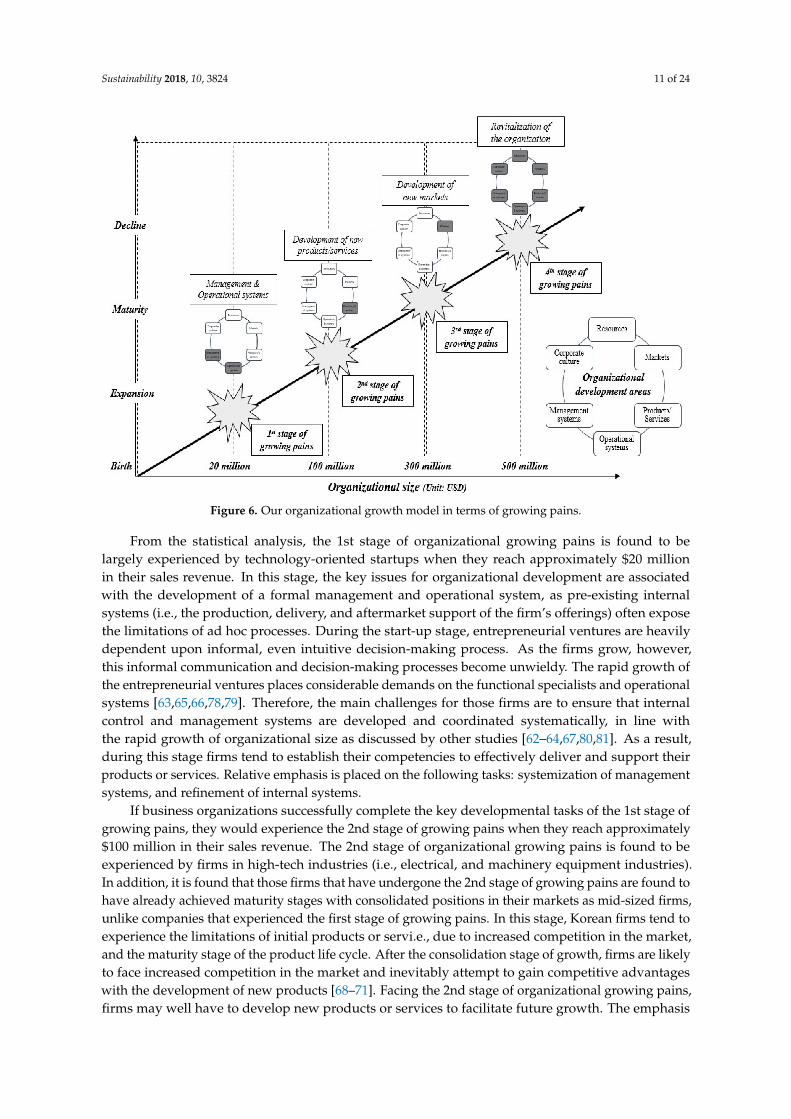
In our view, Korean firms are found to have generally proceeded through four distinct stages ofgrowing pains. As illustrated in Figure 6, critical areas of organizational development required forbusiness organizations to shift from stage to stage of the organizational life-cycle include acquisitionof resources/assets, development of new products, exploration of new markets, and development ofoperational and management systems. At each stage of the organizational life cycle, one or more ofthe key variables of organizational development are paid more attention until the business enterprisesuccessfully deals with organizational growing pains, and makes the transition between growthstages driving sustained and profitable growth. Key variables of organizational development arestrongly associated with different sets of internal and external environmental variables governingthe organizations in each stage of growth. As shown in Figure 6, we propose the organizational growthmodel in terms of growing pains and key dimensions for business management strategies, on the basisof findings drawn from our statistical analysis as presented in Section 2.
Our growth model consists of four distinct stages (in terms of organizational growing pains),and every stage presents a new set of developmental challenges for organizations. Based onthe previous studies’ findings and frameworks, we consider six essential areas of organizationaldevelopment as follows: products/services, markets, resources, operational systems, managementsystems, and corporate culture. Even though six tasks of organizational development mustbe performed together for firms to overcome growing pains and shift from stage to stage ofthe organizational life-cycle, we formalize that the degree of emphasis required in each developmentalarea may vary according to the stage of growth. The relative emphasis on those developmentalareas during the growth stages is expressed with greyed-out elements as depicted in Figure 6.In addition, four stages of organizational growth are taken into consideration from birth to declinestage in order to account for stages of growing pains in accordance with previous literature.Several studies [5,14,15,21,22,26–28,42,76,77] suggest that business organizations follow predictablepatterns and common stages. For example, Miller and Friesen [34] identify common stages ofgrowth (birth, growth, maturity, revival, and decline, and find complementarities among the variablesof environment, strategy, organizational structure, and decision-making modes within each stage.In addition, Hankes et al. [33] attempt to identify stages of growth based on cluster analysis, and showthat each stage is a unique combination of organizational and strategic variables. However, thoseprevious studies largely focus on static characteristics existing in different stages, which pay littleattention to the transition process between growth stages. Our proposed growth model, therefore,aims to incorporate the processes by which organizations progress from one stage to another withthe concept of organizational growing pains.
Sustainability 2018, 10, 3824 11 of 24
Figure 6. Our organizational growth model in terms of growing pains.
From the statistical analysis, the 1st stage of organizational growing pains is found to belargely experienced by technology-oriented startups when they reach approximately $20 millionin their sales revenue. In this stage, the key issues for organizational development are associatedwith the development of a formal management and operational system, as pre-existing internalsystems (i.e., the production, delivery, and aftermarket support of the firm’s offerings) often exposethe limitations of ad hoc processes. During the start-up stage, entrepreneurial ventures are heavilydependent upon informal, even intuitive decision-making process. As the firms grow, however,this informal communication and decision-making processes become unwieldy. The rapid growth ofthe entrepreneurial ventures places considerable demands on the functional specialists and operationalsystems [63,65,66,78,79]. Therefore, the main challenges for those firms are to ensure that internalcontrol and management systems are developed and coordinated systematically, in line withthe rapid growth of organizational size as discussed by other studies [62–64,67,80,81]. As a result,during this stage firms tend to establish their competencies to effectively deliver and support theirproducts or services. Relative emphasis is placed on the following tasks: systemization of managementsystems, and refinement of internal systems.
If business organizations successfully complete the key developmental tasks of the 1st stage ofgrowing pains, they would experience the 2nd stage of growing pains when they reach approximately$100 million in their sales revenue. The 2nd stage of organizational growing pains is found to beexperienced by firms in high-tech industries (i.e., electrical, and machinery equipment industries).In addition, it is found that those firms that have undergone the 2nd stage of growing pains are found tohave already achieved maturity stages with consolidated positions in their markets as mid-sized firms,unlike companies that experienced the first stage of growing pains. In this stage, Korean firms tend toexperience the limitations of initial products or servi.e., due to increased competition in the market,and the maturity stage of the product life cycle. After the consolidation stage of growth, firms are likelyto face increased competition in the market and inevitably attempt to gain competitive advantageswith the development of new products [68–71]. Facing the 2nd stage of organizational growing pains,firms may well have to develop new products or services to facilitate future growth. The emphasis
Sustainability 2018, 10, 3824 12 of 24
is placed to the development of new products/services for niche markets by securing relevantresources and assets for the 2nd stage of growing pains. As the electrical and machinery equipmentindustries are characterized by a high level of innovation and differentiation, short products/serviceslife-cycle and high variety, firms experiencing the 2nd stage of growing pains turn their attention tothe development of new products/services for niche markets with complementary assets.
By the time firms reach $300 million in sales revenue, most firms in the wholesale and retailtrade, and iron and steel industries are found to have experienced another type of organizationalgrowing pain. We argue that the 3rd stage of organizational growing pains typically undergoneby Korean firms appears when those reach approximately $300 million in their organizationalsizes. From the statistical analysis, we find that most companies that experienced the 3rd stageof growing pains had difficulties in exploring new markets for their existing products, entering newpotential markets, and expanding their market shares. This can be understood by the industry-specificconditions that exist in wholesale and retail trade, and iron and steel industries in Korea as discussedin Section 2.2.3. Quantitative findings also suggest that those firms are found to have already achievedorganizational maturity stages like firms which have undergone the second stage of growing pains.However, the different characteristics of the industries in which those firms exist suggest differentapproaches to deal with organizational growing pains. Accordingly, the emphasis should be turned tothe definition of the firm’s markets and potential niches for the 3rd stage of organizational growingpains. This process involves strategic market planning to identify potential customers and their needs,and laying the strategy for the firm’s competition with others for its share of the intended market asnoted by previous studies [14,15,82].
After firms successfully complete the key developmental tasks required for the 2nd and 3rdstages of growing pains, there are possibilities for them to encounter another type of organizationalgrowing pains. From the statistical analysis, it is found that the 4th stage of growing pains is typicallyencountered by firms in capital-intensive industries (i.e., the chemicals and chemical product industry).This stage is typically shown by the time those firms reach approximately $500 million in organizationalsize. From the HP filtering analysis, we confirm that those firms that experienced the 4th stage ofgrowing pains are found to have proceeded to the decline stage. During this stage, the organizationaldevelopment process takes place in a wide range of areas as follows: revitalizing the business concepts,refining products/services, re-conceptualizing markets, revitalizing operational and managementsystems [14,72,73]. Flamhotlz and Randle [14] suggest that the basic problem that makes revitalizationso difficult is that firms in this stage must focus on wide range of the organizational developmentareas. As noted by previous studies [30,71,74,75], however, even though firms may need to makemajor investments to revitalize the business organizations, they may encounter significant internalresistance [83]. Therefore, this process requires careful planning and management practices to ensurethe alignment of strategic goals with the organizational development process.
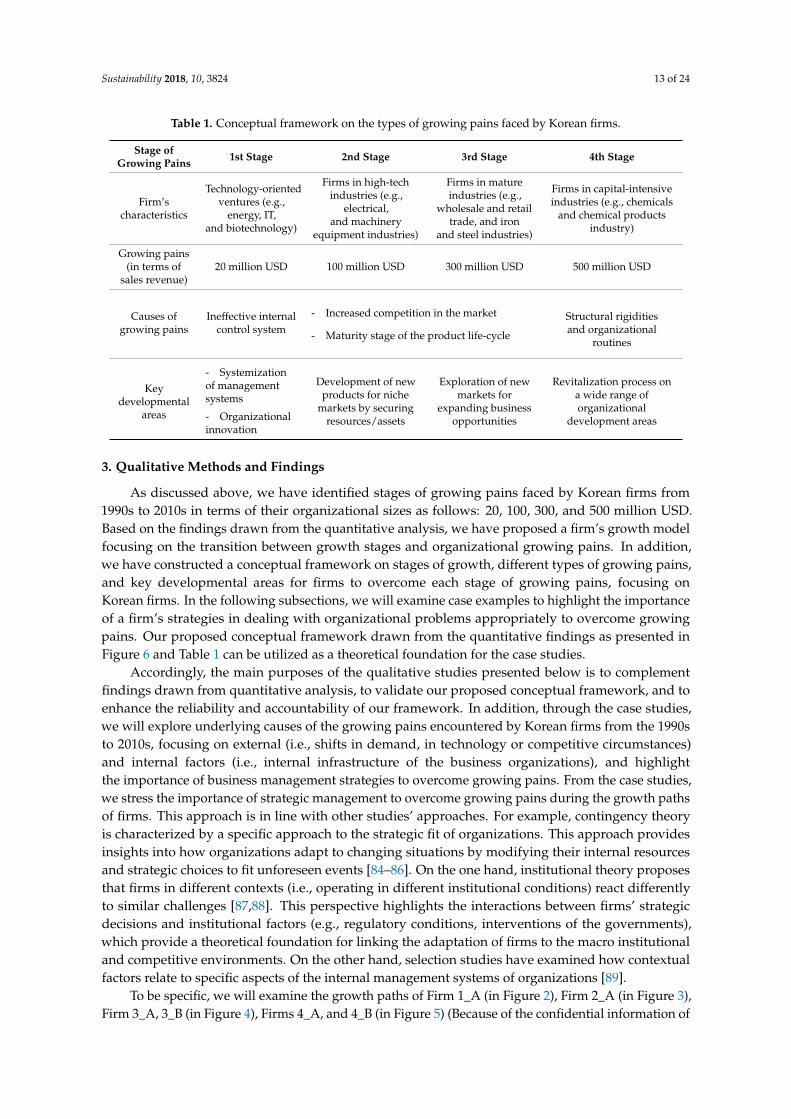
Although Figure 6 shows the key variables to which the most attention is turned at each stage,it is important to remember that all these areas must be managed at the same time. Key findingsdrawn from the HP filtering analysis lay foundations for developing a conceptual framework on stagesof growth, and different types of growing pains experienced by Korean firms as shown in Table 1.Table 1 summarizes the characteristics of organizations, the underlying causes of organizationalgrowing pains, and the degree of emphasis required in each developmental area during each stageof growing pain. As mentioned above, they are drawn from the results of HP filtering analysis,and considerations for the industrial contexts of Korea, along with arguments from previous studies.
Sustainability 2018, 10, 3824 13 of 24
Table 1. Conceptual framework on the types of growing pains faced by Korean firms.
Stage ofGrowing Pains 1st Stage 2nd Stage 3rd Stage 4th Stage
Firm’scharacteristics
Technology-orientedventures (e.g.,
energy, IT,and biotechnology)
Firms in high-techindustries (e.g.,
electrical,and machinery
equipment industries)
Firms in matureindustries (e.g.,
wholesale and retailtrade, and iron
and steel industries)
Firms in capital-intensiveindustries (e.g., chemicals
and chemical productsindustry)
Growing pains(in terms of
sales revenue)20 million USD 100 million USD 300 million USD 500 million USD
Causes ofgrowing pains
Ineffective internalcontrol system
- Increased competition in the market Structural rigiditiesand organizational
routines- Maturity stage of the product life-cycle
Keydevelopmental
areas
- Systemizationof managementsystems
Development of newproducts for niche
markets by securingresources/assets
Exploration of newmarkets for
expanding businessopportunities
Revitalization process ona wide range oforganizational
development areas- Organizationalinnovation
3. Qualitative Methods and Findings
As discussed above, we have identified stages of growing pains faced by Korean firms from1990s to 2010s in terms of their organizational sizes as follows: 20, 100, 300, and 500 million USD.Based on the findings drawn from the quantitative analysis, we have proposed a firm’s growth modelfocusing on the transition between growth stages and organizational growing pains. In addition,we have constructed a conceptual framework on stages of growth, different types of growing pains,and key developmental areas for firms to overcome each stage of growing pains, focusing onKorean firms. In the following subsections, we will examine case examples to highlight the importanceof a firm’s strategies in dealing with organizational problems appropriately to overcome growingpains. Our proposed conceptual framework drawn from the quantitative findings as presented inFigure 6 and Table 1 can be utilized as a theoretical foundation for the case studies.
Accordingly, the main purposes of the qualitative studies presented below is to complementfindings drawn from quantitative analysis, to validate our proposed conceptual framework, and toenhance the reliability and accountability of our framework. In addition, through the case studies,we will explore underlying causes of the growing pains encountered by Korean firms from the 1990sto 2010s, focusing on external (i.e., shifts in demand, in technology or competitive circumstances)and internal factors (i.e., internal infrastructure of the business organizations), and highlightthe importance of business management strategies to overcome growing pains. From the case studies,we stress the importance of strategic management to overcome growing pains during the growth pathsof firms. This approach is in line with other studies’ approaches. For example, contingency theoryis characterized by a specific approach to the strategic fit of organizations. This approach providesinsights into how organizations adapt to changing situations by modifying their internal resourcesand strategic choices to fit unforeseen events [84–86]. On the one hand, institutional theory proposesthat firms in different contexts (i.e., operating in different institutional conditions) react differentlyto similar challenges [87,88]. This perspective highlights the interactions between firms’ strategicdecisions and institutional factors (e.g., regulatory conditions, interventions of the governments),which provide a theoretical foundation for linking the adaptation of firms to the macro institutionaland competitive environments. On the other hand, selection studies have examined how contextualfactors relate to specific aspects of the internal management systems of organizations [89].
To be specific, we will examine the growth paths of Firm 1_A (in Figure 2), Firm 2_A (in Figure 3),Firm 3_A, 3_B (in Figure 4), Firms 4_A, and 4_B (in Figure 5) (Because of the confidential information of
Sustainability 2018, 10, 3824 14 of 24
the firms, we do not mention the firms’ names directly presented in Section 3) in order to offer extensiveexplanations for the significance of a firm’s strategies to deal with each stage of growing pains. A widerange of documents and reference materials are used for the case studies, including annual companyreports, interviews with managers or founders, and companies’ web pages to extract additionalinformation on the firms’ histories and the growth paths they took.
3.1. Case Study: Firms Overcoming Growing Pains with 20 Million USD Revenue
The development of management systems could be one of the most important and pressingtasks for organizations when the growth rates of organizational sizes outstrip the rates at whichthe enterprises’ management systems are well established. If the required infrastructure and relatedinternal control systems are not in place, the organization will not operate well, resulting in variousorganizational problems. Firm 1_A’s course of growth is a good example to explain the importance ofthe infrastructure of management systems as a sound platform for future growth that allows a companyto operate efficiently on a day-to-day basis.
Firm 1_A was established in 1997 as a manufacturer of digital electric meters. It experienceda transition from a high-growth path to a low-growth path by the time it reached approximately20 million USD of revenues during 2008 to 2011. This was a time of slowdown in overall economic growthcaused by the global financial crisis, thereby depressing the housing construction sector. Under thesesituations, the projects and businesses under the Firm 1_A could not speed up. At the same time, its growingpains were brought about, at least in part, by underdeveloped operational and internal control systemsrequired for the organization’s continued growth.
One of key factors to help the Firm 1_A overcome its growing pains was the development ofoperational and management systems. While Firm 1_A had already developed core competenciesin technological capabilities as an important driver of product development outcomes with a largenumber of patents, entrepreneurs were unable to cope with the managerial problems that aroseas the organization grew. (During the mid-2000s, the number of defective products and productbreakdowns increased as the production volume of Firm 1_A expanded.) In such situations,the infrastructure of the management system that let the company operate efficiently and effectivelywas essential to ensure sustained growth. However, during the rapid expansion in its organizationalsize during the early 2000s, Firm 1_A was not interested in developing formalized operationalsystems (e.g., quality-management systems), but placed emphasis on securing marketing channelsand the acquisition of resources required to diversify product lines.
Despite rapid expansion in sales revenues, it underdeveloped its quality-control infrastructureto consistently meet customer requirements and enhance their satisfaction. In this situation,Firm 1_A appointed a general director of quality management dedicated to enterprise-wide qualitymanagement tasks in 2009. It also introduced a total quality-management system in 2009 to improveits ability to deliver high-quality products and services to customers. Furthermore, Firm 1_A has madethe transition from entrepreneurship to professionally managed organization. By hiring professionalmanagers during the late 2000s, it began to develop the formalized management systems required tofacilitate its future growth.
Furthermore, during 2008 to 2011 Firm 1_A faced a rise in production costs caused bythe skyrocketing currency exchange rate. It sourced intermediate parts and components fromChina’s original equipment manufacturers (OEMs), and assembled final manufactured goods indomestic manufacturing facilities. (At that time, the head office located in Korea carried out highvalue-added functions, such as research, design, and marketing.) Under this functional distribution,the global financial crisis caused Firm 1_A to face rising material costs and production costs.Accordingly, it underwent a stage of stagnation with fluctuations in revenues during the late 2000s.A foreign exchange risk-management system was an essential component for Firm 1_A which importsthe majority of intermediate goods from abroad, so as to flexibly deal with the economic crisis.However, Firm 1_A had not developed such a system at that time.
Sustainability 2018, 10, 3824 15 of 24
As Firm 1_A experienced significant problems when it reached approximately 20 million USDof revenues in the late 2000s, it started to make improvements in business functions and corporategovernance. To cope with future conditions of uncertainty, it suspended subcontracts with China’sOEMs, and started production of intermediate parts and components domestically in 2009. As a resultof these efforts, it now supplies intermediate goods from its own manufacturing facilities. It consideredthat managing exchange rate risk exposure was also important for reducing the firm’s vulnerabilitiesto major exchange rate movements. As a result, it assigned a chief finance officer for tasks, includingfinancing, accounting, and foreign exchange risk management, in order to enhance its financialsystem in 2009. Following those strategic choices including the implementation of new organizationalmethods, and the development and establishment of operational management systems, it couldovercome growing pains successfully in 2012. The example of the Firm 1_A’s growth path highlightsthe importance of organizational innovations in the management system as a sound platform forovercoming the first stage of growing pains.
3.2. Case Study: Firms Overcoming Growing Pains with 100 Million USD Revenue
The example of Firm 2_A’s transition process from the state of growing pains toward a rapidgrowth phase sheds light on growth strategies to create new opportunities for future growth afterthe consolidation stage of organizations. Firm 2_A was established in 1956 as a manufacturerof electrical equipment, including high-energy storage capacitors, and electromagnetic filters.Firm 2_A experienced its growing pains by the time it reached approximately 100 million USDof sales revenues during the mid-2000s. Its growing pains are attributable to various factors, such assluggish demand for electrical equipment products from downstream industries due to the depressedIT industry, and increased competition from other countries’ manufacturers, resulting in lower profitmargins and a state of stagnation.
A critical challenge posed to Firm 2_A was the threat of latecomers with cost advantages, especiallythose with much lower labor costs. During the early 2000s, latecomers made large-scale investments innew production facilities to gain comparative advantages in production costs over their competitors.Another problem faced by Firm 2_A during the mid-2000s were the significant breakthroughs made byJapanese firms in the development of new and more efficient materials and methods for cost-efficientmanufacturing processes. While latecomers including Chinese manufacturers expanded their marketshares in the general-purpose electric equipment markets with huge investments for productionfacilities, Japanese companies attempted to gain competitive advantages in superior-quality and highlycustomized products. At that time, the core business of Firm 2_A (i.e., general-purpose electricequipment) reached limits in terms of available market share. In such situations, increased competitiondriven by Chinese and Japanese manufacturers decreased Firm 2_A’s profit margins and erodedits market share over time. As a result, Firm 2_A experienced growing pains when it reachedan organizational size of 100 million USD in sales revenues.
Nevertheless, it successfully dealt with growing pains through the development and introductionof new products for new markets with enhanced research and development (R&D) activities.In particular, Firm 2_A felt the importance of the development of highly customized productsto fulfil specific customer requirements as a niche market strategy. (With the advent of highvalue-added IT devices during that period, an increased demand for higher capacity, superior quality,and highly customized capacitors is expected.) Accordingly, it attempted to overcome its growingpains by diversifying its product lines from general-purpose electrical components to highlycustomized equipment and products. In order to develop core capabilities to diversify productlines, Firm 2_A attempted to maintain its R&D intensity (measured by the ratio of R&D expenditureto sales revenues) at about 1.5%. Having maintained its R&D spending despite its growing painsduring the mid-2000s, Firm 2_A could establish technological capabilities specializing in highlycustomized products.
Sustainability 2018, 10, 3824 16 of 24
In addition, Firm 2_A reorganized its in-house R&D structure from a single unit into threedepartments in 2006—new product development, research planning, and new project developmentunits—to enhance the efficiency of R&D activities. Furthermore, it sold several businesses, and reorganizedbusiness units aiming at a transition toward high value-added products. Moreover, it sought to strengthentechnological exchanges and transfers through the formation of a consortium with government-fundedresearch institutes and other companies, thereby establishing organizational infrastructure associatedwith the development and mass production of high value-added products. As a result of these efforts,it succeeded in developing core fundamental technologies applied to high-capacity, high-reliabilitycapacitors and component modules. The number of Firm 2_A’s patent applications that are issuedand granted has also shown a rapid increase from 2004. In 2004, the total number of patents that wereissued and granted was only 3, but it increased to 16 in 2011, 30 in 2012, and 21 in 2013.
Likewise, Firm 2_A made concentrated efforts to gain competitive advantages with regard toproduct differentiation through R&D activities. It attempted to maximize the value creation from highvalue-added products based on its technological capabilities through reorganizing business units tointegrate R&D with other relevant complementary assets. As a result, Firm 2_A overcame its growingpains at the stage of 100 million USD in sales revenues, and made a successful transition to a highgrowth phase in the late 2000s.
3.3. Case Study: Firms Overcoming Growing Pains with 300 Million USD Revenue
Founded in 1945, Firm 3_A provides special wire products, including wire rope and pre-stressedconcrete steel wire, and now is positioned as a leading manufacturer in Korea. Firm 3_A is foundto have undergone growing pains during the mid-2000s. With the Korean financial crisis duringthe period between 1997 and 1998, market conditions in the construction and car-making industrieshad continued to worsen until the early 2000s, resulting in a critical crisis in the iron and steel industry.In addition, other factors, such as decline in global demand for steel products and increased globalcompetition from steel makers in South-East Asia with low manufacturing costs, deepened the ironand steel industry crisis until the early 2000s. Under these severe conditions, Firm 3_A’s market sharedecreased, and it experienced growing pains when it reached an organizational size of 300 million USD.
One of the key strategies for Firm 3_A to overcome its growing pains was customer-orientedmarketing strategies focused on overseas markets, in parallel with consistent R&D investmentsin developing new products. Facing the financial crisis in Korea, Firm 3_A made activeinvestments in R&D activities and built additional experimental and research centers in 1998 soas to enhance collaboration with various steelmakers and public research institutes (i.e., universities,and government-funded research institutes). Based on this form of research networkingand collaboration, it sought to increase shared learning, new research opportunities, and technologytransfers, as well as to promote flexibility to adapt to a wide spectrum of challenges in productdifferentiation. Along with these efforts focusing on the development of new products for the existingmarket, Firm 3_A actively extended its manufacturing sites abroad to gain access to new markets,and search for opportunities to operate businesses in new markets.
Since the late 1990s, developing countries, especially those in the South-East Asian region,have been the fastest-growing market in the world for steel products due to their rapid rates ofindustrialization. In response to the rapid growth of new potential markets, Firm 3_A actively set upmanufacturing facilities and service centers in those areas from the early 2000s. By 2014, Firm 3_A hadestablished four factories in Malaysia, six in China, three in the United States, two in Vietnam,two in Indonesia, and one in Hungary. Based on these production facilities abroad, it focused oncustomer-oriented services, including maintenance (e.g., product updates and technical support),repairs, and other types of services (e.g., product customization and training). Firm 3_A highlightedthe increasing importance of customer-oriented services as the company’s strategic developmentstrategy. As a result, Firm 3_A could customize its product lines to fit the context of customers innew markets and retain its differentiated brand image in the global market. Following these strategic
Sustainability 2018, 10, 3824 17 of 24
choices, Firm 3_A could overcome its growing pains, and successfully make the transition towardthe next stage of growth, showing a rebound in growth rates of sales revenues after the mid-2000s.
Firm 3_B’s course of growth is another good example to explain the importance of the explorationprocess for new markets to overcome organizational problems. Firm 3_B was established in 1968 asa specialized manufacturer of knitting garments. From HP filtering analysis, it is found that Firm 3_Bexperienced a transition from a high-growth path to a low-growth path by the time it had reachedapproximately 300 million USD of revenues during the mid-2000s. The Korean financial crisis duringthe period between 1997 and 1998 depressed domestic market conditions, resulting in decreasedclothing consumption. This trend continued until the mid-2000s, and Firm 3_B faced its growing painsduring that period.
Under such conditions, Firm 3_B attempted to explore new markets for existing productsabroad, based on its established overseas subsidiaries and interconnected subcontracting factories.From the early stages of the organization, it did not build its production facilities in Korea,but manufactured the entire range of its products by outsourcing from overseas subsidiariesand subcontracting factories located in South America and South-East Asia to gain cost advantagesover competitors. With already well-established global production networks, Firm 3_B implementedaggressive marketing strategies targeting the overseas market rather than the domestic market.As a company in the wholesale and retail trade industry, which is sensitive to changing consumptiontrends, Firm 3_B attempted to regain sustainable competitive advantage by expanding its market sharein new markets abroad. Well-established production facilities distributed across the world playedan important role as a bridgehead for Firm 3_B to enter the overseas market. As a result, it couldovercome growing pains and successfully make the transition toward the next stage of growth afterthe mid-2000s.
3.4. Case Study: Firms Overcoming Growing Pains with 500 Million USD Revenue
Firm 4_A was founded in 1969 as a manufacturer of petrochemical products. Until the late1990s, it grew rapidly through the expansion of businesses with vertical integration and portfoliodiversification. It steadily continued to invest in production facilities during the 1990s, and increasedproduction outputs from linear alkylbenzene (LAB) and normal paraffin (NP) plants. As a result,it could flexibly respond to increasing world demand for industrial petrochemical products at thattime, showing high growth of sales revenues. However, it had undergone the stage of stagnation sincethe early of 2000s, and experienced growing pains when it reached approximately 500 million USDof sales revenues during the mid of 2000s. To overcome its growing pains, it had tried to deal witha wide range of issues involved with its stage of organizational decline and revitalization.
One of the most important factors in dealing with growing pains was to re-conceptualize its targetmarket and update its product lines. Since the late of 1990s, there had been an increased competitionin the markets of LAB and NP, due to new entrants from China and Middle Eastern countries. In sucha situation, Firm 4_A had successfully developed tertiary dodecyl mercaptan (TDM) in 1997, and it wasthe third company in the world to succeed in developing the TDM. The TDM production process bynature recycles waste generated in the LAB production process, and uses it as raw material. In this way,Firm 4_A had tried to expand its businesses by starting manufacturing a new product (TDM) relatedto its existing business activities. Under this form of related diversification, Firm 4_A had made easierthe consumption of its products by producing complementary goods, and enhanced the efficiencies inthe production process. Production of TDM became a new revenue-generating source for Firm 4_A,with the increased demand coming from the synthetic resin and synthetic rubber markets. As a result,Firm 4_A overcame its growing pains, and made a successful transition towards a high growth phasein the late of 2000s.
Firm 4_B’s course of growth is contrasted with that of Firm 4_A. Founded in 1964, Firm 4_Bmanufactures intermediate raw materials and basic chemical products used for various industrialfields. Firm 4_B had produced urea and ammonia using naphtha as a raw material, but it lagged
Sustainability 2018, 10, 3824 18 of 24
behind Middle Eastern companies which produced urea and ammonia with natural gas, and Chinesecompanies which produced them using coal with cost-competitiveness. As a result, Firm 4_Bhad been in a deficit since 2003, and suspended its production of urea and ammonia from 2011.Instead, it established a joint venture company with a Japanese ceramic manufacturer in 2011 toenter the secondary battery material market. It also established another joint venture company witha solar panel manufacturer in the U.S. to gain access to new opportunities in the solar polysiliconmarket. However, those businesses went into liquidation in 2015. As a result, it is still trapped in itsgrowing pains with challenges of revitalization. Firm 4_B tried to overcome growing pains througha horizontal expansion, seeking to diversify its product lines, and gain access to new markets withhigh-growth potential.
However, it is pointed out that Firm 4_B had implemented excessive diversification strategieswith unclear long-term strategic goals for revitalization, resulting in increased bureaucratic costs.Through the establishment of joint ventures, Firm 4_B had attempted to revise its strategic goalof producing high value-added chemical products, and to forcibly advance into new markets,following other global companies. The revitalization process with the lack of a long-term strategicdirection caused significant challenges for Firm 4_B in ensuring organizational developments alignedwith its future goals. Lacking alignment between organizational systems and strategic goals, the newbusinesses of Firm 4_B created additional bureaucratic costs, and hindered the revitalization processof the company. In reality, it can be noted that there were frequent conflicts between managersand engineers from foreign companies over sharing ideas, knowledge, and corporate cultures, due todifferences in organizational cultures.
It is important for companies in the stage of decline which pursue the process of revitalizationto develop and revise their organizational infrastructure in order to support new businesses.In this revitalization process, several different but related issues must be addressed. In other words,the organization needs to ensure whether it has appropriate resources, operational systems,management systems, and corporate governance, aligned with clear long-term strategic goals tosupport the revitalization process. Firm 4_A had a deeper understanding of how to fit and coordinatediversification activities with an existing organizational infrastructure. On the other hand, Firm 4_Bfailed to integrate the new businesses into its existing portfolio of business and revise its organizationalinfrastructure aligned with its future goals. Those examples shed light on the importance ofthe alignment between organizational infrastructure development and strategic goals in order toexit the decline stage and seek a revitalization process.
4. Conclusions
Firms go through distinct stages of growth, and face different sets of internal and externalenvironmental variables as they move from one stage to another [90]. The sustainable growthof firms involves successful transitions between growth stages through managing organizationalgrowing pains and maintaining sustainable competitive positions [91]. Different sets of variablesgoverning the organizations in each stage cause growth challenges, and tend to hinder a successfultransition process between growth stages. In this study, we define organizational growing pains asproblems that occur as a result of inadequate organizational development in relation to businesssize and external environments at a given stage of growth. The sustainable growth of firmscan be fraught with those growing pains. Therefore, it is important for managers and foundersof companies to understand the different aspects of the transitions over the life-cycle of businessorganizations in order to secure the sustainable growth of firms. In this context, the objectives ofthis paper are to propose a conceptual framework to account for a business organization’s life-cyclein terms of organizational growing pains and key developmental areas by synthesizing qualitativeand quantitative findings. To achieve this objective, we have formalized the proposed conceptualframework through analyzing key findings drawn from statistical analyses, and collecting evidencefrom case studies to enhance the accountability of our proposed framework. Through the case studies,
Sustainability 2018, 10, 3824 19 of 24
we have collected observations of organizational behavior to generalize about the determinants oforganizational growing pains and key developmental areas for organizations in the various stages oforganizational growth.
Based on the case studies, we examine case examples to highlight the importance of a firm’sstrategies in dealing with organizational problems appropriately in order to overcome growingpains. Our proposed conceptual framework drawn from the quantitative findings lays downtheoretical foundations for case studies. Our findings on the stages of growing pains and keyorganizational development areas for Korean firms from the 1990s to 2010s can be summarizedas follows: (1) Growth stage with 1st stage of growing pains (20 million USD in organizationalsize): systemization of management system; (2) Maturity stage with 2nd stage of growing pains(100 million USD): development of new products with enhanced R&D capabilities and complementaryassets; (3) Maturity stage with 3rd stage of growing pains (300 million USD): exploration of newmarkets for expanding business opportunities; and (4) Decline stage with 4th stage of growingpains (500 million USD): revitalization process on a wide range of organizational development areas.The life-cycle literature suggests that organizations evolve in a consistent and predictable manner,suggesting that organizational structures and strategies evolve as firms move through their life-cyclesand growth stages. From this perspective, the managers of companies must learn how to managegrowth and deal with their growing pains for the inevitable transitions from one to another stage ofgrowth. It is also required for managers to understand the significance of the concept of organizationallife-cycle and explore the underlying causes of growing pains that hinder a successful transition towardthe next phase of growth, and key organizational development areas to overcome organizationalgrowing pains [92].
Accordingly, our findings suggest that there are different types of transition during the growthtrajectories of firms that must be made at different stages of growth in order for business organizationsto continue to flourish and grow successfully. If those types of transitions between growth stagesare not made effectively, firms will experience growing pains, which have a significant impacton organizational effectiveness, efficiency, and success [14]. Different aspects of the transitionsand growing pains that must be made over the entire life-cycles of firms help us identify the underlyingfactors that cause transition failures between growth stages [90,93]. Understanding the underlyingdeterminants of growing pains and key developmental areas required for the successful transitionspromote long-term success and ultimately result in sustainable corporate growth. Based on theseunderstandings, leaders and managers of business organizations should proactively know about howto design organizations with appropriate business strategies in order to adapt to different sets ofinternal and external changes in accordance with growth stages. Their capabilities associated withmanagement and organizational development with timely decision-making in different situationscan contribute to the progress of organizations, and create value and competitive advantageover competitors.
In this context, this study has academic merit in presenting a conceptual framework forunderstanding the growth patterns and stages of business organizations in terms of organizationalgrowing pains. It presents a holistic framework beyond a synthesis of different models such as,organizational development models and organizational life-cycle models. Accordingly, we expectour proposed conceptual framework and organizational growth model to provide comprehensiveinsights for examining the linkage between organizational growing pains and formulation ofbusiness management strategies at different stages (or, positions) of business organizations byconsidering the governing internal and external conditions. The limitation of this study lies inthe fact that the analysis is limited to the contextual conditions of Korea. As noted by institutionaltheory, context-specific and institutional conditions can shape different strategic choices of firms.Therefore, further research may require the enhancement of generalizability beyond the context ofthis study.
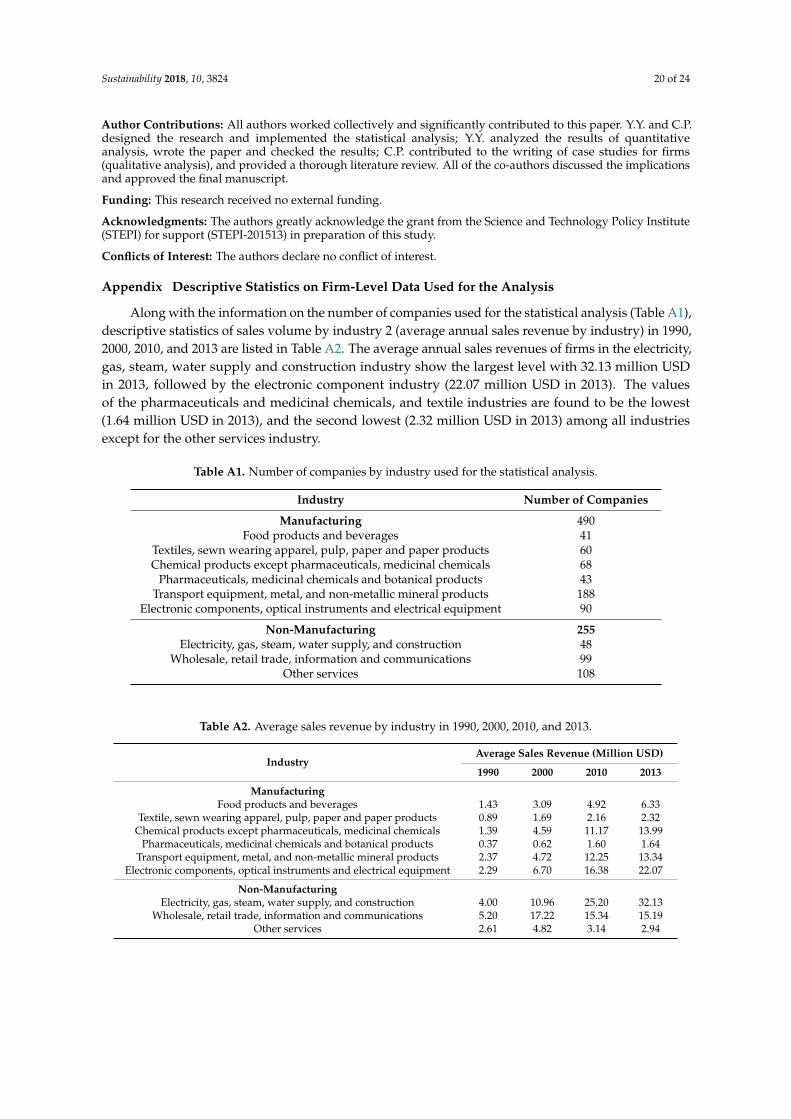
Sustainability 2018, 10, 3824 20 of 24
Author Contributions: All authors worked collectively and significantly contributed to this paper. Y.Y. and C.P.designed the research and implemented the statistical analysis; Y.Y. analyzed the results of quantitativeanalysis, wrote the paper and checked the results; C.P. contributed to the writing of case studies for firms(qualitative analysis), and provided a thorough literature review. All of the co-authors discussed the implicationsand approved the final manuscript.
Funding: This research received no external funding.
Acknowledgments: The authors greatly acknowledge the grant from the Science and Technology Policy Institute(STEPI) for support (STEPI-201513) in preparation of this study.
Conflicts of Interest: The authors declare no conflict of interest.
Appendix Descriptive Statistics on Firm-Level Data Used for the Analysis
Along with the information on the number of companies used for the statistical analysis (Table A1),descriptive statistics of sales volume by industry 2 (average annual sales revenue by industry) in 1990,2000, 2010, and 2013 are listed in Table A2. The average annual sales revenues of firms in the electricity,gas, steam, water supply and construction industry show the largest level with 32.13 million USDin 2013, followed by the electronic component industry (22.07 million USD in 2013). The valuesof the pharmaceuticals and medicinal chemicals, and textile industries are found to be the lowest(1.64 million USD in 2013), and the second lowest (2.32 million USD in 2013) among all industriesexcept for the other services industry.
Table A1. Number of companies by industry used for the statistical analysis.
Industry Number of Companies
Manufacturing 490Food products and beverages 41
Textiles, sewn wearing apparel, pulp, paper and paper products 60Chemical products except pharmaceuticals, medicinal chemicals 68
Pharmaceuticals, medicinal chemicals and botanical products 43Transport equipment, metal, and non-metallic mineral products 188
Electronic components, optical instruments and electrical equipment 90
Non-Manufacturing 255Electricity, gas, steam, water supply, and construction 48
Wholesale, retail trade, information and communications 99Other services 108
Table A2. Average sales revenue by industry in 1990, 2000, 2010, and 2013.
IndustryAverage Sales Revenue (Million USD)
1990 2000 2010 2013
ManufacturingFood products and beverages 1.43 3.09 4.92 6.33
Textile, sewn wearing apparel, pulp, paper and paper products 0.89 1.69 2.16 2.32Chemical products except pharmaceuticals, medicinal chemicals 1.39 4.59 11.17 13.99
Pharmaceuticals, medicinal chemicals and botanical products 0.37 0.62 1.60 1.64Transport equipment, metal, and non-metallic mineral products 2.37 4.72 12.25 13.34
Electronic components, optical instruments and electrical equipment 2.29 6.70 16.38 22.07
Non-ManufacturingElectricity, gas, steam, water supply, and construction 4.00 10.96 25.20 32.13
Wholesale, retail trade, information and communications 5.20 17.22 15.34 15.19Other services 2.61 4.82 3.14 2.94
Sustainability 2018, 10, 3824 21 of 24
References
1. Dodge, H.R.; Robbins, J.E. An empirical investigation of the organizational life cycle. J. Small Bus. Manag.1992, 30, 27–37.
2. McKelvie, A.; Wiklund, J. Advancing firm growth research: A focus on growth mode instead of growth rate.Entrep. Theory Pract. 2010, 34, 261–288. [CrossRef]
3. Flamholtz, E.; Hua, W. Strategic organizational development and the bottom line: Further empirical evidence.Eur. Manag. J. 2002, 20, 72–81. [CrossRef]
4. Greiner, L.E. Evolution and revolution as organizations grow. In Readings in Strategic Management; Springer:Berlin, Germany, 1989; pp. 373–387.
5. Scott, B.R. Stages of Corporate Development; Harvard Business School Press: Boston, MA, USA, 1971.6. Burke, W.W. Organization Change: Theory and Practice; Sage Publications: London, UK, 2017.7. Cummings, T.G. Organization Development and Change; John Wiley & Sons: Indianapolis, IN, USA, 2009.8. Carnall, C.; By, R.T. Managing Change in Organizations, 6th ed.; Pearson Higher Ed.: London, UK, 2014.9. Teece, D.J. Explicating dynamic capabilities: The nature and microfoundations of (sustainable) enterprise
performance. Strateg. Manag. J. 2007, 28, 1319–1350. [CrossRef]10. Smither, R.; Houston, J.; McIntire, S. Organization Development: Strategies for Changing Environments; Routledge:
London, UK, 2016.11. Benn, S.; Edwards, M.; Williams, T. Organizational Change for Corporate Sustainability; Routledge: London, UK, 2014.12. Coad, A.; Tamvada, J.P. Firm growth and barriers to growth among small firms in India. Small Bus. Econ.
2012, 39, 383–400. [CrossRef]13. Stam, E. Growth beyond Gibrat: Firm growth processes and strategies. Small Bus. Econ. 2010, 35, 129–135.
[CrossRef]14. Flamholtz, E.G.; Randle, Y. Growing Pains: Building Sustainably Successful Organizations; John Wiley & Sons:
Indianapolis, IN, USA, 2015.15. Flamholtz, E.G.; Randle, Y. Growing Pains: Transitioning from an Entrepreneurship Toa Professionally Managed
Firm; John Wiley & Sons: Indianapolis, IN, USA, 2012.16. Flamholtz, E.; Hua, W. Strategic organizational development, growing pains and corporate financial
performance: An empirical test. Eur. Manag. J. 2002, 20, 527–536. [CrossRef]17. Delmar, F.; Davidsson, P.; Gartner, W.B. Arriving at the high-growth firm. J. Bus. Ventur. 2003, 18, 189–216.
[CrossRef]18. Wales, W.; Monsen, E.; McKelvie, A. The organizational pervasiveness of entrepreneurial orientation.
Entrep. Theory Pract. 2011, 35, 895–923. [CrossRef]19. Shirokova, G.; Berezinets, I.; Shatalov, A. Organisational change and firm growth in emerging economies.
J. East Eur. Manag. Stud. 2014, 19, 185–212. [CrossRef]20. Flamholtz, E.G.; Randle, Y. Corporate culture, business models, competitive advantage, strategic assets
and the bottom line: Theoretical and measurement issues. J. Hum. Resour. Costing Account. 2012, 16, 76–94.[CrossRef]
21. Hambrick, D.C.; Crozier, L.M. Stumblers and stars in the management of rapid growth. J. Bus. Ventur. 1985,1, 31–45. [CrossRef]
22. Kazanjian, R.K. Relation of dominant problems to stages of growth in technology-based new ventures.Acad. Manag. J. 1988, 31, 257–279.
23. Kazanjian, R.K.; Drazin, R. An empirical test of a stage of growth progression model. Manag. Sci. 1989,35, 1489–1503. [CrossRef]
24. Kazanjian, R.K.; Drazin, R. A stage-contingent model of design and growth for technology based newventures. J. Bus. Ventur. 1990, 5, 137–150. [CrossRef]
25. Greiner, L.E. Evolution and revolution as organizations grow: A company’s past has clues for managementthat are critical to future success. Fam. Bus. Rev. 1997, 10, 397–409. [CrossRef]
26. Dobbs, M.; Hamilton, R. Small business growth: Recent evidence and new directions. Int. J. Entrep. Behave. Res.2007, 13, 296–322. [CrossRef]
27. Lee, Y.-J. Technology strategy by growth stage of technology-based venture companies. Int. Rev. Bus. Res. Pap.2010, 6, 216–234.
Sustainability 2018, 10, 3824 22 of 24
28. Muhos, M. Review of business growth models: Methodology and the assumption of determinism. Int. J.Manag. Enterp. Dev. 2015, 14, 288–306. [CrossRef]
29. Quinn, R.E.; Cameron, K. Organizational life cycles and shifting criteria of effectiveness: Some preliminaryevidence. Manag. Sci. 1983, 29, 33–51. [CrossRef]
30. Colombo, M.G.; Delmastro, M. The determinants of organizational change and structural inertia:Technological and organizational factors. J. Econ. Manag. Strategy 2002, 11, 595–635. [CrossRef]
31. Christensen, P.R. Managing Complexity and Change in SMEs: Frontiers in European Research; Edward ElgarPublishing: London, UK, 2006.
32. Abetti, P.A. Accelerated growth: Helping companies get and stay on the fast track. Int. J. Manuf. Technol. Manag.2001, 3, 15–30. [CrossRef]
33. Hanks, S.H.; Watson, C.J.; Jansen, E.; Chandler, G.N. Tightening the life-cycle construct: A taxonomic studyof growth stage configurations in high-technology organizations. Entrep. Theory Pract. 1993, 18, 5–30.[CrossRef]
34. Miller, D.; Friesen, P.H. A longitudinal study of the corporate life cycle. Manag. Sci. 1984, 30, 1161–1183.[CrossRef]
35. Leminen, S.; Westerlund, M. Categorizing the growth strategies of small firms. Technol. Innov. Manag. Rev.2012, 2, 5–9. [CrossRef]
36. Jaafar, H.; Halim, H.A. Refining the firm life cycle classification method: A firm value perspective. J. Econ.Bus. Manag. 2016, 4, 112–119. [CrossRef]
37. Gupta, P.D.; Guha, S.; Krishnaswami, S.S. Firm growth and its determinants. J. Innov. Entrep. 2013, 2, 15–30.[CrossRef]
38. Flamholtz, E. Managing organizational transitions: Implications for corporate and human resourcemanagement. Eur. Manag. J. 1995, 13, 39–51. [CrossRef]
39. Saunders, C.; Chan, Y.E. Rapid-growth firms: The challenge of managing information technology. Ivey Bus. J.2002, 66, 62–68.
40. Shah, S.F.H.; Nazir, T.; Zaman, K.; Shabir, M. Factors affecting the growth of enterprises: A survey ofthe literature from the perspective of small-and medium-sized enterprises. J. Enterp. Transform. 2013,3, 53–75. [CrossRef]
41. Flamholtz, E.G. Toward a holistic model of organizational effectiveness and organizational development atdifferent stages of growth. Hum. Resour. Dev. Q. 1990, 1, 109–127. [CrossRef]
42. Flamholtz, E.G.; Aksehirli, Z. Organizational success and failure: An empirical test of a holistic model.Eur. Manag. J. 2000, 18, 488–498. [CrossRef]
43. Penrose, E.T. The Theory of the Growth of the Firm; MIT Press: Cambridge, MA, USA, 1995.44. Kuruvilla, S.; Ranganathan, A. Economic development strategies and macro-and micro-level human resource
policies: The case of india’s “outsourcing” industry. Ind. Labor Relat. Rev. 2008, 62, 39–72. [CrossRef]45. Flamholtz, E.G.; Randle, Y. Successful organizational development and growing pains. Manag. Online Rev.
2007, 58, 1–9.46. Flamholtz, E.G.; Kurland, S. Strategic organizational development, infrastructure, and financial performance:
An empirical investigation. Int. J. Entrep. Educ. 2005, 3, 117–141.47. Andreeva, T.; Ritala, P. What are the sources of capability dynamism? Reconceptualizing dynamic capabilities
from the perspective of organizational change. Baltic J. Manag. 2016, 11, 238–259. [CrossRef]48. Weinzimmer, L.G. A replication and extension of organizational growth determinants. J. Bus. Res. 2000,
48, 35–41. [CrossRef]49. Weinzimmer, L.G.; Nystrom, P.C.; Freeman, S.J. Measuring organizational growth: Issues, consequences
and guidelines. J. Manag. 1998, 24, 235–262. [CrossRef]50. Hodrick, R.J.; Prescott, E.C. Postwar U.S. business cycles: An empirical investigation. J. Money Credit Bank.
1997, 29, 1–16. [CrossRef]51. Backus, D.K.; Kehoe, P.J. International evidence on the historical properties of business cycles. Am. Econ. Rev.
1992, 82, 864–888.52. Hansen, G.D. Indivisible labor and the business cycle. J. Monet. Econ. 1985, 16, 309–327. [CrossRef]53. Chenhall, R.H.; Langfield-Smith, K. Multiple perspectives of performance measures. Eur. Manag. J. 2007,
25, 266–282. [CrossRef]
Sustainability 2018, 10, 3824 23 of 24
54. Garengo, P.; Biazzo, S.; Bititci, U.S. Performance measurement systems in SMEs: A review for a researchagenda. Int. J. Manag. Rev. 2005, 7, 25–47. [CrossRef]
55. Birley, S.; Westhead, P. Growth and performance contrasts between ‘types’ of small firms. Strateg. Manag. J.1990, 11, 535–557. [CrossRef]
56. Kimberly, J.R. Organizational size and the structuralist perspective: A review, critique, and proposal.Adm. Inistrat. Sci. Q. 1976, 21, 571–597. [CrossRef]
57. Dragnic, D. Impact of internal and external factors on the performance of fast-growing small and mediumbusinesses. Manag. J. Contemp. Manag. Issues 2014, 19, 119–159.
58. Covin, J.G.; Green, K.M.; Slevin, D.P. Strategic process effects on the entrepreneurial orientation–sales growthrate relationship. Entrep. Theory Pract. 2006, 30, 57–81. [CrossRef]
59. El-Ansary, A.I. Marketing strategy: Taxonomy and frameworks. Eur. Bus. Rev. 2006, 18, 266–293. [CrossRef]60. Palmer, R.; Pels, J. Marketing practice and market orientation: An exploratory international study. J. Euromark.
2005, 14, 59–86. [CrossRef]61. Shin, K.; Park, G.; Choi, J.Y.; Choy, M. Factors affecting the survival of SMEs: A study of biotechnology firms
in South Korea. Sustainability 2017, 9, 108. [CrossRef]62. Nilsson, A. Balancing the management control package of small, rapidly growing firms in turbulent
environments. Int. J. Entrep. Small Bus. 2010, 11, 3–24. [CrossRef]63. Brush, C.G.; Ceru, D.J.; Blackburn, R. Pathways to entrepreneurial growth: The influence of management,
marketing, and money. Bus. Horiz. 2009, 52, 481–491. [CrossRef]64. Bisbe, J.; Otley, D. The effects of the interactive use of management control systems on product innovation.
Account. Organ. Soc. 2004, 29, 709–737. [CrossRef]65. Picken, J.C. From startup to scalable enterprise: Laying the foundation. Bus. Horiz. 2017, 60, 587–595.
[CrossRef]66. Demir, R.; Wennberg, K.; McKelvie, A. The strategic management of high-growth firms: A review
and theoretical conceptualization. Long Range Plan. 2017, 50, 431–456. [CrossRef]67. Brown, R.; Mawson, S. Trigger points and high-growth firms: A conceptualisation and review of public
policy implications. J. Small Bus. Enterp. Dev. 2013, 20, 279–295. [CrossRef]68. Hur, J.; Riyanto, Y.E. Organizational structure and product market competition. J. Econ. Manag. Strategy
2012, 21, 707–743. [CrossRef]69. Barney, J.B.; Ketchen, D.J., Jr.; Wright, M. The future of resource-based theory: Revitalization or decline?
J. Manag. 2011, 37, 1299–1315. [CrossRef]70. Kelley, D.J.; Rice, M.P. Leveraging the value of proprietary technologies. J. Small Bus. Manag. 2002, 40, 1–16.
[CrossRef]71. Leonard-Barton, D. Core capabilities and core rigidities: A paradox in managing new product development.
Strateg. Manag. J. 1992, 13, 111–125. [CrossRef]72. Heine, K.; Rindfleisch, H. Organizational decline: A synthesis of insights from organizational ecology, path
dependence and the resource-based view. J. Organ. Chang. Manag. 2013, 26, 8–28. [CrossRef]73. Agarwal, R.; Gort, M. Firm and product life cycles and firm survival. Am. Econ. Rev. 2002, 92, 184–190.
[CrossRef]74. Loderer, C.F.; Waelchli, U. Firm Age and Performance; MPRA Working Paper; University of Munich:
Munich, Germany, 2010.75. Whetten, D.A. Organizational growth and decline processes. Annu. Rev. Social. 1987, 13, 335–358. [CrossRef]76. Filley, A.C.; House, R.J. Managerial process and organizational behavior. Acad. Manag. J. 1969, 12, 523.
[CrossRef]77. Steinmetz, L.L. Critical stages of small business growth. Bus. Horiz. 1969, 12, 29–36. [CrossRef]78. Davila, A.; Foster, G. Management control systems in early-stage startup companies. Account. Rev. 2007,
82, 907–937. [CrossRef]79. Ingley, C.; Khlif, W.; Karoui, L. SME growth trajectories, transitions and board role portfolios: A critical
review and integrative model. Int. Small Bus. J. 2017, 35, 729–750. [CrossRef]80. Bamiatzi, V.C.; Kirchmaier, T. Strategies for superior performance under adverse conditions: A focus on
small and medium-sized high-growth firms. Int. Small Bus. J. 2014, 32, 259–284. [CrossRef]
Sustainability 2018, 10, 3824 24 of 24
81. Davila, A.; Foster, G.; Li, M. Reasons for management control systems adoption: Insights from productdevelopment systems choice by early-stage entrepreneurial companies. Account. Organ. Soc. 2009,34, 322–347. [CrossRef]
82. Santini, C.; Rabino, S. Internationalisation drivers in the wine business: A RBV perspective. Int. J. Bus. Glob.2012, 8, 7–19. [CrossRef]
83. Zhou, Z.; Chen, Z. Formation mechanism of knowledge rigidity in firms. J. Knowl. Manag. 2011, 15, 820–835.[CrossRef]
84. Chenhall, R.H. The contingent design of performance measures. Contemp. Issues Manag. Account. 2006,1, 92–117.
85. Gerdin, J.; Greve, J. Forms of contingency fit in management accounting research—A critical review.Account. Organ. Soc. 2004, 29, 303–326. [CrossRef]
86. Luft, J.; Shields, M.D. Mapping management accounting: Making structural models from theory-basedempirical research. Account. Organ. Soc. 2003, 28, 77–99. [CrossRef]
87. Peng, M.W.; Sun, S.L.; Pinkham, B.; Chen, H. The institution-based view as a third leg for a strategy tripod.Acad. Manag. Perspect. 2009, 23, 63–81. [CrossRef]
88. Lim, D.S.; Morse, E.A.; Mitchell, R.K.; Seawright, K.K. Institutional environment and entrepreneurialcognitions: A comparative business systems perspective. Entrep. Theory Pract. 2010, 34, 491–516. [CrossRef]
89. Milgrom, P.R.; Roberts, J. Economics, Organization and Management; Prentice-Hall International: Upper SaddleRiver, NJ, USA, 1992.
90. Zhang, J.; Xie, H.; Li, H. Positioning and priorities of growth management in construction industrialization:Chinese firm-level empirical research. Sustainability 2017, 9, 1105. [CrossRef]
91. Songling, Y.; Ishtiaq, M.; Anwar, M.; Ahmed, H. The role of government support in sustainable competitiveposition and firm performance. Sustainability 2018, 10, 3495. [CrossRef]
92. Longenecker, C.O.; Neubert, M.J.; Fink, L.S. Causes and consequences of managerial failure in rapidlychanging organizations. Bus. Horiz. 2007, 50, 145–155. [CrossRef]
93. Shih, T.-Y. Determinants of enterprises radical innovation and performance: Insights into strategic orientationof cultural and creative enterprises. Sustainability 2018, 10, 1871. [CrossRef]
© 2018 by the authors. Licensee MDPI, Basel, Switzerland. This article is an open accessarticle distributed under the terms and conditions of the Creative Commons Attribution(CC BY) license (http://creativecommons.org/licenses/by/4.0/).