msl_2018_4.pdf - Growing Science
12
* Corresponding author. Tel.: +918827817365 E-mail address: [email protected] (M. Mathew) © 2018 by the authors; licensee Growing Science, Canada doi: 10.5267/j.msl.2018.1.004 Management Science Letters 8 (2018) 139–150 Contents lists available at GrowingScience Management Science Letters homepage: www.GrowingScience.com/msl Comparison of new multi-criteria decision making methods for material handling equipment selection Manoj Mathew a* and Sagar Sahu a a Department of Mechanical Engineering, SSIPMT, Raipur, C.G., India C H R O N I C L E A B S T R A C T Article history: Received: November 26, 2017 Received in revised format: No- vember 26, 2017 Accepted: January 28, 2018 Available online: January 30, 2018 Conveyors and automated guided vehicles (AGVs) are important mechanical handling equipment used to transport loads from one place to another. Selection of proper material handling equipment is an intricate process. In the present paper two material handling equipment selection problem was solved using various newly developed multi criteria decision making (MCDM) methods. First a conveyor selection problem with six conflicting criteria and four alternatives was solved using four MCDM methods, i.e. combinative distance based assessment (CODAS) method, evaluation based on distance from average solution (EDAS) method, weighted aggregated sum product as- sessment (WASPAS) method and multi-objective optimization on the basis of ratio analysis (MOORA) method. Second an automated guided vehicles selection problem with six conflicting criteria and eight alternatives was solved using CODAS, EDAS, WASPAS and MOORA methods. Spearman rank correlation coefficient was calculated between the ranks obtained by various meth- ods. The ranks obtained by these methods were even compared with the ranks of other MCDM methods and it was found that the relatively new methods CODAS, EDAS and WASPAS were in good agreement with each other. © 2018 by the authors; licensee Growing Science, Canada Keywords: MCDM CODAS EDAS MOORA WASPAS Conveyor selection Automated guided vehicle selec- tion 1. Introduction In a production unit, proper selection of material handling equipment plays a crucial role in increasing the effectiveness and efficiency of the complete system (Komljenovic & Kecojevic, 2009). The cost of production, operating cost and production rate, all depend on the selection of proper material handling equipment. In today’s era where technological advancement has achieved a greater height, large num- bers of material handling equipment are available in the market (Lin et al., 2007). Each material han- dling equipment has its own distinct characteristics along with pros and cons, which make the selection of material handling equipment a complicated affair. Multi-criteria decision making (MCDM) methods can act as an excellent tool for solving these kinds of problems. Conveyors are material handling equip- ment which is used to transport loads continuously from one place to another over a fixed path (Peters et al., 1998). There are various parameters on which a conveyor system is selected. Cost both fixed and
-
Upload
khangminh22 -
Category
Documents
-
view
1 -
download
0
Transcript of msl_2018_4.pdf - Growing Science

* Corresponding author. Tel.: +918827817365 E-mail address: [email protected] (M. Mathew) © 2018 by the authors; licensee Growing Science, Canada doi: 10.5267/j.msl.2018.1.004
Management Science Letters 8 (2018) 139–150
Contents lists available at GrowingScience
Management Science Letters
homepage: www.GrowingScience.com/msl
Comparison of new multi-criteria decision making methods for material handling equipment selection
Manoj Mathewa* and Sagar Sahua
aDepartment of Mechanical Engineering, SSIPMT, Raipur, C.G., India C H R O N I C L E A B S T R A C T
Article history: Received: November 26, 2017 Received in revised format: No-vember 26, 2017 Accepted: January 28, 2018 Available online: January 30, 2018
Conveyors and automated guided vehicles (AGVs) are important mechanical handling equipment used to transport loads from one place to another. Selection of proper material handling equipment is an intricate process. In the present paper two material handling equipment selection problem was solved using various newly developed multi criteria decision making (MCDM) methods. First a conveyor selection problem with six conflicting criteria and four alternatives was solved using four MCDM methods, i.e. combinative distance based assessment (CODAS) method, evaluation based on distance from average solution (EDAS) method, weighted aggregated sum product as-sessment (WASPAS) method and multi-objective optimization on the basis of ratio analysis (MOORA) method. Second an automated guided vehicles selection problem with six conflicting criteria and eight alternatives was solved using CODAS, EDAS, WASPAS and MOORA methods. Spearman rank correlation coefficient was calculated between the ranks obtained by various meth-ods. The ranks obtained by these methods were even compared with the ranks of other MCDM methods and it was found that the relatively new methods CODAS, EDAS and WASPAS were in good agreement with each other.
© 2018 by the authors; licensee Growing Science, Canada
Keywords: MCDM CODAS EDAS MOORA WASPAS Conveyor selection Automated guided vehicle selec-tion
1. Introduction In a production unit, proper selection of material handling equipment plays a crucial role in increasing the effectiveness and efficiency of the complete system (Komljenovic & Kecojevic, 2009). The cost of production, operating cost and production rate, all depend on the selection of proper material handling equipment. In today’s era where technological advancement has achieved a greater height, large num-bers of material handling equipment are available in the market (Lin et al., 2007). Each material han-dling equipment has its own distinct characteristics along with pros and cons, which make the selection of material handling equipment a complicated affair. Multi-criteria decision making (MCDM) methods can act as an excellent tool for solving these kinds of problems. Conveyors are material handling equip-ment which is used to transport loads continuously from one place to another over a fixed path (Peters et al., 1998). There are various parameters on which a conveyor system is selected. Cost both fixed and
140
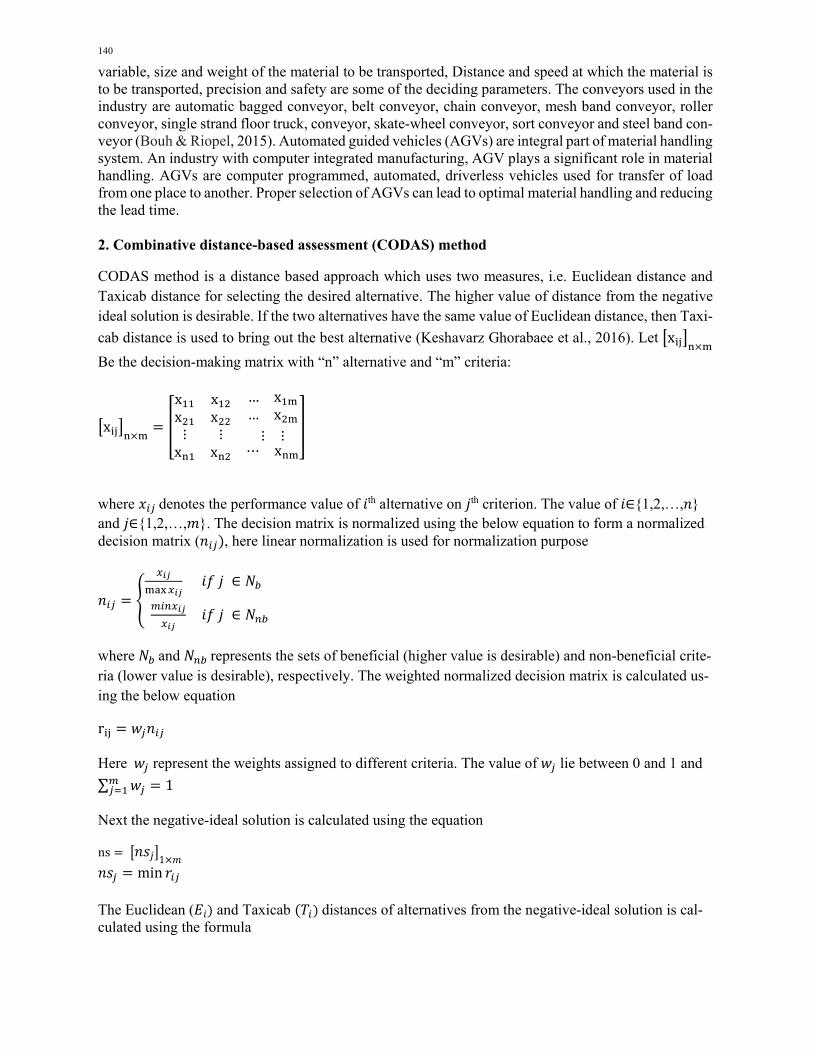
variable, size and weight of the material to be transported, Distance and speed at which the material is to be transported, precision and safety are some of the deciding parameters. The conveyors used in the industry are automatic bagged conveyor, belt conveyor, chain conveyor, mesh band conveyor, roller conveyor, single strand floor truck, conveyor, skate-wheel conveyor, sort conveyor and steel band con-veyor (Bouh & Riopel, 2015). Automated guided vehicles (AGVs) are integral part of material handling system. An industry with computer integrated manufacturing, AGV plays a significant role in material handling. AGVs are computer programmed, automated, driverless vehicles used for transfer of load from one place to another. Proper selection of AGVs can lead to optimal material handling and reducing the lead time. 2. Combinative distance-based assessment (CODAS) method
CODAS method is a distance based approach which uses two measures, i.e. Euclidean distance and Taxicab distance for selecting the desired alternative. The higher value of distance from the negative ideal solution is desirable. If the two alternatives have the same value of Euclidean distance, then Taxi-
cab distance is used to bring out the best alternative (Keshavarz Ghorabaee et al., 2016). Let x
Be the decision-making matrix with “n” alternative and “m” criteria:
x
x x … xx x … x⋮x
⋮x
⋮ ⋮⋯ x
where denotes the performance value of th alternative on th criterion. The value of ∈{1,2,…, } and ∈{1,2,…, }. The decision matrix is normalized using the below equation to form a normalized decision matrix ( , here linear normalization is used for normalization purpose
∈
∈
where and represents the sets of beneficial (higher value is desirable) and non-beneficial crite-ria (lower value is desirable), respectively. The weighted normalized decision matrix is calculated us-ing the below equation
r
Here represent the weights assigned to different criteria. The value of lie between 0 and 1 and
∑ 1
Next the negative-ideal solution is calculated using the equation
ns 1
min
The Euclidean ( and Taxicab distances of alternatives from the negative-ideal solution is cal-culated using the formula

M. Mathew and S. Sahu / Management Science Letters 8 (2018)
141
∑
∑
The relative assessment matrix is obtained using the equation
n ψ
where ∈{1,2,…, } and denotes a threshold function to recognize the equality of the Euclidean distances of two alternatives which is defined as
ψ1, | | τ0, | |
In the above equation is the threshold parameter which is set or taken by the decision maker. It is suggested that the value shouldliebetween0.01 and 0.05 (Keshavarz Ghorabaee et al., 2016). If the difference between Euclidean distances of two alternatives is less than thethresholdvalue, then the two alternatives are also compared with the Taxicab distance. In the present paper the value of istakenas0.02. The final assessment score of each alternative is calculated using formula
∑
The alternative having highest value is selected as the best choice among the alternatives.
3. Evaluation Based on Distance from Average Solution (EDAS) Method EDAS method is also a distance based approach which uses positive and negative distances from the average solution for raking the available alternatives (Keshavarz Ghorabaee et al., 2016). Let x
be the decision-making matrix with “n” alternative and “m” criteria:
x
x x … xx x … x⋮x
⋮x
⋮ ⋮⋯ x
where denotes the performance value of th alternative on th criterion ( ∈{1,2,…, } and
∈{1,2,…, }). The average solution AV for all criteria is calculated
where, ∑
The positive distance from the average (PDA) and the negative distance from the average (NDA) are calculated depending based on the type of criteria (benefit and non-beneficial), shown as follows:

142
If jth criterion is beneficial,
max 0,
max 0,
And if jth criterion is non-beneficial,
max 0,
max 0,
Where and denote the positive and negative distance of ith alternative from average solution in terms of jth criterion, respectively. Next the weighted sum of the positive and the negative distance from the average solution for all alternatives is calculated using the equation
where wj is the weight of jth criterion. The weighted sum of the positive and the negative distance from the average solution for all alternatives is normalized using the equation
1
The final appraisal score (AS) for all alternatives is calculated using which the mean is of the normal-ized weighted sum of the positive and the negative distance from the average solution for all alternatives
12
where 0 1
The alternative with the highest appraisal score is selected as the best choice among the available alter-natives. 4. Weighted Aggregated Sum Product Assessment (WASPAS) Method Weighted Aggregated Sum Product Assessment Method was given by Šaparauskas et al. (2011). They joined two criteria of optimality, the first criteria of optimality is a weighted sum of the normalized
performance value similar to Simple Additive Weighting method . The second criterion is similar to the weighted product method. Let x be the decision-making matrix with “n” alternative and “m” criteria:
M. Mathew and S. Sahu / Management Science Letters 8 (2018)
143
x
x x … xx x … x⋮x
⋮x
⋮ ⋮⋯ x
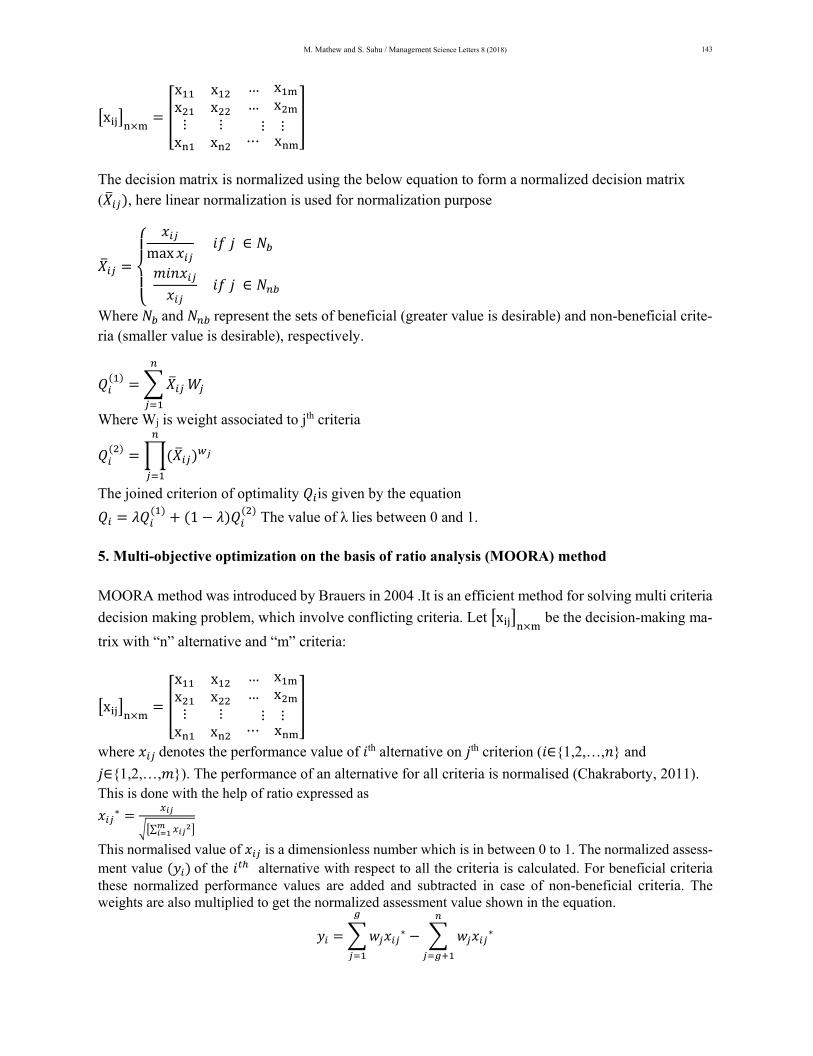
The decision matrix is normalized using the below equation to form a normalized decision matrix ( , here linear normalization is used for normalization purpose
max ∈
∈
Where and represent the sets of beneficial (greater value is desirable) and non-beneficial crite-ria (smaller value is desirable), respectively.
Where Wj is weight associated to jth criteria
The joined criterion of optimality is given by the equation
1 The value of λ lies between 0 and 1.
5. Multi-objective optimization on the basis of ratio analysis (MOORA) method MOORA method was introduced by Brauers in 2004 .It is an efficient method for solving multi criteria
decision making problem, which involve conflicting criteria. Let x be the decision-making ma-
trix with “n” alternative and “m” criteria:
x
x x … xx x … x⋮x
⋮x
⋮ ⋮⋯ x
where denotes the performance value of th alternative on th criterion ( ∈{1,2,…, } and
∈{1,2,…, }). The performance of an alternative for all criteria is normalised (Chakraborty, 2011). This is done with the help of ratio expressed as
∗
∑
This normalised value of is a dimensionless number which is in between 0 to 1. The normalized assess-ment value of the alternative with respect to all the criteria is calculated. For beneficial criteria these normalized performance values are added and subtracted in case of non-beneficial criteria. The weights are also multiplied to get the normalized assessment value shown in the equation.
∗ ∗

144
Here is the weight of criteria, g is the number of beneficial criteria and (n−g) is the number of non-beneficial criteria. The normalized assessment value can be positive or negative depending on the total number of beneficial and non-beneficial criterion in the decision matrix. The value for all alternatives shows the final prefer-ence list. The best alternative has the highest value of , while the worst alternative has the lowest value. 6. Example 1 Kulak (2005) in his paper used fuzzy multi-attribute selection process for selecting the best conveyor alternative out of four available alternatives with six selection criteria. Rao (2007) solved the problem and calculated the preference index for the same four conveyors using simple additive weighting, weighted product method, analytical hierarchy process, graph theory and matrix approach, technique for order performance by similarity to ideal solution (TOPSIS) and modified TOPSIS. Karande and Chakraborty (2013) solved the same problem using weighted utility additive (WUTA) method, VIse Kriterijumska Optimizacija kompromisno Resenje (VIKOR), Preference Ranking Organization method for enrichment evaluation (PROMETHEE), ELECTRE methods and compared the ranking obtained by different methods. Table 1 displays decision matrix for the conveyor selection problem in which four alternative conveyors are shown, these four conveyors can be selected on the basis of six criteria, i.e. fixed cost per hour (FC), Variable cost per hour (VC), Speed of conveyor in m/min (SC), Item width in cm (IW), Item weight in kg (W) and Flexibility (F). In this example, there are four ben-eficial criteria, i.e. Speed of conveyor, Item width, Item weight and Flexibility. Fixed costs per hour and Variable cost per hour are the two non-beneficial criteria whose minimum value are preferred. Table 1 Decision matrix for the conveyor selection problem (Kulak, 2005)
Criteria Weights 0.1049 0.126 0.126 0.2402 0.2245 0.1782
Conveyor Alternative
fixed cost per hour (FC)
Variable cost per hour(VC)
Speed of con-veyor (m/min)
(SC)
Item width
(cm) (IW)
Item weight
(kg) (W) Flexibility (F)
A1 2 0.45 12 15 10 Very good (0.745) A2 2.3 0.44 13 20 10 Excellent (0.955) A3 2.25 0.45 11 30 20 Excellent (0.955) A4 2.4 0.46 10 25 15 Very good (0.745)
6.1 Combinative distance-based assessment (CODAS) method
The performance value Xij were normalized and weighted normalized decision matrix was calculated along with negative ideal solution for all criteria. The Euclidean distances and Taxicab distances of alternatives from the negative-ideal solution were also computed to find the final relative assessment matrix (Ra) and the assessment scores (Hi) of alternatives shown in Table 2. From the assessment score it is clear that A3 is the best conveyor alternative among all other alternative. The ranking of alternative obtained from CODAS method is A3>A4>A2>A1.
Table 2 Relative assessment matrix and the assessment scores of alternatives
A1 A2 A3 A4 HiA1 0 -0.11525 -0.39334 -0.16818 -0.67678A2 0.115254 0 -0.27809 -0.05293 -0.21576A3 0.393341 0.278087 0 0.225158 0.896586A4 0.168183 0.052929 -0.22516 0 -0.00405
M. Mathew and S. Sahu / Management Science Letters 8 (2018)
145
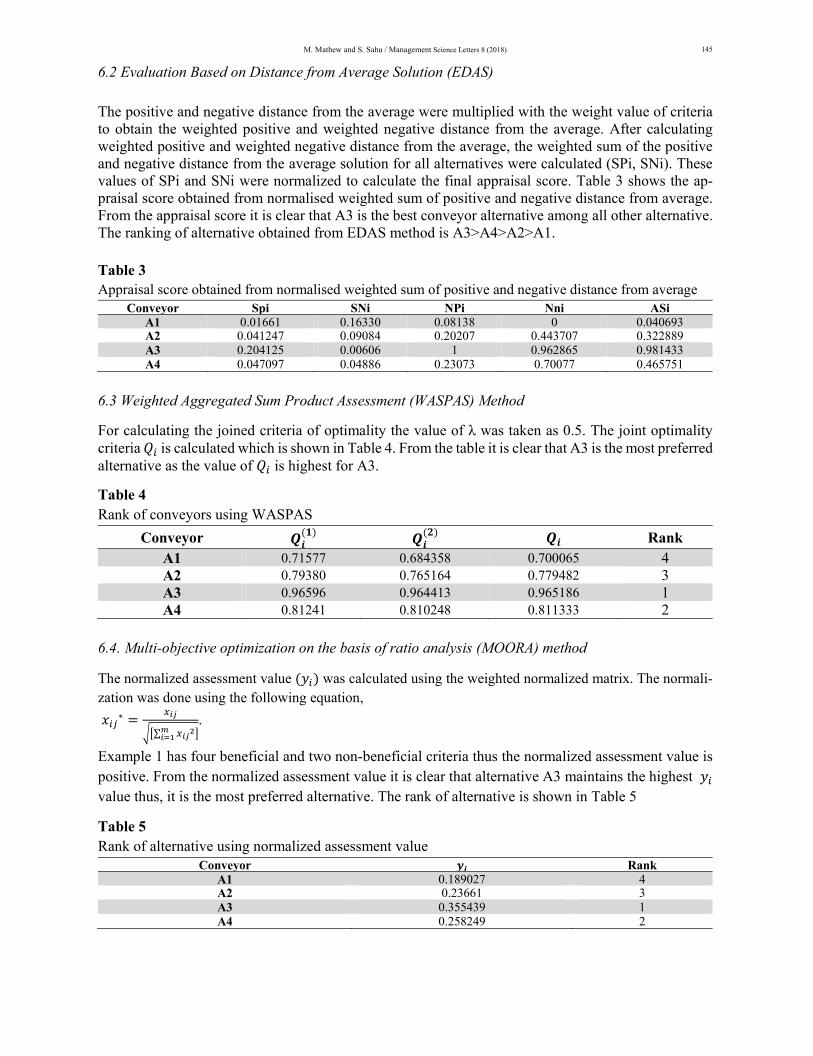
6.2 Evaluation Based on Distance from Average Solution (EDAS) The positive and negative distance from the average were multiplied with the weight value of criteria to obtain the weighted positive and weighted negative distance from the average. After calculating weighted positive and weighted negative distance from the average, the weighted sum of the positive and negative distance from the average solution for all alternatives were calculated (SPi, SNi). These values of SPi and SNi were normalized to calculate the final appraisal score. Table 3 shows the ap-praisal score obtained from normalised weighted sum of positive and negative distance from average. From the appraisal score it is clear that A3 is the best conveyor alternative among all other alternative. The ranking of alternative obtained from EDAS method is A3>A4>A2>A1.
Table 3 Appraisal score obtained from normalised weighted sum of positive and negative distance from average
Conveyor Spi SNi NPi Nni ASiA1 0.01661 0.16330 0.08138 0 0.040693A2 0.041247 0.09084 0.20207 0.443707 0.322889A3 0.204125 0.00606 1 0.962865 0.981433A4 0.047097 0.04886 0.23073 0.70077 0.465751
6.3 Weighted Aggregated Sum Product Assessment (WASPAS) Method
For calculating the joined criteria of optimality the value of λ was taken as 0.5. The joint optimality criteria is calculated which is shown in Table 4. From the table it is clear that A3 is the most preferred alternative as the value of is highest for A3.
Table 4 Rank of conveyors using WASPAS
Conveyor Rank A1 0.71577 0.684358 0.700065 4 A2 0.79380 0.765164 0.779482 3 A3 0.96596 0.964413 0.965186 1 A4 0.81241 0.810248 0.811333 2
6.4. Multi-objective optimization on the basis of ratio analysis (MOORA) method
The normalized assessment value was calculated using the weighted normalized matrix. The normali-zation was done using the following equation,
∗
∑.
Example 1 has four beneficial and two non-beneficial criteria thus the normalized assessment value is positive. From the normalized assessment value it is clear that alternative A3 maintains the highest value thus, it is the most preferred alternative. The rank of alternative is shown in Table 5
Table 5 Rank of alternative using normalized assessment value
Conveyor RankA1 0.189027 4 A2 0.23661 3 A3 0.355439 1 A4 0.258249 2

146
7. Example 2
Maniya and Bhatt (2011) solved an automated guided vehicle selection problem using modified grey relational analysis method. The weights of the criteria were calculated using analytical hierarchy ap-proach (AHP). The decision matrix in the problem contained eight alternatives and six conflicting cri-teria, in which controllability, accuracy, range, reliability and flexibility are beneficial criteria while cost is a non-beneficial criterion. The decision matrix in Table 6 is the decision matrix which contains linguistic terms converted to quantitative value using five-point conversion scale used by Rao (2007). The converted quantitative values lie between the same upper and lower values, so normalization of this decision matrix was not required. The criteria weights was calculated by Maniya and Bhatt (2011) using AHP method. Table 6 Decision matrix for selection of AGV (Maniya & Bhatt, 2011)
Criteria Weights
0.346 0.168 0.0584 0.073 0.063 0.293
AGV Alternative Controllability Accuracy Cost Range Reliability Flexibility
A1 High (0.895) Average (0.495) Above Average (0.695) Average (0.495)
High (0.895) Below Average
(0.295) A2 Low (0.115) High (0.895) High (0.895) High (0.895) Average (0.495) Average (0.495)
A3 Low (0.115) Low (0.115) High (0.895) Low (0.115) Above Average
(0.695) High (0.895)
A4 Below Average
(0.295) High (0.895) Low (0.115)
Average (0.495)
Average (0.495) High (0.895)
A5 High (0.895) Average (0.495) Low (0.115) Above Average
(0.695) Below Average
(0.295) Average (0.495)
A6 Average (0.495)
Average (0.495) High (0.895) Low (0.115) Above Average
(0.695) Above Average
(0.695)
A7 Low (0.115) Below Average
(0.295) High (0.895) Low (0.115) High (0.895) High (0.895)
A8 Low (0.115) Average (0.495) Above Average (0.695) Average (0.495)
Average (0.495) Above Average
(0.695)
7.1 Combinative distance-based assessment (CODAS) method
The weighted normalized decision matrix was calculated along with negative ideal solution for all six criteria. The Euclidean distances and Taxicab distances of all alternatives from the negative ideal solu-tions were also calculated to find the final relative assessment matrix (Ra) and the assessment scores (Hi) of alternatives shown in Table 7. From the assessment score it is clear that A5 is the best alternative among all other alternative. Table 7 Relative assessment matrix and the assessment scores of alternatives
A1 A2 A3 A4 A5 A6 A7 A8 Hi RankA1 0.000 0.250 0.287 0.077 -0.005 0.139 0.239 0.320 1.307 2A2 -0.250 0.000 0.036 -0.173 -0.255 -0.111 -0.011 0.070 -0.695 6A3 -0.287 -0.036 0.000 -0.210 -0.291 -0.148 -0.047 0.034 -0.985 7A4 -0.077 0.173 0.210 0.000 -0.082 0.062 0.162 0.243 0.691 3A5 0.005 0.255 0.291 0.082 0.000 0.144 0.244 0.325 1.345 1A6 -0.139 0.111 0.148 -0.062 -0.144 0.000 0.100 0.181 0.197 4A7 -0.239 0.011 0.047 -0.162 -0.244 -0.100 0.000 0.081 -0.606 5A8 -0.320 -0.070 -0.034 -0.243 -0.325 -0.181 -0.081 0.000 -1.254 8
7.2 Evaluation Based on Distance from Average Solution (EDAS) The positive and negative distance from the average were multiplied with the weight value of criteria to obtain the weighted positive and weighted negative distances from the average. The weighted sum of the positive and negative distance from the average solution (SPi, SNi) for all eight alternatives were
M. Mathew and S. Sahu / Management Science Letters 8 (2018)
147
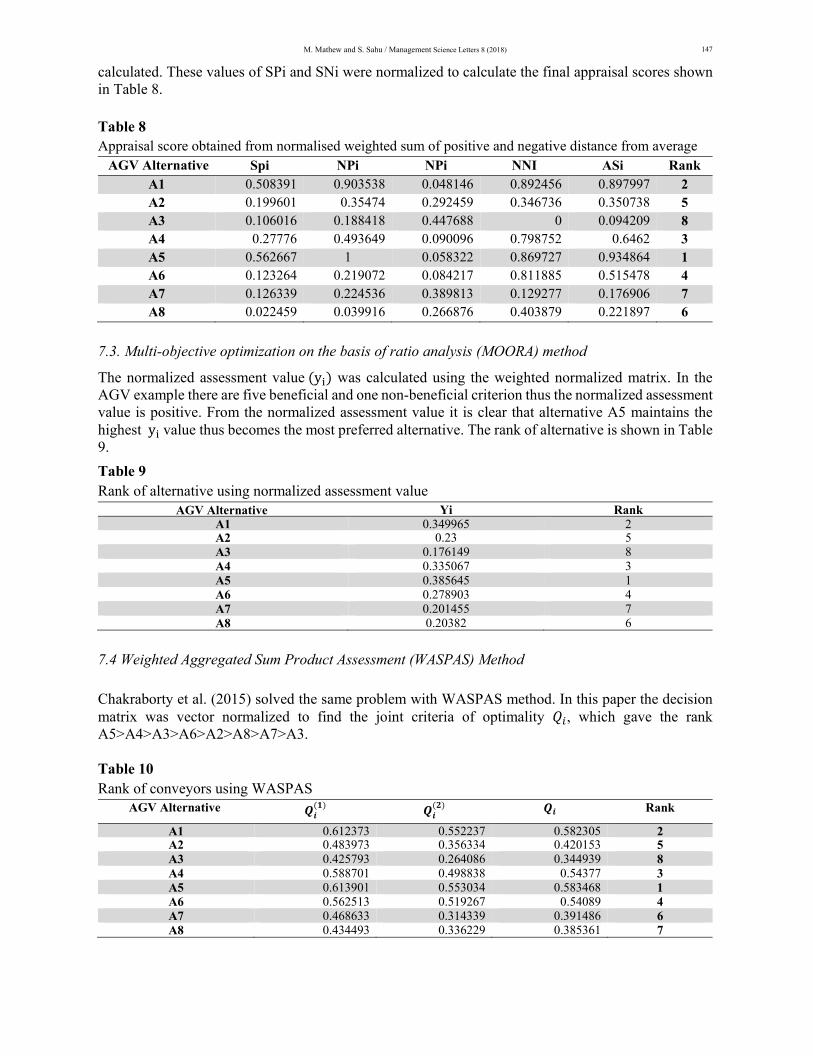
calculated. These values of SPi and SNi were normalized to calculate the final appraisal scores shown in Table 8.
Table 8 Appraisal score obtained from normalised weighted sum of positive and negative distance from average AGV Alternative Spi NPi NPi NNI ASi Rank
A1 0.508391 0.903538 0.048146 0.892456 0.897997 2 A2 0.199601 0.35474 0.292459 0.346736 0.350738 5 A3 0.106016 0.188418 0.447688 0 0.094209 8 A4 0.27776 0.493649 0.090096 0.798752 0.6462 3 A5 0.562667 1 0.058322 0.869727 0.934864 1 A6 0.123264 0.219072 0.084217 0.811885 0.515478 4 A7 0.126339 0.224536 0.389813 0.129277 0.176906 7 A8 0.022459 0.039916 0.266876 0.403879 0.221897 6
7.3. Multi-objective optimization on the basis of ratio analysis (MOORA) method
The normalized assessment value y was calculated using the weighted normalized matrix. In the AGV example there are five beneficial and one non-beneficial criterion thus the normalized assessment value is positive. From the normalized assessment value it is clear that alternative A5 maintains the highest y value thus becomes the most preferred alternative. The rank of alternative is shown in Table 9.
Table 9 Rank of alternative using normalized assessment value
AGV Alternative Yi Rank A1 0.349965 2 A2 0.23 5 A3 0.176149 8 A4 0.335067 3 A5 0.385645 1 A6 0.278903 4 A7 0.201455 7 A8 0.20382 6
7.4 Weighted Aggregated Sum Product Assessment (WASPAS) Method Chakraborty et al. (2015) solved the same problem with WASPAS method. In this paper the decision matrix was vector normalized to find the joint criteria of optimality , which gave the rank A5>A4>A3>A6>A2>A8>A7>A3. Table 10 Rank of conveyors using WASPAS
AGV Alternative Rank
A1 0.612373 0.552237 0.582305 2A2 0.483973 0.356334 0.420153 5A3 0.425793 0.264086 0.344939 8A4 0.588701 0.498838 0.54377 3A5 0.613901 0.553034 0.583468 1A6 0.562513 0.519267 0.54089 4A7 0.468633 0.314339 0.391486 6A8 0.434493 0.336229 0.385361 7
148
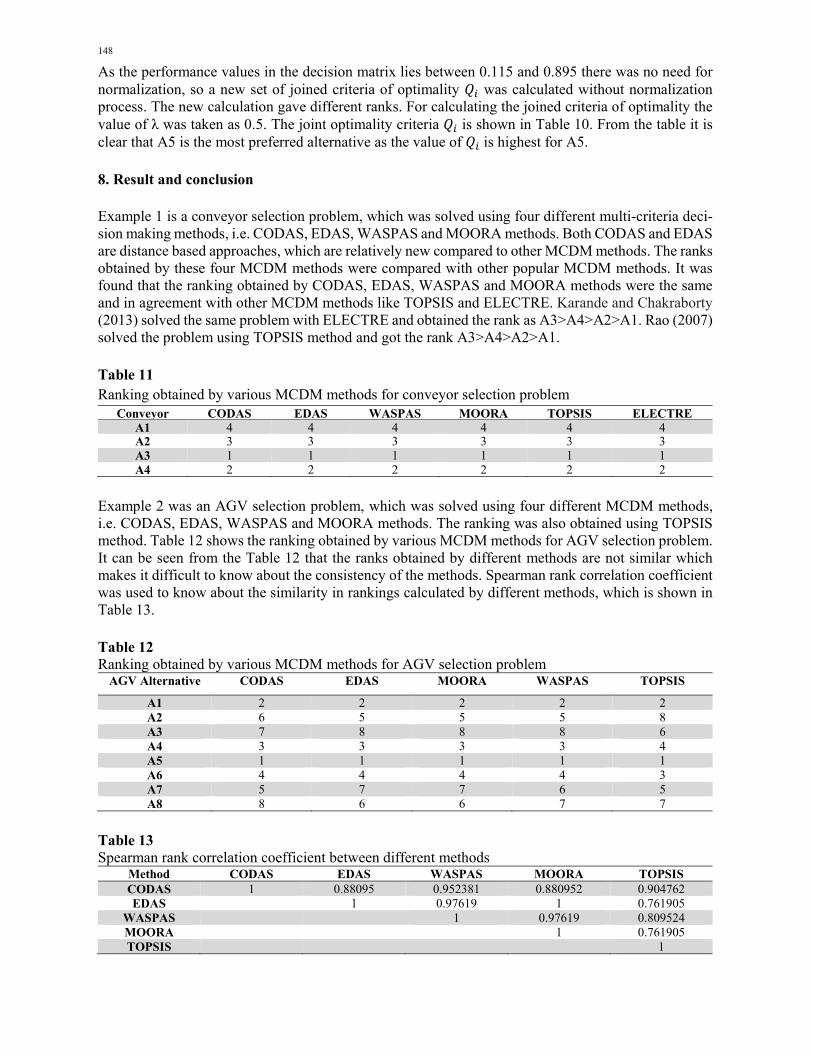
As the performance values in the decision matrix lies between 0.115 and 0.895 there was no need for normalization, so a new set of joined criteria of optimality was calculated without normalization process. The new calculation gave different ranks. For calculating the joined criteria of optimality the value of λ was taken as 0.5. The joint optimality criteria is shown in Table 10. From the table it is clear that A5 is the most preferred alternative as the value of is highest for A5. 8. Result and conclusion Example 1 is a conveyor selection problem, which was solved using four different multi-criteria deci-sion making methods, i.e. CODAS, EDAS, WASPAS and MOORA methods. Both CODAS and EDAS are distance based approaches, which are relatively new compared to other MCDM methods. The ranks obtained by these four MCDM methods were compared with other popular MCDM methods. It was found that the ranking obtained by CODAS, EDAS, WASPAS and MOORA methods were the same and in agreement with other MCDM methods like TOPSIS and ELECTRE. Karande and Chakraborty (2013) solved the same problem with ELECTRE and obtained the rank as A3>A4>A2>A1. Rao (2007) solved the problem using TOPSIS method and got the rank A3>A4>A2>A1. Table 11 Ranking obtained by various MCDM methods for conveyor selection problem
Conveyor CODAS EDAS WASPAS MOORA TOPSIS ELECTREA1 4 4 4 4 4 4A2 3 3 3 3 3 3A3 1 1 1 1 1 1A4 2 2 2 2 2 2
Example 2 was an AGV selection problem, which was solved using four different MCDM methods, i.e. CODAS, EDAS, WASPAS and MOORA methods. The ranking was also obtained using TOPSIS method. Table 12 shows the ranking obtained by various MCDM methods for AGV selection problem. It can be seen from the Table 12 that the ranks obtained by different methods are not similar which makes it difficult to know about the consistency of the methods. Spearman rank correlation coefficient was used to know about the similarity in rankings calculated by different methods, which is shown in Table 13.
Table 12 Ranking obtained by various MCDM methods for AGV selection problem
AGV Alternative CODAS EDAS MOORA WASPAS TOPSIS
A1 2 2 2 2 2 A2 6 5 5 5 8 A3 7 8 8 8 6 A4 3 3 3 3 4 A5 1 1 1 1 1 A6 4 4 4 4 3 A7 5 7 7 6 5 A8 8 6 6 7 7
Table 13 Spearman rank correlation coefficient between different methods
Method CODAS EDAS WASPAS MOORA TOPSIS CODAS 1 0.88095 0.952381 0.880952 0.904762EDAS 1 0.97619 1 0.761905
WASPAS 1 0.97619 0.809524 MOORA 1 0.761905TOPSIS 1
M. Mathew and S. Sahu / Management Science Letters 8 (2018)
149
From Table 13 it is clear that MOORA and EDAS gave exactly the same rank i.e. A5>A1>A4>A6>A2>A8>A7>A3. The values of the correlation coefficients for different methods lie between 0.8-1.0 which show that the ranks are in perfect agreement and have strong correlations with each other. The Spearman correlation coefficient between EDAS and TOPSIS, MOORA and TOPSIS is 0.761905.which is less compared to other correlation coefficient values, but still they maintain a strong correlation between each other. Thus we can say that that new MCDM methods like CODAS, EDAS and WASPAS are effective in solving material handling equipment selection problem.
Acknowledgement
The authors would like to thank the anonymous referees for constructive comments on earlier version of this paper.
References
Bouh, M. A., & Riopel, D. (2015, October). Material handling equipment selection: New classifications of equipments and attributes. In Industrial Engineering and Systems Management (IESM), 2015 In-ternational Conference on (pp. 461-468). IEEE.
Brauers, W. K. (2004). Optimization Methods For (Vol. 342). Kluwer Academic Publishers, Bos-ton/Dordrecht/London.
Chakraborty, S. (2011). Applications of the MOORA method for decision making in manufacturing environment. The International Journal of Advanced Manufacturing Technology, 54(9-12), 1155-1166.
Chakraborty, S., Zavadskas, E. K., & Antucheviciene, J. (2015). Applications of WASPAS method as a multi-criteria decision-making tool. Economic Computation & Economic Cybernetics Studies & Research, 49(1).
Karande, P., & Chakraborty, S. (2013). Material handling equipment selection using weighted utility additive theory. Journal of Industrial Engineering, 2013.
Keshavarz Ghorabaee, M., Zavadskas, E. K., Olfat, L., & Turskis, Z. (2015). Multi-criteria inventory classification using a new method of evaluation based on distance from average solution (EDAS). Informatica, 26(3), 435-451.
Keshavarz Ghorabaee, M., Zavadskas, E. K., Turskis, Z., & Antucheviciene, J. (2016). A new combi-native distance-based assessment (CODAS) method for multi-criteria decision-making. Economic Computation & Economic Cybernetics Studies & Research, 50(3).
Komljenovic, D., & Kecojevic, V. (2009). Multi-attribute selection method for materials handling equipment. International Journal of Industrial and Systems Engineering, 4(2), 151-173.
Kulak, O. (2005). A decision support system for fuzzy multi-attribute selection of material handling equipments. Expert systems with applications, 29(2), 310-319.
Lin, H. Y., Hsu, P. Y., & Sheen, G. J. (2007). A fuzzy-based decision-making procedure for data ware-house system selection. Expert systems with applications, 32(3), 939-953.
Maniya, K. D., & Bhatt, M. G. (2011). A multi-attribute selection of automated guided vehicle using the AHP/M-GRA technique. International Journal of Production Research, 49(20), 6107-6124.
Peters, B. A., Malmborg, C., Petrina, G., Pratt, D., & Taylor, D. (1998). An introduction to material handling equipment selection. College-Industry Council on Material Handling Education (CIC-MHE).
Rao, R. V. (2007). Selection of Material Handling Equipment. Decision Making in the Manufacturing Environment: Using Graph Theory and Fuzzy Multiple Attribute Decision Making Methods, 187-195.
Šaparauskas, J., Kazimieras Zavadskas, E., & Turskis, Z. (2011). Selection of facade's alternatives of commercial and public buildings based on multiple criteria. International Journal of Strategic Prop-erty Management, 15(2), 189-203.

150
© 2018 by the authors; licensee Growing Science, Canada. This is an open access ar-ticle distributed under the terms and conditions of the Creative Commons Attribution (CC-BY) license (http://creativecommons.org/licenses/by/4.0/).