d077p029.pdf - Inter-Research Science Publisher
12
DISEASES OF AQUATIC ORGANISMS Dis Aquat Org Vol. 77: 29–40, 2007 doi: 10.3354/dao01811 Published August 13 INTRODUCTION Infectious hematopoietic necrosis virus (IHNV) is a fish pathogen known to cause severe losses among young farm-reared and wild salmonids in North America and, more recently, in several countries in Europe and Asia (Wolf 1988, Winton 1991, Park et al. 1993, Enzmann et al. 2005, Nishizawa et al. 2006). The virus has been principally associated with epi- demics among hatchery and farmed salmonid fish, including sockeye Oncorhynchus nerka, Chinook O. tshawytscha, chum O. keta, rainbow trout O. mykiss and steelhead (anadromous O. mykiss) and Atlantic salmon Salmo salar (Williams & Amend 1976, Wolf 1988, Bootland & Leong 1999). Since fish losses due to an IHNV outbreak may reach up to 100%, control of the disease is of critical importance to commercial fish farms that produce salmon and trout for the market- place and to state and federal hatcheries in North America that propagate salmon and steelhead for mitigation purposes. The control of IHNV in cultured salmonids has focused mainly on avoiding viral con- © Inter-Research 2007 · www.int-res.com *Corresponding author. Email: [email protected] Genotypes and phylogeographical relationships of infectious hematopoietic necrosis virus in California, USA Garry O. Kelley 1 , Christin M. Bendorf 1 , Susan C. Yun 1 , Gael Kurath 2 , Ronald P. Hedrick 1, * 1 Department of Medicine and Epidemiology, School of Veterinary Medicine, University of California, Davis, California 95616, USA 2 Western Fisheries Research Center, United States Geological Survey, Biological Resources Discipline, 6505 NE 65th St., Seattle, Washington 98115, USA ABSTRACT: Infectious hematopoietic necrosis virus (IHNV) contains 3 major genogroups in North America with discreet geographic ranges designated as upper (U), middle (M), and lower (L). A com- prehensive genotyping of 237 IHNV isolates from hatchery and wild salmonids in California revealed 25 different sequence types (a to y) all in the L genogroup; specifically, the genogroup contained 14 sequence types that were unique to individual isolates as well as 11 sequence types representing 2 or more identical isolates. The most evident trend was the phylogenetic and geographical division of the L genogroup into 2 distinct subgroups designated as LI and LII. Isolates within Subgroup LI were primarily found within waterways linked to southern Oregon and northern California coastal rivers. Isolates in Subgroup LII were concentrated within inland valley watersheds that included the Sacramento River, San Joaquin River, and their tributaries. The temporal and spatial patterns of virus occurrence suggested that infections among adult Chinook salmon in the hatchery or that spawn in the river are a major source of virus potentially infecting other migrating or resident salmonids in California. Serum neutralization results of the California isolates of IHNV corroborated a temporal trend of sequence divergence; specifically, 2 progressive shifts in which more recent virus isolates represent new serotypes. A comparison of the estimates of divergence rates for Subgroup LI (1 × 10 –5 mutations per nucleotide site per year) indicated stasis similar to that observed in the U genogroup, while the Subgroup LII rate (1 × 10 –3 mutations per nucleotide site per year) suggested a more active evolution similar to that of the M genogroup. KEY WORDS: Infectious hematopoietic necrosis virus · IHNV · Rhabdovirus · Chinook salmon Resale or republication not permitted without written consent of the publisher
-
Upload
khangminh22 -
Category
Documents
-
view
0 -
download
0
Transcript of d077p029.pdf - Inter-Research Science Publisher

DISEASES OF AQUATIC ORGANISMSDis Aquat Org
Vol. 77: 29–40, 2007doi: 10.3354/dao01811
Published August 13
INTRODUCTION
Infectious hematopoietic necrosis virus (IHNV) is afish pathogen known to cause severe losses amongyoung farm-reared and wild salmonids in NorthAmerica and, more recently, in several countries inEurope and Asia (Wolf 1988, Winton 1991, Park et al.1993, Enzmann et al. 2005, Nishizawa et al. 2006).The virus has been principally associated with epi-demics among hatchery and farmed salmonid fish,including sockeye Oncorhynchus nerka, Chinook O.
tshawytscha, chum O. keta, rainbow trout O. mykissand steelhead (anadromous O. mykiss) and Atlanticsalmon Salmo salar (Williams & Amend 1976, Wolf1988, Bootland & Leong 1999). Since fish losses due toan IHNV outbreak may reach up to 100%, control ofthe disease is of critical importance to commercial fishfarms that produce salmon and trout for the market-place and to state and federal hatcheries in NorthAmerica that propagate salmon and steelhead formitigation purposes. The control of IHNV in culturedsalmonids has focused mainly on avoiding viral con-
© Inter-Research 2007 · www.int-res.com*Corresponding author. Email: [email protected]
Genotypes and phylogeographical relationships ofinfectious hematopoietic necrosis virus in
California, USA
Garry O. Kelley1, Christin M. Bendorf1, Susan C. Yun1, Gael Kurath2,Ronald P. Hedrick1,*
1Department of Medicine and Epidemiology, School of Veterinary Medicine, University of California, Davis,California 95616, USA
2 Western Fisheries Research Center, United States Geological Survey, Biological Resources Discipline, 6505 NE 65th St.,Seattle, Washington 98115, USA
ABSTRACT: Infectious hematopoietic necrosis virus (IHNV) contains 3 major genogroups in NorthAmerica with discreet geographic ranges designated as upper (U), middle (M), and lower (L). A com-prehensive genotyping of 237 IHNV isolates from hatchery and wild salmonids in California revealed25 different sequence types (a to y) all in the L genogroup; specifically, the genogroup contained 14sequence types that were unique to individual isolates as well as 11 sequence types representing 2 ormore identical isolates. The most evident trend was the phylogenetic and geographical division of theL genogroup into 2 distinct subgroups designated as LI and LII. Isolates within Subgroup LI wereprimarily found within waterways linked to southern Oregon and northern California coastal rivers.Isolates in Subgroup LII were concentrated within inland valley watersheds that included theSacramento River, San Joaquin River, and their tributaries. The temporal and spatial patterns of virusoccurrence suggested that infections among adult Chinook salmon in the hatchery or that spawn inthe river are a major source of virus potentially infecting other migrating or resident salmonids inCalifornia. Serum neutralization results of the California isolates of IHNV corroborated a temporaltrend of sequence divergence; specifically, 2 progressive shifts in which more recent virus isolatesrepresent new serotypes. A comparison of the estimates of divergence rates for Subgroup LI (1 × 10⁻⁵
mutations per nucleotide site per year) indicated stasis similar to that observed in the U genogroup,while the Subgroup LII rate (1 × 10⁻³ mutations per nucleotide site per year) suggested a more activeevolution similar to that of the M genogroup.
KEY WORDS: Infectious hematopoietic necrosis virus · IHNV · Rhabdovirus · Chinook salmon
Resale or republication not permitted without written consent of the publisher

Dis Aquat Org 77: 29–40, 2007
tact by using eggs from pathogen-free fish, iodophordisinfection of eggs, and by using water supplies freeof the virus (Winton 1991). Newer control measuresincluding the use of DNA vaccines offer good protec-tion and have recently been licensed for use inCanada, but they have not been widely applied(Anderson et al. 1996, Kurath 2005, Lorenzen & La-Patra 2005). Management of IHNV infections amongwild salmon populations and salmonids once releasedfrom hatcheries requires different approaches, whichmay be aided by a better understanding of the geneticdiversity and modes of transmission of geographicallydistinct viruses.
Reactivity with monoclonal antibodies, the mobilityof structural proteins in polyacrylamide gels, and theribonuclease fingerprinting and protection assays(RPA) have all been used to demonstrate geneticheterogeneity among IHNV isolates (Hsu et al. 1986,Winton et al. 1988, Ristow & Arnzen de Avila 1991,Oshima et al. 1995, Anderson et al. 2000, Emmeneg-ger et al. 2000). Complete or partial sequencing of theglycoprotein (G) and non-virion (NG) genes furtherconfirmed that distinct genetic groups of IHNVlargely correlate to geographic distribution (Nichol etal. 1995, Emmenegger et al. 2000, Troyer et al. 2000,Emmenegger & Kurath 2002, Kurath et al. 2003). Poly-merase chain reaction (PCR) amplification andsequencing of a 303 nucleotide (nt) amplicon calledthe ‘mid-G’ in the G gene of IHNV has provided datauseful for investigations of genetic diversity, epidemi-ology, and evolution of IHNV in wild and farmedsalmonids (Emmenegger et al. 2000, Troyer et al.2000, Emmenegger & Kurath 2002, Garver et al. 2003,Kurath et al. 2003, Troyer & Kurath 2003). These stud-ies identified 3 major genogroups of IHNV in NorthAmerica, with discreet geographic ranges (Kurath etal. 2003). IHNV isolates from the more northerly dis-tribution of the virus most likely evolved among sock-eye salmon and form a large homogenous groupdesignated as the U genogroup. The geographicalrange of the U genogroup extends from the state ofAlaska, USA through the coastal regions of BritishColumbia, Canada, to the states of Washington andOregon, USA (Emmenegger et al. 2000, Emmenegger& Kurath 2002, Garver et al. 2003, Kurath et al. 2003).Troyer et al. (2000) described a second major groupof IHNV, the M genogroup, principally circulatingamong rainbow trout in commercial farms in the stateof Idaho, but also extending into the Columbia Riverbasin (Garver et al. 2003). In contrast to the Ugenogroup, isolates within the M genogroup werefound to be genetically heterogenous and appeared todiverge temporally into co-circulating subgroups atmultiple sites (Troyer et al. 2000, Kurath et al. 2003,Troyer & Kurath 2003). The third and final genetic
group of IHNV, the L genogroup, is found principallyin Chinook salmon in California and coastal water-sheds of southern Oregon.
In California, the disease caused by the virus, infec-tious hematopoietic necrosis or IHN, was first recog-nized in the Sacramento River drainage in the 1950sand 1960s among juvenile Chinook salmon propa-gated at the Coleman National Fish Hatchery andNimbus Hatchery (Ross et al. 1960, Parisot et al.1965). Early investigations of variation among IHNVisolates indicated that IHNV from California differedfrom more northern virus isolates based on biologicalphenotypes (Amend et al. 1969, Mulcahy et al. 1984).IHN epidemics have continued to occur in culturedsalmonids in California, and since 1990 progressivechanges in serotype have been demonstrated bychanges in reactivity to neutralizing antibodies indiagnostic tests (authors’ unpubl. data). To date,genetic characterization of the L genogroup has beenbased on mid-G sequence data from 38 virus isolatesfrom California and southern Oregon described in theoverview of IHNV genetic diversity in North Americaby Kurath et al. (2003). That report defined 2 phylo-genetic subgroups in the L genogroup, designated LIand LII, but did not consider temporal aspects orvirus epidemiologic implications of the strain diver-sity. Recently, investigations by Bendorf et al. (inpress) using viral isolates collected from a single Cal-ifornia fish hatchery over a 35 yr period suggested atemporal trend in divergence and corroborated thedivision of the L genogroup into the LI and LII sub-groups. In the work described here we expand onprior studies and give a comprehensive regionalstudy of the genetic diversity and epidemiology ofIHNV throughout California and southern Oregon.Our study compares with the regional studies ofIHNV throughout the geographic range such as thosefor the U and M genogroups in Alaska (Emmeneggeret al. 2000), the Columbia River basin (Garver et al.2003), southern Idaho (Troyer & Kurath 2003) andcoastal Washington (Emmenegger & Kurath 2002).
Understanding the genetic heterogeneity, mutationrates, and the epidemiology of IHNV, both temporallyand spatially, is critical to management decisions forfish movements and, in the future, for vaccinationstrategies. In the present study, we analyzed mid-G ntsequences of 237 isolates of IHNV collected in Cali-fornia and southern Oregon from 1966 to 2004 (seeFigs. 1 & 2). This included a large set of isolates (n =82) from the Feather River Hatchery described byBendorf et al. (in press), as well as isolates from 10additional fish hatcheries and other collection sites(Table 1), which collectively represent the most com-prehensive genetic analysis to date of the L genogroupof IHNV.
30

Kelley et al.: Infectious hematopoietic necrosis virus in California
MATERIALS AND METHODS
Virus isolates. Viruses were obtained from eitherindividual fish or pooled samples of tissues from hatch-ery-reared or wild fish collected at state and federalhatcheries or salmon carcasses from areas in closeproximity to hatcheries where anadromous fish con-
gregate to spawn. Adult fish tissues sampled includedanterior kidney and spleen, or ovarian fluid. Sampleswere taken according to procedures described by La-Patra et al. (2001). Virus isolates were routinely exam-ined after 2 to 4 passages in the Chinook salmonembryo (CHSE-214) or epithelioma papulosum cypri-nid (EPC) cell lines (Fijan et al. 1983, Lannan et al.
31
Sequence Isolate Isolation Host(s) Life stage Year(s) Source Accessiontype no. site(s) (n) (n) no.
a 2 ER, FR C (1) na 1969, 1976 Bendorf et al. (in press) AY598415
b 32 CC, ER, FR, C (26), S (3), Adult (26), 1969–1998 Bendorf et al. (in press) AY598416HO, MC, RC, CO (2), NA(1) yearling (4),
RR, TR fry (2)
c 1 MK S Adult 1971 Present study DQ910915
d 1 FR C na 1971 Bendorf et al. (in press) AY598417
e 1 NB C Adult 1974 Bendorf et al. (in press) DQ910908
f 1 TR C Adult 1991 Bendorf et al. (in press) DQ910909
g 1 NB C Adult 1966 Nichol et al. (1995) L40881
h 2 CL, MA S (1), C (1) Adult (2) 1979, 1985 Present study DQ910916
i 1 CL C Adult 1980 Nichol et al. (1995) L40873
j 1 TR C na 1987 Present study DQ910917
k 2 MC, SX C (2) Adult (1), 1986, 1988 Bendorf et al. (in press) DQ910910fingerling (1)
l 1 EE S Adult 1988 Present study DQ910921
m 18 BC, CL, FR, C (13), S (5) Adult (17), 1989–2003 Bendorf et al. (in press) AY598418MC, NB juvenile (1)
n 24 CL, FR, MC, C (22), S (2) Adult (24) 1990–1999 Bendorf et al. (in press) AY598419MK, NB
o 1 CL C Adult 1995 Bendorf et al. (in press) DQ910911
p 1 NB C Adult 1998 Present study DQ910918
q 1 CL C Adult 2001 Present study DQ910922
r 4 BC, CK C (4) Adult (4) 2003 Present study DQ910919
s 3 BC, CK C (3) Adult (3) 2003 Present study DQ910920
t 48 BC, CK, CL, C (37), S (11) Adult (19), 1996–2003 Bendorf et al. (in press) AY598420FR, MK, NB juvenile (1),
fry (1)
u 80 FR, MC, MK, C (70), S (9) Adult (71), 1999–2004 Bendorf et al. (in press) AY598421NB, LO, YL, R (1) yearling (2),
YM, YU fingerling (6)fry (1)
v 1 FR C Fingerling 2001 Bendorf et al. (in press) AY598422
w 1 FR C Fingerling 2002 Bendorf et al. (in press) DQ910912
x 8 FR, YL C (8) Adult (8) 2003 Bendorf et al. (in press) DQ910913
y 1 FR S Adult 2004 Bendorf et al. (in press) DQ910914
Table 1. Infectious hematopoietic necrosis virus (IHNV). Sequence types from California used in the present study. The isolatesare grouped into sequence types designated by the letters ‘a’ through ‘y’. Grouping was based upon the sequence of a 303nucleotide region of the G or glycoprotein gene of the virus. Isolation sites were Trinity River Hatchery (TR), Hoopa Fish RearingFacility (HO), Mad River Hatchery (MA), Rowdy Creek Fish Hatchery (RC), Camp Creek (CC), and Eel River (EE). In addition,virus isolates were obtained from 11 inland sites that included Feather River (FR), Lake Oroville (LO), Nimbus Hatchery (NB),Merced River Hatchery (MC), Mokelumne River Hatchery (MK), Yuba River lower site (YL), Yuba River middle site (YM), YubaRiver upper site (YU), Clear Creek (CK), Battle Creek (BC) and Coleman National Fish Hatchery (CL). Isolates were also obtainedfrom 3 coastal watersheds from southern Oregon that included: Elk River Hatchery (ER), Sixes River (SX), and Rogue River (RR).
Host fish species included Chinook (C), coho (CO), steelhead (S), and rainbow trout (R). na: not available
Dis Aquat Org 77: 29–40, 2007
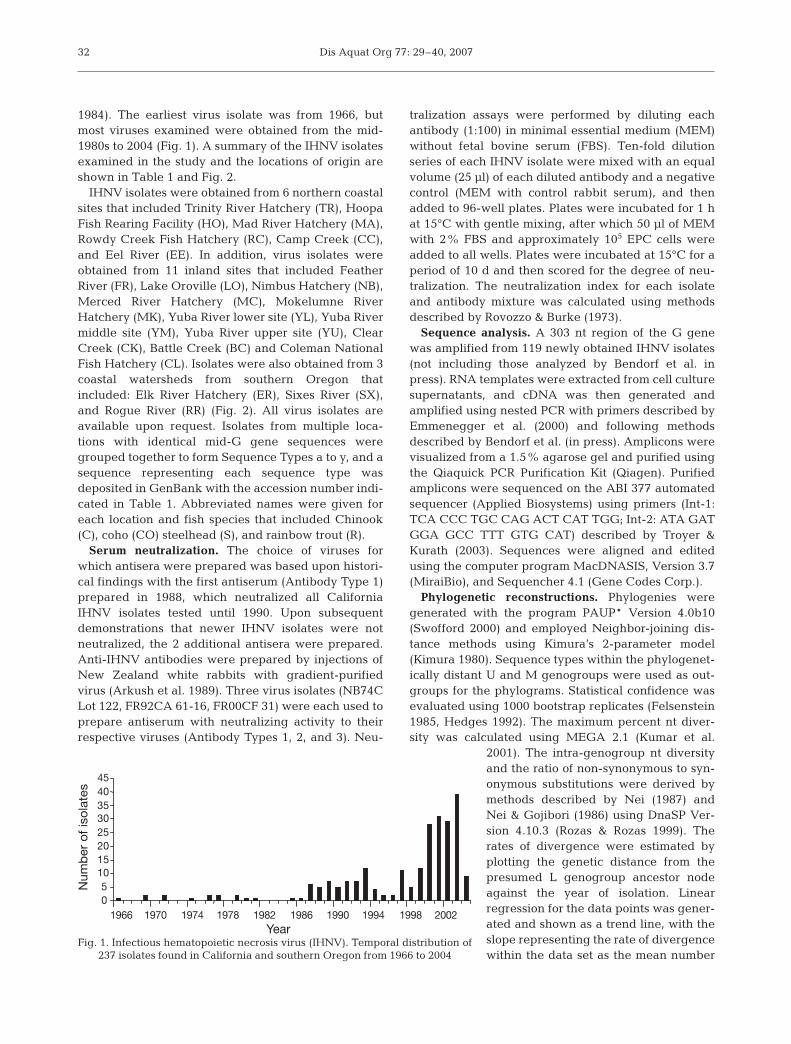
1984). The earliest virus isolate was from 1966, butmost viruses examined were obtained from the mid-1980s to 2004 (Fig. 1). A summary of the IHNV isolatesexamined in the study and the locations of origin areshown in Table 1 and Fig. 2.
IHNV isolates were obtained from 6 northern coastalsites that included Trinity River Hatchery (TR), HoopaFish Rearing Facility (HO), Mad River Hatchery (MA),Rowdy Creek Fish Hatchery (RC), Camp Creek (CC),and Eel River (EE). In addition, virus isolates wereobtained from 11 inland sites that included FeatherRiver (FR), Lake Oroville (LO), Nimbus Hatchery (NB),Merced River Hatchery (MC), Mokelumne RiverHatchery (MK), Yuba River lower site (YL), Yuba Rivermiddle site (YM), Yuba River upper site (YU), ClearCreek (CK), Battle Creek (BC) and Coleman NationalFish Hatchery (CL). Isolates were also obtained from 3coastal watersheds from southern Oregon thatincluded: Elk River Hatchery (ER), Sixes River (SX),and Rogue River (RR) (Fig. 2). All virus isolates areavailable upon request. Isolates from multiple loca-tions with identical mid-G gene sequences weregrouped together to form Sequence Types a to y, and asequence representing each sequence type wasdeposited in GenBank with the accession number indi-cated in Table 1. Abbreviated names were given foreach location and fish species that included Chinook(C), coho (CO) steelhead (S), and rainbow trout (R).
Serum neutralization. The choice of viruses forwhich antisera were prepared was based upon histori-cal findings with the first antiserum (Antibody Type 1)prepared in 1988, which neutralized all CaliforniaIHNV isolates tested until 1990. Upon subsequentdemonstrations that newer IHNV isolates were notneutralized, the 2 additional antisera were prepared.Anti-IHNV antibodies were prepared by injections ofNew Zealand white rabbits with gradient-purifiedvirus (Arkush et al. 1989). Three virus isolates (NB74CLot 122, FR92CA 61-16, FR00CF 31) were each used toprepare antiserum with neutralizing activity to theirrespective viruses (Antibody Types 1, 2, and 3). Neu-
tralization assays were performed by diluting eachantibody (1:100) in minimal essential medium (MEM)without fetal bovine serum (FBS). Ten-fold dilutionseries of each IHNV isolate were mixed with an equalvolume (25 µl) of each diluted antibody and a negativecontrol (MEM with control rabbit serum), and thenadded to 96-well plates. Plates were incubated for 1 hat 15°C with gentle mixing, after which 50 µl of MEMwith 2% FBS and approximately 105 EPC cells wereadded to all wells. Plates were incubated at 15°C for aperiod of 10 d and then scored for the degree of neu-tralization. The neutralization index for each isolateand antibody mixture was calculated using methodsdescribed by Rovozzo & Burke (1973).
Sequence analysis. A 303 nt region of the G genewas amplified from 119 newly obtained IHNV isolates(not including those analyzed by Bendorf et al. inpress). RNA templates were extracted from cell culturesupernatants, and cDNA was then generated andamplified using nested PCR with primers described byEmmenegger et al. (2000) and following methodsdescribed by Bendorf et al. (in press). Amplicons werevisualized from a 1.5% agarose gel and purified usingthe Qiaquick PCR Purification Kit (Qiagen). Purifiedamplicons were sequenced on the ABI 377 automatedsequencer (Applied Biosystems) using primers (Int-1:TCA CCC TGC CAG ACT CAT TGG; Int-2: ATA GATGGA GCC TTT GTG CAT) described by Troyer &Kurath (2003). Sequences were aligned and editedusing the computer program MacDNASIS, Version 3.7(MiraiBio), and Sequencher 4.1 (Gene Codes Corp.).
Phylogenetic reconstructions. Phylogenies weregenerated with the program PAUP* Version 4.0b10(Swofford 2000) and employed Neighbor-joining dis-tance methods using Kimura’s 2-parameter model(Kimura 1980). Sequence types within the phylogenet-ically distant U and M genogroups were used as out-groups for the phylograms. Statistical confidence wasevaluated using 1000 bootstrap replicates (Felsenstein1985, Hedges 1992). The maximum percent nt diver-sity was calculated using MEGA 2.1 (Kumar et al.
2001). The intra-genogroup nt diversityand the ratio of non-synonymous to syn-onymous substitutions were derived bymethods described by Nei (1987) andNei & Gojibori (1986) using DnaSP Ver-sion 4.10.3 (Rozas & Rozas 1999). Therates of divergence were estimated byplotting the genetic distance from thepresumed L genogroup ancestor nodeagainst the year of isolation. Linearregression for the data points was gener-ated and shown as a trend line, with theslope representing the rate of divergencewithin the data set as the mean number
32
05
1015202530354045
1966 1970 1974 1978 1982 1986 1990 1994 1998 2002
Num
ber
of
iso
late
s
YearFig. 1. Infectious hematopoietic necrosis virus (IHNV). Temporal distribution of
237 isolates found in California and southern Oregon from 1966 to 2004

Kelley et al.: Infectious hematopoietic necrosis virus in California
of mutations per nt site per year. The significance (p <0.05) of the trend line slope and the correlation coeffi-cient (r2) value (values at or near 1 represent a reliabletrend line) were calculated using SPSS 10.0 (SPSS).
RESULTS
Phylogenetic analyses
The 119 IHNV isolates newly characterized in thepresent study were sequenced and analyzed in con-
junction with sequences from 82 previously identifiedisolates from the Feather River Hatchery and LakeOroville (Bendorf et al. in press) and 36 isolates from 8locations in southern Oregon and northern Californiadescribed by Kurath et al. (2003). Sequence analysisshowed a total of 25 different mid-G sequence types(a to y) that included 14 unique types (found in onlya single virus isolate) and 11 sequence types thatcontained 2 or more identical isolates. Phylogenieswere created by using representative IHNV isolatesfrom the U and M genogroups and by retainingbranch nodes with bootstrap group frequencies of >70
33
Fig. 2. Infectious hematopoietic necrosis virus (IHNV). Geographic distribution of fish hatcheries, rivers, and sample locations ofthe origins of the viruses used in this study. Dashed and dotted lines represent the range for the L genogroup Subgroups LI and
LII, respectively. Triangles: sampling sites; rectangles: dams

Dis Aquat Org 77: 29–40, 2007
(Fig. 3). In this standard analysis, all 25 Californiasequence types fell clearly within the L genogroup,which was divided into 2 distinct subgroups known asLI and LII. Sequence types inside LI and LII were pre-sent as single branches linked directly to the ancestralnode for each subgroup with bootstrap support at 83and 82%, respectively. Subgroup LI contained a to-tal of 6 virus sequence types, including 4 uniquesequence types and 2 larger sequence groups identi-fied as Types a and b. Subgroup LII contained 19virus sequence types that fell into 10 unique sequencetypes and 9 major sequence groups identified asTypes g to y.
Spatial and temporal distribution of IHNV isolates
The most revealing spatial trend was the clear sepa-ration of isolates from southern Oregon and northernCalifornia coastal watersheds from those found in theCalifornia Central Valley inland watersheds into Sub-groups LI and LII, respectively (Fig. 2). Subgroup LIcontained a total of 38 isolates that includes 29 and 9isolates from coastal and inland watersheds, respec-tively. A total of 24 of 38 (63%) Subgroup LI isolateswere from the Trinity River Hatchery. Subgroup LIIcontained a total of 199 isolates (84% of the isolatesfound in the present study), with only 4 isolates from
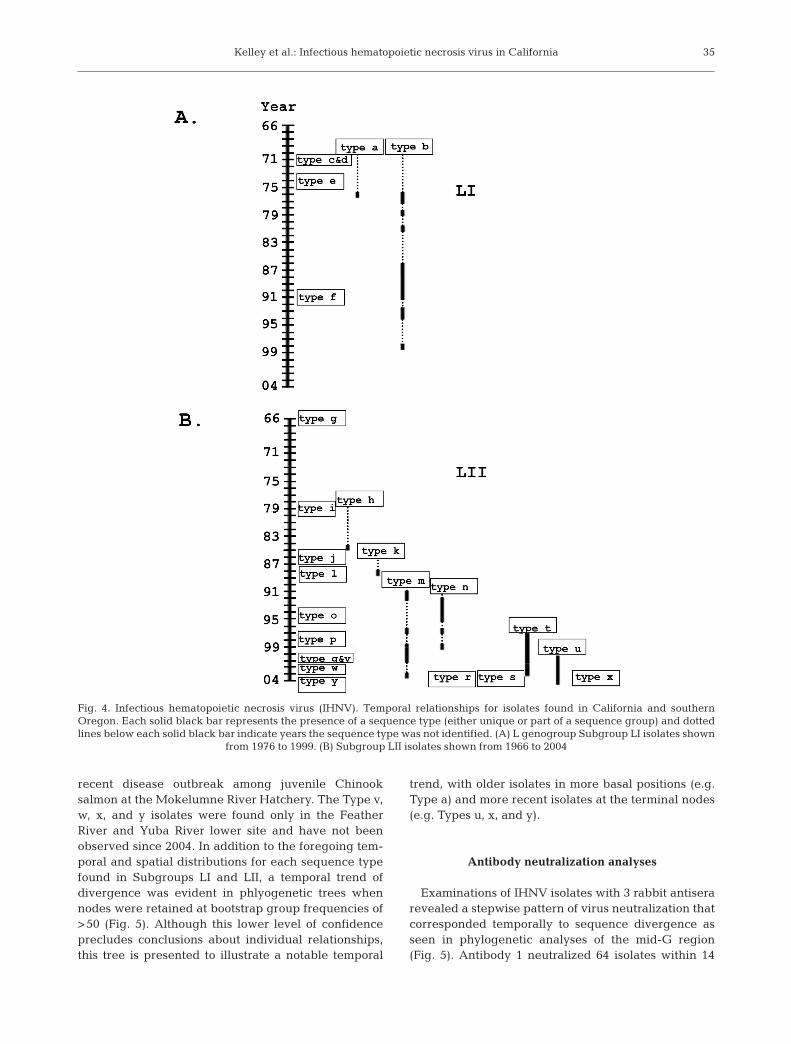
coastal watersheds and 195 isolates frominland watersheds. From 1988 to the pre-sent there have been no exceptions tothe geographic separation of SubgroupLI isolates in northern coastal water-sheds and Subgroup LII isolates in thecentral valley inland drainages. Sub-group LI isolates found inland before1988 included Sequence Type a (1 of 2isolates), Type b (5 of 32 isolates), andSequence Types c to e (Fig. 4A). Sub-group LII isolates found in northern coastwatersheds up to 1988 included Se-quence Type h (1 of 2 isolates), SequenceTypes j and l, and Type k (1 of 2 isolates)(Fig. 4B). Viral isolates within Types hand k were also found inland in 1985 and1988, respectively (Fig. 4B). Among theSubgroup LII (inland) isolates, SequenceType m occurred from 1989 to 2003 (Fig.4B), with the most recent isolate takenfrom wild Chinook salmon spawning inBattle Creek. Type n was regularlyencountered in the early to mid-1990s atthe Coleman National Fish Hatchery, buthas not occurred since 1999. The mostrecent Type r isolates were from BattleCreek and Clear Creek. Also in 2003,Sequence Types s and t were foundintermingling within Battle Creek andClear Creek. Type t was additionallyisolated at the Nimbus, Mokelumne,Feather, and Coleman National Fishhatcheries, and consistently found from1996 to 2003. The largest number of iso-lates (n = 80) was characterized asSequence Type u, which is prevalent inthe Feather River drainage as well as inthe Yuba River (Table 1; Bendorf et al.in press). IHNV isolates obtained since1999 have predominantly been fromSequence Type u (Fig. 4B), including a
34
Fig. 3. Infectious hematopoietic necrosis virus (IHNV). Phylogenetic tree ofmid-G gene sequences (303 nt) of virus isolates representing relationshipsamong L, M, and U genogroups with branches retained at bootstrap group fre-quencies >70. The names for Genogroup L sequence types are shown at termi-nal nodes (a to y); n#: number of virus isolates (if >1), with the year(s) or rangeof years of isolation indicated in parentheses. The names of sequence typesrepresenting U and M genogroups, as previously described by Nichol et al.(1995), Troyer et al. (2000), and Kurath et al. (2003), were retained. Branchlengths correspond to genetic distance, and the U and M genogroups wereused as outgroups. Sequence types containing an isolate found during an IHN
disease outbreak are noted with an asterisk
Kelley et al.: Infectious hematopoietic necrosis virus in California
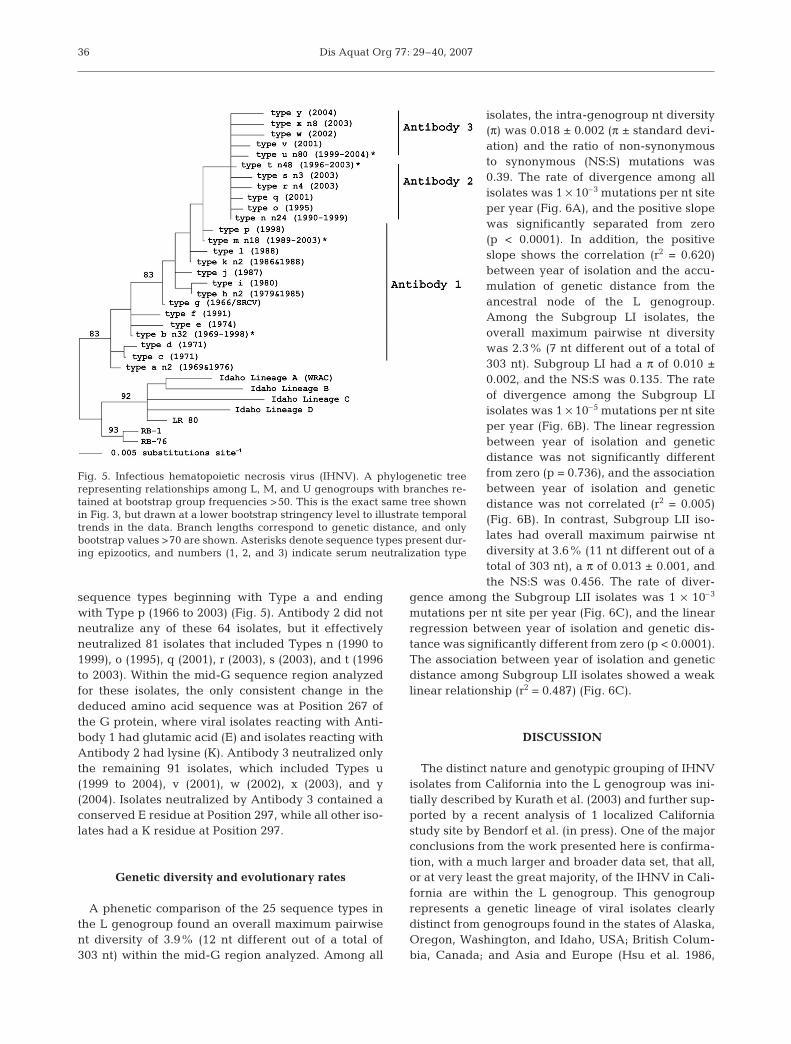
recent disease outbreak among juvenile Chinooksalmon at the Mokelumne River Hatchery. The Type v,w, x, and y isolates were found only in the FeatherRiver and Yuba River lower site and have not beenobserved since 2004. In addition to the foregoing tem-poral and spatial distributions for each sequence typefound in Subgroups LI and LII, a temporal trend ofdivergence was evident in phlyogenetic trees whennodes were retained at bootstrap group frequencies of>50 (Fig. 5). Although this lower level of confidenceprecludes conclusions about individual relationships,this tree is presented to illustrate a notable temporal
trend, with older isolates in more basal positions (e.g.Type a) and more recent isolates at the terminal nodes(e.g. Types u, x, and y).
Antibody neutralization analyses
Examinations of IHNV isolates with 3 rabbit antiserarevealed a stepwise pattern of virus neutralization thatcorresponded temporally to sequence divergence asseen in phylogenetic analyses of the mid-G region(Fig. 5). Antibody 1 neutralized 64 isolates within 14
35
Fig. 4. Infectious hematopoietic necrosis virus (IHNV). Temporal relationships for isolates found in California and southernOregon. Each solid black bar represents the presence of a sequence type (either unique or part of a sequence group) and dottedlines below each solid black bar indicate years the sequence type was not identified. (A) L genogroup Subgroup LI isolates shown
from 1976 to 1999. (B) Subgroup LII isolates shown from 1966 to 2004
Dis Aquat Org 77: 29–40, 2007
sequence types beginning with Type a and endingwith Type p (1966 to 2003) (Fig. 5). Antibody 2 did notneutralize any of these 64 isolates, but it effectivelyneutralized 81 isolates that included Types n (1990 to1999), o (1995), q (2001), r (2003), s (2003), and t (1996to 2003). Within the mid-G sequence region analyzedfor these isolates, the only consistent change in thededuced amino acid sequence was at Position 267 ofthe G protein, where viral isolates reacting with Anti-body 1 had glutamic acid (E) and isolates reacting withAntibody 2 had lysine (K). Antibody 3 neutralized onlythe remaining 91 isolates, which included Types u(1999 to 2004), v (2001), w (2002), x (2003), and y(2004). Isolates neutralized by Antibody 3 contained aconserved E residue at Position 297, while all other iso-lates had a K residue at Position 297.
Genetic diversity and evolutionary rates
A phenetic comparison of the 25 sequence types inthe L genogroup found an overall maximum pairwisent diversity of 3.9% (12 nt different out of a total of303 nt) within the mid-G region analyzed. Among all
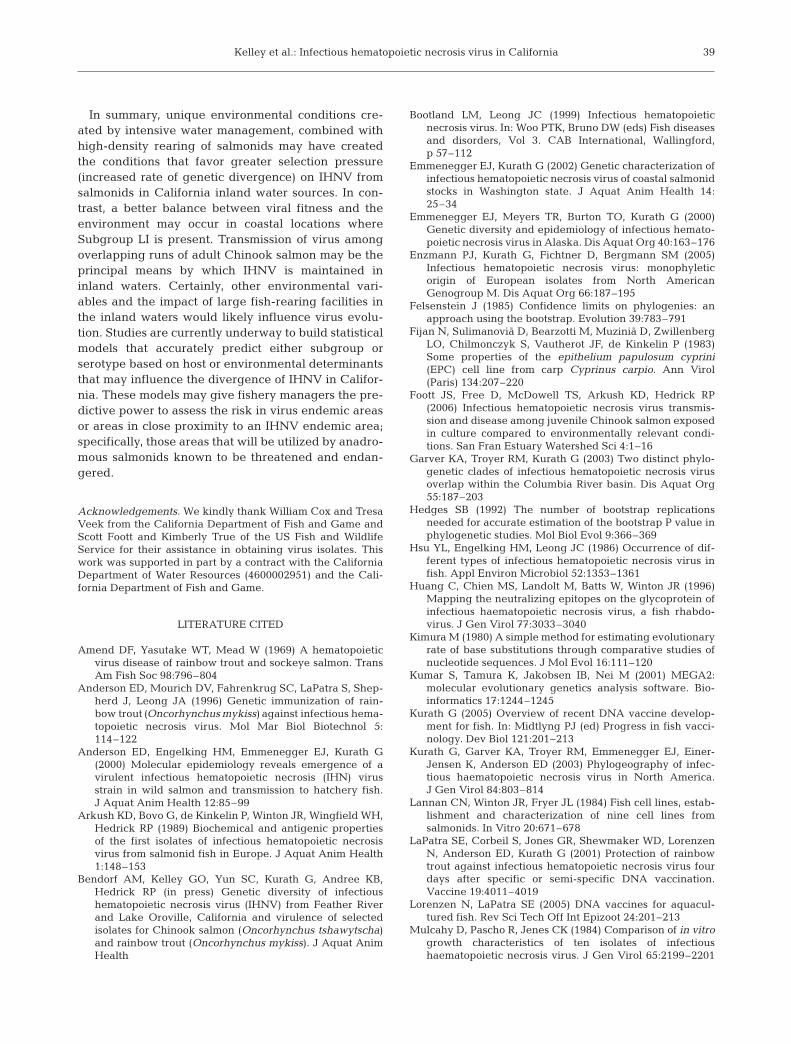
isolates, the intra-genogroup nt diversity(π) was 0.018 ± 0.002 (π ± standard devi-ation) and the ratio of non-synonymousto synonymous (NS:S) mutations was0.39. The rate of divergence among allisolates was 1 × 10⁻³ mutations per nt siteper year (Fig. 6A), and the positive slopewas significantly separated from zero(p < 0.0001). In addition, the positiveslope shows the correlation (r2 = 0.620)between year of isolation and the accu-mulation of genetic distance from theancestral node of the L genogroup.Among the Subgroup LI isolates, theoverall maximum pairwise nt diversitywas 2.3% (7 nt different out of a total of303 nt). Subgroup LI had a π of 0.010 ±0.002, and the NS:S was 0.135. The rateof divergence among the Subgroup LIisolates was 1 × 10⁻⁵ mutations per nt siteper year (Fig. 6B). The linear regressionbetween year of isolation and geneticdistance was not significantly differentfrom zero (p = 0.736), and the associationbetween year of isolation and geneticdistance was not correlated (r2 = 0.005)(Fig. 6B). In contrast, Subgroup LII iso-lates had overall maximum pairwise ntdiversity at 3.6% (11 nt different out of atotal of 303 nt), a π of 0.013 ± 0.001, andthe NS:S was 0.456. The rate of diver-
gence among the Subgroup LII isolates was 1 × 10⁻³
mutations per nt site per year (Fig. 6C), and the linearregression between year of isolation and genetic dis-tance was significantly different from zero (p < 0.0001).The association between year of isolation and geneticdistance among Subgroup LII isolates showed a weaklinear relationship (r2 = 0.487) (Fig. 6C).
DISCUSSION
The distinct nature and genotypic grouping of IHNVisolates from California into the L genogroup was ini-tially described by Kurath et al. (2003) and further sup-ported by a recent analysis of 1 localized Californiastudy site by Bendorf et al. (in press). One of the majorconclusions from the work presented here is confirma-tion, with a much larger and broader data set, that all,or at very least the great majority, of the IHNV in Cali-fornia are within the L genogroup. This genogrouprepresents a genetic lineage of viral isolates clearlydistinct from genogroups found in the states of Alaska,Oregon, Washington, and Idaho, USA; British Colum-bia, Canada; and Asia and Europe (Hsu et al. 1986,
36
Fig. 5. Infectious hematopoietic necrosis virus (IHNV). A phylogenetic treerepresenting relationships among L, M, and U genogroups with branches re-tained at bootstrap group frequencies >50. This is the exact same tree shownin Fig. 3, but drawn at a lower bootstrap stringency level to illustrate temporaltrends in the data. Branch lengths correspond to genetic distance, and onlybootstrap values >70 are shown. Asterisks denote sequence types present dur-ing epizootics, and numbers (1, 2, and 3) indicate serum neutralization type

Kelley et al.: Infectious hematopoietic necrosis virus in California
Winton 1991, Park et al. 1993, Kurath et al. 2003, Enz-mann et al. 2005, Nishizawa et al. 2006). Prior studieshave addressed genetic and geographical differencesamong a limited number of isolates from California(Hsu et al. 1986, Nichol et al. 1995, Oshima 1995,Kurath et al. 2003), but the current study is the firstcomprehensive phylogenetic and serotypic characteri-zation from 20 collection sites, including 9 majorsalmon and steelhead fish rearing facilities within Cal-ifornia (Table 1). The 237 IHNV isolates were separa-ble into 25 different sequence types (a to y) of which 14contained only a single isolate and 11 contained 2 ormore identical isolates. Although isolates from steel-head, coho salmon, and rainbow trout represent asmall percentage of the sample set that was dominatedby isolates from Chinook salmon (84%), there was no
demonstration of strict host specificity forany of the IHNV sequence types observedin the present study.
Our phylogenetic trees (Figs. 3 & 5) sup-ported the clustering of the L genogroupseparate from the U and M genogroup iso-lates as previously described (Nichol et al.1995, Kurath et al. 2003, Bendorf et al.in press). All analyses also supported thedivision of the L genogroup into 2 majorsubgroups, LI and LII (Fig. 3). In our largerdata set the bootstrap support for this sep-aration of Subgroups LI and LII was 83 and82%, respectively (Fig. 3). Presence of amonophyletic ancestral node for all Lgenogroup sequence types suggested evo-lution of the L genogroup from a singlesource rather than multiple introductions.Single source origin was also presumed forM genogroup isolates found in the com-mercial rainbow trout industry centered inthe Hagerman Valley, Idaho, due to amonophyletic structure in phylogeneticanalyses (Troyer et al. 2000, Garver et al.2003). In our study, the phylogenetic treewith nodes retained at bootstrap values>70 (Fig. 3) did not reveal temporal trendsin IHNV evolution. In contrast, the step-wise evolution of more recent isolates nearthe crown of the tree evolving from olderisolates near the base of the tree was sug-gested by a less stringent tree, with nodesretained at bootstrap values >50. This pos-sible temporal trend was further supportedby the results of serum neutralization stud-ies; specifically, serotypes within the Lgenogroup followed a stepwise pattern ofevolution, with older isolates neutralizedby Antibody 1, intermediate isolates from
1990 to 2004 neutralized by Antibody 2, and more con-temporary isolates neutralized by Antibody 3 (Fig. 5).Although phylogenetic relationships with bootstrapvalues between 50 and 70 are too low to be consideredconclusive, the step-wise tree topology and neutraliza-tion results suggest a hypothesis that the L genogrouphas diverged directionally from an ancestor of Sub-group LI, but then evolved within Subgroup LII inresponse to residence in inland waters, including theSacramento River and San Joaquin River drainages.
Although the exact mode of IHNV introduction intoCalifornia remains unknown, previous studies (Kurathet al. 2003) have suggested that a host jump phenome-non occurred from a U genogroup ancestor by way ofunpasteurized sockeye salmon viscera used as feed orpossibly from infected eggs or transplantation of
37
y = 5E-04x–0.994R2 = 0.487
y = 1E-05x–0.023R2 = 0.005
y = 1E-03x–1.874R2 = 0.620
Year
Mut
atio
ns p
er n
ucle
otid
e si
te
1966
1969 1972 1975 1978 1981 1984 1987 1990 1993 1996 1999
0.000
0.000
0.000
0.0050.010
0.015
0.0200.0250.030
0.035
0.040
0.002
0.004
0.006
0.008
0.010
0.012
0.0050.0100.015
0.0200.0250.0300.035
0.040
1969 1972 1975 1978 1981 1984 1987 1990 1993 1996 1999 2002 2005
1966 1969 1972 1975 1978 1981 1984 1987 1990 1993 1996 1999 2002 2005
C Subgroup LII
B Subgroup LI
A All isolates
Fig. 6. Infectious hematopoietic necrosis virus (IHNV). (A) Rate of divergencefor all IHNV isolates used in this study. Rate of divergence among: (B) Sub-group LI and (C) Subgroup LII isolates. Each sequence type was plottedagainst the genetic distance (number of substitutions per nt site peryear) from the presumed ancestral isolate of the L genogroup. Note thatthe y-axis for (B) differs from those of (A) and (C). s: Subgroup L1;
d: Subgroup LII

Dis Aquat Org 77: 29–40, 2007
infected fish. If indeed a host jump from sockeye (Ugenogroup) to Chinook (L genogroup) occurred, thenat least a 5-fold increase in the rate of viral evolutionhas taken place since the appearance of the firstknown L genogroup isolate in California. This is indi-cated by the overall rate of divergence found in the Lgenogroup (1 × 10⁻³ nt substitutions per site per year)(Fig. 6A), which is unlike the static pattern observedwith the U genogroup (2 × 10⁻⁴ nt substitutions per siteper year). However, within the L genogroup the 2 sub-groups differed dramatically, with the Subgroup LI (1 ×10⁻⁵ nt substitutions per site per year) in apparent sta-sis similar to the U genogroup, and the Subgroup LII(1 × 10⁻³ nt substitutions per site per year) in relativelyrapid evolution similar to the M genogroup (1.2 × 10⁻³)as described by Kurath et al. (2003). Kurath et al. (2003)have suggested that genetic stasis in the U genogroupmay be the result of a long-term host–pathogen associ-ation in which viral fitness has reached a high level inequilibrium with the host, while M genogroup virusesare evolving more rapidly due to relatively recentadaptation to a new host, rainbow trout. By this logic,the apparent stasis in LI may indicate a long-term sta-ble host–pathogen association that persists in morenorthern coastal rivers, and may be an indication thatLII is evolving more rapidly in the inland watersheds.Within the Subgroup LII, geographic range evalua-tions of the rate of divergence among viral isolatesfrom individual watersheds demonstrated that local-ized differences exist (Bendorf et al. in press). In thecase of the Feather River (9.1 × 10⁻⁴), as much as a 3-fold increase in divergence rate was observed com-pared to that observed from other inland watershedssuch as Battle Creek (3 × 10⁻⁴) and the American River(4 × 10⁻⁴) (data not shown). The total intra-genogroupnt diversity observed among all viral isolates from theL genogroup in our study (π = 0.018, mean 5.4 nt differ-ences out of 303 nt) is higher than that previouslyreported by Kurath et al. (2003) (π = 0.012, mean 3.5 ntdifferences out of 303 nt), most likely due to the greaternumber of isolates characterized in the present study.Surprisingly, our total diversity is nearly identical tothat found by Bendorf et al. (in press) for IHNV from asingle hatchery in California over 35 yr (π = 0.017,mean of 5.3 nt differences out of 303 nt), indicating thatthis localized study site is nearly as diverse as theentire L genogroup range. We did not observe hetero-geneity (data not shown) at nt Sites 786, 844, and 907,as shown by Garver et al. (2003), or variable aminoacid residues at Positions 272 to 276, as described byHuang et al. (1996). The presence of non-synonymousmutations located at Positions 267 and 297 was consis-tent with the changes in neutralization type and mayindicate specific mutations that are a result of immuneselection pressure among the Subgroup LII sequence
types. However, mutations elsewhere in the G proteinmay also be involved. Ratios of non-synonymous tosynonymous mutations were 0.135 and 0.456 for Sub-group I and II, respectively, and suggest no overallpositive selection pressure among isolates found inCalifornia. Although individual nt sites could still beunder selection, these findings support the lack of anoverall positive selection pressure, as described previ-ously among the U, M, and L genogroups by Kurath etal. (2003).
The inland Sacramento and San Joaquin Riverdrainages contain wild and hatchery-reared Chinooksalmon that historically include 4 genetically distinctfall, late-fall, winter, and spring runs (Yoshiyama et al.1998), and steelhead. Major rearing efforts havefocused on supplementing Chinook salmon and steel-head runs considered as threatened or endangered.The presence of several large and intensive salmonidproduction facilities and their contribution to the trans-mission of IHNV between hatchery and wild fish, andthe extent of spawning runs overlapping temporallyare poorly understood, and were not a focal point ofthis study. However, our hypothesis is that moderatedwater flows due to intensive water management, andthe resulting altered water temperatures, may con-tribute to the overlap among seasonal spawning runs(Yoshiyama et al. 2000), thereby perpetuating thedivergence of the L genogroup by providing year-round availability of susceptible hosts. The perpetualaccess to infections among adult Chinook salmon inthe hatchery or that spawn in the river could representthe major virus source in the system for susceptibleadult immigrants and smolt out-migrants. However,laboratory studies (authors’ unpubl. data) have shownthat IHNV was not easily transmitted from infectedChinook salmon to cohabitant rainbow trout, whichsuggests that fish harboring IHNV as outmigrant juve-niles may not represent a major source of virus thatwould infect other salmonids they might encounter inthe river. Similar conclusions were reached in studiesby Foott et al. (2006), who found it difficult to demon-strate fish to fish transmission of the disease betweencohorts of juvenile Chinook salmon under experimen-tal conditions. Factors such as virus amplification, oc-curring with the seasonal increase in susceptible fishbiomass, might perpetuate divergence by allowing aspecific isolate to dominate in a specific system for thatyear (e.g. Type r in 2000 and 2002, Type u from 2000 to2003), and the fragmentation of host populations intoindividual production ponds may serve to expose apopulation of reservoir hosts potentially with no orinsufficient immunity. Other environmental factors orstressors encountered by out-migrant Chinook salmonmay be sufficient to cause young salmon to undergovirus-induced mortality, but this is difficult to assess.
38
Kelley et al.: Infectious hematopoietic necrosis virus in California
In summary, unique environmental conditions cre-ated by intensive water management, combined withhigh-density rearing of salmonids may have createdthe conditions that favor greater selection pressure(increased rate of genetic divergence) on IHNV fromsalmonids in California inland water sources. In con-trast, a better balance between viral fitness and theenvironment may occur in coastal locations whereSubgroup LI is present. Transmission of virus amongoverlapping runs of adult Chinook salmon may be theprincipal means by which IHNV is maintained ininland waters. Certainly, other environmental vari-ables and the impact of large fish-rearing facilities inthe inland waters would likely influence virus evolu-tion. Studies are currently underway to build statisticalmodels that accurately predict either subgroup orserotype based on host or environmental determinantsthat may influence the divergence of IHNV in Califor-nia. These models may give fishery managers the pre-dictive power to assess the risk in virus endemic areasor areas in close proximity to an IHNV endemic area;specifically, those areas that will be utilized by anadro-mous salmonids known to be threatened and endan-gered.
Acknowledgements. We kindly thank William Cox and TresaVeek from the California Department of Fish and Game andScott Foott and Kimberly True of the US Fish and WildlifeService for their assistance in obtaining virus isolates. Thiswork was supported in part by a contract with the CaliforniaDepartment of Water Resources (4600002951) and the Cali-fornia Department of Fish and Game.
LITERATURE CITED
Amend DF, Yasutake WT, Mead W (1969) A hematopoieticvirus disease of rainbow trout and sockeye salmon. TransAm Fish Soc 98:796–804
Anderson ED, Mourich DV, Fahrenkrug SC, LaPatra S, Shep-herd J, Leong JA (1996) Genetic immunization of rain-bow trout (Oncorhynchus mykiss) against infectious hema-topoietic necrosis virus. Mol Mar Biol Biotechnol 5:114–122
Anderson ED, Engelking HM, Emmenegger EJ, Kurath G(2000) Molecular epidemiology reveals emergence of avirulent infectious hematopoietic necrosis (IHN) virusstrain in wild salmon and transmission to hatchery fish.J Aquat Anim Health 12:85–99
Arkush KD, Bovo G, de Kinkelin P, Winton JR, Wingfield WH,Hedrick RP (1989) Biochemical and antigenic propertiesof the first isolates of infectious hematopoietic necrosisvirus from salmonid fish in Europe. J Aquat Anim Health1:148–153
Bendorf AM, Kelley GO, Yun SC, Kurath G, Andree KB,Hedrick RP (in press) Genetic diversity of infectioushematopoietic necrosis virus (IHNV) from Feather Riverand Lake Oroville, California and virulence of selectedisolates for Chinook salmon (Oncorhynchus tshawytscha)and rainbow trout (Oncorhynchus mykiss). J Aquat AnimHealth
Bootland LM, Leong JC (1999) Infectious hematopoieticnecrosis virus. In: Woo PTK, Bruno DW (eds) Fish diseasesand disorders, Vol 3. CAB International, Wallingford,p 57–112
Emmenegger EJ, Kurath G (2002) Genetic characterization ofinfectious hematopoietic necrosis virus of coastal salmonidstocks in Washington state. J Aquat Anim Health 14:25–34
Emmenegger EJ, Meyers TR, Burton TO, Kurath G (2000)Genetic diversity and epidemiology of infectious hemato-poietic necrosis virus in Alaska. Dis Aquat Org 40:163–176
Enzmann PJ, Kurath G, Fichtner D, Bergmann SM (2005)Infectious hematopoietic necrosis virus: monophyleticorigin of European isolates from North AmericanGenogroup M. Dis Aquat Org 66:187–195
Felsenstein J (1985) Confidence limits on phylogenies: anapproach using the bootstrap. Evolution 39:783–791
Fijan N, Sulimanoviã D, Bearzotti M, Muziniã D, ZwillenbergLO, Chilmonczyk S, Vautherot JF, de Kinkelin P (1983)Some properties of the epithelium papulosum cyprini(EPC) cell line from carp Cyprinus carpio. Ann Virol(Paris) 134:207–220
Foott JS, Free D, McDowell TS, Arkush KD, Hedrick RP(2006) Infectious hematopoietic necrosis virus transmis-sion and disease among juvenile Chinook salmon exposedin culture compared to environmentally relevant condi-tions. San Fran Estuary Watershed Sci 4:1–16
Garver KA, Troyer RM, Kurath G (2003) Two distinct phylo-genetic clades of infectious hematopoietic necrosis virusoverlap within the Columbia River basin. Dis Aquat Org55:187–203
Hedges SB (1992) The number of bootstrap replicationsneeded for accurate estimation of the bootstrap P value inphylogenetic studies. Mol Biol Evol 9:366–369
Hsu YL, Engelking HM, Leong JC (1986) Occurrence of dif-ferent types of infectious hematopoietic necrosis virus infish. Appl Environ Microbiol 52:1353–1361
Huang C, Chien MS, Landolt M, Batts W, Winton JR (1996)Mapping the neutralizing epitopes on the glycoprotein ofinfectious haematopoietic necrosis virus, a fish rhabdo-virus. J Gen Virol 77:3033–3040
Kimura M (1980) A simple method for estimating evolutionaryrate of base substitutions through comparative studies ofnucleotide sequences. J Mol Evol 16:111–120
Kumar S, Tamura K, Jakobsen IB, Nei M (2001) MEGA2:molecular evolutionary genetics analysis software. Bio-informatics 17:1244–1245
Kurath G (2005) Overview of recent DNA vaccine develop-ment for fish. In: Midtlyng PJ (ed) Progress in fish vacci-nology. Dev Biol 121:201–213
Kurath G, Garver KA, Troyer RM, Emmenegger EJ, Einer-Jensen K, Anderson ED (2003) Phylogeography of infec-tious haematopoietic necrosis virus in North America.J Gen Virol 84:803–814
Lannan CN, Winton JR, Fryer JL (1984) Fish cell lines, estab-lishment and characterization of nine cell lines fromsalmonids. In Vitro 20:671–678
LaPatra SE, Corbeil S, Jones GR, Shewmaker WD, LorenzenN, Anderson ED, Kurath G (2001) Protection of rainbowtrout against infectious hematopoietic necrosis virus fourdays after specific or semi-specific DNA vaccination.Vaccine 19:4011–4019
Lorenzen N, LaPatra SE (2005) DNA vaccines for aquacul-tured fish. Rev Sci Tech Off Int Epizoot 24:201–213
Mulcahy D, Pascho R, Jenes CK (1984) Comparison of in vitrogrowth characteristics of ten isolates of infectioushaematopoietic necrosis virus. J Gen Virol 65:2199–2201
39

Dis Aquat Org 77: 29–40, 2007
Nei M (1987) Molecular evolutionary genetics. ColumbiaUniversity Press, New York
Nei M, Gojobori T (1986) Simple methods for estimating thenumber of synonymous and non-synonymous nucleotidesubstitutions. Mol Biol Evol 3:418–426
Nichol ST, Rowe JE, Winton JR (1995) Molecular epizootiol-ogy and evolution of the glycoprotein and non-virionprotein genes of infectious hematopoietic necrosis virus, afish rhabdovirus. Virus Res 38:159–173
Nishizawa T, Kinoshita S, Kim WS, Higashi S, Yoshimizu M(2006) Nucleotide diversity of Japanese isolates of infec-tious hematopoietic necrosis virus (IHNV) based on theglycoprotein gene. Dis Aquat Org 71:267–272
Oshima KH, Arakawa CK, Higman KH, Landolt ML, NicholST, Winton JR (1995) The genetic diversity and epizootiol-ogy of infectious hematopoietic necrosis virus. Virus Res35:123–141
Parisot TJ, Yasutake WT, Klontz GW (1965) Virus diseases ofthe Salmonidae in western United States. I. Etiology andepizootiology. Ann NY Acad Sci 126:502–519
Park MA, Sohn SG, Lee SD, Chun SK, Park JW, Fryer JL, HahYC (1993) Infectious haematopoietic necrosis virus fromsalmonids cultured in Korea. J Fish Dis 16:471–478
Ristow SS, Arnzen de Avila J (1991) Monoclonal antibodiesto the glycoprotein and nucleoprotein of infectioushematopoietic necrosis virus (IHNV) reveal differencesamong isolates of the virus by fluorescence, neutraliza-tion, and electrophoresis. Dis Aquat Org 11:105–115
Ross AJ, Pelnar J, Rucker RR (1960) A virus-like disease ofChinook salmon. Trans Am Fish Soc 89:160–163
Rovozzo G, Burke CN (1973) A manual of basic virologicaltechniques. Prentice-Hall, Englewood Cliffs, NJ, p 97
Rozas J, Rozas R (1999) DNaSP Version 3, an integrated pro-
gram for molecular population genetics and molecularevolution analysis. Bioinformatics 15:174–175
Swofford DL (2000) PAUP* (Version 4.0). Phylogenetic ana-lysis using parsimony (*and other methods). SinauerAssociates, Sunderland, MA
Troyer RM, Kurath G (2003) Molecular epidemiology of infec-tious hematopoietic necrosis virus reveals complex virustraffic and evolution within southern Idaho aquaculture.Dis Aquat Org 55:175–185
Troyer RM, LaPatra SE, Kurath G (2000) Genetic analysesreveal unusually high diversity of infectious haemato-poietic necrosis virus in rainbow trout aquaculture. J GenVirol 81:2823–2832
Williams IV, Amend DF (1976) A natural epizootic of infec-tious hematopoietic necrosis in fry of sockeye salmon(Oncorhynchus nerka) at Chilko Lake, British Columbia.J Fish Res Board Can 33:1564–1567
Winton JR (1991) Recent advances in detection and control ofinfectious hematopoietic necrosis virus in aquaculture.Annu Rev Fish Dis 1:83–93
Winton JR, Arakawa CK, Lannan CN, Fryer JL (1988)Neutralizing monoclonal antibodies recognize antigenicvariants among isolates of infectious hematopoietic necro-sis virus. Dis Aquat Org 4:199–204
Wolf K (1988) Infectious hematopoietic necrosis virus. In: Fishviruses and fish viral diseases. Cornell University Press,Ithaca, NY, p 83–114
Yoshiyama RM, Fisher FW, Moyle PB (1998) Historical abun-dance and decline of Chinook salmon in the central valleyregion of California. North Am J Fish Manage 18:487–521
Yoshiyama RM, Moyle PB, Gerstung ER, Fisher FW (2000)Chinook salmon in the California Central Valley: anassessment. Fisheries 15:6–20
40
Editorial responsibility: Mark Crane,Geelong, Victoria, Australia
Submitted: January 19, 2007; Accepted: April 10, 2007Proofs received from author(s): August 4, 2007