Direct measurement of the intermolecular forces between - NCBI
14
Direct measurement of the intermolecular forces between counterion-condensed DNA double helices Evidence for long range attractive hydration forces Donald C. Rau and V. Adrian Parsegian Laboratory of Biochemistry and Metabolism, National Institute of Diabetes and Digestive and Kidney Diseases; and Physical Sciences Laboratory, Division of Computer Research and Technology, National Institutes of Health, Bethesda, Maryland 20892 ABSTRACT Rather than acting by modifying van der Waals or electrostatic double layer interactions or by directly bridging neighboring molecules, polyvalent ligands bound to DNA double helices appear to act by reconfiguring the water between macromolecular surfaces to create attractive long range hydration forces. We have reached this conclusion by directly measuring the repulsive forces between parallel B-form DNA double helices pushed together from the separations at which they have self organized into hexagonal arrays of parallel rods. For all of the wide variety of "condensing agents" from divalent Mn to polymeric protamines, the resulting intermolecular force varies exponentially with a decay rate of 1.4-1.5 A, exactly one-half that seen previously for hydration repulsion. Such behavior qualitatively contradicts the predictions of all electrostatic double layer and van der Waals force potentials previously suggested. It fits remarkably well with the idea, developed and tested here, that multivalent counterion adsorption reorganizes the water at discrete sites complementary to unadsorbed sites on the apposing surface. The measured strength and range of these attractive forces together with their apparent specificity suggest the presence of a previously unexpected force in molecular organization. INTRODUCTION For their ability to create strong and specific associations under exquisite control, the forces between and within macromolecules have long been recognized as a key to the regulation of cellular activity. Yet, while the impor- tance of intermolecular forces in macromolecular orga- nization is well recognized, it is not generally apparent that traditional theories of such forces are inadequate. Direct measurement of interactions between mem- branes and between macromolecules has shown that, in the crucial last 10 A of separation, forces of solvation are far more important than the electrostatic and van der Waals forces traditionally assumed to act between charged or polar surfaces. It is now beginning to emerge that these "hydration" forces can confer the strength, specificity, and control required for macromolecular assembly. To our knowledge, there is still only one way to measure directly the forces between macromolecules in solution. That is to create ordered arrays of repelling molecules and to use x-ray diffraction to measure the change in intermolecular spacing with applied osmotic stress. Besides obtaining molecular force versus separa- tion curves, one can sometimes also measure the change in molecular configurational entropy with separation (Podgornik et al., 1989). Through use of this Osmotic Stress Method (Parsegian et al., 1986), there are now data on forces between a large variety of phospholipid bilayers (e.g., Rand, 1981; Rand and Parsegian, 1989), between DNA double helices (Rau et al., 1984), be- tween neutral and charged polysaccharides (Rau and Parsegian, 1990), and on inverted hexagonal phases of phospholipids (Rand et al., 1990). Osmotic stress has been used as well to create a phase diagram of an assembling protein (Prouty et al., 1985) and to measure the internal volume change in voltage-gated transmem- brane ionic channels (Zimmerberg and Parsegian, 1986). To the extent that one can compare results with force balance measurements between macroscopic surfaces (e.g., Horn et al., 1988), there is excellent agreement between macroscopic and molecular methods of mea- surement. Few systems are as well suited to osmotic stress measurements as ordered assemblies of DNA (Rau et al., 1984). Used as a model for cellular and viral packing of DNA (Wilson and Bloomfield, 1979; Widom and Baldwin, 1980; Chattoraj et al., 1978), poised with the order required for direct force measurement (Schellman and Parthasarathy, 1984), regulated by controlled exposure to different kinds of ion (Wilson and Bloomfield, 1979; Gosule and Schellman, 1978; Widom and Baldwin, 1983), and made from molecules of robust well defined structure, the spontaneously forming arrays of ligand- condensed DNA are ideal for examining the kinds of interactions that can occur between large molecules. X-ray diffraction by these compact structures reveals hexagonal arrays of parallel double helices with interax- ial distances 6-12 A greater than the 20-A helical diameter (Schellman and Parthasarathy, 1984). Until now, studies have emphasized the requirements for condensation (ligand activity, temperature, solvent com- 24 voum 61 Jaur 199 24. 5 Bipya ora 246 Volume 61 January 1992 246-259 Biophysical Journal
-
Upload
khangminh22 -
Category
Documents
-
view
0 -
download
0
Transcript of Direct measurement of the intermolecular forces between - NCBI
Direct measurement of the intermolecular forces betweencounterion-condensed DNA double helicesEvidence for long range attractive hydration forces
Donald C. Rau and V. Adrian ParsegianLaboratory of Biochemistry and Metabolism, National Institute of Diabetes and Digestive and Kidney Diseases; and PhysicalSciences Laboratory, Division of Computer Research and Technology, National Institutes of Health, Bethesda, Maryland 20892
ABSTRACT Rather than acting by modifying van der Waals or electrostatic double layer interactions or by directly bridgingneighboring molecules, polyvalent ligands bound to DNA double helices appear to act by reconfiguring the water betweenmacromolecular surfaces to create attractive long range hydration forces. We have reached this conclusion by directly measuringthe repulsive forces between parallel B-form DNA double helices pushed together from the separations at which they have selforganized into hexagonal arrays of parallel rods. For all of the wide variety of "condensing agents" from divalent Mn to polymericprotamines, the resulting intermolecular force varies exponentially with a decay rate of 1.4-1.5 A, exactly one-half that seenpreviously for hydration repulsion. Such behavior qualitatively contradicts the predictions of all electrostatic double layer and vander Waals force potentials previously suggested. It fits remarkably well with the idea, developed and tested here, that multivalentcounterion adsorption reorganizes the water at discrete sites complementary to unadsorbed sites on the apposing surface. Themeasured strength and range of these attractive forces together with their apparent specificity suggest the presence of apreviously unexpected force in molecular organization.
INTRODUCTION
For their ability to create strong and specific associationsunder exquisite control, the forces between and withinmacromolecules have long been recognized as a key tothe regulation of cellular activity. Yet, while the impor-tance of intermolecular forces in macromolecular orga-nization is well recognized, it is not generally apparentthat traditional theories of such forces are inadequate.Direct measurement of interactions between mem-
branes and between macromolecules has shown that, inthe crucial last 10A of separation, forces of solvation are
far more important than the electrostatic and van derWaals forces traditionally assumed to act betweencharged or polar surfaces. It is now beginning to emergethat these "hydration" forces can confer the strength,specificity, and control required for macromolecularassembly.To our knowledge, there is still only one way to
measure directly the forces between macromolecules insolution. That is to create ordered arrays of repellingmolecules and to use x-ray diffraction to measure thechange in intermolecular spacing with applied osmoticstress. Besides obtaining molecular force versus separa-tion curves, one can sometimes also measure the changein molecular configurational entropy with separation(Podgornik et al., 1989). Through use of this OsmoticStress Method (Parsegian et al., 1986), there are nowdata on forces between a large variety of phospholipidbilayers (e.g., Rand, 1981; Rand and Parsegian, 1989),between DNA double helices (Rau et al., 1984), be-tween neutral and charged polysaccharides (Rau and
Parsegian, 1990), and on inverted hexagonal phases ofphospholipids (Rand et al., 1990). Osmotic stress hasbeen used as well to create a phase diagram of an
assembling protein (Prouty et al., 1985) and to measurethe internal volume change in voltage-gated transmem-brane ionic channels (Zimmerberg and Parsegian, 1986).To the extent that one can compare results with forcebalance measurements between macroscopic surfaces(e.g., Horn et al., 1988), there is excellent agreementbetween macroscopic and molecular methods of mea-
surement. Few systems are as well suited to osmoticstress measurements as ordered assemblies of DNA(Rau et al., 1984).Used as a model for cellular and viral packing of DNA
(Wilson and Bloomfield, 1979; Widom and Baldwin,1980; Chattoraj et al., 1978), poised with the orderrequired for direct force measurement (Schellman andParthasarathy, 1984), regulated by controlled exposureto different kinds of ion (Wilson and Bloomfield, 1979;Gosule and Schellman, 1978; Widom and Baldwin,1983), and made from molecules of robust well definedstructure, the spontaneously forming arrays of ligand-condensed DNA are ideal for examining the kinds ofinteractions that can occur between large molecules.X-ray diffraction by these compact structures revealshexagonal arrays of parallel double helices with interax-ial distances 6-12 A greater than the 20-A helicaldiameter (Schellman and Parthasarathy, 1984). Untilnow, studies have emphasized the requirements forcondensation (ligand activity, temperature, solvent com-
24 voum 61 Jaur 19924. 5 Bipya ora246 Volume 61 January 1992 246-259 Biophysical Journal
position, activity of non-condensing salts) to gatherinformation on mechanisms. Here, because paralleldouble helices are not condensed to contact, we havemeasured the repulsive forces between helices as theyare brought together from their spontaneously-assumedspacings. These measured forces allow one to inquiresystematically into the balance of attractive and repul-sive forces that creates these minimum energy spacings.We find that these forces are neither consistent with
any model of direct ionic bridging nor with a balance ofelectrostatic/hydration repulsion against van der Waalsattraction. Rather, the evidence is for an attractive formof the hydration force. Rearrangement or release ofwater about the adsorbing ionic ligand and the hostdouble helix is driven in part by the entropy of solventrelease (Rau and Parsegian, 1992), a kind of "hydropho-bic interaction" between polar surfaces.
After collapse under these attractive forces, the 3A
decay length exponential repulsion seen between doublehelices in ordinary solutions is replaced by a 1.5-Adecay force regardless of the kind of condensing ion
even though the magnitudes of forces change dramati-cally with condensing ion species. The striking halving ofthe decay length can be rationalized by simple modifica-tion of the formalism developed for purely repulsivehydration forces. The mutual dependence of condensa-tion on applied osmotic stress and ion activity allows oneto measure the number of ions bound or rearrangedupon condensation as well as to estimate the strength ofattractive forces that drive assembly.
MATERIALS AND METHODS
Materials and chemicalsSpermidine trihydrochloride and salmon protamine were obtainedfrom Sigma Chemical Co. (St. Louis, MO); cobaltic hexamminechloride (Co(NH3)6C13) from Eastman-Kodak Co. (Rochester, NY);and manganese perchlorate (Mn(CIO)2) from Aldrich Chemical Co.(Milwaukee, WI). All were used without further purification. Polyeth-ylene glycols (PEG), average molecular weights 8,000 and 20,000, werepurchased from Sigma Chemical Co. PEG was used without furtherpurification for most experiments. Some control experiments weredone, however, with PEG 20,000 average molecular weight that hadbeen dissolved in water, dialyzed against distilled water, with severalchanges, for -24 h (Spectra-Por dialysis membranes with a 6,000-8,000 molecular weight cutoff) to remove low molecular species andcontaminants, and lyophilized to dryness. There was no observabledifference between results obtained with untreated and dialyzedPEGs. High molecular weight DNA was prepared from adult chickenwhole blood as described by (McGhee et al., 1981), and exhaustivelydialyzed against 10 mM TrisCl (pH 7.5), 1 mM EDTA.
Osmotic stressThe osmotic stress technique applied to DNA has been described indetail elsewhere (Rau et al., 1984; Parsegian et al., 1986; Podgornik et
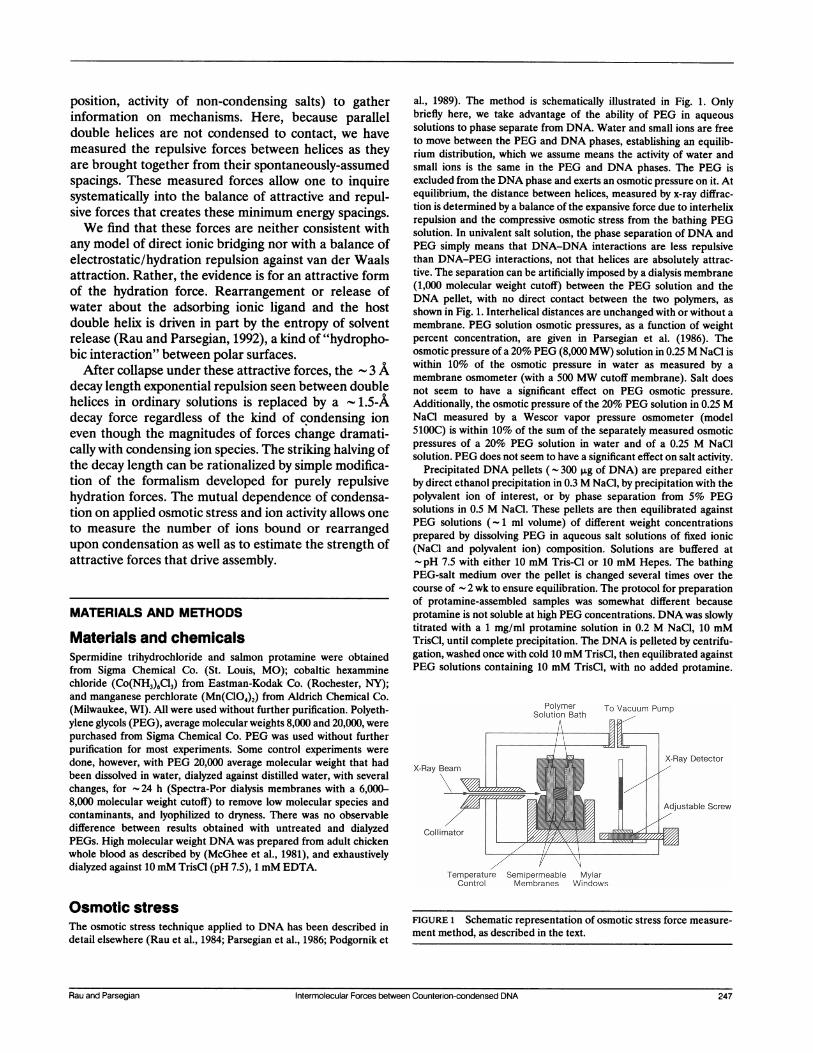
al., 1989). The method is schematically illustrated in Fig. 1. Onlybriefly here, we take advantage of the ability of PEG in aqueous
solutions to phase separate from DNA. Water and small ions are freeto move between the PEG and DNA phases, establishing an equilib-rium distribution, which we assume means the activity of water andsmall ions is the same in the PEG and DNA phases. The PEG isexcluded from the DNA phase and exerts an osmotic pressure on it. Atequilibrium, the distance between helices, measured by x-ray diffrac-tion is determined by a balance of the expansive force due to interhelixrepulsion and the compressive osmotic stress from the bathing PEGsolution. In univalent salt solution, the phase separation of DNA andPEG simply means that DNA-DNA interactions are less repulsivethan DNA-PEG interactions, not that helices are absolutely attrac-tive. The separation can be artificially imposed by a dialysis membrane(1,000 molecular weight cutoff) between the PEG solution and theDNA pellet, with no direct contact between the two polymers, as
shown in Fig. 1. Interhelical distances are unchanged with or without a
membrane. PEG solution osmotic pressures, as a function of weightpercent concentration, are given in Parsegian et al. (1986). Theosmotic pressure of a 20% PEG (8,000 MW) solution in 0.25 M NaCl iswithin 10% of the osmotic pressure in water as measured by a
membrane osmometer (with a 500 MW cutoff membrane). Salt doesnot seem to have a significant effect on PEG osmotic pressure.Additionally, the osmotic pressure of the 20% PEG solution in 0.25 MNaCl measured by a Wescor vapor pressure osmometer (model5100C) is within 10% of the sum of the separately measured osmoticpressures of a 20% PEG solution in water and of a 0.25 M NaClsolution. PEG does not seem to have a significant effect on salt activity.
Precipitated DNA pellets ( 300 pg of DNA) are prepared eitherby direct ethanol precipitation in 0.3 M NaCl, by precipitation with thepolyvalent ion of interest, or by phase separation from 5% PEGsolutions in 0.5 M NaCl. These pellets are then equilibrated againstPEG solutions (- 1 ml volume) of different weight concentrationsprepared by dissolving PEG in aqueous salt solutions of fixed ionic(NaCl and polyvalent ion) composition. Solutions are buffered at-pH 7.5 with either 10 mM Tris-Cl or 10 mM Hepes. The bathingPEG-salt medium over the pellet is changed several times over thecourse of - 2 wk to ensure equilibration. The protocol for preparationof protamine-assembled samples was somewhat different becauseprotamine is not soluble at high PEG concentrations. DNA was slowlytitrated with a 1 mg/ml protamine solution in 0.2 M NaCl, 10 mMTrisCl, until complete precipitation. The DNA is pelleted by centrifu-gation, washed once with cold 10 mM TrisCl, then equilibrated againstPEG solutions containing 10 mM TrisCl, with no added protamine.
Polymer To Vacuum Pump
Solution Bath
X-Ray DetectorX-Ray\Bas
or _ / ~~~~~~~~~Adjustable ScrewCollimator Wmi
FIGURE 1 Schematic representation of osmotic stress force measure-ment method, as described in the text.
Rau and Parsegian Intermolecular Forces between Counterion-condensed DNA 247Rau and Parsegian Intermolecular Forces between Counterion-condensed DNA 247
The complex is sufficiently stable under these salt conditions that nochange in spacing is observed even after repeated cycling of a samplebetween high and low osmotic pressures. We have additionallycompared spacings we measure with interhelical distances determinedby Suwalsky and Traub (1977) for salmon sperm nuclei at 92% relativehumidity (Fig. 3).
X-ray measurementsDistances between helices in DNA pellets equilibrated against PEG-salt solutions are determined by x-ray scattering. An Enraf-NoniusService Corp. (Bohemia, NY) fixed anode Diffractis 601 x-ray genera-tor equipped with a high power, fine focus, copper tube is used forthese measurements. The camera was designed and built at the NIH(Mudd et al., 1987). The sample cells contain both the DNA pellet and- 100 p.1 of the bathing PEG-salt solution, sealed against evaporation,and temperature regulated. The camera chamber is evacuated tominimize air scattering. X-ray reflections from the DNA pellet are
detected by film (DEF 5; Eastman-Kodak Co.). The very strongequatorial reflections can be measured either by hand or by a scanningdensitometer (Podgornik et al., 1989) to give a Bragg spacing betweenhelices. The 14.5 A Bragg reflection from powdered bromobenzoicacid was used to calibrate the sample to film distance ( 15 cm).Occasionally, DNA samples are exposed long enough to obtain higherorder reflections to confirm hexagonal packing and to observe the 3.4A reflection characteristic of B-form DNA. The relation between theBragg spacing, DBr, and the actual distance between helices, Di.,, forthis packing is,
Dint=-2DBr/ /-i
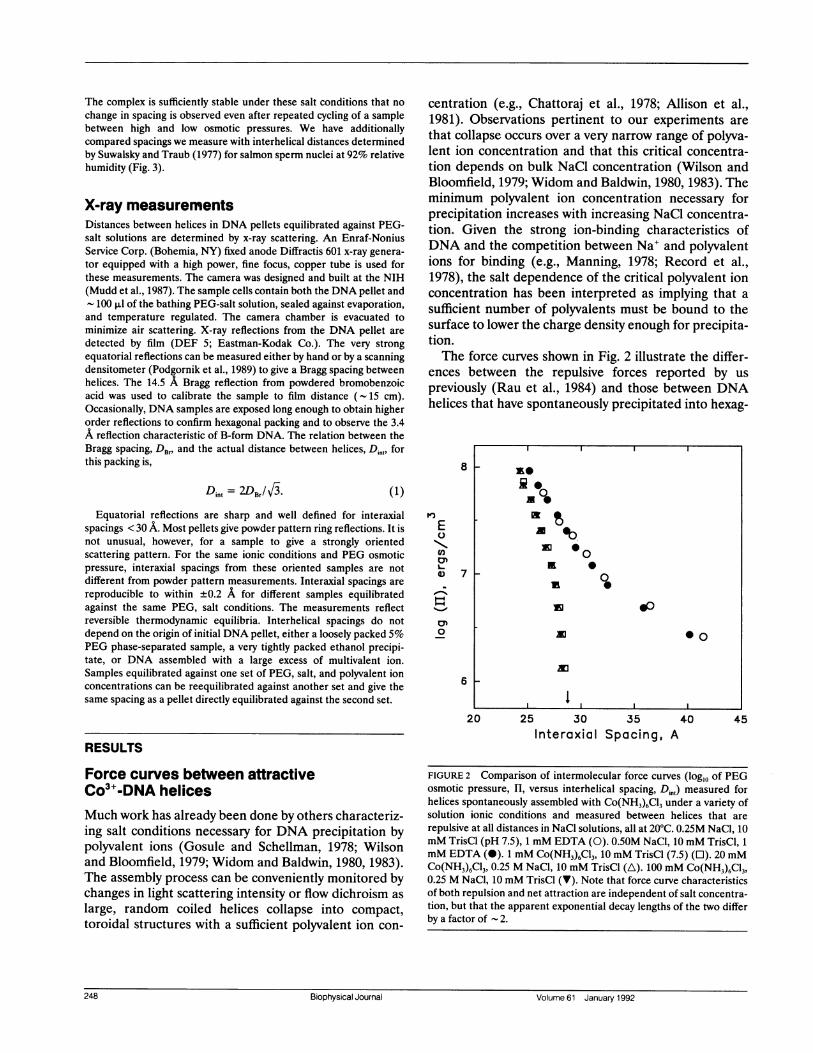
centration (e.g., Chattoraj et al., 1978; Allison et al.,1981). Observations pertinent to our experiments arethat collapse occurs over a very narrow range of polyva-lent ion concentration and that this critical concentra-tion depends on bulk NaCl concentration (Wilson andBloomfield, 1979; Widom and Baldwin, 1980, 1983). Theminimum polyvalent ion concentration necessary forprecipitation increases with increasing NaCl concentra-tion. Given the strong ion-binding characteristics ofDNA and the competition between Na+ and polyvalentions for binding (e.g., Manning, 1978; Record et al.,1978), the salt dependence of the critical polyvalent ionconcentration has been interpreted as implying that asufficient number of polyvalents must be bound to thesurface to lower the charge density enough for precipita-tion.The force curves shown in Fig. 2 illustrate the differ-
ences between the repulsive forces reported by uspreviously (Rau et al., 1984) and those between DNAhelices that have spontaneously precipitated into hexag-
8
(1)
Equatorial reflections are sharp and well defined for interaxialspacings < 30 A. Most pellets give powder pattern ring reflections. It isnot unusual, however, for a sample to give a strongly orientedscattering pattern. For the same ionic conditions and PEG osmoticpressure, interaxial spacings from these oriented samples are notdifferent from powder pattern measurements. Interaxial spacings are
reproducible to within +0.2 A for different samples equilibratedagainst the same PEG, salt conditions. The measurements reflectreversible thermodynamic equilibria. Interhelical spacings do notdepend on the origin of initial DNA pellet, either a loosely packed 5%PEG phase-separated sample, a very tightly packed ethanol precipi-tate, or DNA assembled with a large excess of multivalent ion.Samples equilibrated against one set of PEG, salt, and polyvalent ionconcentrations can be reequilibrated against another set and give thesame spacing as a pellet directly equilibrated against the second set.
E
L-
0
7
6
20 25 30 35 40Interaxial Spacing, A
RESULTS
45
Force curves between attractiveCo3+-DNA helicesMuch work has already been done by others characteriz-ing salt conditions necessary for DNA precipitation bypolyvalent ions (Gosule and Schellman, 1978; Wilsonand Bloomfield, 1979; Widom and Baldwin, 1980, 1983).The assembly process can be conveniently monitored bychanges in light scattering intensity or flow dichroism as
large, random coiled helices collapse into compact,toroidal structures with a sufficient polyvalent ion con-
FIGURE 2 Comparison of intermolecular force curves (log10 of PEGosmotic pressure, H, versus interhelical spacing, Di,,) measured forhelices spontaneously assembled with Co(NH3)6C13 under a variety ofsolution ionic conditions and measured between helices that are
repulsive at all distances in NaCl solutions, all at 20°C. 0.25M NaCl, 10mM TrisCl (pH 7.5), 1 mM EDTA (0). 0.50M NaCl, 10 mM TrisCl, 1mM EDTA (0). 1 mM Co(NH3)6C13, 10 mM TrisCl (7.5) (0). 20 mMCo(NH3)6C13, 0.25 M NaCl, 10 mM TrisCl (A). 100 mM Co(NH3)6C13,0.25 M NaCl, 10 mM TrisCl (V). Note that force curve characteristicsof both repulsion and net attraction are independent of salt concentra-tion, but that the apparent exponential decay lengths of the two differby a factor of 2.
4 Al V m 61
II
a t
0XD *
XI *0
I I I
248 Biophysical Journal Volume 61 January 1992
onal arrays after the addition of sufficient Co(NH3)6C13.These curves relate measured interhelical spacing Di., tolog of the osmotic stress (H) exerted by PEG-saltsolutions in equilibrium with the DNA lattices.The rightmost curves show the forces in 0.25 and 0.5
M NaCl. We had previously observed for these purelyrepulsive forces that, at interaxial distances > 30-35 A,
force magnitudes and slopes are ionic strength depen-dent and arise from fluctuation-enhanced electrostaticrepulsion (Podgornik et al., 1989; Podgornik and Parseg-ian, 1990). At higher pressures and closer distances, weobserve an exponentially growing force with an apparent- 3 A decay length. Force magnitudes in this region donot depend on ionic strength, but are sensitive to theparticular counterion bound on the DNA surface (Rauet al., 1984). The 3 A decay length is independent of
both ionic strength and counterion species. We havecharacterized these forces as arising from repulsivewater structuring between helices, repulsive "hydration"forces.The other, leftmost, three curves in Fig. 2 are for
DNA to which enough Co3+ is added to cause helices toassemble spontaneously into a hexagonal array. Twocurves are with 20 and 100 mM trivalent Co3+ in 0.25 MNaCl, 10 mM TrisCl. The third curve is for DNAprecipitated in 1 mM Co3+, 10 mM Tris-Cl, withoutadded NaCl.The three curves superpose and show a common set of
force characteristics. In the absence of applied stress,there is a stable, finite center-to-center separation of
28.3, or 8.3 A between surfaces. The base pair
concentration at this spacing is - 1 M. Such a finiteequilibrium separation implies a balance between attrac-tive forces that bring the helices together from infiniteseparation and repulsive forces acting at very shortdistances.The measured forces probe the characteristics of the
close distance repulsive side of the energy well. Withadded osmotic pressure, we can bring the helices closer,down to 22 A interaxial spacing at the highest pressure.The force characteristics observed here greatly restrictpossible candidates for the close distance repulsion. Theinsensitivity of the equilibrium (HI = 0) spacing andobserved forces to ionic strength and to added Co3+argues strongly against a significant contribution fromelectrostatic double layer forces.At higher pressures, away from the minimum in the
energy well, the curve is accurately described by an
exponentially increasing force with a 1.4 + 0.1 A decaylength. The repulsive component of the net force is notthe -3 A value characteristic of hydration repulsionfound between DNA helices in NaCl only.
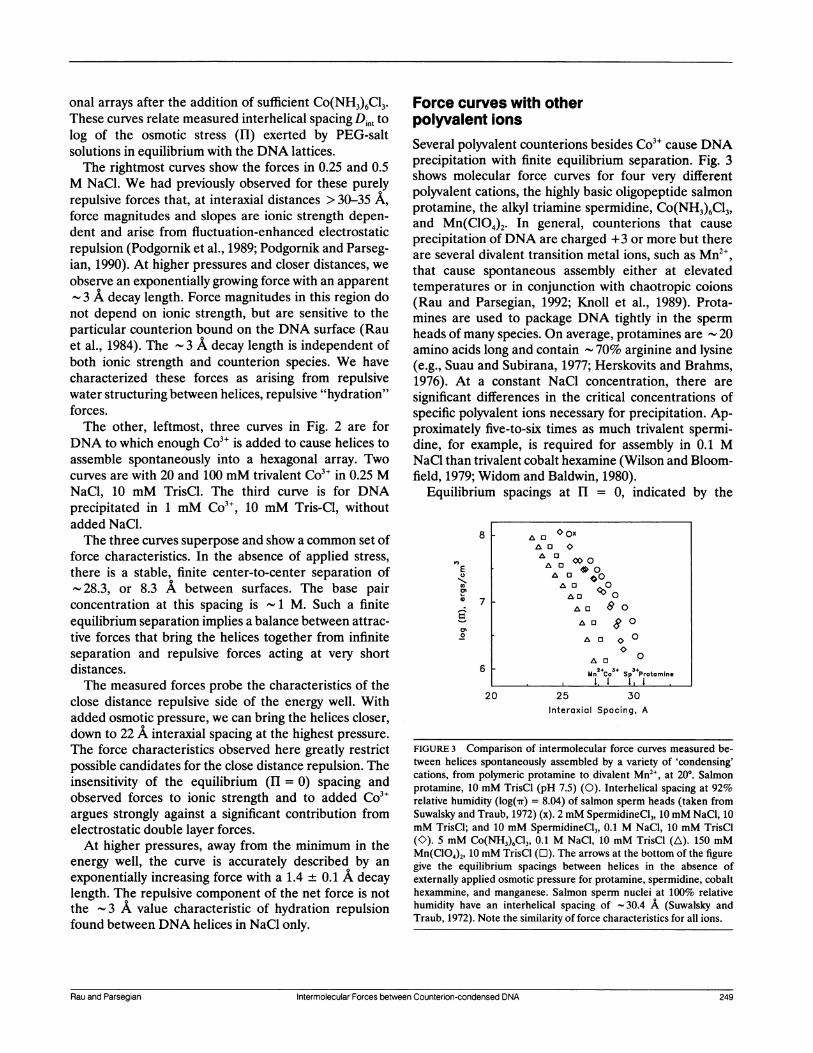
Force curves with otherpolyvalent ionsSeveral polyvalent counterions besides Co3" cause DNAprecipitation with finite equilibrium separation. Fig. 3shows molecular force curves for four very differentpolyvalent cations, the highly basic oligopeptide salmonprotamine, the alkyl triamine spermidine, Co(NH3)6C13,and Mn(C1O4)2. In general, counterions that cause
precipitation of DNA are charged +3 or more but thereare several divalent transition metal ions, such as Mn ,that cause spontaneous assembly either at elevatedtemperatures or in conjunction with chaotropic coions(Rau and Parsegian, 1992; Knoll et al., 1989). Prota-mines are used to package DNA tightly in the spermheads of many species. On average, protamines are 20
amino acids long and contain - 70% arginine and lysine(e.g., Suau and Subirana, 1977; Herskovits and Brahms,1976). At a constant NaCl concentration, there are
significant differences in the critical concentrations ofspecific polyvalent ions necessary for precipitation. Ap-proximately five-to-six times as much trivalent spermi-dine, for example, is required for assembly in 0.1 MNaCl than trivalent cobalt hexamine (Wilson and Bloom-field, 1979; Widom and Baldwin, 1980).
Equilibrium spacings at HI = 0, indicated by the
8
nE
0
coa%L-
a
ot
7
6
20 25 30
Interaxial Spacing, A
FIGURE 3 Comparison of intermolecular force curves measured be-tween helices spontaneously assembled by a variety of 'condensing'cations, from polymeric protamine to divalent Mn2", at 200. Salmonprotamine, 10 mM TrisCl (pH 7.5) (0). Interhelical spacing at 92%relative humidity (log('rr) = 8.04) of salmon sperm heads (taken fromSuwalsky and Traub, 1972) (x). 2 mM SpermidineCl3, 10mM NaCl, 10mM TrisCl; and 10 mM SpermidineCl3, 0.1 M NaCl, 10 mM TrisCl(K). 5 mM Co(NH3)6C13, 0.1 M NaCl, 10 mM TrisCl (A). 150 mMMn(ClO4)2, 10 mM TrisCl (O). The arrows at the bottom of the figuregive the equilibrium spacings between helices in the absence ofexternally applied osmotic pressure for protamine, spermidine, cobalthexammine, and manganese. Salmon sperm nuclei at 100% relativehumidity have an interhelical spacing of -30.4 A (Suwalsky andTraub, 1972). Note the similarity of force characteristics for all ions.
Intermolecular Forces between Counterion-condensed DNA 249
AD0AD 0 0
A o 4*00A 0 * o
08
0
0AD0
Mn 0~o Sp +rotamineI LI 1II
Rau and Parsegian intermolecular Forces between Counterion-condensed DNA 249
arrows in the figure, depend on the particular ioncausing assembly. This has also been reported by Schell-man and Parthasarathy (1984), who find Deq = 29.4 A forspermidine with calf thymus DNA and 28.2 A for cobalthexammine with chicken erythrocyte DNA. The magni-tude of the repulsive part of the energy minimum, that isthe force needed to push helices closer than the equilib-rium spacing, also depends on polyvalent ion identity. Athigh pressures, however, all four curves are well charac-terized as exponentially increasing forces with decaylengths 1.3-1.5 A, independent of counterion species.These force characteristics are closely similar to the
properties that led us to conclude that repulsive hydra-tion forces dominate the forces between helices inunivalent counterion solutions. Force magnitudes de-pend on counterion identity, but not concentration;exponential decay lengths are independent of both. Thevery striking difference from our previous observations isthat the decay length associated with an attractiveenergy minimum is very close to half that for overall nethydration repulsion (1.4 + 0.1 vs. 3 + 0.3 A).
Equilibrium spacings in mixedmethanol water solutionsWilson and Bloomfield (1979) have reported that diva-lent ions such as Mg2" are sufficient to cause precipita-tion in 50:50 (vol/vol) methanol-water solutions. Addi-tionally, much lower concentrations of polyvalent ionsare required for spontaneous assembly than in water atthe same ionic strength. Schellman and Parthasarathy(1984) have measured a 26.7 A equilibrium spacingbetween DNA helices in MgCl2 and 50% methanol. Thisvery small separation together with the dependence ofequilibrium spacings in water on the size of the polyva-lent ion led Schellman and Parthasarathy to suggest thata tight counterion-DNA phosphate cross-bridging com-plex is formed between two helices.We have extended these equilibrium spacing measure-
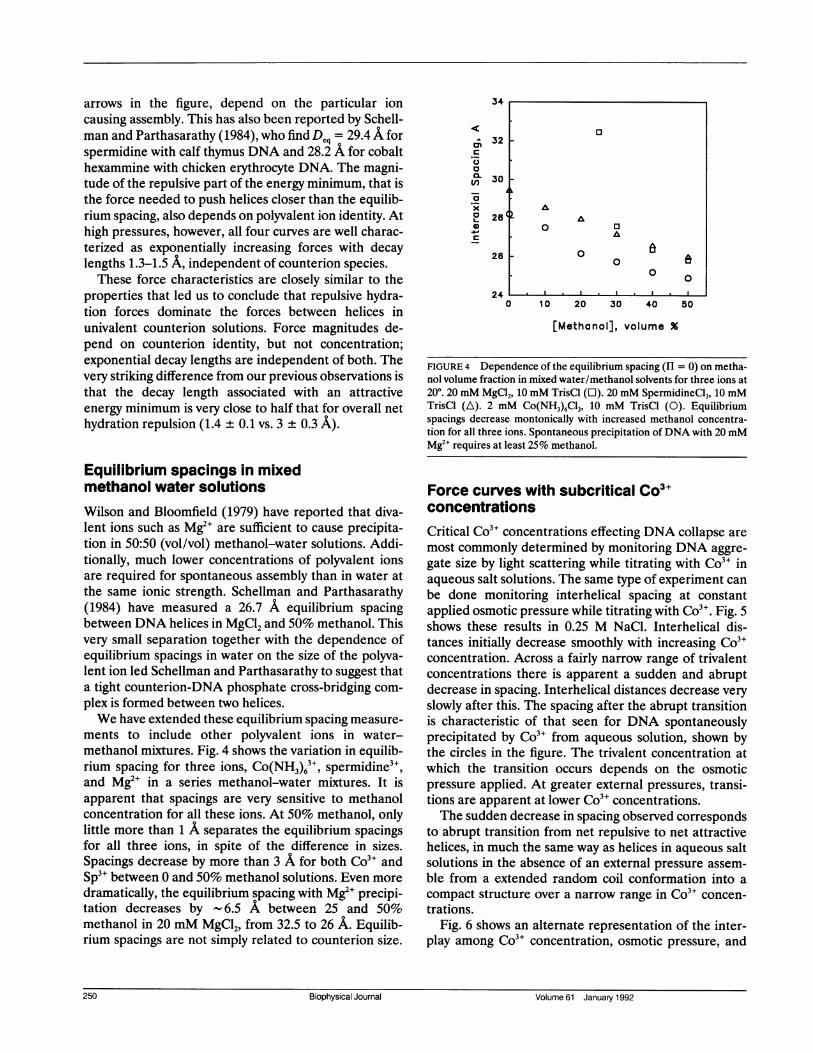
ments to include other polyvalent ions in water-methanol mixtures. Fig. 4 shows the variation in equilib-rium spacing for three ions, Co(NH3)63+, spermidine3+,and Mg2+ in a series methanol-water mixtures. It isapparent that spacings are very sensitive to methanolconcentration for all these ions. At 50% methanol, onlylittle more than 1 A separates the equilibrium spacingsfor all three ions, in spite of the difference in sizes.Spacings decrease by more than 3 A for both Co3" andSp3+ between 0 and 50% methanol solutions. Even moredramatically, the equilibrium spacing with Mg2` precipi-tation decreases by - 6.5 A between 25 and 50%methanol in 20 mM MgCl2, from 32.5 to 26 A. Equilib-rium spacings are not simply related to counterion size.
34
C;U
a
x
0-)-c
32 F
30
288
26 1-
240 1 0 20 30 40 50
[Methanol], volume %
FIGURE 4 Dependence of the equilibrium spacing (H = 0) on metha-nol volume fraction in mixed water/methanol solvents for three ions at200. 20 mM MgCl2, 10 mM TrisCl (O). 20 mM SpermidineCl3, 10 mMTrisCl (A). 2 mM Co(NH3)6C13, 10 mM TrisCl (0). Equilibriumspacings decrease montonically with increased methanol concentra-tion for all three ions. Spontaneous precipitation of DNA with 20 mMMg2" requires at least 25% methanol.
Force curves with subcritical Co3+concentrationsCritical Co3` concentrations effecting DNA collapse are
most commonly determined by monitoring DNA aggre-gate size by light scattering while titrating with Co3" inaqueous salt solutions. The same type of experiment can
be done monitoring interhelical spacing at constantapplied osmotic pressure while titrating with Co3+. Fig. 5shows these results in 0.25 M NaCl. Interhelical dis-tances initially decrease smoothly with increasing Co3"concentration. Across a fairly narrow range of trivalentconcentrations there is apparent a sudden and abruptdecrease in spacing. Interhelical distances decrease very
slowly after this. The spacing after the abrupt transitionis characteristic of that seen for DNA spontaneouslyprecipitated by Co3" from aqueous solution, shown bythe circles in the figure. The trivalent concentration atwhich the transition occurs depends on the osmoticpressure applied. At greater external pressures, transi-tions are apparent at lower Co3" concentrations.The sudden decrease in spacing observed corresponds
to abrupt transition from net repulsive to net attractivehelices, in much the same way as helices in aqueous saltsolutions in the absence of an external pressure assem-
ble from a extended random coil conformation into a
compact structure over a narrow range in Co3" concen-trations.
Fig. 6 shows an alternate representation of the inter-play among Co3" concentration, osmotic pressure, and
25 B.pya Jora Voum 61 January.1992
0
Aa
0 0A
0 8
0 a0
250 Biophysical Journal Volume61 January 1992
45
40c
v}
cLU.
0
x
aL.
a)
35 +
30
25
0 1 0 20 30 40
8
f,
E
a)cn
0
7
6
50
[Co(NH3),C13], mM
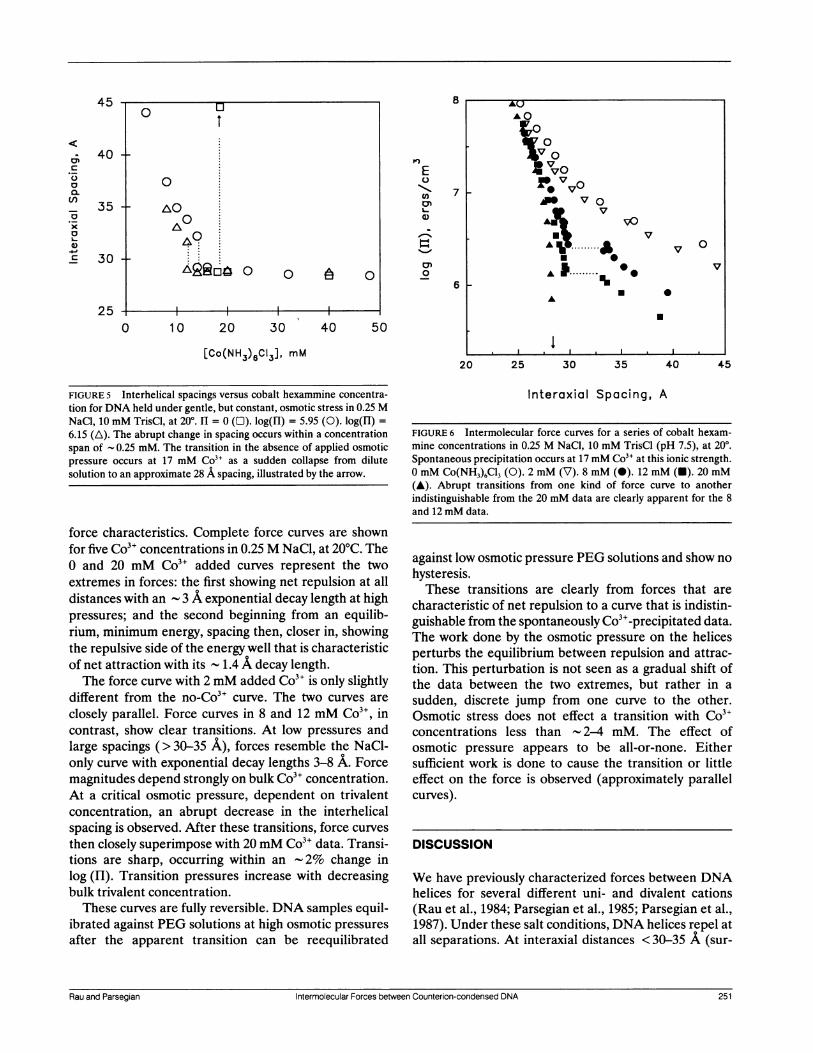
FIGURE 5 Interhelical spacings versus cobalt hexammine concentra-tion for DNA held under gentle, but constant, osmotic stress in 0.25 MNaCl, 10 mM TrisCl, at 200. I1 = 0 (O). log(HI) = 5.95 (0). log(H) =6.15 (A). The abrupt change in spacing occurs within a concentrationspan of 0.25 mM. The transition in the absence of applied osmoticpressure occurs at 17 mM Co3" as a sudden collapse from dilutesolution to an approximate 28 A spacing, illustrated by the arrow.
force characteristics. Complete force curves are shownfor five Co3" concentrations in 0.25 M NaCl, at 20°C. The0 and 20 mM Co3" added curves represent the twoextremes in forces: the first showing net repulsion at alldistances with an - 3 A exponential decay length at highpressures; and the second beginning from an equilib-rium, minimum energy, spacing then, closer in, showingthe repulsive side of the energy well that is characteristicof net attraction with its - 1.4 A decay length.The force curve with 2 mM added Co3" is only slightly
different from the no-Co3" curve. The two curves are
closely parallel. Force curves in 8 and 12 mM Co3", incontrast, show clear transitions. At low pressures andlarge spacings (> 30-35 A), forces resemble the NaCl-only curve with exponential decay lengths 3-8 A. Forcemagnitudes depend strongly on bulk Co3" concentration.At a critical osmotic pressure, dependent on trivalentconcentration, an abrupt decrease in the interhelicalspacing is observed. After these transitions, force curves
then closely superimpose with 20 mM Co3+ data. Transi-tions are sharp, occurring within an -2% change inlog (H). Transition pressures increase with decreasingbulk trivalent concentration.These curves are fully reversible. DNA samples equil-
ibrated against PEG solutions at high osmotic pressures
after the apparent transition can be reequilibrated
&I-JAUAO
P. VV~~
vo
* VA_.
0~~ 0
E .IV *
20 25 30 35 40 45
Interaxial Spacing, A
FIGURE 6 Intermolecular force curves for a series of cobalt hexam-mine concentrations in 0.25 M NaCl, 10 mM TrisCl (pH 7.5), at 200.Spontaneous precipitation occurs at 17 mM Co3" at this ionic strength.0 mM Co(NH3)6C13 (0). 2 mM (V). 8 mM (0). 12 mM (U). 20 mM(A). Abrupt transitions from one kind of force curve to anotherindistinguishable from the 20 mM data are clearly apparent for the 8and 12 mM data.
against low osmotic pressure PEG solutions and show nohysteresis.These transitions are clearly from forces that are
characteristic of net repulsion to a curve that is indistin-guishable from the spontaneously Co3"-precipitated data.The work done by the osmotic pressure on the helicesperturbs the equilibrium between repulsion and attrac-tion. This perturbation is not seen as a gradual shift ofthe data between the two extremes, but rather in a
sudden, discrete jump from one curve to the other.Osmotic stress does not effect a transition with Co3"concentrations less than - 2-4 mM. The effect ofosmotic pressure appears to be all-or-none. Eithersufficient work is done to cause the transition or littleeffect on the force is observed (approximately parallelcurves).
DISCUSSION
We have previously characterized forces between DNAhelices for several different uni- and divalent cations(Rau et al., 1984; Parsegian et al., 1985; Parsegian et al.,1987). Under these salt conditions, DNA helices repel atall separations. At interaxial distances <30-35 A (sur-
Rau and Parsegian Intermolecular Forces between Counterion-condensed DNA 251
0
A0
40
A22EJaO 0 6 0.
. I II r-i
|~~ ~ ~~~~~~~~
Intermolecular Forces between Counterion-condensed DNA 251Rau and Parsegian
face separations < 10-15 A), exponentially varying repul-sion decays with a characteristic length of - 3 A. Thedecay length and magnitude of this repulsion are surpris-ingly insensitive to ionic strength or to the type of ion inthe suspending medium. Only the coefficient of thisforce is changed in the presence of different cations.
Then, at greater separations, repulsion is sensitive toionic strength. But, the decay rate is approximatelyone-half that expected from Debye Huckel double layertheory. By direct measurement both of the intermolecu-lar force versus separation as well as of the change indisorder of the flexible DNA molecules, it was foundthat at these larger separations there is steric undulatoryenhancement of electrostatic double layer or of hydra-tion forces, a coupling between thermal disorder ofmolecular bending with the intermolecular repulsionthat suppresses that bending (Podgornik et al., 1989;Podgornik and Parsegian, 1990).
In contrast, here DNA molecules "condensed" bypolyvalent cations assemble into well defined latticeswith interaxial distances much greater than the diameterof double helices. These distances imply the action oflong range attraction acting to create energy minima at 8to 12 A separation between molecular surfaces. Directmeasurement of the forces needed to push moleculestogether from these spontaneously assumed positionsreveal an exponential repulsion of 1.3 to 1.5 A decaylength. This is one-half the value seen in cases of pure
repulsion. This 1.4 A decay is stubbornly insensitive to
ionic strength and even to the identity of condensingspecies. Only the spontaneous separations of collapsedstructures change with the identity of the condensingagent. These data fit neither of the previously imaginedmechanisms for counterion condensation, and lead us torecognize the possibility of attractive forces based on
solvent restructuring of the water between neighboringdouble helices.At first thought, polyvalent cations might be acting
indirectly by allowing molecules to come close simply byscreening electrostatic double layer (esdl) potentialsenough to allow van der Waals attraction to pull mole-cules together. This is the kind of balance expected inclassical colloid theory. This traditional view is renderedinvalid by two qualitative features of the measuredforces.
First, the - 1.4 A decay length exponential repulsion,between molecules forced together from equilibriumseparation at a distance, is affected neither by thevalence nor the ionic strength of the condensing agent; itbears no relation to the predictions of electrostaticdouble layer theory.
Second, added NaCl, which if anything should furtherscreen electrostatic double layer repulsion, causes thecondensed pellet suddenly to come apart. The concentra-
tion of polyvalent ion necessary for assembly increaseswith increasing NaCl concentration (Wilson and Bloom-field, 1979; Widom and Baldwin, 1980, 1983).Our data supports a direct role for bound polyvalent
ions in the precipitation of DNA. One extreme would bethat the various agents can form direct cross-bridge linksbetween neighboring molecules. Indeed, the depen-dence of the equilibrium spacing on polyvalent ionspecies seemed to imply that this distance is determinedby the size of the polyvalent ion through the formation oftight complexes between a phosphate on one helix, thepolyvalent ion, and a phosphate on an apposing helix.
In support of a tight bridging complex, Schellman andParthasarathy (1984) measured the equilibrium spacings
of Mg2+-precipitated DNA in 50:50 methanol-watersolution. The 25-26 A interaxial spacing observed fitwell with a series of spacings seen for DNA precipitatedwith larger polyvalents in pure water. Ion size seemed tocorrelate well with spacing. Now, having measuredinteraxial spacings between DNA helices precipitated ina range of methanol:water ratios and having measuredforces for DNA precipitated by several kinds of ions, wefind that the correlation between spacing and ion size nolonger holds.
First, it is difficult to rationalize the 32 A spacingobserved with Mg2+ in 25% methanol as a well struc-tured Mg2+-PO4- complex. This spacing is vastly biggerthan those seen with Sp3" or Co3+ at the same methanolconcentration. The earlier size-spacing correlation worksonly if the DNA is in solutions ofvery different methanolconcentration.
Second, it is even more difficult to see how a cross-
linking or tight-complex mechanism can lead to a com-mon 1.4 A exponential repulsion for DNA condensed byagents as different as Mn2 , Co(NH3)63 , Sp3, andpolymeric protamine. The "sponginess" of a tightlybridged complex should depend on the identity of thecounterion.
Osmotic stress mediated transitionsThe sensitivity of force magnitudes at low pressures toCo(NH3)63+ concentration seen in Fig. 6 results from thesensitivity of hydration forces to the type of counterionbound to the DNA surface. Just as we found previously(Rau and Parsegian, 1984) that force magnitudes, butnot the exponential force characteristics, are dependenton the particular univalent or divalent cation in solution,so also will the force magnitude be dependent on therelative fraction of bound Na+ and Co(NH3)63+ in mixeduni- and trivalent solution. This observed sensitivity alsoimplies a dependence of Co3+ binding (or Co3+/Na+exchange) on interhelical spacing. Similarly, the insensi-tivity of molecular force curves for spontaneously precip-
252 Biophysical Journal Volume 61 January 1992252 Biophysical Journal Volume 61 January 1992
itated DNA to bulk Co3" concentration and the superpo-
sition of force curves with subcritical Co3" at highpressures with the curves for spontaneously precipitatedDNA implies a limiting or saturating binding of trivalention to DNA. The measurement of forces by the osmoticstress technique under well defined solution conditionsallows one to apply fundamental thermodynamic rela-tionships to determine the changes occurring with Co3binding occurring.The osmotic stress experiment is thermodynamically
equivalent to an experiment in which a piston with a
semipermeable membrane applies a mechanical pres-
sure on the DNA phase. The membrane separates theDNA containing phase from a reservoir salt solution(without PEG) of fixed ion and water activity. Themechanical pressure is equivalent to the osmotic pres-
sure of the PEG in the stress experiment. We assume
that the ion and water activities are the same in thereference reservoir and in the DNA phase and that theexchangeable volume between the two is entirely fromwater, i.e., that the volume ofDNA itself is constant andthat the volume of exchanging ions is very small com-
pared with water. A more complete description of thethermodynamic connection between the osmotic stressand mechanical pressure experiments is given in Leikinet al. (1991).The osmotic stress versus interaxial separation rela-
tions of Fig. 6 are thermodynamic measures of the statefunctions that govern molecule force and assembly.These curves indicate the change in the DNA containingphase free energy dG with experimental variables,specifically osmotic stress and Co3" chemical potentialpLco. With each of these variables there is a correspond-ing conjugate variable, the volume of the DNA phase, V,for the osmotic pressure and the number of bound Co3",or, more precisely, the number of ions associated withthe DNA phase, ncO, for the trivalent ion chemicalpotential. If all other experimental variables, tempera-ture, NaCl activity, etc., are held constant, then thechange in system free energy can be written
dG = VdHI - ncdtco, (2)
where we recognize that aGaIaI = V and aG/lac =
-nc0. Because G is a state function we can immediatelywrite down a Maxwell relation,
(anc0/aH), =J-(aVIa 0)n. (3)
The change in number of Co3" ions associated with theDNA phase can be calculated from,
av anco = f anc =f-f dil = - wfVdHI. (4)a~Lc. a ~LCo
Using the bulk Co3" concentration-independent forcecurve of spontaneously precipitated DNA as a common
reference state, the change in the number of bound Co3"for those force curves with subcritical Co3" concentra-tions that show an abrupt change in spacing and merge
with the spontaneously precipitated force curve is givenby,
Anc. = -d J (V([Co]) - V*) dHI, (5)
where V([Co]) is the water volume associated with a
particular osmotic pressure and subcritical cobalt concen-tration and V* is the corresponding volume for sponta-neously precipitated DNA. The integral is taken fromII = 0 to the pressure at which the two curves superim-pose. Over this bounded region, the integral can betransformed to,
Aflc0 = dp.d f (([Co]) - I* dV. (6)
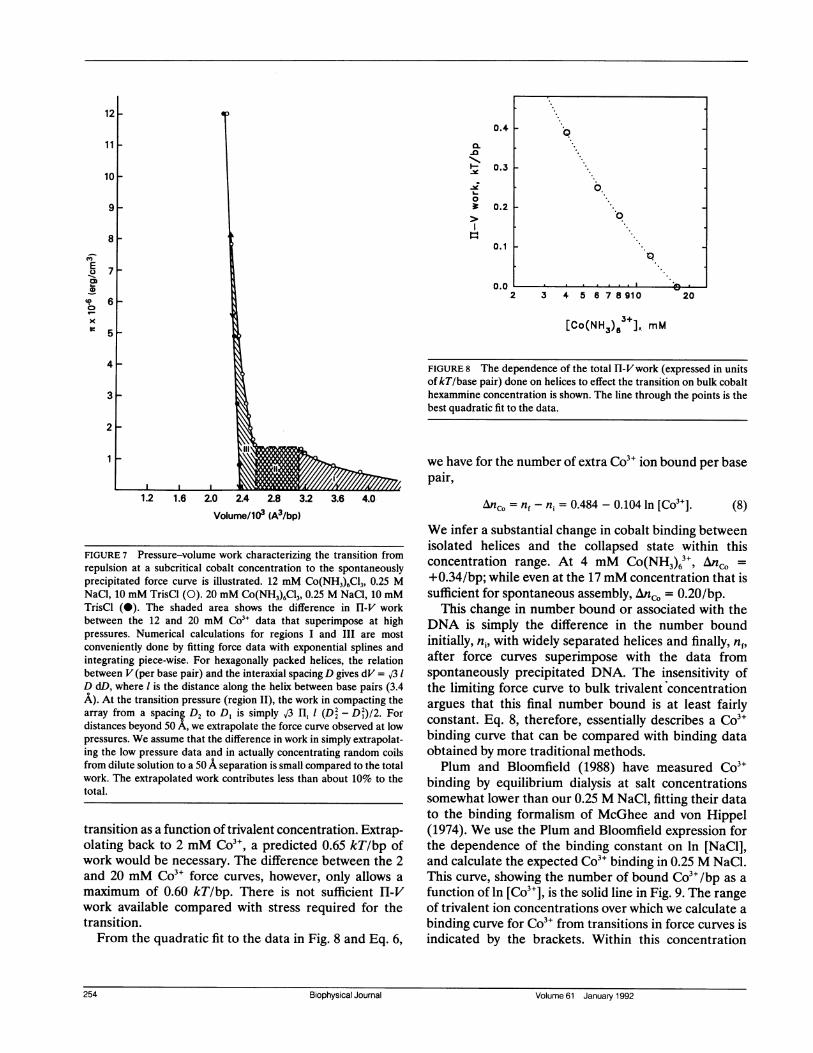
The integral in this equation simply represents thedifference in total Hl-V work done between pushingDNA helices at a subcritical Co3" concentration fromlarge spacing through the abrupt transition to thelimiting force curve at high pressures and pushing DNAhelices spontaneously precipitated with Co3" from theequilibrium separation to the same endpoint. This workdifference is illustrated in Fig. 7 for 12 mM Co(NH3)6C13.The dependence of this work difference on cobaltchemical potential (here assumed as kT ln([Co3+]) atthese salt concentrations) directly gives changes intrivalent ion binding.
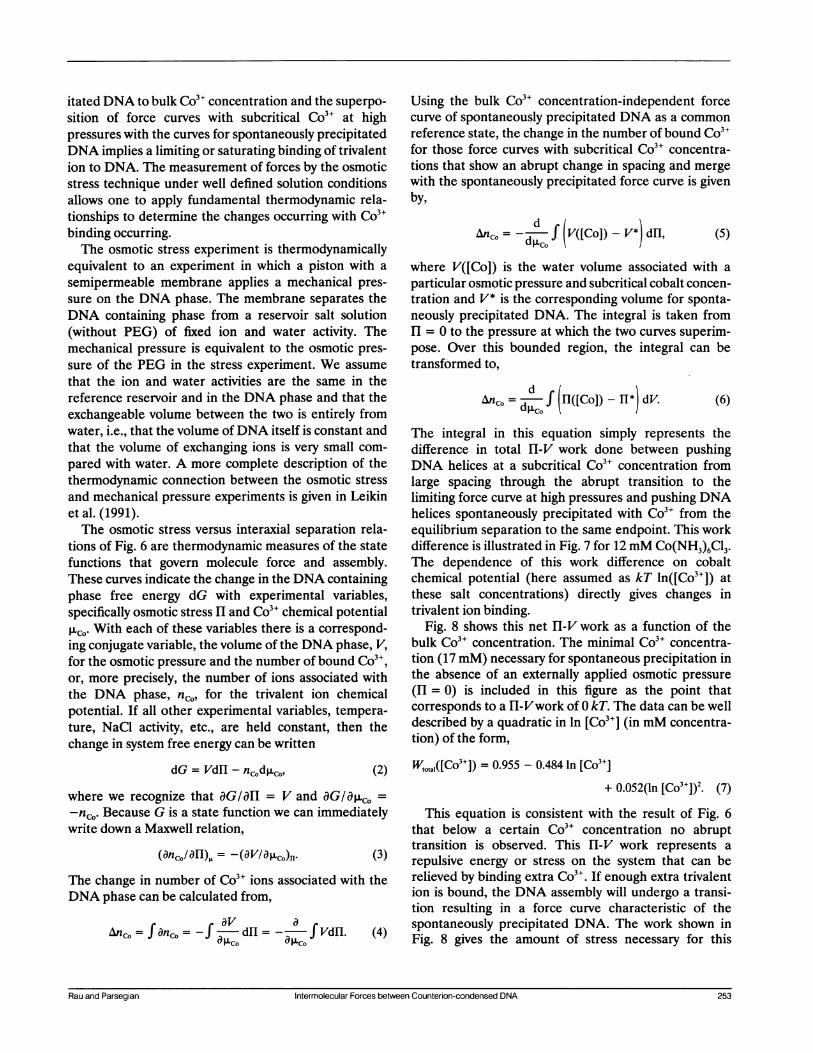
Fig. 8 shows this net Hl-V work as a function of thebulk Co3+ concentration. The minimal Co3+ concentra-tion (17 mM) necessary for spontaneous precipitation inthe absence of an externally applied osmotic pressure
(Hl = 0) is included in this figure as the point thatcorresponds to a Hl-Vwork of 0 kT. The data can be welldescribed by a quadratic in ln [Co3+] (in mM concentra-tion) of the form,
Wtotal([CO3+]) = 0.955 - 0.484 In [Co3+]
+ 0.052(ln [Co3+])2. (7)
This equation is consistent with the result of Fig. 6that below a certain Co3+ concentration no abrupttransition is observed. This fH-V work represents a
repulsive energy or stress on the system that can berelieved by binding extra Co3+. If enough extra trivalention is bound, the DNA assembly will undergo a transi-tion resulting in a force curve characteristic of thespontaneously precipitated DNA. The work shown inFig. 8 gives the amount of stress necessary for this
Rau and Parsegian Intermolecular Forces between Counterion-condensed DNA 253~~~~~~~~~~~~~~~~~~~~~~~~~~~~~~~~~~~~~~~~~~~~~~~~~~~~~~~~~~~~~~~~~~~~~~~~~~~~~~~~~~~~~~~~~~~~~~~~~~~~~~~~~~~~~~~Rau and Parsegian Intermolecular Forces between Counterion-condensed DNA 253
an
.N
L-0
I::
0.4
0.3
0.2
0.1
0.02 3 4 5 6 7 8910 20
[Co(NH3),3], mM
FIGURE 8 The dependence of the total Hl-Vwork (expressed in unitsof kT/base pair) done on helices to effect the transition on bulk cobalthexammine concentration is shown. The line through the points is thebest quadratic fit to the data.
we have for the number of extra Co3" ion bound per basepair,
Volume/103 (A3/bp)
FIGURE 7 Pressure-volume work characterizing the transition fromrepulsion at a subcritical cobalt concentration to the spontaneouslyprecipitated force curve is illustrated. 12 mM Co(NH3)6C13, 0.25 MNaCl, 10 mM TrisCl (0). 20 mM Co(NH3)6C13, 0.25 M NaCl, 10 mMTrisCl (0). The shaded area shows the difference in HI-V workbetween the 12 and 20 mM Co3+ data that superimpose at highpressures. Numerical calculations for regions I and III are mostconveniently done by fitting force data with exponential splines andintegrating piece-wise. For hexagonally packed helices, the relationbetween V (per base pair) and the interaxial spacing D gives dV = 03 1D dD, where 1 is the distance along the helix between base pairs (3.4A). At the transition pressure (region II), the work in compacting thearray from a spacing D2 to D, is simply J3 Ilt 1 (D2 - D2)/2. Fordistances beyond 50 A, we extrapolate the force curve observed at lowpressures. We assume that the difference in work in simply extrapolat-ing the low pressure data and in actually concentrating random coilsfrom dilute solution to a 50 A separation is small compared to the totalwork. The extrapolated work contributes less than about 10% to thetotal.
transition as a function of trivalent concentration. Extrap-olating back to 2 mM Co3", a predicted 0.65 kT/bp ofwork would be necessary. The difference between the 2and 20 mM Co3" force curves, however, only allows a
maximum of 0.60 kT/bp. There is not sufficient H-Vwork available compared with stress required for thetransition.From the quadratic fit to the data in Fig. 8 and Eq. 6,
Anco = nf - ni = 0.484 - 0.104 ln [Co3+]. (8)
We infer a substantial change in cobalt binding betweenisolated helices and the collapsed state within thisconcentration range. At 4 mM Co(NH3)63+, Anc =
+0.34/bp; while even at the 17mM concentration that issufficient for spontaneous assembly, Anc = 0.20/bp.
This change in number bound or associated with theDNA is simply the difference in the number boundinitially, ni, with widely separated helices and finally, nf,after force curves superimpose with the data fromspontaneously precipitated DNA. The insensitivity ofthe limiting force curve to bulk trivalent concentrationargues that this final number bound is at least fairlyconstant. Eq. 8, therefore, essentially describes a Co3+binding curve that can be compared with binding dataobtained by more traditional methods.Plum and Bloomfield (1988) have measured Co3"
binding by equilibrium dialysis at salt concentrationssomewhat lower than our 0.25 M NaCl, fitting their datato the binding formalism of McGhee and von Hippel(1974). We use the Plum and Bloomfield expression forthe dependence of the binding constant on ln [NaCl],and calculate the expected Co3+ binding in 0.25 M NaCl.This curve, showing the number of bound Co3+/bp as afunction of ln [Co3"], is the solid line in Fig. 9. The rangeof trivalent ion concentrations over which we calculate abinding curve for Co3+ from transitions in force curves isindicated by the brackets. Within this concentration
Biophysical Journal Volume 61 January 1992
12
11
10
9.
E-
r-
0.
.0
: 1~~~~~.
*--. I q
1
Biophysical Journal254 Volume 61 January 1992
0.6
0.5
0.40.
0.3
0.2
0.1
0.010
[Co ], mM
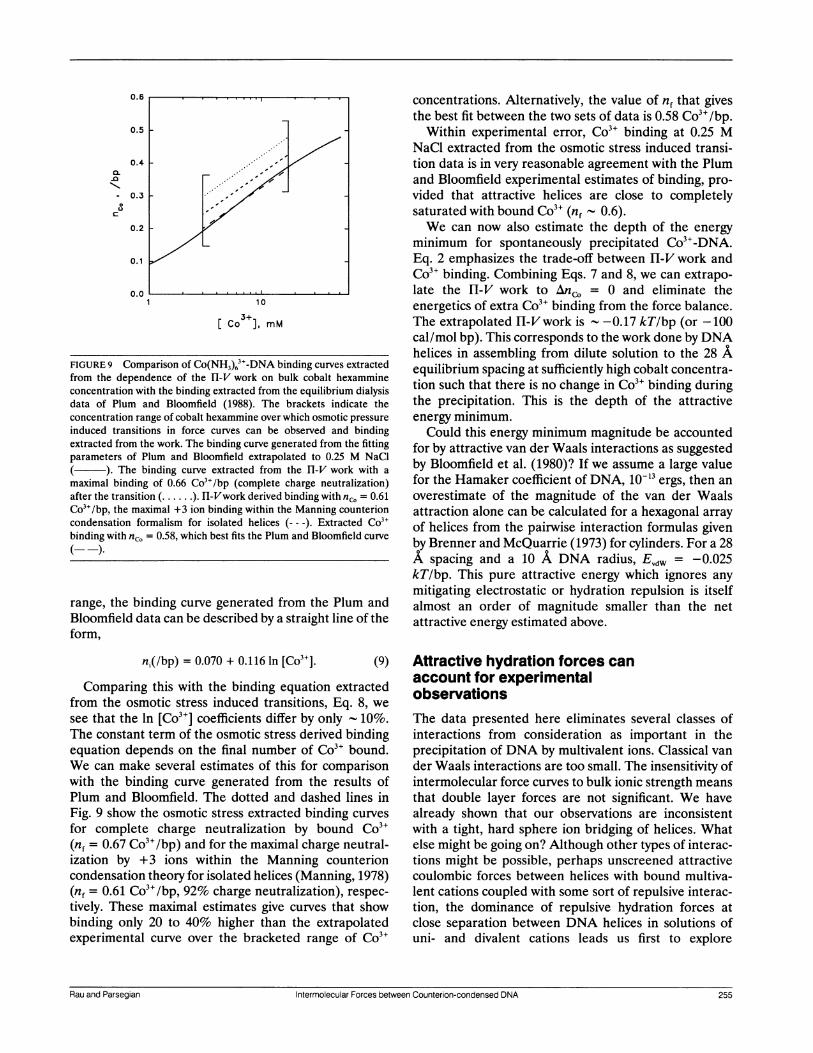
FIGURE 9 Comparison of Co(NH3)63+-DNA binding curves extractedfrom the dependence of the H-V work on bulk cobalt hexammineconcentration with the binding extracted from the equilibrium dialysisdata of Plum and Bloomfield (1988). The brackets indicate theconcentration range of cobalt hexammine over which osmotic pressureinduced transitions in force curves can be observed and bindingextracted from the work. The binding curve generated from the fittingparameters of Plum and Bloomfield extrapolated to 0.25 M NaCl
). The binding curve extracted from the Il-V work with amaximal binding of 0.66 Co3+/bp (complete charge neutralization)after the transition (......). Hl-Vwork derived binding with nc. = 0.61Co3+/bp, the maximal +3 ion binding within the Manning counterioncondensation formalism for isolated helices (--- ). Extracted Co3+binding with nc. = 0.58, which best fits the Plum and Bloomfield curve
range, the binding curve generated from the Plum andBloomfield data can be described by a straight line of theform,
ni(/bp) = 0.070 + 0.116 In [Co3+]. (9)
Comparing this with the binding equation extractedfrom the osmotic stress induced transitions, Eq. 8, wesee that the In [Co3"] coefficients differ by only 10%.The constant term of the osmotic stress derived bindingequation depends on the final number of Co3" bound.We can make several estimates of this for comparisonwith the binding curve generated from the results ofPlum and Bloomfield. The dotted and dashed lines inFig. 9 show the osmotic stress extracted binding curves
for complete charge neutralization by bound Co3"(nf = 0.67 Co3+/bp) and for the maximal charge neutral-ization by +3 ions within the Manning counterioncondensation theory for isolated helices (Manning, 1978)(nf = 0.61 Co3+/bp, 92% charge neutralization), respec-
tively. These maximal estimates give curves that showbinding only 20 to 40% higher than the extrapolatedexperimental curve over the bracketed range of Co3`
concentrations. Alternatively, the value of nf that givesthe best fit between the two sets of data is 0.58 Co3+/bp.
Within experimental error, Co3" binding at 0.25 MNaCl extracted from the osmotic stress induced transi-tion data is in very reasonable agreement with the Plumand Bloomfield experimental estimates of binding, pro-
vided that attractive helices are close to completelysaturated with bound Co3" (nf 0.6).We can now also estimate the depth of the energy
minimum for spontaneously precipitated Co3`-DNA.Eq. 2 emphasizes the trade-off between H-V work andCo3" binding. Combining Eqs. 7 and 8, we can extrapo-late the fl-V work to Anco = 0 and eliminate theenergetics of extra Co3" binding from the force balance.The extrapolated HI-Vwork is - -0.17 kTlbp (or -100cal/mol bp). This corresponds to the work done by DNAhelices in assembling from dilute solution to the 28 Aequilibrium spacing at sufficiently high cobalt concentra-tion such that there is no change in Co3" binding duringthe precipitation. This is the depth of the attractiveenergy minimum.Could this energy minimum magnitude be accounted
for by attractive van der Waals interactions as suggestedby Bloomfield et al. (1980)? If we assume a large valuefor the Hamaker coefficient of DNA, 10-3 ergs, then an
overestimate of the magnitude of the van der Waalsattraction alone can be calculated for a hexagonal arrayof helices from the pairwise interaction formulas givenby Brenner and McQuarrie (1973) for cylinders. For a 28A spacing and a 10 A DNA radius, Evdw = -0.025kTlbp. This pure attractive energy which ignores anymitigating electrostatic or hydration repulsion is itselfalmost an order of magnitude smaller than the netattractive energy estimated above.
Attractive hydration forces canaccount for experimentalobservationsThe data presented here eliminates several classes ofinteractions from consideration as important in theprecipitation of DNA by multivalent ions. Classical van
der Waals interactions are too small. The insensitivity ofintermolecular force curves to bulk ionic strength meansthat double layer forces are not significant. We havealready shown that our observations are inconsistentwith a tight, hard sphere ion bridging of helices. Whatelse might be going on? Although other types of interac-tions might be possible, perhaps unscreened attractivecoulombic forces between helices with bound multiva-lent cations coupled with some sort of repulsive interac-tion, the dominance of repulsive hydration forces atclose separation between DNA helices in solutions ofuni- and divalent cations leads us first to explore
Rau and Parsegian Intermolecular Forces between Counterion-condensed DNARau and Parsegian Intermolecular Forces between Counterion-condensed DNA 255
alternate hydration force schemes, in particular attrac-tive hydration forces. The major difference betweenrepulsive forces in NaCl, for example, and the residualrepulsive force seen with multivalent ion assembledDNA is the factor of two change in exponential decaylengths. We have previously argued that attractive hydra-tion forces are important for the forces between lipidbilayers (Rand et al., 1988; Kornyshev and Leikin, 1989)and have shown that this factor of two is a naturalconsequence of attractive hydration interactions.The hydration force formalism developed by Marcelja
and co-workers (e.g., Marcelja and Radic, 1976; Gruenet al., 1983) assumes that a hydrating surface perturbs insome way the water in contact with that surface. Thisperturbation is propagated through water-water interac-tions into the bulk solution. The decay length for thepropagation is taken as -3 A to connect with experi-ment. Repulsive hydration forces result from a symmet-ric overlap of perturbed hydration atmospheres as twosurfaces approach. It is convenient for us to picture theperturbation as a polarization of water bound to thesurface. The propagation of this structuring perturba-tion into the solution is then due to the hydrogenbonding of this water in successive layers. In a simple-minded way, when two surfaces that polarize water inthe same way approach, the overlapping perturbedwater polarizations disrupt the hydrogen bonding net-work water prefers. Analogously, if two surfaces withcomplementary water structures (the surfaces polarizeor structure water in opposite directions) approach,then a hydrogen bonding network from one surface tothe other is reinforced (e.g., see Rand et al., 1988).Attractive hydration forces result.
Real surfaces are not so homogeneous. Water is notstructured the same way on all parts of the surface. Thevarious chemical groups on a real polymer will orientwater differently. It is possible that two approachingsurfaces have some apposing patches that are attractiveand others that are repulsive. With Co3" precipitatedDNA, for example, apposing attractive patches could bea bound Ca3" on one helix opposite a phosphate groupon the other. Within the linear approximation used byMarcelja and Radic (1976), the net force betweensurfaces is just the sum of the two contributions.For cylindrical geometry, the hydration free energy
per base pair from pushing purely repulsive surfacesfrom infinite separation to a spacing D and the osmoticpressure atD are,
AGhyd(D)=
2ilX2 Pr2KO(D/2X)
Ko(aIX) (Ko(a/X)IO(DI2X) - KO(DI2X)Io(a/X))
HI(D) =
[(KO(al X)IO(D12A) - K(Dl2X)IO(a/ ))2]where p2 is a measure of the strength of the repulsivewater structuring on the two surfaces; 1, the distancealong the helix between base pairs (3.4 A for B-formDNA); a, the radius of the DNA cylinder (10 A), X theexponential decay length for the propagation of thewater structuring; and the I and K functions are modi-fied Bessel functions.The corresponding free energy difference and osmotic
pressure for surfaces with both attractive and repulsiveapposing patches are given by,
27rrlX2 [Pr2K0(D/2X)AGhyd(D) =Ko(al/ ) [(Ko(a1X)IO(D/2X) - KO(DI2X)IO(a/X))
P2K,(DI2X) 1 (12)
(K1(D/2X)Io(a/X) + KO(a/X)I(D/2X))J
HI(D) = (2A/D)2L(KO(aIX)Io(D/2X) - KO(D/2X)IO(a/A))2
(K,(D/2X)IO(a /X) + KO(a/X)II(D/2X))2 (1)
where p2 is a measure of the magnitude of the surfacehydration perturbation that results in attraction. If p2 >p2, there is predicted an energy minimum at some finitecylinder separation, Deq. At this spacing, the ratio of theperturbation magnitudes for the attractive and repulsivepatches is given by,
P. .Ki(Deq/2X)Io(a /A) + KO(a/X)II(Deq/2X)]2P LKo(a /X)IO(Deq/2X) - KO(Deq/2X)IO(a /X)]
(14)
At large separations, the modified Bessel functionscan be approximated by exponentials. Retaining onlythe two lowest order exponential terms, we have for Eq.13,
4(p2 _p'2) 2zP + P2)1(D) D e( ) + eDe 2D-)/A (15)
The first term on the right hand side describes theattractive force approaching the energy well from largerseparations. It is exponential with decay length X. Thesecond term dominates the force for pushing helicescloser than the equilibrium separation, the residualrepulsive force. Again, this is an exponentially varyingforce but with half the decay length, X/2, of the attrac-tive term. This second-order term can be considered an
image charge repulsion (Kornyshev and Leikin, 1989), a
256 Biophysical Journal Volume 61 January 1992
p2r
256 Biophysical Journal Volume 61 January 1992
change in solvation energy due to the stwater by neighboring helices.The magnitude of the attractive hydrn
ponent is associated with the order parais a measure of the solvent organizininteracting surfaces. The strength of 2
mediated by bound polyvalent ions willability of the polyvalent to bind and orgavicinity. The qualitative correlation of Ifor trivalents might rationalized in ternin water organizing power due to ion sizein Deq between Co3" and Mg2" at 25% medue to a difference in water structurin,charge difference.
Within this theoretical framework,separation and the magnitude and exponiistics of the residual repulsive force a
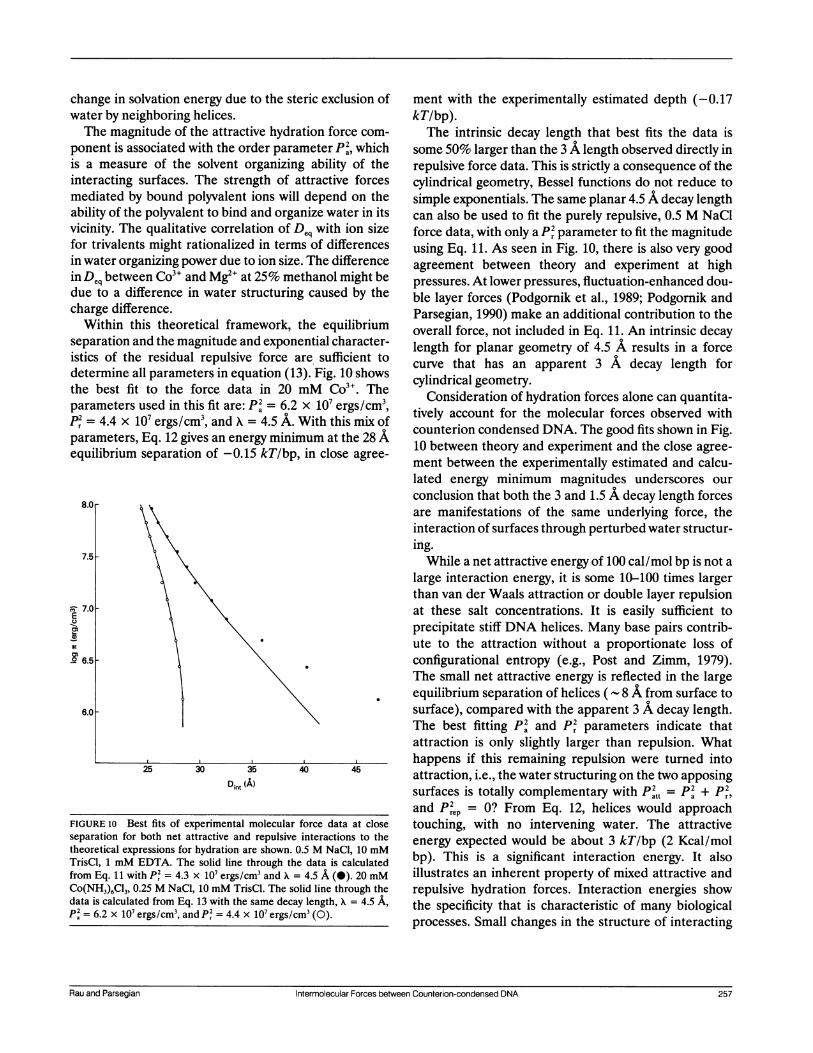
determine all parameters in equation (1the best fit to the force data in 20parameters used in this fit are: p2 = 6.2P2 = 4.4 x 10⁷ ergs/cm3, and A = 4.5 A.
parameters, Eq. 12 gives an energy minirequilibrium separation of -0.15 kT/bp
8.0r
7.5
7.0hE0,C
0'
0
cn
Q 6.5
6.0F
25 30 35
Dint (A)
FIGURE 10 Best fits of experimental molecularseparation for both net attractive and repulsivetheoretical expressions for hydration are shown. (TrisCl, 1 mM EDTA. The solid line through thtfrom Eq. 11 with P2 = 4.3 x 10' ergs/cm3 and A =Co(NH3)6C13, 0.25 M NaCI, 10 mM TrisCl. The scdata is calculated from Eq. 13 with the same decaa= 6.2 x 10' ergs/cm3, and P2 = 4.4 x 10' ergs/c
eric exclusion of ment with the experimentally estimated depth (-0.17kTlbp).
ation force com- The intrinsic decay length that best fits the data ismeter P2, which some 50% larger than the 3 A length observed directly invg ability of the repulsive force data. This is strictly a consequence of theattractive forces cylindrical geometry, Bessel functions do not reduce todepend on the simple exponentials. The same planar 4.5 A decay length
Lnize water in its can also be used to fit the purely repulsive, 0.5 M NaCl
Deq with ion size force data, with only a P2 parameter to fit the magnitudeis of differences using Eq. 11. As seen in Fig. 10, there is also very good
The difference agreement between theory and experiment at highthanol might be pressures. At lower pressures, fluctuation-enhanced dou-g caused by the ble layer forces (Podgornik et al., 1989; Podgornik and
the equilibriumParsegian, 1990) make an additional contribution to the
,ential chabracter overall force, not included in Eq. 11. An intrinsic decayential character- length for planar geometry of 4.5 A results in a force
Ffig.10 shows curve that has an apparent 3 A decay length for3+ig cylindrical geometry.mM Co . The Consideration of hydration forces alone can quantita-
With this mix f tively account for the molecular forces observed with
mum at the 28 A counterion condensed DNA. The good fits shown in Fig.10 between theory and experiment and the close agree-,in close agree- ment between the experimentally estimated and calcu-
lated energy minimum magnitudes underscores our
conclusion that both the 3 and 1.5 A decay length forcesare manifestations of the same underlying force, theinteraction of surfaces through perturbed water structur-ing.While a net attractive energy of 100 cal/mol bp is not a
large interaction energy, it is some 10-100 times largerthan van der Waals attraction or double layer repulsionat these salt concentrations. It is easily sufficient toprecipitate stiff DNA helices. Many base pairs contrib-ute to the attraction without a proportionate loss ofconfigurational entropy (e.g., Post and Zimm, 1979).The small net attractive energy is reflected in the largeequilibrium separation of helices (- 8 A from surface to
surface), compared with the apparent 3 A decay length.The best fitting p2 and p2 parameters indicate thatattraction is only slightly larger than repulsion. Whathappens if this remaining repulsion were turned intoattraction, i.e., the water structuring on the two apposingsurfaces is totally complementary with P2 = p2 + p2,and P2 = 0? From Eq. 12, helices would approach
force data at close touching, with no intervening water. The attractiveinteractions to the energy expected would be about 3 kT/bp (2 Kcal/mol
e data is calculated bp). This is a significant interaction energy. It also= 4.5 A (0). 20 mM illustrates an inherent property of mixed attractive andlid line through the repulsive hydration forces. Interaction energies showy length, = 4.5 A, the specificity that is characteristic of many biologicalI
processes. Small changes in the structure of interacting
Rau and Parsegian Intermolecular Forces between Counterion-condensed DNA 257Rau and Parsegian Intermolecular Forces between Counterion-condensed DNA 257
surfaces can cause large changes in the interactionenergy.For all its frustrating noncommittal to any physical
model, the order parameter formalism does have theremarkable property of capturing the essential spirit ofall second order perturbation theories. The relevantequations for scalar parameters are completely isomor-phous to the Debye Huckel theory of weak electrostaticdouble layer potentials, where the role of order parame-ter is played by the electric field. The boundary condi-tions used by Marcelja and Radic (1976) are equivalentto constant charge surfaces, while those of Cevc et al.(1982) to constant potential. In some ways the attractioninferred from this model, sites of "positive" polarizationdue to adsorption of polyvalent cations opposite"negatively" polarized sites of unbound fixed phos-phates, is a kind of charge pairing or salt bridge. But thephysical mechanism apparent in the force law mustdiffer from the Coulombic interaction in a continuumdielectric medium. Real solvent must be restructured inquite a different way.
Received for publication 3 May 1991 and in final forn26 July 1991.
REFERENCES
Allison, S. A., J. C. Herr, and J. M. Schurr. 1981. Structure of virial 429DNAcondensed by simple triamines: a light-scattering and electron-microscopy study. Biopolymers. 20:469-488.
Bloomfield, V. A., R. W. Wilson, and D. C. Rau. 1980. Comparison ofpolyelectrolyte theories of binding of cations to DNA. Biophys.Chem. 11:339-343.
Brenner, S. L., and D. A. McQuarrie. 1973. Force balances in systemsof cylindrical polyelectrolytes. Biophys. J. 13:301-331.
Cevc, G., R. Podgornik, and B. Zeks. 1982. The free energy, enthalpy,and entropy of phospholipid bilayer membranes and their depen-dence on the interfacial separation. Chem. Phys. Lett. 91:193-196.
Chattoraj, D. K., L. C. Gosule, and J. A. Schellman. 1978. DNAcondensation with polyamines II. Electron microscopic studies. J.Mol. Biol. 121:327-337.
Gosule, L. C., and J. A. Schellman. 1978. DNA condensation withpolyamines I. Spectroscopic studies. J. Mol. Biol. 121:311-326.
Gruen, D. W. R., S. Marcelja, and V. A. Parsegian. 1984. Waterstructure near the membrane surface. In Cell Surface Dynamics,Concepts and Models. A. Perelson, K. Wiegel, and C. Delisi,editors. Marcel Dekker, New York. 59-91.
Herskovits, T. T., and J. Brahms. 1976. Structural investigations onDNA-protamine complexes. Biopolymers. 15:687-706.
Horn, R. G., J. N. Israelachvili, J. Marra, V. A. Parsegian, R. P. Rand.1988. Comparison of forces measured between phosphatidylcholinebilayers. Biophys. J. 54:1185-1187.
Knoll, D. A., M. G. Fried, and V. A. Bloomfield. 1988. Heat-inducedDNA aggregation in the presence of divalent metal salts. InStructure & Expression, Vol. 2, DNA and Its Drug Complexes.
R. H. Sarma and M. H. Sarma, editors. Adenine Press, New York.123-145.
Kornyshev, A. A., and S. Leikin. 1989. Fluctuation theory of hydrationforces: the dramatic effects of inhomogeneous boundary conditions.Phys. Rev. A 40:6431-6437.
Leikin, S., D. C. Rau, and V. A. Parsegian. 1991. Measured entropyand enthalpy of water as a function of distance between DNAdouble helices. Phys. Rev. A. 44:5272-5278.
Manning, G. S. 1978. The molecular theory of polyelectrolyte solutionswith applications to the electrostatic properties of polynucleotides.Quart. Rev. Biophys. 11:179-246.
Marcelja, S., and N. Radic. 1976. Repulsion of interfaces due toboundary water. Chem. Phys. Lett. 42:129-130.
McGhee, J. D., and P. H. von Hippel. 1974. Theoretical aspects ofDNA-protein interactions: Cooperative and noncooperative bind-ing of large ligands to a one-dimensional homogeneous lattice. J.Mol. Biol. 86:469-486.
McGhee, J. D., W. I. Wood, M. Dolan, J. D. Engel, and G. Felsenfeld.1981. A 200 base pair region at the 5' end of the chicken adult3-globin gene is accessible to nuclease digestion. Cell. 27:45-55.
Mudd, C. P., H. Tipton, V. A. Parsegian, and D. C. Rau. 1987.Temperature-controlled vacuum chamber for x-ray diffraction stud-ies. Rev. Sci. Instrum. 58:2110-2114.
Parsegian, V. A., R. P. Rand, and D. C. Rau. 1985. Hydration forces:what next? Chem. Scr. 25:28-31.
Parsegian, V. A., R. P. Rand, N. L. Fuller, and D. C. Rau. 1986.Osmotic stress for the direct measurement of intermolecular forces.Methods Enzymol. 127:400-416.
Parsegian, V. A., R. P. Rand, and D. C. Rau. 1987. Lessons from thedirect measurement of forces between biomolecules. In Physics ofComplex and Supermolecular Fluids. S. A. Safran and N. A. Clark,editors. John Wiley and Sons, New York. 115-135.
Plum, G. E., and V. A. Bloomfield. 1988. Equilibrium dialysis study ofhexammine cobalt (III) to DNA. Biopolymers. 27:1045-1051.
Podgornik, R., D. C. Rau, and V. A. Parsegian. 1989. The action ofinterhelical forces on the organization of DNA double helices:fluctuation-enhanced decay of electrostatic double-layer and hydra-tion forces. Macromol. 22:1780-1786.
Podgornik, R., and V. A. Parsegian. 1990. Molecular fluctuations inthe packing of polymeric liquid crystals. Macromol. 23:2265-2269.
Post, C. B., and B. H. Zimm. 1979. Internal condensation of a singleDNA molecule. Biopolymers. 18:1487-1501.
Prouty, M. S., A. N. Schechter, and V. A. Parsegian. 1985. Chemicalpotential measurements of deoxyhemoglobin S polymerization:determination of the phase diagram of an assembling protein. J.Mol. Biol. 184:517-528.
Rand, R. P. 1981. Interacting phospholipid bilayers: measured forcesand induced structural changes. Annu. Rev. Biophys. Bioeng. 10:277-314.
Rand, R. P., N. Fuller, V. A. Parsegian, and D. C. Rau. 1988. Variationin hydration forces between neutral phospholipid bilayers: evidencefor hydration attraction. Biochemistry. 27:7711-7722.
Rand, R. P., and V. A. Parsegian. 1989. Hydration forces betweenphospholipid bilayers. Biochim. Biophys. Acta. 988:351-376.
Rand, R. P., N. L. Fuller, S. M. Gruner, and V. A. Parsegian. 1990.Membrane curvature, lipid segregation, and structural transitionsfor phospholipids under dual-solvent stress. Biochemistry. 29:76-87.
Rau, D. C., B. K. Lee, and V. A. Parsegian. 1984. Measurement of therepulsive force between polyelectrolyte molecules in ionic solution:
258 Biophysical Journal Volume 61 January 1992
hydration forces between parallel DNA double helices. Proc. Natl.Acad. Sci. USA. 81:2621-2625.
Rau, D. C., and V. A. Parsegian. 1992. Direct measurement oftemperature-dependent solvation between DNA double helices.Biophys. J. 61:260-271.
Rau, D. C., and V. A. Parsegian. 1990. Direct measurement of forcesbetween linear polysaccharides: Xanthan and schizophyllan. Science(Wash. DC). 249:1278-1281.
Record, M. T., C. F. Anderson, and T. M. Lohman. 1978. Thermody-namic analysis of ion effects on the binding and conformationalequilibria of proteins and nucleic acids: the roles of ion associationor release, screening, and ion effects on water activity. Quart. Rev.Biophys. 11: 103-178.
Schellman, J. A., and N. Parthasarathy. 1984. X-ray diffraction studieson cation-collapsed DNA. J. Mol. Bio. 175:313-329.
Suau, P., and J. A. Subirana. 1977. X-ray diffraction studies ofnucleoprotamine structure. J. MoL Biol. 117:909-926.
Suwalsky, M., and W. Traub. 1972. A comparative x-ray study of anucleoprotamine and DNA complexes with polylysine and polyargi-nine. Biopolymers. 11:2223-2231.
Widom, J., and R. L. Baldwin. 1980. Cation-induced toroidal conden-sation of DNA: studies with Co3"(NH3)6. J. Mol. Biol. 144:431-453.
Widom, J., and R. L. Baldwin. 1983. Monomolecular condensation ofX-DNA induced by cobalt hexammine. Biopolymers. 22:1595-1620.
Wilson, R. W., and V. A. Bloomfield. 1979. Counterion-inducedcondensation of deoxyribonucleic acid. A light scattering study.Biochemistry. 18:2192-2196.
Zimmerberg, J., and V. A. Parsegian. 1986. Polymer inaccessiblevolume changes during opening and closing of a voltage-dependentionic channel. Nature (Lond.). 323:36-39.
Rau and Parsegian Intermolecular Forces between Counterion-condensed DNA 259