Dip Cracking in Ni-base Alloys THESIS Prese - OhioLINK ETD ...
136
Optimization and Application of the Strain-To-Fracture Test for Studying Ductility- Dip Cracking in Ni-base Alloys THESIS Presented in Partial Fulfillment of the Requirements for the Degree Master of Science in the Graduate School of The Ohio State University By Verner C. Kreuter V Graduate Program in Welding Engineering The Ohio State University 2015 Master's Examination Committee: Professor John C. Lippold, Advisor Dr. Boian Alexandrov
-
Upload
khangminh22 -
Category
Documents
-
view
0 -
download
0
Transcript of Dip Cracking in Ni-base Alloys THESIS Prese - OhioLINK ETD ...

Optimization and Application of the Strain-To-Fracture Test for Studying Ductility-
Dip Cracking in Ni-base Alloys
THESIS
Presented in Partial Fulfillment of the Requirements for the Degree Master of Science in
the Graduate School of The Ohio State University
By
Verner C. Kreuter V
Graduate Program in Welding Engineering
The Ohio State University
2015
Master's Examination Committee:
Professor John C. Lippold, Advisor
Dr. Boian Alexandrov

Copyright by
Verner C. Kreuter V
2015

ii
Abstract
The use of non-ferrous alloys in the nuclear power industry has increased over the
past several decades due to industry demands for improved materials properties.
Specifically, Inconel Alloy-690 and matching filler metal, FM-52, have been developed
with an increased Cr-content (28-30 wt. %), which has demonstrated improved properties
in corrosive environments. The development of high-Cr, Ni-base alloys has however, led
to weldability concerns, such as ductility-dip cracking, that have challenged
manufacturers and users of these consumables.
Concerns with ductility-dip cracking in FCC materials has led to the development
of the Strain-To-Fracture test at Ohio State, which is a weldability test designed to
quantify DDC susceptibility in austenitic materials. A Gleeble® 3800 is used to generate
a thermo-mechanical response cycle in which a material is isolated within the ductility
dip temperature range, and subsequently strained to a desired level. Due to variability in
the testing environment and the desire to employ Ni-alloy and FM’s in the STF test, a
“re-optimization” study was conducted to ensure parameters were in a robust region that
would produce repeatable results. Insights into DDC mechanisms were also made by
studying commonly used Ni-alloys with compositional/microstructural variations as well
as specimens that were generated with various fabrication methods. It was determined
that composition has a large influence on DDC performance, and “pure” materials tend to
be most susceptible. Also, fabrication method does appear to have some influence over

iii
DDC formation in heats of FM-52M. A digital image correlation study was also
conducted to confirm strain levels in sample gauge sections.

iv
Dedication
To my loving parents, for their support and guidance has shown me what is possible
through patience, passion, and perseverance, and that doing what you love is a privilege
that should not be taken for granted. For that and many other things, I am extremely
grateful.

v
Acknowledgments
First and foremost, I would like to express my sincerest gratitude to my advisor,
Dr. John Lippold, for the continuous support, patience, guidance, and encouragement I
have received throughout my graduate studies at The Ohio State University. John’s keen
understanding of welding metallurgy contributed tremendously to my graduate
experience, and allowed my work to excel to an otherwise unachievable level.
I would also like to thank Dr. Boian Alexandrov for giving me the opportunity to
extend my knowledge as a member of the Welding and Joining Metallurgy Group as an
undergraduate student. This opportunity fueled my interest in welding research and
became a decisive factor in choosing to continue my education as a graduate student.
I would like to thank the Electric Power Research Institute, especially Steve
McCracken, for sponsoring this work and allowing me the opportunity to take part in
such interesting work.
Lastly, I would like to thank my fellow graduate students for their guidance and
support throughout my years in the welding metallurgy lab. I would especially like to
thank Adam Hope for his mentorship and assistance that was provided for this work.

vi
Vita
August 22, 1991 .............................................Born. Rochester, NY
June 2009 .......................................................Graduate Webster Thomas High School in
Webster, NY
May 5, 2009 ...................................................B.S. Welding Engineering, The Ohio State
University
Publications
Ductility Dip Cracking Susceptibility of Commercially Pure Ni, and Ni-Base Alloys
Utilizing the Strain-to-Fracture Test, BAM Conference, Berlin, Germany, 2014, V. C.
Kreuter V and J. C. Lippold
Fields of Study
Major Field: Welding Engineering

vii
Table of Contents Abstract ............................................................................................................................... ii
Dedication .......................................................................................................................... iv
Acknowledgments............................................................................................................... v
Vita ..................................................................................................................................... vi
Publications ........................................................................................................................ vi
Fields of Study ................................................................................................................... vi
Table of Contents ............................................................................................................ vii
List of Tables ..................................................................................................................... xi
List of Figures .................................................................................................................. xiii
Chapter 1: Introduction ....................................................................................................... 1
Chapter 2: Background ....................................................................................................... 6
2.1 Ductility Dip Cracking Definition............................................................................. 6
2.2 Ductility Dip Cracking in Ni-base Alloys ................................................................. 7
2.3 Ductility Dip Cracking: Microstructural Characteristics ........................................ 11
2.4 Ductility Dip Cracking Formation in Various Ni-base Alloys and Filler Metals ... 18
2.5 DDC Mechanisms ................................................................................................... 19
2.6 STF Testing Method................................................................................................ 21

viii
Chapter 3: Objectives ........................................................................................................ 28
Chapter 4: Experimental Approach .................................................................................. 30
Chapter 5: Experimental Procedure .................................................................................. 33
5.1 Materials .................................................................................................................. 33
5.1.1 Base Metal Compositions ................................................................................. 33
5.1.2 Ni-base Filler Metals ........................................................................................ 35
5.2 STF Re-Optimization .............................................................................................. 36
5.2.1 GTA Spot Weld Parameter Optimization ......................................................... 37
5.2.2 STF Optimization ............................................................................................. 39
5.3 Sample Preparation ................................................................................................. 42
5.3.1 Heat Treatments ................................................................................................ 43
5.3.2 Oxygen Additions ............................................................................................. 44
5.3.3 Limited Material Sample Preparation ............................................................... 45
5.3.4 STF Digital Image Correlation ......................................................................... 46
5.4 Round Robin Sample Fabrication and Preparation ................................................. 47
5.4.1 WSI/AZZ Sample Fabrication .......................................................................... 48
5.4.2 Special Metals Sample Fabrication .................................................................. 51
5.4.3 EPRI Sample Fabrication ................................................................................. 53
5.5 Sample Characterization ......................................................................................... 54

ix
5.5.1 Optical Microscopy .......................................................................................... 54
5.5.2 Scanning Electron Microscope ......................................................................... 55
Chapter 6: Results and Discussion ................................................................................ 57
6.1 Phase I: STF Parameter “Re-Optimization”............................................................ 58
6.1.1 GTA Spot Weld Optimization .......................................................................... 59
6.1.2 Gleeble Parameter Optimization ...................................................................... 65
6.2 Phase II: Insight to DDC Mechanism ..................................................................... 73
6.2.1 STF Testing of Various Ni-base Alloys ........................................................... 74
6.2.2 Alloy 200 .......................................................................................................... 75
6.2.3 Inconel Alloy-600 ............................................................................................. 79
6.2.4 Inconel Alloy-625 ............................................................................................. 81
6.2.5 The Effect of Oxygen on DDC susceptibility .................................................. 84
6.2.6 STF Sample Heat Treatments ........................................................................... 85
Phase III: 6.3 STF Round Robin Study ......................................................................... 88
6.3.1 NX4720TK ....................................................................................................... 89
6.3.2 NX5213TK ....................................................................................................... 91
6.3.3 EXOA51P ......................................................................................................... 93
6.3.4 Compiled Round Robin Results ....................................................................... 95
6.3.5 Effect of Oxygen Concentration on STF Round Robin Study ....................... 101

x
Phase IV: 6.4 “New” STF Testing Procedure ............................................................. 103
Phase V: STF Digital Image Correlation .................................................................... 105
Chapter 7: Conclusions ................................................................................................ 108
Chapter 8: Recommended Future Work .................................................................... 112
References ................................................................................................................... 115
Appendix A .................................................................................................................... 118
Gleeble QuickSim Program for STF Test ............................................................... 118

xi
List of Tables
Table 1: Historically Significant DDC Studies in Ni-base Alloys and FM’s. .................. 19
Table 2: Theorized DDC Mechanisms Summary ............................................................. 21
Table 3: GTA Spot Weld parameter schedule for STF testing method ............................ 24
Table 4: Compositional data (wt. %) for Ni-base materials used in the presented STF
study. ................................................................................................................................. 35
Table 5: Ni-base FM, FM-52M, compositional data (wt. %) for the 3 heats used in the
round robin study (NX4720TK, EXOA51P, NX5213TK). .............................................. 36
Table 6: STF optimization parameter schedules for GTA spot weld. .............................. 38
Table 7: Gleeble parameters used during the spot weld optimization study. ................... 39
Table 8: Gleeble-based parameters for the STF testing procedure, developed by Nissley
[15]. ................................................................................................................................... 40
Table 9: Gleeble parameter optimization schedules for INCONEL Alloy-600. .............. 42
Table 10: Gleeble parameter optimization schedules for INCONEL Alloy-690. ............ 42
Table 11: Heat treatment schedules used on STF samples in Phase II. ............................ 44
Table 12: Weld procedure specification for the fabrication of STF samples in the round
robin study. ....................................................................................................................... 48
Table 13: Parameters associated with the fabrication of WSI’s STF samples. ................ 50
Table 14: GTAW spot welding schedule. Highlighted values indicate variables that were
examined in the optimization study. ................................................................................. 61

xii
Table 15: Spot welding DOE used in optimization study for Inconel Alloy-690
specimens. ......................................................................................................................... 64
Table 16: Gleeble DOE during the optimization study for Inconel Alloy-600. ............... 70
Table 17: Gleeble optimization test runs for Inconel Alloy-690. ..................................... 72
Table 18: Sample heat treatment schedules employed in Phase II STF testing, including
grain size measurements in the spot weld microstructure after GTA spot welds were
generated in sample gauge sections. ................................................................................. 87
Table 19: Round robin STF data for FM-52M heat NX4720TK...................................... 91
Table 20: Round robin STF data for FM-52M heat NX5213TK...................................... 93
Table 21: Round robin STF results for FM-52M, heat EXOA51P................................... 95
Table 22: Complied STF results for round robin testing .................................................. 96
Table 23: Round robin STF data comparing a 98Ar/2O2 shielding gas mixture and a
100Ar shielding gas during the GTA spot weld stage of the STF test. .......................... 102
Table 24: STF data for the “new” STF testing procedure, allowing testing of material in
limited concentrations. .................................................................................................... 105

xiii
List of Figures
Figure 1: Ductility-temperature profile of an alloy that undergoes ductility-dip
phenomena [8]. ................................................................................................................... 8
Figure 2: Ductility-temperature curve representing the relationship between restraint and
crack susceptibility [8]. ..................................................................................................... 10
Figure 3: Representation of solidification microstructure present in single phase austenitic
weld metals, exhibiting grain boundary migration [36].................................................... 12
Figure 4: Photomicrograph of a ductility-dip crack along a migrated grain boundary in a
thick section weldment of filler metal 52 (FM52). Arrows represent the onset of
recrystallization due to high local strain concentrations at these boundaries [41]. .......... 14
Figure 5: Strain distribution map of FM 52 heated to 986ºC and strained at 2.6%. Thin
lines represent high angle boundaries. Black is open cracks present in the WM. Color is
strain distribution with blue being lowest and red being highest [34]. ............................. 15
Figure 6: SEM photomicrographs of WM MGBs in a) FM82 showing pinning via MC
carbides (arrows) and b) FM52 [9, 23]. ............................................................................ 17
Figure 7: STF sample geometry. ....................................................................................... 23
Figure 8: Copper block used for the autogenous GTAW spot weld input in the gauge
section of all STF samples. ............................................................................................... 23
Figure 9: Autogenous GTAW spot welding microstructure. Current downslope schedule
induces columnar growth in a 360° radial direction causing multiple grain boundary

xiv
orientation relative to the applied loading direction. DDC may typically be found 45°
with respect to the loading direction [18]. ........................................................................ 24
Figure 10: Gleeble 3800® at The Ohio State University, utilized for STF testing. ........... 27
Figure 11: Thermo-mechanical cycle generated by the Gleeble to conduct the STF testing
procedure. The blue line represented the temperature history, while the orange line
represents the mechanical history. .................................................................................... 27
Figure 12: Historical output for each spot weld test run, S1-S4. ...................................... 39
Figure 13: STF sequence for “newly” developed STF testing procedure. ....................... 46
Figure 14: DIC painted speckle pattern on STF sample gauge section. ........................... 47
Figure 15: Schematic of WSI/AZZ’s STF sample fabrication. ........................................ 50
Figure 16: Special Metals Co. STF sample fabrication for the round robin STF study. .. 52
Figure 17: EPRI sample fabrication for round robin STF study. ...................................... 54
Figure 18: STF output data for the STF spot weld optimization study. ........................... 65
Figure 19: Cracking vs. Strain data for STF testing of Inconel Alloy-600 re-optimization
study. ................................................................................................................................. 71
Figure 20: Stroke-Strain relationship used to predict strain values in Inconel Alloy-600
STF specimens. ................................................................................................................. 71
Figure 21: Stroke rate vs. Strain threshold data showing an increasing trend between
stroke rate and minimum strain required to induce DDC. ................................................ 72
Figure 22: Stroke rate vs. Strain threshold data for Alloy-690 STF specimens showing
similar trend to Alloy-600 specimens. .............................................................................. 73

xv
Figure 23: STF cracking data at 950°C for Phase II testing, comparing Alloy 600, 625,
and 200 DDC susceptibilities............................................................................................ 75
Figure 24: Ni-200 photomicrographs exhibiting DDC formation along WM MGBs. A.)
100X magnification B.) 200X magnification. .................................................................. 77
Figure 25: SEM Images of a Ni-200 STF sample with increasing magnification to
observe fracture morphology features. A flat intergranular morphology is present with no
evidence of micro-ductility. .............................................................................................. 78
Figure 26: Alloy-600 photomicrographs depicting DDC formation along WM MGBs. A.)
500X magnification B.) 1000X magnification. ................................................................ 80
Figure 27: SEM images of Ni-600 STF specimen showing a smooth intergranular fracture
morphology indicative of DDC. ....................................................................................... 81
Figure 28: Alloy-625 photomicrograph showing Interdendritic phase formation (NbC and
Laves Phase) within the austenite matrix at 500X magnification. .................................... 83
Figure 29: STF strain vs cracking envelope comparing 100% Argon (blue) shielding gas
vs a shielding gas mixture containing 2% oxygen (red). .................................................. 85
Figure 30: Figure depicting the observed effect of grain size on sample DDC
susceptiblity. ..................................................................................................................... 88
Figure 31: STF round robin results by company .............................................................. 99
Figure 32: Round Robin STF data as compared by FM-52M heat. ................................ 101
Figure 33: STF Round Robin study comparing oxygen presence in shielding gas mixture
to a 100% Ar shielding gas. ............................................................................................ 103
Figure 34: Graphical depiction of the data provided in Table 24. .................................. 105

xvi
Figure 36: STF DIC strain map before STF testing. ....................................................... 107
Figure 37: STF DIC strain map after STF testing. Strain distribution may be viewed via
the legend on the right as percent strain. ......................................................................... 107
Figure 38: QuickSim program used to generate STF testing procedure. ........................ 120

1
Chapter 1: Introduction
The use of non-ferrous alloys in the nuclear power industry has increased over the
past several decades due to industry demand for improved material properties, including;
elevated temperature strength, corrosion resistance, and increased strength to weight ratio
[1]. More specifically, the use of Inconel alloy 600 and matching filler metal, FM82
(AWS A5.14 ERNiCr-3), have been employed in steam generator tubes and hardware in
nuclear reactors for the electric power generation industry since the 1950’s [2], initially
exhibiting good resistance to generalized corrosive attack and localized corrosion.
However, long exposure to primary water environment has led to concerns with stress
corrosion cracking (SCC) of moderate Cr-alloys (14-22 wt. %), such as alloy 600, and
matching filler metal FM82, leading to the development of higher Cr alloys such as
Inconel alloy 690 (28-30 wt. % Cr) [3-5]. Inconel alloy 690, and its series of matching
filler metals (FM52 family: AWS A5.14 ERNiCrFe-7(A)) have shown considerable
resistance to corrosion in most water-reactor environments [6] leading to the replacement
of alloy 600 in nuclear steam generators [7]. However, the use of higher-Cr alloys in the
nuclear power industry has led to significant weldability issues, such as ductility dip
cracking (DDC), which has evolved into a weldability problem that has challenged
manufacturers and users of these consumables [8, 9]. Considerable research has been
conducted to avoid all types of cracking in these environments in order to increase the
degree of safety in nuclear components carrying high pressure radioactive steam.
2
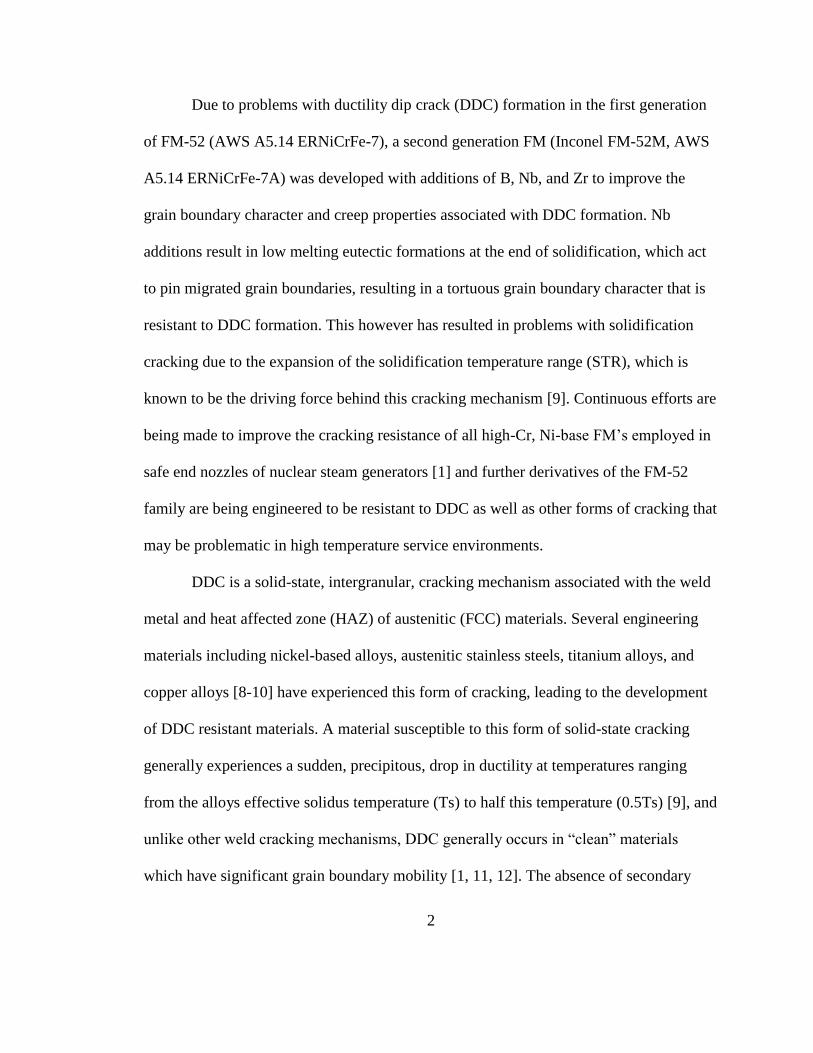
Due to problems with ductility dip crack (DDC) formation in the first generation
of FM-52 (AWS A5.14 ERNiCrFe-7), a second generation FM (Inconel FM-52M, AWS
A5.14 ERNiCrFe-7A) was developed with additions of B, Nb, and Zr to improve the
grain boundary character and creep properties associated with DDC formation. Nb
additions result in low melting eutectic formations at the end of solidification, which act
to pin migrated grain boundaries, resulting in a tortuous grain boundary character that is
resistant to DDC formation. This however has resulted in problems with solidification
cracking due to the expansion of the solidification temperature range (STR), which is
known to be the driving force behind this cracking mechanism [9]. Continuous efforts are
being made to improve the cracking resistance of all high-Cr, Ni-base FM’s employed in
safe end nozzles of nuclear steam generators [1] and further derivatives of the FM-52
family are being engineered to be resistant to DDC as well as other forms of cracking that
may be problematic in high temperature service environments.
DDC is a solid-state, intergranular, cracking mechanism associated with the weld
metal and heat affected zone (HAZ) of austenitic (FCC) materials. Several engineering
materials including nickel-based alloys, austenitic stainless steels, titanium alloys, and
copper alloys [8-10] have experienced this form of cracking, leading to the development
of DDC resistant materials. A material susceptible to this form of solid-state cracking
generally experiences a sudden, precipitous, drop in ductility at temperatures ranging
from the alloys effective solidus temperature (Ts) to half this temperature (0.5Ts) [9], and
unlike other weld cracking mechanisms, DDC generally occurs in “clean” materials
which have significant grain boundary mobility [1, 11, 12]. The absence of secondary

3
phases allows for significant grain boundary migration at elevated temperatures, leading
to large grains and relatively straight migrated grain boundaries (MGBs), increasing a
materials susceptibility to DDC. Under high restraint conditions, often exhibited in thick
sectioned, multi-pass welding procedures, strain localization at these grain boundaries
and grain boundary triple points leads to a “creep-like phenomena” [13], which
eventually leads to DDC propagation. While DDC cracks may be rather minute in size, it
can be a relatively costly failure and preventative measures must be taken to forego this
type of cracking.
The Strain-To-Fracture (STF) testing method, developed at The Ohio State
University (OSU) by Nathan Nissley and John Lippold [1, 14-16] is a Gleeble®-based
testing procedure designed to rank a materials susceptibility to DDC formation. The STF
testing method allows the user to test a variety of alloys and microstructures at various
temperatures and strains [15], to produce temperature-strain envelopes designed to
represent a materials susceptibility to this form of cracking. The STF testing procedure is
unique from all other DDC testing methods in that it isolates the sample within the
materials ductility-dip temperature range (DTR) and allows for precise control over the
testing conditions [1]. It is, however, unclear at what level of strain an actual weldment
must undergo to produce such forms of cracking. Due to this factor, further investigation
must to be conducted in order to relate DDC formation in the STF testing procedure to
DDC formation in an actual weld mockup.
There is a lot of speculation surrounding the external factors that influence DDC
formation in Ni-base alloys and filler metals, and many mechanisms relating to the causes

4
of DDC have been proposed. The presence of DDC in an austenitic (FCC) alloy was first
reported as early as 1912 by Bengough [17], and since that time many researchers have
conducted studies focusing on DDC formation in multiple alloy systems, giving insight
into the mechanism governing this cracking phenomenon.
Collins et al. determined that impurity elements, S and P, have a negative
influence on DDC formation, resulting in sufficiently lower strains required to produce
cracking when these elements are present in increased concentration [18-22]. While
“clean” materials tend to be most susceptible to this cracking phenomenon, impurity
element concentration may have some influence over grain boundary cohesive strength,
which is likely lowered in the presence of S, P, H, or O [18, 23].
Certain elemental additions, such as Nb and Ti, have proven to increase a
materials resistance to DDC by influencing the nature of the secondary phase precipitates
that form within these austenitic alloys [8, 9, 11]. The formation of Nb-rich, M(C,N)
precipitates, at the end of solidification has the most profound effect on DDC, since these
precipitates are most effective at pinning MGBs [11]. Generally speaking, materials with
refined grain size and more tortuous grain boundary character tend to be more resistant to
DDC formation, making “clean” materials most susceptible to DDC formation. As an
example, “Commercially-Pure,” Ni-alloy 200 has increased DDC response due to the
absence of secondary phases that might pin MGBs, refining grain size, and producing
tortuous grain boundary character [12].
While the exact mechanism for DDC formation may be under relative
speculation, it is generally accepted that the underlying cause of the ductility-dip is a

5
grain boundary sliding phenomenon (similar to creep-rupture failure), where void
coalescence at temperatures below the recrystallization temperature contribute to DDC
formation and eventual failure [8, 9, 13, 24, 25]. In fact, a recent study by Chen [26]
measured the effect of grain boundary sliding and MGB misorientation angle on DDC
formation, concluding that grain boundary sliding contributes to crack formation and
propagation, while misorientation angle is associated with the DDC initiation site.
This work aims to study the DDC response in several Ni-base alloys while
utilizing the Strain-to-Fracture testing method which was developed at Ohio State. Severe
compositional variations in the alloys studied will give some insight into specific factors
that influence DDC susceptibility, and STF parameter development will also be under
examination to determine an optimized range for testing. A “round robin” study was also
conducted which aims to understand the influence of sample fabrication methods as it
relates to DDC response in Ni-base FM 52M. Results in this document provide an
understanding to the specific mechanism(s) which govern DDC susceptibility in Ni-base
alloys and FM’s and may be used as a guide to reduce this weldability issue in future
industrial applications.

6
Chapter 2: Background
2.1 Ductility Dip Cracking Definition
Until recently, ductility dip cracking (DDC) in welded structures was considered
more of a curiosity than a serious weldability issue [9]. This is due to the inconsistent and
confusing language and literature concerning DDC formation in multiple alloy systems.
DDC has been referred to as hot cracking, hot tearing, hot fissuring, micro-fissuring,
reheat cracking, and polygonisation in welding literature [1, 13, 27, 28], causing
confusion amongst academics in the metallurgical profession. Haddrill and Baker [29]
clearly define DDC as the loss in ductility, over a temperature range below the solidus,
sufficient to produce cracking under the influence of thermal strain caused by welding.
Essentially referring to DDC as a solid-state cracking phenomenon that is induced based
on a certain level of restraint imposed to a specified area in a multi-pass weldment.
Hemsworth [27] confirms this definition of DDC formation, referring to DDC as
occurring above 0.5Tm (Tm = melting temperature in K), but occurring at boundaries
that are free from liquid films. In fact, it is Hemsworth and Boniszewski [27] who
categorizes various high temperature cracking mechanisms as either Type 1.) Segregation
cracking or Type 2.) DDC, separating liquation cracking mechanisms from solid-state
cracking mechanisms. DDC may be further divided into occurring in the heat affected
zone (HAZ) of a material, the weld metal (WM), or the reheated weld metal based on the
conditions exhibited during welding and the amount of restraint imposed on a specified

7
area. This separation criterion proposed by Hemsworth [27] does not, however, provide
the specifics to define a single cracking mechanism [9], requiring further evaluation in
the efforts to define DDC formation.
2.2 Ductility Dip Cracking in Ni-base Alloys
Figure 1 provides a useful representation of the ductility-dip curve associated with
DDC susceptible, Ni-base alloys and filler metals [8]. A precipitous drop in ductility over
a narrow temperature range below the effective solidus temperature (Ts) (represented by
the shaded area in Figure 1), may lead to a solid-state, intergranular, form of cracking,
known as DDC. Specifically, Ni-base alloys and filler metals commonly exhibit this
“signature” ductility-dip between 750-1150°C, with a minimum ductility typically
occurring around 950°C [15, 18, 30]. In the presence of sufficient strain levels (via
extrinsic loading or intrinsic weld restraint experienced in thick sectioned weldments), a
materials available ductility may be “exhausted,” leading to void formation and eventual
DDC via a grain boundary sliding phenomenon [8, 9] in the reheated WM or HAZ of a
weldment.
It should be noted, that each individual alloy susceptible to this form of cracking
has its own “signature” ductility-dip curve and threshold strain value required to initiate
cracking, making some alloys more susceptible to DDC than others. It is generally known
that a wide DTR and low εmin to initiate fracture represent the most DDC susceptible
materials. In fact, Zhang et al. [31] determined that for a material to be considered
resistant to DDC formation, the DTR should be less than 100°C wide and/or the threshold
strain should be greater than 15%. Compositional and microstructural influences on a

8
materials elevated temperature ductility will be discussed in further detail in section 2.5,
Proposed DDC Mechanisms.
Figure 1: Ductility-temperature profile of an alloy that undergoes ductility-dip
phenomena [8].
Figure 2 [8], represents the relationship between residual strain concentration due
to a materials intrinsic restraint level or contraction stresses induced on cooling and DDC
formation. As depicted by the figure, if the strain level (restraint) exceeds a certain
threshold level, εmin, within the DTR crack formation is likely to occur. This condition is
represented by the “high restraint” line in Figure 2 and would ultimately crack due to a
grain boundary sliding phenomenon along the materials MGBs. However, if the restraint
level could be kept under control and held below the εmin, cracking would be arrested and
the material may continue to be employed as usual. DDC may therefore be characterized
by a strain threshold to induce crack formation, εmin, and a ductility dip temperature range

9
(DTR), in which crack formation is possible [1, 8-10, 15, 30, 32]. It should be noted that
the DTR exists over a temperature range where no liquid film formation is likely to
occur, making DDC a solid-state cracking mechanism. There have however, been few
reports linking the presence of DDC as propagating from a liquation crack and in some
cases, the brittle temperature range (BTR) and the DTR may overlap [33].
The onset of the ductility-dip in DDC susceptible alloys contrasts several
engineering alloys that are generally resistant to DDC formation. Elevated temperature
ductility of these alloys is generally quite high at increased temperatures, close to the
effective solidus (Ts), followed by a steady decline in ductility as the temperature is
reduced to room temperature [8]. However, alloys that are susceptible to DDC formation,
generally experience a ductility-dip phenomenon at temperatures just below the
recrystallization temperature [34]. Within this temperature range, voids have time to form
and coalesce via grain boundary shearing and DDC formation occurs [9].

10
Figure 2: Ductility-temperature curve representing the relationship between restraint and
crack susceptibility [8].
Exposure to a temperature within the recrystallization temperature range leads to
the formation of new grains and therefore grain boundaries along parent MGBs, making
void formation and coalescence very difficult [8, 9, 30]. At these temperatures the
ductility is recovered and DDC formation is not likely to occur. The upper bound of the
DTR curve is therefore represented by temperatures at or around the recrystallization
temperature (1050-1200°C), where ductility recovery is influenced by the onset of new
grain formation [18, 23, 34].
The lower bound of the DTR curve may be linked to the creep properties of the
subjected material due to the “creep-like” nature of DDC formation [13]. It is generally
known, that creep rupture is limited at lower temperatures and the dislocation motion
associated with grain boundary sliding may not occur below certain temperatures. Due to

11
limited creep properties at lower temperatures, ductility recovery occurs close to 0.5Ts,
representing the lower temperature limit in which DDC is likely to occur. Increased creep
strength at low temperatures is thought to make DDC formation impossible below 0.5Ts.
2.3 Ductility Dip Cracking: Microstructural Characteristics
As previously stated, DDC is a solid-state, intergranular, form of cracking that is
most often observed in single phase, austenitic (FCC) materials exhibiting long and non-
tortuous MGBs throughout the γ matrix [28, 35]. The formation of MGBs within a single
phase, FCC material, may be represented by the schematic shown in Figure 3 [36]. This
figure shows the solidification microstructure characteristics associated with single phase,
Ni-base, WM’s upon cooling from the solidus temperature (Ts). As represented by the
figure, MGB formation originates from the parent solidification grain boundary (SGB).
As cooling persists, the crystallographic portion of the SGB acts to straighten itself out,
migrating away from the compositional portion of the SGB. If no secondary phase
formation is present to “pin” the migration of the MGB, long and non-tortuous, high
angle grain boundaries will be present in the weld microstructure. Migration of MGBs is
driven by the high energy associated with the increased misorientation angle of the
crystallographic portion in SGB’s [37]. MGBs are generally thought to be very
susceptible to DDC formation, especially if the nature of the boundary is in a non-
tortuous condition [8, 9, 30, 38]. High purity materials tend to form with non-tortuous
MGBs due to the absence of secondary phases and solute elements that may act to “pin”
or “drag” this boundary via a grain boundary locking mechanism or solute drag effect [8,

12
9]. “Free” migration of MGBs tends to result in weld metal microstructures that contain
relatively large grains and very straight boundaries, making high purity materials most
susceptible to DDC formation [9, 12, 35].
Figure 3: Representation of solidification microstructure present in single phase austenitic
weld metals, exhibiting grain boundary migration [36].
The DDC susceptibility of large grained, single phase, structures tends to be
increased due to the reduction in grain boundary area per unit volume exhibited by a
particular large grained materials [19, 33, 34, 39, 40]. Limiting the GB area per unit
volume decreases the paths for deformation mechanisms that may be necessary in the
presence of loading conditions, often exhibited when welding highly restrained materials.
This leads to localized strain concentrations at MGBs and grain boundary triple points,
where DDC formation commonly initiates [9, 18]. If sufficient strain is concentrated

13
along a particular MGB, the available ductility may be “exhausted” [8, 9], leading to
grain boundary shearing mechanisms associated with void formation and DDC
propagation. Strain localization along MGBs can in fact be observed in Figure 4 [41] and
5 [34], proving that DDC formation may only be induced when sufficient strain levels
exceed the ductility minimum governed by the ductility trough in DTR.
Figure 4 is a photomicrograph of a thick sectioned weldment of high-Cr, Ni-base,
filler metal 52 (FM52), exhibiting severe DDC formation and recrystallization along
MGBs [9]. Arrows indicate areas along MGBs that are exhibiting new grain formation
via a recrystallization mechanism, resulting from high strain concentrations along these
boundaries at elevated temperatures [9]. Dynamic recrystallization often occurs in the
presence of localized strain concentrations at elevated temperatures, proving that intrinsic
strain, resulting from restraint conditions, tends to be localized along MGBs. As
previously stated, if sufficient strain levels are present along MGBs, ductility exhaustion
may occur leading to de-cohesion of these boundaries (DDC formation).

14
Figure 4: Photomicrograph of a ductility-dip crack along a migrated grain boundary in a
thick section weldment of filler metal 52 (FM52). Arrows represent the onset of
recrystallization due to high local strain concentrations at these boundaries [41].
The effect of strain localization along MGBs was also investigated by Collins, et
al [23, 34] using Electron Back Scatter Diffraction (EBSD) to produce a strain
distribution map along a material subjected to the Strain-To-Fracture (STF) testing
method. Figure 5 depicts the use of the strain distribution map on a STF sample of FM52
subjected to 2.6% strain at approximately 950°C. It is clear from this figure, that the
highest levels of strain concentration are observed along high angle, MGBs, and grain
boundary triple points. DDC is therefore only likely to occur along MGBs due to the
presence of localized strain concentrations which may exceed the available ductility
present at the specified boundary, leading to crack formation and propagation.

15
Figure 5: Strain distribution map of FM 52 heated to 986ºC and strained at 2.6%. Thin
lines represent high angle boundaries. Black is open cracks present in the WM. Color is
strain distribution with blue being lowest and red being highest [34].
“Free” grain boundary mobility, often associated with high purity, Ni-base weld
metals, may be reduced by influencing the secondary phase formations via compositional
alterations to DDC susceptible, Ni-base filler metals. The presence of secondary carbides
limits grain boundary mobility and grain growth leading to a structure with increased
grain boundary area per unit volume. Ramirez, et al [9, 24, 34] reported that formation of
second phase precipitates are effective at pinning MGBs, preventing grain growth and
resulting in tortuous MGB character. It is in fact proven that additions of Nb to DDC
susceptible weld metals result in the formation of Nb-rich carbides (NbC) at the end of
solidification. These precipitates are effective at pinning MGBs, via GB locking
mechanisms, which acts to produce a more tortuous GB character within the
solidification microstructure [9]. Secondary phase formation also limits grain growth,
contributing to an overall increase in GB area per unit volume.

16
The nature of secondary carbide phase formation on DDC susceptibility in Ni-
base FM’s and WM’s has been the focus of many studies [3, 18, 24, 42] in an effort to
determine the underlying mechanism associate with DDC formation. It was determined
that alloys with increased concentrations of Ti and Nb, such as in FM82, tend to have
increased resistance to DDC formation [18] in comparison with FM’s absent of these
elemental additions. The formation of MC carbides act to mechanically lock MGBs
leading to boundaries which resist grain boundary sliding and have a more tortuous GB
character [18]. The influence of carbide formation on MGB character, in various Ni-base
FM’s can be observed in Figure 6, a and b [9, 23].
Figure 6, a, is a SEM photomicrograph of Ni-base, FM82 exhibiting GB pinning
effects from the MC type carbides indicated by the arrows. It is apparent from this figure
that MGBs become pinned in place at the location of Nb-rich MC carbides, leading to a
more tortuous structure that may be more resistant to DDC formation [23]. Figure 6, b, is
a similar SEM photomicrograph of Ni-base, FM 52, exhibiting long, non-tortuous MGBs
[9]. The difference in MGB character may be attributed to Nb additions. While FM82
contains approximately 2.5 wt. % Nb, FM 52 only contains approximately 1 wt. % Nb
[9]. The reduced concentration of Nb in FM52 results in limited formation of NbC at the
end of solidification, leading to insufficient GB pinning effects.
It should be noted that not all secondary phase precipitates influence DDC
formation as significantly as MC carbides. Some carbides, such as M23C6, form outside
the DTR and have shown little influence on GB tortuosity, and therefore DDC [9, 24].
Studies conducted by Noecker and Dupont [25, 43] correlate increased DDC resistance

17
with M23C6 carbide formation, however, it is unclear if they are of sufficient size to
promote GB pinning. The influence of other elemental additions on DDC susceptibility
will be discussed further in section 2.5, Proposed DDC Mechanisms.
Figure 6: SEM photomicrographs of WM MGBs in a) FM82 showing pinning via MC
carbides (arrows) and b) FM52 [9, 23].
18
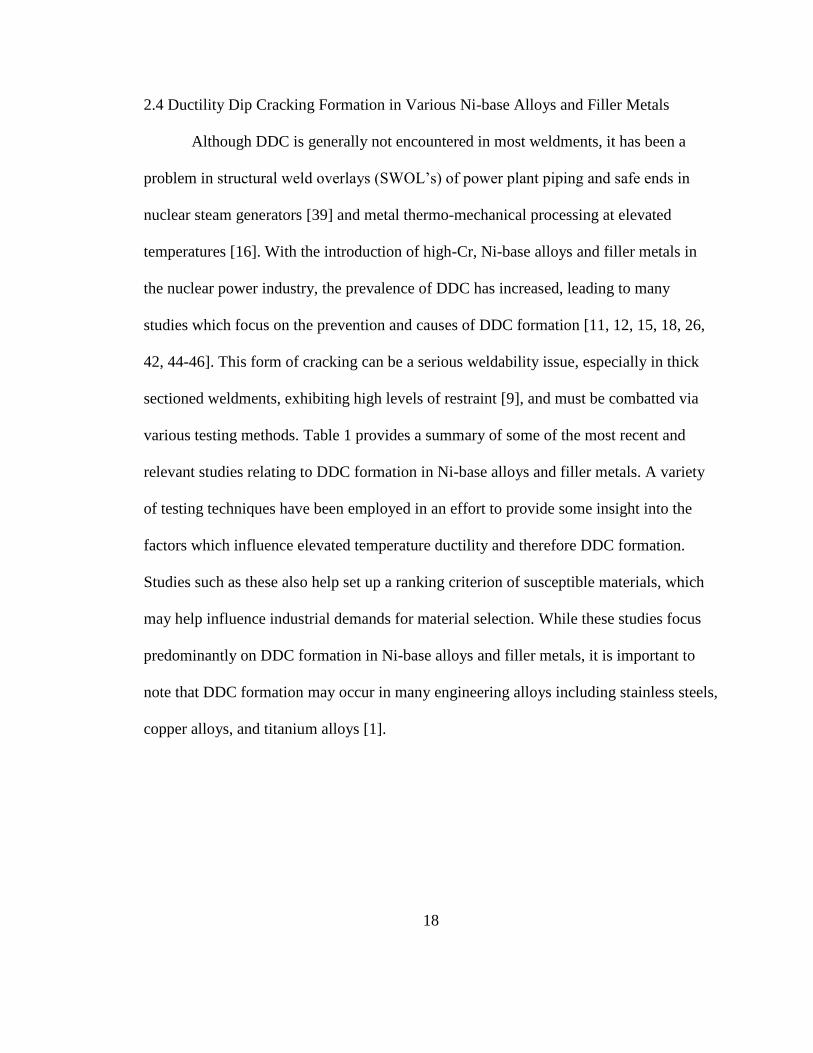
2.4 Ductility Dip Cracking Formation in Various Ni-base Alloys and Filler Metals
Although DDC is generally not encountered in most weldments, it has been a
problem in structural weld overlays (SWOL’s) of power plant piping and safe ends in
nuclear steam generators [39] and metal thermo-mechanical processing at elevated
temperatures [16]. With the introduction of high-Cr, Ni-base alloys and filler metals in
the nuclear power industry, the prevalence of DDC has increased, leading to many
studies which focus on the prevention and causes of DDC formation [11, 12, 15, 18, 26,
42, 44-46]. This form of cracking can be a serious weldability issue, especially in thick
sectioned weldments, exhibiting high levels of restraint [9], and must be combatted via
various testing methods. Table 1 provides a summary of some of the most recent and
relevant studies relating to DDC formation in Ni-base alloys and filler metals. A variety
of testing techniques have been employed in an effort to provide some insight into the
factors which influence elevated temperature ductility and therefore DDC formation.
Studies such as these also help set up a ranking criterion of susceptible materials, which
may help influence industrial demands for material selection. While these studies focus
predominantly on DDC formation in Ni-base alloys and filler metals, it is important to
note that DDC formation may occur in many engineering alloys including stainless steels,
copper alloys, and titanium alloys [1].

19
Table 1: Historically Significant DDC Studies in Ni-base Alloys and FM’s.
Material Testing Method Reference Year
Commercially pure Ni-alloy 200, INCONEL
600, and INCONEL 625 STF Test Kreuter [12] 2014
FM52 and FM52M STF Test Nissley, Lippold [1,
11, 45, 46] 2005
INCONEL alloy 690 Hot Ductility Test Dave and Cola [47] 2004
FM52, FM82, FM625, Alloy 690, Alloy 600
Spot Varestraint Test
Kikel and Parker [39]
1998
FM52 and FM82 STF Test Ramirez, Sowards, Lippold [24, 42, 44]
2006
2.5 DDC Mechanisms
Until recently, the mechanisms which govern ductility-dip cracking in Ni-base
alloys and FM’s were rather unclear. The introduction of the STF testing method and other
weldability testing methods, which focus on the formation of DDC, have allowed
significant advancement in the understanding of this specific cracking phenomenon.
Throughout the years of research focusing on DDC, many factors have been proposed
which aim to understand the exact mechanism governing the formation of the ductility-dip
and therefore crack formation in many alloy systems. Table 2 summarizes proposed
mechanisms that have been theorized over the past 50 years.
Based on these proposed factors influencing DDC formation, it is clear that there
are four main theories which have been used to describe DDC formation in FCC materials.
Precipitate morphology, concentration of impurity elements (S, P, O, and N), grain

20
boundary strain concentrations, and grain boundary sliding have all been described as
factor which influence DDC formation. Young et al. [3] studied the effect of precipitate
morphology on DDC formation and theorized that strain concentrations exist adjacent to
partially coherent precipitates which act as a crack initiation point. This however,
contradicts work conducted by Ramirez et al. [12, 42] which states that precipitates may
be added to reduce DDC susceptibility via GB “locking” mechanisms, and that “clean”
materials are most susceptible to DDC formation.
The introduction of impurity elements, such as S or P, have also been considered a
factor which promotes DDC response in FCC alloys. While research by Collins [18] shows
an increased susceptibility to DDC in the presence of these elements, it does not explain
the increased DDC susceptibility observed in commercially pure materials. Impurity
elements definitely have some influence over DDC formation, however their existence
does not describe the underlying mechanisms associated with DDC. The extent to which
these elements influence DDC response is still under current investigation.
It is generally accepted that grain boundary sliding is the underlying mechanism
governing DDC formation. GB sliding is a “creep-like” phenomenon which occurs along
high angle grain boundaries due to ductility “exhaustion” in the presence of increased strain
levels [9, 30, 35]. This phenomenon has been observed by Ramirez [44] via an “in-situ”
STF testing method, and recently quantified by Chen [26]. This mechanisms is still under
current investigation although it is clear that GB sliding is the mechanism which governs
DDC formation in FCC materials.

21
Table 2: Theorized DDC Mechanisms Summary
2.6 STF Testing Method
The STF testing method was designed by Nathan Nissley in 2002 [15] as a
method to quantify DDC susceptibility in multiple alloy systems. The test has been
employed by multiple researchers to compare FM’s susceptibility to DDC under high
restraint and to improve understanding of the mechanisms associated with this form of
Reference Year(s) Author(s) Alloys Tested Mechanism Summary
[18, 48, 49] 2003, 2006, 2013
M. Collins, K.
Nishimoto, K.
Saida
FM-82, Alloy 690,
High Ni,Cr SS
Deterioration of ductility due to grain boundary segregation of P
and S in reheated weld metal.
[13, 24, 50, 51] 1961, 1971, 1985, 2004
F. Rhines,
A. Dix,
Y. Zhang, A.
Ramirez
Monel®, Inconel X-
750, Fe-36%Ni,
FM-52,
Grain boundary sliding, creep-like phenomena.
[3] 2008 G. YoungAlloy 690 and associated
filler metals
Local grain boundary stresses generated during precipitation of
partially coherent, M23C6, carbides.
[52] 1985 Y. Zhang Fe-36%Ni (Invar)
Ductility trough is a synthesis of intergranular precipitation,
serrated GB's, GB sliding, GB migration, flow stress, and dynamic
recrystallization
[53] 2005 T. Capobianco FM-52Combination of sulfur embrittlement and local stresses from
Cr23C6 carbides.
[39] 1998 J. Kikel FM-52 and Alloy 690 Grain boundary orientation relative to the applied strain.
[34] 2004 M. Collins, FM-52 and FM-82
Complex interplay of alloy composition, impurity addition, GB
segregation, GB sliding, precipitation, recrystallization,
accumulated local strain, and GB misorientation.
[54] 1984 F. Matsuda Fe-36% Ni (Invar) Sulfur, Oxygen, Nitrogen, and Aluminum embrittlement.
Postulated DDC Mechanisms

22
cracking. The following will discuss the process procedure of the STF testing method as
it was developed by Nissley.
Samples of the desired tested material are machined by water jet cutting ¼” thick
plate to the sample geometry shown in Figure 7. Sample gauge sections are machined
with a smaller area, as compared to the rest of the bar, in order to concentrate strain and
heating in this area. Once machined, sample gauge sections are polished to remove
surface contaminants and then given an autogenous GTA spot weld with the parameters
listed in Table 3. A specialized copper molding system has been constructed specifically
for this stage of testing and may be seen in Figure 8. Weld parameters are specifically
designed to control the solidification rate and grain growth in the spot weld of each
sample. The current downslope induces columnar growth in the radial direction as seen in
Figure 9, giving a 360° radial array of MGBs within the spot weld microstructure. Grain
boundary orientation relative to the applied strain has proven to be an important variable
for repeatability in accordance with this experiment, and cracking tends to occur in the
spot weld +/- 45° relative to the normal direction of the applied load.

23
Figure 7: STF sample geometry.
Figure 8: Copper block used for the autogenous GTAW spot weld input in the gauge
section of all STF samples.

24
Figure 9: Autogenous GTAW spot welding microstructure. Current downslope schedule
induces columnar growth in a 360° radial direction causing multiple grain boundary
orientation relative to the applied loading direction. DDC may typically be found 45°
with respect to the loading direction [18].
Table 3: GTA Spot Weld parameter schedule for STF testing method
Time (S) Value Unit
Shielding Gas Pre-flow
10 20 Ft^3/h
Initial Current 0.1 20 Amps
Upslope 5 24 Amps/Second
Weld Current 10 140 Amps
Downslope 12.7 9.5 Amps/Second
Final Current 0.1 20 Amps
Shielding Gas Post-flow
20 20 Ft^3/h
Voltage 11-12.5 Voltage
Shielding Gas Argon (99.98%)

25
Following the completion of the spot weld on each sample, gauge sections were
polished through 800 grit silicon carbide paper to help make crack detection more
observable. Indentation marks ~8mm apart were then placed in the gage section in order
to measure the induced strain in each sample. The distance was measured before and after
the STF test with the use of an optical microscope and strain was calculated by dividing
length change over original length of the indentation marks. This technique allows for
localized strain measurements in the sample gauge section and avoids the complicated
and time consuming setup of a strain gauge. It should be noted that Digital Image
Correlation (DIC) technology was used in a later stage of this testing, and strain
measurements via the indentation measurement method have been confirmed.
The strain-to-fracture test is conducted using a Gleeble® 3800 [48] (shown in
Figure 10), where thermal cycles as well as mechanical loading conditions may be
applied to simulate overlay welding procedures. Samples are fit with a type K
thermocouple which connects to the Gleeble in order to verify accurate temperature
readings throughout the sample gauge section. Prepared samples are then mounted into
the Gleeble’s stainless steel high force jaw system which contains knurled tool steel grips
in order to prevent slippage. A jaw spacing of 30 mm was used in these tests to allow for
accurate positioning of each sample. Once samples are mounted and positioned
appropriately, a rough vacuum system depressurizes the chamber (10-2 torr) followed
with a back purge of 99.998% argon. This process is repeated twice to prevent sample
contamination during testing.

26
Programming of the Gleeble cycle is generated with the use of QuickSim (snap-
shot of the QuickSim interface macro is located in Appendix A), which allows for input
of multiple variables. Programming for this test was generated to heat samples to a peak
temperature of 950C at a heating rate of 100C/s. 950C was chosen as the test
temperature based on previous data which suggests that this temperature is the low
ductility point in Ni-base alloys ductility dip temperature range (DTR). Samples were
held at the peak temperature for 10 seconds before the stroke was applied to allow for the
temperature to stabilize across the gauge section. After the hold time, the sample was
strained by moving the jaws at a constant rate of 0.6 mm/s. Maximum stroke inputs were
variable in order to allow for different strains in each sample. Upon completion of the
stroke cycle, heating was turned off and samples were free cooled down to room
temperature. A zero load condition was applied to the sample on cooling to account for
thermal contraction stresses which suppressed cracks that may have formed on cooling.
Figure 11 represents the thermo-mechanical cycle that is currently generated for the STF
testing procedure in the Gleeble simulator. It should be noted that three mobile
conversion units (MCU) are available for the Gleeble at Ohio State for various forms of
testing; pocket jaws (high and low force) and a torsion unit may be changed out
depending on the testing requirements.

27
Figure 10: Gleeble 3800® at The Ohio State University, utilized for STF testing.
Figure 11: Thermo-mechanical cycle generated by the Gleeble to conduct the STF testing
procedure. The blue line represented the temperature history, while the orange line
represents the mechanical history.
0
0.05
0.1
0.15
0.2
0.25
0.3
0.35
0
100
200
300
400
500
600
700
800
900
1000
0 10 20 30 40 50
Stro
ke (
cm)
Tem
pe
ratu
re (
ºC)
Time (seconds)
Gleeble Thermo-Mechanical History
Temperature
Stroke

28
Chapter 3: Objectives
The Strain-To-Fracture (STF) test has been used for years to evaluate the Ductility-
Dip Cracking (DDC) susceptibility in several alloy systems. Many researchers have
employed this testing method to determine specific factors that contribute to a materials
DDC response in an effort to avoid weldability challenges in industrial applications.
However, application of the STF testing method to actual practice has proved to be a
challenge and the validity of specific quantification methods have been in question.
The goal of this study is to optimize the testing methods used at The Ohio State
University to evaluate DDC response, as well as determine the influence of weld
procedure and STF sample fabrication methods on DDC susceptibility. More specifically,
the objectives of this study are as follows:
1. Optimize the STF testing procedure to ensure sample repeatability when utilizing
Ni-base alloys and FM’s.
2. Evaluate the cracking response of several Ni-base alloys and filler metals to
observe how compositional influence and solidification microstructure variations
influence DDC formation, including Nickel 200, Inconel 600, Inconel 625,
Inconel 690, and FM52M.
3. Using the optimized STF procedure, determine the influence of weld procedure
and STF sample geometry on DDC susceptibility in a round robin study using
FM52M.

29
4. Provide insight into the mechanism(s) that govern DDC formation in Ni-base
weld metals and determine how composition and solidification microstructure
influences DDC formation in these materials.
5. Determine the effect of a 98Ar/2O2 mixed shielding gas, employed during the
GTA spot weld, on the formation of DDC in Inconel 600, 625, and FM52M.

30
Chapter 4: Experimental Approach
The Gleeble®-based, Strain-To-Fracture (STF) testing procedure was developed at
The Ohio State University in 2002 by Nissley and Lippold [14-16] and has become one
of the most repeatable, cost effective, and reliable testing methods for quantifying DDC
susceptibility in a variety of alloy systems. This test is unique from all other hot cracking
tests in that samples are isolated within the ductility dip temperature range (DTR),
meaning that crack formation is limited solely to DDC formation. The isolated
temperature field within the DTR limits the confusion of other DDC testing methods,
such as the Varestraint Test [49] or PVR Test [50], which may be used to produce
various forms of hot cracking phenomenon, such as solidification cracking, liquation
cracking, and ductility dip cracking. The formation of other types of high temperature
cracking while employing these various testing methods may result in stress relief in the
testing area, which will add to the complexity of the testing format, especially since these
tests require strain measurements as the quantification methodology.
The Gleeble-based STF testing method has been determined to be the best
approach for distinguishing slight variations in DDC cracking resistance between a
variety of Ni-base weld metals and filler metals [18]. The flexibility of the thermal
control system allows for a variety of heating and cooling rates, which may aid in
determining temperature dependent mechanisms that govern DDC formation in tested
alloys. A variety of isothermal heat treatments may be employed to isolate the sample

31
within the DTR, which limits crack formation to DDC. Solutionization heat treatments
may also be devised to produce a variety of precipitation reactions which may help
produce a more tortuous grain boundary structure that is more resistant to DDC
formation. These heat treatments are often used in conjunction to provide a variety of
microstructural characteristics in the specific alloys tested resulting in a variety of DDC
formation as well as strain quantification figures. The mechanical loading system in the
Gleeble is also very flexible and may be used to control the amount of strain localization
that is present within the gauge section of the samples tested. Since crack formation is
directly related to the amount of strain localization a sample experiences at a MGB,
various strain amounts may be used to provide a range of cracking susceptibilities in
materials tested. Strain rate is also a flexible variable controlled by the Gleeble thermo-
mechanical system. This variable, however, appears to have a very significant effect on
the resistance to DDC formation in all alloys tested. Increasing strain rate has shown to
reduce a samples susceptibility to DDC formation, which is likely due to reduced
microstructural creep properties at increased strain rates [51].
This study focuses of the improvement of current testing techniques associated
with the Strain-To-Fracture test, in order to provide a robust parameter set that may be
used to provide a repeatable testing method for the formation of DDC in multiple alloy
systems. This was initiated with the re-optimization of the STF testing parameters when
employing Ni-base alloys and filler metals, which was necessary as the test was
originally developed with the use of 310 stainless steel. Once the testing parameters were
optimized, a variety of tests may be run to give insight into the mechanisms which govern

32
DDC susceptibility in multiple alloy systems. The repeatability of the STF test allows for
a quick and cost effective way to examine DDC response. A variety of Ni-base material
systems were examined in this study to give some insight into compositional and
microstructural variation on DDC formation. Process parameters used to develop STF
samples were also examined in order to determine the effect of weld process parameters
as they relate to DDC formation in Ni-base systems. Work in this study aims to relate
weld procedure specification (WPS’s) used in the nuclear power industry to DDC
performance.

33
Chapter 5: Experimental Procedure
5.1 Materials
The following section includes all of the materials that were employed in the STF
study including tables with compositional information. Ni-base metals will be discussed
first followed by Ni-base FM’s.
5.1.1 Base Metal Compositions
Four commonly used Ni-base alloys were examined in this study for DDC
propensity via the STF testing procedure. Inconel alloys 600, 625, and 690 as well as
commercially pure Ni-200 were all used to study the respective susceptibility to DDC
formation based on compositional variations. Compositions (weight %) for these alloys
may be seen in Table 4. It should be noted that Inconel alloys 600 and 625 as well as
commercially pure Ni-200 compositions are presented as nominal compositions, while
Inconel alloy-690 is presented as the exact composition for the specific heat used. This is
a result of unidentified heat numbers used for a portion of testing.
Due to Alloy-690’s increased susceptibility to DDC formation, it was used as a
baseline material for the “re-optimization” of the STF testing parameters (Phase I). It was
determined that this alloy would be useful in producing repeatable results at relatively
lower strains, which would be quicker and more cost effective to run. Nb, Ti, and Al
additions are kept at a minimum in this alloy which prevents precipitation of carbides that

34
would otherwise act to pin MGBs. This results in solidification microstructure that has
relatively straight MGBs at room temperature which have limited resistance to DDC
formation. Reduced secondary phase formation also results in increased grain sizes as the
alloy cools to room temperature due to the fact that grain boundary mobility is not
restricted.
Inconel alloys 600, 625, and commercially pure Ni-200 were used as baseline
materials for Phase II of testing due to the dramatic compositional variations between the
three materials. This study was designed to focus on the effect of alloying additions on
DDC susceptibility in various materials. Phase II gives some insight into factors that may
influence DDC formation in Ni-base materials.

35
Table 4: Compositional data (wt. %) for Ni-base materials used in the presented STF
study.
Element Inconel Alloy-600
Inconel Alloy-625
Inconel Alloy-690
(NX9620H)
Nickel 200
Ni 72 58 60.5 99
Fe 10 5 9.13 0.4
Cr 17 23 29.5 -
C 0.02 0.1 0.03 0.15
Mn 1 0.5 0.15 0.35
Si 0.5 0.5 0.05 0.35
Cu 0.5 - 0.01 0.25
S 0.015 0.015 0.002 0.01
P - 0.015 - -
Nb 0.15 4.15 0.02 -
Mo - 10 0.02 -
Al - 0.4 0.24 -
Co - 1 - -
5.1.2 Ni-base Filler Metals
Three heats of FM-52M were examined and tested in this study via the STF test
and their nominal compositional properties (wt. %) may be seen in Table 5. All heats of
FM-52M were used in a “round robin” study to examine the effect of weld procedure
development on DDC formation as well as to examine the significance of heat-to-heat
variation as it relates to DDC development. The results of the “round robin” study will be
discussed in chapter 6 of this text.

36
Table 5: Ni-base FM, FM-52M, compositional data (wt. %) for the 3 heats used in the
round robin study (NX4720TK, EXOA51P, NX5213TK).
Element FM 52M
(NX4720TK) FM52M
(EXOA51P) FM52M
(NX5213TK)
Ni 60.23 60.37 60.05
Cr 29.56 30.04 29.99
Fe 8.17 8.42 7.83
C 0.015 0.02 0.016
Nb + Ta 0.8 0.85 0.83
Mn 0.69 0.81 0.76
Ti 0.2 0.21 0.22
Al 0.13 0.1 0.11
Si 0.13 0.03 0.13
Cu 0.03 0.02 0.03
Mo 0.01 0.02 0.01
P 0.003 0.004 0.003
S 0.001 0.001 0.0007
Co 0.005 0.007 0.006
Zr 0.001 0.015 <0.01
B <0.001 0.004 0.001
Other <0.5 <0.5 <0.5
5.2 STF Re-Optimization
The interest of high-Cr, Ni-base alloys and filler metals in the nuclear power
industry fueled the “re-optimization” of STF testing procedure while employing these
alloys. STF parameter schedules (in both the spot weld stage and the Gleeble simulation
stage) were created with Type 310 stainless steel during the developments of the STF test
in 2002 [15]. For this reason, it was necessary to conduct a study focusing on parameter
development as it relates to DDC susceptibility for Ni-base alloys and filler metals. Spot

37
weld parameter optimization was looked at initially followed by parameter optimization
of the Gleeble-based simulation. For testing repeatability reasons, it was necessary to find
a range of parameters that have little or no influence of the quantification method of the
STF test. Important variables examined in each stage of testing will be discussed in the
following sections. INCONEL alloy 690 was used as the baseline material for all DOE
testing.
5.2.1 GTA Spot Weld Parameter Optimization
The importance of the spot weld on STF results was discussed in the background
section, 2.6. A designed current downslope is used to induce columnar growth in the
radial direction, creating a 360 degree radial array of migrated grain boundaries (MGBs)
that may be susceptible to DDC formation (shown in Figure 9). It has been proven that
grain boundary orientation relative to the applied load has some influence on DDC
formation, with 45° relative to the applied loading direction being the most susceptible
orientation for the formation of DDC. Grain size and grain boundary tortuosity also have
proven to influence DDC formation. For this reason, it was necessary to examine the spot
welding parameters which have the ability to effect solidification microstructure and
therefore DDC susceptibility. Variables that were examined include, peak current, current
downslope time, and weld time (time at peak current). It was necessary to determine if
slight variations in spot welding parameters significantly affected microstructural
characteristics and therefore STF strain thresholds to induce crack formation. If this was
the case, special attention must be given to the spot weld parameters so to ensure (i.e. arc

38
length, cooling rate, heat input) all are exactly the same from one sample to the next. It
may also be necessary to find a more robust parameter set if slight variations in spot weld
parameters produce inconsistent STF results.
A simple design of experimentation (DOE) for spot welding variables influence
on DDC formation was conducted focusing on three main variables (peak current, time at
peak current, and current downslope time). Table 6 includes a list of the various
parameter sets (S1-S4) used to generate the spot weld in each sample, as well as the
resultant STF strain threshold data and spot weld diameters (mm). Spot weld parameters
were made in accordance with Table 6 parameter sets (S1-S4) and the remainder of the
Gleeble-based testing was conducted with the parameters shown in Table 7 (developed
by Nissley). A graphical depiction of all of the spot welding current-time outputs were
generated and are shown in Figure 12. It should be noted that testing schedule S1,
depicted by the blue line in Figure 12, is the original spot weld parameter schedule
developed by Nissley [14-16] when the STF test was first developed. Results of the GTA
spot weld parameter optimization will be discussed in the results section of this thesis.
Table 6: STF optimization parameter schedules for GTA spot weld.

39
Table 7: Gleeble parameters used during the spot weld optimization study.
Figure 12: Historical output for each spot weld test run, S1-S4.
5.2.2 STF Optimization
The next stage of testing consisted of parameter verification and optimization for
the Gleeble parameters used throughout the STF testing procedure. This stage of testing
is required to induce strain localization and temperature homogenization within the
sample’s gauge sections. A set of standard conditions for the STF test was developed by
Nissley in 2002 [14-16], and may be seen in the following table (Table 8). Preliminary
Stroke Rate (mm/s) 0.6
Peak Temp (ºC) 950
Time at peak temp (s) 10
STF Gleeble Parameters
0
50
100
150
200
250
0 5 10 15 20 25 30 35 40 45
Cu
rre
nt
(am
ps)
Time (seconds)
Spot weld DOE Test Schedules (S1-S4)
S1
S2
S3
S4

40
testing during the development stages of the STF test employed Type 310 stainless steel
as the baseline alloy. For this reason, it was necessary to optimize the chosen parameters
for Ni-base alloys, which are commonly employed in the STF test. Like the spot weld
optimization, it was necessary to find a robust parameter set for the Gleeble-based portion
of testing to ensure that slight variability in parameters will produce repeatable results.
Table 8: Gleeble-based parameters for the STF testing procedure, developed by Nissley
[15].
Step Parameter Value
1 Heating Rate (ºC/Sec) 100
2 Peak Temperature (ºC) 950
3 Time at Peak Temperature
(s) 10
3 Stroke (mm) Controls strain
- Any Value
4 Stroke Rate (cm/s) 0.06
5 Cooling Rate (ºC/s) ~1 (Free Cool)
Variables that were considered for further testing include: heating rate, peak
temperature, time at peak temperature, the effect of multiple heating cycles, and stroke
rate. It is known already that peak temperature may influence the position within the
DTR that the sample is tested. This means that as long as the test temperature is kept
consistent, results may be considered repeatable. Heating rate and the use of multiple
heating cycles were considered non-significant variables, and were not examined in this
optimization process. In fact, when Nissley developed the STF testing procedure, only
41
stroke rate and time at peak temperature seemed to have influence on the quantification
method. For this reason, only these two variables were examined further in the
optimization process. INCONEL alloy 600 and 690 were used as baseline alloys for
Gleeble DOE testing. These two alloys were chosen due to their historical significance in
the nuclear power industry as well as to ensure repeatability when employing parameter
sets.
Parameter sets for this experimentation may be viewed in Table 9 (INCONEL
alloy 600) and Table 10 (INCONEL alloy 690). Tests A-E were designed to examine the
effect of stroke rate and time at peak temperature on STF strain threshold. Values
highlighted in red indicate the changed variable for the particular parameter set. It should
be noted that only 1 variation to “time at peak temperature” was conducted to confirm
that the sample gauge section was of uniform heat as the stroke was imposed on the
sample. If this is not the case, a longer time must be used to confirm temperature
homogenization along the sample gauge section. It should also be noted that test run C
(for both alloys 600 and 690) is the original parameter set that was developed by Nissley
during the creation of the STF testing procedure. Results to the Gleeble optimization
testing and the significance of tested variables on strain threshold results will be
discussed further in the results section of this thesis.

42
Table 9: Gleeble parameter optimization schedules for INCONEL Alloy-600.
Gleeble DOE Parameters - INCONEL Alloy-600
Run Stroke Rate
(cm/s)
Time at Peak Temperature
(s)
Peak Temperature
(°C)
G-1 0.6 10 950
G-2 0.2 10 950
G-3 0.06 10 950
G-4 0.06 1 950
G-5 0.1 10 950
Table 10: Gleeble parameter optimization schedules for INCONEL Alloy-690.
Gleeble DOE Parameters - INCONEL Alloy-690
Run Stroke Rate
(cm/s)
Time at Peak temperature
(s)
Peak Temperature
(°C)
GS-1 0.6 10 950
GS-2 0.2 10 950
GS-3 0.06 10 950
GS-4 0.06 1 950
GS-5 0.1 10 950
5.3 Sample Preparation
A variety of techniques were used in this study to focus on specific aspects that
relate to DDC susceptibility in Ni-base alloys and FM’s. The following material
describes specific factors that were influenced in order to alter the STF response. This
section also covers the sample preparation for the round robin STF study.

43
5.3.1 Heat Treatments
In order to give further insights into some of the mechanisms which govern DDC
formation in Ni-base alloys, heat treatments were employed on various STF samples. The
Lindberg Horizontal Furnace at Ohio State, was used as a means to conduct heat
treatments on STF samples in order to examine the effect of increased grain size and
varying precipitate morphology on ductility-dip crack formation. Two heat treatments
were employed on 4 STF samples constructed from ¼” thick plate of Inconel Alloy-600
and compared to the as welded Inconel Alloy-600 samples testing in the initial stages of
phase II. Heat treatment schedules for phase II of testing may be viewed in Table 11,
along with average grain size measurements. Grain size was measured by averaging the
width per grain of consecutive grains in a radial pattern. Heat treated samples were then
run through the STF testing procedure to examine the effect of grain size on the STF
quantification thresholds (εmin).
It should be noted that increasing a materials grain size will result in increased
strain concentration per grain boundary, (due to a decrease in grain boundary area per
unit volume), and therefore a reduced amount of grain boundaries to distribute localized
strain induced in each sample. This may result in STF threshold values that are much
lower than originally seen in the as welded samples. Special attention was given to the
degree of tortuosity of MGBs in these heat treated samples. The results section of this
thesis will make an effort to relate grain boundary tortuosity as well as grain size
measurements to DDC susceptibility.

44
Table 11: Heat treatment schedules used on STF samples in Phase II.
Heat Treatment
Grain Size (Microns/grain)
As Welded 176
1200°C for 10 hrs.
225
1200°C for 20 hrs.
247
5.3.2 Oxygen Additions
The effect of impurity elements on crack formation has been studied in many
alloy systems. Specific to this study, Collins sought out the effect of hydrogen and sulfur
on DDC formation in two nickel-based filler metals [18]. It was found that both
impurities, H and S, increased the susceptibility of DDC and lowered the effective εmin.
Hydrogen, which was added in through the shielding gas, seemed to be most significant
in lowering the strain threshold.
Continued efforts to study the significance of impurity element concentration on
DDC formation was examined in this study with the use of a mixed Ar-2%O2 shielding
gas. Autogenous GTAW spot welds were made on nickel 600 and 625, utilizing this
shielding gas mixture to determine the effect oxygen has on the STF strain threshold.
Once spot welds were completed on specified STF samples, the samples were run
through the STF testing procedure as usual and results were compared to samples
prepared with 100%Ar shielding gas. The effects of oxygen concentration on DDC

45
formation will be discussed in depth in the results section of this thesis. Previous studies
have confirmed that increased oxygen concentrations result in grain boundary
embrittlement and therefor reduced increased temperature ductility [52].
5.3.3 Limited Material Sample Preparation
A new STF testing procedure was developed for testing materials in limited
supply. This was initially an attempt to conduct STF testing on wire for the “development
of a high-Cr, Ni-base alloy for nuclear power applications” project. Conical holes were
drilled into the gauge section of existing STF samples in order to make a space for new
material to be welded in. Small weight buttons were then made via an autogenous GTAW
torch in order to fit into the conical hole within the STF sample. A Jetline GTAW side
beam was then used to melt the button into the conical hole of the STF sample for further
testing. Excess material was then ground flat before continuing with the spot weld and
Gleeble testing. A step by step figure of the “new” STF procedure developed at OSU is
shown in Figure 13: STF sequence for “newly” developed STF testing procedure.. This
test proved useful for testing materials that were in limited supply and STF tests were run
for Hf-bearing alloys that were in the process of being developed for a FM development
project currently being conducted at OSU. Further testing may be required to confirm the
repeatability of this method. It is thought that there may be some lack of fusion effect
influencing DDC formation, but this has yet to be concluded.

46
Figure 13: STF sequence for “newly” developed STF testing procedure.
5.3.4 STF Digital Image Correlation
The final stage of this work was to conduct a digital image correlation (DIC) of
STF specimen gauge sections via a spray paint pixel methodology. DIC software, NCorr,
converts a painted speckle pattern (as shown in Figure 14), on STF sample gauge sections
to a strain gradient based on pixel displacement, allowing for accurate and localized
strain measurements on samples tested. This was conducted in an effort to confirm strain
calculations that had been previously measured via an indentation spacing on the side of
each sample. Indentation marks were measured before and after testing and were used to
determine the percent strain for the particular sample. DIC analysis was also used as a
means to identify strain concentrations which may be associated with crack initiation
sites. The use of DIC to observe grain boundary strain concentrations was the original
intention of this work, however problems with high resolution imaging made this

47
difficult. Future work related to DIC analysis on STF specimens will attempt to complete
this work.
Figure 14: DIC painted speckle pattern on STF sample gauge section.
Equation 1: Strain equation
5.4 Round Robin Sample Fabrication and Preparation
Phase III of testing in this experimentation was a STF “round robin” study
comprising samples manufactured from three participating companies (WSI, Special
Metals, and EPRI). Each respective company fabricates STF samples in a way that
represents their weld procedures specification in industrial applications. The design of
this round robin study was to determine how weld procedure influences DDC formation
in three heats of Ni-base FM-52M (EXOA51P, NX4720TK, and NX5213TK). This phase
𝜀 =𝛥𝑙
𝑙∗ 100

48
of testing also helps gives some further insight into the formation of DDC in Ni-base
FM’s and may help influence future weld procedure developments in nuclear power
applications. Filler metal compositions for each heat of FM-52M used in this study may
be observed in section 5.1 in Table 5, followed by weld procedure specifications that
were used by each respective company to fabricate their STF samples in Table 12.
Further details on STF sample fabrication will be discussed in the following sections.
Table 12: Weld procedure specification for the fabrication of STF samples in the round
robin study.
5.4.1 WSI/AZZ Sample Fabrication
As represented by Table 12, 10 samples of each respective filler metal of FM-52M
were supplied by AZZ/WSI LLC for round robin STF testing. The point of this testing was
to measure the propensity for DDC in each of these heats of FM-52M and to relate that to
Company Samples Heat BM FM Weld Process Wire diam. I (amps) V (volts) Polarity Shielding Gas Interpass Temp TS (in/min)
10 NX5213TK 0.035 200 9.8 350 3.3
10 EX0A51P 0.023 200 9.8 350 3.3
10 NX4720TK 0.035 200 9.8 350 3.3
10 NX5213TK 0.045 220 30 350 7
10 EX0A51P 0.045 200-240 29-31 350 7
10 NX4720TK 0.045 200-240 29-31 350 7
11 NX5213TK 0.035 155 10 N/A 4
11 EX0A51P 0.045 180/150 9.8 N/A 4
11 NX4720TK 0.035 160/150 10.2 N/A 4
GTAW
DCEN
DCEP
WSI/AZZ
Special
Metals
EPRI
-
690
600
52M
GTAW
GMAW
DCEN
100% Ar

49
sample fabrication mockups generated by AZZ/WSI. The results of the round robin study
will give further insight into fabrication techniques that may be used to avoid micro-
fissuring in Structural Weld Overlays (SWOL’s) that are generated by this company [53].
Sample fabrication is conducted by generating a GTAW overlay buildup of the desired
filler metals to be tested, in this case FM-52M, on an ER308L stainless steel buffer layer,
as shown in Figure 15. Weld procedure specification for each pass of the SWOL mockup
may be seen in Table 13, indicating that 5 passes are made to complete the mockup. STF
samples are then plasma cut from the overlay to the desired geometry, yielding an STF
specimen that is composed entirely of deposited weld metal [53]. This is in contrary to the
typical STF specimen where samples are fabricated either entirely from the desired base
material via a ¼” thick plate or a via a groove joint configuration with a dissimilar metal
weld. 10 samples for each heat of FM-52M were fabricated this way and then STF tested
with the parameters generated during the optimization phase of this research.

50
Figure 15: Schematic of WSI/AZZ’s STF sample fabrication.
Table 13: Parameters associated with the fabrication of WSI’s STF samples.
Layer Amps Volts Travel (in/min) Wire Inter-pass Temp.
Stainless Buffer 180 9.8 3.3 90 212°F
#1 186 9.7 3.6 67 350°F
#2 215 9.9 3.1 70 350°F
#3 200 9.8 3.3 90 350°F
#4 200 9.8 3.3 90 350°F
#5* 200 9.8 3.3 90 350°F

51
5.4.2 Special Metals Sample Fabrication
As indicated by Table 12, 10 samples of each heat of FM-52M were prepared by
Special Metals Corporation and sent to OSU for round robin STF testing. Special Metals
Co. fabricates their STF samples via the traditional groove joint configuration, shown in
Figure 16, with a dissimilar metal welding operation. A 75 degree (included angle)
groove is machined into a ¾” thick plate of INCONEL Alloy-690 base material. A
GMAW process utilizing 0.045” diameter filler wire of INCONEL FM-52M is used to
fill the groove, and represents the gauge section of each STF sample. Upon completion of
welding, samples are water-jet cut to a thickness of just over ¼” and then ground to the
final thickness of 0.25”. It should be noted that samples from Special Metals Co. were
received without the sample gauge section, requiring additional manufacturing before
testing could be completed. Weld procedures specifications for the fabrication of these
samples may be viewed in Table 12. Samples provided by Special Metals are the only
samples out of the three participating companies that utilized a GMAW process as a
fabrication method. It should be noted that historically, samples provided by Special
Metals have performed worse than those provided by competing companies. This may be
due to the increased heat input required to deposit weld metal via a GMAW process or
the increased travel speed utilized in the weld fabrication technique. Insights into why
this might be the case will be discussed in the results section of this thesis as well as
results of the round robin STF testing.

52
Figure 16: Special Metals Co. STF sample fabrication for the round robin STF study.

53
5.4.3 EPRI Sample Fabrication
The Electric Power Research Institute (EPRI) provided 11 samples for each heat
of FM-52M to complete STF round robin testing at OSU. Fabrication was completed
using a ½” U-groove with a 2” A-36 steel backing plate to prevent distortion during
welding. INCONEL Alloy-600 was used as the base material and 3 U-grooves were
machined into the 18” long plate, as can be observed in Figure 17. U-grooves are filled
with a GTAW process with the desired filler metal for testing (in this case 3 heats of FM-
52M) in accordance with the weld procedure specification listed in Table 12 After
welding, the A-36 steel backing plate is removed and then flattened in a press in order to
reduce any distortion that may have occurred during welding. The top of the plate is then
machined flat and then flipped over to machine to the final ¼” thickness required for the
STF samples. STF samples are then water-jet cut from the remaining ¼” thick plate to the
desired geometry, resulting in specimens that are produced from the top 2/3rds of the
joint configuration. A special current pulsing mechanism is used to produce the welds
with a 180 peak current and 150 background current. STF results for these specific
specimens are recorded and compared in the results section of this thesis.

54
Figure 17: EPRI sample fabrication for round robin STF study.
5.5 Sample Characterization
5.5.1 Optical Microscopy
The use of optical microscopy is necessary to examine tested sample surfaces to
for crack formation as well as to observe solidification microstructure that may have led
to or helped resist DDC formation. Crack detection is conducted with a Phillips XL-30-
FEG as well as a Nikon SMZ1000 from 30-70X magnification. Due to the depth of
cracks on the sample surface, cracks may easily be detected by intergranular “dark
areas,” where light does not return through the optical lens. Cracks within the spot welds
are recorded on each side of the sample gauge sections and then averaged for each
particular sample. It should be noted that cracks that are observed outside of the spot

55
welded area should not be counted as a ductility-dip crack unless otherwise specified by
the user.
Photomicrographs were taken of selected sample that have gone through the STF
testing procedure. Selected samples were prepared using standard polishing and etching
techniques. The use of an electrolytic, 10% chromic acid etch at 5 volts and 1 amp for
approximately 5-10 seconds was used to reveal sample microstructures. Special attention
was paid to grain size, grain boundary tortuosity, precipitate morphology, and crack
formation/location. Various alloy samples were compared to one another to give some
insight to the mechanisms governing DDC formation in Ni-base alloys.
Photomicrographs of selected samples may be viewed in the results section of this thesis.
5.5.2 Scanning Electron Microscope
A Scanning Electron Microscope (SEM), located at the Center for Electron
Microscopy and Analysis (CEMAS) [54], at The Ohio State University in Columbus,
Ohio was used for all electron microscopy in this study. Selected samples were prepared
and brought to CEMAS for imaging and Energy Dispersive Spectroscopy (EDS)
chemical analysis. The Phillips XL-30 ESEM was used for general imaging as well as
EDS chemical analysis. Fracture surface morphological features were given special
attention with ESEM imagining to ensure crack morphology was that of DDC. A smooth
intergranular fracture surface was to be expected for DDC formation and images as well
as morphological fracture features may be further examined in the results section of this
thesis. Chemical analysis also helped discover compositional gradients adjacent to

56
fracture features and at precipitates to examine their effect on crack formation. The
Quanta SEM, which uses a tungsten electrode source, was generally used for lower
resolution optical microscopy due to the limited resolution of this SEM. It should be
noted that all SEM analysis was performed in a high vacuum (HV) at 15-20 KeV with a
spot size of 3-5.

57
Chapter 6: Results and Discussion
The following section includes STF results for Phase’s I-V in this study, which
are as follows:
1. Phase I: Optimization of the STF GTA spot welding procedure and the STF
Gleeble-based procedure for Ni-base alloys and filler metals.
2. Phase II: STF testing of various Ni-base alloys to give insight into factors
promoting DDC formation in these alloys.
3. Phase III: Round robin STF study determining the influence of fabrication method
and heat to heat variation on DDC response.
4. Phase IV: Develop a new STF testing procedure for materials that are in limited
quantities.
5. Phase V: Conduct a digital image correlation (DIC) of an STF specimen to
produce a macroscopic strain map on sample gauge sections.
A discussion will be presented in conjunction with the results to give insights into
why specific materials responded certain ways and potential mechanisms that resulted in
the formation of DDC. Photomicrographs are presented as well as fracture morphology
studies in order to characterize DDC in selected materials. Further metallographic studies

58
may be required to make more insights into the mechanisms governing DDC formation in
Ni-base alloys and FM’s, and will be presented in the future work section of this thesis.
6.1 Phase I: STF Parameter “Re-Optimization”
In the past decade or so, problems with ductility dip cracking has been reported in
a number of Ni-base alloys used in the nuclear power industry [2, 5]. The push for DDC
resistant alloys in these industries has led to the “re-optimization” of the Strain-To-
Fracture testing procedure that was originally developed at Ohio State with the use of
Austenitic Stainless Steels (304 and 310) [14-16]. It was imperative to ensure that the
STF testing procedure was optimized in accordance with Ni-base alloys to ensure the
accuracy of the results that were being produced. For this reason, Phase I of testing in this
research focuses initially on, the optimization of the GTA spot welding procedure
associated with the STF test, followed by the optimization of some important variables
used in the Gleeble-based portion of testing. It was necessary to find a range of
parameters that would be robust to the STF test and insensitive to slight variable changes.
The initial GTA spot weld is conducted on the gauge section of every STF specimen
before testing continues, making the parameters used to generate this autogenous weld
very important. It was imperative to see if slight variable changes in the spot welding
parameters would result in microstructural changes that would yield different strain
thresholds to produce fracture. If this is the case, it would be necessary to ensure that the
same exact variables were used for every GTA spot weld produced (i.e. voltage, current,
arc length, etc.). The same applies to the Gleeble-based portion of testing. Variables must

59
be consistent in producing results even if there are slight changes in stroke, stroke rate,
peak temperature, etc. A design of experimentation (DOE) was conducted on both
portions of the STF test in order to ensure a robust parameter set was being used in both
phases of testing for Ni-base alloys.
The following sections discuss the results of the GTA spot weld optimization as
well as the Gleeble-based portion of testing, including variables that were evaluated as
well as how individual variables influenced STF outputs. It should be noted that Inconel
Alloy-690 was used as the baseline alloy for the spot weld optimization testing and
Inconel Alloy-600 as well as Inconel Alloy-690 were used for the Gleeble-based portion
of testing. Alloy compositions for both of these Ni-base alloys were provided in section
5.1 in Table 4. These alloys were used as the baseline alloys due to their predominant use
in the nuclear power industry as well as their inherent problems with DDC in highly
restrained weldments at intermediate temperatures.
6.1.1 GTA Spot Weld Optimization
The importance of the autogenous GTA spot weld on the gauge section of each
individual STF specimen cannot be understated. Spot welding parameters were designed
to induce columnar growth in a 360 degree radial pattern in order to produce a multitude
of migrated grain boundaries (MGBs) with various grain boundary orientations relative to
the applied loading direction, which would later be experienced in the Gleeble. Many
researchers have studied the effect of grain boundary orientation relative to the applied
loading direction [13, 51] and found that creep rupture (DDC is a creep-like phenomenon
[13]) only occurs in a transverse (+/- 45°) orientation relative to the applied loading

60
direction. This means that DDC is never found in a parallel orientation to the applied
loading direction in the autogenous spot weld on STF specimens, due to the mechanism
of creep rupture in austenitic (FCC) alloys [51].
DDC formation in Ni-base alloys has also proven to be highly dependent on grain
size and MGB tortuosity [8, 9, 18, 35, 42]. The tortuosity of a MGB is a measure of its
relative “curviness” with more tortuous grain boundaries being less susceptible to crack
propagation. Specimens with increased grain size experience a reduced grain boundary
area per unit volume, which would act to increase the amount of strain localized on a
specific grain boundary under loading or restraint conditions. Due to the fact that DDC
occurs due to ductility “exhaustion” at a grain boundary [9], specimens with increased
grain size would experience an increased susceptibility to DDC formation. A reduced
grain boundary area per unit volume results in a limited distribution of localized strain
concentration along these boundaries making grain size a critical feature in predicting
DDC susceptibility of a particular alloy.
The fact that DDC susceptibility is highly dependent on microstructural features
of a particular STF specimen means that the autogenous GTA spot welding procedure,
that precedes STF testing in the Gleeble, must produce repeatable microstructural
features from specimen to specimen. Current autogenous GTA spot welding parameters
that are used to generate sample spot welds may be found in Table 14. Highlighted
features in this table indicate variables that were examined further in the optimization
process. The time at peak current, the peak current, and the current downslope time have
the most significant impact of the weld metal microstructure size and distribution of
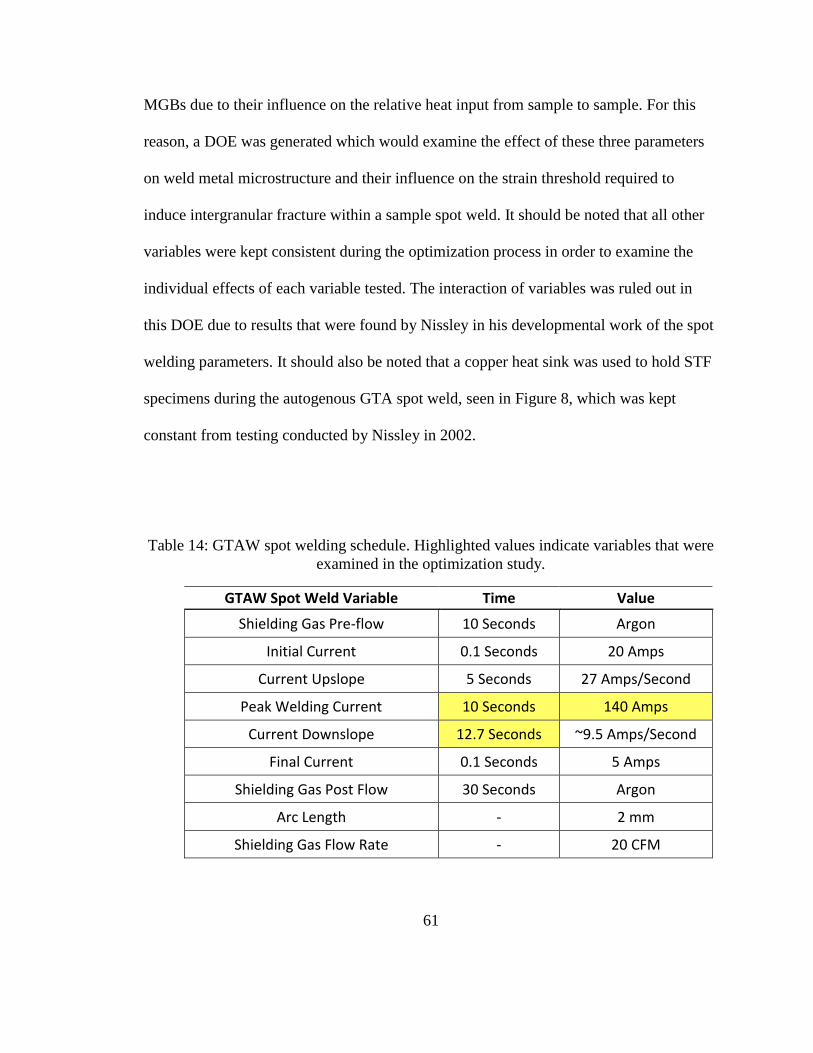
61
MGBs due to their influence on the relative heat input from sample to sample. For this
reason, a DOE was generated which would examine the effect of these three parameters
on weld metal microstructure and their influence on the strain threshold required to
induce intergranular fracture within a sample spot weld. It should be noted that all other
variables were kept consistent during the optimization process in order to examine the
individual effects of each variable tested. The interaction of variables was ruled out in
this DOE due to results that were found by Nissley in his developmental work of the spot
welding parameters. It should also be noted that a copper heat sink was used to hold STF
specimens during the autogenous GTA spot weld, seen in Figure 8, which was kept
constant from testing conducted by Nissley in 2002.
Table 14: GTAW spot welding schedule. Highlighted values indicate variables that were
examined in the optimization study.
GTAW Spot Weld Variable Time Value
Shielding Gas Pre-flow 10 Seconds Argon
Initial Current 0.1 Seconds 20 Amps
Current Upslope 5 Seconds 27 Amps/Second
Peak Welding Current 10 Seconds 140 Amps
Current Downslope 12.7 Seconds ~9.5 Amps/Second
Final Current 0.1 Seconds 5 Amps
Shielding Gas Post Flow 30 Seconds Argon
Arc Length - 2 mm
Shielding Gas Flow Rate - 20 CFM
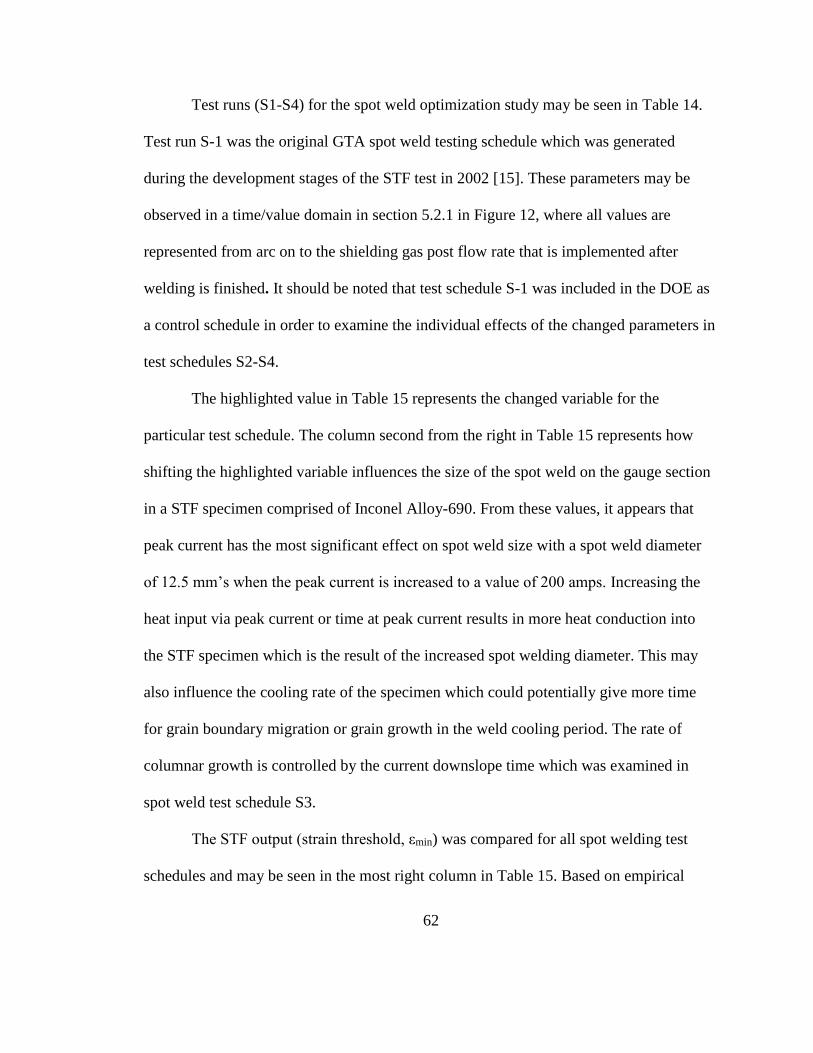
62
Test runs (S1-S4) for the spot weld optimization study may be seen in Table 14.
Test run S-1 was the original GTA spot weld testing schedule which was generated
during the development stages of the STF test in 2002 [15]. These parameters may be
observed in a time/value domain in section 5.2.1 in Figure 12, where all values are
represented from arc on to the shielding gas post flow rate that is implemented after
welding is finished. It should be noted that test schedule S-1 was included in the DOE as
a control schedule in order to examine the individual effects of the changed parameters in
test schedules S2-S4.
The highlighted value in Table 15 represents the changed variable for the
particular test schedule. The column second from the right in Table 15 represents how
shifting the highlighted variable influences the size of the spot weld on the gauge section
in a STF specimen comprised of Inconel Alloy-690. From these values, it appears that
peak current has the most significant effect on spot weld size with a spot weld diameter
of 12.5 mm’s when the peak current is increased to a value of 200 amps. Increasing the
heat input via peak current or time at peak current results in more heat conduction into
the STF specimen which is the result of the increased spot welding diameter. This may
also influence the cooling rate of the specimen which could potentially give more time
for grain boundary migration or grain growth in the weld cooling period. The rate of
columnar growth is controlled by the current downslope time which was examined in
spot weld test schedule S3.
The STF output (strain threshold, εmin) was compared for all spot welding test
schedules and may be seen in the most right column in Table 15. Based on empirical

63
results of the spot welding diameter changes from test runs S1-S4, it could be predicted
that shifting spot welding parameters (especially the ones that result in increased heat
input into the STF specimen) would result in variable STF strain thresholds to induce
DDC formation. This however, was not the case as the strain threshold values for testing
schedules S1-S3 were all around 8% strain. This means that it took about 8% localized
strain to cause intergranular crack formation in the spot weld of each sample tested. The
strain threshold for test run S4 was at about 10% which is actually the opposite of what
was predicted. It was initially thought that increasing the peak current, resulting in
increased heat input and therefore slower cooling rate, would result in a sample with
larger grains that is known to be more susceptible to DDC formation. This testing
schedule may require further analysis as a limited amount of samples were used for this
optimization study. It is still not clear how many samples must be tested via the STF
testing procedure to produce statistically validated results. From this testing however, it
can be concluded that slight variations in spot welding parameters have no significant
effect on the STF output, meaning that the parameter set originally chosen by Nissley is
in a robust range that ensures sample repeatability. Cracking vs. strain charts for each
spot weld test run may be observed graphically in Figure 18 to get a better sense of the
STF performance for each trial run. All test runs (S1-S4) followed the same general
pattern in the crack vs strain chart confirming the robustness and repeatability of the
parameter sets chosen. This might signify that microstructural changes were not
significant enough from one test run to another to produce variation in strain threshold to

64
cause cracking. Microstructural variations may need to be much more significant in order
to influence the STF output.
Table 15: Spot welding DOE used in optimization study for Inconel Alloy-690
specimens.
Original
Paramter Set
Changed
Variable
RunPeak
Current (I)
Time at Peak
Current (s)
Current Downslope
Time (s)
Avg Spot
Diameter (mm)
Strain Threshold
(εmin)
Spot Weld DOE Parameters
8
7.9
8.3
10
12.7
12.7
25
12.7
8.9
10.9
9.4
12.510
10
20
10
140
S-1
S-2
S-3
S-4
140
140
200

65
Figure 18: STF output data for the STF spot weld optimization study.
6.1.2 Gleeble Parameter Optimization
The Gleeble-based portion of the STF testing procedure has the most direct effect
on the STF testing results. This stage of testing is required for temperature
homogenization of the sample gauge section to a temperature within the ductility dip
temperature range (DTR) as well as strain localization to exceed the strain threshold of
each particular sample in order to induce DDC formation. A preliminary DOE was
conducted during the developmental stages of the STF testing procedure with type 310
SS in order to develop a set of initial standard Gleeble-parameters, which may be viewed
in section 2.6 of this thesis. Due to industrial demands for the use of Ni-base alloys in the
nuclear power generation industry, the Gleeble portion of the STF testing procedure must
be “re-optimized” to ensure that slight variations in Gleeble parameters will yield the
0
1
2
3
4
5
6
7
5 6 7 8 9 10 11 12
Cra
ck C
ou
nt
Percent Strain
Spot Weld DOE - STF Data
S-1
S-2
S-3
S-4

66
same result when utilizing Ni-base alloys and filler metals. It is necessary to create a
robust parameter set that will ensure sample repeatability and accuracy when dealing with
specialty alloys like those used in the nuclear power industry. Like the spot welding
optimization, a new DOE must also be conducted for the Gleeble thermo-mechanical
parameters used to run the STF testing procedure. Testing was conducted with two Ni-
base alloy systems in this case to ensure sample repeatability. INCONEL Alloy-600 as
well as INCONEL Alloy-690 were run through a series of testing procedures to check the
influence on individual parameters generated by the Gleeble.
Initially, multiple variables were considered for the optimization of the Gleeble-
based portion of the STF testing procedure. Testing temperature, stroke rate, heating rate
to test temperature, hold time at the testing temperature, and the use of multiple heating
cycles were considered important variables in this stage of testing. It was later determined
that a few of these variables were non-essential variables in the optimization of the STF
test due to their insensitivity to the testing output.
It is already determined that the peak testing temperature (°C) controls the point
in the ductility-dip temperature range that the specific sample is in. As long as this
variable is kept constant from one sample to the next, without much fluctuation (+/- 5°C),
the position in the DTR would remain the same and therefore the strain threshold would
as well. Due to this knowledge, the testing temperature was kept at a constant 950°C for
the remainder of the testing procedure. Previous research indicated that 950°C is a typical
low point within the DTR envelope of Ni-base alloys and FM’s which would eliminate
variation in output data given some temperature fluctuation.

67
Heating rate to the testing temperature was initially considered a significant
variable due to the variations in testing microstructure that may occur with different
heating rates. This was however thrown out, due to the fact that diffusion rates in FCC
materials are generally slower [30] resulting in similar sample microstructures regardless
of heating rate. It was also determined by Nissley that heating rates of 10°C/sec and
100°C/sec yielded no difference in producing threshold values. Accordingly, a value of
100°C/sec was selected for the remainder of the tests, due to the fact that it closely
matches what occurs in a GTA weld as well as to reduce the time required to get to the
testing temperature.
The use of multiple heating cycles was considered an important and practical
factor for the STF testing environment. Multiple heating cycles may resemble multi-pass
welding conditions and allow for “subsequent” passes to be made on the same specimen.
This variable was later thrown out however, due to the complexity it would add to the
testing environment. While this may be an important variable to test in future studies, it
was not selected for the “re-optimization” phase of the STF testing procedure. As long as
only one heating cycle was generated for each respective sample that was tested, results
would yield a repeatable value. The presumption here is that DDC occurs on-heating
during the first reheat cycle into the DTR.
According to the literature [31, 55, 56], the value of stroke rate, or the rate at
which the jaws induce the strain within the sample, is considered an important variable in
influencing grain boundary sliding characteristics. Due to the fact that DDC is a grain
boundary sliding phenomenon [9], the stroke rate parameter must be further evaluated in
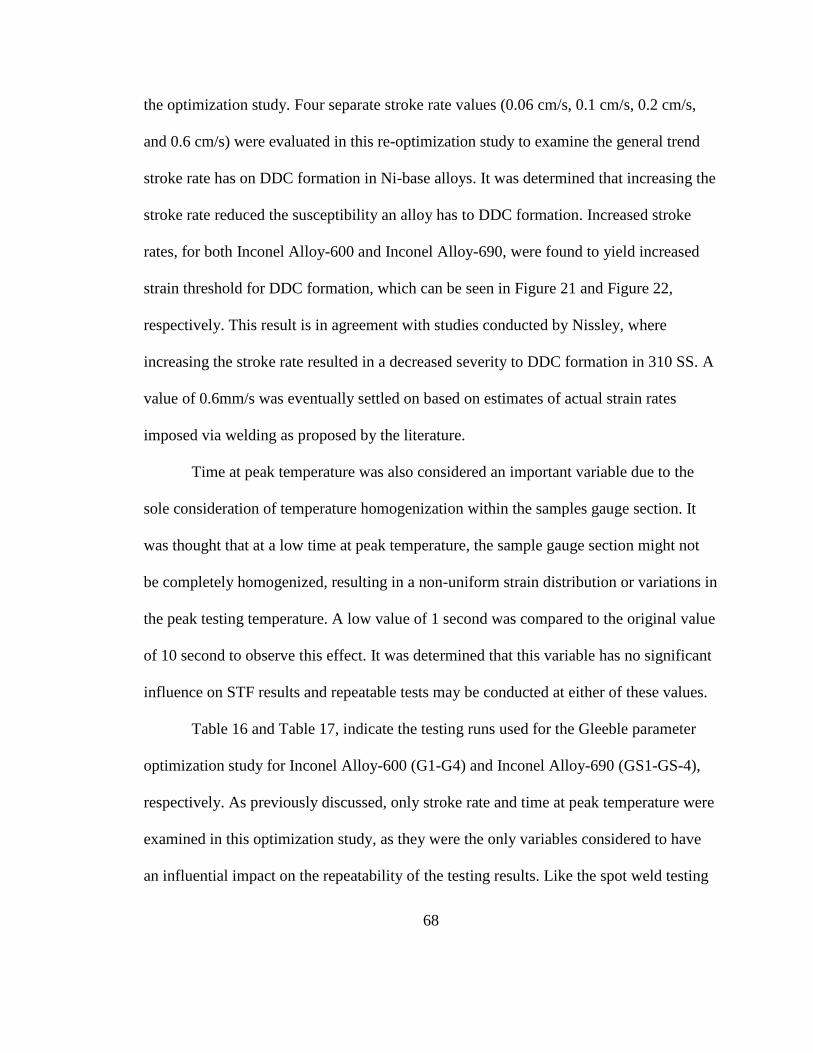
68
the optimization study. Four separate stroke rate values (0.06 cm/s, 0.1 cm/s, 0.2 cm/s,
and 0.6 cm/s) were evaluated in this re-optimization study to examine the general trend
stroke rate has on DDC formation in Ni-base alloys. It was determined that increasing the
stroke rate reduced the susceptibility an alloy has to DDC formation. Increased stroke
rates, for both Inconel Alloy-600 and Inconel Alloy-690, were found to yield increased
strain threshold for DDC formation, which can be seen in Figure 21 and Figure 22,
respectively. This result is in agreement with studies conducted by Nissley, where
increasing the stroke rate resulted in a decreased severity to DDC formation in 310 SS. A
value of 0.6mm/s was eventually settled on based on estimates of actual strain rates
imposed via welding as proposed by the literature.
Time at peak temperature was also considered an important variable due to the
sole consideration of temperature homogenization within the samples gauge section. It
was thought that at a low time at peak temperature, the sample gauge section might not
be completely homogenized, resulting in a non-uniform strain distribution or variations in
the peak testing temperature. A low value of 1 second was compared to the original value
of 10 second to observe this effect. It was determined that this variable has no significant
influence on STF results and repeatable tests may be conducted at either of these values.
Table 16 and Table 17, indicate the testing runs used for the Gleeble parameter
optimization study for Inconel Alloy-600 (G1-G4) and Inconel Alloy-690 (GS1-GS-4),
respectively. As previously discussed, only stroke rate and time at peak temperature were
examined in this optimization study, as they were the only variables considered to have
an influential impact on the repeatability of the testing results. Like the spot weld testing

69
DOE, highlighted variables indicate the changed variable for the particular test run and
test run G-3 (Alloy-600) and GS-3 (Alloy-690) indicate the original testing schedule that
was developed by Nissley to be used as a control test run.
The results indicate that the stroke rate is the only important variable in altering
the repeatability of the test runs, with an increased stroke rate resulting in an increased
strain threshold required to induce DDC formation in both Ni-alloys tested. The
relationship between the stroke rate and the strain threshold value is represented in Figure
21 for Alloy-600 and Figure 22for Alloy-690, both of which show a similar trend. It was
however, determined that there is a robust parameter value between 0.06cm/s and
0.1cm/s (test runs G3/GS3 and G5/GS5) indicating that slight variations in the stroke rate
would yield repeatable results. This means that the testing stroke rate variable that was
generated by Nissley during the developmental stages of the STF test in 2002 is also
valid for Ni-base alloys.
As previously stated, the DOE found no significance in variations of the time at
the testing temperature as both test runs, G3/GS3 and G4/GS4, yielded the same strain
threshold. Cracking vs. strain information for Inconel Alloy-600 may be viewed in Figure
19 to get a better understanding of the performance of the samples tested. It should be
noted that a stroke-strain relationship was developed for Inconel Alloy-600 in order to be
able to predict the strain value that would be outputted from the input stroke value. This
relationship may be seen in Figure 20, and can be used to produce desired strain levels
for Ni-base alloys while employing the STF testing procedure.

70
Table 16: Gleeble DOE during the optimization study for Inconel Alloy-600.
Gleeble DOE Parameters - Inconel Alloy - 600
Run Stroke Rate
(cm/s) Time at Peak
Temp (s) Peak Temp
(ºC) Threshold, εmin (percent strain)
Slope
G-1 0.6 10 950 10.5 0.68
G-2 0.2 10 950 9 0.62
G-3 0.06 10 950 8 5.7
G-4 0.06 1 950 8 2.2
G-5 0.1 10 950 8 1.08
Original Parameter Set
Changed Variable

71
Figure 19: Cracking vs. Strain data for STF testing of Inconel Alloy-600 re-optimization
study.
Figure 20: Stroke-Strain relationship used to predict strain values in Inconel Alloy-600
STF specimens.
0
5
10
15
20
25
30
35
6 8 10 12 14 16
Cra
cks
Percent Strain
STF Parameter DOE Strain Thresholds - Alloy 600
G-1
G-2
G-3
G-4
G-5
2
2.5
3
3.5
4
4.5
4 6 8 10 12 14 16
Stro
ke (
mm
)
Percent Strain
Stroke-Strain Relationships
G-1
G-2
G-3
G-4
G-5

72
Figure 21: Stroke rate vs. Strain threshold data showing an increasing trend between
stroke rate and minimum strain required to induce DDC.
Table 17: Gleeble optimization test runs for Inconel Alloy-690.
Gleeble DOE Parameters - Inconel Alloy 690
Run Stroke Rate
(mm/s) Time at Peak
Temp (s) Peak Temp
(ºC)
Threshold (percent strain)
Slope
GS-1 0.6 10 950 11 7.1
GS-2 0.2 10 950 10 1
GS-3 0.06 10 950 8.5 1.3
GS-4 0.06 1 950 8.7 0.9
GS-5 0.1 10 950 8.5 1.08
6
7
8
9
10
11
0 0.1 0.2 0.3 0.4 0.5 0.6 0.7
Stra
in T
hre
sho
ld
Stroke Rate (cm/s)
Stroke Rate vs. STF Threshold (Inconel 600)

73
Original Parameter Set
Changed Variable
Figure 22: Stroke rate vs. Strain threshold data for Alloy-690 STF specimens showing
similar trend to Alloy-600 specimens.
6.2 Phase II: Insight to DDC Mechanism
Phase II of testing was designed to gain some insights into the mechanisms which
govern DDC formation in Ni-base alloys. Initially, three commonly used Ni-base alloys,
of varying alloying addition and microstructure, were run through the STF testing
procedure to examine the effect of compositional fluctuation on DDC formation.
6
7
8
9
10
11
12
0 0.1 0.2 0.3 0.4 0.5 0.6 0.7
Stra
in T
hre
sho
ld
Stroke Rate (cm/s)
Stroke Rate vs Strain Threshold (Inconel 690)

74
Commercially pure Ni-200, Inconel Alloy-600, and Inconel Alloy-625 were run through
the STF testing procedure (in accordance with parameters generated in Phase I) in order
to compare the DDC susceptibility of these alloys. Nominal compositions for these alloys
(wt. %) were provided in Table 4 in section 5.1 of this thesis. The results of this testing
and a subsequent discussion on material performance will follow this introduction.
Metallographic work was also done on each alloy presented to gain an understanding of
microstructural features that may be associated with DDC response.
Following the STF work on these Ni-base alloys, a study was conducted in order
to understand the significance of oxygen concentration on DDC formation. A 98%
Argon, 2% Oxygen, shielding gas mixture was used to generate GTA spot welds on STF
samples of Inconel Alloy-600 as well as Inconel Alloy-625. These samples were then run
through the remainder of the STF testing procedure and cracking results were compared
to similar STF specimens generated with a 100% Argon shielding gas. A SEM
metallographic study will be presented and discussed in the following section in order to
understand the role oxygen plays in DDC formation.
Final work in Phase II consisted of STF sample heat treatments of Inconel Alloy-
600 to study the effect of grain size and precipitate morphology on DDC response.
Samples were given various heat treatments at 1200°C for 10 and 20 hours, respectively
to study to effect of grain size on DDC formation in these alloys. A full review of the
results will be discussed in the following section.
6.2.1 STF Testing of Various Ni-base Alloys

75
Cracking vs strain data for the STF testing of commercially pure Ni-200, Inconel
Alloy-600, and Inconel Alloy-625 are shown in Figure 23. 5-10 STF samples were run at
various strains in order to determine a threshold to initiate DDC formation at 950°C in
each respective alloy being studied. A ranking criterion of the DDC susceptibility of the
alloys testing is as follows (least to most susceptible): Alloy-625, Alloy-600, and Alloy-
200. A more in depth review of these results will be presented in the following sections
along with metallurgical characterizations of each alloy tested.
Figure 23: STF cracking data at 950°C for Phase II testing, comparing Alloy 600, 625,
and 200 DDC susceptibilities.
6.2.2 Alloy 200
Five Ni-200 STF samples were tested in this investigation and strained at various
rates to determine strain threshold values for DDC initiation. This alloy system proved to
be the most susceptible to DDC, exhibiting a threshold value of ~1% and a transition to

76
gross cracking above 2%. Gross cracking can be defined as the strain where cracking
becomes so abundant that cracks begin to connect and grow [38]. This is likely due to the
significant amount of long and non-tortuous MGBs in the weld microstructure of Ni-200.
Pure materials, such as Ni-200, can be susceptible to weld metal DDC due to their
homogenous microstructure that is free of secondary phases. On cooling, the
crystallographic portion of the solidification grain boundary will migrate via grain growth
and boundary straightening mechanisms, leading to migrated grain boundaries that are
long and non-tortuous. The lack of a secondary phase leads to free grain boundary motion
within the weld metal; resulting in large grain size and reduced MGB area. Since weld
metal DDC forms preferentially along MGBs, Ni- 200 has high a susceptibility to DDC.
This is in contrast to what was predicted by Young [3], where DDC formation is
proposed to be precipitation induced. Due to the fact that Ni-200 has no precipitates
within the weld metal microstructure, it can be concluded that Young’s theory of DDC
formation may not be applicable to this particular case of DDC formation. That does not
mean that strain concentrations do not occur around precipitates leading to void
formation and subsequent crack propagation in other alloy systems.
Metallography studies of Ni-200 samples STF tested at ~1% strain are shown in
Figure 24 (A and B). A purely austenitic (FCC) microstructure may be seen in both
photomicrographs with abundant DDC formation along weld metal MGBs. It is apparent
that crack formation initiates at grain boundary triple points in all metallographic sections
which were examined, indicating that these areas concentrate the highest amount of

77
strain. On average, DDC in Ni-200 was around 100 microns in length, and sometimes
exceeded 200 microns. This indicated the severity of crack formation in this alloy system,
and it may be concluded that highly pure austenitic materials may be very susceptible to
DDC formation.
Figure 24: Ni-200 photomicrographs exhibiting DDC formation along WM MGBs. A.)
100X magnification B.) 200X magnification.
The fracture morphology of Ni-200 is shown in Figure 25. Figure 25 A, shows the
entire ductility-dip crack with small fractures stemming off of the perpendicular
conjoining grain boundaries. From Figure 25 B-D, increasing magnification reveals a
smooth intergranular fracture morphology indicative of ductility-dip crack formation. It is
evident in this figure that the crack initiated at the grain boundary triple point in the
A B

78
center of the photo and propagated outward in both directions as strain concentrations
increased. This particular crack is rather large and has a crack length of over 600
microns, which revels the severity of cracking that occurred in this particular specimen.
Figure 25: SEM Images of a Ni-200 STF sample with increasing magnification to
observe fracture morphology features. A flat intergranular morphology is present with no
evidence of micro-ductility.
A B
C D

79
6.2.3 Inconel Alloy-600
Seven STF samples of Inconel Alloy-600 were tested in this study to determine
the strain threshold required to induce fracture in this system. It was determined that
Alloy-600 is resistant to DDC according to DuPont and Lippold [9] by having a strain
threshold greater than 6%. Cracking was not observed in this system until the induced
strain exceeded 10% and no transition to gross cracking was observed in any of the
samples tested. This is likely due to the characterization of the MGBs in this alloy system
due to increased alloying additions.
Phase identification software, JMatPro-Ni, suggests the formation of M7C3
carbides at ~1200°C in Alloy-600. The formation of secondary phases within the
austenitic matrix tend to pin grain boundaries via the grain boundary locking mechanism,
leading to the formation of tortuous MGBs. Photomicrographs of Ni-600, as seen in Figure
26 A and B, show a relatively fine grained austenitic microstructure with the presence of
small carbides along solidification and migrated grain boundaries. Grain boundaries in
Alloy 600 tend to be shorter and more tortuous (due to finer grain size), which result in
the higher strain threshold required to induce DDC formation exhibited by this material.
Cracks also tend to be much shorter with an average crack length of ~40 microns. It is
clear from these results that materials with increased alloying additions tend to be less
susceptible to DDC formation than commercially pure alloys. The extent of the
precipitation in this system is under current review and future work may be conducted on
this system to determine the precipitate composition that exists along grain boundaries. It
should be noted however, that precipitates in this system form in the solid-state condition

80
and not at the end of solidification, which would inhibit any grain boundary locking
mechanism that may otherwise occur.
Figure 26: Alloy-600 photomicrographs depicting DDC formation along WM MGBs. A.)
500X magnification B.) 1000X magnification.
Fracture morphology studies were also completed on an STF specimen of Alloy-
600 exhibiting ~18% strain. Figure 26 A and B, represent DDC formation along MGBs of
a selected specimen of Alloy-600 that has been STF tested. Figure 27 A and B, illustrate
the degree of grain boundary cracking at increased strain levels. Smooth intergranular
fracture surfaces may be viewed more closely in Figure 27 B, which confirms the presence
of DDC in this alloy. Figure 27 A shows how DDC fractures propagate along the grain
boundary until the grain boundary changes direction, where the crack propagation tends to
A B

81
stop. This is due to the tortuosity of the grain at this point, proving that DDC fractures tend
to be abundant in materials exhibiting non-tortuous MGBs.
Figure 27: SEM images of Ni-600 STF specimen showing a smooth intergranular fracture
morphology indicative of DDC.
6.2.4 Inconel Alloy-625
Ten samples of Inconel Alloy-625 were STF tested in order to determine a strain
threshold required to induce fracture for this system. It was determined that Alloy-625 is
very resistant to DDC formation, as no cracking was observed in any of the 10 samples
tested (up to 35% strain). This is likely due to the degree of secondary phases that exist in
Alloy-625. Crystallographic portions of solidification grain boundaries that would
otherwise migrate get “pinned” on secondary phase formations, resulting in a very fine
grained structure with tortuous MGBs.
Inconel Alloy-625 is the most alloyed of all materials tested in this study
containing 23 wt. % Cr, 4.15 wt. % Nb, and 10 wt. % Mo. Phase identification software
A B

82
JMatPro-Ni predicts the formation of niobium carbides (NbC) and Laves Phase at the end
of solidification which would act to prevent grain boundary migration and grain growth.
Figure 28 shows the solidification microstructure of a STF specimen of Alloy-625. As
represented by the photomicrograph, inter-dendritic regions of this material exhibit
extensive NbC as well as Laves Phase formations. Although MGB’s are difficult to
distinguish in this photomicrograph, they tend to be very tortuous in this alloy, which
contributes to the increased resistance to DDC formation.
It may be concluded that significant additions of Nb, Mo, and Cr in Alloy 625
lead to the formation of a complex, multi-phase microstructure, which is resistant to DDC
at all intermediate temperatures. This confirms other researchers, such as Ramirez [42],
who proposed that DDC may be prevented with the additions of elements that form
eutectic constituents, which have a mechanical locking effect on the migration of grain
boundaries. This also confirms that DDC susceptible alloys must contain long and non-
tortuous MGBs in order for cracking to be prevalent within the weld metal
microstructure.

83
Figure 28: Alloy-625 photomicrograph showing Interdendritic phase formation (NbC and
Laves Phase) within the austenite matrix at 500X magnification.
Previous research conducted by Ramirez and Lippold proposed that grain boundary
tortuosity has the greatest influence on DDC susceptibility [42]. Studies showed that
increasing the level of precipitate-forming elements in nickel-based filler metals, such as
niobium and titanium, may lead to grain boundaries which are more tortuous, and therefore
less susceptible to DDC. Although tortuous grain boundaries may suppress the formation
of DDC, it should be noted that the introduction of precipitate forming elements may widen
the solidification temperature range making the alloy more susceptible to solidification
cracking. Work conducted in this study supports the grain boundary tortuosity hypothesis
and crack formation seems to be suppressed with the addition of precipitation forming

84
elements in Ni-600 and Ni-625, as compared to commercially pure Ni-200. Continued
work is underway to look at the effect of recrystallization behavior on DDC susceptibility.
6.2.5 The Effect of Oxygen on DDC susceptibility
As previously mentioned, the effect of impurity element concentration was
examined in this study with the use of a Ar2%O2 shielding gas mixture utilized during the
GTA spot welding stage of testing. Three STF samples were prepared utilizing the mixed
shielding gas for both Alloys 600 and 625, while keeping all other testing variables
constant. Strain vs DDC count charts may be seen in Figure 29 A and B, for Alloy-600
and Alloy-625, respectively. The red line in these charts represents the STF specimens
that were tested with the shielding gas mixture while the blue line indicates samples
tested in the previous portion of Phase II.
The results showed a significant decrease in strain threshold required for DDC
development when oxygen concentrations are increased. The strain threshold for Ni-600
dropped from ~11% to below 7%, whereas the threshold for Ni-625 was established at
~20%. Like hydrogen, oxygen may have some factor in reducing grain boundary cohesion
resulting in an increased susceptibility to DDC in materials exhibiting critical
concentrations. Surface oxide formations tend to decrease the toughness and ductility of a
material due to the brittle nature of the oxide. The extent to which oxygen effects DDC
susceptibility and the amount required to shift threshold levels is still under investigation.

85
Figure 29: STF strain vs cracking envelope comparing 100% Argon (blue) shielding gas
vs a shielding gas mixture containing 2% oxygen (red).
6.2.6 STF Sample Heat Treatments
The final stage of Phase II was to determine the effect of grain size on DDC
susceptibility in STF samples of Inconel Alloy-600. As previously mentioned, two
sample heat treatments were conducted on four STF samples in order to increase the
relative grain size in the gauge section of tested samples. Table 18 shows the heat
treatments that were used in this study, the average sample grain sizes in the gauge
section (microns/grain) for the particular heat treatment employed, and STF strain
A
B

86
thresholds experienced for each respective test. It should be noted that sample grain size
was determined based on averaging the microns/grain in a radial direction in the gauge
section of each sample. Upon completion of the sample heat treatments, the STF testing
procedure was employed as usual. It should be noted that heat treatment schedules were
employed before the spot welding stage of testing, which means that there is some degree
of epitaxy from the base material into the spot welding microstructure. The significance
that this has on spot weld grain size is under current investigation.
As was expected, increasing the sample time in the furnace at 1200°C resulted in
increased grain size in the STF sample gauge section. Increased grain boundary mobility
and diffusion rates at increased temperatures result in the increase in grain size with high
temperature heat treatments. Also, as previously mentioned, increasing sample grain size
results in a decrease in grain boundary area per unit volume resulting in increased strain
concentration at a particular grain boundary. This is due to the fact that with larger
grained samples (reduced grain boundary area), there is less area for strain to be
distributed upon external loading or restraint conditions. As a result, each individual grain
boundary must accommodate an increased localized strain level, which may result in
ductility “exhaustion” and therefore DDC formation at a lower overall load. Figure 30
represents this phenomenon by showing how larger grained samples have a lower strain
threshold required to induce DDC formation (which was determined via the STF testing
procedure).
In fact, there appears to be a negative linear correlation between larger grain size
and strain threshold required to induce DDC in INCONEL Alloy-600 STF samples. For

87
this reason, it would be recommended to employ materials with finer grain size in the
nuclear power industry as to reduce the likelihood that DDC might form within the
materials weld metal under increased loading conditions. Further testing is being
conducted to confirm this phenomenon with other Ni-base materials and to observe how
precipitation behavior affects grain boundary mobility at increased temperatures.
Table 18: Sample heat treatment schedules employed in Phase II STF testing, including
grain size measurements in the spot weld microstructure after GTA spot welds were
generated in sample gauge sections.

88
Figure 30: Figure depicting the observed effect of grain size on sample DDC
susceptibility.
Phase III: 6.3 STF Round Robin Study
Phase III of testing was a “round robin” STF study that was designed to examine
the effect of weld process and procedure development on DDC susceptibility in STF
samples comprised of Ni-base FM-52M. Three participating companies (WSI, Special
Metals, and EPRI) provided STF samples for the study that were fabricated via their
respective manufacturing methods commonly employed in the nuclear power industry.
As a baseline material, three heats of FM-52M were used to manufacture samples to the
desired STF geometry required by the STF testing procedure in section 2.6.
Compositional data for the three heats of FM-52M used in this study was provided in
Table 5 in section 5.1. Weld procedure specifications for the fabrication of these samples
were provided in Table 12 in section 5.4, followed by detailed information on each

89
respective company’s method of manufacturing in sections 5.4.1-5.4.3. This information
may be insightful in determining mechanisms for the round robin testing results that are
compiled in the following sections. Heat to heat variations will be discussed first,
followed by a set of compiled data that examines weld procedure developmental aspects
that may have influenced STF results. A ranking system will also be provided based on
heat to heat variations as well as company fabrication methods. Future work will be
conducted in an effort to characterize metallographic characteristics of tested samples, in
order to gain some further insight into the performance of selected specimens.
AS described in section 5.4, both EPRI and WSI samples were fabricated with the
GTAW process, while Special Metals samples were fabricated with the GMAW process.
The results clearly indicate that the DDC susceptibility of Special Metals samples was
higher, which may be based on heat input, shielding gas coverage, impurity element
concentration, or geometrical features during the fabrication of specimens. Travel speed
may also be an indication of dissimilar results, as the speed of welding in Special Metals
specimens was nearly twice that of both other fabrication methods produced by WSI and
EPRI. A more in depth review of weld procedure specifications as they relate to STF
results will be discussed in the following sections.
6.3.1 NX4720TK
Compiled data for STF tested samples of FM-52M, heat NX4720TK, may be seen
in Table 19. 8-9 STF samples from each participating company were prepared and run
through the STF testing procedure in accordance with the parameters specified in section

90
2.6. Results of individual testing runs may be seen in this table as well as linearly
extrapolated strain threshold values for each respective company’s samples. It should be
noted that a stroke-strain relationship, developed in Phase I of testing, was used as a
means to influence the strain within each tested sample.
Based on the STF results presented in Table 19, for heat NX4720TK, it is clear
that the Special Metals samples had the highest DDC susceptibility with a strain
threshold of only 3.7%. WSI samples were slightly more resistant to DDC formation with
a strain threshold of 6.5%, followed by EPRI samples, which performed the best, having
a strain threshold value of 7.2%. As previously mentioned, the strain threshold indicates
the required strain to induce DDC formation within a tested sample, therefore all samples
tested at a strain over the strain threshold should contain DDC formations along MGBs.
It should be noted that only STF samples produced by Special Metals
demonstrated a transition to gross cracking, while all other samples tested showed
minimal DDC formations indicating reduced susceptibility. Samples fabricated by EPRI
showed a clear favorability in this testing format while employing heat NX4720TK of
FM-52M.

91
Table 19: Round robin STF data for FM-52M heat NX4720TK
6.3.2 NX5213TK
Table 20 shows the STF data for round robin specimens produced with heat
NX5213TK. Similar to the previous heat tested, 8-9 samples were prepared for each
participating company and run through the STF testing procedure with the newly
“optimized” parameters. Threshold values, shown in the right column in Table 20,
indicate the level of susceptibility that was observed for each companies STF specimens.
STF results, presented in the following table, indicate increased DDC susceptibly
in samples fabricated by Special Metals, with a strain threshold of 4%. Samples
Company Heat/Year Strain (%) # of Cracks Threshold
3.7 0.0
9.7 4.5
5.0 0.0
7.8 4.0
7.2 3.0
10.7 5.0
14.1 5.5
13.3 7.0
1.7 0.0
2.3 0.0
8.2 14.0
7.4 1.0
9.5 4.0
3.0 0.0
4.1 0.5
8.6 7.5
7.9 2.5
8.6 4.0
7.1 2.5
7.2 0.0
11.7 5.0
8.9 3.0
7.3 1.0
7.6 1.0
3.9 0.0
EPRINX4720TK (52M)
2015~7.2
WSINX4720TK (52M)
2015~6.5
Special MetalsNX4720TK (52M)
2015~3.7

92
fabricated by WSI and EPRI performed very similarly with strain threshold values of
5.8% and 6.1%, respectively. Special Metals samples showed very similar testing results
with that of FM-52M heat NX4720TK, while both the WSI and EPRI samples had
increased susceptibility during testing of heat NX5213TK. Again, EPRI samples showed
the highest resistance to DDC formation, although WSI samples showed similar DDC
resistance.
It should be noted that no transition to gross cracking was observed in any of the
tested samples (including a Special Metals sample tested at 14.5% strain). While this fact
does not speak for the quantification method of the STF test, it does indicate that
increased strain levels induced within samples of this heat show increased resistance to
DDC formation. Results in samples fabricated with this heat may be due to reduced
impurity concentration along weld metal MGBs that can otherwise lead to increased grain
boundary decohesion efforts at similar strain values.

93
Table 20: Round robin STF data for FM-52M heat NX5213TK.
6.3.3 EXOA51P
Round robin STF results for FM-52M, heat EXOA51P, are shown in Table 21.
Results presented in the following table indicate increased DDC resistance for all STF
specimens that were fabricated with this particular heat of FM-52M. Special Metals
samples demonstrated the highest DDC susceptibility with respect to the other
companies’ STF specimens with a resultant strain threshold value of 7.3%. However, this
is a considerable increase from the ~4.0% strain threshold that was observed in both other
heats of FM-52M. WSI samples showed a strain threshold of 8.6% and EPRI samples
showed the highest DDC resistance with a strain threshold of 9.4%. It is clear from
Company Heat/Year Strain (%) # of Cracks Threshold
10.4 5.0
9.6 4.0
5.7 0.0
7.4 1.0
8.2 3.0
7.7 2.0
7.7 1.5
3.6 0.0
6.2 1.0
5.8 0.0
5.4 1.0
4.3 1.0
1.3 0.0
9.3 2.0
8.8 1.3
10.2 1.0
14.5 4.0
6.1 0.5
8.0 1.0
8.7 1.0
7.0 1.0
8.0 2.0
10.1 7.5
8.5 2.0
11.2 4.0
EPRINX5213TK (52M)
2015~6.1
WSINX5213TK (52M)
2015~5.8
Special MetalsNX5213TK (52M)
2015~4.0

94
testing that heat EXOA51P produced the best results, showing the lowest DDC
susceptibility of all heats tested. No transitions to gross cracking were observed in any of
the samples tested and minimal DDC formations were observed in most samples.
Reduced DDC susceptibility, observed with this heat of FM-52M, may be due to
the slight increase in Zr and B additions, which are both known to improve creep
resistance. Si additions are also reduced as compared to the other heats tested which may
act to suppress grain boundary embrittlement phases that may form within the other
samples. Nb, Cr, and C concentrations in this heat of FM-52M are also slightly increased
which may result in higher volume fraction NbC or M23C6 precipitates which may act to
pin MGBs on cooling.

95
Table 21: Round robin STF results for FM-52M, heat EXOA51P.
6.3.4 Compiled Round Robin Results
The following section will provide insight into the round robin STF testing study
that was conducted at Ohio State. Compiled results of the STF round robin test may be
seen in Table 22, including strain thresholds for all 9 heats of material that were tested.
The following figures (Figure 31 and Figure 32), organize results by company and heat,
respectively, to allow comparisons to be made on heat to heat variations as well as weld
procedure developmental variations. It should be noted that all STF testing was
Company Heat/Year Strain (%) # of Cracks Threshold
7.4 0.0
10.2 0.5
17.5 4.5
8.3 0.0
8.7 0.0
8.0 0.0
7.3 0.0
19.7 6.0
13.7 3.5
4.7 0.0
9.5 1.0
5.9 0.0
11.0 2.0
18.7 8.0
10.6 1.5
11.6 6.0
9.4 1.0
12.5 2.5
7.5 0.0
8.2 0.0
8.9 0.0
16.4 7.0
3.5 0.0
12.0 1.5
22.0 13.5
EPRIEX0A51P (52M)
2015~9.4
WSIEX0A51P (52M)
2015~8.6
Special MetalsEX0A51P (52M)
2015~7.3

96
conducting with the use of consistent parameters in order to limit possible variations in
resultant data.
Table 22: Complied STF results for round robin testing
The following figure represents the STF data for the round robin testing
conducted at OSU, categorized by the various fabrication methods used to manufacture
STF samples. Based on the collected data in Figure 31, it is clear that specimens
fabricated by Special Metals showed the highest susceptibility to DDC formation during
the STF testing procedure, while EPRI samples generally showed the most resistance to
DDC formation. As previously mentioned, EPRI and WSI samples were manufactured
with a GTAW process, while Special Metals samples were fabricated via a GMAW
process. Weld procedure specifications for the sample mock-ups may be seen in Table 12
in section 5.4 of this thesis.
Company Heat Strain Threshold,
εmin
NX4720TK 6.5
NX5213TK 5.8
EXOA51P 8.6
NX4720TK 3.7
NX5213TK 4
EXOA51P 7.3
NX4720TK 7.2
NX5213TK 6.1
EXOA51P 9.4
WSI/AZZ
Special
Metals
EPRI

97
Samples provided by Special Metals Co. used a GMAW process during STF
sample fabrication to fill a 75° included groove in ¾” 690 plate. Typically, an increased
travel speed may be used with GMAW processes due to the increased material deposition
rate that is accompanied by the higher heat input of GMAW. This may result in an
increased partial pressure of oxygen (less shielding gas coverage) over the welded area,
which would result in increased oxygen segregation to weld metal grain boundaries and
therefore brittle oxide formations at these boundaries. Increased oxygen content is known
to increase DDC susceptibility and may very well be the cause of the increased DDC
response observed in Special Metals STF samples.
It has already been proven, in Phase II of this study, that increasing oxygen
concentration in the spot welding stage of STF testing results in an increase in DDC
susceptibility. Therefore, reduced shielding gas coverage in samples fabricated by Special
Metals (due to increased travel speed, and therefore reduced shielding gas coverage)
could very well lead to their hindered performance in the round robin STF study.
Poor performance of Special Metals STF samples in this study may also likely be
due to the solidification rate and heat input of the GMAW process employed. With
increased heat input, solidification rate as well as cooling rate of the weld pool is
reduced, causing more time for migration of grain boundaries or precipitation of
secondary phases. Since there are limited alloying elements in the FM-52M heats used to
manufacture these specimens, precipitation effects may not be significant enough to pin
MGBs, which may otherwise result in a tortuous grain boundary character. This would
result in increased time for MGBs to straighten, becoming less tortuous and therefore

98
more susceptible to DDC formation. GMAW processes also tend to use mixed shielding
gasses in order to create arc stabilization in the weld, however this is not the case in this
study as 100%Ar shielding gas was employed during the fabrication of samples. This
does however create a more unstable arc, which may also be a result of the poor DDC
response that was observed in this study.
According to Figure 31, EPRI samples showed the best resistance to DDC in the
round robin STF study. This is likely due to the minimal heat input that was used to
fabricate these samples, as compared to the other participating companies. A pulsed
current schedule was also used to fill U-grooves in Ni-600 plate, which may result in
dendrite fragmentation and therefore a refined grain structure that would be more
resistant to creep deformation mechanisms, such as DDC.

99
Figure 31: STF round robin results by company
As previously mentioned, STF heat to heat variations in all three heats of FM-
52M showed reduced DDC susceptibility in heat EXOA51P. Figure 32 shows a
considerable increase in strain threshold values for each respective company’s tested
samples when employing this heat, with a maximum strain threshold value of 9.4% in
samples provided by EPRI. This was due to the extent of alloying found in this particular
heat of FM-52M as compared to the other two heats tested.
Increased concentrations of Zr and B result in increased creep strength at MGBs.
Since DDC is a “creep-like” phenomenon, improving the creep life of a material may
have substantial influence on the DDC susceptibility of that particular material. Reduced
Si content in this heat, may have also resulted in improved DDC response due to limited
0
1
2
3
4
5
6
7
8
9
10
WSI/AZZ Special Metals EPRI
Stra
in T
hre
sho
ld (
% S
trai
n)
STF Round Robin Study by Company
NX4720TK
NX5213TK
EXOA51P

100
formation of grain boundary embrittlement phases that may otherwise lead to grain
boundary decohesion at reduced strain levels. The reduced partition coefficient of Si,
results in increased diffusion rates of this element at high temperatures, which may result
in increased Si concentrations at SGB’s and sub solidification grain boundaries. The
formation of brittle silicide’s at these boundaries (as predicted by JMatPro-Ni) may likely
result in decohesive efforts which contribute to DDC formation at reduced strain levels.
Reduced Si levels in EXOA51P results in improved DDC response for this reasoning.
Increased Nb, Cr, and C concentrations in heat EXOA51P may also yield an
increased resistance to DDC, due to the formation of NbC or M23C6 precipitates at the
end of solidification. Secondary phase formation, as shown in Phase II of testing, results
in MGB pinning, which results in tortuous grain boundary character that has a difficult
time propagating crack formation. While these precipitates may not necessarily stop DDC
all together, they do have an effect on the crack propagation rate, which may act to limit
the extent of crack formation.
The other two heats of FM-52M tested in this study, NX4720TK and NX5213TK,
showed similar STF results due to limited variations in material composition. Slight
variation in STF data may be a result of random scatter in the STF data or influence of
small compositional variation.

101
Figure 32: Round Robin STF data as compared by FM-52M heat.
6.3.5 Effect of Oxygen Concentration on STF Round Robin Study
The effect of oxygen on the round robin STF study was examined with the use of
an Ar/2%O2 mixed shielding gas that was employed during the GTA spot welding stage
of testing. Like Phase II of this study, the results indicated a significant deleterious effect
on DDC response when employing the mixed shielding gas containing oxygen. 2 samples
of each heat for each company were tested in this study, one side made with a 100%Ar
shielding gas while the other employed the mixed shielding gas. Results are compiled in
Table 23 and may be viewed more graphically in Figure 33. It is clear from these results
that oxygen has a negative impact on DDC resistance and may likely be due to an
embrittlement phase that is present along weld metal MGBs. Again, further work is being
conducted to determine the exact phases present along WM MGB’s in the presence of
0
1
2
3
4
5
6
7
8
9
10
NX4720TK NX5213TK EXOA51P
Stra
in T
hre
sho
ld (
% S
trai
n)
STF Round Robin Data by Heat
WSI
SM
EPRI

102
oxygen as well as quantifying a critical concentration that leads to grain boundary
degradation in Ni-base alloys and FM’s.
Table 23: Round robin STF data comparing a 98Ar/2O2 shielding gas mixture and a
100Ar shielding gas during the GTA spot weld stage of the STF test.
Company Heat/Year Strain (%)# of Cracks
(100%Ar)
# of Cracks
(98%Ar-2%O2)
7.8 4.0 4
7.2 3.0 5
8.2 3.0 3
7.7 2.0 3
7.3 0.0 5
19.7 6.0 17
11.7 5.0 6
8.9 3.0 5
7.0 1.0 8
8.0 2.0 6
8.9 0.0 1
16.4 7.0 10
7.4 1.0 4
9.5 4.0 23
1.3 0.0 0
9.3 2.0 5
18.7 8.0 15
- - -
NX4720TK (52M)
2015
NX5213TK (52M)
2015
EXOA51P (52M) 2015
NX4720TK (52M)
2015
NX5213TK (52M)
2015
EXOA51P (52M) 2015
WSI/AZZ
EPRI
NX4720TK (52M)
2015
NX5213TK (52M)
2015
EXOA51P (52M) 2015
Special
Metals

103
Figure 33: STF Round Robin study comparing oxygen presence in shielding gas mixture
to a 100% Ar shielding gas.
Phase IV: 6.4 “New” STF Testing Procedure
A new STF testing procedure was designed for testing of material that is in
quantities insufficient to produce entire STF samples (typically the case when filler wire
is not available or during material development stages). This was in conjunction with a
subsequent project being conducted at OSU which has been designed to develop a high-
Cr, Ni-base FM for nuclear power applications. The motivation for this work was in
result to the limited FM which was produced via compositional optimization studies

104
conducted at OSU for this project. Efforts to conduct weldability testing on this new FM
were hindered due to limited material availability, which required a new method of
testing.
A new STF testing procedure was created by melting small “buttons” of the
desired composition into a cavity within the gauge section of an STF sample. An
autogenous GTAW process was used to melt the testing material (button) into the
specimen cavity, which resulted in samples that contained a sufficient amount of desired
testing material within the sample gauge section. Following the melting process, the
samples were ground flat and then run through the STF testing procedure as usual. A step
by step picture sequence of this process may be seen in section 5.3.3 of this thesis.
In order to gain a better understanding of the testing environment and
effectiveness of the new procedure, results for two compositions of a Ni-Cr-Hf FM are
included in Table 24 and Error! Reference source not found.. It should be noted that only
two samples of each respective material were tested in this phase of testing, but results
indicate the effectiveness of the new procedure. The higher Hf material (indicated in
Table 24 as Ni-30Cr-2.5Hf), showed improved DDC resistance as compared to the Ni-
30Cr-0.25Hf material, which would be expected due to the increased eutectic formation
that would subsequently occur during the spot welding stage. As previously mentioned,
increased volume fraction eutectic results in highly tortuous MGBs and they are pinned
on cooling, which limits their mobility. While initial indications suggest that the new STF
testing procedure shows testing accuracy, more samples may need to be run to prove
testing repeatability.
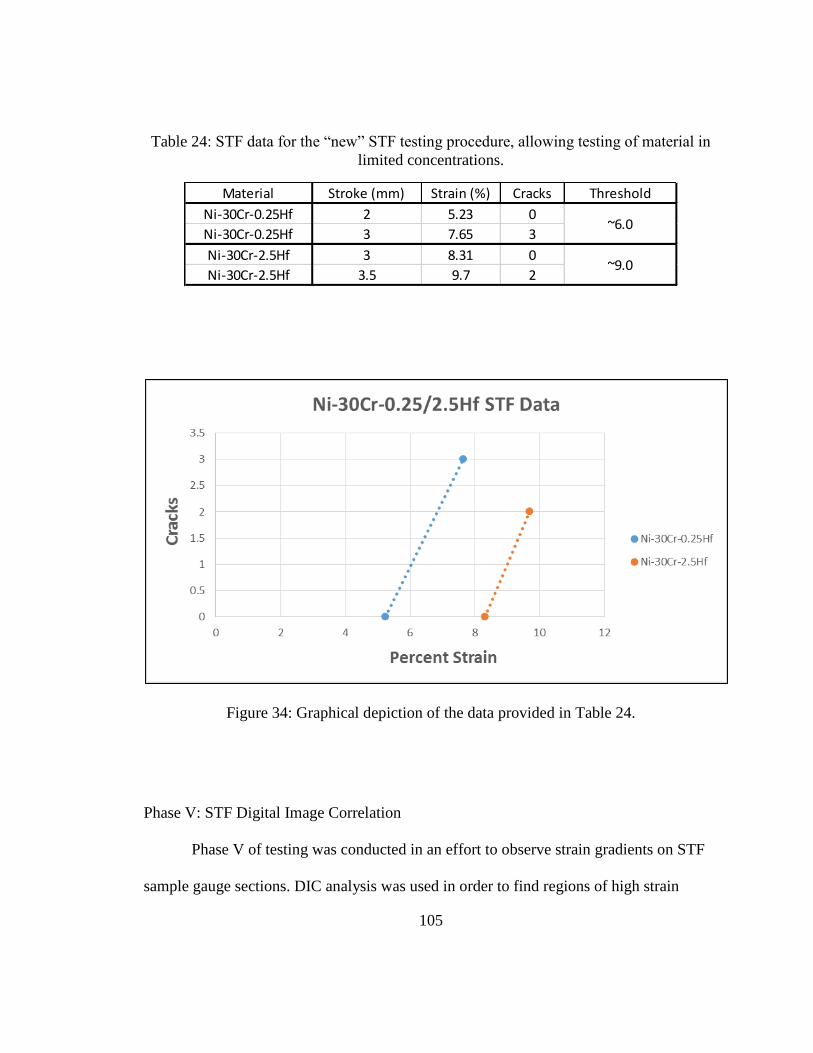
105
Table 24: STF data for the “new” STF testing procedure, allowing testing of material in
limited concentrations.
Figure 34: Graphical depiction of the data provided in Table 24.
Phase V: STF Digital Image Correlation
Phase V of testing was conducted in an effort to observe strain gradients on STF
sample gauge sections. DIC analysis was used in order to find regions of high strain
Material Stroke (mm) Strain (%) Cracks Threshold
Ni-30Cr-0.25Hf 2 5.23 0
Ni-30Cr-0.25Hf 3 7.65 3
Ni-30Cr-2.5Hf 3 8.31 0
Ni-30Cr-2.5Hf 3.5 9.7 2
~6.0
~9.0

106
concentration, where crack initiation might occur. As discussed in section 5.3.4, DIC
strain maps are generated via pixel (paint speckle) displacement in highly localized
regions and converted to strain measurements via Equation 1 and NCorr software
algorithms. Before and after strain maps, generated by the DIC software, are shown in
Figure 35 and Figure 36, respectively. Figure 36 shows a concentrated strain
measurement of ~20% in the center gauge section after testing, which matches well with
the indentation spacing calculation used, which measured ~19.5% strain. This confirms
the success of the strain measurement system that is currently in place. DIC maps do
however, show that strain in STF samples tends to be concentrated at the center of the
sample gauge section, and therefore indentation spacing measurements give a strain value
that is averaged over their width rather than a localized measurement that the DIC strain
map provides. Future work associated with STF DIC maps will be used to

107
Figure 35: STF DIC strain map before STF testing.
Figure 36: STF DIC strain map after STF testing. Strain distribution may be viewed via
the legend on the right as percent strain.

108
Chapter 7: Conclusions
1. Phase I: STF Parameter “Re-Optimization” for Ni-base alloys
a. The range of GTA spot weld parameters tested showed repeatable STF
results, indicating that microstructural variations may need to be quite
significant in order to influence DDC susceptibility.
i. GTA spot weld parameters: peak current, time at peak current, and
current downslope time, showed an insensitivity to STF testing
outputs.
b. STF optimization of Gleeble parameters showed that stroke rate (mm/sec),
or the rate at which the strain is applied to STF sample gauge sections,
influences DDC susceptibility quite significantly.
i. Increasing the sample stroke rate results in a reduced susceptibility
to DDC formation.
ii. There exists some range of insensitivity where small variations in
stroke rate do not have any effect on the strain threshold required
to induce DDC.
iii. All other parameters tested in the STF optimization study showed
an insensitivity to STF outputs.

109
c. STF parameter development in Ni-base alloys shows similar results to
those that were developed by Nissley, and STF parameters may be
employed as usual.
2. Phase II: Insight Into DDC Mechanisms
a. Pure materials, such as Ni-200, appear to have the highest susceptibility to
DDC formation with a STF strain threshold of ~1%.
i. Extensive cracking was observed in all Ni-200 samples tested.
ii. Increased grain boundary mobility, in the absence of secondary
phases, results in MGBs that are long and non-tortuous.
iii. Fracture surfaces in Ni-200 STF samples showed a smooth
intergranular morphology, indicative of DDC.
b. Inconel Alloy-600 and Inconel Alloy-625 were more resistant to DDC
formation due to inter-dendritic secondary phase formations within the
austenite matrix.
i. Inconel Alloy-600 forms intragranular carbides, which have some
influence over the DDC susceptibility of this alloy, giving STF
specimens comprised of this alloy a strain threshold of ~10%.
ii. Inconel Alloy-625 has increased Nb, C, Cr, and Mo contents,
which result in NbC precipitates and Laves Phase, making it
resistant to DDC at all strain levels tested (up to 35%).
iii. Fracture surfaces in Inconel Alloy-600 samples show some
evidence of micro-ductility.

110
3. Phase III: Round Robin STF Study
a. FM-52M Heat, EXOA51P, was most resistant to DDC formation of all
heats tested, which is most likely due to increased additions of Zr, B, Nb,
Cr, and C.
b. Specimens provided by Special Metals Co. showed the highest
susceptibility to DDC formation
i. Increased oxygen levels, most notably associated with the GMAW
process, may have contributed to grain boundary decohesive
efforts at reduced strain levels.
c. STF samples provided by EPRI showed the highest resistance to DDC
formation
i. Current pulsing may lead to dendrite fragmentation, and therefore
increased nucleation sites for new grain formation, leading to a
refined grain size in STF samples that is more resistant to DDC.
d. While external factors may have influenced STF response in the round
robin study, compositional effects are likely the most reasonable cause of
susceptibility variations between participating companies.
4. Phase IV: New STF Procedure
a. The newly developed STF testing procedure for testing materials in
limited quantities proved to be an effective testing method.
5. Phase V: STF Digital Image Correlation

111
a. The DIC analysis verified the current strain measuring system used in the
STF testing procedure.
b. Strain in more concentrated to the center of sample gauge sections that
originally thought.
6. Oxygen Measurements
a. DDC susceptibility was increased in Alloy-600 and Alloy-625 samples
that were tested with the use of an Ar/2%O2 shielding gas during the GTA
spot welding stage of testing.
b. The introduction of oxygen in the STF testing procedure likely results in
grain boundary decohesion at reduced strain levels.
7. Heat Treatments
a. High temperature heat treatments conducted on Inconel Alloy-600 STF
samples resulted in a coarse grain structure that is more susceptible to
DDC due to a reduced grain boundary area per unit volume.
i. Increased sample grain size results in incremented localized strain
concentration along sample grain boundaries and grain boundary
triple points.
8. STF Testing Procedure
a. The STF testing procedure, as it is employed at OSU, is a verifiable test in
determining a materials response to DDC susceptibility.
b. Consistent results in all Ni-base alloys and FM’s tested demonstrate the
repeatability of the STF testing procedure.

112
Chapter 8: Recommended Future Work
Based on the completed work in this thesis, the following is recommended as
future work to expand on the comprehensive understanding of DDC formation in Ni-base
alloys and FM’s.
1. The effect of oxygen concentration on DDC performance clearly has a
negative influence, as determined in the final stages of Phase II and Phase III.
Expansion on this knowledge may be critical to understanding the underlying
mechanisms which governs DDC formation in these alloys.
a. EDS testing to observe oxide formation along weld metal MGBs and
measurement of oxygen content in already tested samples.
b. TEM work to identify grain boundary phase formations.
c. Determining critical oxygen concentrations to hinder DDC
performance in Ni-base alloys and FM’s.
2. In depth metallurgical characterizations may be necessary to examine how
specific alloying additions influence a materials response in the STF testing
procedure. This may also give some heightened insight into the mechanisms
which govern DDC susceptibility in FCC materials. Samples used in Phase II
may be the best materials to understanding this approach.

113
3. Nickel-200 was used as a baseline material in order to test a simplified system
and gain valuable understanding of DDC formations.
a. Add alloying elements, such as Nb, Cr, Mo, and C to examine
individual effects on DDC response and MGB characterization.
b. Conduct In-Situ SEM examinations in conjunction with the STF
testing procedure to observe GB sliding as it occurs.
4. The effect of precipitate morphology, size, and distribution is known to have
some influence on DDC formation in Ni-base alloys and FM’s
a. Conduct a study in which precipitation interactions are closely
observed throughout the STF testing procedure.
b. Vary alloying element concentration (Nb, C, Cr, Si, etc.) in order to
vary precipitate formation and observe which is most effective at
pinning MGBs.
5. The STF “re-optimization” study neglected to examine the effect of multiple
heating cycles on DDC response as well as testing conducted “on-cooling.”
a. Test a variety of multi-heat cycles in the Gleeble to simulate multi-
pass weld procedures used in the nuclear industry. This may result in
increased residual stresses which would likely increase the DDC
response in a particular alloy.
6. Improve upon the digital image correlation study to examine how strain
concentrates along WM MGBs and or precipitate formations.

114
a. Find a critical localized strain along a WM MGB to lead to void
formation and therefore DDC.
b. Observe strain concentrations along crack tips or voids that may lead
to DDC propagation.

115
References
1. Nissley, N.E., Intermediate temperature grain boundary embrittlement in nickel-base weld metals. 2006, The Ohio State University.
2. Kiser, S.D., L.E. Shoemaker, and H. Alloys, Nickel alloy welding requirements for nuclear service. Focus on Nuclear Power Generation 2005, 2005.
3. Young, G., et al., The mechanism of ductility dip cracking in nickel-chromium alloys. WELDING JOURNAL-NEW YORK-, 2008. 87(2): p. 31.
4. Gorman, J., et al., PWR reactor vessel alloy 600 issues. Companion Guide to the ASME Boiler & Pressure Vessel Code, 2009. 3.
5. Bamford, W. and J. Hall. A review of Alloy 600 cracking in operating nuclear plants including Alloy 82 and 182 weld behavior. in 12th International Conference on Nuclear Engineering. 2004. American Society of Mechanical Engineers.
6. Alloy, I., 690, Huntington Alloys. Inc., Huntington, WV, 1980. 7. Strauss, S.D., Inconel 690 is alloy of choice for steam-generator tubing. Power (New
York), 1996. 140(2). 8. Lippold, J.C., Welding Metallurgy and Weldability. 2014: John Wiley & Sons. 9. Lippold, J.C., S.D. Kiser, and J.N. DuPont, Welding metallurgy and weldability of nickel-
base alloys. 2011: John Wiley & Sons. 10. Lippold, J. and N. Nissley, Ductility-dip cracking in high chromium, Ni-base filler metals,
in Hot Cracking Phenomena in Welds II. 2008, Springer. p. 409-425. 11. Lippold, J. and N. Nissley, Further investigations of ductility-dip cracking in high
chromium, Ni-base filler metals. Welding in the World, 2007. 51(9-10): p. 24-30. 12. Kreuter, V.C.a.L., J. C. , Ductility-Dip Cracking Susceptibility of Commercially Pure Ni and
Ni-base Alloys Utilizing the Strain-To-Fracture Test. 2014 BAM Conference Preceding's 2014.
13. Rhines, F. and P. Wray, Investigation of the intermediate temperature ductility minimum in metals. ASM TRANS Q, 1961. 54(2): p. 117-128.
14. Nissley, N. and J. Lippold, Development of the strain-to-fracture test. Welding Journal, 2003. 82(12): p. 355-364.
15. Nissley, N., et al., Development of the strain-to-fracture test for evaluating ductility-dip cracking in austenitic stainless steels and Ni-base alloys. Welding in the World, 2002. 46(7-8): p. 32-40.
16. Nissley, N.E., Development of the strain-to-fracture test to study ductility-dip cracking in austenitic alloys. 2002, The Ohio State University.
17. Bengough, G., A study of the properties of alloys at high temperatures. J Inst Met, 1912. 7(1): p. 123-178.
18. Collins, M. and J. Lippold, An investigation of ductility dip cracking in nickel-based filler materials-Part I. Welding Journal, 2003. 82(10): p. 288.
19. Yamaguchi, S., et al., Effect of minor elements on hot workability of nickel-base superalloys. Metals Technology, 1979. 6(1): p. 170-175.
20. Xie, X., et al., The role of phosphorus and sulfur in Inconel 718. Superalloys 1996, 1996: p. 599.

116
21. Nishimoto, K., H. Mori, and H. Hirata. Effect of grain boundary segregation of sulphur on reheat cracking susceptibility in multipass weld metal of Fe-36% Ni alloy. in Today and Tomorrow in Science and Technology of Welding and Joining, Proceedings of the 7th Japanese Welding Society International Symposium. 2001.
22. Saida, K., et al., Influences of phosphorus and sulphur on ductility dip cracking susceptibility in multipass weld metal of alloy 690. Science and Technology of Welding and Joining, 2012. 17(1): p. 1-8.
23. Collins, M., A. Ramirez, and J. Lippold, An investigation of ductility dip cracking in nickel-based weld metals-Part II: Fracture behavior and fracture surface morphology are related to microstructure, composition, and temperature. Welding journal, 2003. 82(12): p. 348. S-354. S.
24. Ramirez, A. and J. Lippold, High temperature behavior of Ni-base weld metal: Part II–Insight into the mechanism for ductility dip cracking. Materials Science and Engineering: A, 2004. 380(1): p. 245-258.
25. Noecker, F. and J. DuPont, Metallurgical investigation into ductility dip cracking in Ni-based alloys: Part II. Welding Journal, 2009. 88(3): p. 62s-77s.
26. Chen, J., et al., Effect of grain boundary behaviour on ductility dip cracking mechanism. Materials Science and Technology, 2014. 30(10): p. 1189-1196.
27. Hemsworth, B., T. Boniszewski, and N. Eaton, Classification and definition of high-temperature welding cracks in alloys. Metal Construction, 1969. 1(2): p. 5-16.
28. Rowe, M., J. Lippold, and M. Juhas, Summary of ductility dip cracking—Ductility dip cracking literature review. Ohio: Columbus, 1997.
29. Haddrill, D. and R. Baker, Microcracking in austenitic weld metal. Brit Weld J, 1965. 12(8): p. 411-419.
30. Nissley, N. and J. Lippold. Ductility-dip cracking susceptibility of austenitic alloys. in 6 th International Conference: Trends in Welding Research. 2002.
31. ZHANG, Y.-C., H. NAKAGAWA, and F. MATSUDA, Weldability of Fe-36% Ni Alloy (Report III): Dynamic Observation of Reheat Hot Crack and Evaluation of Hot Ductility of Reheated Weld Metal (Materials, Metallurgy & Weldability). Transactions of JWRI, 1985. 14(1): p. 107-114.
32. ARATA, Y., F. MATSUDA, and S. KATAYAMA, Solidification crack susceptibility in weld metals of fully austenitic stainless steels (Report II): Effect of ferrite, P, S, C, Si and Mn on ductility properties of solidification brittleness. Transactions of JWRI, 1977. 6(1): p. 105-116.
33. Gooch, T. and J. Honeycombe, MICROCRACKING IN FULLY AUSTENITIC STAINLESS-STEEL WELD METAL. Metal Construction, 1975. 7(3): p. 146-148.
34. Collins, M., A. Ramirez, and J. Lippold, An investigation of ductility-dip cracking in nickel-based weld metals-Part III. WELDING JOURNAL-NEW YORK-, 2004. 83(2): p. 39-S.
35. Lippold, J., M. Rowe, and M. Juhas, Summary of ductility dip cracking. Unpublished work at Ohio State University, Columbus, Ohio, 1997.
36. Lippold, J.C., W.A. Clark, and M. Tumuluru, An investigation of weld metal interfaces. The Metal Science of Joining, 1992: p. 141-146.
37. Porter, D.A., K.E. Easterling, and M. Sherif, Phase Transformations in Metals and Alloys, (Revised Reprint). 2011: CRC press.

117
38. Nissley, N. and J. Lippold, Ductility-dip cracking susceptibility of nickel-based weld metals: part 2—microstructural characterization. Welding journal, 2009. 88(6): p. 131s-140s.
39. Kikel, J. and D. Parker. Ductility of dip cracking susceptibility of filler metal 52 and alloy 690. in 5 th International Conference: Trends in Welding Research. 1998.
40. Lin, W. and M. Cola. Weldability of Inconel filler metal 52. in 78th American Welding Society Annual Meeting, Abstracts of Papers. 1997.
41. Lippold, J.C., WE 612 Lecture Slides Section NF5-39. 2009: p. 39. 42. Ramirez, A.J., J.W. Sowards, and J.C. Lippold, Improving the ductility-dip cracking
resistance of Ni-base alloys. Journal of materials processing technology, 2006. 179(1): p. 212-218.
43. Noecker, I., FF, and DuPont, JN 2009. Metallurgical investigation into ductility dip cracking in Ni-based alloys: Part I. Welding Journal. 88(1).
44. Ramirez, A. and J. Lippold, High temperature behavior of Ni-base weld metal: Part I. Ductility and microstructural characterization. Materials Science and Engineering: A, 2004. 380(1): p. 259-271.
45. Nissley, N. and J. Lippold. Ductility-dip cracking susceptibility of filler metal 52 and 52M Ni-base filler metals. in Trends In Welding Research: Proceedings of the 7Th International Conference. 2006. ASM International.
46. Nissley, N. and J. Lippold, Ductility-dip cracking susceptibility of nickel-based weld metals part 1: strain-to-fracture testing. Welding Journal, 2008. 87(10): p. 257-264.
47. Cola, M., et al. Hot ductility testing of laser deposited alloy 690- initial studies. in 6 th International Conference: Trends in Welding Research. 2002.
48. Inc., D.S. Gleeble Systems 2015 [cited 2015 April 29]. 49. Savage, W. and C. Lundin, The varestraint test. WELD J, 1965. 44(10): p. 433. 50. Fink, D.-W.-I.C., I.M. Zinke, and D.-W.-I.D. Keil, Evaluation of hot cracking susceptibility
of nickel-based alloys by the PVR test. Welding in the World, 2012. 56(7-8): p. 37-43. 51. Garofalo, F., Fundamentals of creep and creep-rupture in metals. 1965: Macmillan. 52. Bricknell, R. and D. Woodford, The embrittlement of nickel following high temperature
air exposure. Metallurgical Transactions A, 1981. 12(3): p. 425-433. 53. P. Lester, M.K., D. Barborak The Testing of ERNiCrFe-13 for Use in Structural Weld
Overlays 2014, AZZ/WSI LLC p. 1-17. 54. (CEMAS), O.S.U.C.f.E.M.a.A. Electron Microscopy and Analysis 2015 [cited 2015 April
29]. 55. Yeniscavich, W., A correlation of Ni-Cr-Fe alloy weld metal fissuring with hot ductility
behavior. WELD J, 1966. 45(8): p. 344. 56. Mintz, B. and J. Jonas, Influence of strain rate on production of deformation induced
ferrite and hot ductility of steels. Materials Science and Technology, 1994. 10(8): p. 721-727.
118
Appendix A
Gleeble QuickSim Program for STF Test
The following figure is the STF-Macro programed via QuickSim2. Controlling
variables include temperature (°C) of the sample, stroke or jaw movement (mm), stroke
rate (mm/s), time to heat to peak temperature (°C/s), and time at peak temperature before
the stroke is applied (s).

119
Figure 37: QuickSim program used to generate STF testing procedure.