Effectiveness of Exercise Intervention in Runners with and ...
Utah State UniversityDigitalCommons@USU
ITLS Faculty Publications
7-1-2013
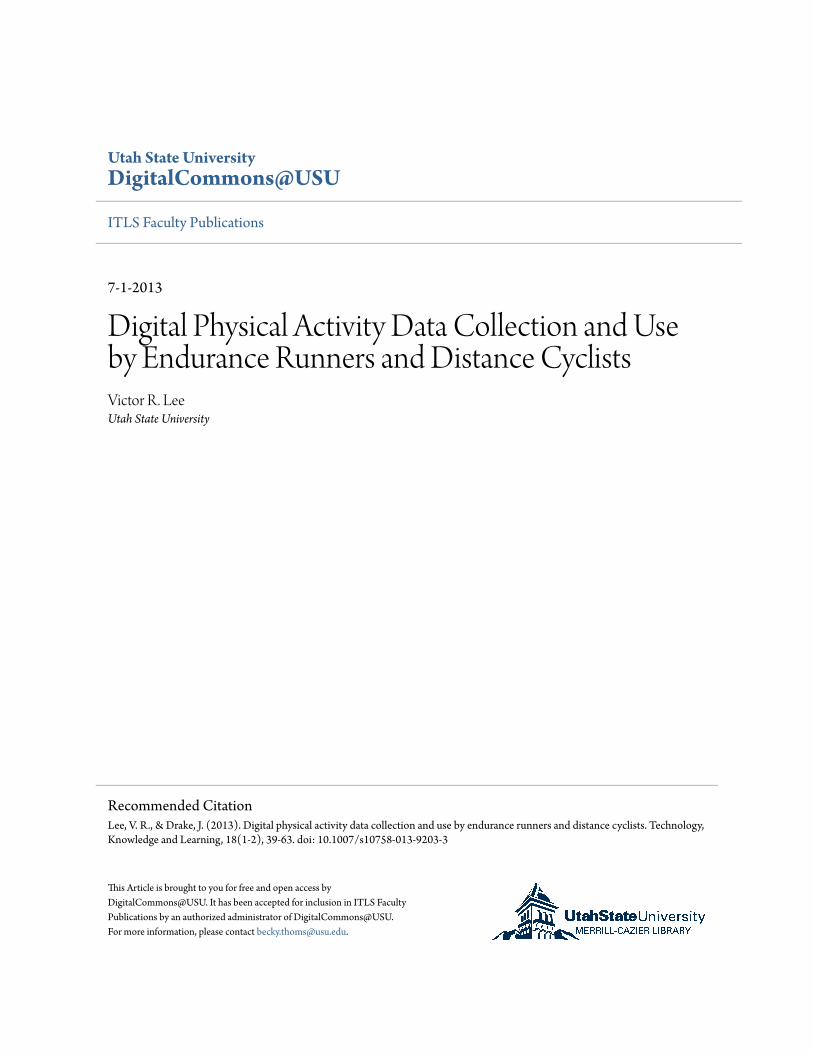
Digital Physical Activity Data Collection and Useby Endurance Runners and Distance CyclistsVictor R. LeeUtah State University
This Article is brought to you for free and open access byDigitalCommons@USU. It has been accepted for inclusion in ITLS FacultyPublications by an authorized administrator of [email protected] more information, please contact [email protected].
Recommended CitationLee, V. R., & Drake, J. (2013). Digital physical activity data collection and use by endurance runners and distance cyclists. Technology,Knowledge and Learning, 18(1-2), 39-63. doi: 10.1007/s10758-013-9203-3
1
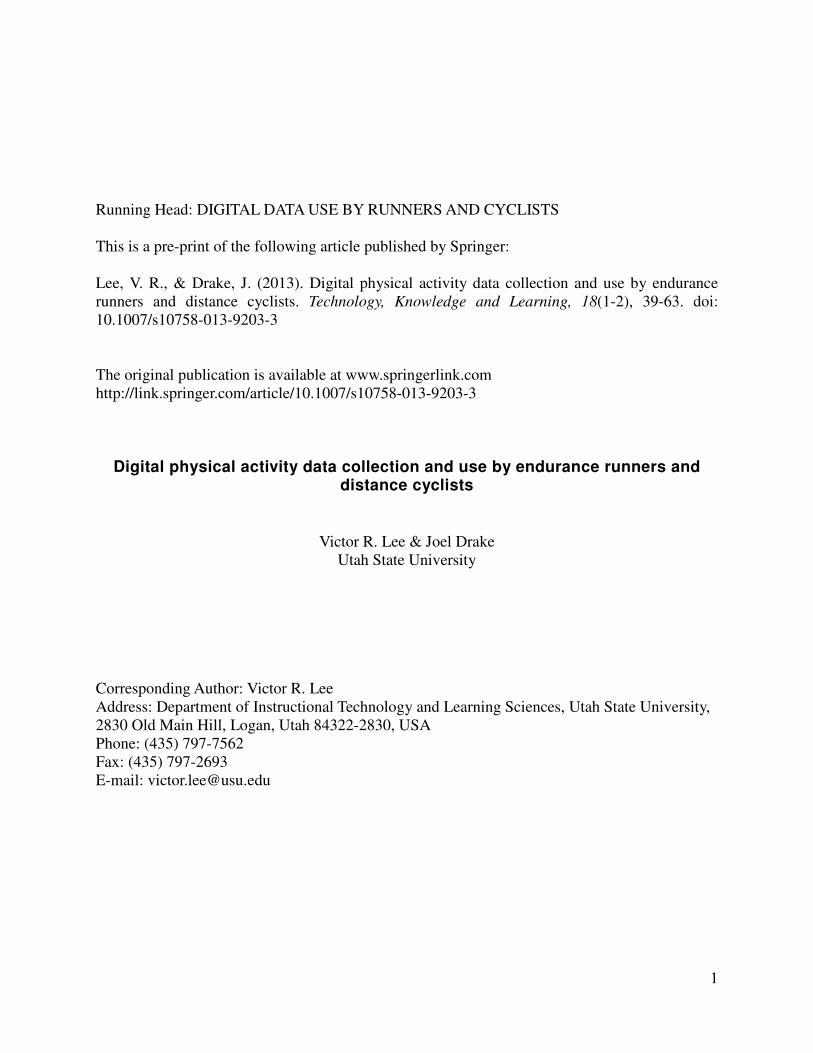
Running Head: DIGITAL DATA USE BY RUNNERS AND CYCLISTS This is a pre-print of the following article published by Springer: Lee, V. R., & Drake, J. (2013). Digital physical activity data collection and use by endurance runners and distance cyclists. Technology, Knowledge and Learning, 18(1-2), 39-63. doi: 10.1007/s10758-013-9203-3 The original publication is available at www.springerlink.com http://link.springer.com/article/10.1007/s10758-013-9203-3
Digital physical activity data collection and use by endurance runners and distance cyclists
Victor R. Lee & Joel Drake
Utah State University
Corresponding Author: Victor R. Lee Address: Department of Instructional Technology and Learning Sciences, Utah State University, 2830 Old Main Hill, Logan, Utah 84322-2830, USA Phone: (435) 797-7562 Fax: (435) 797-2693 E-mail: [email protected]

2
Abstract: The introduction of sensor technologies to athletic practices has allowed athletes to quantify and track their performance, adding an information-based layer to athletic practices. This information layer is particularly prevalent in practices involving formal competition and high levels of physical endurance. We interviewed 20 athletes who participated in distance cycling or endurance running and also had experience using these technologies. This paper presents two cases and a number of shorter descriptive examples from these interviews that illustrate the factors salient to the introduction of these athletes to their respective sports, their continued participation in running or cycling, and their use of physical activity data. The effects of these data and logging practices among these individuals are examined, including some of the tensions that these athletes have with respect to quantifications of their performance and how they see themselves as athletic individuals in light of the increased presence of digital data. Educational implications are also discussed.

3
Introduction Sporting activities have had an extensive and intimate history with technology. Often, the
development of technologies is understood in terms of physical equipment and gear, and enhancements in their design are motivated by the desire to improve performance during competition (Stefani, 2012). For example, the 2008 Summer Olympics saw the appearance of the LZR Racer swimsuit developed by Speedo, a piece of equipment that was considered to be a “game-changer” for competitive swimming. Bicycles, since they became popular for recreational and competitive use in the United States at the end of the 19th century, have seen a number of technological innovations that made it possible for riders to travel longer distances at greater speeds (Wilson, 2004). Athletic shoes represent yet another area of technological innovation, albeit one that is being actively debated within communities of distance runners (McDougall, 2009).
In addition to technological innovations that take the form of apparel or lightened equipment, several relatively recent innovations have introduced portable digital technologies, such as sensors and miniaturized computers, into athletic practices (Lee & DuMont, 2010). These devices, which serve to quantify aspects of activity such as heart rate, motion, speed, or power, are also important tools for improving performance. However, unlike the body suits, bike frames, or specialized shoes, these digital technologies were not designed to alter the athlete’s relationship with the physical environment. Rather, these technologies injected data into athletic activities by quantifying athletic performance, thereby introducing new ways of thinking about and knowing what one’s body was doing.
As is the case with nearly all sports-related technologies, data technologies were initially intended as tools for use by the athletic elite, enabling them to analyze their performance in ways never before possible and to push the boundaries of human ability. As these technologies became more affordable, they were adopted at all levels of competition.
These technologies are now being promoted heavily to sports enthusiasts. Athletic stores, in addition to carrying the latest and greatest in performance athletic wear, now carry smart watches and sensors. Magazines dedicated to specific sports and athletic lifestyles now regularly include reviews and recommendations for mobile sensors and portable computers. Virtually anyone can find a device that generates information about their physical activities and purchase it for less than the price of a mobile phone. Given the prevalence of these devices in sports and athletic practices, our goal is to understand what impact this information is having on how individuals now think about their sports and their bodies. Stated differently, a new layer composed of information is being added into established sets of practices. We want to understand the nature of the interactions and implications associated with this layer.
While this endeavor could easily be viewed as one suited for some other field of social research beyond education, we believe that pursuing such an understanding is actually both important and valuable for education research, and specifically, educational technology research. This belief is based on the fundamental assumption that new technologies establish new ways of thinking, knowing, and acting, rather than simply enhancing our ability to learn some specified content. This is an assumption shared by a number of educational technologists in past decades. For example, the Logo programming language opened up new regions within the possible spaces of mathematics education (Papert, 1996), and the same could be said for new dialects and environments that redefine how we express ourselves through digital art (Resnick, et al., 2009; Peppler & Kafai, 2007), how we model and represent objects in motion (Sherin, 2001), and how

4
we conceptualize the mechanisms that underlie complex systems (Wilensky & Resnick, 1999). Moreover, we hold that technologies are most productively understood as cultural tools
that are appropriated in service of participation in practices. When the use of a new technological tool has been appropriately understood relative to the practice in which it belongs, we can devise means to thoughtfully design pedagogical experiences and scaffolds that can establish pathways for participation. This has been the case in new designs for incorporating technology in the context of innovative new K-12 science curricula (e.g., Berland & Lee, 2012; Edelson, Gordin, & Pea, 1999; Edelson & Reiser, 2006). However, there are occasions where we do not yet understand the nature of technology within practices. For example, studies of the technology-related practices of professional engineers can serve an important role in informing the design of engineering educational experiences (e.g., Gainsburg, 2007). The same holds true for research into the practices of professional scientists (e.g., Hall, Stevens, & Torralba, 2002) and nurses (e.g., Noss, Pozzi, & Hoyles, 1999).
This article is written in a similar vein to these previous studies. Our goal is to demonstrate that the aforementioned “information layer” is indeed having an impact on athletic practice and that it involves new meanings and activities that relate to physical activity data. To accomplish that, this article will interweave examples drawn from two domains of athletic practice: endurance running and distance cycling. We have selected these two as exemplars because of a clear presence and promotion of technologies within these spaces. Runners are purchasing shoes with accelerometers built into their soles and watches with GPS capabilities. New shirts are being developed and sold with wireless heart rate detection capabilities. Apps that recommend running routes and track speed are being installed onto smart phones. Cyclists are attaching computers to their bicycles and paying for subscriptions to web services that let them share with their friends how fast and how far they have ridden. We believe that these developments represent a unique opportunity for us to understand aspects of knowing and learning with digital technologies within the context of existing practices that are not typically associated with computation. Thus, this paper will highlight some differences and similarities among practices in these spaces, including those marked by the technologies used and information obtained from those technologies. This article will also serve as another record for the research literature of specific cases of data use “in the wild.”
In the sections that follow, we will discuss briefly some of our theoretical orientations for this work. Namely, we conceive of participation in these athletic practices as representing participation in a set of athletic affinity spaces (Gee, 2008). After introducing our sample and describing how a number of these individuals became participants in their respective spaces, we discuss the digital technologies they currently use and the ways in which the information generated by those technologies are integrated into their thinking about their activities. We then focus on two ways in which digital technologies mediate individual understandings of athletic activity. The first is through support of a common athletic inscriptional practice (Roth & McGinn, 1998; Wu & Krajcik, 2006), namely data logging. In that practice, data obtained from athletic devices is recorded on a regular basis, which enables reflections specific to the goals and values of particular individuals. The second form of mediation, which has some degree of overlap with data logging practices, pertains to identification. We will present examples to show how the creation of data from athletic devices mediates the way in which individuals view themselves and others in their sport. Finally, we will discuss some of the implications of these observations with an eye toward education and learning.
5
Theoretical perspectives: Practices, affinity spaces, mediation, and identity We take as axiomatic that practices constitute a central piece of human action and
existence (Rogoff, 2003). As people in a sociocultural milieu, we all participate in a number of practices that are associated with a cultural history. Furthermore, these practices have all developed their own specialized discourses and tools. In some cases, our participation in practices attains enough regularity and formal structure that we can designate that participation as being associated with an identifiable community of practice (Wenger, 1998). For example, a group of claims agents in an insurance company or a team of photocopier repair technicians would each be representative of communities of practice (Brown & Duguid, 1991). In other cases, the practice may have recurrent patterns for participation, but community membership is more fluid and disparate. Not all who participate in those practices necessarily belong to an official and formally designated community. In those cases, the term “affinity spaces” (Gee, 2005) can be seen as a productive alternative.
A video game serves as one of Gee’s canonical examples of an affinity space. While online games have obvious features that appear to be a space (i.e., an “environment” where players meet), it is important to note that it is not the gathering place (either real or virtual) that defines an affinity space. Rather, affinity spaces have practice-specific signs and discourses that are distributed across places and media. They feature various portals that provide access to and enable participation within that space. To continue with Gee’s example of a video game, the game itself can be a locus for signs and discourse interactions, but various online message boards, paper-based strategy guides, and other players can all serve as portals. However, Gee also makes a deliberate effort to demonstrate that the construct of affinity spaces goes beyond games. Cooking clubs, for example, can serve as examples of affinity spaces. In such a space, discourses can be shared and propagated through objects such as cookbooks, recipes, and gatherings of individuals who are interested in cooking.
Athletic activities can also be interpreted as affinity spaces. There are specific terms and discourses that are involved in the practices of running (e.g., Clydesdale races, 10K, minimalist shoes) and cycling (e.g., drafting, centuries, saddles). A number of portals exist and are used by individuals of varying degrees of status within the space. For example, one can participate in the affinity space of cycling by accessing cycling-specific websites and forums (mtbr.com, bicycling.com, velonews.com), visiting local bike shops, participating in races, joining riding clubs, and even simply riding with friends. Comparable access points exist in running spaces. Given the broad set of portals for participation in the space, it follows that there will be some variation in how participation takes shape over time. One question to consider is how one becomes a participant in a given affinity space. We will discuss that with some specific examples below.
Earlier, we stated that a new “layer” of information—in the form of physical activity data—was being introduced to existing athletic practices. Thus, understanding the appropriation of specialized tools and discourses in our two athletic spaces is critical and intertwined in our present work. Athletic information technologies serve as mediators in the sense described by Soviet cultural-historical psychologists such as Leontiev (1978) and Vygotsky (1978). In that tradition, tools and artifacts alter the relationship between an individual and an object or goal of pursuit. In the obvious case, new equipment that quantifies bodily performance alters the ways in which an athlete pursues goals and improves. However, we are also considering the ways in which the information generated by athletic technologies have the potential for impacting how

6
individuals understand themselves as athletic individuals. They may, for example, come to see themselves as performing somewhere on a continuum of athletic ability rather than as being categorically someone who is athletic or someone who is not.
So, finally, identities within the practice must play a prominent role in this work. By identities, we refer to a “sense of self” that one projects and perceives in the context of a practice. Attending to this “sense of self” has implications for how we view competence in practices and how we understand the nature of boundaries that appear to exist between practices. For example, Nasir & Hand (2008) have demonstrated that high school basketball players competently quantify and describe their performance in basketball but those competences are not expressed when dealing with content explored in their math classrooms.
Indeed, new technologies are being increasingly recognized as serving an important role in the development and crafting of identities in practice (Ching & Foley, 2012). It is important to note that the influence of technologies on identity development and expression can be seen as both positive and negative. For example, we know from numerous interviews over multiple years documented by Turkle that understandings and expressions of self with technology could be productive and empowering (1984, 1997) but also unexpectedly isolating (2011). Game spaces and virtual worlds also are domains where identities could be explored through forms of experimentation that can differ from how one presents themselves in real life (Fields & Kafai, 2012; Kafai, Fields, & Cook, 2010; Lam, 2000). While there are some online spaces that our participants use, we expect the identity implications among the individuals in our research will differ from the above examples because the aspects of identity we are considering are refined and influenced by technological reflection on actual physical activity rather than projections of possibilities embodied in a virtual construction.
Data Sources We recruited 20 adult athletes to meet individually with a researcher for roughly one hour.
These athletes were recruited primarily through local sports equipment stores, running and cycling clubs, and word of mouth. All of the participants resided in and participated in athletic activities in Utah, a Rocky Mountain state in the US known in part for abundant access to outdoor and endurance activities. The participants ranged in age from early-20s to mid-60s. In total, we recruited eleven athletes who self-identified primarily as cyclists, eight who identified primarily as runners, and one who identified strongly with both activities. Ten males and ten females participated in this study. Most of the participants (19 of 20) were college-educated.
Although engaging with participants in a multi-week period of field observation for research purposes might have been an option for some in our study, the fact that there were twenty different individuals who each had very different schedules for physical activity (some would begin before dawn, others mid-day, and some after dark) and nearly all participated in activities that required excellent levels of fitness beyond the capabilities of the research team (e.g., these individuals trained for and competed in events that involved speeds and durations greater than what members of the research team could attain), we concluded that interviews were the most feasible form of data that we could collect at this time. We do acknowledge that other research methods, such as ethnography, would be valuable and desirable.
The interview protocol that we designed and implemented had three components. The first twenty to thirty minutes of the interview involved asking participants about their history of

7
involvement in their selected sport (running and/or bicycling). Prior to the interview, participants were asked to bring or share any devices, files, or other materials that were related to their use of physical activity data, which we reviewed with participants during this portion of the interview. We also made available an internet-connected computer for any individuals who used or relied on a particular web service for tracking activity data and who wished to show the sites that they used. This was critical because we expected these documents or web-accessed accounts would provide some history of their technology use.
The second component of the interview involved asking participants to draw a bicycle, explain its mechanics, and then answer questions related to gearing and mechanical advantage. This set of questions was intended to help us understand, at least in a tentative way, the nature of their mechanical knowledge related to their sport. For participants who were identified at their time of recruitment as runners, some of the questions related to gearing were replaced with training recommendations related to endurance running. We still retained some gearing questions for runners so we could compare them to the cyclists.
Finally, the last segment of the interview involved participants using a think-aloud procedure while interpreting a provided display of speed data from a competitive race. We then asked the participants to produce a graph showing what they believed to be the elevation profile of the race terrain given the changes in speed. All interviews were transcribed. For this paper, we only report on data from the first section, when participants were asked about their sport and the PAD technologies they used.
Data Analysis There were three phases of data analysis that were pursued iteratively. The first phase was
simply an inventory of technology and athletic data use as could be ascertained from interview transcripts and from video footage of any devices or websites that were shown at any time during the interview. Early in the interview, talk of data typically involved listing the data functionalities that the athletes checked on a given device. Later in the interview, the athletes tended to talk about data relative to a context of use. For example, some athletes talked about their improvement over time, which was described in terms of average heart rates over time. Each of these mentions was coded based on what data were being used or referenced by the interviewee. It is worth noting that many fitness tracking and monitoring devices have the potential to obtain dozens of types of data. Our coding scheme included 13 different types of physical activity data that participants mentioned that they obtained. All athletes in our sample generally favored use of a small subset of the available data (m = 5.45, sd = 1.93).
The second phase of our analysis process involved identifying motivations for participating in the selected athletic practices. In pursuing this analysis, we wanted to contextualize the data use and determine how technology came to be part of each individual’s engagement with their sport(s). For this analysis, we reviewed and coded the first portion of the interviews and identified passages that explained why individuals had taken up a sport. For example, the following passage was coded as having two major motivators: (1) a prior history as an athlete in another sport and (2) an injury that led to a shift in sport.
Miranda: Um, well, I think this is the story for a lot of people, but I was a runner, and then, got injured and started picking up biking as a cross training thing and then, slowly,

8
cycling kind of replaced running. So, I’ve probably been riding actively with cycling as my primary sport for 2 years.
While there could have been other motivators implied in that excerpt, we were fairly conservative with our coding and relied only on explicit mentions of motivators. However, for all individuals, including Miranda, we had several lines of transcript with which to work and thus, motivations tended to appear in multiple, lengthy statements and in specific anecdotes. Our coding scheme ultimately had 20 different codes for motivators that ranged from physical enjoyment to wanting to spend time with others who participated in the sport to concerns about the environment (the last applying in the case of bicycling).
The third phase of analysis involved identifying and coding instances of participants describing technology mediation within their athletic practice. Essentially, we wanted to consider the meanings and contexts of use for devices and data. In our overview of the first phase of data analysis, above, we mentioned that, during portions of the interviews, participants talked about their data use in context. These moments often involved statements of meanings that were inferred from data and ways in which data were made useful for a given individual. For example, a runner described using data to set a specific goal in terms of the pace he expected to beat in an upcoming competition. For cyclists, cadence became a target range to maintain while riding. In both of these examples, data that were obtained not only served to inform the athlete about their own performance but also shaped their participation in more structured activities involving other people.
The application of codes during these three phases allowed us to prepare two kinds of reports. One report involves numerical summaries of devices and data. Because we had specifically targeted two endurance sports, we were interested in the extent to which the devices and data overlapped. The other report involves narrative descriptions—short cases of specific individuals—with an eye toward the use of technology in athletic practice. The cases we present below were not chosen because they are naturally representative of the entire population of runners or cyclists. There is clearly variation in each sport. Rather, the individuals and excerpts we provide have been selected because their stories are illustrative and, in many ways, vivid based on the verbal detail that those individuals were willing to provide during their interviews. Because the practices may be unfamiliar to some readers, we have opted to first introduce two cases of individuals—one who became a cyclist and one who became a runner. We also introduce the technologies that those two individuals came to use. Following those cases, we describe some of the similarities and differences observed across the entire sample of runners and cyclists. Finally, we present some final illustrative excerpts of how physical activity data took on various meanings for the athletes we interviewed.
Becoming participants As stated above, the individuals we recruited for this study participated in their chosen
sports beyond the casual participation associated with joining a health club as part of a New Year’s resolution or riding a bicycle with family on the weekends. For several of our participants, formal competition and involvement in community-sanctioned events centered on their sport (e.g., races, training groups) were distinguishing features. These activities require substantial financial, time, and physical investments; these athletes often placed themselves in situations that

9
caused pain and discomfort (as one cyclist put it, success required entering “the pain cave”). In this section, we will present the backgrounds of two individuals—one cyclist and one runner—with an eye toward how they came to be participants in their respective affinity spaces, what factors contributed to their continued high levels of participation after years in their sports, and how they came to use digital technology in support of their physical activities. Our aim in this section is to provide some account of how the individuals we studied came to be active participants in their current sport and what some of the similarities and differences are with respect to the influences that led to their entry and continued engagement. We also intend for this section to help contextualize the adoption and use of physical activity data technologies.
From injured sprinter to a cyclist with power Based on the “second phase” codes assigned to the athletes in our sample, 15 athletes
identified motivations for current participation in their sport as being related to fitness (a desire to maintain or attain a body condition that could be seen as healthy) and 16 explicitly mentioned social influences (a desire to affiliate with other individuals) that led them to participate. Twelve individuals cited both as motivators. These numbers appear consistent with a generic expectation that participation in physical activity is driven by desires to be healthy and/or to spend time with friends.
Unlike the suddenly ambitious middle-aged adult who decides that it is time to alter his or her physical lifestyle (as is often the case in the United States at the start of a new year), we observed that the athletes who identified fitness as a motivator were actually following a trajectory established earlier in their lives. For example, several athletes had participated in an organized sport in high school or college. Moreover, the ways in which other people figured into individual participation exhibited nuances.
For example, Jennie(1), a cyclist in her 30s, ran track competitively through her youth and in college at a NCAA Division I school for five years, with a specialization in short distance runs. However, she developed a serious back injury after her competitive college years. Being physically active was an important part of her life experience and was one of the ways through which she identified herself throughout her life. She described athletic competition as filling some undescribed void in her life. Because of that history and stance toward athletic activities, it is not surprising that she maintained an interest in continuing sports. In addition to that previous experience, personal relationships influenced the next direction that her competitive athletic lifestyle would take.
Jennie: My husband was really big into mountain biking, so we got a mountain bike [for me] and just started riding together. And I got into racing. I was actually in Sun Valley mountain biking. Met Haley Johnson just on the trail, and she’s seven-time national champion, and we just became really good friends. And she was like, “You’re going to start racing.” I was biking before that, but just kind of recreationally and just kind of for fun. Not that racing isn’t fun, but that took it to a whole—That was kind of it. It took it to a whole different level.
Because her husband was already interested in mountain biking, transitioning to
mountain bike riding was an easy way to continue being physically active while also enabling

10
her to spend time with her partner. Spending time with romantic partners was also noted for two other runners turned cyclists in our sample. However, instead of continuing to simply ride with her husband, Jennie’s orientation toward competition was re-expressed and encouraged through a new personal relationship with someone who could be considered an “old-timer” (Lave & Wenger, 1991) who was widely respected within the mountain biking space. Yet, it was not simply a matter of Jennie redirecting physical excellence from one sport to another. Despite being physically fit from years of running and having immediate access to more experienced individuals (e.g. her husband, Haley Johnson), the process of becoming a cyclist still involved a major transition.
J: I come from a sprinting [background], speed, power, agility side and this whole endurance side… I am definitely not endurance. I was a sprinter in college. So, for
20 years I trained my body to go 60 seconds or less as fast as I could. There’s very
few races that are 60 seconds or less in cycling(2)
.
Coming from a short-distance, sprint-running background, where short bursts of
anaerobic activity were valued, Jennie found transitioning to the sustained aerobic efforts required in cycling to be challenging. This became even more pressing as she moved from mountain biking to road cycling, which tends to involve longer riding distances. However, with continuous training she had successfully incorporated the endurance aspects of road cycling well enough to finish in the top 10 in several major bicycle races. This transition was also facilitated by her purchase of a specific sensor technology to use with her road bicycle.
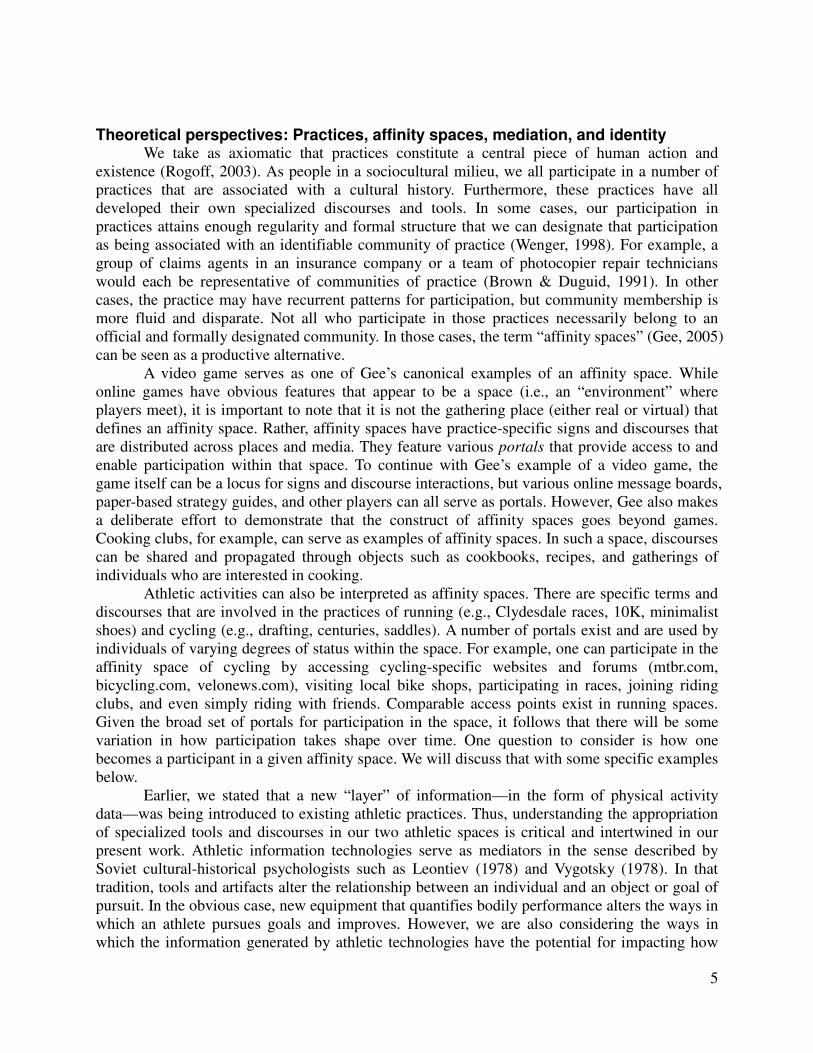
J: As soon as I decided I was going to race and take it a little bit more serious - from the advice of my friend Haley, who had power [i.e., a power meter], I bought my bike with power. So I’ve actually never ridden [a road bike] without power. So, I’m kind of one of the few in the cycling circle, as I see—Because I started so late, and power came into the scene around 2000, 2002—I bought a PowerTap, threw it on my bike, and now I’m kind of lost without it. It’s addicting…coming from a different competitive background [running] it actually quantifies what I’m doing and shows improvement instead of just taking into other factors that [I] may or may not have any control over.

11
Figure 1. A CycleOps PowerTap power meter(3) in a bicycle wheel hub. Data are transmitted wire
lessly to a bicycle computer
The sensor technology that Jennie described buying was a power meter, one of the most expensive tracking technologies available for road cyclists (roughly US$2,000). Power meters work by measuring the amount of torque applied by a rider as they are pedaling and reporting in real-time the wattage on a bicycle-mounted computer. Although it was a substantial initial investment, it became something that she felt was “addicting” and she would feel “kind of lost without it.” The quantification was valuable and a marked contrast from other descriptions of exertion, such as self-reports of perceived exertion (e.g., Borg, 1998). The wattage information from the power meter suited her competitive preferences because it was an objective measure. That objectivity from the device gave her a means to track improvement by providing her a standardized vocabulary to describe levels of performance during a race. As she described the usefulness of power meters, Jennie offered the following example:
J: If you know “My threshold is 248 watts” and you are going 320 for the first 10 minutes, you’re going to blow up. So, it [a power meter] will kind of give you a perspective of -- rein you in a little bit.
Jennie was the only participant in our sample who used a power meter. When we asked
other cyclists about power meters, they recognized them as impressive and desirable devices to have for their bicycles, but all cited costs as prohibitive. Jennie’s purchase of a power meter was clearly influenced by her friendship with Haley. It was also influenced by some existing patterns she had established as a competitive runner in her past. In an analysis of how interests and participation in hobby practices develop and are maintained over time, Azevedo (2011) theorized that interests could be seen as lines of practice that were influenced by two sets of structures: preferences and conditions of practice. Preferences were generally tied to the individual and referred to long-term goals and values of the individual. Conditions of practice generally went beyond individual preferences and were products of the physical or social context or other less directly managed factors. For Jennie, she exhibited long-standing preferences for competition and high levels of physical activity. These were cultivated through years of running and sprinting.

12
However, various conditions led her to shift to the sport of cycling. These included conditions such as her back injury, geographic location in a biking-rich environment, and personal contacts. Additionally, she had the financial resources to purchase a power meter. We also saw that there was a preference for socializing through her sport, as well as a preference for being able to quantify performance and improvement, which also intersected through the endorsement of power meters by her friend, Haley. From this example, it appears that previously established preferences, conditions that steered her toward cycling and ultimately racing, and the resonance of the power meter technology with both preferences and conditions all contributed to helping Jennie become a competitive cyclist.
From “fat man” to a runner with a trophy Richard was a runner in his 40s who worked as an information technology specialist.
Like Jennie, he had some previous fitness experience as he was a competitive wrestler for one year in college before moving overseas for two years and then returning to the US and joining the Army National Guard, where he served for several years until he retired as a major. While enlisted, he was responsible for maintaining a certain level of fitness. After his retirement, that requirement to maintain a certain level of fitness was no longer present. By the mid 2000s, he had gained a great deal of weight and had unhealthy blood pressure and cholesterol levels. Because of this, he decided to change his lifestyle and begin running to reduce his weight and improve his blood sugar and cholesterol. However, that effort to get involved in running for fitness was confronted with an obstacle.
Richard: But then… I herniated a disc in my back. L4-L5 [vertebrae]. And really bad. I had about 40-50% strength in my right leg… I couldn’t raise my foot up…sciatica, through my right glute to my hamstring to the side of my lower leg and into, up over the foot and my big toe. I couldn’t raise any of that. And I went through physical therapy, the doctor did a bunch of a lot of little things, and the orthopedic surgeon, and I said I’d like to start running again. I was just getting in shape. And he [the surgeon] said, “Oh, you’ll never run again.”
Injuries like this one contributed to Jennie’s shift toward cycling. However, Richard
ended up maintaining his commitment to running. He did not view the surgeon’s declaration as a limit to his abilities.
R: So I said [to the doctor], “Oh yeah? You wanna see me?” and so it was a
challenge…and I [ran a marathon and] took third in the fat man group, the Clydesdale division [over 200 lbs], and I got a trophy! So I thought I was just going to do one marathon, and I thought “Well, okay, I’ll do another one. I got a
trophy, I might as well do another one!”
For Richard, a sense of self-reliance and a desire to be healthier were important motivators. However, those internal motivators were not the only influences on his participation. Richard stated in this excerpt that he decided to continue in part because of external validation he received in the sport in the form of a trophy. As he described this accomplishment, Richard was a

13
bit self-deprecating. He associated his achievement as being one within the “fat man group.” However, he later realized that it was indeed a substantial achievement
R: So about that time I did my first marathon, I did it in 3 hours and 30 minutes -- fairly slow but for a fat old man, I thought “okay”. I was 39 years old [at the time]. So I was talking to a friend of mine who is a doctor at [the local hospital], and he
mentioned that he had never broken a 4-hour [time in a marathon], and I ran my
first one in a 3:35.
When Richard shared his result with his friend, he discovered that his time from his first marathon—of which he was somewhat dismissive—was still better than that of his friend who had done multiple marathons. At that point in his running history, Richard then described himself as beginning to martial social support through a friend. However, unlike Jennie who was encouraged by a new friend to start racing, it was Richard’s own direct recruitment of his existing friend to join him in competitions.
R: I said [to my doctor friend] hey we ought to try and break a 3:30 in the [marathon scheduled for next year] and try to qualify for Boston [Marathon]. So he said “Ok, let’s try it. Let’s go for it. It might be a pipe dream. But let’s go ahead
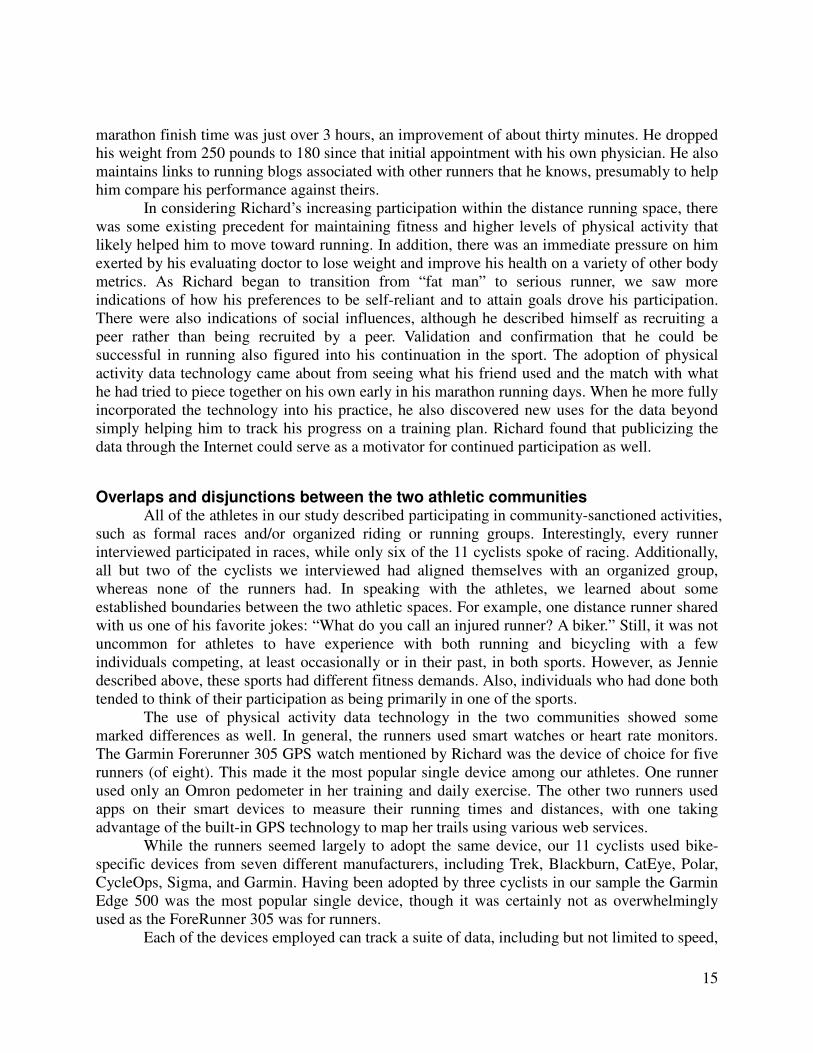
and do it.” He had a Garmin 305 at the time, and he showed it to me. A Garmin Forerunner 305, and he showed me all the little features and capabilities that it could do like track you every mile and give you average minutes per mile per every mile, average heart rate per mile, and a lot of other features. I think that’s cool plus the overall time and elevation and all that stuff.
Figure 2. Garmin Forerunner 305. The device is a GPS wristwatch that wirelessly communicates
with a heart rate monitor. Additional sensors can be paired as well.
Within the broader distance running affinity space, the Boston Marathon is held in particularly high esteem. It is a major competitive event that annually includes tens of thousands of runners, and it consistently hosts the most elite distance runners in the world. Qualifying for the Boston Marathon, which is done by completing another sanctioned marathon within a specific time set for sex and age group, was understood amongst distance runners as a badge of

14
honor. Richard decided that he was interested in pursuing that goal and recruited his friend to do it as well. His friend thought of it as a “pipe dream,” but agreed.
Soon after establishing the shared goal of qualifying for Boston, Richard learned about his friend’s Garmin Forerunner 305, a physical activity data tracking device that enabled him to get details about his running through an embedded GPS receiver and through wireless communications with heart rate monitor straps. In his description of his very first marathon, Richard told us about how he had devised a crude system to help him keep track of his performance that involved a stopwatch and a wristband that had target mile times handwritten on it. During the marathon, he would check his stopwatch and then cross reference the time on that stopwatch against the times he had written on his wristband. The Garmin Forerunner was able to do automatically much of what Richard was doing by hand, so he was immediately drawn to the device. A few months after learning about the Forerunner from his friend, his wife bought him one as a gift, which allowed him to discard his homespun tracking system. Richard reported that since receiving the Forerunner several years prior to our interview with him, he used it to track all of his runs. The main advantage he saw was that it was a more effective way for him to keep track of paces and set goals.
R: So I’d been running with a Garmin 305, Forerunner since [my wife gave it to me as a gift 4 years ago]. It’s helped me quite a bit as far as keeping track of paces, being able to set up a running plan and say, “Okay, I want to slowly increase,” and I can track that on my Garmin and go from there.
Much like Jenny used her digitally-obtained data, Richard took advantage of this sensor
device to help set running plans and make comparisons over time based on his pace. In addition, Richard reported a general enthusiasm about the ability to transfer data from the Forerunner automatically to a web service, Garmin Connect, where the obtained data about runs could be stored, viewed by him, and shared with others. Using this service helped motivate his participation in running not only because he could see improvement but also because his performance could be viewed and judged by others.
R: Another thing that’s really nice is I posted this to connect.garmin.com, other people who have an account on connect.garmin.com can go view my runs because I made them public. And that motivates you a little bit. Because like [my doctor friend] sometimes looks at mine, and I look at his, and we kind of compare. It’s a
healthy competition but not really too much [competition] because we are both
about the same thing. Its good to know, “Oh, he’s going to look at my time so I’m
going to keep going a little faster.”
Richard found this sharing of information (and the friendly competition that it supported) so motivating that he even began his own running blog four years after his first marathon. He provided us with the address for his blog and invited us to view his performance as it was entered there. Upon review of his blog, we saw that Richard recorded which shoes he had used, how many miles he ran each day, and how much of his training runs were split between “fast” and “slow” miles. According to his running blog, and at the time of the writing of this article, Richard has run 11 marathons and already participated twice in the Boston Marathon. His most recent
15
marathon finish time was just over 3 hours, an improvement of about thirty minutes. He dropped his weight from 250 pounds to 180 since that initial appointment with his own physician. He also maintains links to running blogs associated with other runners that he knows, presumably to help him compare his performance against theirs.
In considering Richard’s increasing participation within the distance running space, there was some existing precedent for maintaining fitness and higher levels of physical activity that likely helped him to move toward running. In addition, there was an immediate pressure on him exerted by his evaluating doctor to lose weight and improve his health on a variety of other body metrics. As Richard began to transition from “fat man” to serious runner, we saw more indications of how his preferences to be self-reliant and to attain goals drove his participation. There were also indications of social influences, although he described himself as recruiting a peer rather than being recruited by a peer. Validation and confirmation that he could be successful in running also figured into his continuation in the sport. The adoption of physical activity data technology came about from seeing what his friend used and the match with what he had tried to piece together on his own early in his marathon running days. When he more fully incorporated the technology into his practice, he also discovered new uses for the data beyond simply helping him to track his progress on a training plan. Richard found that publicizing the data through the Internet could serve as a motivator for continued participation as well.
Overlaps and disjunctions between the two athletic communities All of the athletes in our study described participating in community-sanctioned activities,
such as formal races and/or organized riding or running groups. Interestingly, every runner interviewed participated in races, while only six of the 11 cyclists spoke of racing. Additionally, all but two of the cyclists we interviewed had aligned themselves with an organized group, whereas none of the runners had. In speaking with the athletes, we learned about some established boundaries between the two athletic spaces. For example, one distance runner shared with us one of his favorite jokes: “What do you call an injured runner? A biker.” Still, it was not uncommon for athletes to have experience with both running and bicycling with a few individuals competing, at least occasionally or in their past, in both sports. However, as Jennie described above, these sports had different fitness demands. Also, individuals who had done both tended to think of their participation as being primarily in one of the sports.
The use of physical activity data technology in the two communities showed some marked differences as well. In general, the runners used smart watches or heart rate monitors. The Garmin Forerunner 305 GPS watch mentioned by Richard was the device of choice for five runners (of eight). This made it the most popular single device among our athletes. One runner used only an Omron pedometer in her training and daily exercise. The other two runners used apps on their smart devices to measure their running times and distances, with one taking advantage of the built-in GPS technology to map her trails using various web services.
While the runners seemed largely to adopt the same device, our 11 cyclists used bike-specific devices from seven different manufacturers, including Trek, Blackburn, CatEye, Polar, CycleOps, Sigma, and Garmin. Having been adopted by three cyclists in our sample the Garmin Edge 500 was the most popular single device, though it was certainly not as overwhelmingly used as the ForeRunner 305 was for runners.
Each of the devices employed can track a suite of data, including but not limited to speed,

16
distance, duration, altitude, elevation gain, pace, and cadence. Athletes were free to select which of these data to attend to, and we probed them for their preferred data during their interviews. As can be seen in the figure below, cyclists adopted distance and duration nearly universally, and while runners paid similar attention to distance, only about half of them cared about duration. Additionally, while grade and elevation gain were both adopted by little more than 25% of the cyclists, fully half of the runners attended to their elevation gain and none bothered with grade.
Figure 3. Relative frequency plot for data obtained. Black bars are cyclists. Gray bars are runners
.
In roughly equal numbers cyclists and runners adopted cadence and pace, respectively, while ignoring the other. Cadence is a measure of repeated cycles, such as revolutions of a pedal arm, against a set period of time, such as a minute. For cyclists, cadence was understood in terms of effort and efficiency. To the cyclists tracking it, a cadence of around 95 rpm seemed to have an almost mythical property as the purported “optimal” pedaling rate that one should be able to maintain. Runners were instead concerned about pace, which would be a measure of time associated with a set distance (for our runners, this was understood as minutes per mile).
Additionally, one would think that pace could serve the same purpose for runners and cyclists in calculating the amount of time remaining in a given training run or race based on the remaining distance. However, cyclists universally preferred speed to pace, with every cyclist

tracking their speed in some mannernot identified by any of our runners as a meaningful quantity for their practice.
The practice of physical activity data loggingGiven the accessibility of data from their dev
look at the data for real-time feedback but also begin to & McGinn, 1998; Wu & Krajcik, 2006) of fairly common practice across both purposes, but at a minimum, it provided proof of physical activity for a particular day. As one cyclist in our study put it, “If it wasn’t logged, did it really happen?”
Sixteen of the twenty participants had experience with or were currently logging data relating to their physical activity. These athletes either used web services that stored their information (12 of 16) or individually createSometimes these were in the service of a training regimen for a planned competition, but for others, it was simply a habitual activity to facilitate reflections about themselves. In this section, we present two examples to illustrate the demeaning about physical activities and performance.
Evaluating current performance against past performance
The first example of logging comes from Thomas, a cyclist in his 40s who had been riding competitively for several years. He had become so seasoned that heat the cadence on his bike computer and know from that what gear he was in, rather than looking down at his gearing. After years of keeping highly detailed logs of his activto simplify and started using a free wall calendar as his logging medium of choice. He left the calendar hanging in his office and filled in each day with summary information related to his cycling (Figure 1). As he described it,
Figure 4. Physical activity logging system used by Thomas
Thomas: You know, my data collection has simplified over the yearswrite down everything, but, you know, now…pretty much it's just, you knowin the blanks here. I have little squares, and I usually name the course…here's
their speed in some manner—ride averaged, current, or maximum. Maximum speed was not identified by any of our runners as a meaningful quantity for their practice.
The practice of physical activity data logging Given the accessibility of data from their devices, it followed that athletes would not only
time feedback but also begin to engage in the inscriptional practice (Roth & McGinn, 1998; Wu & Krajcik, 2006) of logging and tracking their data. Data logging was a
ctice across both the running and cycling spaces. Logging served a number of purposes, but at a minimum, it provided proof of physical activity for a particular day. As one
put it, “If it wasn’t logged, did it really happen?” of the twenty participants had experience with or were currently logging data
relating to their physical activity. These athletes either used web services that stored their information (12 of 16) or individually created and maintained logs of their activitSometimes these were in the service of a training regimen for a planned competition, but for others, it was simply a habitual activity to facilitate reflections about themselves. In this section, we present two examples to illustrate the design and use of these logs as tools for extracting meaning about physical activities and performance.
Evaluating current performance against past performance
The first example of logging comes from Thomas, a cyclist in his 40s who had been tively for several years. He had become so seasoned that he reported he
at the cadence on his bike computer and know from that what gear he was in, rather than looking down at his gearing. After years of keeping highly detailed logs of his activity, Thomas decided to simplify and started using a free wall calendar as his logging medium of choice. He left the calendar hanging in his office and filled in each day with summary information related to his cycling (Figure 1). As he described it,
. Physical activity logging system used by Thomas, involving a free wall calendar.
my data collection has simplified over the years.
write down everything, but, you know, now…pretty much it's just, you knowblanks here. I have little squares, and I usually name the course…here's
17
ride averaged, current, or maximum. Maximum speed was
ices, it followed that athletes would not only engage in the inscriptional practice (Roth
their data. Data logging was a . Logging served a number of
purposes, but at a minimum, it provided proof of physical activity for a particular day. As one
of the twenty participants had experience with or were currently logging data relating to their physical activity. These athletes either used web services that stored their
logs of their activities (10 of 16). Sometimes these were in the service of a training regimen for a planned competition, but for others, it was simply a habitual activity to facilitate reflections about themselves. In this section,
sign and use of these logs as tools for extracting
The first example of logging comes from Thomas, a cyclist in his 40s who had been reported he could look
at the cadence on his bike computer and know from that what gear he was in, rather than looking ity, Thomas decided
to simplify and started using a free wall calendar as his logging medium of choice. He left the calendar hanging in his office and filled in each day with summary information related to his
, involving a free wall calendar.
I used to write down everything, but, you know, now…pretty much it's just, you know, I fill
blanks here. I have little squares, and I usually name the course…here's

18
how far it is….if I rode it alone, if I rode it with other guys, kind of what the course is, my average speed…[for] somewhere there's a lot of hills, I'll write down elevation gain also.
Yet, even though he logged all of these data, Thomas did not consider himself an active
user of data. As he described his thoughts about all these data he had recorded, he stated, “You're always just going off of what you remember what you did last time, or else you don't really care, you're just riding.” Logging was more a habitual activity for him from years of paying attention to his performance. When asked about if and how he used this logs, he reported using them to make self-evaluations.
T: There's times I've gone out and, especially at the beginning of a year and rode and thought, “oh man I'm just not up to snuff,” or else I think I'm doing extra good but if I can go back and say well okay last year, you know, I was about in this range, about normal or I'm ahead or behind or whatever. It kind of helps me
gauge where I'm at, you know, knowledge is power, I guess. And so I kind of always know where I'm at.
For Thomas, the calendar and the data he kept in it served as important artifacts for
helping him recognize what was a normal performance range for him. It was a highly personalized evaluative tool against which he could compare himself relative to different times in the year. In fact, he had accumulated over 12 years worth of logs, and the entire corpus helped him to consider how his performance changed as he aged.
T: So this data just really, I'd say the main purpose is just to help me know where
I'm at, you know, and also from year to year, as I get older if I'm starting to
know—if I'm starting to decline or if I'm actually doing better, or maintaining or to see where I'm at. You know, eventually I'm going to start that decline with age, but I'd have to say some of the guys I'm riding with they are in their fifties and they are riding well. At least it helps me know I've got plenty of time to ride and do well, if I can, you know, keep it up.
Considering the years of logging and exposure to activity data, it could be that Thomas
would have reached a level in which he would have outgrown the technology. To explore this, we asked him what would happen to him if he no longer had his bike computer.
T: Well, you know, for instance, earlier this year I lost, my battery went out in my computer, and I couldn't get the thing open to change it, so I did a race without a computer early in the year, and so I had to just kind of go more off of feel, you know, I didn't know how fast I was going, I didn't know how to compare my rides.
Although real-time activity data and data logging had become integral to Thomas’
approach to riding, when these resources were unavailable he was still able to ride competitively based on “feel”—drawing on years of ingrained familiarity with what various cadences felt like. The extended period of technology use helped him to understand how his performance changed

19
over time, and it did so in a way that the technology and the information it provided became a central part of his practice that was qualitatively different when the technology was unavailable.
Ranking self and predicting future performance David, a banker and competitive marathon runner in his 50s, reported to us that he used
GPS technology and a heart rate monitor as part of his running practice. He had been running for decades, starting initially because he was too small to play in his high school’s football team but wanted to participate in an athletic activity. He previously lived in a major city elsewhere in the western United States and formed a running group that would regularly run five to ten miles at a time. This running group grew to the point that it developed its own website and Facebook page so members could stay informed about scheduled runs. When we met him, he reported completing 3-4 mile “easy runs” on weekdays. On Saturdays, he regularly completed 10-20 mile long runs. Like several other runners in the sample, David also owned a Garmin Forerunner watch, which he referred to as his “GPS watch.”
David: By and large most of the time I’m wearing my GPS watch. It gives me my distance, my pace, I can come back and check mile-by-mile and how I did. It’s just like on the courses. So, “Mile 2 that’s where the hills were. I’ll need to tackle those harder next time.” But yeah, I use watches. I used to run a course before they had that kind of technology…I have certain paces I wanted to run. Without that [watch] I have to do it in my head. …The watch makes it a lot easier. And it improves my training because as I’m out running sometimes you may feel like
you’ve got a good pace going, but you check your watch and say, “oh my heavens
I’m really lagging behind I’ve got to pick it up.” So it makes you more focused on
your training.
In speaking about his watch, David’s words again highlight two of the major benefits afforded by the use of physical activity data tracking technology. First, it made existing computational work easier. As mentioned earlier, paces are meaningful quantities to runners, but their computation during the act of running is an added burden. One must take deliberate steps such as identifying possible markers for miles, noting current time, find another physical marker to use as a finish, determining time after that interval, and then determining the time to distance ratio. The precision of this information will vary depending on the markers used—pace for an entire multi-mile length may involve different paces for different legs. With a GPS-enabled device, the location and time information are available and obtained automatically. Thus, the computational work changes so that the focus during running can be on matters such as technique or strategy.
The other affordance of the technology that David mentioned was that it reconciled how things felt in his body with an actual measure of how he was doing objectively. It is not at all uncommon for a runner to feel they have “got a good pace going”, but experienced athletes recognize that perceived effort is not the same as actual performance. David found that he was able to maintain focus on specific, quantifiable metrics and use that to better understand his performance.

20
D: Because without the watch we’re going on perceived effort, which is, on occasion is fine. But we don’t know, in fact before we got the watch, I say we; I have a close running partner and I, before we got the watches, we’d run and we thought that we were doing okay. It wasn’t until we got the watches and it told
what our pace and our distance is that we started to improve our running times by
quite a bit. Because then we can look and see “Oh, here is where I should be based upon my training.” With the watch I know if I’m there or not. I should be at this pace for this distance, without the watch you don’t know unless you’ve run a lot. Again it’s just based upon my perceived effort based upon years of running. So the watch has helped a lot as far as improving our times in races.
David knew that the improvements were happening because he maintained a log of his
runs. In fact, David created two separate log files, both of which he maintained in an online spreadsheet tool. The first log was for his daily runs, and he described how he used it and his Forerunner.
D: What I do with it is I record every run and my overall pace. I’ll look at my splits by mile. Here's a case in point when it came in handy. Earlier this year on one of my 14 or 15 mile training runs, I ran and was doing 6:50-6:45 pace. I thought, “I don’t know if I can maintain this pace or not for the full 14 or 15 miles, but it’s a training run, I’m going to give it a go.” The worst that happens in a
training run is I crash and burn; I’m not going to die. So whatever. At that point I’m checking the watch the entire time because I want to be under 7:00 pace for this training run. So when I finished the overall pace was about a 6:45. This was a 14-mile run. So I forced myself based upon the watch to run faster.
Through logging his data, David came to expect certain paces for his training runs and
races at particular distances. When his watch provided data indicating that he had exceeded his expected pace, he re-calibrated his expectations for the run, using frequent feedback from the watch to ensure he met these new expectations.
Figure 5. Excerpts from the logging systems used by David for training
The other log that David maintained was a race log. In his race log file, he noted the date,
the name of the run, the type (8K, relay, marathon, etc.), his time, pace, placement in his division, and his placement overall. He also tabulated his percentile rank relative to all other participants in the race. In addition, he added comments about the race quality or concerns he had related to his physical state (e.g., he recorded a hernia that was bothering him for a few races).
As David was showing us his logs, we asked about a frequent note he made on some races that said simply “BQ”. He explained that was a marker for himself to help him remember

21
whether or not his time qualified for the Boston Marathon, the same community standard identified by Richard above. When asked about his Boston qualifying times, David was very quick to state that even though he had qualified for Boston, it did not mean he intended to run in the Boston Marathon after that. He was simply proud to mark that achievement in his records.
Figure 6. Excerpts from the logging system used by David for races
Aside from using his log to remember aspects of races and to evaluate his performance
relative to peers and a community standard (Boston qualification times), David also used his log as a tool for calibrating his expectations for upcoming races based on previous experience in the same race. As it turned out, the day we interviewed him was also the day before a half-marathon in town. David was going to compete in that as he did in previous years.
Int: Well, based on this, or whatever you’ve been doing, what do you think your Run the Rockies [the upcoming race] is going to turn out? D: The half [marathon] tomorrow? See, I – I’m probably, I’m think around 1:35 [hh:mm]. Int: What’s making you think 1:35? D: [referencing his log] Well, it was 1:38 last year, it’s a different course. I’m not as, motivated for it as I am Arbor City [another race in his log] which is coming up in 3-4 weeks. I’m more interested in racing the Arbor City half. I run this one because I like the course. I like it, I grew up here. But it’s more, I put it on the schedule because it’s a training run for the Dixie [another race on the log]. So probably 1:35. That’s what I think.
With the written record of his previous year’s performance and the view of where the
current race was situated relative to others that he was doing, David demonstrated a comfort with making a forecast of his performance. He also was able to factor in pace. In his race log, his pace (minute per mile) ranged from 7:08 to 8:31 across all of his races. For the current race year, his pace range tended to be between 6:42 and 7:45, with shorter times appearing more often in the recent races. As it turned out, David’s prediction was fairly accurate. He finished the half marathon in 1:32 the following day.
In summary, David found data about his running to be informative and desirable for a number of reasons. It simplified some of the computational work he needed to do, and he found that the numbers generated from his devices helped him to reconsider what he perceived and improve his actual performance. Logging the data allowed him to track his overall performance

22
and understand where he stood relative to various groups, including those in his age division, all runners in a given race, and the Boston qualifying standard. It also could be used to help him calibrate his expectations for his performance to the point where he was fairly accurate in his predictions. Interestingly, maintaining this log was something he did for himself. He did not make this information public, but it proved to be a useful artifact for helping David reach an understanding of where he stood athletically.
Relationships with Data: Tensions and Realizations Thus far, the examples we have provided have all been generally positive about the
infusion of technology into sport. However, there was a mix of opinions about data technologies, and negative sentiments were expressed fairly consistently by our athletes.
In order to fully understand the effect of physical activity data technologies on the practices of their users, we must also account for this negativity. It is important to recognize that all the examples of data use that we have presented involved quantifying one’s performance, and these actions were largely situated in the larger context of training for or participating in competitive activities. The four individuals we presented all raced competitively. Competition, and in particular, success during competition, were important drivers that supported continuation in the practices. Activity data were strongly associated with this competition frame, and we saw that for several individuals, there was a tension between appreciation for and a general weariness with the data they collected. For example, one way in which data could be troublesome was when the technology that provided the data was physically disruptive to the athletic activity, as described by Austin (a cyclist in his 20s).
Austin: When I started cycling earlier on…I thought “Oh, wouldn’t that be cool to track my speed and know how fast I can go and track my miles,” so I put a bike computer on both my bikes. I had it off within a week. I found that just having the numbers there, what I’d end up doing was just be like, looking at my computer more than paying attention to what I was doing. It wasn’t a danger thing, I was still paying attention where I needed to, but I felt like it robbed my
experience from everything around me. So, yeah, I don’t like having numbers
facing me or beeping at me during a ride.
Austin was a bicycle enthusiast who was very knowledgeable about optimal bicycle components and loved the speed he could reach while riding. He described himself as being “addicted to velocity” and that likely motivated him to get a bike computer in the first place. But the data and their omnipresence quickly became a distraction to him. He felt that the technology “robbed” him of the experience of being “on [his] bike with the trees and the wind around [him].” Some devices, like Austin’s, are capable of providing feedback on performance, beeping when the user drops below a certain cadence or speed. As these devices supported training and competition, this feature was sensible to include. Austin did not want that intrusion. His solution was to stick his bike computer in his pocket while riding. He was interested in seeing some of the information, like his distance and maximum speed, afterwards, but he did not want to see nor hear it while he was out enjoying his rides.
Yet, even without the interruption of a beeping device, the constant self-evaluation

23
inherent in performance quantification, and the competitive aspects that were implied, also became burdensome for Bradley, a cyclist in his 30s. He too described how data could disconnect him from the simple enjoyment of his sport.
Bradley: At the beginning of the year after the winter, you know, you don’t exercise at all, and you start awfully slow. I wanted to see how much I could improve to the end of the year, but, I found…that as I would ride and try to compete with my last ride and stuff, you know—I wasn’t enjoying the riding as I
was just trying to get better and for me that’s what it’s for, not trying to excel and
be some amazing athlete. I do it for the joy.
Bradley started riding for fitness and transportation and did not want to become an “amazing athlete.” When he felt pushed toward competition by his data, he enjoyed riding less. To keep from feeling the desire to constantly increase his performance, he then deliberately stopped gathering data on his riding. Indeed, even for Jennie, who transitioned to cycling by way of mountain biking and presented herself as being data-driven, competition was something she needed to compartmentalize. Racing was strictly for road biking and cyclocross. While espousing the benefits of understanding performance in terms of power, Jennie—who was introduced to cycling through mountain biking but began to compete through road cycling—made a similar point when she told us, “I don’t mountain bike with watts because I like it to be fun. I’m not out training. Not that I don’t go hard.”
In total, 17 of our 20 athletes (9 cyclists, 7 runners, and the individual who identified with both) found that the data led to them making comparisons about themselves. Ten individuals (6 cyclists, 4 runners) reported that the technology could decrease their enjoyment of their sport.
However, while about half of the users found some complaint about the technology, the benefits often outweighed the costs. For those who competed, it helped to improve performance. However, even for individuals who were not as competition-oriented, the data could be made meaningful and be validating. For example, the runner who used an Omron pedometer got a great deal of personal satisfaction from achieving 10,000 steps in a given day because it told her that she had stayed sufficiently active—particularly on days when she was not racing or doing a training run.
Stacy, a woman in her mid-30s, told us she started running because she had a family history of obesity and was concerned about health risks. She shared a personal anecdote to illustrate how data layered into her exercise positively changed her perceptions in a very affirming way.
Stacy: There was this route I did when I would visit my aunt and uncle…but there was this hill and this incline, and I would always be so out of breath when I got to that, and I’d keep telling myself, “You’re just being a wimp. You just need to buck up and do it.” But every single time, I’d start up on it, and then I’d end up stopping and walking because it was so hard! And I just thought of myself as
being a wimp…and just not being tough and getting out there and run, you know? And so I kinda had a low opinion of myself when it came to that…And then when I got this heart rate monitor, and …I threw it on one day, and I was out running and all of a sudden, I get to that same point and… I was about to walk, and I did

24
walk, and I glance down at my heart rate monitor and … my heart rate was 203! And I went “OH! A) I should be walking and B) I am not a wimp!” I need to, I need to walk through this. This is absolutely ridiculous to have it be that high…That’s why I have such a strong desire to walk. Because my body is saying, “You’ve got to slow down, you’ve got to let that heart rate drop.” And all of a
sudden, it was, “I’m not a wimp. I’m pretty tough if I can get it to that high.”
As she described it, Stacy was very critical of herself and her ability because she evaluated herself based on whether or not she could maintain a speed and run up a hill. She identified with “being a wimp” and had a “low opinion” of herself. But after she got her heart rate monitor and checked the data it was producing as she ran up that incline, she realized that by the metrics it was providing, she was working very hard. In fact, she thought that value was too high, and she was able to reframe her need to walk from being the result of wimpiness to being the result of an accelerated and unsustainable heart rate. Interestingly, after she saw that information, her athletic identity went from being a “wimp” to being “pretty tough” based on the heart rate metric that was made visible with her PAD device.
The presence of data in sport thus can be both burdensome for some, but for others it can be a boon. The numerical values made prominent by the technology tend to lead one to assign themselves a relative location on that scale. If there has been a personal history with data that has included other instances of self-placement on the scale (by virtue of participating in races or establishing performance goals), then a game of comparison between those immediate and previous placements comes quite naturally. However, when the numbers are seen as a means of recalibrating perceived effort, they are powerful and have the potential to reshape one’s practice-based identity as an active individual. We saw this in Stacy’s anecdote, and it also appeared to be tied to the positive feelings that David, Richard, and Jennie had each noted as well. For these technologies to be enjoyable, it would seem that we want devices to be informative about our sporting experiences but not the primary focus of our activity.
Conclusions As athletes incorporate personal activity data devices into their athletic practices, the
nature of the athletic endeavor exhibits changes. The technology establishes an information layer between the individual’s perception of the activity and their execution of physical movements necessary for the activity. Perhaps one of the most outwardly noticeable aspects of this mediation is a change in the way the athlete describes their activities. Those athletes who embraced their data expressed their activities more quantitatively; they focused on working in certain heart rate zones or pedaling at a certain cadence. They volunteered speed, paces, times, and distances as ways of describing their engagement in their sport. These athletes used this information layer as a resource to facilitate their engagement in competition. Yet for some athletes, there is also a need to remove the information layer, as it clouded the aspects of execution and perception that had originally brought them to their sport.
We do not foresee a decline in the use of physical activity data technologies. Quantification is a common feature of sport, especially in western society, and the advantages conferred by new sensor and measurement technologies are too numerous for serious athletes to turn them away. Thus, we see a new strand of practice in athletic affinity spaces emerging that

25
we designate as reflecting a move toward “technoathleticism” (Lee & Drake, 2012). As a term, technoathleticism is intended to cover the swath of activities and ways of thinking that come about from the creation of a mediating information layer within sport. Through this paper we have seen how training routines, loci of attention, and identifications of self can all change when the information layer is present. We also see that sometimes individuals need to move out of technoathletic practices and simply return to athletic ones.
Recognition of how practices and ways of thinking about self change when an information layer is introduced is important and timely as we are becoming more inundated with data, particularly, data about ourselves. Currently, there is an international movement toward understanding the “Quantified Self” by way of ‘lifelogging’ (e.g., Rivera-Pelayo, Zacharius, Muller, & Braun, 2012). The main idea of this movement is to monitor and record all aspects of the body, such as amount of sleep, food intake, and physical location throughout the day. It is thought to be a powerful means to support critical self-reflection as well as help inform the typical range of behaviors of people. Our primary contributions to this movement include some specific cases of self-quantification routines in a particular domain as well as some empirically-based discussion of both the benefits and challenges that are associated with understanding our lives and bodies in this way.
Additionally, we see the work here as having some use for research and development work in education. In our own research, we are exploring ways to bring in quantifiable data about bodily activities and making them an object of study for students. We operate under the assumption that more powerful learning and new means for understanding everyday activities are possible as long as we devise appropriate tools and learning activities. Thus far, we have had some modest successes with this approach (Lee & Thomas, 2011), but this study of adult athletes has proven useful to us in that it highlights how activity data are actually used “in the wild” and some of the risks that may be associated. The practice of individualized logging seems to be, at least relative to experienced practitioners, especially well-suited to these technologies. Thus, it might be appropriate to consider use of physical activity data in a classroom to require sustained and extended engagement and ample time, on the scale of weeks and months, for data collection. Also, attention should be given to how the data may influence how students view themselves and their activities. We often engage in physical activities for the sheer enjoyment of being active and being mobile in the physical world. It is possible that turning such activities into occasions of data reflection can detract from or otherwise affect the enjoyment that we experience when we simply focus on the positive experiences associated with mobility. On the flip side, it may also be possible we can help individuals who do not think they can enjoy and engage in such activities and give them a means to understand and appreciate what they are capable of doing. A major challenge for learning scientists is determining the most productive framing of educational activities that use personal data and experience. As there are increasingly others in the field who have been examining intersections of learning and knowing in the contexts of health, sport, and exercise (e.g., Halverson & Halverson, 2008; Kanter, Sherin, & Lee, 2006; Nasir & Hand, 2008; Smith, Frost, Albayrak, & Sudhakar, 2006; Reeve & Bell, 2009) this is a challenges that will continue to generate interest. We are optimistic that this challenge can be managed as we continue to better understand how these technologies reshape practices and afford ways of supporting new understandings about the self, sport, and physical activity.

26
Endnotes (1) All interviewee and other proper names are pseudonyms. (2) All emphases are added by the authors and have been made to highlight key phrases that
supported our analyses. (3) “Zipp 404 Firecrest Powertap G3 Wheel,” © Glory Cycles, used under Creative
Commons Attribution license, http://creativecommons.org/licenses/by/2.0/.

27
References Azevedo, F. (2011). Lines of practice: A practice-centered theory of interest relationships. Cognit
ion & Instruction, 29(2), 147-184. Berland, L. K., & Lee, V. R. (2012). In pursuit of consensus: Disagreement and legitimization
during small group argumentation. International Journal of Science Education, 34(12), 1857-1882. doi: 10.1080/09500693.2011.645086
Brown, J. S., & Duguid, P. (1991). Organizational learning and communities-of-practice: Toward a unified view of working, learning, and innovation. Organization Science, 2(1), 40-57.
Borg, G. (1998). Borg's Perceived Exertion and Pain Scales. Champaign, IL: Human Kinetics. Ching, C. C., & Foley, B. J. (Eds.). (2012). Constructing the Self in a Digital World. Cambridge,
UK: Cambridge University Press. Edelson, D. C., Gordin, D. N., & Pea, R. D. (1999). Addressing the challenges of inquiry-based
learning through technology and curriculum design Journal of the learning sciences,
8(3/4), 391-450. Edelson, D. C., & Reiser, B. J. (2006). Making authentic practices accessible to learners: Design
challenges and strategies. In R. K. Sawyer (Ed.), The Cambridge Handbook of the
Learning Sciences (pp. 335-354). New York: Cambridge University Press. Gainsburg, J. (2006). The mathematical modeling of structural engineers. Mathematical Thinking
and Learning, 8(1), 3-36. Gee, J. P. (2005). Semiotic social spaces and affinity spaces. In D. Barton & K. Tusting (Eds.),
Beyond Communities of Practice: Language Power and Social Context (pp. 214–232). Glaser, B. G., & Strauss, A. L. (1967). The discovery of grounded theory: Strategies for qualitati
ve research. Chicago: Aldine Pub. Co. Hall, R., Stevens, R., & Torralba, T. (2002). Disrupting representational infrastructure in
conversations across disciplines. Mind, Culture, and Activity, 9(3), 179-210. Halverson, E. R., & Halverson, R. (2008). Fantasy Baseball: The Case for Competitive Fandom.
Games and Culture, 3(3-4), 286-308. Kafai, Y. B., Fields, D. A., & Cook, M. S. (2010). Your second selves: Avatar designs and identit
y play. Games and Culture, 5(1), 23-42. Kanter, D., Sherin, B., & Lee, V. (2006). Changing conceptual ecologies in task-structured
science curricula. In S. A. Barab, K. E. Hay & D. T. Hickey (Eds.), Proceedings of The
Seventh International Conference of the Learning Sciences (Vol. 1, pp. 293-299). Mahwah, NJ: Lawrence Erlbaum Associates.
Lam, W. S. E. (2000). L2 Literacy and the Design of the Self: A Case Study of a Teenager Writing on the Internet. TESOL Quarterly, 34(3), 457-483.
Lave, J., & Wenger, E. (1991). Situated Learning: Legitimate peripheral participation. Cambridge: Cambridge University Press.
Lee, V. R., & Drake, J. (2012). Physical activity data use by technoathletes: Examples of collection, inscription, and identification. In J. van Aalst, K. Thompson, M. J. Jacobson & P. Reimann (Eds.), The Future of Learning: Proceedings of the 10th International Confer
ence of the Learning Sciences (ICLS 2012) (Vol. 2, pp. 321-325). Sydney, NSW, Australia: International Society of the Learning Sciences.
Lee, V. R., & DuMont, M. (2010). An exploration into how physical activity data-recording devices could be used in computer-supported data investigations. International Journal of
Computers for Mathematical Learning, 15(3), 167-189. doi: 10.1007/s10758-010-9172-8

28
Lee, V. R., & Thomas, J. M. (2011). Integrating physical activity data technologies into elementary school classrooms. Educational Technology Research and Development,
59(6), 865-884. doi: 10.1007/s11423-011-9210-9 Leontiev, A. N. (1978). Activity, Consciousness, and Personality. Englewood Cliffs, NJ:
Prentice-Hall. Miles, M. B., & Huberman, A. M. (1994). Qualitative data analysis : an expanded sourcebook
(2nd ed.). Thousand Oaks, Calif.: Sage. McDougall, C. (2009). Born to Run: A Hidden Tribe, Superathletes, and the Greatest Race the
World Has Never Seen. New York: Alfred A. Knopf. Nasir, N. S., & Cooks, J. (2009). Becoming a Hurdler: How Learning Settings Afford Identities.
Anthropology & Education Quarterly, 40(1), 41–61. doi:10.1111/j.1548-1492.2009.01027.x
Nasir, N. S., & Hand, V. (2008). From the Court to the Classroom: Opportunities for Engagement, Learning, and Identity in Basketball and Classroom Mathematics. Journal of the
Learning Sciences, 17(2), 143–179. doi:10.1080/10508400801986108 Noss, R., Pozzi, S., & Hoyles, C. (1999). Touching epistemologies: Meanings of average and
variation in nursing practice. Educational Studies in Mathematics, 40(1), 25-51. Papert, S. (1996). An Exploration in the Space of Mathematics Educations. International Journal
of Computers for Mathematical Learning, 1(1), 95-123. Peppler, K. A., & Kafai, Y. B. (2007). From SuperGoo to Scratch: exploring creative digital
media production in informal learning. Learning, Media and Technology, 32(2), 149-166. doi: 10.1080/17439880701343337
Reeve, S., & Bell, P. (2009). Children's self documetationand understanding of the concepts 'healthy' and 'unhealthy'. International Journal of Science Education, 31(14), 1953-1974.
Resnick, M., Maloney, J., Monroy-Hernandez, A., Rusk, N., Eastmond, E., Brennan, K., . . . Kafai, Y. (2009). Scratch: programming for all. Communications of the ACM, 52(11), 60-67. doi: 10.1145/1592761.1592779
Rivera-Pelayo, V., Zacharias, V., Müller, L., & Braun, S. (2012). Applying Quantified Self approaches to support reflective learning. In S. Dawson & C. Hathornwaite (Eds.), LAK
'12 Proceedings of the 2nd International Conference on Learning Analytics and
Knowledge (pp. 111-114). New York, NY: ACM. Roth, W. M., & McGinn, M. K. (1998). Inscriptions: Toward a theory of representing as social
practice. Review of Educational Research, 68(1), 35-59. Sherin, B. (2001). A comparison of programming and algebraic notation as expressive languages
for physics. International Journal of Computers for Mathematical Learning, 6, 1-61. Smith, B. K., Frost, J., Albayrak, M., & Sudhakar, R. (2006). Facilitating narrative medical
discussions of type 1 diabetes with computer visualizations and photography. Patient
Education and Counseling, 64, 313-321. Stefani, R. (2012). Olympic swimming gold: The suit or the swimmer in the suit? Significance,
9(2), 13-17. Turkle, S. (2011). Alone Together: Why We Expect More from Technology and Less from Each
Other. New York, NY: Basic Books. Turkle, S. (1984). The Second Self: Computers and the Human Spirit. New York, NY: Simon &
Schuster. Turkle, S. (1997). Life on the Screen: Identity in the Age of Internet. New York, NY: Simon &

29
Schuster. Vygotsky, L. S. (1978). Mind in society. Cambridge, MA: Harvard University Press. Wenger, E. (1998). Communities of Practice: Learning, Meaning, and Identity. New York:
Cambridge University Press. Wilensky, U., & Resnick, M. (1999). Thinking in levels: A dynamic systems approach to making
sense of the world. Journal of Science Education and Technology, 8(1), 3-19. Wilson, D. G. (2004). Bicycling Science (3rd ed.). The MIT Press. Wu, H., & Kracjik, J. S. (2006). Inscription practices in two inquiry-based classrooms: A case
study of seventh graders' use of data tables and graphs. Journal of Research in Science
Teaching, 43(1), 63-95.
Acknowledgments This work was funded by NSF grant DRL-1054280. The opinions in this paper are those of the authors and not necessarily of the US National Science Foundation. Sincere thanks go to the members of the VITAL Collaborative at Utah State University who assisted in data collection, the participants who shared their experiences, Utah businesses that assisted in participant recruitment, and three anonymous reviewers who provided a number of comments that helped us to improve this article. Thanks also to Bruce Sherin for helpful feedback on earlier versions of this article.
Copyright © 2022 FDOKUMEN