Running Economy Of Elite East African Runners: 805
12
1 23 European Journal of Applied Physiology ISSN 1439-6319 Eur J Appl Physiol DOI 10.1007/s00421-012-2357-1 Energetics of running in top-level marathon runners from Kenya Enrico Tam, Huber Rossi, Christian Moia, Claudio Berardelli, Gabriele Rosa, Carlo Capelli & Guido Ferretti
Transcript of Running Economy Of Elite East African Runners: 805

1 23
European Journal of AppliedPhysiology ISSN 1439-6319 Eur J Appl PhysiolDOI 10.1007/s00421-012-2357-1
Energetics of running in top-level marathonrunners from Kenya
Enrico Tam, Huber Rossi, ChristianMoia, Claudio Berardelli, Gabriele Rosa,Carlo Capelli & Guido Ferretti

1 23
Your article is protected by copyright and
all rights are held exclusively by Springer-
Verlag. This e-offprint is for personal use only
and shall not be self-archived in electronic
repositories. If you wish to self-archive your
work, please use the accepted author’s
version for posting to your own website or
your institution’s repository. You may further
deposit the accepted author’s version on a
funder’s repository at a funder’s request,
provided it is not made publicly available until
12 months after publication.

ORIGINAL ARTICLE
Energetics of running in top-level marathon runners from Kenya
Enrico Tam • Huber Rossi • Christian Moia •
Claudio Berardelli • Gabriele Rosa •
Carlo Capelli • Guido Ferretti
Received: 26 November 2011 / Accepted: 14 February 2012
� Springer-Verlag 2012
Abstract On ten top-level Kenyan marathon runners
(KA) plus nine European controls (EC, equivalent to KA),
we measured maximal oxygen consumption ( _VO2max) and
the energy cost of running (Cr) on track during training
camps at moderate altitude, to better understand the KA
dominance in the marathon. At each incremental running
speed, steady-state oxygen consumption ( _VO2) was mea-
sured by telemetric metabolic cart, and lactate by electro-
enzymatic method. The speed requiring _VO2 ¼ _VO2max
provided the maximal aerobic velocity (vmax). The energy
cost of running was calculated by dividing net _VO2 by the
corresponding speed. The speed at lactate threshold (vHAN)
was computed from individual Lab versus speed curves.
The sustainable _VO2max fraction (Fd) at vHAN (FHAN) was
computed dividing vHAN by vmax. The Fd for the marathon
(Fmar) was determined as Fmar = 0.92 FHAN. Overall,_VO2max (64.9 ± 5.8 vs. 63.9 ± 3.7 ml kg-1 min-1), vmax
(5.55 ± 0.30 vs. 5.41 ± 0.29 m s-1) and Cr (3.64 ± 0.28
vs. 3.63 ± 0.31 J kg-1 m-1) resulted the same in KA as in
EC. In both groups, Cr increased linearly with the square of
speed. FHAN was 0.896 ± 0.054 in KA and 0.909 ± 0.068
in EC; Fmar was 0.825 ± 0.050 in KA and 0.836 ± 0.062
in EC (NS). Accounting for altitude, running speed pre-
dictions from present data are close to actual running
performances, if FHAN instead of Fmar is taken as index of
Fd. In conclusion, both KA and EC did not have a very
high _VO2max, but had extremely high Fd, and low Cr, equal
between them. The dominance of KA over EC cannot be
explained on energetic grounds.
Keywords Maximal oxygen consumption � Energy cost �Running performance � Ethnic groups � Altitude
Introduction
A remarkable evolution in marathon running performance
has occurred in recent years. In 1990, the 50th best per-
former of the year ran in 2 h 13 min and 1 s, implying an
average running speed over the distance of 5.287 m s-1 or
19.03 km h-1 (source: http://digilander.libero.it/atletica2/
Stagionali/WRL/1990/Mar). The equivalent performance
in 2010 was 2 h 8 min and 25 s, for an average running
speed of 5.476 m s-1 or 19.72 km h-1 (source: http://
www.iaaf.org/statistics/toplists), representing a 3.58%
improvement with respect to 20 years earlier. Impressively
enough, this unusual performance improvement has been
Communicated by David C. Poole.
E. Tam � C. Moia � G. Ferretti
Departement de Neurosciences Fondamentales,
Universite de Geneve, Geneva, Switzerland
E. Tam
Facolta di Scienze Motorie, Universita di Bologna, Bologna,
Italy
H. Rossi � C. Berardelli � G. Rosa
Marathon Sport Medical Center, Brescia, Italy
C. Capelli
Dipartimento di Scienze Neurologiche, Neuropsicologiche,
Morfologiche e Motorie, Facolta di Scienze Motorie,
Universita di Verona, Verona, Italy
G. Ferretti
Dipartimento di Scienze Biomediche e Biotecnologie,
Facolta di Medicina, Universita di Brescia, Brescia, Italy
G. Ferretti (&)
Departement des Neurosciences Fondamentales, Centre Medical
Universitaire, 1 rue Michel Servet, 1211 Geneva 4, Switzerland
e-mail: [email protected]
123
Eur J Appl Physiol
DOI 10.1007/s00421-012-2357-1
Author's personal copy

largely due to marathon runners from Kenya. In 1990, there
was only one athlete from Kenya in the top 50 list, and he
was a Kikuyu. This number never stopped increasing ever
since. In 2010, there were 30 Kenyans in the top 50 per-
formers in the marathon, and 108 in the top 200. Similar
tendencies can also be reckoned for the half-marathon
performance.
Most of the current marathon runners from Kenya
belong to the same ethnic group, the Kalenjin. Of the 30
Kenyans in the 2010 top 50 list, 29 were Kalenjin and 1
Kikuyu. The Kalenjins constitute some 3.5 million indi-
viduals, divided into 12 tribes that have been dwelling for
centuries on the highlands of the Rift Valley, in the western
part of Kenya. For more details on the demography and
social geography of the Kalenjin tribes, see Larsen (2003).
The question is how such an extraordinary achievement by
such a small-sized population could take place. Several
aspects were looked at, including population genetics
(Larsen 2003, 2004; Yang et al. 2007), food intake
(Onywera et al. 2004), demography and social organization
(Larsen 2003; Onywera et al. 2006), and hematology
(Prommer et al. 2010). In the field of exercise physiology,
maximal oxygen consumption, lactate threshold and run-
ning economy (Billat et al. 2003; Larsen et al. 2004; Saltin
et al. 1995b), muscle morphology and muscle fiber typing
(Saltin et al. 1995a) were investigated. These studies,
however, provided only limited answers to the above
question.
Most of previous physiological studies on Kenyan run-
ners were not carried out on top athletes, but on either
medium-level or junior athletes and this jeopardized the
possibility of identifying differences with respect to ath-
letes from other ethnic groups. This was the first study to be
carried out on real top marathon runners: the studied Ka-
lenjin included Martin Lel, multiple winner of London and
New York City marathons, and Sammy Korir, who in
Berlin ended one second apart from the world record; the
control group included Stefano Baldini from Italy, winner
of the Olympic marathon in Athens 2004, and Viktor
Rothlin from Switzerland, the current European champion.
The maximal velocity that a long-distance runner can
sustain over a given distance (vd) is equal to:
vd ¼_Emax
Cr
¼ Fd� _VO2max
Cr
ð1Þ
where Cr is the energy cost of running (the physical
parameter quantifying running economy), _Emax is the
maximal sustainable metabolic power, _VO2max is the
maximal oxygen consumption and Fd is the fraction of_VO2max that can be sustained over the race distance. When_Emax ¼ _VO2max, then Fd = 1; when _Emax\ _VO2max, then
Fd \ 1. The latter is the case for the marathon, in which Fd
is somehow related to the so-called lactate threshold speed
(Ferretti et al. 2011), which Helgerud et al. (1990) defined
as the highest speed at which, during a 20-min continuous
exercise, blood lactate concentration increases by less
than 1 mM in the last 15 min. Because of Eq. 1, the
measurement of _VO2max and Cr and the estimate of Fd is
first source of information on potential differences on the
sustainable marathon speed between Kalenjin and Cau-
casians (di Prampero 1986; Ferretti et al. 2011). Other
factors may be called upon for a deeper physiological
understanding of the phenomenon of Kenyan runners, but
if physiological differences exist between Kalenjin run-
ners and runners from other ethnic groups, they can only
translate into visible differences in the three terms of the
right branch of Eq. 1.
The aim of this study was thus to measure _VO2max, Cr
and estimate Fd in a set of top-level marathon runners
issued from the Kalenjin ethnic group and compare them
with the data obtained on a group of top-level Caucasian
athletes. The hypothesis was that the predominance of the
Kalenjin in the marathon could be explained by differences
in the three terms of Eq. 1 with respect to their Caucasian
competitors.
Methods
Subjects
Ten Kalenjin marathon runners (KA) participated in the
study. They all had a best performance in the marathon of
less than 2 h and 9 min. A control group of nine top
European athletes (European controls, EC) was also
enrolled, with similar performances to those of KA. The
physical characteristics of KA and EC are reported in
Table 1, together with the best performances in the mara-
thon and the semi marathon in the 2 years that preceded
and followed the performance of the tests. The two groups
did not differ among them, except for the fact that EC were
significantly older than KA. Body mass was strictly the
same (1.7 kg difference, p = 0.482). Nevertheless, KA had
significantly better performances on both the marathon and
the half-marathon than EC, although only four EC athletes
had a performance on the marathon.
The athletes were investigated outside the competition
period, during winter or summer training stages. This
implies that all experiments were carried out at altitude, in
winter at Eldoret, Kenya (altitude 2,000 m, inspired oxy-
gen pressure (PIO2), 113.2 ± 0.6 mmHg), in summer either
at Saint Moritz, Switzerland (altitude 1,800 m, PIO2
116.7 ± 0.5 mmHg) or at Ortisei, Italy (altitude 1,300 m,
PIO2 127.3 ± 0.5 mmHg).
Eur J Appl Physiol
123
Author's personal copy
Study designs and methods were approved by the ethical
committee of the local health agency of Brescia, Italy,
where Rosa Associati, the athletes managing company, is
located. All the subjects were informed about the aims of
the investigation and the methods applied in the experi-
ments, and they all signed a written informed consent form.
Protocol
This was a field study and the experiments were performed
on an athletic camp. In Eldoret, we operated at the Kip-
choge Keyno Stadium, whose track is in red clay. In Eur-
ope, experiments were performed on training camps, whose
track was covered with synthetic material. The length of
the track on the inner circle was measured and in all cases
resulted to be within 2 m from the official length of 400 m.
Starting from the goal line, plastic cones were positioned
50 m apart, to give a precise reference of the distance
covered. An investigator, who cycled 10 m ahead of the
athlete following the rhythm imposed by a metronome,
paced the running velocity. The frequency of the metro-
nome at each speed was set in such a way as to have a beep
each time the bicycle had to pass beside a cone. The dis-
tance between the bicycle and the athlete, who ran in the
innermost track, was such as to avoid any reduction of the
air resistance encountered by the athletes while running.
A progressive step protocol was applied. Starting from a
velocity of 12 km h-1, the velocity was progressively
increased by steps of 2 km h-1, up to 20 km h-1. Each
step lasted 4 min. Successive steps were separated by 5-
min intervals, during which micro blood samples were
taken from an earlobe for the measurement of blood lactate
concentration. In most cases, the athlete sustained the
20 km h-1 step without signs of exhaustion. If this was so,
then a final step was performed, consisting of an all-out
trial over the 800-m distance. This effort was slightly su-
pramaximal for all athletes. At the end of this last trial,
peak blood lactate concentration (Lab) was determined
with micro blood samples taken at min 1, 3 and 5 during
recovery. Arterial oxygen saturation (SaO2) was also
measured before and immediately after the end of the test.
Measurements
Oxygen consumption ( _VO2) at the exercise steady state
was determined by means of a portable telemetric meta-
bolic cart (Cosmed K4, Rome, Italy) at rest and during each
running trial. The system comprised a turbine flowmeter
(instantaneous flow between 0.03 and 20 l s-1; precision
±2%), a zirconium oxygen analyzer (precision ±0.02%,
response time \150 m s) and an infrared carbon dioxide
analyzer (precision ±0.01%, response time \150 m s).
The metabolic system was calibrated before and after each
experimental session by means of certified gas mixtures
and a 3-l syringe (Hans Rudolph, Kansas City, MO, USA).
R was calculated from V:
CO2 and V:
O2 data. Heart rate was
measured continuously by a cardiometer (Polar, Finland).
Peak blood lactate concentration was measured by an
electro-enzymatic method (Lactate Pro, Biomedic Labs,
USA). Arterial oxygen saturation was measured by infrared
spectrometry (Siemens MicrO2, Denvers, MA, USA).
The individual _VO2max was determined from the plateau
attained by the _VO2 versus speed relationship above a
given speed. This plateau was observed in all tests. The
corresponding maximal aerobic velocity (vmax) was cal-
culated as the minimal speed requiring a _VO2 equal to_VO2max, or, in other terms, as the velocity at the crossing of
the _VO2max plateau with the _VO2 versus speed line. Cr was
computed at all speeds lower than vmax (submaximal
speeds) as the ratio between the net (measured minus
upright resting) steady state _VO2 at each speed and the
corresponding speed. The speed at the lactate threshold
(vHAN) was computed from the Lab versus speed curves,
Table 1 Basic characteristics of the subjects and their performances on the marathon and the half-marathon
Subjects Age
(yy)
Height
(cm)
Body
mass (kg)Resting _VO2
(ml min-1 kg-1)
Resting fh
(min-1)
Marathon
time (s)
Half-marathon
time (s)
KA
Mean 29 172 59.4 5.7 59 7,637 3,640
SD 4 7 5.8 1.4 4 87 31
EC
Mean 33 175 61.1 6.7 65 7,704a 3,717
SD 4 5 4.5 2.3 11 75 47
Concerning performances, as expressed in IAAF official timing rules, the average marathon times corresponded to 2 h 7 min and 17 s (SD 1 min
27 s) in KA, and 2 h 8 min 24 s (SD 1 min 15 s) in EC, whereas the average half-marathon times corresponded to 60 min and 40 s (SD 31 s) in
KA and 61 min and 57 s (SD 47 s) in EC
_VO2 oxygen consumption, fh heart rate, KA top-level Kalenjins (n = 10), EC European controls (n = 9)a n = 4
Eur J Appl Physiol
123
Author's personal copy

with the same procedure used by Helgerud (1994). The
sustainable fraction of _VO2max at vHAN (FHAN) was com-
puted as the ratio of vHAN to vmax. The Fd for the marathon
(Fmar) was then determined as (Helgerud 1994):
Fmar ¼ 0:92FHAN ð2Þ
Statistics
Mean values are reported along with their standard devia-
tions (SD). Data comparison among groups was done by
means of a student t test for unpaired observations.
Although the level of significance was formally set at
p \ 0.05 (two-tailed test), actual p values are reported.
Concerning Cr, comparison of Cr changes with increasing
speed within each group was done by means of a one-way
analysis of variance for repeated measures. When appli-
cable, a Tukey post hoc test was used to locate significant
differences. The level of significance was set at p \ 0.05
(two-tailed test). Linear regression equations were com-
puted with the least-squares method. The slope was con-
sidered significant when p \ 0.05. Slopes and y-intercepts
were compared by means of analysis of covariance
(Kleinbaum et al. 1987). In figures, values are given as
mean and standard deviation, whereas lines are regression
lines computed on individual data.
Results
The _VO2max is reported in Table 2 for both KA and EC,
together with the related parameters. p values indicate that_VO2max was indeed the same in KA as in EC, as were all other
reported parameters, despite the observed significant dif-
ferences in marathon performance. Of course, a tendency
toward lower _VO2max values at Eldoret or St. Moritz than at
Ortisei was observed, for both KA (63.1 ± 6.9 vs. 67.5 ±
2.6 ml kg-1 min-1) and EC (62.3 ± 5.2 vs. 65.2 ± 1.6
ml kg-1 min-1). The mean Cr was 3.64 ± 0.28 J kg-1 m-1
(174 ± 13 ml kg-1 km-1) in KA and 3.63 ± 0.31 J
kg-1 m-1 (174 ± 15 ml kg-1 km-1) in EC, again practi-
cally the same in the two groups (p = 0.963).
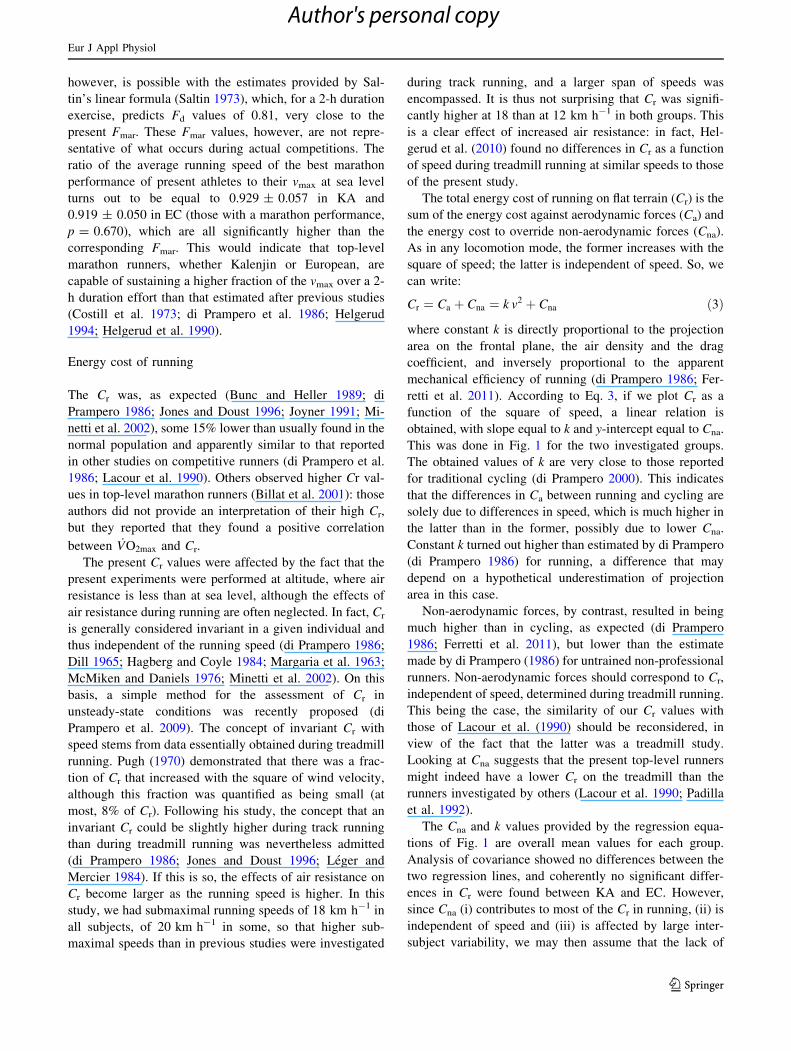
However, when the effects of speed on Cr is analyzed, as
in Table 3, it appears that the Cr at the speed of 18 km h-1
was significantly higher than at the speed of 12 km h-1 in
both groups (p = 0.046 for KA and 0.042 for EC),
although no differences between groups were observed at
any speed. If we plot Cr as a function of the square of
submaximal running speeds, as in Fig. 1, significant linear
relationships are found for each group. The two regression
lines, also reported on the same figure, had no significant
differences in slopes and y-intercepts, partly because of
inter-individual variability within groups (coefficient of
variations for Cr 7.7% in KA and 8.6% in EC). The
y-intercepts, corresponding to the non-aerodynamic com-
ponent of Cr (Cna) were indeed very close, equal to
3.288 J kg-1 m-1 in KA and 3.234 J kg-1 m-1 in EC, as
were the slopes, corresponding to the aerodynamic constant
k, which were equal to 0.0180 and 0.0191 J s2 kg-1 m-3 in
KA and EC, respectively.
The vhAN was 4.96 ± 0.15 m s-1 in KA and
4.92 ± 0.43 m s-1 in EC (p = 0.774). As a consequence,
the FhAN turned out to be equal to 0.896 ± 0.055 in KA
and 0.909 ± 0.068 in EC (p = 0.653), indicating that EC
and KA really had almost equal FhAN. The Fmar was equal
to 0.825 ± 0.050 and 0.836 ± 0.062, in KA and EC,
respectively (Table 4).
The combination of individual _VO2max, Cr at the speed
of 18 km h-1 (note that Cr varies with speed) and Fmar
yielded a prediction of mean sustainable running speed in
the marathon, at the altitudes at which the study was car-
ried out, of 4.561 ± 0.246 m s-1 in KA and
4.568 ± 0.578 m s-1 in EC (p = 0.972).
Discussion
According to Eq. 1, three factors determine the maximal
sustainable speed during a marathon: the _VO2max, its
Table 2 Maximal oxygen consumption and related parameters
Subjects _VO2max (l min-1) _VO2max (ml min-1 kg-1) [La]max (mM) vmax (m s-1) vmax (km h-1) fhmax (min-1) R SaO2
KA
Mean 3.83 64.9 8.63 5.55 20.0 181 1.09 0.84
SD 0.36 5.8 3.75 0.30 1.1 9 0.11 0.07
EC
Mean 3.90 63.9 9.56 5.41 19.5 174 1.06 0.88
SD 0.35 3.7 4.22 0.29 1.0 9 0.07 0.05
p 0.698 0.660 0.617 0.332 0.332 0.111 0.474 0.107
_VO2 max maximal oxygen consumption, [La]max maximal blood lactate concentration, fhmax maximal heart rate, R gas exchange ratio at maximal
exercise, SaO2 arterial oxygen saturation, KA top-level Kalenjins (n = 10), EC European controls (n = 9)
Eur J Appl Physiol
123
Author's personal copy
sustainable fraction and Cr (di Prampero 1986; Ferretti
et al. 2011). All these factors were determined on KA and
EC. This was the first study in which the energetics of
running in top-level Kenyan marathon runners was inves-
tigated. In fact, the best performances of the KA group
were such as to place all the members of this group within
the top 50 list of year 2010 or the top 200 best perfor-
mances of all time in the marathon, according to the
records of the International Association of Athletic Fed-
erations (see http://www.iaaf.org/statistics/toplists). None
of the previous studies of the energetics of running in
Kenyan long-distance runners could be carried out on
athletes of similar level to the present ones. In the past,
only adolescent or junior athletes, or runners of a lesser
level, could be studied (Billat et al. 2003; Larsen et al.
2004; Saltin et al. 1995b). These studies revealed no dif-
ferences with respect to their European controls. The sus-
picion existed, however, that energetic differences might
have appeared when real top-level athletes were studied.
The present results showed that this was not so, since no
differences between KA and EC were found for any of the
investigated parameters. As a consequence, equal predicted
marathon speeds were obtained for both KA and EC at the
altitudes where this study was carried out. These results
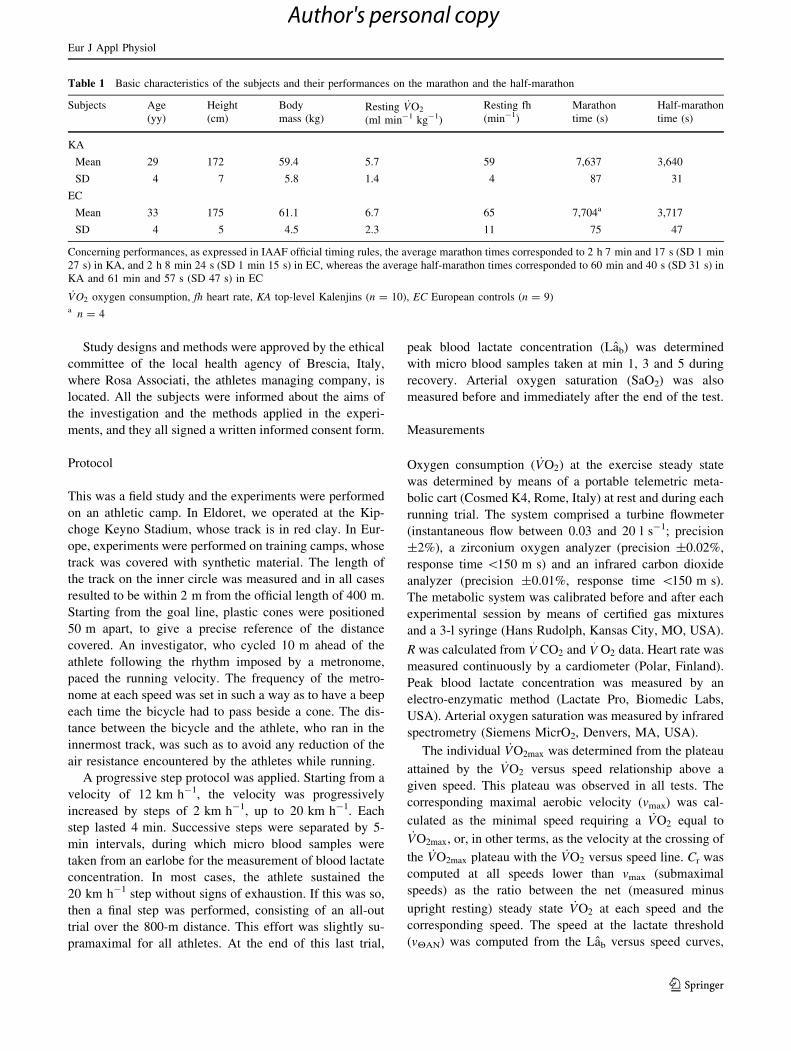
Table 3 Energy cost of running (Cr) (mean and standard deviations)
at the various investigated speeds (v)
V (km h-1) Cr (J kg-1 m-1) Cr (ml kg-1 km-1) p
KA EC KA EC
12
Mean 3.48 3.44 167 165 0.766
SD 0.26 0.28 13 14
14
Mean 3.56 3.53 170 169 0.853
SD 0.30 0.29 15 14
16
Mean 3.67 3.61 176 173 0.748
SD 0.38 0.41 18 20
18
Mean 3.72 3.71 178 178 0.943
SD 0.34 0.34 16 16
TKy = 0.0180x + 3.2883
R2 = 0.2883
ECy = 0.0191x + 3.2355
R2 = 0.2992
3.000
3.200
3.400
3.600
3.800
4.000
4.200
0.00 5.00 10.00 15.00 20.00 25.00 30.00
square of speed (m2 s-2)
Cr (
J kg
-1 m
-1)
Fig. 1 Mean values of the energy cost of running (Cr) as a function
of the square of speed. Data are given as mean and standard deviation.
Regressions have been calculated on individual data. Filled circletop-level Kalenjin (KA), open circle European controls (EC)
Table 4 Prediction of marathon average speed at sea level
Sea level KA EC
_VO2max (ml min-1 kg-1)
Mean 69.1 67.9
SD 6.0 3.7
Cr at 18 km h-1 (J m-1 kg-1)
Mean 3.83 3.83
SD 0.35 0.32
Fmar
Mean 0.825 0.836
SD 0.050 0.062
FHAN
Mean 0.896 0.909
SD 0.054 0.068
Fd, actual
Mean 0.933 0.919
SD 0.058 0.050
v (Fmar) (km h-1)
Mean 17.13 16.85
SD 0.95 1.92
v (FHAN) (km h-1)
Mean 18.62 18.31
SD 1.03 2.09
v (Fd, actual) (km h-1)
Mean 19.39 19.36
SD 1.02 0.77
vrecord (km h-1)
Mean 19.89 19.72*
SD 0.23 0.19
_VO2max estimated maximal oxygen consumption at sea level, Cr
energy cost of running, Fmar sustainable fraction of maximal aerobic
speed calculated according to Helgerud et al. 1990, FHAN sustainable
fraction of _VO2max calculated after the speed at the lactate threshold,
Fd actual, sustainable fraction of maximal aerobic speed calculated
after the average speed sustained during the best performance mara-
thon, v velocity, vrecord average speed attained during best perfor-
mance marathon by the investigated athletes, KA top-level Kalenjins,
EC European controls (*n = 4 for this group)
Eur J Appl Physiol
123
Author's personal copy
show that, contrary to the tested hypothesis, the supremacy
of Kenyan runners over Caucasians in the marathon is not
due to differences in the energetics of running. Yet, we
demonstrated a clear effect of speed on Cr in both KA and
EC, which we attributed to an effect of speed on the energy
cost against aerodynamic forces, Ca. This effect was
strictly the same in KA and EC. The three parameters that
determine the sustainable mean running speed of a mara-
thon are discussed separately, before putting them together
in an attempt at predicting the marathon speed at sea level
and compare it with the actual mean speed during
competition.
Maximal oxygen consumption
The relatively low _VO2max values were obviously a con-
sequence of the altitude at which the tests were carried out.
Due to logistic constraints, tests had to be made at two
different altitudes, so at two inspired PO2 values, both
lower than at sea level, where most marathons take place.
This may be viewed as a limitation of our study. The mean_VO2max value reported in Table 2 accounts for the two
altitudes. Luckily enough, the fraction of athletes investi-
gated at 2,000 m was the same in the two groups, which
made group comparison possible. An estimate of the
equivalent _VO2max at sea level requires deciding about the
occurrence of arterial oxygen desaturation at maximal
exercise (Dempsey effect, Dempsey et al. 1984) in these
athletes. This occurrence is unpredictable from the mea-
sured SaO2. For the sake of simplicity, we assumed that the
present subjects were not affected by the Dempsey effect.
Based on this assumption, the individual _VO2max values at
sea level could be calculated from the characteristics of the
classical curve describing the _VO2max decrease at altitude
(Ferretti 1990), considering the actual altitude at which
each test was done. Then the corresponding SaO2 values at
sea level were estimated after the linear _VO2max versus
SaO2 relationship reported by Ferretti et al. (1997).
At sea level, estimated _VO2max turned out equal to
69.1 ± 6.0 ml min-1 kg-1 in KA and 68.7 ± 4.0
ml min-1 kg-1 in EC (p = 0.841). These _VO2max values
were associated with vmax values at sea level of
5.94 ± 0.33 m s-1 in KA and 5.78 ± 0.33 m s-1 in EC
(p = 0.318). These sea-level _VO2max values were coupled
with estimated SaO2 values at maximal exercise of
0.89 ± 0.08 and 0.94 ± 0.05, in KA and EC, respectively
(p = 0.173). The estimated SaO2 values of KA are in the
range of what Dempsey and Wagner (1999) define as
moderate exercise-induced arterial hypoxemia, suggesting
that our assumption might have been partially wrong.
Nevertheless, in view of the moderate altitude at which the
tests were made, the hypothetical error introduced in this
estimate would be, practically speaking, negligible. In fact,
only slightly higher sea-level _VO2max values would have
been obtained by using the linear relationship that Wehrlin
and Hallen (2006) established for desaturating athletes.
Moreover, the mean SaO2 value of KA is affected by the
data of two athletes, who were remarkably hypoxemic at
maximal exercise (their SaO2 values were 0.71 and 0.74 at
the end of the test, carried out in Eldoret). Saltin et al.
(1995b) found a 16.6% higher _VO2max at sea level than at
2,000 m in a group of young medium-level Kalenjin run-
ners, suggestive of severe exercise-induced arterial hyp-
oxemia in those subjects. This was not the case for the
present KA: a 16.6% higher _VO2max at sea level would
have implied SaO2 values around 1.0, if not above, for the
present subjects, a preposterous situation indeed.
The estimated _VO2max values at sea level are elevated,
but not as high as one would expect. They can conveniently
be compared with those of Coetzer et al. (1993), who found
similar _VO2max values than the present ones in a group of
high-level South-African long-distance runners investi-
gated at sea level. Yet, they appear lower than those found
by others on Kenyan runners of lesser level than the present
ones (Billat et al. 2003; Saltin et al. 1995b). Even higher_VO2max values were reported on marathon runners in a
farther past. The _VO2max of two top-level Kalenjins of the
1960s was higher than 80 ml min-1 kg-1 (Saltin and
Astrand 1967), and similar values were also observed in
top-level Caucasians studied in the same period (di
Prampero et al. 1970; Pollock 1977; Saltin and Astrand
1967). Such high _VO2max values have not been observed
anymore in marathon runners in recent years, since values
below 75 ml min-1 kg-1 are most commonly found at sea
level nowadays (Billat et al. 2001; Larsen et al. 2004). It is
noteworthy, however, that in older studies graded protocols
were used and it was reported that the former provide_VO2max values that are 5% higher than with the latter
exercise mode (Hermansen and Saltin 1969). An extremely
high _VO2max is not a distinctive characteristic of contem-
porary marathon runners, independent of the ethnic group
to which they belong.
Sustainable fraction of maximal oxygen consumption
A direct determination of Fd is complex, since it requires
running until exhaustion at several submaximal speeds, and
no previous study reported measured Fd values, but only
estimates. The same was the case for the present athletes.
In this study, we relied on the concept that the Fd sustained
over a marathon (Fmar) is directly related to vhan (Helgerud
et al. 1990; Helgerud 1994), whose ratio to vmax is equal to
FhAN. So, we computed Fmar from Fhan, according to
Helgerud (1994). An indirect and simple comparison,
Eur J Appl Physiol
123
Author's personal copy
however, is possible with the estimates provided by Sal-
tin’s linear formula (Saltin 1973), which, for a 2-h duration
exercise, predicts Fd values of 0.81, very close to the
present Fmar. These Fmar values, however, are not repre-
sentative of what occurs during actual competitions. The
ratio of the average running speed of the best marathon
performance of present athletes to their vmax at sea level
turns out to be equal to 0.929 ± 0.057 in KA and
0.919 ± 0.050 in EC (those with a marathon performance,
p = 0.670), which are all significantly higher than the
corresponding Fmar. This would indicate that top-level
marathon runners, whether Kalenjin or European, are
capable of sustaining a higher fraction of the vmax over a 2-
h duration effort than that estimated after previous studies
(Costill et al. 1973; di Prampero et al. 1986; Helgerud
1994; Helgerud et al. 1990).
Energy cost of running
The Cr was, as expected (Bunc and Heller 1989; di
Prampero 1986; Jones and Doust 1996; Joyner 1991; Mi-
netti et al. 2002), some 15% lower than usually found in the
normal population and apparently similar to that reported
in other studies on competitive runners (di Prampero et al.
1986; Lacour et al. 1990). Others observed higher Cr val-
ues in top-level marathon runners (Billat et al. 2001): those
authors did not provide an interpretation of their high Cr,
but they reported that they found a positive correlation
between _VO2max and Cr.
The present Cr values were affected by the fact that the
present experiments were performed at altitude, where air
resistance is less than at sea level, although the effects of
air resistance during running are often neglected. In fact, Cr
is generally considered invariant in a given individual and
thus independent of the running speed (di Prampero 1986;
Dill 1965; Hagberg and Coyle 1984; Margaria et al. 1963;
McMiken and Daniels 1976; Minetti et al. 2002). On this
basis, a simple method for the assessment of Cr in
unsteady-state conditions was recently proposed (di
Prampero et al. 2009). The concept of invariant Cr with
speed stems from data essentially obtained during treadmill
running. Pugh (1970) demonstrated that there was a frac-
tion of Cr that increased with the square of wind velocity,
although this fraction was quantified as being small (at
most, 8% of Cr). Following his study, the concept that an
invariant Cr could be slightly higher during track running
than during treadmill running was nevertheless admitted
(di Prampero 1986; Jones and Doust 1996; Leger and
Mercier 1984). If this is so, the effects of air resistance on
Cr become larger as the running speed is higher. In this
study, we had submaximal running speeds of 18 km h-1 in
all subjects, of 20 km h-1 in some, so that higher sub-
maximal speeds than in previous studies were investigated
during track running, and a larger span of speeds was
encompassed. It is thus not surprising that Cr was signifi-
cantly higher at 18 than at 12 km h-1 in both groups. This
is a clear effect of increased air resistance: in fact, Hel-
gerud et al. (2010) found no differences in Cr as a function
of speed during treadmill running at similar speeds to those
of the present study.
The total energy cost of running on flat terrain (Cr) is the
sum of the energy cost against aerodynamic forces (Ca) and
the energy cost to override non-aerodynamic forces (Cna).
As in any locomotion mode, the former increases with the
square of speed; the latter is independent of speed. So, we
can write:
Cr ¼ Ca þ Cna ¼ k v2 þ Cna ð3Þ
where constant k is directly proportional to the projection
area on the frontal plane, the air density and the drag
coefficient, and inversely proportional to the apparent
mechanical efficiency of running (di Prampero 1986; Fer-
retti et al. 2011). According to Eq. 3, if we plot Cr as a
function of the square of speed, a linear relation is
obtained, with slope equal to k and y-intercept equal to Cna.
This was done in Fig. 1 for the two investigated groups.
The obtained values of k are very close to those reported
for traditional cycling (di Prampero 2000). This indicates
that the differences in Ca between running and cycling are
solely due to differences in speed, which is much higher in
the latter than in the former, possibly due to lower Cna.
Constant k turned out higher than estimated by di Prampero
(di Prampero 1986) for running, a difference that may
depend on a hypothetical underestimation of projection
area in this case.
Non-aerodynamic forces, by contrast, resulted in being
much higher than in cycling, as expected (di Prampero
1986; Ferretti et al. 2011), but lower than the estimate
made by di Prampero (1986) for untrained non-professional
runners. Non-aerodynamic forces should correspond to Cr,
independent of speed, determined during treadmill running.
This being the case, the similarity of our Cr values with
those of Lacour et al. (1990) should be reconsidered, in
view of the fact that the latter was a treadmill study.
Looking at Cna suggests that the present top-level runners
might indeed have a lower Cr on the treadmill than the
runners investigated by others (Lacour et al. 1990; Padilla
et al. 1992).
The Cna and k values provided by the regression equa-
tions of Fig. 1 are overall mean values for each group.
Analysis of covariance showed no differences between the
two regression lines, and coherently no significant differ-
ences in Cr were found between KA and EC. However,
since Cna (i) contributes to most of the Cr in running, (ii) is
independent of speed and (iii) is affected by large inter-
subject variability, we may then assume that the lack of
Eur J Appl Physiol
123
Author's personal copy

significant differences in Cr among groups and the rela-
tively low correlation coefficients of the regression lines
reported in Fig. 1 are mostly due to variability of Cna.
Inter-subject variability of Cna implies vertical shifts up or
down of the individual Cr versus v2 lines with respect to the
corresponding regression line shown in Fig. 1. This shift
can be estimated for each speed from the ratio between the
individual Cr and the mean Cr at the same speed, when
individual Cna was obtained. Then the individual Ca was
calculated as Cr minus the corresponding Cna. These
results, however, still include the variability due to the
different altitudes at which the experiments were carried
out. Thus, Ca was referred to sea-level condition, by cor-
recting it for the effects of lower air density at altitude. To
this aim, the relationship between air density and altitude
established by Capelli and di Prampero (1995) was used.
The results of this analysis are shown in Fig. 2, showing
that at each speed KA and EC had also equal Ca values
(p ranging from 0.131 at 12 km h-1 to 0.378 at
18 km h-1). To sum up, the lack of differences in Cr
between KA and EC is not only a result of a confounding
effect of the predominance of highly variable Cna in
determining Cr: KA and EC have the same Cna and the
same Ca, indeed.
Best performance in marathon running
The knowledge of sea-level _VO2max, Cr and Fd allows an
estimate of the mean marathon running speed for a
comparison with actual running speeds as attained during
competition. The estimated data at sea level used for this
prediction are summarized in Table 4. When Fmar is used
as index of Fd, significantly lower predicted than actual
marathon speeds are obtained. When FhAN is used instead,
predicted speeds are much closer, although still lower, to
actual speeds, in both groups. This discrepancy is at least
partly related to the fact that athletes run a marathon at
their best physical condition, at an even higher Fd than the
FhAN. However, it is of note that we took the individual
best performance as actual marathon speed. The above
differences are further reduced if we consider the marathon
performances that some of the athletes established within
3 months after their participation in the tests. Let us take
0.0
0.1
0.2
0.3
0.4
0.5
TK EC
Ca (
J kg
-1 m
-1) 12 km hr-1
14 km hr-116 km hr-118 km hr-1
Fig. 2 Estimated aerodynamic energy cost (Ca) of running at the
indicated speeds for top-level Kalenjin (KA) and European controls
(EC). No significant differences were found between KA and EC
Table 5 Individual data obtained on two KA and one EC athletes, who accepted to disclose their data and who ran a marathon within 3 months
after testing
Martin Lel Elijah Keitany Viktor Rothlin
Eldoret SL Ortisei SL Eldoret SL
V0O2max (l min-1) 3.67 3.94 4.40 4.63 3.63 3.90
V0O2max (ml min-1 kg-1) 62.8 67.5 64.0 67.4 59.1 63.5
vmax (m s-1) 5.444 5.854 5.611 5.969 5.556 5.974
Cr at 5 m s-1 (J kg-1 m-1) 3.28 3.39 3.37 3.45 3.49 3.64
vHAN (m s-1) 5.139 5.526 5.097 5.422 5.361 5.765
FHAN 0.944 0.944 0.908 0.908 0.965 0.965
vmar at SL (m s-1) Predicted 5.762 5.513 5.550
Actual 5.508 5.438 5.480
Record 5.615 5.551 5.521
SL sea level, _VO2max maximal oxygen consumption, vmax maximal aerobic speed, Cr energy cost of running, vHAN speed at the lactate threshold,
FHAN sustainable fraction of _VO2max calculated after vHAN, vmar mean speed over a marathon, predicted speed after Eq. 1, actually sustained
speed within 3 months after testing, and personal record speed. On 22 April 2007, Lel won the London Marathon in 2 h 7 min and 41 s running
at a mean speed of 5.508 m s-1, i.e., 4.4% slower than predicted. According to the prediction, he would have in principle been able to run in 2 h
2 min and 3 s, i.e., faster than the current world record, but he did not need to exploit such a potential to gain the London marathon. On the
contrary, on 31 October 2010, Keitany was eighth in Frankfurt, Germany, in 2 h 9 min and 19 s, with a mean speed of 5.438 m s-1, equivalent to
only 1.36% less than the predicted speed. His best performance on the marathon (2 h 6 min 41 s) is only 0.69% faster than our prediction (2 h
7 min and 33 s). On 1 April 2007, Rothlin won the Zurich marathon in 2 h 8 min and 20 s. His mean speed was 1.24% less than the predicted
speed. His best performance (2 h 7 min and 23 s) is only 0.52% slower than our prediction (2 h 6 min and 43 s)
Eur J Appl Physiol
123
Author's personal copy

three examples, from two KA and one EC who authorized
disclosure of their individual data, Martin Lel, Elijah
Keitany and Viktor Rothlin. Lel and Rothlin were tested in
Eldoret, Kenya, in February 2007, Keitany in Ortisei, Italy,
in July 2010. Their results are shown in Table 5. Their
predicted marathon speeds, calculated using Fhan, were
20.74 km h-1 for Lel, 19.85 km h-1 for Keitany and
19.98 km h-1 for Rothlin, to be compared, respectively,
with record speeds of 20.21, 19.98 and 19.87 km h-1.
The present results are not in contrast with the hypothesis
that shortly the 2-h record in the marathon may be broken
(Capelli and Ferretti 2011), possibly by an athlete with an
extremely low Cr (Joyner 1991; Foster and Lucia 2007). In
KA, the coefficient of variability of sea-level _VO2max was
8.62%, that of Cr at 18 km/h was 9.05%, and that of Fhan
6.08%. Assume a hypothetical athlete with a higher _VO2max
and FhAN and a lower Cr at 18 km h-1 than the mean values
of the KA group by an amount corresponding to one-half of
the coefficient of variation of KA for each variable, a very
likely case indeed. Well, such an athlete would in theory be
able to run the marathon in 2 h 0 min and 14 s, indicating
that the goal of the 2-h marathon is close indeed.
Conclusions
In conclusion, top-level Kalenjin marathon runners are
characterized by a high, but not very high, _VO2max, an
extremely elevated Fd and a low Cr. The same, however, was
the case for their European counterparts, so that the domi-
nance of Kenyan marathon runners with respect to Cauca-
sians cannot be explained by differences in the energetics of
running. The predictions of mean running speed that can be
made from the present data are reasonably close to the actual
running performances, if an Fd equal to the FhAN is
accounted for, although the Fd actually sustained during a
competition might be somewhat higher than FhAN. A precise
knowledge of the individual energetic parameters is still a
crucial aspect for the evaluation of the physical condition of a
marathon runner in view of a competition. The 2-h marathon
record is not far from being achieved.
Acknowledgments Financial support to this work was provided by
a grant the Office Federal du Sport, Magglingen, Switzerland, to
Guido Ferretti. We are grateful to Rosa Associati srl, Iseo, Italy, and
the Italian Athletic Federation (FIDAL) for collaboration in athletes’
recruitment and for logistic support.
References
Billat VL, Demarle A, Slawinski J, Paiva M, Koralsztein JP (2001)
Physical and training characteristics of top-class marathon
runners. Med Sci Sports Exerc 33:2089–2097
Billat V, Lepretre PM, Heugas AM, Laurence MH, Salim D,
Koralsztein JP (2003) Training and bioenergetic characteristics
in elite male and female Kenyan runners. Med Sci Sports Exerc
35:297–304
Bunc V, Heller J (1989) Energy cost of running in similarly trained
men and women. Eur J Appl Physiol 59:178–183
Capelli C, di Prampero PE (1995) Effects of altitude on top speeds during
1 h unaccompanied cycling. Eur J Appl Physiol 71:469–471
Capelli C, Ferretti G (2011) Comments on viewpoint: the two-hour
marathon: who and when? Physiological determinants of best
performance in marathon running. J Appl Physiol 110:283–284
Coetzer P, Noakes TD, Sanders B, Lambert MI, Bosch AN, Wiggins
T, Dennis SC (1993) Superior fatigue resistance of elite black
South African distance runners. J Appl Physiol 75:1822–1827
Costill DL, Thomas H, Roberts E (1973) Fractional utilization of the
aerobic capacity during distance running. Med Sci Sports
5:248–252
Dempsey JA, Wagner PD (1999) Exercise-induced arterial hypox-
emia. J Appl Physiol 87:1997–2006
Dempsey JA, Hanson PG, Henderson KS (1984) Exercise-induced
arterial hypoxaemia in healthy human subjects at sea level.
J Physiol Lond 355:161–175
di Prampero PE (1986) The energy cost of human locomotion on land
and in water. Int J Sports Med 7:55–72
di Prampero PE (2000) Cycling on earth, in space, on the moon. Eur J
Appl Physiol 82:345–360
di Prampero PE, Pinera-Limas F, Sassi G (1970) Maximal muscular
power, aerobic and anaerobic, in 116 athletes performing at the
XIXth Olympic games in Mexico. Ergonomics 13:665–674
di Prampero PE, Atchou G, Brt‹ ckner JC, Moia C (1986) The
energetics of endurance running. Eur J Appl Physiol 55:259–266
di Prampero PE, Salvadego D, Fusi S, Grassi B (2009) A simple
method for assessing the energy cost of running during
incremental tests. J Appl Physiol 107:1068–1075
Dill DB (1965) Oxygen used in horizontal and grade walking and
running on the treadmill. J Appl Physiol 20:19–22
Ferretti G (1990) On maximal oxygen consumption in hypoxic
humans. Experientia 46:1188–1194
Ferretti G, Moia C,Thomet JM, KayserB (1997)The decrease of maximal
oxygen consumption during hypoxia in man: a mirror image of the
oxygen equilibrium curve. J Physiol Lond 498:231–237
Ferretti G, Bringard A, Perini R (2011) An analysis of performance in
human locomotion. Eur J Appl Physiol 111:391–401
Foster C, Lucia A (2007) Running economy: the forgotten factor in
elite performance. Sports Med 37:316–319
Hagberg JM, Coyle EF (1984) Physiological comparison of compet-
itive race walking and running. Int J Sports Med 5:74–77
Helgerud J (1994) Maximal oxygen uptake, anaerobic threshold and
running economy in women and men with similar performances
level in marathons. Eur J Appl Physiol 68:155–161
Helgerud J, Ingjer F, Strømme SB (1990) Sex differences in
performance-matched marathon runners. Eur J Appl Physiol
61:433–439
Helgerud J, Støren O, Hoff J (2010) Are there differences in running
economy at different velocities for well-trained distance run-
ners? Eur J Appl Physiol 108:1099–1105
Hermansen L, Saltin B (1969) Oxygen uptake during maximal
treadmill and bicycle exercise. J Appl Physiol 26:31–37
Jones AM, Doust JH (1996) A 1% treadmill grade most accurately
reflects the energetic cost of outdoor running. J Sports Sci
14:321–327
Joyner MJ (1991) Modelling optimal marathon performance on the
basis of physiological factors. J Appl Physiol 70:683–687
Kleinbaum DG, Kupper LL, Muller KE (1987) Applied regression
analysis and other multivariable methods. PWS-KENT Publish-
ing Company, Boston
Eur J Appl Physiol
123
Author's personal copy
Lacour JR, Padilla-Magunacelaya S, Barthelemy JC, Dormois D
(1990) The energetics of middle distance running. Eur J Appl
Physiol 60:38–43
Larsen HB (2003) Kenyan dominance in distance running. Comp
Biochem Physiol A 136:161–170
Larsen HB, Christensen DL, Nolan T, Søndergaard H (2004) Body
dimensions, exercise capacity and physical activity level of
adolescent Nandi boys in western Kenya. Ann Hum Biol
31:159–173
Leger L, Mercier B (1984) Gross energy cost of horizontal treadmill
and track running. Sports Med 1:270–277
Margaria R, Cerretelli P, Aghemo P, Sassi G (1963) Energy cost of
running. J Appl Physiol 18:367–370
McMiken DF, Daniels JT (1976) Aerobic requirements and maximum
aerobic power in treadmill and track running. Med Sci Sports
8:14–17
Minetti AE, Moia C, Roi GS, Susta D, Ferretti G (2002) Energy cost
of walking and running at extreme uphill and downhill slopes.
J Appl Physiol 93:1039–1046
Onywera VO, Kiplamai FK, Boit MK, Pitsiladis YP (2004) Food and
macronutrient intake of elite Kenyan distance runners. Int J Sport
Nutr Exerc Metab 14:709–719
Onywera VO, Scott RA, Boit MK, Pitsiladis YP (2006) Demographic
characteristics of elite Kenyan endurance runners. J Sports Sci
24:415–422
Padilla S, Bourdin M, Barthelemy JC, Lacour JR (1992) Physiolog-
ical correlates of middle-distance running performance. A
comparative study between men and women. Eur J Appl Physiol
65:561–566
Pollock ML (1977) Submaximal and maximal working capacity of
elite distance runners. Part I: cardiorespiratory aspects. Ann NY
Acad Sci 301:310–327
Prommer N, Thoma S, Quecke L, Gutekunst T, Volzke C, Wachs-
muth N, Niess AM, Schmidt W (2010) Total hemoglobin mass
and blood volume of elite Kenyan runners. Med Sci Sports Exerc
42:791–797
Pugh LGCE (1970) Oxygen intake in track and treadmill running with
observations on the effect of air resistance. J Physiol Lond
207:823–835
Saltin B (1973) Oxygen transport by the circulatory system during
exercise in man. In: Keul J (ed) Limiting factors of physical
performance. Thieme, Stuttgart, pp 235–252
Saltin B, Astrand PO (1967) Maximal oxygen uptake in athletes.
J Appl Physiol 23:353–358
Saltin B, Kim CK, Terrados N, Larsen H, Svedenhag J, Rolf CJ
(1995a) Morphology, enzyme activities and buffer capacity in
leg muscles of Kenyan and Scandinavian runners. Scand J Med
Sci Sports 5:222–230
Saltin B, Larsen H, Terrados N, Bangsbo J, Bak T, Kim CK,
Svedenhag J, Rolf CJ (1995b) Aerobic exercise capacity at sea
level and at altitude in Kenyan boys, junior and senior runners
compared with Scandinavian runners. Scand J Med Sci Sports
5:209–221
Wehrlin JP, Hallen J (2006) Linear decrease in VO2max and
performance with increasing altitude in endurance athletes. Eur
J Appl Physiol 96:404–412
Yang N, MacArthur DG, Wolde B, Onywera VO, Boit MK, Lau SY,
Wilson RH, Scott RA, Pitsiladis YP, North K (2007) The
ACTN3 R577X polymorphism in East and West African
athletes. Med Sci Sports Exerc 39:1985–1988
Eur J Appl Physiol
123
Author's personal copy