Digital PCR quantification of MGMT methylation refines prediction of clinical benefit from...
44
1 Annals of Oncology 2015; doi: 10.1093/annonc/mdv272 title: Digital PCR quantification of MGMT methylation refines prediction of clinical benefit from alkylating agents in glioblastoma and metastatic colorectal cancer author(s) list: L. Barault 1 , A. Amatu 2 , F.E. Bleeker 3 , C. Moutinho 4 , C. Falcomatà 1 , V. Fiano 5 , A. Cassingena 2 , G. Siravegna 1,6,7 , M. Milione 8 , P. Cassoni 5 , F. De Braud 9 , R. Rudà 10 , R. Soffietti 10 , T. Venesio 1 , A. Bardelli 1,6 , P. Wesseling 11,12 , P. de Witt Hamer 13 , F. Pietrantonio 8 , S. Siena 2 , M. Esteller 4,14,15 , A. Sartore-Bianchi 2 , F. Di Nicolantonio 1,6* affiliation(s) list: 1 Experimental Clinical Molecular Oncology, Candiolo Cancer Institute-FPO, IRCCS, Candiolo (Torino), Italy; 2 Niguarda Cancer Center, Ospedale Niguarda Ca' Granda, Milan, Italy; 3 Department of Clinical Genetics, Academic Medical Center, University of Amsterdam, The Netherlands; 4 Cancer Epigenetics and Biology Program (PEBC), Bellvitge Biomedical Research Institute (IDIBELL), Barcelona, Catalonia, Spain; 5 Department of Medical Sciences, University of Turin, Citta` della Salute e della Scienza Hospital, Turin, Italy; 6 Department of Oncology, University of Torino, Candiolo (Torino), Italy; 7 FIRC Institute of Molecular Oncology (IFOM), Milan, Italy; 8 Department of Pathology and Laboratory Medicine, Fondazione IRCCS Istituto Nazionale dei Tumori, Milan, Italy;
-
Upload
independent -
Category
Documents
-
view
4 -
download
0
Transcript of Digital PCR quantification of MGMT methylation refines prediction of clinical benefit from...

1
Annals of Oncology 2015;
doi: 10.1093/annonc/mdv272
title: Digital PCR quantification of MGMT methylation refines prediction of clinical
benefit from alkylating agents in glioblastoma and metastatic colorectal cancer
author(s) list: L. Barault 1, A. Amatu 2, F.E. Bleeker 3, C. Moutinho 4, C. Falcomatà 1, V.
Fiano 5, A. Cassingena 2, G. Siravegna 1,6,7, M. Milione 8, P. Cassoni 5, F. De Braud 9, R.
Rudà 10, R. Soffietti 10, T. Venesio 1, A. Bardelli 1,6, P. Wesseling 11,12, P. de Witt Hamer 13,
F. Pietrantonio 8, S. Siena 2, M. Esteller 4,14,15, A. Sartore-Bianchi 2, F. Di Nicolantonio 1,6*
affiliation(s) list:
1 Experimental Clinical Molecular Oncology, Candiolo Cancer Institute-FPO, IRCCS,
Candiolo (Torino), Italy;
2 Niguarda Cancer Center, Ospedale Niguarda Ca' Granda, Milan, Italy;
3 Department of Clinical Genetics, Academic Medical Center, University of Amsterdam,
The Netherlands;
4 Cancer Epigenetics and Biology Program (PEBC), Bellvitge Biomedical Research
Institute (IDIBELL), Barcelona, Catalonia, Spain;
5 Department of Medical Sciences, University of Turin, Citta` della Salute e della Scienza
Hospital, Turin, Italy;
6 Department of Oncology, University of Torino, Candiolo (Torino), Italy;
7 FIRC Institute of Molecular Oncology (IFOM), Milan, Italy;
8 Department of Pathology and Laboratory Medicine, Fondazione IRCCS Istituto Nazionale
dei Tumori, Milan, Italy;

2
9 Department of Medical Oncology Fondazione IRCCS Istituto Nazionale dei Tumori,
Milan, Italy;
10 Department of Neuroscience, University of Turin and Città della Salute e della Scienza
Hospital, Turin, Italy;
11 Department of Pathology, VU University Medical Center, Amsterdam, The Netherlands
12 Department of Pathology, Radboud University Medical Center, Nijmegen, The
Netherlands
13 Department Neurosurgery, Neurosurgical Center Amsterdam, VU University Medical
Center, Amsterdam, The Netherlands
14 Department of Physiological Sciences II, School of Medicine, University of Barcelona,
Catalonia, Spain;
15 Institucio Catalana de Recerca i Estudis Avançats (ICREA), Barcelona, Catalonia, Spain
full address for correspondence
*corresponding author:
Dr Federica Di Nicolantonio
Department of Oncology, University of Torino
Strada Provinciale, 142 km 3,95
10060 Candiolo, Torino-Italy
Phone: +39 011 993 3837
Fax: +39 011 993 3225
(Email: [email protected])

3
Abstract
Background: O6-Methyl-Guanine-Methyl-Transferase (MGMT) silencing by promoter
methylation may identify cancer patients responding to the alkylating agents dacarbazine
or temozolomide.
Patients and methods: We evaluated the prognostic and predictive value of MGMT
methylation testing both in tumor and cell-free circulating DNA (cfDNA) from plasma
samples using an ultra-sensitive two-step digital PCR technique (Methyl-BEAMing).
Results were compared to two established techniques, Methylation specific PCR (MSP)
and Bs-pyrosequencing.
Results: Thresholds for MGMT methylated status for each technique were established in
a training-set of 98 glioblastoma patients. The prognostic and the predictive value of
MGMT methylated status was validated in a second cohort of 66 glioblastoma patients
treated with temozolomide in which Methyl-BEAMing displayed a better specificity than the
other techniques. Cut-off values of MGMT methylation specific for metastatic colorectal
cancer (mCRC) tissue samples were established in a cohort of 60 patients treated with
dacarbazine. In mCRC, both quantitative assays Methyl-BEAMing and Bs-pyrosequencing
outperformed MSP, providing better prediction of treatment response and improvement in
progression-free survival (PFS)(p<0.001). Ability of Methyl-BEAMing to identify responding
patients was validated in a cohort of 23 mCRC patients treated with temozolomide and
pre-selected for MGMT methylated status according to MSP. In mCRC patients treated
with dacarbazine, exploratory analysis of cfDNA by Methyl-BEAMing showed that MGMT
methylation was associated with better response and improved median PFS (p=0.008).
Conclusions: Methyl-BEAMing showed high reproducibility, specificity and sensitivity and
was applicable to formalin fixed paraffin embedded tissues and cfDNA. This study

4
supports the quantitative assessment of MGMT methylation for clinical purposes since it
could refine prediction of response to alkylating agents.
Key Words: MGMT; DNA methylation; digital PCR; Metastatic colorectal cancer;
alkylating agent; cell free circulating DNA.
Key Message:
Improved assessment of MGMT methylation by a digital PCR method in glioblastoma as
well as in colorectal cancer samples could be used to identify patients most likely to derive
clinical benefit from treatment with alkylating agents such as dacarbazine or temozolomide.

5
Introduction
Alkylating agents such as dacarbazine and temozolomide (TMZ) are currently used in the
clinical management of lymphomas, melanomas and as first-line treatment for
glioblastoma (GBM) in addition to surgical resection and radiotherapy. Action of these
drugs is enhanced in tumors with inactive O6-Methyl-Guanine-Methyl-Transferase
(MGMT), which is the DNA repair enzyme in charge of removing DNA alkylated adducts
[1]. Defective MGMT function mainly results from its transcriptional silencing by gene
promoter methylation. Therefore, MGMT methylation has been proposed as a predictive
marker of response to alkylating agents [2-5]. Nevertheless, not all patients with MGMT
hypermethylated tumors respond to treatment with alkylating agents [6, 7].
MGMT silencing has also been found to occur in several other malignancies [8, 9],
including colorectal cancer (CRC) [8, 9]. The reported high prevalence of this marker in
CRC (30-40%) has led to several trials which have recently evaluated the clinical activity of
alkylating agents in the metastatic setting [10-13]. Collectively, these studies showed that
clinical benefit could be achieved in up to 40% of heavily pre-treated patients [11-13].
Despite minor differences in response rates and progression-free survival (PFS), all the
above studies reported that only a fraction of MGMT methylated cases derived clinical
benefit from treatment with dacarbazine or TMZ. We hypothesize that the relatively poor
specificity of MGMT status as a predictive marker of response to alkylating agents could
be explained by an inaccurate assessment of methylation due to sampling issues, tumor
heterogeneity or suboptimal detection methods.
Here we implemented the detection of MGMT methylation through the
methyl beads, emulsion, amplification, and magnetics protocol also known as Methyl-
BEAMing assay [14]. We validated the predictive prognostic value of MGMT methylation

6
testing in two GBM cohorts. We tested whether this technique could improve the
assessment of MGMT methylation and the selection of CRC patients with higher
probability of response to alkylating agents. We then compared it to commonly used
methods, including Methylation Specific PCR [MSP] [15] and Bisulfite Pyrosequencing [Bs-
Pyrosequencing] [16]. Finally, we evaluated the ability of the Methyl-BEAMing assay to
detect tumor methylation status directly from plasma samples of CRC patients to evaluate
the feasibility of patient selection for treatment via a blood test.
Material and Methods
Patients and sample preparation
A first GBM training-set included tissue samples from 98 patients who had undergone
brain surgery at the Academic Medical Center in Amsterdam, between 1988 and 2006 [17].
A second GBM validation-set consisted of 66 tissue samples from patients with newly-
diagnosed GBM, who had surgery and chemoradiation (radiotherapy and concomitant
TMZ, followed by six monthly cycles of adjuvant TMZ) with a follow-up of at least two years
at the VU University Medical Center in Amsterdam. The DETECT-01 trial composed the
CRC training-set, in which 68 patients with chemorefractory metastatic CRC (mCRC) were
treated with dacarbazine [11]. The validation-set consisted of 23 samples from a phase II
trial, in which 32 patients with chemorefractory metastatic CRC (mCRC) were treated with
TMZ [13]. Further details about the cohorts and the sample preparation can be found in
Data S1. The studies followed the Declaration of Helsinki and were approved by local
ethics committees.
MGMT methylation assays
MGMT methylation was retrospectively assessed in tissue sample DNA using MSP, Bs-
pyrosequencing and Methyl-BEAMing. Analyses were performed in a blinded fashion

7
without prior knowledge of MGMT methylation status. Cell-free circulating DNA (cfDNA)
(cfDNA) was assessed by Methyl-BEAMing. All the assays targeted CpGs within the
differentially methylated region number 2 previously associated with TMZ response [18].
Detailed protocols are provided in Data S1. Sensitivity, reproducibility and specificity of
MGMT Methyl-BEAMing assays can be found in Data S2.
Quality control of cfDNA
Three different assays were used to evaluate the presence of cfDNA from tumor origin
(circulating tumor DNA, ctDNA): Methyl-BEAMing assays specific for SEPT9 and VIM
methylation (markers highly prevalent in mCRC) and Droplet Digital™ PCR assays for the
KRAS mutational status for samples known to be mutated in the tumor tissue (Data S1).
Statistical Analyses
Survival analyses and kappa statistics were performed using Prism 6.01 for Windows
(GraphPad Software). Differences in survival were tested by the log-rank test (Mantel-Cox).
ROC analyses were performed with R bioconductor using the pROC package [19].
Hazard-Ratios were expressed using the log-rank test. All expressed p-values were
calculated with two-tailed tests and were considered significant when p<0.05.
Results
Prognostic and predictive value of MGMT methylation in GBM
MGMT methylation is a well-known prognostic marker in GBM [8]. In order to establish the
prognostic value of MGMT status assessed by Methyl-BEAMing, we employed tissue
samples from a cohort of 98 patients with GBM diagnosed before TMZ was introduced as
component of standard treatment for these tumors [17]. Methyl-BEAMing was compared
with two established techniques, namely MSP and Bs-Pyrosequencing. For each method,

8
ROC analysis was performed to evaluate the threshold best fitting the overall survival (OS)
at 1 year (Data S3A-C). Methylation classification for the three methods concurred in most
of the cases with the best agreement between Bs-Pyrosequencing and Methyl-BEAMing
(86.7%) (Data S3D). All three methods identified a methylated subgroup of patients with
better OS (p<0.05 for all methods); however quantitative techniques (Bs-Pyrosequencing,
Methyl-BEAMing) displayed a better specificity. Then, only quantitative methods were
assessed in a validation cohort of 66 GBM treated with TMZ. Methylation ranges, status,
and association with survival for both techniques are summarized in Table S1 and Data
S3E-G. OS and PFS according to methylation status by both techniques are shown in
Figure 1 and demonstrated better identification of long term responders with Methyl-
BEAMing. Comparison of hazard-ratios (Data S3H), showed a better stratification of the
population with good prognosis and response to TMZ by Methyl-BEAMing.
Prognostic and predictive value of MGMT methylation in mCRC
The DETECT-01 study evaluated dacarbazine treatment for mCRC patients after failure of
standard therapies. The original report determined MGMT methylation status via MSP and
found that 44% of patients in the methylated subgroup achieved disease control as
assessed by radiological methods, although no improvement in PFS was observed [11].
Archived FFPE tumor samples were available for 61 of the 68 patients originally enrolled in
the trial. MGMT assessment was successful in 56 cases (91.8%) by MSP, 59 (96.7%) by
Bs-Pyrosequencing and in all 61 cases by Methyl-BEAMing. Methylation values were
normalized for 60 cases for which tumor content was available (Data S1). All techniques
showed a bimodal distribution with similar range (Data S4A-B). MGMT methylation ranges,
status and association with survival are in Table S1. For each method ROC analysis was
performed to evaluate the threshold best fitting the PFS at 12 weeks (Data S4C). When
these cut-off values were applied, the number of cases classified as methylated by MSP,

9
Bs-Pyrosequencing and Methyl-BEAMing was 18 (30%), 10 (17%) and 12 (20%),
respectively. This resulted in 92% concordance between Bs-Pyrosequencing and Methyl-
BEAMing, and 77% and 72% agreement between MSP and Methyl-BEAMing or Bs-
Pyrosequencing respectively (Data S4D). No association with OS was observed with any
of the techniques (Data S4E), suggesting that MGMT status might lack prognostic value in
mCRC.
Response to dacarbazine was evaluated using RECIST criteria. Among the 61 available
cases, nine patients showed disease control (two responders and seven individuals with
stable disease; Data S4). MSP classified 18 cases as methylated, which included seven of
the nine patients achieving clinical benefit, thereby displaying a positive predictive value
(PPV) of 0.39 and a negative predictive value (NPV) of 0.88 (Figure 2A). Bs-
Pyrosequencing achieved a PPV of 0.8 and NPV of 0.89, by classifying a total of 10 cases
as methylated, of which eight patients with disease control (Figure 2B). Methyl-BEAMing
identified 12 tumors as methylated, of which eight (67%) were from patients with clinical
benefit (Figure 2C), resulting in a PPV of 0.67 and a NPV of 0.89.
Next, Bs-Pyrosequencing and Methyl-BEAMing were assessed in a validation cohort of 23
samples from mCRC patients treated with TMZ using the above identified cut-off values.
Methyl-BEAMing was successful in 21 cases (91%) and identified 8 tumors as methylated,
of which 4 (50%) were from patients with clinical benefit (all partial responders) (Data S4G-
H), achieving a PPV of 0.5 and a NPV of 0.67. Methyl-BEAMing methylated subgroup also
showed a trend for improved PFS. Bs-Pyrosequencing failed in 15 cases (65%) preventing
further analyses.
Analysis of cfDNA in plasma from mCRC Patients
MGMT methylation of cfDNA was only assessed by Methyl-BEAMing assay. Evaluation
was successful in all 49 available samples. MGMT ranges, status and association with

10
survival are shown in Table S1. ROC analysis was performed to define the best threshold
in cfDNA (Data S4C). Thirty-eight unmethylated cases (75.6%) were identified. To verify
the presence of DNA from tumor origin (circulating tumor DNA, ctDNA), we assessed
KRAS mutational status for the 20 cases with known G12 or G13 mutation in the
corresponding tumor tissue, as well as SEPT9 and VIM methylation in all samples.
Methylated SEPT9 and VIM are two early markers of detection of intestinal disease
reported with over 85% prevalence in mCRC [14, 20]. Six samples were considered as low
ctDNA (four KRAS mutated and two wild type cases) since they displayed neither KRAS
mutation nor methylation in SEPT9 or VIM in plasma (Figure 1D) despite showing these
alterations in the corresponding tissue (data not shown).
Out of the 49 available plasma samples only 43 had remaining matched tissue that could
be assessed for tumor content and MGMT methylation. Concordance was seen in 37
cases (86.1%) (six methylated and 31 unmethylated cases; Figure 1E; Data S4I).
Correlation between the MGMT methylation status in tissue and plasma samples indicates
that most of the methylated alleles present in the tissue were released in the blood
(Spearman correlation= 0.53, p=0.0003).
MGMT methylated status in cfDNA was also associated with a significantly improved
median PFS (2.1 months vs. 1.8 months for unmethylated group, p=0.008, Table S1, Data
S4E). Among the available plasma samples, seven were obtained from patients with
clinical benefit from dacarbazine treatment. MGMT methylated status was observed in 11
(22%) plasma and identified five of the seven patients achieving clinical benefit (Figure 1F,
Data S4F). Among the two unmethylated cases with clinical benefit, one did not have
remaining tissue sample DNA and the second was considered as low ctDNA.

11
Discussion
MGMT methylation has been previously identified as a prognostic and predictive marker in
GBM [2-5]. However its specificity for response prediction in GBM and other cancer types
remains controversial. MGMT methylation status is usually evaluated by MSP or Bs-
Pyrosequencing [15, 16]. Notably, recent phase II clinical trials in mCRC with alkylating
agent therapies relied on MSP evaluation of MGMT [11-13] for patient selection or
evaluation of response prediction. These studies demonstrated that up to 40% of heavily
pretreated mCRC patients achieved some clinical benefit, indicating that drug repositioning
could be helpful in this setting upon improved patient selection [21]. Here, we describe the
use of Methyl-BEAMing, a highly sensitive and reproducible technique for the detection of
MGMT methylation in tissue and plasma samples derived from cancer patients.
Prognostic significance of MGMT methylated status assessed by Methyl-BEAMing in GBM
was improved compared to MSP or Bs-Pyrosequencing. Predictive value of MGMT
methylated status for response to TMZ was also observed with a better stratification using
Methyl-BEAMing compared to Bs-Pyrosequencing. Plasma samples were not available for
the GBM patients, thereby preventing us from assessing the potential role of liquid biopsy
in this setting. While the blood brain barrier may limit the amount of cfDNA in patients
affected by CNS malignancies [22], it has been shown that real-time PCR can be used to
detect MGMT methylation in the plasma of glioblastoma patients receiving TMZ [23].
Further studies are therefore warranted to clarify the role of liquid biopsy in GBM [24].
Our study retrospectively assessed two mCRC cohorts for which DNA was extracted from
FFPE tissue. The three methods successfully evaluated most of the CRC samples in the
first training-set yet with a better performance obtained with Methyl-BEAMing in terms of
dynamic range. Both mCRC patient cohorts were enrolled in clinical trials with alkylating

12
agents thus allowing the assessment of MGMT methylation as a predictive biomarker.
Both Methyl-BEAMing and Bs-Pyrosequencing outperformed MSP in the CRC training-set
strongly indicating that quantitative methods are needed to assess methylation markers in
tissue. However, Bs-Pyrosequencing failed to reliably assess MGMT promoter methylation
status in most of the samples of the validation cohort for which only limited amount of DNA
was available. Consequently, although Bs-Pyrosequencing provides a robust quantification,
its requirement for DNA with high quality and quantity could limit its use for specific sample
types such as FFPE biopsies or cfDNA.
Of interest, a number of GBM cases showed intra-locus heterogeneity by Bs-
Pyrosequencing (also described by Bady et al. using a methylation microarray platform
[18]); while this pattern was rarely seen in the mCRC samples (Data S4I). As the current
Bs-Pyrosequencing is the average of the six evaluated CpG sites, its accuracy might suffer
from the heterogenous profiles observed in GBM as well as by incomplete bisulfite
conversion. Therefore we hypothesize that this could explain the discrepancy of
performance between Bs-Pyrosequencing and Methyl-BEAMing in the two tissue types.
It is also possible that MGMT methylation heterogeneity exists among individual tumor
cells and that MGMT immunostaining could be used in combination with methylation
based methods to better refine selection of patients [25]. However, so far, observer
variability and lack of association with patient survival has hampered the use of
immunohistochemistry as clinical biomarker in GBM [26, 27]. Studies that have addressed
the role of MGMT immunostaining as predictive biomarker of response in CRC are limited
to case reports [10] and further investigations are needed in larger cohorts.
13
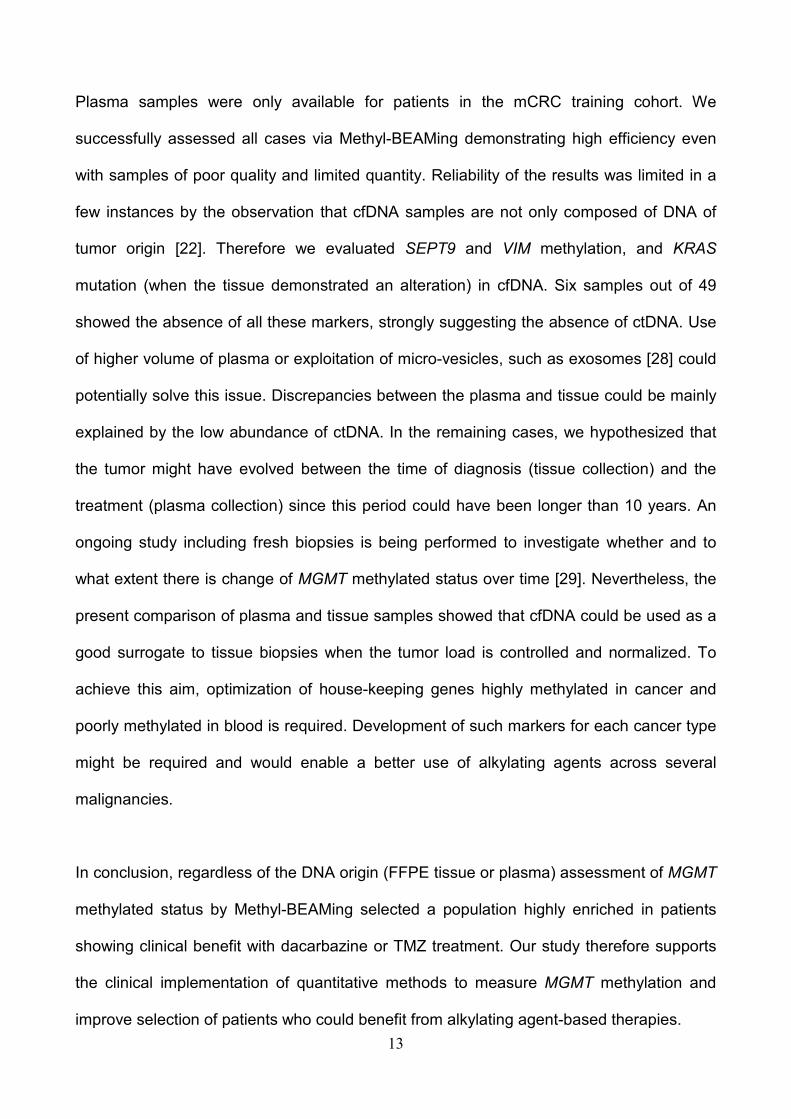
Plasma samples were only available for patients in the mCRC training cohort. We
successfully assessed all cases via Methyl-BEAMing demonstrating high efficiency even
with samples of poor quality and limited quantity. Reliability of the results was limited in a
few instances by the observation that cfDNA samples are not only composed of DNA of
tumor origin [22]. Therefore we evaluated SEPT9 and VIM methylation, and KRAS
mutation (when the tissue demonstrated an alteration) in cfDNA. Six samples out of 49
showed the absence of all these markers, strongly suggesting the absence of ctDNA. Use
of higher volume of plasma or exploitation of micro-vesicles, such as exosomes [28] could
potentially solve this issue. Discrepancies between the plasma and tissue could be mainly
explained by the low abundance of ctDNA. In the remaining cases, we hypothesized that
the tumor might have evolved between the time of diagnosis (tissue collection) and the
treatment (plasma collection) since this period could have been longer than 10 years. An
ongoing study including fresh biopsies is being performed to investigate whether and to
what extent there is change of MGMT methylated status over time [29]. Nevertheless, the
present comparison of plasma and tissue samples showed that cfDNA could be used as a
good surrogate to tissue biopsies when the tumor load is controlled and normalized. To
achieve this aim, optimization of house-keeping genes highly methylated in cancer and
poorly methylated in blood is required. Development of such markers for each cancer type
might be required and would enable a better use of alkylating agents across several
malignancies.
In conclusion, regardless of the DNA origin (FFPE tissue or plasma) assessment of MGMT
methylated status by Methyl-BEAMing selected a population highly enriched in patients
showing clinical benefit with dacarbazine or TMZ treatment. Our study therefore supports
the clinical implementation of quantitative methods to measure MGMT methylation and
improve selection of patients who could benefit from alkylating agent-based therapies.

14
Acknowledgements
We are grateful to Mrs. Kirsten Mooij, Dept. of Pathology and Biobank, VU University
Medical Center, Amsterdam, The Netherlands, for her excellent support in getting the
samples for the GBM-validation cohort ready for further analysis. We are also grateful to
Ms. Stefania Giove, Core Facilities, Candiolo Cancer Institute-FPO, IRCCS, Candiolo, Italy,
for her wonderful support in preparing the paraffin section for the GBM-validation cohort.
Funding
This study was supported by 5 per mille 2009 MIUR—from Fondazione Piemontese per la
Ricerca sul Cancro—ONLUS [“Farmacogenomica” to F.D.N.]. Work in the authors’
laboratories was also supported by the European Community’s Seventh Framework
Programme [602901 MErCuRIC to A.B. and F.D.N., 259015 COLTHERES to A.B., F.D.N.,
M.E. and S.S.]; Associazione Italiana per la Ricerca sul Cancro IG [12812 to A.B.];
Associazione Italiana per la Ricerca sul Cancro MFAG [11349 to F.D.N.]; Associazione
Italiana per la Ricerca sul Cancro 2010 Special Program Molecular Clinical Oncology 5 per
mille [9970 to A.B. and S.S.]; Ministero dell’Istruzione, dell’Università e della Ricerca [PRIN
2010-2011 to A.B.]; grant from Oncologia Ca’ Granda (OCGO) Fondazione [to S.S.]; grant
from Regione Lombardia and Ministero Salute [Identification and monitoring of gene
mutations in peripheral blood and urine as a diagnostic tool for patients with solid tumors
to S.S.]; Fondazione Piemontese per la Ricerca sul Cancro-ONLUS 5 per mille 2010 and
2011 Ministero della Salute [to F.D.N. and A.B.].
Disclosure
Ludovic Barault was the recipient of a post-doctoral fellowship from Fondazione Umberto
Veronesi in 2013 and 2015.
All remaining authors have declared no conflicts of interest.

15
References
1. Kaina B, Christmann M, Naumann S, Roos WP. MGMT: key node in the battle against genotoxicity, carcinogenicity and apoptosis induced by alkylating agents. DNA Repair (Amst) 2007; 6: 1079-1099. 2. Esteller M, Garcia-Foncillas J, Andion E et al. Inactivation of the DNA-repair gene MGMT and the clinical response of gliomas to alkylating agents. N Engl J Med 2000; 343: 1350-1354. 3. Hegi ME, Diserens AC, Gorlia T et al. MGMT gene silencing and benefit from temozolomide in glioblastoma. N Engl J Med 2005; 352: 997-1003. 4. Kewitz S, Stiefel M, Kramm CM, Staege MS. Impact of O6-methylguanine-DNA methyltransferase (MGMT) promoter methylation and MGMT expression on dacarbazine resistance of Hodgkin's lymphoma cells. Leuk Res 2014; 38: 138-143. 5. Tuominen R, Jewell R, van den Oord JJ et al. MGMT promoter methylation is associated with temozolomide response and prolonged progression-free survival in disseminated cutaneous melanoma. Int J Cancer 2015; 136: 2844-2853. 6. Gallego Perez-Larraya J, Ducray F, Chinot O et al. Temozolomide in elderly patients with newly diagnosed glioblastoma and poor performance status: an ANOCEF phase II trial. J Clin Oncol 2011; 29: 3050-3055. 7. Taal W, Dubbink HJ, Zonnenberg CB et al. First-line temozolomide chemotherapy in progressive low-grade astrocytomas after radiotherapy: molecular characteristics in relation to response. Neuro Oncol 2011; 13: 235-241. 8. Gerson SL. MGMT: its role in cancer aetiology and cancer therapeutics. Nat Rev Cancer 2004; 4: 296-307. 9. Esteller M, Corn PG, Baylin SB, Herman JG. A gene hypermethylation profile of human cancer. Cancer Res 2001; 61: 3225-3229. 10. Shacham-Shmueli E, Beny A, Geva R et al. Response to temozolomide in patients with metastatic colorectal cancer with loss of MGMT expression: a new approach in the era of personalized medicine? J Clin Oncol 2011; 29: e262-265. 11. Amatu A, Sartore-Bianchi A, Moutinho C et al. Promoter CpG island hypermethylation of the DNA repair enzyme MGMT predicts clinical response to dacarbazine in a phase II study for metastatic colorectal cancer. Clin Cancer Res 2013; 19: 2265-2272. 12. Hochhauser D, Glynne-Jones R, Potter V et al. A phase II study of temozolomide in patients with advanced aerodigestive tract and colorectal cancers and methylation of the O6-methylguanine-DNA methyltransferase promoter. Mol Cancer Ther 2013; 12: 809-818. 13. Pietrantonio F, Perrone F, de Braud F et al. Activity of temozolomide in patients with advanced chemorefractory colorectal cancer and MGMT promoter methylation. Ann Oncol 2014; 25: 404-408. 14. Li M, Chen WD, Papadopoulos N et al. Sensitive digital quantification of DNA methylation in clinical samples. Nat Biotechnol 2009; 27: 858-863. 15. Yachi K, Watanabe T, Ohta T et al. Relevance of MSP assay for the detection of MGMT promoter hypermethylation in glioblastomas. Int J Oncol 2008; 33: 469-475. 16. Quillien V, Lavenu A, Karayan-Tapon L et al. Comparative assessment of 5 methods (methylation-specific polymerase chain reaction, MethyLight, pyrosequencing, methylation-sensitive high-resolution melting, and immunohistochemistry) to analyze O6-methylguanine-DNA-methyltranferase in a series of 100 glioblastoma patients. Cancer 2012; 118: 4201-4211. 17. Molenaar RJ, Verbaan D, Lamba S et al. The combination of IDH1 mutations and MGMT methylation status predicts survival in glioblastoma better than either IDH1 or MGMT alone. Neuro Oncol 2014.

16
18. Bady P, Sciuscio D, Diserens AC et al. MGMT methylation analysis of glioblastoma on the Infinium methylation BeadChip identifies two distinct CpG regions associated with gene silencing and outcome, yielding a prediction model for comparisons across datasets, tumor grades, and CIMP-status. Acta Neuropathol 2012; 124: 547-560. 19. Robin X, Turck N, Hainard A et al. pROC: an open-source package for R and S+ to analyze and compare ROC curves. BMC Bioinformatics 2011; 12: 77. 20. Potter NT, Hurban P, White MN et al. Validation of a real-time PCR-based qualitative assay for the detection of methylated SEPT9 DNA in human plasma. Clin Chem 2014; 60: 1183-1191. 21. Inno A, Fanetti G, Di Bartolomeo M et al. Role of MGMT as biomarker in colorectal cancer. World J Clin Cases 2014; 2: 835-839. 22. Bettegowda C, Sausen M, Leary RJ et al. Detection of circulating tumor DNA in early- and late-stage human malignancies. Sci Transl Med 2014; 6: 224ra224. 23. Fiano V, Trevisan M, Trevisan E et al. MGMT promoter methylation in plasma of glioma patients receiving temozolomide. J Neurooncol 2014; 117: 347-357. 24. Best MG, Sol N, Zijl S et al. Liquid biopsies in patients with diffuse glioma. Acta Neuropathol 2015; 129: 849-865. 25. Lalezari S, Chou AP, Tran A et al. Combined analysis of O6-methylguanine-DNA methyltransferase protein expression and promoter methylation provides optimized prognostication of glioblastoma outcome. Neuro Oncol 2013; 15: 370-381. 26. Preusser M, Charles Janzer R, Felsberg J et al. Anti-O6-methylguanine-methyltransferase (MGMT) immunohistochemistry in glioblastoma multiforme: observer variability and lack of association with patient survival impede its use as clinical biomarker. Brain Pathol 2008; 18: 520-532. 27. Melguizo C, Prados J, Gonzalez B et al. MGMT promoter methylation status and MGMT and CD133 immunohistochemical expression as prognostic markers in glioblastoma patients treated with temozolomide plus radiotherapy. J Transl Med 2012; 10: 250. 28. Thakur BK, Zhang H, Becker A et al. Double-stranded DNA in exosomes: a novel biomarker in cancer detection. Cell Res 2014; 24: 766-769. 29. Amatu A, Bencardino K, Barault L et al. Phase II study of temozolomide (TMZ) in metastatic colorectal cancer (mCRC) patients molecularly selected by MGMT promoter hypermethylation. J Clin Oncol 2015; 33: suppl 3; abstr 583.

17
Table S1: Impact on overall survival (OS) or progression free survival (PFS) of MGMT
status in GBM or mCRC patients, according to the different assays employed to assess
gene methylation. All survival data are expressed in months.
Figure 1: Overall (OS) and Progression Free Survival (PFS) of the GBM validation cohort
by (A) Bs-pyrosequencing, and (B) Methyl-BEAMing. Methylated subgroup is in blue,
Unmethylated in orange and censored cases are represented by circles.
Figure 2A: Predictive value of MGMT methylation status by MSP in mCRC tissue.
Waterfall plot indicates response to dacarbazine.
Figure 2B: Predictive value of MGMT methylation status by Bs-Pyrosequencing in mCRC
tissue. Waterfall plot indicates response to dacarbazine.
Figure 2C: Predictive value of MGMT methylation status by Methyl-BEAMing in mCRC
tissue. Waterfall plot indicates response to dacarbazine.
Figure 2D: Distribution of methylation (MGMT, SEPT9, VIM) and mutational (KRAS)
values in cfDNA. Individual samples were ranked according to average of SEPT9 + VIM +
KRAS. Grey area corresponds to cases in which no markers were detectable (<1%) and
hence were considered to contain very low ctDNA. Threshold for MGMT methylated status
is plotted as a dot line.
Figure 2E: Scatter plot of methylation values in tissue and plasma with Spearman
correlation according to methylated status. Threshold for each type of tissue is indicated
by a dot line.
Figure 2F: Predictive value of MGMT methylation status by Methyl-BEAMing in mCRC
plasma. Waterfall plot indicates response to dacarbazine.

A Bs-Pyrosequencing
100 -e- Unmethylated MGMT 100 -e- Unmethylated MGMT Cii -e- Methylated MGMT Cii -e- Methylated MGMT > > -~ p=0.0020 -~ p= 0.0203 :::l :::l (/) (/)
c 50 c 50 (J) (J) u u G:i G:i 0.. 0..
0 0 0 6 12 18 24 30 36 42 48 54 60 66 0 6 12 18 24 30 36 42
Overall survival (Months) progression Free Survival (Months)
B Methyl-BEAMing
Cii 100 -e- Unmethylated MGMT 100 -e- Unmethylated MGMT
> -e- Methylated MGMT Cii -e- Methylated MGMT "2: >
:::l p < 0.0001 "2: p= 0.0043
(/) :::l
c 50 (/)
(J) c 50 u <D .... u <D .... 0.. <D
0..
0 0 6 12 18 24 30 36 42 48 54 60 66 0
0 6 12 18 24 30 36 42 Overall survival (Months) Progression Free Survival (Months)

A
Q) N "iii
0 E .3 .S Q) Ol c <ll
£ (.)
t5 Q)
co
B
Q) N "iii
0 E .3 . S Q) Ol c <ll
£ (.)
t5 Q)
co
c
Q) N "iii
0 E .3 .s Q) Ol c <ll
£ (.)
t5 Q) co
MSP
Bs-Pyrosequencing
•Methylated MGMT DUnmethylated MGMT DNA
•Methylated MGMT DUnmethylated MGMT DNA
Methyl-BEAMing Tissue
•Methylated MGMT DUnmethylated MGMT
D
c .Q -ro "5 E
100
80
60
20
Low ctDNA
~ ·
• KRAS Mutation • MGMT Methylation • SEPT9 Methylation
VIM Methvlation
. . . ...
. .
.. . .
. ·.·.·· ' eft 4.5 .................. : ......... : .~ .~ .. ~ .• ... • . ~ .;,, ...•. ... : .• ~ ................... .. a~~~~~~~~~~~~~+-~~~~----~~
lnd1v1dual Pat1ent Samples
E
~
100 spearman co~r~~~~~~t~~ ~~~sue-Plasma for ~GM1 § 10 p=00003 • :• ·:
................. ~ :;:., £ Q) E "0 0 0 iii
• 0.1
0.01 •
~- . • • • .. :
• 0.001 +---~..----~..----~..----..:........----............
F
Q) N "iii
0 E .3 .S Q) Ol c <ll
£ (.)
t5 Q) co
0.01 0.1 10 100 1000 Tumor Tissue methylation %
Methyl-BEAMing Plasma
-Methylated MGMT D Unmethylated MGMT DLowctDNA

Data S1.
Additional Methods Patients GBM training-set samples were obtained from 98 patients who had undergone brain
surgery at the Academic Medical Center (AMC) in Amsterdam, the Netherlands, between
1988 and 2006 and for which follow-up and tissue were available. Oral consent for
removal of the tissue and its storage in the tumor bank for research purposes was
obtained and documented in patients’ medical charts. Research was performed on “waste”
material and stored in a coded fashion. Consent for this project was reviewed and
waivered by the Medical Ethics Review Committee of the Academic Medical Center and
University of Amsterdam (reference number W14_224 # 14.17.0286). Frozen samples
were stored in the tumor bank maintained by the Departments of Neurosurgery and
Neuropathology at the AMC. Tumor samples were included only if there was at least 80%
of cancer cells, verified by hematoxylin and eosin staining. More details about the
enrollment procedure and the patients’ characteristics can be found in the previous study
[1].
The GBM validation-set consisted of 66 tissue samples from patients with newly-
diagnosed GBM, who had surgery and chemoradiation with a follow-up of at least two
years at the VU University Medical Center in Amsterdam. Inclusion criteria consisted of (1)
adult patients older than 17, (2) a new histopathological diagnosis of supratentorial GBM
between 2005 and 2011, verified by an independent neuropathologist, (3) no prior brain
tumor treatment to exclude dedifferentiated glioma, (4) pre- and postoperative MRI within 3
days of surgery, (5) standard adjuvant therapy consisting of 30x2 Gy radiotherapy and
concomitant temozolomide, followed by six monthly cycles of adjuvant temozolomide. All
patients had resective surgery, except two patients who had a biopsy procedure only,
because of eloquent location, with subsequent chemoradiation [2].
CRC training-set samples were obtained from 68 patients enrolled in the DETECT-01 Trial
[3] at Ospedale Niguarda Ca' Granda, Milan, Italy, between May 2011 and March 2012. In
the DETECT-01 trial, patients with chemorefractory mCRC were treated with dacarbazine
(250 mg/m2) intravenously day 1-4 every 21 days. MGMT promoter methylation was
retrospectively assessed by MSP [3]. All patients met the following inclusion criteria: age

18 years or more, Eastern Cooperative Oncology Group performance status of ≤ 1,
histologically confirmed mCRC. Written informed consent was obtained from each patient.
The study was performed according to the Declaration of Helsinki and good clinical
practice, being approved by the ethics committee of Ospedale Niguarda Ca’ Granda.
Among 68 patients enrolled in the study, 61 cases (90%) had remaining material and were
reassessed for methylation status at IRCCS in Candiolo, Italy. DNA was extracted from
paraffin-embedded block from archival tumor tissue of primary and/or metastases and
tumor content was ascertained by hematoxylin and eosin staining (possible in 60 cases
only). Forty nine of the 60 patients also had a blood sample withdrawn prior to treatment
with dacarbazine in which the methylation status could also be performed in the plasma.
Plasmas were stored at -80°C until DNA extraction. Response rate to dacarbazine was
assessed according to Response Evaluation Criteria in Solid Tumors (RECIST1.1) criteria.
An objective response (partial response) was defined as a reduction of at least 30 percent
in the sum of all target lesions. Progressive disease was defined as at least a 20%
increase in the sum of diameters of target lesions. Stable disease was defined as
shrinkage neither sufficient to qualify for partial response nor sufficient increase to qualify
for progressive disease. Further details can be found in the original clinical trial report [3].
CRC validation-set samples were obtained from 32 patients enrolled in the phase II study
at the Department of Medical Oncology of the Fondazione IRCCS Istituto Nazionale dei
Tumori of Milan, previously published by Pietrantonio and colleagues [4]. Between August
2012 and July 2013, 32 patients with advanced, chemorefractory CRC were included the
study. Patients with histologically confirmed MGMT-methylated metastatic CRC and
measurable disease were eligible. The study was conducted according to Good Clinical
Practices and was approved by the local ethics committee. All subjects provided written
informed consent. Further details can be found in the original clinical trial report [4]. Among
32 patients enrolled in the study, 23 cases (72%) had remaining material and were
reassessed for methylation status at IRCCS in Candiolo, Italy.
All survival data were blinded until completion of molecular analyses.
Tumor and Plasma Sample Preparation DNA was collected and extracted from GBM training-set samples, as previously described
[1]. One hundred nanograms of DNA were used for bisulfite conversion using the Epitect

bisulfite kit (Qiagen) according to manufacturer’s protocol. Elution was performed using 80
µl of elution buffer to improve DNA recovery (2x40 µl). Methyl-BEAMing [5] was originally
developed using this kit since its protocol contains a specific reagent (RNA carrier)
expecting to allow conversion of samples of low quality and quantity.
For the GBM validation-set samples, three slices of 10um were cut from FFPE block and
DNA was extracted at the University of Torino, using the QIAamp DNA FFPE Tissue Kit
(Qiagen). For each samples, a minimum of 500ng of DNA was bisulfite converted using
the EZ DNA Methylation-Gold Kit (Zymo research) according to manufacturer’s protocol.
Elution was performed using 40 µl of elution buffer to improve DNA recovery (2x20 µl).For
mCRC training-set tissue samples, DNA was previously extracted and bisulfite converted
at IDIBELL (Barcelona) as described [3]. In instances of insufficient material, slides were
cut from another FFPE block and DNA was re-extracted at the University of Torino, using
the QIAamp DNA FFPE Tissue Kit (Qiagen).
DNA was collected and extracted from the mCRC validation-set samples, as previously
described [4]. For each sample, a maximum of 250ng of DNA was bisulfite converted
using the EZ DNA Methylation-Gold Kit (Zymo research) according to manufacturer’s
protocol. Elution was performed using 40 µl of elution buffer to improve DNA recovery
(2x20 µl).
Forty-nine plasma samples withdrawn prior to treatment were available from the DETECT
trial. cfDNA was extracted at the University of Torino from 1ml of plasma using the
QIAamp Circulating Nucleic Acid Kit (Qiagen) following manufacturer protocol. We
originally tested the Epitect bisulfite kit (Qiagen), as previously described in the original
methyl-BEAMing protocol [5], but we were not able to consistently recover DNA from this
procedure (no amplification). Therefore bisulfite conversions of cfDNA were performed
using the EZ DNA Methylation-Gold Kit (Zymo research) which allowed recovery of DNA in
all samples. Twenty microliters of cfDNA were converted according to manufacturer’s
protocol. Elution was performed using twice 10 µl of M-Elution Buffer. For five patients only
plasma samples were available as tissue had been previously exhausted by other tests
thus preventing comparison between sample types.

MGMT Methylation Assay Controls Ultramer oligomers of 250bp (corresponding to the fully methylated or fully unmethylated
bisulfite converted template) were used as positive controls. Controls were considered as
amplified products until achievement of the working concentration (1pM). Specificity and
sensitivity of each technique were verified using an artificial scale of methylation made by
mixing the two positive controls (Figure S1 and supplemental data 2). Each batch of
amplifications was performed in presence of two positive controls (unmethylated and
methylated) and one negative (no template) control.
Methylation specific PCR Amplification was performed as previously described [6]. Amplification products were
analyzed by agarose gel electrophoresis and quantified using the ImageJ software after
background subtraction. The methylation ratio was calculated dividing the methylated
specific signal by the sum of methylated plus unmethylated specific signal.
Bs-Pyrosequencing Amplification was carried out using the Platinum® Taq (Life technologies) (conditions and
primers in table S2). PCR products were purified on the PyroMark Q24 Vacuum
Workstation according to manufacturer protocol and annealed with the sequencing primer
before being run on the PyroMark Q24 (Qiagen). Pyrograms were analyzed using
PyroMark Q24 Software, average of the 6 CpG sites methylation values was used for
further analyses.
Methyl-BEAMing assay BEAMing analysis is a multistep digital PCR based technique published by Diehl and
colleagues [7]. Its application for methylation is named Methyl-BEAMing and has been
previously described to detect methylation of the VIM gene [5]. A first amplification that
allows the enrichment of the locus of interest was carried out using the Platinum® Taq
(Life technologies) (conditions and primers in table S2). PCR products were diluted
(1/20000 for DNA of tissue origin, 1/6000 for cfDNA) and reamplified in an emulsion PCR
allowing physical separation and independent amplification of the different templates. PCR
mixes were prepared according to conditions in table S2, seventy microliters of Emulsifire
oil were added. Emulsion was performed by repetitive pipetting. Afterwards, PCR emulsion
breaking and hybridization (sequences in table S2) were carried out using Inostics

reagents and following published protocol [7]. Fluorescence was assessed on a CyAN flow
cytometer (Beckam-Coulter) using the filters previously established with controls (scale of
methylation). The percentage of methylation was calculated dividing the methylated
specific signal by the sum of methylated plus unmethylated specific signal.
Micro-dissection of CRC tissue was not performed prior to DNA extraction. Consequently,
methylation values in CRC tissue were corrected for tumor cellularity by dividing the
percentage of methylation with the percentage of tumor content evaluated by hematoxylin
and eosin stain. Percentages were maximized at 100% when the ratio was over this value.
Tumor content was available for 60 out of the 61 cases in the CRC training-set, and for all
samples in the validation-set.
Droplet digital PCR analysis Isolated circulating free DNA was amplified using ddPCR™ Supermix for Probes (Bio-Rad)
using KRAS (PrimePCR™ ddPCR™ Mutation Assay, Bio-Rad) as previously described [8].
ddPCR was then performed according to manufacturer’s protocol and the results reported
as percentage or fractional abundance of mutant DNA alleles to total (mutant plus wild
type) DNA alleles. 8 to 10 µl of DNA template was added to 10 µl of ddPCR™ Supermix
for Probes (Bio-Rad) and 2 µl of the primer and probe mixture. This reaction mix was
added to a DG8 cartridge together with 60 µl of Droplet Generation Oil for Probes (Bio-
Rad) and used for droplet generation. Droplets were then transferred to a 96 well plate
(Eppendorf) and then thermal cycled with the following conditions: 5 minutes at 95°C, 40
cycles of 94°C for 30s, 55°C for 1 minute followed by 98°C for 10 minutes (Ramp Rate
2°C/sec). Droplets were analyzed with the QX200™ Droplet Reader (Bio-Rad) for
fluorescent measurement of FAM and HEX probes. Gating was performed based on
positive and negative controls, and mutant populations were identified. The ddPCR data
were analyzed with QuantaSoft analysis software (Bio-Rad) to obtain Fractional
Abundance and Copy Number Variations of the mutant or amplified DNA alleles in the
wild-type or normal background. The quantification of the target molecule was presented
as number of total copies (mutant plus WT) per sample in each reaction. ddPCR analysis
of normal control plasma DNA (from cell lines) and no DNA template controls were always
included.

Table S2: Assays primers and conditions
5'→3' or reference primer
concentration (mM)
Assay Annealing
temperature
Assay [Mg] mM
Bs-Pyrosequencing MGMT Forward GTTTAGGATATGTTGGGATAGT 10
58 1.5 Reverese GGACACCGCTGATCGTTTAAACCACCCAAACACTCACCAA 1
Universal GGGACACCGCTGATCGTTTA 9
Sequencing GTTTTTAGAAYGTTTTGYGTTT 4 Methyl-BEAMing 1st PCR MGMT Forward TCCCGCGAAATTAATACGACGTTTAGGATATGTTGGGATAGT 10
50 1.5 Reverse GCTGGAGCTCTGCAGCTAAACCACCCAAACACTCACCAA 10
SEPT9 Forward TCCCGCGAAATTAATACGACGGATTTAGAAGGTGGGTGTTGG 10 54 1
Reverse GCTGGAGCTCTGCAGCTACCAAACCCACCCCCAAAATCCTCTC 10
Methyl-BEAMing Emulsion PCR
Forward TCCCGCGAAATTAATACGAC 10 Ref [7] Ref [7]
Reverse GCTGGAGCTCTGCAGCTA 100 Methyl-BEAMing Hybridization
MGMT Unmethylated CACAAACAATACACACCACAA 0.2
NA NA Methylated CGCAAACGATACGCACCGCGA 0.2
Universal CCCAAACACTCACCAAA 0.2
SEPT9 Unmethylated CCACAACCACAACAACC 0.2
NA NA Methylated CCGCGACCGCAACAACC 0.2
Universal CCCCCAAAATCCTCTCCAAC 0.2
Digital Droplet PCR KRAS G12V dHsaCP2000005
NA NA NA G12D dHsaCP2000001
G12C dHsaCP2000007
G12S dHsaCP2000011
G13D dHsaCP2000013

Figure S1: A) Workflow of Methyl-BEAMing assay. B) Flow cytometer output for 0%, 50% and 100% of methylation. C) Linearity of quantification of ultramer oligonucleotide mixture. D) Reproducibility of the Methyl-BEAMing assay across three independent bisulfite treatments in 16 GBM samples. E) MGMT locus with CpG analyzed, position of primers and probes for each technique. TSS= Transcription start site. The Red CpG site corresponds to cg12981137, identified by Bady et al. as associated with TMZ response in GBM [9].

References relative Supplemental Data S1
1. Molenaar RJ, Verbaan D, Lamba S et al. The combination of IDH1 mutations and MGMT methylation status predicts survival in glioblastoma better than either IDH1 or MGMT alone. Neuro Oncol 2014.
2. Stupp R, Mason WP, van den Bent MJ et al. Radiotherapy plus concomitant and adjuvant temozolomide for glioblastoma. N Engl J Med 2005; 352: 987-996.
3. Amatu A, Sartore-Bianchi A, Moutinho C et al. Promoter CpG island hypermethylation of the DNA repair enzyme MGMT predicts clinical response to dacarbazine in a phase II study for metastatic colorectal cancer. Clin Cancer Res 2013; 19: 2265-2272.
4. Pietrantonio F, Perrone F, de Braud F et al. Activity of temozolomide in patients with advanced chemorefractory colorectal cancer and MGMT promoter methylation. Ann Oncol 2014; 25: 404-408.
5. Li M, Chen WD, Papadopoulos N et al. Sensitive digital quantification of DNA methylation in clinical samples. Nat Biotechnol 2009; 27: 858-863.
6. Esteller M, Garcia-Foncillas J, Andion E et al. Inactivation of the DNA-repair gene MGMT and the clinical response of gliomas to alkylating agents. N Engl J Med 2000; 343: 1350-1354.
7. Diehl F, Li M, He Y et al. BEAMing: single-molecule PCR on microparticles in water-in-oil emulsions. Nat Methods 2006; 3: 551-559.
8. Siravegna G, Mussolin B, Buscarino M et al. Clonal evolution and resistance to EGFR blockade in the blood of colorectal cancer patients. Nat Med 2015.
9. Bady P, Sciuscio D, Diserens AC et al. MGMT methylation analysis of glioblastoma on the Infinium methylation BeadChip identifies two distinct CpG regions associated with gene silencing and outcome, yielding a prediction model for comparisons across datasets, tumor grades, and CIMP-status. Acta Neuropathol 2012; 124: 547-560.

Data S2
Sensitivity, reproducibility and specificity of the MGMT Methyl-BEAMing assay Methyl-BEAMing (Figure 1A) is a multistep process starting from the bisulfite conversion of
the DNA followed by the enrichment of the locus of interest, reamplification by emulsion
PCR in presence of magnetic beads. Beads covered with amplicons are purified,
hybridized with sequence specific fluorescent probes and detected by flow cytometry.
Quantification ability of the Methyl-BEAMing assay was tested with a scale made of
template corresponding to the fully methylated or unmethylated bisulfite converted
sequence. Flow cytometer analysis filters were calibrated using the 0, 50 and 100%
methylation samples to obtain an observed value closest to the expected one (Figure 1B).
This step allowed correcting the discrepancy between template specific amplification and
probe efficiency. The linearity between observed and expected value was then assessed
(Figure 1C) with the whole scale. Methyl-BEAMing conserved a linearity of amplification
throughout the whole range of methylated mixture (y= 1.034x -2.166; R2= 0.994). The
sensitivity of detection was as good as 1 methylated copy out of 1000 unmethylated copies.
Reproducibility of MGMT Methyl-BEAMing was tested using three independent bisulfite
treatments of 16 GBM samples (Figure 1D). The highest deviation observed was of 6.3%.
Average standard deviation across samples was 1.8%.
MSP and Bs-Pyrosequencing assessing closely related CpG sites were also tested (Figure
1E) using the scale of methylation (Supplemental Data 2). MSP showed high sensitivity
but could not discriminate high from low methylated template. Pyrosequencing
demonstrated a good reliability for quantification of methylated fraction from 5% and more
but lack of specificity to discriminate samples with percentage of methylation below 5%.

Data S2A) Methylation scale by MSP using mixture of ultramer oligonucleotides. Values above gel
correspond to expected percentage, M correspond to methylated specific band, U to unmethylated
specific band.
100
M U
90
M U
80
M U
70
M U
60
M U
50
M U
40
M U
30
M U
25
M U
20
M U
12.5
M U
10
M U
6.25
M U
3.13
M U
1.57
M U
0.79
M U
0.4
M U
0.2
M U
0.1
M U
0
M U
Data S2B) Methylation scale by MSP using mixture of ultramer oligonucleotides. Observed values
obtained through densitometry:
E x p e c te d % o f C H 3
Ob
serv
ed %
of
CH
3
0 .0 1 0 .1 1 1 0 1 0 00 .0 1
0 .1
1
1 0
1 0 0
y = 0 .4 7 x + 4 6 .1 9
R 2 = 0 .5 7 9
M ix tu re o f U ltra m e rs

Data S2C) Methylation scale by Bs-Pyrosequencing using mixture of ultramer oligonucleotides.
Below 5% of expected methylation Bs-Pyrosequencing does not allow accurate quantification of
methylation.
E x p e c te d % o f C H 3
Ob
serv
ed %
of
CH
3
0 .0 1 0 .1 1 1 0 1 0 00 .0 1
0 .1
1
1 0
1 0 0y = 0 .8 9 x + 1 .1 7 9
R 2 = 0 .9 9 9
M ix tu re o f U ltra m e rs

Data S3A) Distribution of methylation value assessed by all three assays in the GBM training set and sorted by % of methylation by Methyl-BEAMing. Assay-specific thresholds evaluated by ROC analyses are plotted as dot lines with the specific color of each method.
P a tie n ts ra n k e d b y % o f M e th y la tio n o b s e rv e d b y M e th y l-B E A M in g
% o
f M
eth
yla
tion
0
2 0
4 0
6 0
8 0
1 0 0M e th y l-B E A M in g
M S P
B s -P y ro s e q u e n c in g
Data S3B) Distribution of methylation value assessed by all three assays in the GBM cohort. Assay-specific thresholds evaluated by ROC analyses are plotted as dot lines with the specific color of each method.
% o
f M
eth
yla
tion
M S P B s -P yr o s e q u e n c in g M e th yl-B E AM in g0
2 0
4 0
6 0
8 0
1 0 0

Data S3C) ROC Analyses for Overall survival at 1 year in the GBM training cohort according to each assay.
• MSP threshold 55.12 specificity 0.72 sensitivity 0.70 npv 0.82 ppv 0.57
• Bs-Pyrosequencing threshold 29.55 specificity 0.75 sensitivity 0.65 npv 0.80 ppv 0.57
• Methyl-BEAMing threshold 40.19 specificity 0.78 sensitivity 0.65 npv 0.81 ppv 0.61

Data S3D) Assay concordance in the GBM training cohort.
Methyl-BEAMing Bs-Pyrosequencing
Methylated Unmethylated NA Methylated Unmethylated NA
MSP
Methylated 31 9 0 32 8 0
Unmethylated 3 52 0 5 50 0
NA 1 2 0 1 2 0
Bs-Pyrosequencing
Methylated 30 8 0
Unmethylated 5 55 0
NA 0 0 0
Kappa % concordance
Methyl-BEAMing vs. MSP 0.690 [0.551- 0.829] 84.7
Methyl-BEAMing vs. Bs-Pyrosequencing 0.717 [0.574-0.859] 86.7
Bs-Pyrosequencing vs. MSP 0.672 [0.530-0.815] 83.7

Data S3E) Distribution of MGMT methylation values assessed by the indicated assays in the GBM validation set and sorted by % of methylation by Methyl-BEAMing. Assay-specific thresholds evaluated by ROC analyses are plotted as dot lines with the specific color of each method.
D is tr ib u tio n
P a tie n ts r a n k e d b y M G M T % o f m e th y la t io n O b s e r v e d b y M e th y l-B E A M in g
0
2 0
4 0
6 0
8 0
1 0 0M e th y l-B E A M in g
B s -P y ro s e q u e n c in g
Data S3F) Distribution of methylation value assessed by the two techniques in the GBM validation cohort and sorted by techniques. Assay-specific thresholds evaluated by ROC analyses are plotted as dot lines with the specific color of each method.
% o
f M
eth
yla
tio
n
B s -P y ro s e q u e n c in g M e th y l-B E A M in g0
2 0
4 0
6 0
8 0
1 0 0

Data S3G) Concordance between Methyl-BEAMing and Bs-pyrosequencing in the GBM validation cohort.
Methyl-BEAMing Methylated Unmethylated NA
Bs-Pyrosequencing Methylated 18 2 0 Unmethylated 2 36 0 NA 4 7 0
Kappa % of agreement
Methyl-BEAMing vs. Bs-Pyrosequencing 0.597 [0.442-0.753] 78.26

Data S3H) Comparison of hazard ratio for death (overall survival) of the methylated subgroup evaluated by the different methods in the training cohort (T) and validation cohort (V).
H R fo r m e th y la te d s u b g ro u p
0 .1 1 0
M e th yl-B E AM in g (V)
B s -p yr o s e q u e n c in g (V)
M e th yl-B E AM in g (T )
B s -p yr o s e q u e n c in g (T )
M S P (T )
1

Data S4A) Distribution of methylation value assessed by all three assays in the DETECT mCRC cohort and sorted by % of methylation by Methyl-BEAMing. Assay-specific thresholds evaluated by ROC analyses are plotted as dot lines with the specific color of each method.
P a tie n ts ra n k e d b y M G M T % o f m e th y la tio n O b s e rv e d b y M e th y l-B E A M in g
% o
f M
eth
yla
tio
n
0
2 0
4 0
6 0
8 0
1 0 0M e th y l-B E A M in gB s -P y ro s e q u e n c in gM S P
Data S4B) Distribution of methylation values assessed by all three assays in the DETECT mCRC cohort. Assay-specific thresholds evaluated by ROC analyses are plotted as dot lines with the specific color of each method.
% o
f M
eth
yla
tio
n
M S P B s -P yr o s e q u e n c in g M e th yl-B E AM in g
0
2 0
4 0
6 0
8 0
1 0 0

Data S4C) ROC Analyses for PFS at 12 weeks in the DETECT mCRC cohort according to each assay.
• MSP threshold 99.15 specificity 0.79 sensitivity 0.78 npv 0.95 ppv 0.39
• Bs-Pyrosequencing threshold 69.80 specificity 0.96 sensitivity 0.89 npv 0.98 ppv 0.80
• Methyl-BEAMing threshold 56.15 specificity 0.92 sensitivity 0.89 npv 0.98 ppv 0.67
1 - Specificity
Sen
sitiv
ity
0.0
0.2
0.4
0.6
0.8
1.0
0.0 0.2 0.4 0.6 0.8 1.0
99.150 (0.788, 0.778)
AUC: 0.745 (0.544–0.946)AUC: 0.745 (0.544–0.946)
1 - Specificity
Sen
sitiv
ity
0.0
0.2
0.4
0.6
0.8
1.0
0.0 0.2 0.4 0.6 0.8 1.0
69.800 (0.962, 0.889)
AUC: 0.894 (0.711–1.000)AUC: 0.894 (0.711–1.000)

• Methyl-BEAMing Plasma Threshold 4.48 Specificity 0.86 Sensitivity 0.71 Npv 0.95 Ppv 0.45
1 - Specificity
Sen
sitiv
ity
0.0
0.2
0.4
0.6
0.8
1.0
0.0 0.2 0.4 0.6 0.8 1.0
56.150 (0.923, 0.889)
AUC: 0.874 (0.685–1.000)AUC: 0.874 (0.685–1.000)
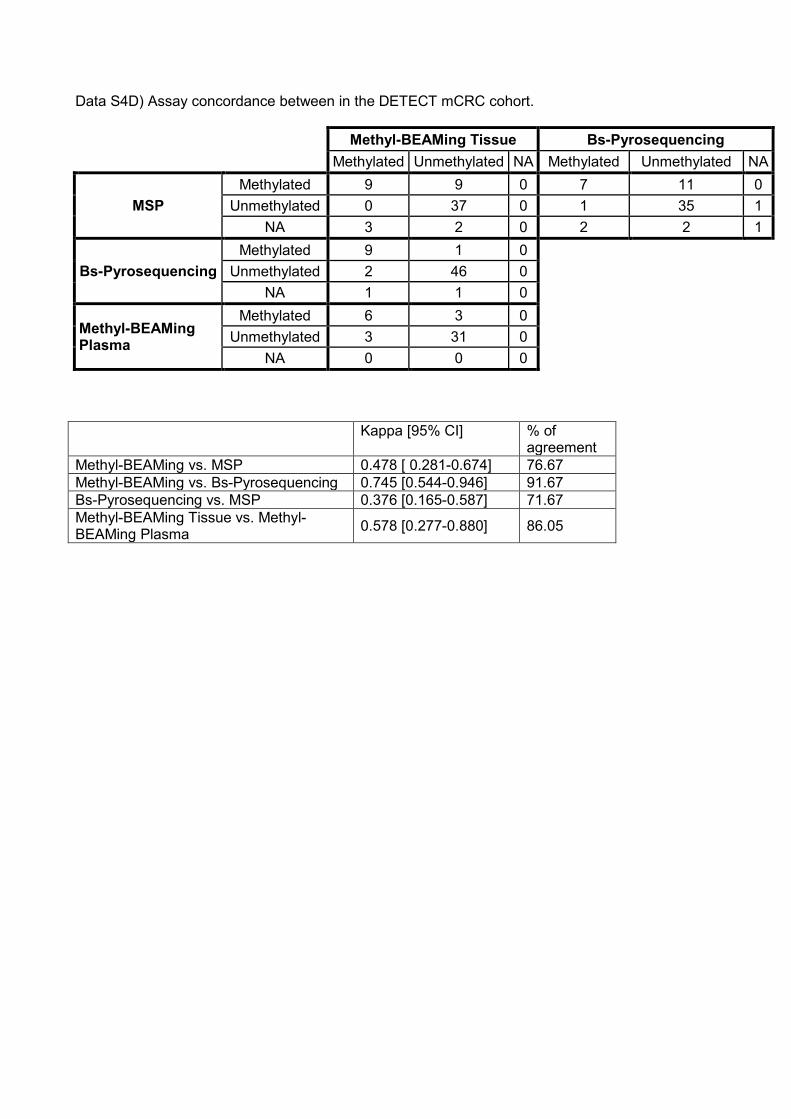
Data S4D) Assay concordance between in the DETECT mCRC cohort.
Methyl-BEAMing Tissue Bs-Pyrosequencing Methylated Unmethylated NA Methylated Unmethylated NA
MSP Methylated 9 9 0 7 11 0
Unmethylated 0 37 0 1 35 1 NA 3 2 0 2 2 1
Bs-Pyrosequencing Methylated 9 1 0
Unmethylated 2 46 0 NA 1 1 0
Methyl-BEAMing Plasma
Methylated 6 3 0 Unmethylated 3 31 0
NA 0 0 0 Kappa [95% CI] % of
agreement Methyl-BEAMing vs. MSP 0.478 [ 0.281-0.674] 76.67 Methyl-BEAMing vs. Bs-Pyrosequencing 0.745 [0.544-0.946] 91.67 Bs-Pyrosequencing vs. MSP 0.376 [0.165-0.587] 71.67 Methyl-BEAMing Tissue vs. Methyl-BEAMing Plasma 0.578 [0.277-0.880] 86.05

Data S4E) Overall survival and Progression Free Survival in DETECT mCRC patients stratified according to MGMT methylation cut-off values calculated for each assay shown in Data S4C).
• MSP
O v e ra ll S u rv iv a l (M o n th s )
Pe
rce
nt
surv
iva
l
0 2 4 6 8 1 0 1 2 1 4 1 6 1 8 2 0 2 2 2 4 2 6 2 8 3 00
5 0
1 0 0U n m e th y la te dM e th y la te d
P ro g re s s io n F re e S u rv iv a l (M o n th s )
Pe
rce
nt
surv
iva
l
0 1 2 3 4 5 60
5 0
1 0 0
U n m e th y la te dM e th y la te d
p = 0 .0 0 0 7
• Bs-Pyrosequencing
O v e ra ll S u rv iv a l (M o n th s )
Pe
rce
nt
surv
iva
l
0 2 4 6 8 1 0 1 2 1 4 1 6 1 8 2 0 2 2 2 4 2 6 2 8 3 00
5 0
1 0 0
U n m e th y la te dM e th y la te d
P ro g re s s io n F re e S u rv iv a l (M o n th s )
Pe
rce
nt
surv
iva
l
0 1 2 3 4 5 60
5 0
1 0 0
U n m e th y la te dM e th y la te d
p = 0 .0 0 0 4
• Methyl-BEAMing Tissue
O v e ra ll S u rv iv a l (M o n th s )
Pe
rce
nt
surv
iva
l
0 2 4 6 8 1 0 1 2 1 4 1 6 1 8 2 0 2 2 2 4 2 6 2 8 3 00
5 0
1 0 0
U n m e th y la te dM e th y la te d
P ro g re s s io n F re e S u rv iv a l (M o n th s )
Pe
rce
nt
surv
iva
l
0 1 2 3 4 5 60
5 0
1 0 0U n m e th y la te dM e th y la te d
p < 0 .0 0 0 1
• Methyl-BEAMing Plasma
O v e ra ll S u rv iv a l (M o n th s )
Pe
rce
nt
surv
iva
l
0 2 4 6 8 1 0 1 2 1 4 1 6 1 8 2 0 2 2 2 4 2 6 2 8 3 00
5 0
1 0 0U n m e th y la te dM e th y la te d
P ro g re s s io n F re e S u rv iv a l (M o n th s )
Pe
rce
nt
surv
iva
l
0 1 2 3 4 5 60
5 0
1 0 0
U n m e th y la te dM e th y la te d
p = 0.0080

Data S4F) Contingency table for clinical benefit (information available in 58 cases for tissues, and 47 cases for plasmas) based on RECIST for DETECT mCRC patients according to each assay:
Clinical benefit (SD+PR)
No Clinical benefit (PD) total
MSP
Methylated 7 11 18
PPV 0.39 Unmethylated 1 34 35
NPV 0.78
NA 1 4 5 total 9 49 58
Clinical benefit (SD+PR)
No Clinical benefit (PD) total
Bs-Pyrosequencing
Methylated 8 2 10
PPV 0.8
Unmethylated 1 45 46
NPV 0.89
NA 0 2 2 total 9 49 58
Clinical benefit (SD+PR)
No Clinical benefit (PD) total
Methyl-BEAMing Tissue
Methylated 8 4 12
PPV 0.67
Unmethylated 1 45 46
NPV 0.89
total 9 49 58
Clinical benefit (SD+PR)
No Clinical benefit (PD) total
Methyl-BEAMing Plasma
Methylated 5 6 11
PPV 0.45
Unmethylated 2 34 36
NPV 0.71
total 7 40 47

Data S4G) Distribution of the methyl-BEAMing value in the mCRC validation cohort and response status to treatment with TMZ. PD : Progressive Disease; PR: Partial Response; SD: Stable Disease.
P a tie n ts ra n k e d b y M G M T % o f m e th y la tio n O b s e rv e d b y M e th y l-B E A M in g
% o
f C
H3
by
Me
thy
lBE
AM
ing
0
5 0
1 0 0
1 5 0
5 6
P DP RS D
Methyl-BEAMing
Clinical benefit (SD+PR)
No Clinical benefit (PD)
total
Methylated 4 4 8
PPV 0.5
Unmethylated 2 11 13
NPV 0.67
total 6 15 21
Data S4H) Overall and Progression Free Survival in the mCRC validation cohort by MGMT status evaluated by methyl-BEAMing:
O v e ra ll S u rv iv a l (M o n th s )
Pe
rce
nt
surv
iva
l
0 2 4 6 8 1 0 1 2 1 4 1 6 1 8 2 0 2 2 2 40
5 0
1 0 0
U n m e th y la te dM e th y la te d
P F S (in m o n th s )
Pe
rce
nt
surv
iva
l
0 1 2 3 4 5 6 7 8 9 1 0 1 1 1 20
5 0
1 0 0
p = 0.1522U n m e th y la te dM e th y la te d

Data S4I) Examples of pyrosequencing profiles in GBM and CRC tissue samples. GBM show a high intralocus heterogeneity of methylation across the MGMT promoter sequence which is not observed in CRC:
.