Diffusion-limited reactive wetting: effect of interfacial reaction behind the advancing triple line
12
Diffusion-limited reactive wetting: effect of interfacial reaction behind the advancing triple line F. Hodaj O. Dezellus J. N. Barbier A. Mortensen N. Eustathopoulos Received: 28 March 2007 / Accepted: 4 June 2007 / Published online: 3 July 2007 Ó Springer Science+Business Media, LLC 2007 Abstract Using the ‘‘dispensed drop’’ variant of the sessile drop technique, spreading kinetics of dilute Cu–Cr alloys on smooth vitreous carbon substrates are measured under helium microleak conditions. In this system, it is known that the drop spreading rate is controlled by diffusion of the reactive atom species (Cr) from the bulk liquid to the triple line, where wetting is induced by formation of an interfacial layer of chromium carbide. Microstructural characterization of rapidly cooled drops shows that growth of the interfacial reaction product layer continues behind the moving solid– liquid–vapor triple line. The spreading velocity is modeled by finite-difference numerical analysis of diffusion near the triple line in the presence of continued interfacial reaction, simplifying the growth rate as being constant and using realistic parameter values. We show that continued interfa- cial reaction explains the dependence of the triple line spreading rate on the instantaneous wetting angle that is observed in this system. Introduction Non-metallic solids, such as oxides, carbides, or carbon, are generally poorly wetted by liquid engineering metals such as tin or copper: contact angles typically exceed 90° [1, 2]. The complications this produces in materials processes such as infiltration or brazing have motivated the search for various means to lower the contact angle in such systems. One approach to this end is to alloy the metal with elements that, by reaction with the solid, form a better- wetted compound. On substrates of carbon for example, chromium or titanium alloyed into molten copper form, by reaction with the carbon, a chromium or titanium carbide. These carbides, of partly metallic character, are relatively well wetted by the metal [3, 4]. When a droplet of such reactive alloys comes in contact with the solid, it first spreads very rapidly, at a rate determined by the (low) viscosity of the metal. It thus quickly reaches a first metastable equilibrium contact an- gle, characteristic of the metal on the unreacted solid substrate. After a short transient stage (a few seconds) a thin continuous reaction layer is then formed along the solid/liquid interface [5]. Thereafter, since the reaction layer is better wetted than the original substrate, the drop starts spreading again as the layer expands outward of the triple line, parallel to the interface. In this second spreading process, the drop spreading rate is controlled, not by the metal viscosity, but rather by the rate at which the reaction product layer can grow at the triple line, parallel to the solid surface. Spreading continues in this manner until the contact angle becomes equal to the equilibrium contact angle of the alloy on the reaction product, h e . Following this, the drop remains stable even though the reaction layer may continue to grow, both in thickness and further out- wards of the triple line, along the substrate free surface. F. Hodaj (&) J. N. Barbier N. Eustathopoulos SIMAP – UMR CNRS 5266, INP Grenoble-UJF, Domaine Universitaire, BP 75 – 1130, rue de la Piscine, 38402 Saint Martin d’Heres, Cedex, France e-mail: [email protected] O. Dezellus LMI – UMR CNRS No. 5615, Universite ´ Claude Bernard Lyon 1, 43 Bd du 11 novembre 1918, 69622 Villeurbanne Cedex, France A. Mortensen Laboratory for Mechanical Metallurgy, Ecole Polytechnique Fe ´de ´rale de Lausanne, Lausanne 1015, Switzerland 123 J Mater Sci (2007) 42:8071–8082 DOI 10.1007/s10853-007-1915-0
-
Upload
independent -
Category
Documents
-
view
1 -
download
0
Transcript of Diffusion-limited reactive wetting: effect of interfacial reaction behind the advancing triple line
Diffusion-limited reactive wetting: effect of interfacial reactionbehind the advancing triple line
F. Hodaj Æ O. Dezellus Æ J. N. Barbier ÆA. Mortensen Æ N. Eustathopoulos
Received: 28 March 2007 / Accepted: 4 June 2007 / Published online: 3 July 2007
� Springer Science+Business Media, LLC 2007
Abstract Using the ‘‘dispensed drop’’ variant of the sessile
drop technique, spreading kinetics of dilute Cu–Cr alloys on
smooth vitreous carbon substrates are measured under
helium microleak conditions. In this system, it is known that
the drop spreading rate is controlled by diffusion of the
reactive atom species (Cr) from the bulk liquid to the triple
line, where wetting is induced by formation of an interfacial
layer of chromium carbide. Microstructural characterization
of rapidly cooled drops shows that growth of the interfacial
reaction product layer continues behind the moving solid–
liquid–vapor triple line. The spreading velocity is modeled
by finite-difference numerical analysis of diffusion near the
triple line in the presence of continued interfacial reaction,
simplifying the growth rate as being constant and using
realistic parameter values. We show that continued interfa-
cial reaction explains the dependence of the triple line
spreading rate on the instantaneous wetting angle that is
observed in this system.
Introduction
Non-metallic solids, such as oxides, carbides, or carbon, are
generally poorly wetted by liquid engineering metals such
as tin or copper: contact angles typically exceed 90� [1, 2].
The complications this produces in materials processes such
as infiltration or brazing have motivated the search for
various means to lower the contact angle in such systems.
One approach to this end is to alloy the metal with
elements that, by reaction with the solid, form a better-
wetted compound. On substrates of carbon for example,
chromium or titanium alloyed into molten copper form, by
reaction with the carbon, a chromium or titanium carbide.
These carbides, of partly metallic character, are relatively
well wetted by the metal [3, 4].
When a droplet of such reactive alloys comes in contact
with the solid, it first spreads very rapidly, at a rate
determined by the (low) viscosity of the metal. It thus
quickly reaches a first metastable equilibrium contact an-
gle, characteristic of the metal on the unreacted solid
substrate. After a short transient stage (a few seconds) a
thin continuous reaction layer is then formed along the
solid/liquid interface [5]. Thereafter, since the reaction
layer is better wetted than the original substrate, the drop
starts spreading again as the layer expands outward of the
triple line, parallel to the interface. In this second spreading
process, the drop spreading rate is controlled, not by the
metal viscosity, but rather by the rate at which the reaction
product layer can grow at the triple line, parallel to the
solid surface. Spreading continues in this manner until the
contact angle becomes equal to the equilibrium contact
angle of the alloy on the reaction product, he. Following
this, the drop remains stable even though the reaction layer
may continue to grow, both in thickness and further out-
wards of the triple line, along the substrate free surface.
F. Hodaj (&) � J. N. Barbier � N. Eustathopoulos
SIMAP – UMR CNRS 5266, INP Grenoble-UJF, Domaine
Universitaire, BP 75 – 1130, rue de la Piscine, 38402 Saint
Martin d’Heres, Cedex, France
e-mail: [email protected]
O. Dezellus
LMI – UMR CNRS No. 5615, Universite Claude Bernard Lyon
1, 43 Bd du 11 novembre 1918, 69622 Villeurbanne Cedex,
France
A. Mortensen
Laboratory for Mechanical Metallurgy, Ecole Polytechnique
Federale de Lausanne, Lausanne 1015, Switzerland
123
J Mater Sci (2007) 42:8071–8082
DOI 10.1007/s10853-007-1915-0

In such systems, the rate at which the liquid spreads over
the solid substrate after reaching its first metastable contact
angle value is controlled by the rate at which the better-
wetted interfacial reaction product grows parallel to the
interface at the liquid/solid/vapor triple line. This, in turn,
is generally governed either by (i) the local reaction
kinetics at the triple line (an example is found in Refs. [5,
6]), or by (ii) the rate of supply of the active solute species
to the triple line. Given the high diffusivity characteristic of
liquids, it is by diffusion through the liquid (and not the
solid nor the atmosphere) that reactive species are supplied
from the bulk liquid to the triple line.
For diffusion-controlled spreading of a liquid drop over
a flat solid substrate, a relatively simple analysis that as-
sumes the interfacial reaction to be strictly localized at the
triple line shows that the velocity of a sessile drop triple
line V ¼ dR=dt (where R is the radius of the drop base and
t is time) varies in direct linear proportion to the instan-
taneous contact angle h [7] until h reaches its equilibrium
value over the reaction layer, he, at which point spreading
stops:
dR
dt¼
2DFðtÞenv
ðCo � CeÞh; h[he ð1aÞ
dR
dt¼ 0; h ¼ he: ð1bÞ
Here, D is the diffusion coefficient in the liquid phase, nv is
the number of moles of reactive solute per unit volume of
the reaction product, e is the reaction product thickness at
the triple line, Co is the nominal (far-field) drop reactive
solute concentration, Ce is the concentration of reactive
solute in equilibrium with the reaction product (such that
C = Ce at the triple line). F(t) is strictly a function of time
but in fact varies so little that it can be taken to be constant,
remaining near 0.04 in usual sessile drop experiments [7].
When confronted with experiment, this relation shows
good agreement with data for the spreading of Cu–Sn–Ti
on vitreous carbon (Cv) near 1,100 �C for h\90� : the rate
of spreading is indeed directly proportional to h, and the
constant of proportionality agrees with that in Eq. 1a [4].
When compared with spreading kinetics measured for
Cu–Cr alloy sessile drops on vitreous carbon, still for
h\90�; a direct linear relationship between dR/dt and h is
again found, the slope of the line being again in accordance
with Eq. 1a; however, the intercept of the line giving dR/dt
vs. h with the h axis is not at the origin (h = 0), but rather
at a finite angle near 40� [3] as shown in Fig. 1.
This discrepancy was attributed to the presence of
additional drop/substrate chemical reaction along the
interface behind the triple line, causing solute also to be
consumed along the liquid/solid interface. As a result, it
was argued, a portion of the total flux of solute from the
bulk of the drop is diverted from the triple line, reducing
the flux that serves to drive drop spreading.
This interpretation was suggested by the following
observations:
(i) Final measured chromium carbide interfacial reaction
layers were relatively thick in the Cu–Cr/C system
(several micrometers) and continued to thicken if the
drop was held at temperature. By comparison, the TiC
reaction layer that forms when Cu–Sn–Ti spreads on
vitreous carbon (Cv) is known to be more impervious
to diffusion, thus preventing continued reaction once it
forms a continuous layer. The TiC reaction layer was
indeed found to be much thinner than the chromium
carbide layers formed in the Cu–Cr/C system [3, 4],
and this system indeed obeys Eq. 1a.
(ii) A simple analytical calculation for the extreme case of
kinetically unhindered chemical reaction with very fast
diffusion of the reactive species through the reaction
layer behind the triple line did, indeed, essentially
result in a simple horizontal translation of the line
linking dR/dt with h [3]. The shift was, however,
unrealistically large, obviously as a result of the
extreme assumption made in this calculation. We give
here a quantitative demonstration that the interpreta-
tion offered earlier is indeed correct. Specifically we
show, using the Cu–1.5% Cr/C system at 1,150 �C as a
case study, that continued interfacial reaction behind
the triple line indeed causes a horizontal translation of
the straight line linking the triple line velocity with the
instantaneous contact angle in diffusion-controlled
reactive wetting. Interfacial reaction behind the triple
line then effectively replaces h in Eq. 1a with (h–hd),
where hd is an essentially constant ‘‘dead angle’’ from
Fig. 1 Experimental triple line velocity as a function of instanta-
neous contact angle h for Cu–1 at.% Cr on vitreous carbon at
1,150 �C [3] and spreading rate according to Eq. 1a, Ref. [7]
8072 J Mater Sci (2007) 42:8071–8082
123

which diffusing solute is diverted away from the triple
line to the interface.
We first present a set of new experimental results for
Cu–1.50% Cr spreading on vitreous carbon at 1,150 �C,
obtained using the dispensed drop method [5] (as opposed
to the transferred drop technique used in Ref. [3]). We then
present a numerical analysis of reactive spreading in this
system that takes into account the influence of solid state
diffusion through the reaction layer behind the triple line.
Finally, we compare predictions with the data to show
the existence of such a dead angle and to explore its
dependence on interfacial reaction kinetics.
Experimental
Experimental procedures
Vitreous carbon (Cv) substrates were used. These feature
no open porosity, an ash content less than 50 ppm and,
after polishing, an average surface roughness of 2 nm.
Before the experiments, all substrates were ultrasonically
cleaned in acetone and then annealed. Wetting was studied
using the dispensed drop method (a variant of the classical
sessile drop technique), in a metallic furnace under a
10–3 Pa helium microleak atmosphere [5]. The copper–
chromium alloys were prepared from pure Cu
(99.999 wt.%) and Cr (99.3 wt.%), by in-situ melting and
alloying in an alumina crucible during experiments, also
under He microleak conditions (10–3 Pa).
In the ‘‘dispensed drop’’ technique used here, the pre-
alloyed metal is extruded through a small hole at the bottom
of the alumina crucible, which is then lowered to effect
contact of the metal with the substrate. The drop is then
detached from the crucible by raising the latter. Spreading of
the isolated drop is recorded using a video camera connected
to a computer equipped with image analysis software for
calculation of (i) the drop/substrate contact circle radius, R,
with a precision of 2%, and (ii) the contact angle, h, with a
precision of 2�, both as a function of time, t. In selected
experiments, the drop was cooled rapidly by turning off the
furnace power supply a few seconds after capillary equilib-
rium was reached. In the He microleak condition (10–3 Pa) of
the experiments, the cooling rate was about 3 K s–1.
After cooldown the specimens were cut, embedded in
resin, and polished for microstructural characterization.
The interfacial reaction product chemistry and morphology
were characterized by scanning electron microscopy.
Experimental results
Four experiments were performed during the present study
with Cu–1.5 at.% Cr at 1,150 �C, the drop volume varying
from 1 to 9 mm3. A typical plot of the variations in time of
the contact angle h and the droplet base radius R is given in
Fig. 2. In agreement with experimental results obtained
using the transferred drop method [3], the Cu–1.5 at.% Cr
alloy wets vitreous carbon well, the final contact angle
being as low as 30�. Moreover, the R(t) curve displays a
time-dependent spreading rate dR/dt, indicating that local
interfacial reaction kinetics do not govern the rate of
spreading (e.g., [5, 6]).
Deducing from these data the triple line velocity dR/dt
and plotting this quantity as a function of the instantaneous
contact angle h, one obtains the curve in Fig. 3 (plotted
data are for spreading after complete transfer of the
drop—i.e., for h lower than 140�). As was observed in
Ref. [3], when h\90� the data points lie roughly along a
straight line that cuts the h-axis at a finite angle. This angle
is, as in Ref. [3], near the final equilibrium contact angle
hf ¼ 30�; characteristic of the liquid alloy at rest on the
reaction product layer.
A cross-section of the interfacial region at the center of
the droplet is shown in Fig. 4. In this experiment, rapid
cooling of the sample was initiated after spreading, such
that solidification of the alloy was achieved about 20 s
later. A continuous chromium carbide reaction layer is
visible along the whole interface. Chemical interaction
between Cu–Cr liquid alloys and vitreous carbon can lead
to the formation of two different carbides: Cr7C3 and
Cr3C2. SEM characterization and microprobe analysis of
the interfacial layers led to identification of the compound
Cr7C3 rather than Cr3C2.
The thickness of carbide layer is around 2 lm at the
center of the drop and decreases progressively to about
1 lm at the triple line, indicating that carbide growth
kinetics are extremely rapid in this system. For this reason,
it is very difficult to measure the real reaction layer
thickness near the triple line as well as its gradient behind
Fig. 2 Drop base radius and contact angle evolution with time during
spreading of Cu–1.5 at.% Cr on vitreous carbon at 1,150 �C using the
dispensed drop method. The drop volume is 9 mm3
J Mater Sci (2007) 42:8071–8082 8073
123

the triple line by ‘‘post-mortem’’ examination because the
observed reaction layer is thicker than it was during
spreading. Therefore, the measured ‘‘post-mortem’’ thick-
ness gradient is likely to be lower than it was during
spreading, since during cooldown a greater amount of
reaction layer thickening is expected where the reaction
layer was thinner, i.e., near the triple line (this point will be
discussed in greater detail in the next section—see Fig. 5).
Still, these experimental results show that reaction takes
place both at, and behind, the triple line during drop
spreading in this system. Solute flux lines from the drop
bulk therefore do not all converge to the triple line, since
the interface now represents a second solute sink. We
analyze this diffusion problem in what follows.
Analysis
General description
Consider a moving wetting front of a liquid binary alloy
A–B, component B of which reacts with the solid substrate
to form a solid reaction product. We assume that the
reaction between B and the substrate is rapid upon initial
contact of the liquid with the solid, causing the formation
of a small thickness ea of reaction product at the triple line.
Thereafter, reaction continues behind the triple line, lead-
ing to a gradual further increase in the thickness e of the
interfacial reaction layer, as shown in Fig. 5a.
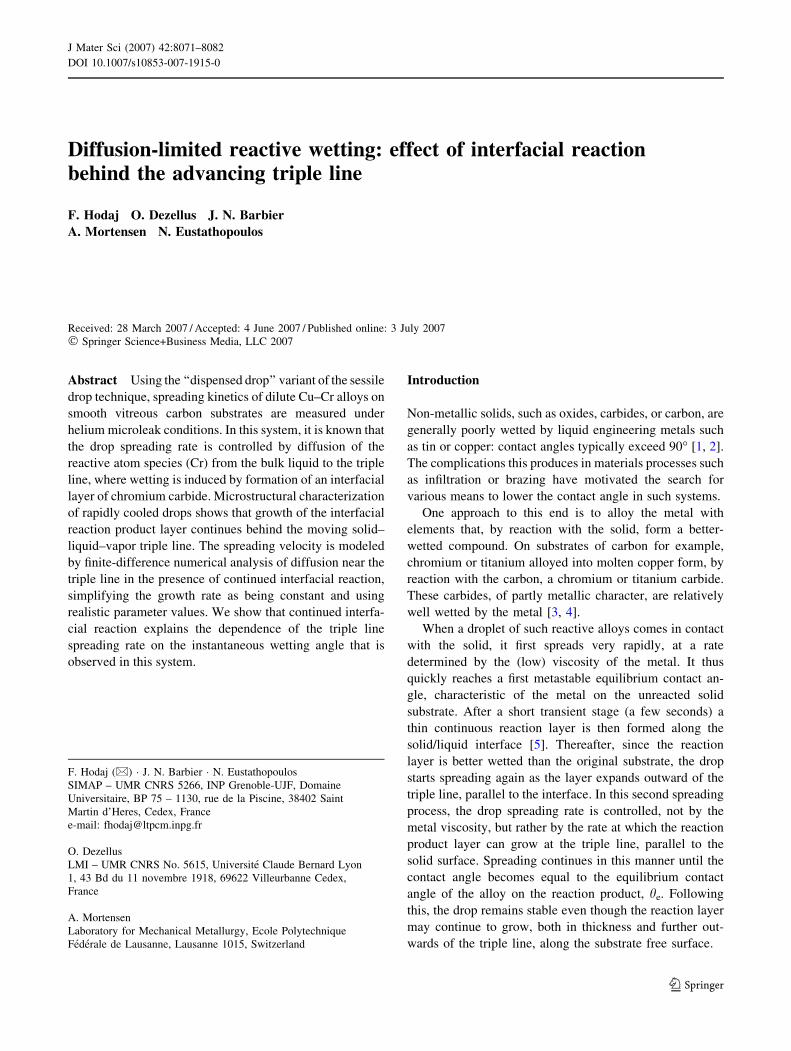
Figure 5c presents a schematic evolution of the reaction
layer profile during spreading when a decrease D h in the
contact angle h occurs after time Dt. This figure shows that
the increase De in the reaction layer thickness e at any
point along the interface depends on the distance from the
triple line. As a result, the reaction layer thickness profile is
not constant during spreading: it depends on time and also
on the distance from the triple line.
The most reasonable assumption from a physical
standpoint is that thickening of the reaction layer obeys a
parabolic law corresponding to a growth rate controlled by
diffusion through the layer. A corollary of a parabolic
growth law is that, at any position along the interface, the
relative increment in reaction layer thickness for a given
increment of contact time Dt, De/e, becomes gradually
smaller as one moves from the triple line to the drop axis,
as depicted in Fig. 5c. For tractability of the moving
boundary problem at hand, we simplify this ‘‘real situa-
tion’’ (Fig. 5c) by assuming that the reaction layer thick-
ness profile is composed of two zones, namely (i) a region
of constant thickness, eb, extending from the center of the
drop to within a certain distance L from the triple line and
(ii) an outer ring that extends from this point to the triple
line where the reaction layer thickness is assumed to
decrease linearly from eb down to its value at the triple line,
ea, as sketched in Fig. 5d.
Calculation method
The rate of spreading of the liquid is governed by the rate
at which the thin continuous solid reaction product layer
grows at the moving triple line to reach an initial thickness
ea. We assume that the rate of growth of the reaction
product at the triple line is limited by diffusive transport of
solute element B through the liquid to the triple line. The
local solute concentration along the triple line then equals
the equilibrium concentration, Ce, in an A–B alloy con-
tacting both the reaction product and the unreacted solid
substrate at the temperature of the experiment.
We assume that spreading is isothermal, and that the
liquid drop is sufficiently large for its bulk to be treated as
an infinite medium having a constant solute concentration
Co. We neglect all curvature along the liquid/solid interface
and thus model the liquid region near the triple line as a
straight wedge of angle h.
In the liquid, solute can be transported by convection and
diffusion. We assume, as was justified in Ref. [7], that in the
0
0.05
0.1
0.15
0.2
0.25
0.3
0.35
0 20 40 60 80 100 120 140 160
s.m
m( V
1-)
θ (°)
Fig. 3 Triple line velocity as a function of instantaneous contact
angle h for Cu–1.50 at.% Cr alloy on vitreous carbon at 1,150 �C;
three sets of data are included to show the reproducibility of the data
and their size-independence: data for drops 1 mm3 ð�Þ; 3 mm3 (+)
and 9 mm3 in volume (s)
Fig. 4 Scanning electron micrograph of a cross-section through a
drop of Cu–1.50 at.% Cr/Cv interface at the center of the drop after
spreading at 1,150 �C on vitreous carbon followed by rapid cooling
(about 3 K/s)
8074 J Mater Sci (2007) 42:8071–8082
123
immediate vicinity of the triple line diffusion is the domi-
nating mechanism for solute transport. We therefore neglect
the influence of convection in this region. As discussed in
Ref. [7], this assumption is justified in practical situations.
It was also shown in Ref. [7] that, because of its
cylindrical symmetry, this diffusion problem may be ana-
lyzed as a steady-state diffusion problem despite its
intrinsically transient nature. It is then governed by the
Laplace equation instead of Fick’s law.
The volume considered is thus a straight wedge of
angle h extending in cylindrical coordinates ðr;uÞbetween radius r = a, situated at the triple line, and
radius r ¼ b ¼ a expð1=ð2FðtÞÞÞ � a marking the
(assumed sharp) boundary between the region where
solute transport is by diffusion only, and the bulk liquid
where convection keeps the liquid composition uniform at
Co, see Figs. 5b, 6a. Within the wedge the solute
concentration C obeys:
r2C ¼ 1
r
oC
orþ o2C
or2þ 1
r2
o2C
ou2¼ 0 ð2Þ
subject to boundary conditions:
at r ¼ a; 0 � u � h; C ¼ Ce ð3Þ
at r ¼ b; 0 � u � h; C ¼ C0 ð4Þ
at u ¼ 0; a � r � b; DoC
rou¼ k
de
dt¼ kV
de
drð5Þ
at u ¼ hðtÞ; a � r � b;oC
ou¼ 0 ð6Þ
where D is the solute diffusion coefficient in the liquid, k
is the (reaction-specific) constant of proportionality
between the normal solute flux along the liquid/solid
interface in the liquid and the rate of interfacial reaction
product growth. The no-flux condition along the liquid
surface (Eq. 6) implicitly assumes that there is no evap-
oration/condensation solute transfer between liquid and
vapor phases.
The rate of motion of the triple line, V = dR/dt, is given
explicitly by a simple mass balance stating that the flux of
reactive solute supplied at the triple line at r = a is fully
used for radial extension of the wetted reaction layer—and
hence of the drop contact area with the solid:
R
liquid alloy
substrate
LL
eaeb
θθ − ∆θ θ
e
∆e
ea
rb
0
θ
liquid
ea
ϕ
R ∆R
(a)
(c)
(d)
(b)
Fig. 5 (a) Schematic
illustration of reaction layer
formation during spreading of a
liquid alloy on a substrate at the
liquid/solid interface. (b)
Details of the zone near the
triple line giving coordinates
used in analysis. (c) Schematic
evolution of the interfacial layer
profile when a decrease Dh in
the contact angle h occurs
during spreading. (d) Assumed
profile of the layer in analysis
J Mater Sci (2007) 42:8071–8082 8075
123

Zh
0
DoC
or
� �r¼a
adu ¼ nvea
dR
dtð7Þ
where ea is the thickness of product reaction layer formed
at the triple line, nv the mole number of reactive solute per
unit volume of reaction product, and R the radius of the
liquid/substrate contact area.
Solution method
The diffusion problem defined by Eqs. 2– 6 is most con-
veniently solved using the method of conjugate variables
[8], as was done in Ref. [3] for an analogous problem. For
the present calculations, we leave variable u unchanged
and define dimensionless variables:
g ¼ lnr
a
� �ð8Þ
v ¼ C � Ce
C � C0
ð9Þ
Eq. 2 then becomes:
o2vog2þ o2v
ou2¼ 0 ð10Þ
such that the problem is recast into a diffusion problem on
a rectangle, as illustrated in Fig. 6. When discretized using
the finite-difference method, variable g conveniently re-
fines the mesh near the triple line, where the more
important concentration gradient are located.
Numerical solutions are obtained with the finite difference
method using Stones’s iteration method [9]. Finite-difference
meshes used in calculations featured one node every 1� for u
and 200 nodes for variable g. With 400 nodes along the gdirection, calculated concentration gradients differed by less
than 0.3%; the above-defined discretization was thus deemed
sufficiently fine and used in all calculations reported here.
Specialization to Cu–Cr spreading on carbon: treatment
of interfacial reaction kinetics
We now focus specifically on the system investigated here
(and in Ref. [3]), namely liquid Cu–Cr alloy drops forming
a continuous Cr7C3 reaction layer while spreading on a flat
vitreous carbon substrate; the problem is sketched in more
detail in Fig. 7. The problem at hand is relatively complex
because it is a free boundary problem in which the solid
and liquid diffusion problems are coupled: indeed, the rate
of reaction along the liquid/solid interface will generally
depend on the local solute concentration C in the liquid,
which is a priori unknown since it depends on solution of
the diffusion problem described by Eqs. 2–6. We thus do
not aim to provide a full simulation of the series of
experiments reported here; rather, we simply aim to show
that the presence of a finite solute flux to the interface
behind the triple line caused by continued interfacial
reaction can indeed explain the observed deviation of data
from Eq. 1a. To this end, we decouple to some extent the
solid and liquid diffusion problems and assume a priori that
the interfacial reaction layer has the two-zone simplified
structure that was described in Section ‘‘Introduction.’’
A quantitative description of the interfacial reaction
kinetics is needed, since these govern the term de/dt in
Eq. 5. This is generally not simple because the two prob-
lems are interrelated: the rate of reaction along the liquid/
solid interface will generally depend on the local solute
concentration C in the liquid, which is a priori unknown
since it depends on solution of the diffusion problem
Fig. 6 Schematic representation of the mesh used in the numerical calculations: (a) cylindrical coordinates ðr;uÞ; (b) after change of variables
ðg;uÞ
8076 J Mater Sci (2007) 42:8071–8082
123

described by Eqs. 2–6. We therefore examine the specifics
of chemical interaction between carbon and Cu–Cr alloys,
stating the assumptions we make to ease tractability of the
problem.
Based on the SEM characterization and microprobe
analysis we consider that the only phase formed along the
liquid/carbon interface is Cr7C3. The problem to be solved
is, then, the diffusion-controlled growth of a layer Cr7C3
sandwiched between pure vitreous carbon and a liquid
Cu–Cr alloy. This is sketched in Fig. 8.
Fries et al. [10] reported diffusion-controlled growth
of carbide layers in the Cr–C system and showed that
diffusion of chromium through chromium carbide is sig-
nificantly slower than carbon diffusion. From this study
we can conclude that reaction kinetics at the liquid/car-
bide interface are not rate-limiting and that growth of
the Cr7C3 reaction layer occurs at the liquid/carbide
interface.
We assume that local thermodynamic equilibrium obtains
along both interfaces: stable equilibrium at the liquid/car-
bide interface, and metastable equilibrium at the carbon/
carbide interface, Fig. 8. Because of the very low carbon
solubility in liquid Cu around 1,100 �C ( < 10–7 at.% at
1,150 �C [11]), we ignore altogether the presence of carbon
in the liquid. The carbide layer thickening rate then
depends on: (i) the diffusion of chromium in the liquid
from the drop bulk to the liquid/carbide interface (Eq. 5)
and (ii) the diffusion of carbon in the solid reaction layer.
Mass balance equations are expressed for chromium by
Eqs. 5 and 11 and for carbon by Eq. 12:
for chromium : CCr;carbide � C�Cr
� � de
dt¼ D
oCCr
rou
� �eþ
ð11Þ
for carbon : C�Cde
dt¼ JC: ð12Þ
Thermodynamic equilibrium along the liquid Cu–Cr/Cr7C3
interface dictates:
a�Cr
� �7a�C� �3¼ exp
DG0f ðCr7C3Þ
RT
� �ð13Þ
where JC is the diffusion flux of carbon through Cr7C3
(chromium diffusion is neglected), aCr and aC are chro-
mium and carbon chemical activity, respectively, CCr and
CC are chromium and carbon concentration, respectively,
and DG0f ðCr7C3Þ is the molar standard free enthalpy of
formation of Cr7C3 from liquid chromium and solid car-
bon. The asterisk superscript indicates that activities or
concentrations are at the liquid/carbide interface, as indi-
cated in Fig 8.
The diffusion flux of carbon in Cr7C3 carbide (JC) is
most conveniently expressed in terms of the chemical
potential gradient lC [12]:
0CrC 0
C =ϕ∂
∂
0 < ϕ < θ
b > r > a L
b
Carbon
Cr7C3
θ
aea
eb
Cr
((Cu, Cr))
C
Fig. 7 (a) Boundary conditions used
to model the diffusion process, (b)
cylindrical coordinate system
Fig. 8 Schematic representation of Cr and C (dotted line) concen-
tration profiles across the interfacial reaction layer in the Cu–Cr/C
system. Solubility of C in liquid phase and of Cr in carbon are
neglected. We assume stable local thermodynamic equilibrium at the
liquid/carbide interface and metastable local equilibrium at the
carbon/carbide interface. CbC is the concentration of carbon in the
bulk, C0C and C�C are the Cr7C3 carbon concentration at C/Cr7C3 and
Cr7C3/liquid interfaces respectively. CvCr and C�Cr are the liquid Cr
concentrations in the drop volume and at the liquid/Cr7C3 interface,
respectively
J Mater Sci (2007) 42:8071–8082 8077
123

JC � �xC 1� xCð ÞD�C
RTVmCr7C3
olC
oz
� �e�
ð14Þ
where VmCr7C3
is the molar volume of Cr7C3 (m3 per mol of
atoms), xC is the mean carbon content of Cr7C3 (nearly
constant across the layer because of the narrow range of
homogeneity), and D�C is the self-diffusion coefficient of
carbon in Cr7C3. Assuming a steady state (linear) profile
for the carbon chemical potential across the carbide layer
and using the classical expression ðlC ¼ l0C þ RT ln aCÞ;
Eq. 14 can be rewritten as:
JC � �xC 1� xCð ÞD�C
VmCr7C3
�ln a�C� �e
ð15Þ
where a�C is the carbon activity in carbide layer at the liquid/
carbide interface (see Fig. 8) and e the layer thickness.
Therefore, Eq. 12 becomes ðwithC�C ¼ xC=VmCr7C3Þ :
de
dt¼ � 1� xCð ÞD�C
ln a�C� �e
: ð16Þ
The rate of carbide layer thickening and the solute
concentration profile in the liquid are, thus, interlinked
problems. As was assumed in Section ‘‘Introduction,’’ the
reaction layer thickness profile near the triple line is taken
to be linear between r = a (e = ea) and r = L (e = eb).
From there until r = b, the reaction layer thickness is
assumed to be constant (at e = eb); see Fig. 7.
The diffusion coefficient of Cr in liquid Cu at 1,150 �C is
taken as D = 2 · 10–9 m2 s–1 (typical of transition metals in
copper at 1,373 K [13]). The average molar volume of atoms in
the liquid is taken as Vml ¼ MCu=qCu ¼ 7:94 cm3 mol�1 and
used to calculate the Cr concentration in liquid (mol cm–3).
The number of moles of reactive solute per unit volume of
Cr7C3, nv, is estimated at 7� qCr7C3=MCr7C3
¼ 0:122 mol
cm�3 [10, 14]; thus VmCr7C3
¼ 5:76 cm3 mol�1 of atoms.
DG0f ðCr7C3Þ ¼ �333880þ 50:846T J mol�1 [15]. Henry’s
law is used, i.e., aCr ¼ c1CrxCr; where c1Cr is the infinite dilu-
tion activity coefficient of Cr in liquid Cu referred to pure
liquid Cr : RTlnc1Cr ¼ 81200 � 27:9T [16].
Evaluation of parameters
We first evaluate parameters L and eb. As mentioned earlier,
the most physically reasonable assumption is that growth
of the reaction layer is solid-state diffusion-controlled
and hence parabolic. The interfacial layer thickness e is
then given by:
eðs;RÞ ¼ ea þ k sðRÞ½ 1=2 ð17Þ
where ea is the thickness of the layer when it first forms at
the triple line, k is a kinetic constant and s is the time of
contact of the drop with the solid substrate at distance R
from the center of the drop (s is obviously different from
the spreading time t, these times being related through the
spreading curves R(t)).
Assuming ea is negligible compared to the final thick-
ness of the reaction layer (as will be seen below, this is
consistent with data) observed values of the reaction layer
thickness at the center of the drop, formed after some
hundreds of seconds of contact, can be used to estimate an
average value of the growth kinetic constant k =
0.15 lm s–1/2 This value is in good agreement with the
value of k � 0:1 lm s�1=2 obtained by Mortimer and
Nicholas [17] who studied the interfacial reaction between
a Cu–1% Cr alloy and vitreous carbon at 1,150 �C for
reaction times as long as 4 h.
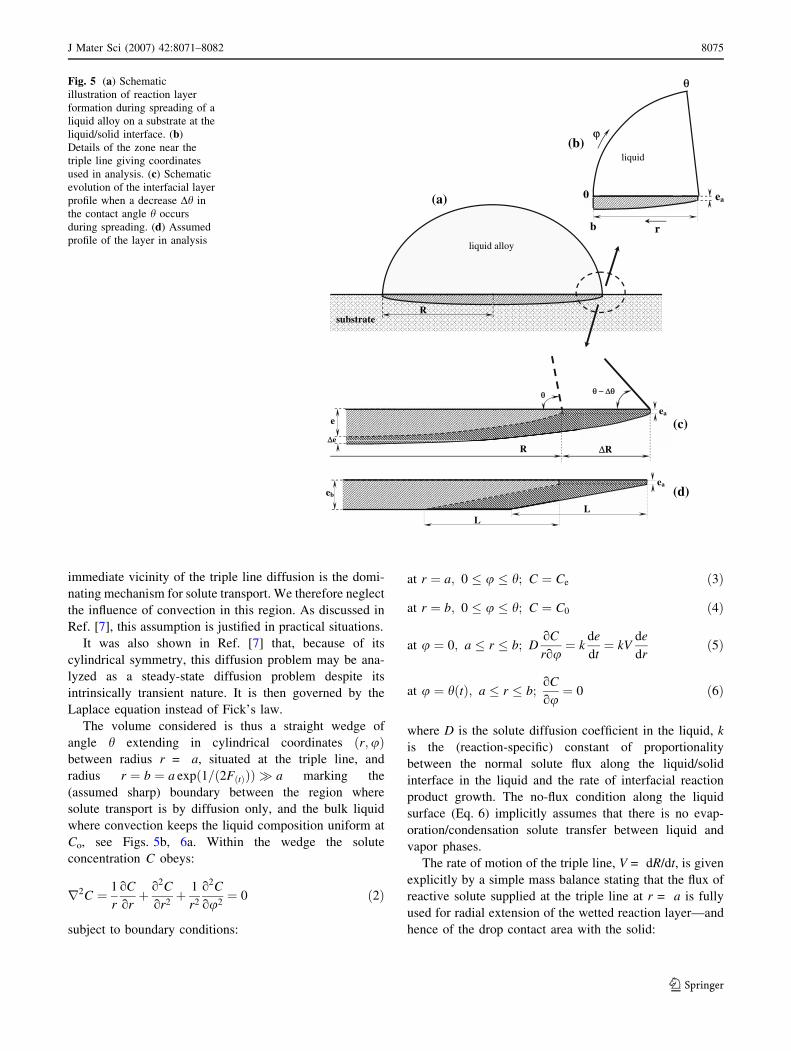
From Eq. 17 and the experimental data of variation with
time of the drop base radius R(t) and contact angle h(t)—cf.
Fig. 2—we then calculate, for different spreading times
(i.e., different contact angle values), the carbide layer
thickness e(R) as a function of distance R from the center of
the drop. Figure 9a presents such calculated curves e(R),
showing that the interfacial layer thickness at the center of
the drop varies from about 0.5 lm (t = 10 s, h = 83�) to
1.5 lm at the end of spreading (t = 100 s, h = 32�). This
figure clearly points out the contrast that exists, for a given
time t, between the high rate of growth of the interfacial
layer near the triple line and its much slower subsequent
growth nearer the center of the drop. When time t increases
from 70 to 100 s and the triple line becomes almost
immobile (displacements fall below 100 lm), the interfa-
cial layer thickness increases by a factor 25 (from 0.04 to
about 1 lm) whereas at the center of the drop the thickness
of the layer increases only by 25% (from 1.2 to 1.5 lm). In
other words, the rate of reaction is important only in a
limited zone close to the triple line. These curves motivated
the simplification made in modeling diffusion within the
drop, namely taking the reaction layer thickness to increase
linearly over a fixed distance L from the triple line and
remain constant thereafter; see Figs. 5d and 7.
To evaluate a mean value for L we have plotted, for
different spreading times, the variation of the diffusion flux
J through the layer at any point of the interface as a
function of distance R from the center of the drop, see
Fig. 9b. We take L as the region within which the diffusion
flux is higher than 20% of Jmax (this value is somewhat
arbitrary but captures well the width of the region of rapid
diffusion). It can then easily deduced from Fig. 9b that L
varies from roughly 150 lm (t = 10 s, h = 83�) to 50 lm
at the end of spreading (t = 100 s, h = 32�). In calculations
8078 J Mater Sci (2007) 42:8071–8082
123
we thus take the average value, of L = 100 lm. Figure 9b
indicates also that during spreading from h ¼ 83� to 32�,
the reaction layer thickness increases from about 0.5 to
1.5 lm. As with L, we use the average value for the carbide
layer thickness far from the triple line: eb = 1 lm.
Parameter a is defined such that (a�h) is the linear area
of the surface along which three-phase equilibrium obtains
(between the Cu–Cr liquid alloy, vitreous carbon and
Cr7C3, Fig. 8) [7]. This is expected to be on the order of a
few nanometers; in the following calculations we have
simply taken a = 1 nm. According to Ref. [7], b is then
roughly 300 lm � a expð1=0:08Þ:Two parameters in the equations system remain difficult
to estimate: the initial thickness of carbide reaction layer
formed at the triple line (ea) and the self-diffusion coeffi-
cient of carbon across Cr7C3 (DC* ).
If indeed the interpretation offered earlier, namely that
continued reaction behind the triple line leaves the slope
predicted by Eq. 1a unchanged, with all parameters other
than the reaction layer known, this last parameter can be
inferred from spreading kinetics at low angles, as was done
in Ref. [3] (see the equation page 1125 of that reference).
This gives ea = 40 nm for the present experiments.
An order of magnitude for D�C can be gleaned from
measurements of the growth kinetics of Cr7C3 during
diffusion couple experiments. Fries et al. have performed
such experiments with the carbon/chromium couple in the
temperature range from 1,200 to 1,475 �C [10]. From their
experiments and using a treatment as in Refs. [12, 18] we
estimate D�C to lie between 4 · 10–16 and 6 · 10–15 m2 s–1.
This range for the value of the self-diffusion coefficient of
carbon through Cr7C3 is relatively wide because of: (i)
dispersion in experimental data of Fries (extrapolated
values for (DCDCC) where DCC is poorly known (the range
of DCDCC across Cr7C3 varies between 0.54 · 10–10 and
8.2 · 10–10 mol m–1 s–1), and (ii) the fact that one must
make assumptions in deducing D�C from values of DCDCC
(see Refs. [12] and [18]). We have therefore conducted
calculations for several different values of D�C; using this
single adjustable parameter as a measure of the relative
importance of interfacial reaction behind the triple
line. Parameters used in calculations are summarized in
Table 1.
Results of calculations and discussion
Results of numerical calculations for Cu–1.5 at.% Cr
spreading on vitreous carbon at 1,150 �C with ea = 40 nm
and for different values of the coefficient of diffusion
through the reaction layer, D�C; values are plotted in
Fig. 10. As seen, the precise value of D�C in a realistic range
of variation around the value 10–15 m2 s–1 exerts a strong
influence on the triple line velocity. If D�C � 10�16 m2 s�1;
the rate of reaction product growth behind the triple line is
negligible. The triple line velocity V = dR/dt is then simply
proportional to the instantaneous contact angle h, as pre-
dicted by the analytical model in Ref. [7] (Eq. 1), indi-
cating thus the consistency of the numerical calculations in
this limiting case. When D�C increases above this value, the
curve giving V as a function of h remains linear, retaining
the same slope. The curve is, in other words, simply
translated such that its intercept with the h-axis increases
progressively with increasing D�C:Under assumptions of the present model, therefore, the
effect of continued interfacial reaction on spreading
kinetics is indeed, as was surmised in Ref. [3], essentially
to create a ‘‘dead-angle’’ in which all solute flux lines
from the drop bulk are diverted away from the triple line
to the liquid/solid interface, as was sketched in Fig. 11
of Ref. [3]. This ‘‘dead angle’’ hd appears simply in the
data as the h-axis intercept of the straight line linking V
with h.
0
0.5
1
1.5
0 500 1000 1500 2000 2500
10
20
30
40
57
70
10032
35
38
43
49
60
83
θ(°) t(s)
1568
)m ( e
µ
R ( m) µ
(a)
0
10
20
30
1000 1500 2000 2500
m ( e/11-
R ( m)µ
µ
10 20 30 40 57 70 10015
83 60 49 43 38 3268θ(°)
t(s)
35(b)
Flu
x)
Fig. 9 Variation with distance R from the center of the drop of (a)
the calculated carbide layer thickness e and (b) carbon flux JC (in
arbitrary units) through this layer at the Cu–1.5 at.% Cr/CV interface
for different spreading times t and contact angles h. T = 1,150 �C.
Values calculated according to Fig. 2 and Eq. 17 with ea = 40 nm
and k = 0.15 lm s–1/2
J Mater Sci (2007) 42:8071–8082 8079
123

The experimental data are relatively well predicted for
D�C ¼ 6� 10�15 m2 s�1 which, as mentioned above, is a
realistic value [10]. Note that for a initial triple line reac-
tion layer thickness values (ea) that are high, i.e. some
hundred of nanometres, the numerical calculations show
that the values of diffusion coefficient in the carbide layer,
susceptible to lead to a significant reactive solute flux
behind the triple line, must be some orders of magnitude
higher than 10–16 m2 s–1; this is unrealistic. Results thus
indicate that either the initial carbide layer is less than
100 nm thick, or that alternatively this initial carbide layer
is not dense, leading thus to a high cross-thickness diffu-
sivity due to diffusion short-circuits. In this last case, of a
porous carbide layer, the width of the boundary zone L
would be lower than the values of L evaluated above (the
higher the effective diffusivity through this layer is, the
lower is the value of L).
Note also that for diffusion through titanium carbide at
1,020 �C, DC* is less than 10–19 m2 s–1, which is well below
the value 10–16 m2 s–1 [12]. The effect of interfacial reac-
tion layer thickening behind the triple line is thus indeed
expected to be negligible for Cu–15 at.% Sn–3 at.% Ti
spreading on vitreous carbon, as observed [4].
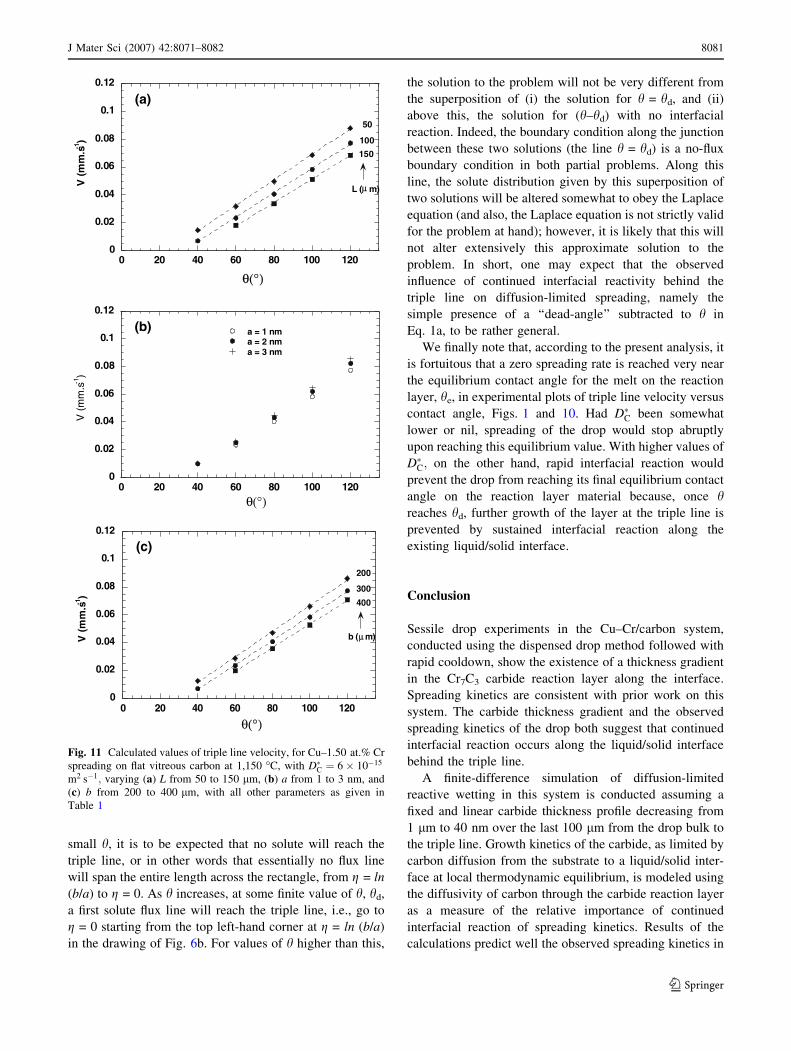
Variations in the assumed geometrical parameters
characterizing growth of the interfacial reaction layer in the
model are explored in Fig. 11, where one can see the
influence of variations in L (Fig. 11a); a (Fig. 11b) and b
(Fig. 11c). As seen, varying L causes a shift in the curve,
the slope of which remains constant. A decrease in L thus
causes a decrease in the effective dead-angle: this is to be
expected, since a decrease in L all else being constant will
cause a decrease in the extent of solute flux diversion away
from the triple line towards the interface. Most importantly,
however, the influence of L is relatively small: a 3-fold
increase in L has less effect than a doubling of D�C (com-
pare Figs. 10 and 11a).
In all cases, it is seen that the simulation yields the same
general result: interfacial reactivity manifests itself by the
presence of a finite ‘‘dead-angle’’ that must be subtracted
from h in Eq. 1a, this equation remaining otherwise
essentially valid. The same result was found analytically in
Ref. [3] for the extreme case of kinetically unhindered
chemical reaction and very fast diffusion of the reactive
species through the reaction layer.
Without providing a rigorous proof, the reason for this
can in fact be relatively easily seen by examination of
Fig. 6, especially Fig. 6b. Suppose indeed that, with a finite
reaction rate along the interface, we consider solutions to
the diffusion problem in Fig. 6b defined by Eqs. 3–6 and
Eq. 10 starting from vanishingly small h. At vanishingly
Table 1 Summary of
parameters used in diffusion
analysis
Parameter Value Reference
Geometrical a 1 nm
b 300 lm
L 100 lm
ea 40 nm
eb 1 lm
h 20� to 120�Thermodynamical DG0
f ðCr7C3Þ –333880 + 50.846T [15]
RT ln c1Cr 81200–27.9T [16]
Kinetical DCr (in liquid) 2 · 10–9 m2 s–1 [13]
D�C (in Cr7C3) 4 · 10–16 to 6 · 10–15 [10, 12, 18]
Other VmCr7C3
5.76 cm3 mol–1 [10, 14]
xCr 0.015
0
0.02
0.04
0.06
0.08
0.1
0.12
0 20 40 60 80 100 120
θ(°)
s.m
m( V
1-)
10
6
4
0.1
1015.D*C
Fig. 10 Experimental triple line velocity V(+, s, h) and calculated
values (u, d, n, m) with ea = 40 nm as a function of instantaneous
contact angle h for various values of D�C expressed as multiples of
10–15 m2 s–1, for Cu–1.50 at.% Cr spreading on flat vitreous carbon at
1,150 �C (calculations were conducted with a = 1 nm, b = 300 lm,
L = 100 lm and eb = 1 lm)
8080 J Mater Sci (2007) 42:8071–8082
123
small h, it is to be expected that no solute will reach the
triple line, or in other words that essentially no flux line
will span the entire length across the rectangle, from g = ln
(b/a) to g = 0. As h increases, at some finite value of h, hd,
a first solute flux line will reach the triple line, i.e., go to
g = 0 starting from the top left-hand corner at g = ln (b/a)
in the drawing of Fig. 6b. For values of h higher than this,
the solution to the problem will not be very different from
the superposition of (i) the solution for h = hd, and (ii)
above this, the solution for (h–hd) with no interfacial
reaction. Indeed, the boundary condition along the junction
between these two solutions (the line h = hd) is a no-flux
boundary condition in both partial problems. Along this
line, the solute distribution given by this superposition of
two solutions will be altered somewhat to obey the Laplace
equation (and also, the Laplace equation is not strictly valid
for the problem at hand); however, it is likely that this will
not alter extensively this approximate solution to the
problem. In short, one may expect that the observed
influence of continued interfacial reactivity behind the
triple line on diffusion-limited spreading, namely the
simple presence of a ‘‘dead-angle’’ subtracted to h in
Eq. 1a, to be rather general.
We finally note that, according to the present analysis, it
is fortuitous that a zero spreading rate is reached very near
the equilibrium contact angle for the melt on the reaction
layer, he, in experimental plots of triple line velocity versus
contact angle, Figs. 1 and 10. Had D�C been somewhat
lower or nil, spreading of the drop would stop abruptly
upon reaching this equilibrium value. With higher values of
D�C; on the other hand, rapid interfacial reaction would
prevent the drop from reaching its final equilibrium contact
angle on the reaction layer material because, once hreaches hd, further growth of the layer at the triple line is
prevented by sustained interfacial reaction along the
existing liquid/solid interface.
Conclusion
Sessile drop experiments in the Cu–Cr/carbon system,
conducted using the dispensed drop method followed with
rapid cooldown, show the existence of a thickness gradient
in the Cr7C3 carbide reaction layer along the interface.
Spreading kinetics are consistent with prior work on this
system. The carbide thickness gradient and the observed
spreading kinetics of the drop both suggest that continued
interfacial reaction occurs along the liquid/solid interface
behind the triple line.
A finite-difference simulation of diffusion-limited
reactive wetting in this system is conducted assuming a
fixed and linear carbide thickness profile decreasing from
1 lm to 40 nm over the last 100 lm from the drop bulk to
the triple line. Growth kinetics of the carbide, as limited by
carbon diffusion from the substrate to a liquid/solid inter-
face at local thermodynamic equilibrium, is modeled using
the diffusivity of carbon through the carbide reaction layer
as a measure of the relative importance of continued
interfacial reaction of spreading kinetics. Results of the
calculations predict well the observed spreading kinetics in
0
0.02
0.04
0.06
0.08
0.1
0.12
0 20 40 60 80 100 120
θ(°)
s.m
m( V
1-)
150
100
50
(a)
L ( m)µ
0
0.02
0.04
0.06
0.08
0.1
0.12
0 20 40 60 80 100 120
a = 1 nma = 2 nma = 3 nm
(b)
θ(°)
s.m
m( V
1-)
0
0.02
0.04
0.06
0.08
0.1
0.12
0 20 40 60 80 100 120
θ((°)
s.m
m( V
1-)
400
300
200
(c)
b ( m)µ
Fig. 11 Calculated values of triple line velocity, for Cu–1.50 at.% Cr
spreading on flat vitreous carbon at 1,150 �C, with D�C ¼ 6� 10�15
m2 s�1; varying (a) L from 50 to 150 lm, (b) a from 1 to 3 nm, and
(c) b from 200 to 400 lm, with all other parameters as given in
Table 1
J Mater Sci (2007) 42:8071–8082 8081
123

this system for a realistic value of the carbon diffusion
coefficient D�C equal to 6 · 10–15 m2 s–1. This simplified
but realistic simulation shows that the influence of con-
tinued reaction behind the triple line in diffusion-limited
reactive wetting cause, in systems of the present class, the
formation of a relatively constant ‘‘dead angle’’ hd in the
liquid edge, across which solute diffusion is deviated away
from the triple line. Spreading thus proceeds as predicted
by Eq. 1a modified by substitution of the instantaneous
contact angle h with (h–hd).
Acknowledgement This work was supported by core funding at the
respective authors’ laboratories.
References
1. Naidich YV (1981) In: Cadenhead DA, Danielli JF (eds) Progress
in surface and membrane science, vol 14. Academic Press, New
York, p 380
2. Eustathopoulos N, Nicholas MG, Drevet B (1999) Wettability at
high temperatures. Elsevier, Kidlington, p 198, 317
3. Voitovitch R, Mortensen A, Hodaj F, Eustathopoulos N (1999)
Acta Mater 47:1117
4. Dezellus O, Hodaj F, Mortensen A, Eustathopoulos N (2001)
Scripta Mater 44:2543
5. Dezellus O, Hodaj F, Eustathopoulos N (2002) Acta Mater
50:4741
6. Landry K, Eustathopoulos N (1996) Acta Mater 44:3923
7. Mortensen A, Drevet B, Eustathopoulos N (1997) Scripta Mater
36:645
8. Carslaw HS, Jaeger JC (1959) Conduction of heat in solids, 2nd
edn. Clarendon Press, Oxford, UK, pp 166–167, 431–434
9. Stone HL (1968) SIAM J Numer Anal 5:530
10. Fries RJ, Cummings JE, Hoffma CG, Daily SA (1967) US
Atomic Energy Comm Report, LA-3795-MS. pp 1–32
11. Oden LL, Gokcen NA (1992) Met Trans B 23B:453
12. Van Loo FJJ, Bastin GF (1989) Metall Trans A 20A:403
13. Weast RC, Lide DR, Astle MJ, Beyer WH (1990) CRC handbook
of chemistry and physics, 70th edn. CRC Press, Inc, Boca Raton,
pp B-85, F-52
14. Nouveau traite de chimie minerale, Masson et Cie Editeurs.
Tome XII, Paris (1959), p 367
15. Chase MW (ed) (1998) NIST JANAF Thermochemical Tables, 4th
edn. American Society and American Institute of Physics for the
National Institute of Standards and Technology. Monograph Nr. 9
16. Chakrabarti DJ, Laughlin DE (1984) Bull Alloy Phase Diagrams
5(1):59
17. Mortimer DA, Nicholas M (1973) J Mat Sci 8:640
18. Gulpen JH, Kodentsov AA, Van Loo FJJ (1995) Z Metallkunde
86:530
8082 J Mater Sci (2007) 42:8071–8082
123