Ischaemia differentially regulates GABAB receptor subunits in organotypic hippocampal slice cultures
Upload
independentCategory
view
0download
0
European Journal of Neuroscience, Vol. 8, pp. 169-182, 1996 0 European Neuroscience Association
Differential Oscillatory Properties of Cholinergic and Non- cholinergic Nucleus Basalis Neurons in Guinea Pig Brain Slice
Angel Alonso, Asaid Khateb’, Patrice Fort’!*, Barbara E. Jones and Michel Muhlethalerl Montreal Neurological Institute, Department of Neurology and Neurosurgery, McGill University, 3801 University Street, Montreal, Quebec, Canada H3A 284 ’ Departement de Physiologie, Centre Medical Universitaire, 1 Rue Michel-Servet, CH-1211 Geneve 4, Switzerland 2Departement de Medicine Experimentale, INSERM U52, CNRS URA1195, Faculte de Medicine, Universite Claude Bernard, 69373 Lyon, France
Keywords: basal forebrain, substantia innominata, choline acetyltransferase, theta, gamma
Abstract
Evidence has suggested that the nucleus basalis magnocellularis has the potential to influence the functional state of the cerebral cortex through topographically organized, widespread projections of the cholinergic cells in that nucleus. It has also been shown that, in addition to the cholinergic neurons, other non-cholinergic magnocellular basal forebrain neurons, some of which have been identified as gamma-aminobutyric acid-ergic, project into the cerebral cortex and thus may also participate in the modulation of its activity. We have performed a comparative study of the intrinsic rhythmic properties of immunohistochemically and morphologically characterized choline acetyltransferase (ChAT)-positive and ChAT-negative cells of the nucleus basalis by means of intracellular recordings in guinea pig brain slices. Our results demonstrate that relatively large, multipolar cholinergic and non-cholinergic neurons each display differential voltage-dependent properties that allow them to discharge rhythmically in spike bursts and spike clusters, respectively, at low frequencies (<I 0 Hz). Cholinergic cells display bursts of 2-4 action potentials (at -200 Hz) riding on low-threshold spikes recurring at a low frequency (<5 Hz) when depolarized from a membrane potential more negative than -55 mV and display low- frequency (<I 0-15 Hz) tonic firing when depolarized from a more positive level. In contrast, non-cholinergic cells fire in a unique mode, displaying non-adapting clusters of spikes interspersed with rhythmic subthreshold membrane-potential oscillations when depolarized from levels less negative than -55 mV. The spike clusters repeat rhythmically at relatively low frequencies (2-1 0 Hz). The intracluster spiking frequency is relatively high and coincides approximately with that of the intervening membrane-potential oscillations (-20-70 Hz). The cluster frequency of the non-cholinergic cells corresponds, in the same manner as the burst frequency of the cholinergic cells, to a delta (1-4 Hz) or theta (4-10 Hz) range of activity, whereas the intra-cluster and tonic spike frequencies of the non-cholinergic cells correspond to high beta to gamma ranges of electroencephalographic activity (1 9-30 Hz and 30-60 Hz, respectively). We propose that the different modes of oscillatory firing by the cholinergic and non-cholinergic basal forebrain cell populations could collectively contribute to the rhythmic modulation of slow and fast rhythms within the cerebral cortex.
Introduction
Considerable evidence suggests that rhythmic activity within the forebrain may provide the temporal coordination necessary for the integration of distributed neuronal processes within sensory, motor and higher order cognitive systems in the cerebral cortex (Llinis, 1988; Bressler, 1990; Singer, 1993; Gray, 1994). Coordination of such rhythmic activity across large populations of cortical neurons may be determined by cortico-cortical connections andor by thalamo- cortical projections (Gray et al., 1989; Steriade et al., 1991b; Llinis and Ribary, 1993), but could also potentially be influenced by other subcortical structures with widespread cortical projections.
It has long been known that the cholinergic neurons In the nucleus basalis magnocellularis provide a topographically organized innervation to the entire cortical mantle (Rye el al., 1984) and have the capacity to modulate cortical activity across the sleepwaking cycle (for review see Jones, 1993). In a previous report we demonstrated that in a guinea pig brain slice these cholinergic neurons display a tendency to burst rhythmically through a low-threshold Ca2+ spike (Khateb et al., 1992). We thus proposed that the basal-forebrain cholinergic neurons could modulate cortical activity in a rhythmic manner.
Correspondence to: Dr Barbara E. Jones
Received 19 April 1995, revised 10 July 1995, accepted 23 August 1995

170 Oscillatory properties of nucleus basalis neurons
It is also known that non-cholinergic cells are located in the basal forebrain and contribute to the projection to the cerebral cortex (Rye et al., 1984). A proportion of the non-cholinergic magnocellular cortical projection neurons have been shown to be gamma-aminobu- tyric acid (GABA)-ergic (Zaborszky ef al., 1986; Fisher et al., 1988; Freund and Meskenaite, 1992; Jones et al., 1995). Based upon preliminary evidence from the guinea pig brain slice, we had reason to believe that non-cholinergic cells in the basal forebrain might display certain rhythmic properties (Miihlethaler et al., 1992). It would thus be possible that the non-cholinergic cells could also modulate cortical activity in a rhythmic manner.
The aim of this study was to compare the electrophysiological properties and morphology of immunohistochemically established choline acetyltransferase (ChAT)-positive and ChAT-negative cells in the basal forebrain of the guinea pig brain slice. Though the oscillatory modes and mechanisms of the cholinergic versus non-cholinergic cells were found to be different, both neuronal populations were seen to display voltage-dependent intrinsically generated slow rhythmic spike discharges of similar predominant frequencies. Whereas cho- linergic cells fire in slow rhythmic low-threshold bursts (LTBs), non- cholinergic cells fire in slow rhythmic spike clusters. In addition, non-cholinergic cells display high frequency rhythmic subthreshold membrane-potential oscillations at about the same frequency as the intra-cluster spiking (20-70 Hz). The different modes of oscillatory firing by these two cell populations could thus contribute to the modulation of slow and fast rhythms within the cerebral cortex.
Materials and methods Brain slices were derived from young guinea pigs (100-200 g) following standard procedures. Briefly, animals were decapitated under Nembutal (30 mg/kg, i.p.) anaesthesia, and the brain was quickly removed and blocked. A slab of tissue containing the basal forebrain was placed in cold (610°C) oxygenated Ringer’s solution (see below) and cut into 400 pm slices in the coronal plane using a vibratome. Slices were then allowed to recover at room temperature for at least 2 h in oxygenated incubation chambers. For each recording, a single slice was transferred to a chamber, submerged and superfused at 32-34°C with a solution containing 130 mM NaCI, 5 mM KCI, 1.25 mM KH2PO4, 2.4 mM CaC12, 1.3 mM MgS04, 20 mM NaHC03 and 10 mM glucose. The pH was adjusted to 7.4 by saturating with 95% O2 / 5% C02. Intracellular glass electrodes (tip resistance 60- 120 MQ) were filled with 2-3 M potassium acetate and either 1-2% biocytin (Sigma, St Louis, MO and Buchs, CH) or 1-2% biotinamide (NeurobiotinTM, Vector Laboratories, Burlingame, CA) in 1-3 M potassium acetate (100-200 MQ) (Horikawa and Armstrong, 1988; Kita and Armstrong, 1991). (Biocytin and biotinamide will from this point be referred to collectively as biocytin.) Signals were amplified (with a Neurodata ER183 or Axoclamp 2A used in bridge mode), digitized (with a Neuro-Corder), visualized on line on a digital storage oscilloscope (Tektronix) and stored on videotape for subsequent analysis on a 386-based computer.
Recordings were taken from cells within the substantia innominata in the region located beneath the lateral wing of the anterior commissure (Khateb et al., 1992, 1993; Alonso et al., 1994). In order to estimate the proportions of different cell types according to their electrophysiological characteristics, recordings were taken from a sample of 125 cells acquired over a 6 month period.
In an immunohistochemical and/or morphological study, carried out over 2 years, 198 cells which were electrophysiologically charac-
terized were injected with biocytin. The slices containing the injected cells were fixed for 30 min with a solution of 3% paraformaldehyde and 0.2% picric acid in 0.1 M phosphate buffer (pH 7.4) and subsequently infused with 30% sucrose, by overnight incubation, prior to deep freezing (-80°C). Frozen sections were cut at 50 pm for all subsequent processing.
Most (l56/198) of the biocytin-injected cells were processed for immunostaining of ChAT in order to determine whether they were cholinergic or not. For this purpose, the sections were processed first for ChAT immunostaining using a rat monoclonal antibody (Incstar, Stillwater, MN) and secondly for biocytin staining. The majority (96) of these biocytin-filled cells were stained by peroxidase techniques by applying first peroxidase-antiperoxidase immunohistochemistry for ChAT, using the brown diaminobenzidine (DAB) reaction product, and second avidin-horseradish peroxidase (HRP) (Vector) labelling for biocytin, using the blue benzidine dihydrochloride (BDHC) reaction product, as reported in a previous publication (Khateb et al., 1992). Sixty other biocytin-filled cells were processed by fluorescence techniques for ChAT immunostaining, using the blue fluorescent 7- amino-4-methylcoumarin-3-acetic acid (AMCA, Jackson Immuno- research Laboratories, West Grove, PA) as a tag, and biocytin staining, using the red fluorescent Texas Red (Jackson, as above) as tag, as reported in another publication (Khateb et al., 1993). In -40% of the peroxidase- and fluorescent-labelled cells, both ChAT immunohisto- chemistry and biocytin labelling were successful enough to allow determination of ChAT immunoreactivity in the characterized biocytin-filled cells. Of the latter sample, the major proportion of the peroxidase-processed cells remained permanently stained and a proportion of the fluorescent-labelled cells were further processed by peroxidase labelling of the biocytin using avidin-biotin complex (ABC Vectastain, Vector) to allow permanent staining of the biocytin- filled cell. Of the 156 filled cells processed for dual staining, 39, which had been identified by either the peroxidase- or the fluorescent- labelling procedure as cholinergic or non-cholinergic, were permanently stained by peroxidase labelling and could thereby be used to construct a map by superimposing the locations of individual cells upon the drawing of one representative section.
Forty-two of the injected cells were processed for biocytin staining alone in order to examine their morphology. In these cells, avidin- HRP or ABC labelling was revealed by DAB alone or DAB enhanced with nickel. In -50% of the filled cells, biocytin staining was adequate for closer examination of the somato-dendritic morphology. Using a camera lucida, these biocytin-filled cells were usually drawn through one section or occasionally through 2 or 3 sections if labelled elements could be clearly aligned across the adjacent sections. All drawings were prepared for publication with the aid of Core1 Draw computer software.
Results Electmphysiological, immunohistochemical and morphological characterization of cholinegic versus non-cholinegic neumns A majority of neurons recorded in the basal forebrain of the guinea pig slice (n = 74/125 = 60%) can be distinguished by the unique display of a delayed LTB discharge when the cells are depolarized from rest or a hyperpolarized level (more negative than -55 mV). When depolarized from levels less negative than -55 mV, they fire tonically at a slow rate which does not usually exceed 10 Hz. Neurons with these characteristics have been found to contain ChAT using the peroxidase technique (Fig. 1A) or the fluorescence technique and are

Oscillatory properties of nucleus basalis neurons 17 1
FIG. 1. Photomicrographs of cholinergic (A) and non-cholinergic (B) cells from basal forebrain guinea pig slices. ChAT is revealed by the brown floccular DAB reaction product and biocytin with the blue, granular BDHC reaction product. In A the biocytin-filled cell (blue granules) is clearly positive for ChAT immunostaining (brown), whereas in B the biocytin-filled cell is clearly negative for C U T immunostaining. The cell in A displayed low-threshold spike bursts and slow tonic spiking, whereas the cell in B did not display such bursts and fired at a rapid rate when depolarized. (Magnification bar = 10 pm.)

172 Oscillatory properties of nucleus basalis neurons
therefore considered to be cholinergic. The biocytin-filled ChAT- positive cells (n = 26) were found to be variable in shape from fusiform or oval to-most commonly-triangular or polygonal, and medium to large in size. In large diameter they measured 17- 33 pm, averaging 22.3 pm. Of all the double-labelled cells, 21 were permanently stained by peroxidase labelling, allowing their location to be plotted in the basal forebrain (Fig. 2, filled circles). The LTB ChAT-positive biocytin-filled neurons were distributed across the
MS
n \ larger substantia innominata, with many cells located within the
0 ChAT+ o ChAT -
2 mm
FIG. 2. Schematized drawing of a section through a guinea pig basal forebrain slice upon which are superimposed the ChAT-positive (filled circles) and ChAT-negative (open circles) cells that were filled with biocytin during recording, successfully processed for ChAT immunohistochemistry and biocytin-labelling by either peroxidase or fluorescence techniques, and permanently labelled by peroxidase staining for their viewing and plotting by light microscopy. All of the ChAT-positive cells were characterized electrophysiologically by the display of low-threshold bursts and slow tonic spiking, whereas the ChAT-negative cells were characterized by the lack of LTBs and the presence of spike clusters and/or fast tonic spiking. The two cell types are distributed through the larger area of the substantia innominata (SI) beneath the anterior commissure (ac), although the non-cholinegic cells are concentrated more ventrally within the area of the magnocellular preoptic nucleus [as delineated in the rat (Gritti er al., 1993)l. CPu, caudate-putamen; MS, medial septum.
reGon of the magnocellular preoptic nucleus [as identified in the rat (Gritti et al., 1993)] and with a few cells extending into the region of the nucleus of the horizontal limb of the diagonal band.
The remaining neurons encountered in the basal forebrain ( n = 51/125 = 40%) manifest properties that clearly distinguish them from the cholinergic cells. First, they do not display delayed low-threshold bursting. Second, the vast majority of these cells (96%) display a relatively fast afterhyperpolarization (AHP) and rapid firing rate which always exceeds 20 or 30 Hz. In addition, the majority of these fast-spiking cells (88%) display a peculiar pattern of rhythmic discharge characterized by recurring ‘clusters’ of spikes interspersed with subthreshold membrane-potential oscillations. In none of the cluster-discharge and/or fast-spiking biocytin-filled cells was ChAT immunostaining evident by either peroxidase or fluorescence tech- niques, and in most, ChAT immunostaining could unequivocally be established as negative (Fig. IB). The non-cholinergic cells (n = 19) varied in their shape from fusiform to oval or polygonal, and they ranged in size from 17 to 30 pm, averaging 21.8 pm in large diameter. Of the ChAT-negative cells, 18 were permanently stained by peroxidase labelling, and their location plotted in the basal forebrain (Fig. 2, open circles). The fast-spikingkluster ChAT-negative biocytin-filled neurons were distributed within the larger substantia innominata but concentrated within the region of the magnocellular preoptic nucleus, with a few extending into the region of the nucleus
Low threshold burst cell (Cholinergic)
Low threshold burst cell (Cholinergic)
Cluster cell (Non-cholinergic)
FIG. 3. Camera lucida drawings of electrophysiologically characterized biocytin-labelled cells presumed to be cholinergic and non-cholinergic. The LTB cholinergic cell (right) was situated in the substantia innominata within the area of the magnocellular preoptic nucleus as shown in the schematized drawing of the slice in which this cell was located. The cluster non-cholinergic cell (left) was situated in a similar position as shown by superimposition of the cell onto the drawing of the other slice. Both cells are medium to large in size and multipolar. Only by the predominant orientation of their soma and principal dendrites do the two cells appear to differ. ac, anterior commissure; CPu, caudate-putamen; MS, medial septum; SI, substantia innominata.

Oscillatoxy properties of nucleus basalis neurons 173
A 1
B
2 3 4 I
FIG. 4. Bursting profile of cholinergic neurons. (A) Discharge patterns of a cholinergic neuron activated by constant-current pulse injections at resting level (3). at a hyperpolarized level (4) and at depolarized levels (1 and 2). At rest, an LTB is activated (3). At hyperpolarized levels bursting emerges with a pronounced delay (4, arrowhead) and at a lower threshold (4, arrow). At more depolarized levels the bursting discharge gradually inactivates (2-1). (B) A slow ramp (3 mVls) depolarization triggers a rhythmic discharge (dashed line) comprising LTBs at - -55 mV (enlargement at bottom left). A further minor DC depolarization above -55 mV subsequently triggers single spikes (enlargement at bottom right) in a repetitive sequence.
of the horizontal limb of the diagonal band. In relation to the cholinergic neurons, the sample of non-cholinergic cells were congregated more ventrally within the basal forebrain.
Samples of electrophysiologically identified delayed LTB cho- linergic cells and cluster non-cholinergic cells were processed for biocytin staining alone in order to examine better their somato- dendritic morphology. Camera lucida drawings revealed overlapping variations in cell size, shape and somato-dendritic configuration of the two cell types. Both had multiple (2-7) primary dendrites which branched sparsely near to and at a distance from the soma and extended considerable distances (often to >250 pm by one major dendrite through one 50 pm section). The dendrites of both cell types were relatively smooth and lacked any specialized appendages. The only morphological difference that could be detected between the two electrophysiologically distinct cell types was in their predominant somato-dendritic orientation in the samples of cells drawn (10 cholinergic and eight non-cholinergic cells). The majority (60%) of the LTB cholinergic cells were oriented with the long axis of their soma and major dendrites along a dorsoventral axis and in parallel to perforating blood vessels, whereas only a minority (25%) of the cluster non-cholinergic cells were oriented along this axis (Fig. 3).
Oscillatory properties of LTB cholinergic cells The distinctive feature of the cholinergic cells (n = 75) was their capacity to fire in delayed LTBs. As illustrated by a typical case in
Figure 4, constant current-pulse injection from the resting level (-65 mV) triggered an all-or-none LTB of action potentials followed by a long-lasting large-amplitude AHP (Fig. 4A, trace 3). As the cell was hyperpolarized below -70 mV, larger amplitude depolarizing current pulses were required in order to reach threshold for the LTB (Fig. 4A, trace 4). From this voltage the LTB emerged with a pronounced delay, characteristic of transient outward rectification; the burst exhibited a markedly lower threshold and a higher intra- burst firing frequency. Current pulses applied at moderately depolar- ized levels (- -60 mV) elicited bursts with a small number of spikes and a relatively low intra-burst spike frequency (Fig. 4A, trace 2). Finally, with current pulses applied at more depolarized levels (positive to -55 mV), the bursting mechanism largely appeared inactivated (Fig. 4A, trace 1). The LTB discharge was furthermore distinguished in the cholinergic cells by the manner in which it could be elicited by very slow DC depolarization (Fig. 4B). When the cells were slowly depolarized from their typical resting level to - -55 mV, a rhythmic and occasionally persistent sequence of LTBs developed (Fig. 4B). This bursting behaviour was effectively inactivated by a further minor DC depolarization which gave rise to higher frequency tonic firing. In a sample of these cells (n = 10) the average interburst frequency was 2.84 -C 0.21 Hz (mean 2 SEM; range 2.0-4.2 Hz) and the intraburst interspike interval was 5.03 2 0.29 ms (range 3.55-6.33 ms), corresponding to an average frequency of -200 Hz. The AHPs following LTBs were relatively long, with a mean duration of 383.12 2 33.88 ms (range 267-522 ms) and a mean amplitude of

174 Oscillatory properties of nucleus basalis neurons
> J * L
- m - 1oopA 0 125pA
- 150pA V 175pA
25OpA 0 275pA
'0
2
I 2 0 r n ~ :i: 1 0 2 4 6 8 10 12 14 16 - Interdischarge interval SOOms
FIG. 5. Instantaneous discharge rate versus inter-discharge interval as a function of increasing depolarizing current in cholinergic neurons. (A) Current pulse injection from a negative (-70 mV) voltage level shows (1 ) the voltage responses to a subthreshold (dotted trace, 90 PA) and a threshold (solid trace, 100 PA) current pulse which elicits a rhythmic bursting sequence with little adaptation. (2) A slightly larger depolarizing pulse (125 PA) elicits a rhythmic bursting discharge that evolves into single spiking without a change in discharge frequency. (3) With greater depolarization (2250 PA), the discharge is initiated by a single spike followed after a short latency by a burst. Arrowheads point to the transient outward rectification that occurs with depolarization from this negative voltage level. (B) Plot of instantaneous discharge versus inter-discharge interval at different current-pulse amplitudes. Whereas bursting continues up to the 3rd interval with the smallest current pulse (trace I), it shifts to tonic discharge after the 2nd interval with larger current pulses. The data obtained from the three traces on the left are numbered accordingly in the graph (1-3).
A
A I 0.3~4 5 O O m S
B
-.b ....... I------- A
0.0 0.1 0.2 0.3 0.4 0.5 0.6
I (nA)
FIG. 6. Steady-state firing frequency as a function of injected current in cholinergic neurons. (A) Response of a cholinergic cell to a depolarizing constant current pulse applied to the cell at rest (-65 mV). (B) Plot of the steady-state firing frequency versus injected current (fm. Note that the firing frequency increases up to a plateau at -7.5 Hz.
14.19 2 1.18 mV (range 8.4-19.3 mV). In addition, there was a mean resting membrane potential of -65.13 2 2.10 mV (range -73 to -56 mV), a mean spike amplitude of 69.07 2 2.24 mV (range 56-79 mV), an average spike width of 0.81 2 0.03 ms (range 0.69- 0.97 ms, measured at mid-height), an average input resistance of 110.09 2 10.66 MR (range 48-164 MR) and an average time constant of 8.43 2 0.89 ms (range 4.3-14.3 ms).
Analysis of the input-output relationship of the cholinergic cells by intracellular injection of long-lasting (>1 s) depolarizing current pulses revealed singular discharge properties in these neurons which clearly differentiated them further from non-cholinergic cells (Fig. 5). From a hyperpolarized level, threshold depolarization triggered a repetitive and slow LTB discharge which was associated with minimal adaptation (Fig. 5A, B, trace 1). A further minor increase in current

Oscillatory properties of nucleus basalis neurons 175
A B
.......................
-8OmV 10.7nA
C .....................
....................
80mV J
D
1-L 10.9nA -1.2 -1.0 4.8 4.6 4.4 4.2 0.0 0.2 0.4
200mS I (nA)
FIG. 7. Electrophysiological characterization of non-cholinergic cluster cells. (A) Activation of cluster cells from a hyperpolarized level triggers spiking following a pronounced delayed onset. Firing is preceded by subthreshold membrane-potential oscillations (inset). (B) Depolarization from a depolarized level induces repetitive firing with no delay. The spikes are clustered and separated by subthreshold membrane-potential oscillations. (C) A large and long depolarizing current pulse from -80 mV triggers pronounced clustering discharge preceded by a delay during which subthreshold membrane-potential oscillations emerge (inset), separated by intervals during which the oscillations also occur. (D) Voltage/current (vll) relationship of non-cholinergic cells. The v/l relationship is linear in the aproximate voltage range of -60 to -80 mV. Moderate inward rectification is apparent at more positive and negative voltage levels. The inset illustrates the voltage traces from which the measurements were obtained. Note the absence of time-dependent inward rectification.
intensity (125 PA) triggered an initial rhythmic discharge (Fig. SA, B, trace 2) followed by single spiking. With larger depolarizing current pulses (2250 PA), another discharge pattern emerged which was characterized by the early appearance of a single spike, followed at a very short interval by a slow and short low-threshold burst sequence which developed into rhythmic single spiking at a slightly higher frequency (Fig. SA, B, trace 3). This peculiar discharge pattern was reflected in the instantaneous discharge rate versus inter-discharge interval by an initial maximal rate followed by a minimal rate and subsequent rise to a plateau as the discharge shifted from bursting to single spiking.
Another distinctive feature of the cholinergic cells is their very low maximal frequency of tonic firing (Fig. 6A, B). Analysis of the repetitive firing properties of these cells by intracellular injection with long ( > I s) depolarizing current pulses of increasing amplitude revealed a maximal steady-state firing frequency which did not exceed 15 Hz in any of the 75 cells of the present sample. Typically, the steady-state firing frequency initially increased with current intensity and then reached a maximal level, often below 10 Hz (Fig. 6B). As the injected current was further increased, the neuron sustained the same firing frequency up to a level of current which subsequently caused cessation of firing. Based upon frequencylcurrent (frr) curves in a sample of cells (n = 4). the average maximum frequency was found to be 9.92 t 1.05 Hz (range 8.2-12.7 Hz).
Oscillatory ptuperties of cluster non-cholinegic cells The cluster non-cholinergic cells (n = 50) were clearly different from the cholinergic cells in many of their properties, including the lack
of delayed low-threshold bursting and the presence of fast AHPs and rapid rates of spiking. The most unusual property of these cells, however, was their capacity to fire in a rhythmic manner involving a distinctive clustered spike discharge interspersed with subthreshold membrane-potential oscillations (Fig. 7). In a sample of these cells (n = lo), the mean AHP had a relatively short duration of 36.11? 3.34 ms (range 24.00-51.00 ms) and a mean amplitude of 14.10 ? 0.80 mV (range 9.W18.00 mV). These cells had a mean resting membrane potential of -58.92 ? 1.86 mV (range -51 to -68 mV), a mean spike amplitude of 65.00 ? 3.16 mV (range 5&77 mV), an average spike width of 0.75 2 0.08 ms (range 0.47-1.30 ms, measured at mid-height), an average input resistance of 97.31 2 11.02 MR (range 51-142 Ma) and an average time constant of 11.72 t 1.84 ms (range 6.60-21 .OO ms).
When a current pulse was applied from a negative voltage level (-80 mV) in the cluster cells, activation often occurred after a marked delay (Fig. 7A). The delayed firing was not observed when the cell was depolarized from a membrane potential less negative than -60 mV (Fig. 7B). This distinctive change in the onset of firing as a function of the resting membrane potential is typical of a voltage- gated transient outward rectifier. As the cells approached firing threshold, subthreshold membrane-potential oscillations were evident preceding the first spike (insets in Fig. 7A, C). With increasing levels of depolarization, the cells discharged in clusters of spikes which were separated by low-amplitude membrane-potential oscillations (Fig. 7B, C). In the study of the voltagelcurrent (vll) relationship, it was apparent that through the voltage range of about -60 to -80 mV it was linear, but at more positive or negative voltages it deviated

176 Oscillatory properties of nucleus basalis neurons
40'
35.
30
25
20
15- <
A B
7 0 1 a IIIJI
i 2 0 1 - . - . - . - . - . - I
0 200 400 600 800 1000 1200
Tme (ms)
45 7 0 osc
0 A.P.
0 A.P. 0 -.*i 0
104 - 1 - I - . - , - , - I - 0.1 0.2 0.3 0.4 0.5 0.6 0.7 I
I0-W .0
FIG. 8. Characterization of spiking and subthreshold oscillations in the non-cholinergic cluster cells. (A) Plot of the frequency of action potentials (A. P.) and oscillations (Osc) as a function of Time elapsed during a depolarizing constant current pulse (inset). Both oscillatory frequency and firing frequency (dotted and continuous lines, respectively) decayed exponentially with time to reach approximately equal frequencies at steady state. Subthreshold oscillations were of about double the frequency of the spiking at the beginning of the trace but decayed with a faster time constant. The inset illustrates one of the traces from which the plot was constructed. (B) Plot of the steady-state frequency of A. P. and Osc as a function of the intensity of depolarizing constant-current pulses. The frequency of the oscillations was similar to that of the spikes and increased linearly with increasing amplitudes of current pulses.
upwards, indicating moderate levels of inward rectification (Fig. 7D). In the further characterization of the subthreshold oscillations and
spiking behaviour in the non-cholinergic cells, their frequency was examined as a function of the time and amplitude of a depolarizing pulse (Fig. 8). With a step depolarization, the frequency of the subthreshold oscillations was higher than the firing frequency at the beginning of the pulse but, together with the firing frequency, decreased exponentially as a function of time to reach a similar rate at steady state. At this steady state, the subthreshold oscillation frequency and spike frequency exhibited almost parallel increases as a function of the intensity of the depolarizing current step (Fig. 8B). In a sample of cluster cells (n = lo), the subthreshold oscillations varied from a minimum of 20 to a maximum of 70 Hz, and the intra- cluster spike frequency varied from a minimum of 20 to a maximum of 80 Hz across a range of increasing current-pulse amplitudes. Under these same conditions, the cluster frequency varied from a minimum of 2 to a maximum of 10 Hz.
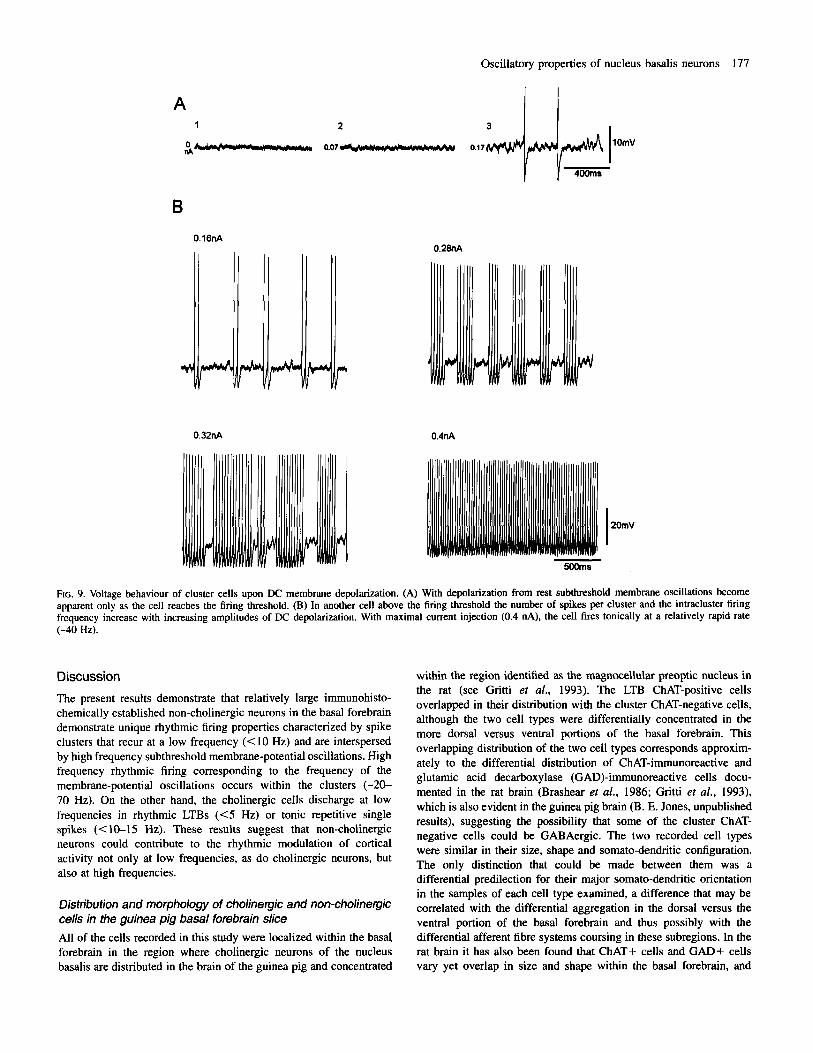
To characterize further the subthreshold membrane oscillatory properties and spike clusters of the non-cholinergic cells, their steady- state membrane voltage behaviour was analysed at different levels of DC current injection (n = 10) (Fig. 9). Clear subthreshold oscillations only developed within a voltage range of --50 to -55 mV, where low frequency spiking also appeared (Fig. 9A). With further depolarization, subthreshold oscillations became prominent between emergent spike clusters (Fig. 9B). The clusters increased in duration and spike number with increasing levels of depolarization, consisting of spike doublets at low levels and multiple spikes at higher levels. The intra-cluster spike frequency also increased with the increase in number of spikes per cluster. At moderate to strong levels of depolarization rapid repetitive firing developed and this became continuous at maximal levels of depolarization.
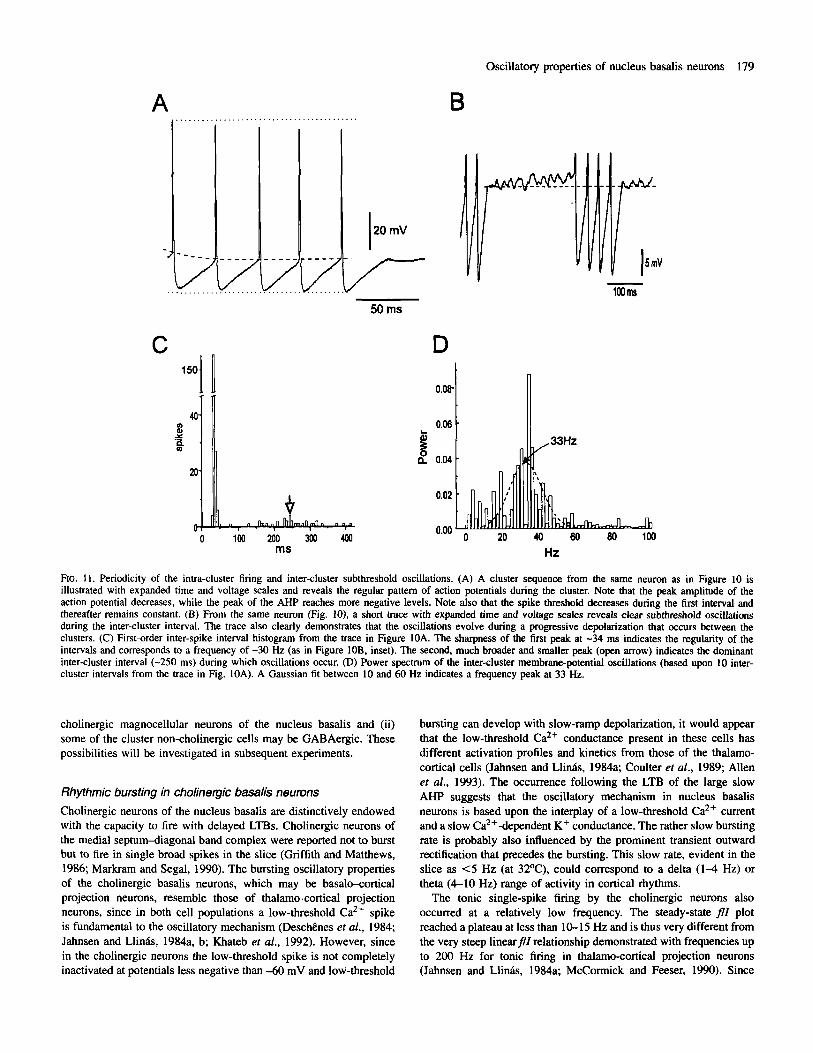
As illustrated in a representative spontaneously active cell (Fig. IOA), the clustering behaviour was highly regular (n = 10). as evident in an autocorrelation histogram constructed with a 10 ms bin size (Fig. IOB), revealing clear rhythmicity with an inter-cluster frequency of -2.5 Hz. Similarly, the intra-cluster spiking was highly regular, as evident in an autocorrelation histogram constructed with a 2 ms bin size (Fig. 10B, inset), revealing rhythmic spiking at a frequency of -30 Hz. Examination of the spike clusters and inter-cluster membrane oscillations on an expanded time and voltage scale (Fig. 11A, B) revealed a correlated rhythmicity of the spiking and subthreshold oscillations (Fig. 1 lC, D). The spike clusters displayed certain conspicuous characteristics (Fig. 1 IA): (i) regularity of the intra- cluster interval; (ii) a progressive decrease in the peak voltage reached by the spikes through the cluster; (iii) a progressive decrease in the spike threshold, most pronounced at the beginning of the cluster; and (iv) a progressive increase in the peak negative voltage reached by the spike AHP through the cluster. The first order interspike interval histogram (Fig. 11C) revealed the sharp peak at 34 ms (as in Fig. lOB), indicating again the regularity of the intra-cluster spiking, followed by a broader peak at 250 ms, indicating the greater variability in the inter-cluster interval (Fig. 1 IC). During the inter-cluster interval, the subthreshold oscillations also appeared to be rhythmic (Fig. 1 IB). It was apparent that during the oscillations a slow progressive depolarization occurred over the course of the inter-cluster interval and leading up to the subsequent spike cluster. Power-spectral analysis of multiple intervals revealed the rhythmicity of the oscillations with a peak frequency (calculated by the Gaussian fit) of -33 Hz (Fig. 11D). As evident from the inter-spike interval frequency histogram and power-spectral curve, the dominant frequency of the cluster spiking was similar to the dominant frequency of the subthreshold oscillations.
Oscillatory properties of nucleus basalis neurons 177
A l l 1 2 3
i w 0.07- 0 . 1 7 m (lonlv
B 0.16nA
0.28nA
0.32nA 0.4nA
FIG. 9. Voltage behaviour of cluster cells upon DC membrane depolarization. (A) With depolarization from rest subthreshold membrane oscillations become apparent only as the cell reaches the firing threshold. (B) In another cell above the firing threshold the number of spikes per cluster and the intracluster firing frequency increase with increasing amplitudes of DC depolarization. With maximal current injection (0.4 nA), the cell fires tonically at a relatively rapid rate (-40 Hz).
Discussion within the region identified as the magnocellular preoptic nucleus in
The present results demonstrate that relatively large immunohisto- chemically established non-cholinergic neurons in the basal forebrain demonstrate unique rhythmic firing properties characterized by spike clusters that recur at a low frequency (<lo Hz) and are interspersed by high frequency subthreshold membrane-potential oscillations. High frequency rhythmic firing corresponding to the frequency of the membrane-potential oscillations occurs within the clusters (-20- 70 Hz). On the other hand, the cholinergic cells discharge at low frequencies in rhythmic LTBs (<5 Hz) or tonic repetitive single spikes (< 10-15 Hz). These results suggest that non-cholinergic neurons could contribute to the rhythmic modulation of cortical activity not only at low frequencies, as do cholinergic neurons, but also at high frequencies.
Distribution and morphology of cholinergic and non-cholinegic cells in the guinea pig basal forebrain slice All of the cells recorded in this study were localized within the basal forebrain in the region where cholinergic neurons of the nucleus basalis are distributed in the brain of the guinea pig and concentrated
the rat (see Gritti et al., 1993). The LTB ChAT-positive cells overlapped in their distribution with the cluster ChAT-negative cells, although the two cell types were differentially concentrated in the more dorsal versus ventral portions of the basal forebrain. This overlapping distribution of the two cell types corresponds approxim- ately to the differential distribution of ChAT-immunoreactive and glutamic acid decarboxylase (GAD)-immunoreactive cells docu- mented in the rat brain (Brashear et al., 1986; Gritti et al., 1993), which is also evident in the guinea pig brain (B. E. Jones, unpublished results), suggesting the possibility that some of the cluster ChAT- negative cells could be GABAergic. The two recorded cell types were similar in their size, shape and somato-dendritic configuration. The only distinction that could be made between them was a differential predilection for their major somato-dendritic orientation in the samples of each cell type examined, a difference that may be correlated with the differential aggregation in the dorsal versus the ventral portion of the basal forebrain and thus possibly with the differential afferent fibre systems coursing in these subregions. In the rat brain it has also been found that ChAT+ cells and GAD+ cells vary yet overlap in size and shape within the basal forebrain, and

178 Oscillatory properties of nucleus basalis neurons
A
B
... I, -1 1 , * . ,,,, ,, "," 1q ." "
1000 ms -1000 ms -500 0 500
FIG. 10. Non-cholinergic cells fire in rhythmic clusters of spikes. (A) Spontaneous and regular discharge of a typical cluster cell. (B) Autocorrelation histogram of the discharge in A constructed with a 10 ms bin (for both positive and negative analysis time) or a 2 ms bin (for positive analysis time, inset). The rhythmic nature of the discharge is documented by the obvious rhythmicity of the autocorrelation histogram. The superimposed dotted line represents a multi-Gaussian fit to the histogram. Note that the cluster peaks are separated by approximately equal intervals of -400 ms with a corresponding inter-cluster frequency of -2.5 Hz. The 2 ms bin autocorrelation histogram (inset) demonstrates the rhythmic character of the intra-cluster firing. Note that the peaks are separated by approximately equal intervals of 34 ms with a corresponding intra-cluster frequency of -30 Hz.
that large ChAT+ and GAD+ cells appear very similar to one another, differing in various regions only according to their major somato-dendritic orientation (Brashear et a/., 1986; Kiss et a/., 1990; Gritti et al., 1993). Both recorded cell types were relatively large and most commonly multipolar. These results suggest that the recorded cells comprise a subpopulation of neurons within the basal forebrain that are most likely projection neurons and very probably those which project to the cerebral cortex, since such cells have been identified as large multipolar cells (Divac, 1975; Ingham er nl., 1985; Semba et al., 1987; Jones et nl., 1995) and have been distinguished from diencephalic- or brainstem-projecting cells that are medium to small in size (Divac, 1975; Gritti et al., 1994). Such a bias toward medium- large and large (> 17 pm) cells in the present sample can be explained by a greater facility in intracellular penetration and recording of relatively large neurons. The existence of large multipolar non-
cholinergic (in addition to cholinergic) cortically projecting cells in the basal forebrain was first documented for cells projecting particularly to olfactory bulbs and limbic cortex (Rye er al., 1984). Like those in the septum projecting to the hippocampus (Kohler er al., 1984; Freund and Antal, 1988), a significant proportion of the non-cholinergic neurons in the magnocellular preoptic region and substantia innomin- ata that project to meso- and iso-cortical regions has also been shown to comprise GABAergic neurons (Zaborszky er a/., 1986; Fisher et a/., 1988; Freund and Meskenaite, 1992; Jones et nl., 1995). It is also known that other non-cholinergic and non-GABAergic basal forebrain neurons project to the cerebral cortex as well (Jones et al., 1995). It is likely that such cells would contain another fast amino acid neurotransmitter, such as glutamate or aspartate. In summary, then, it is possible that (i) the LTB and cluster cells recorded in the present study correspond to cortically projecting cholinergic and non-
A
40-
'5 '
20-
t X
UJ
,..". . . . . . . . . . . . . . . . . . . . . . . . . . . . . . . . . .
Oscillatory properties of nucleus basalis neurons 179
B
50 ms
D 0.08
0.06 8 a 0.04
0.02
n
0 2 0 4 0 60 8 0 1 0 0 HZ
FIG. 11. Periodicity of the intra-cluster firing and inter-cluster subthreshold oscillations. (A) A cluster sequence from the same neuron as in Figure 10 is illustrated with expanded time and voltage scales and reveals the regular pattern of action potentials during the cluster. Note that the peak amplitude of the action potential decreases, while the peak of the AHP reaches more negative levels. Note also that the spike threshold decreases during the first interval and thereafter remains constant. (B) From the same neumn (Fig. 10). a short trace with expanded time and voltage scales reveals clear subthreshold oscillations during the inter-cluster interval. The trace also clearly demonstrates that the oscillations evolve during a progressive depolarization that occurs between the clusters. (C) First-order inter-spike interval histogram from the trace in Figure IOA. The sharpness of the first peak at -34 ms indicates the regularity of the intervals and corresponds to a frequency of -30 Hz (as in Figure IOB, inset). The second, much broader and smaller peak (open arrow) indicates the dominant inter-cluster interval (-250 ms) during which oscillations occur. (D) Power spectrum of the inter-cluster membrane-potential oscillations (based upon 10 inter- cluster intervals from the trace in Fig. IOA). A Gaussian fit between 10 and 60 Hz indicates a frequency peak at 33 Hz.
cholinergic magnocellular neurons of the nucleus basalis and (ii) some of the cluster non-cholinergic cells may be GABAergic. These possibilities will be investigated in subsequent experiments.
Rhythmic bursting in cholinegic basalis neurons Cholinergic neurons of the nucleus basalis are distinctively endowed with the capacity to fire with delayed LTBs. Cholinergic neurons of the medial septum-diagonal band complex were reported not to burst but to fire in single broad spikes in the slice (Griffith and Matthews, 1986; Markram and Segal, 1990). The bursting oscillatory properties of the cholinergic basalis neurons, which may be basalwortical projection neurons, resemble those of thalamo-cortical projection neurons, since in both cell populations a low-threshold CaZf spike is fundamental to the oscillatory mechanism (Deschknes et al., 1984; Jahnsen and Llinhs, 1984a, b; Khateb et al., 1992). However, since in the cholinergic neurons the low-threshold spike is not completely inactivated at potentials less negative than -60 mV and low-threshold
bursting can develop with slow-ramp depolarization, it would appear that the low-threshold Ca2+ conductance present in these cells has different activation profiles and kinetics from those of the thalamo- cortical cells (Jahnsen and Llinh, 1984a; Coulter et al., 1989; Allen et al., 1993). The occurrence following the LTB of the large slow AHP suggests that the oscillatory mechanism in nucleus basalis neurons is based upon the interplay of a low-threshold Ca2+ current and a slow Ca2+-dependent K+ conductance. The rather slow bursting rate is probably also influenced by the prominent transient outward rectification that precedes the bursting. This slow rate, evident in the slice as <5 Hz (at 32OC), could correspond to a delta (1-4 Hz) or theta (4-10 Hz) range of activity in cortical rhythms.
The tonic single-spike firing by the cholinergic neurons also occurred at a relatively low frequency. The steady-state $7 plot reached a plateau at less than 10-15 Hz and is thus very different from the very steep linearfll relationship demonstrated with frequencies up to 200 Hz for tonic firing in thalamo-cortical projection neurons (Jahnsen and LlinBs, 1984a; McCormick and Feeser, 1990). Since
180 Oscillatory properties of nucleus basalis neurons
acetylcholine is known to have a very slow excitatory effect upon cortical cells (Metherate et al., 1992), the slow tonic (like the slow phasic) activity of the cholinergic neurons may be appropriate for pacing this slow modulatory action.
Rhythmic clustering of spike discharge in non-cholinergic cells The non-cholinergic cells were clearly distinct from the cholinergic cells recorded in the guinea pig basal forebrain slice since at rest or upon DC depolarization most of them expressed a peculiar rhythmic pattern consisting of non-adapting spike clusters interspersed with low amplitude membrane-potential oscillations at relatively high frequencies. As a corollary to their relatively fast spiking rate, these cells had relatively fast AHPs, which have also been described in non- cholinergic cells within the medial septum4iagonal band complex (Griffith and Matthews, 1986; Markram and Segal, 1990). However, the non-adapting spike clusters and rhythmic subthreshold membrane- potential oscillations that we have described in the non-cholinergic cells of the substantia innominata have not been described in those cells of the medial septum-diagonal band complex. The spike clusters in the basalis cells occurred at a relatively low frequency (< 10 Hz) and the spikes and oscillations at a relatively high frequency (20- 70 Hz). The cluster frequency (2-10 Hz) corresponds to a delta or theta range (20-70 Hz), whereas the intra-cluster and tonic spike frequencies ( 1 4 and 4-10 Hz respectively) correspond to a high beta to gamma range (19-30 and 30-60 Hz respectively) of electro- encephalographic activity.
Rhythmic non-adapting spike clusters interspersed by rhythmic membrane-potential oscillations have to our knowledge only been previously described in the stellate cells of layer I1 within the entorhinal cortex (Alonso and Klink, 1993). In the stellate cells persistent subthreshold membrane-potential oscillations first develop at -5-10 mV below firing threshold and occur at a slow frequency within the theta range at this level (Alonso and Llinis, 1989; Alonso and Klink, 1993). The relatively fast subthreshold oscillations in the non-cholinergic basalis neurons emerge at rheobase and are thus accompanied by spiking, suggesting that they may depend upon different mechanisms from those in the stellate cells. In the basalis cells the progressive decline of the peak voltages during the spike cluster and the progressive increase of the membrane potential during the inter-cluster interval suggest that the transient outward rectification displayed by these non-cholinergic neurons may be an important factor in determining the spike clustering, particularly for the duration of the spike-cluster and inter-cluster interval.
Spiking in the non-cholinergic cells arises from the peak of and occurs at approximately the same frequency as the low amplitude membrane-potential oscillations, suggesting that the spike timing and frequency are largely determined by the intrinsic oscillations. High frequency subthreshold membrane-potential oscillations and correla- ted high-frequency firing (though not rhythmic spike clusters) have also been described in cortical interneurons in vitro (Llinis et al., 1991), and in thalamic reticularis neurons (Pinault and Deschgnes, 1992) and relay neurons in vivo (Steriade et al., 1991b). Each of these cell groups utilizes fast-acting amino acid neurotransmitters: GABA in the case of the cortical interneurons and thalamic reticularis neurons, and glutamate or aspartate in the case of the thalamo-cortical neurons (Ottersen and Storm-Mathisen, 1984). It has been proposed that resonant local and distant circuits of thalamic and cortical neurons may interact to entrain coherent high-frequency gamma-wave activity within thalamo-cortico-thalamic loops (Ribary et al., 1992; Llinks and Ribary, 1993). Cortical gamma activity can be elicited by brainstem stimulation, which has been shown to be transmitted to the
cortex through the thalamus (Steriade et al., 1991b). The brainstem reticular-activating system also projects to the basal forebrain, as the ventral extra-thalamic relay to the cerebral cortex (for review see Jones, 1995), and microinjection into the basal forebrain of agonists contained in the brainstem afferents stimulates gamma activity in the cerebral cortex (Cape and Jones, 1994). The results of the present study would suggest that the fast-spiking non-cholinergic neurons of the nucleus basalis could contribute to oscillating circuits, enhancing coherence of cortical activity in the gamma frequency range. More- over, by virtue of the tendency of the non-cholinergic basalis neurons to fire in rhythmic spike clusters, these cells might introduce a slower rhythmic oscillation that could more effectively coordinate large populations of widely distributed cells, while at the same time carrying the faster frequency oscillation. A high frequency oscillation riding upon a slower oscillation was originally described in vivo from field potentials recorded in association with the theta rhythm in the hippocampus (Stumpf, 1965).
Functional implications of the rhythmic oscillations in cholinergic and non-cholinergic basalis neurons Our results demonstrate that a large proportion of non-cholinergic, in addition to cholinergic, basal forebrain neurons display prominent intrinsic oscillatory properties. Both fire rhythmically at low frequen- cies, even though the low-threshold bursting of the cholinergic cells and the cluster discharge of the non-cholinergic cells depend upon different intrinsic properties. It would nevertheless be possible that these two cell populations could fire in a coordinated manner at low frequencies in vivo. Coordinated rhythmic firing by different cell populations has been described by using in vivo extracellular recording in the medial septum, where two populations of units discharge rhythmically -180" out of phase with each other and in relationship to hippocampal theta waves (Gaztelu and Buno, 1982). Although evidence from in vivo extracellular recording studies in the basal forebrain suggests that some basalis neurons may fire in a rhythmic manner in association with particular sleepwake state activity (Detari et al., 1984, 1987; Detari and Vanderwolf, 1987; Buzsiki et al., 1988; Szymusiak and McGinty, 1989), precise identification of such cells as cholinergic or non-cholinergic will be necessary to interpret such evidence in light of the present in vitro findings.
Both the cholinergic and non-cholinergic neurons recorded in the slice were relatively large cells and therefore probably correspond to cortical projection neurons. It is possible that some of the non- cholinergic magnocellular basalis neurons could be GABAergic. Concerted rhythmic activity from these cholinergic and non- cholinergic neurons could modulate the cerebral cortex in a slow rhythmic manner while also pacing high-frequency activity. Coherent firing of cell populations, as has been demonstrated to occur in thalamo-cortical systems (Steriade et al., 1991a, 1993), remains to be demonstrated for basalo-cortical systems in order to prove their role in synchronized forebrain rhythms. Nonetheless, given the demonstrated collective oscillatory properties of the incumbent neurons, we consider it reasonable to propose that the nucleus basalis could be implicated in theta and gamma forebrain oscillations. It is perhaps because of the collective oscillatory properties that the nucleus basalis is so important for normal processes of cortical activation, attention and memory (for review see Dunnett et al., 1991), which are subtended by both slow theta- and fast gamma- rhythmic activity (Buzsiki et al., 1983; Larson et al., 1986; Bressler, 1990; Singer, 1993; Gray, 1994). Accordingly, both the cholinergic and non-cholinergic basalis neurons could be involved in the temporal

Oscillatory properties of nucleus basalis neurons 18 1
coordination of neuronal activity underlying attentional or mnemonic processing in the forebrain.
Acknowledgements We thank Lynda Mainville and Daniele Machard for their excellent technical assistance. This work was supported by grants from the Medical Research Council of Canada (to A. A. and to B. E. J.) and from the Swiss Fonds National, Sandoz and Roche Foundations (to M. M.). P. F. was supported by grants from the Fondation Fyssen and La Rigion RhBne-Alpes.
Abbreviations ABC AHP BDHC ChAT DAB GABA GAD HRP LTB
avidin-biotin complex afterhyperpolarization benzidine dihydrochloride choline acetyltransferase diaminobenzidine gamma-aminobutyric acid glutamic acid decarboxylase horseradish peroxidase low-threshold burst
References Allen, T. G. J., Sim, J. A. and Brown, D. A. (1993) The whole-cell calcium
current in acutely dissociated magnocellular cholinergic basal forebrain neurones of the rat. J. Physiol. (Land.), 460, 91-116.
Alonso, A., Faure, M.-P. and Beaudet, A. (1994) Neurotensin promotes oscillatory bursting behavior and is internalized in basal forebrain cholinergic neurons. J. Neurosci., 14, 5778-5792.
Alonso, A. and Klink, R. (1 993) Differential electroresponsiveness of stellate and pyramidal-like cells of medial entorhinal cortex layer 11. J. Neumphysiol., 70, 128-143.
Alonso, A. and Llinis, R. R. (1989) Subthreshold Na+-dependent theta-like rhythmicity in stellate cells of entorhinal cortex layer 11. Nature, 342, 175-1 77.
Brashear, H. R., Zaborszky, L. and Heimer. L. (1986) Distribution of GABAergic and cholinergic neurons in the rat diagonal band. Neuroscience, 17, 43945 1.
Bressler, S. L. ( 1990) The gamma wave: a cortical information carrier. Trends Neurosci., 13, 161-162.
Buzsiki, G., Leung, L.-W. S. and Vandenvolf, C. H. (1983) Cellular bases of hippocampal EEG in the behaving rat. Bruin Res. Rev., 6, 139-171.
Buzsiki, G., Bickford, R. G., Ponomareff, G., Thal, L. J., Mandel, R. and Gage, F. H. (1988) Nucleus basalis and thalamic control of neocortical activity in the freely moving rat. J. Neurosci., 8, 4007-4026.
Cape, E. and Jones, B. E. (1994) Modulation of sleep-wake state and cortical activity following injections of agonists into the region of cholinergic basal forebrain neurons. Soc. Neurosci. Absrc, 20, 156.
Coulter, D. A,, Huguenard, J. R. and Prince, D. A. (1989) Calcium currents in rat thalamocortical relay neurones: kinetic properties of the transient, low-threshold current. J. Physiol., 414, 587-604.
Deschhes, M., Paradis, M., Roy, J. P. and Steriade, M. (1984) Electrophysiology of neurons of lateral thalamic nuclei in cat: resting properties and burst discharges. J. Neurophysiol., 51, 11961219.
Detari, L. and Vandenvolf, C. H. (1987) Activity of identified cortically projecting and other basal forebrain neurones during large slow waves and cortical activation. Bruin Res., 437, 1-8.
Detari, L., Juhasz, G. and Kukorelli, T. (1984) Firing properties of cat basal forebrain neurones during sleep-wakefulness cycle. Elecrroenceph. Clin. Neurophysiol., 58, 362-368.
Detari, L., Juhasz, G. and Kukorelli, T. (1987) Neuronal firing in the pallidal region: firing patterns during sleep-wakefulness cycle in cats. Electroenceph. Clin. Neurophysiol., 67, 159-166.
Divac, I. (1975) Magnocellular nuclei of the basal forebrain project to neocortex, brain stem and olfactory bulb. Review of some functional correlates. Bruin Res., 93, 385-398.
Dunnett, S. B., Everitt, B. J. and Robbins, T. W. (1991) The basal forebrain- cortical cholinergic system: interpreting the functional consequences of excitotoxic lesions. Trends Neurosci., 14, 494-501.
Fisher, R. S., Buchwald, N. A,, Hull, C. D. and Levine, M. S. (1988)
GABAergic basal forebrain neurons project to the neocortex: the localization of glutamic acid decarboxylase and choline acetyltransferase in feline corticopetal neurons. J. Comp. Neurol., 272, 489-502.
Freund, T. F. and Antal, M. (1988) GABA-containing neurons in the septum control inhibitory interneurons in the hippocampus. Nurure, 336, 170-173.
Freund, T. F. and Meskenaite, V. (1992) Gamma-aminobutyric acid-containing basal forebrain neurons innervate inhibitory interneurons in the neocortex. Proc. Nurl Acad. Sci. USA, 89,738-742.
Gaztelu, J. M. and Buno, W. Jr (1982) Septo-hippocampal relationships during EEG theta rhythm. Electroenceph. Clin. Neurophysiol., 54, 375-387.
Gray, C. (1994) Synchronous oscillations in neuronal systems: mechanisms and functions. J. Compurur. Neurosci., 1, 11-38.
Gray, C. M., Konig, P., Engel, A. K. and Singer, W. (1989) Oscillatory responses in cat visual cortex exhibit inter-columnar synchronization which reflects global stimulus properties. Nurure, 338, 334-337.
Griffith, W. H. and Matthews, R. T. (1986) Electrophysiology of AChE- positive neurons in basal forebrain slices. Neurosci. Letr., 71, 169-174.
Gritti, I., Mainville, L. and Jones, B. E. (1993) Codistribution of GABA- with acetylcholine-synthesizing neurons in the basal forebrain of the rat. J. Comp. Neurol., 329,438-457.
Gritti, I., Mainville, L. and Jones, B. E. (1994) Projections of GABAergic and cholinergic basal forebrain and GABAergic preoptic-anterior hypothalamic neurons to the posterior lateral hypothalamus of the rat. J. Comp. Neurol.,
Horikawa, K. and Armstrong, W. E. (1988) A versatile means of intracellular labeling: injection of biocytin and its detection with avidin conjugates. J. Neurosci. Methods, 25, 1-1 1.
Ingham, C. A., Bolam, J. P., Wainer, B. H. and Smith, A. D. (1985) A correlated light and electron microscopic study of identified cholinergic basal forebrain neurons that project to the cortex in the rat. J. Comp. Neurol., 239, 176192.
Jahnsen, H. and Llinis, R. (1984a) Electrophysiological properties of guinea- pig thalamic neurones: an in virro study. J. Physiol. (Lond.), 349, 205-226.
Jahnsen, H. and Llinh, R. (1984b) Ionic basis for the electroresponsiveness and oscillatory properties of guinea-pig thalamic neurones in vitro. J. Physiol. (Lond. ), 349, 227-247.
Jones, B. E. (1993) The organization of central cholinergic systems and their functional importance in sleep-waking states. In Cuello, A. C. (ed.) Progress in Bruin Research, Vol. 98, Cholinergic Function and Dysbncrion. Elsevier, Amsterdam, pp. 61-71.
Jones, B. E. (1995) Reticular formation. Cytoarchitecture, transmitters and projections. In Paxinos, G. (ed.), The Rar Nervous Sysrem. Academic Press Australia, New South Wales, pp. 155-171.
Jones, B. E., Mainville, L., Mancia, M. and Gritti, I. (1995) GABAergic and other non-cholinergic basal forebrain neurons project to both meso- and iso-cortical regions in the rat brain. Soc. Neurosci. Abst,:, 21, 1617.
Khateb, A,, Miihlethaler, M., Alonso, A., Serafin, M., Mainville, L. and Jones, B. E. (1992) Cholinergic nucleus basalis neurons display the capacity for rhythmic bursting activity mediated by low threshold calcium spikes. Neuroscience, 51, 489494.
Khateb, A,, Fort, P., Alonso, A., Jones, B. E. and Miihlethaler, M. (1993) Pharmacological and immunohistochemical evidence for a serotonergic input to cholinergic nucleus basalis neurons. Eu,: J. Neurosci., 5, 541-547.
Kiss, J., Patel, A. J., Baimbridge, K. G. and Freund, T. F. (1990) Topographic localization of neurons containing parvalbumin and choline acetyltransferase in the medial septum4iagonal band region of the rat. Neuroscience, 36, 61-72.
Kita, H. and Armstrong, W. (1991) A biotin-compound N-(2- aminoethy1)biotinamide for intracellular labeling and neuronal tracing studies: comparison with biocytin. J. Neurosci. Methods, 37, 141-150.
Kohler, C., Chan-Palay, V. and Wu, J.-Y. (1984) Septal neurons containing glutamic acid decarboxylase immunoreactivity project to the hippocampal region in the rat brain. Anur. Embryol., 169, 41-44.
Larson, J., Wong. D. and Lynch, G. (1986) Patterned stimulation at the theta frequency is optimal for the induction of hippocampal long-term potentiation. Bruin Res., 368, 347-350.
Llinis, R. and Ribary, U. (1993) Coherent 4@Hz oscillation characterizes dream state in humans. Proc. Nurl Acud. Sci. USA, 90, 2078-2081.
Llinds, R. R. (1988) The intrinsic electrophysiological properties of mammalian neurons: insights into central nervous system function. Science, 242, 16541664.
Llinds, R. R., Grace, A. A. and Yarom, Y. (1991) In vitro neurons in mammalian cortical layer 4 exhibit intrinsic oscillatory activity in the 10- to 50-Hz frequency range. Proc. Nut1 Acad. Sci. USA, 88, 897-901.
Markram, H. and Segal, M. (1990) Electrophysiological characteristics of
339, 25 1-268.

182 Oscillatory properties of nucleus basalis neurons
cholinergic and non-cholinergic neurons in the rat medial septum-diagonal band complex. Bruin Res., 513, 171-174.
McCormick, D. A. and Feeser, H. R. (1990) Functional implications of burst firing and single spike activity in lateral geniculate relay neurons. Neuroscience, 39, 103-1 13.
Metherate, R., Cox, C. L. and Ashe, J. H. (1992) Cellular bases of neocortical activation: modulation of neural oscillations by the nucleus basalis and endogenous acetylcholine. J. Neurosci., 12, 4701471 1.
MUhlethaler, M., Khateb, A., Fort, P., Jones, B. E. and Alonso, A. (1992) Forty Hz membrane potential oscillations and theta-like activity in basal forebrain neurones. Neurosci. Absa , 18, 197.
Ottersen, 0. P. and Storm-Mathisen, J. (1984) Glutamate- and GABA- containing neurons in the mouse and rat brain, as demonstrated with a new immunocytochemical technique. J. Comp. Neurol., 229, 374-392.
Pinault, D. and Deschknes, M. (1992) Voltage-dependent 4@Hz oscillations in rat reticular thalamic neurons in vivo. Neuroscience, 51, 245-258.
Ribary, U., Ioannides, A. A., Singh, K. D., Hasson, R., Bolton, J. P. R., Lado, F., Mogilner, A. and Llinls, R. (1992) Magnetic field tomography of coherent thalamocortical 4@Hz oscillations in humans. Proc. Nut1 Acad. Sci. USA, 89, 11037-11041.
Rye, D. B., Wainer, B. H., Mesulam, M.-M., Mufson, E. J. and Saper, C. B. (1984) Cortical projections arising from the basal forebrain: a study of cholinergic and noncholinergic components employing combined retrograde tracing and immunohistochemical localization of choline acetyltransferase. Neuroscience, 13, 627-643.
Semba, K., Reiner, P. B., McGeer, E. G. and Fibiger, H. C. (1987) Morphology of cortically projecting basal forebrain neurons in the rat as revealed by intracellular iontophoresis of horseradish peroxidase. Neuroscience, 20, 6 3 7 6 5 1.
Singer, W. ( 1 993) Synchronization of cortical activity and its putative role in information processing and learning. Annu. Rev. Physiol., 55, 349-374.
Steriade, M., Curro Dossi, R. and Nunez, A. (1991a) Network modulation of a slow intrinsic oscillation of cat thalamocortical neurons implicated in sleep delta waves, cortically induced synchronization and brainstem cholinergic suppression. J. Neurosci., 11, 3200-3217.
Steriade, M., Curro Dossi, R., Pare, D. and Oakson, G. (1991b) Fast oscillations (2040Hz) in thalamocortical systems and their potentiation by mesopontine cholinergic nuclei in the cat. Proc. Narl Acad. Sci. USA, 88, 43964400.
Steriade, M., Contreras, D., Curro Dossi, R. and Nunez, A. (1993) The slow (< 1 Hz) oscillation in reticular thalamic and thalamocortical neurons: scenario of sleep rhythm generation in interacting thalamic and neocortical networks. J. Neurosci., 13, 3284-3299.
Stumpf, C. (1965) The fast component in the electrical activity of rabbit’s hippocampus. Electroenceph. Clin. Neurophysiol., 18, 477486.
Szymusiak, R. and McGinty, D. (1989) Sleep-waking discharge of basal forebrain projection neurons in cats. Bruin Res. Bull., 22, 423-430.
Zaborszky, L., Carlsen, J., Brashear, H. R. and Heimer, L. (1986) Cholinergic and GABAergic afferents to the olfactory bulb in the rat with special emphasis on the projection neurons in the nucleus of the horizontal limb of the diagonal band. J . Comp. Neurol., 243,488-509.
Copyright © 2022 FDOKUMEN