
Differential impact of chronic ozone exposure on expanding and fully expanded poplar leaves
18
Differential impact of chronic ozone exposure on expanding and fully expanded poplar leaves SACHA BOHLER, 1,2 KJELL SERGEANT, 1 ISABELLE LEFÈVRE , 1 YVES JOLIVET, 2 LUCIEN HOFFMANN, 1 JENNY RENAUT, 1 PIERRE DIZENGREMEL 2 and JEAN-FRANCOIS HAUSMAN 1,3 1 Department of Environment and Agro-biotechnologies, CRP-Gabriel Lippmann, 41 rue du Brill, L-4422 Belvaux, GD Luxembourg 2 Nancy-Université, UMR 1137 Ecologie et Ecophysiologie Forestières, F-54506 Vandoeuvre-lès-Nancy, France 3 Corresponding author ([email protected]) Received April 9, 2010; accepted August 16, 2010; handling Editor Marc Abrams Summary Populus tremula L. × Populus alba L. (Populus×canescens (Aiton) Smith) — clone INRA 717- 1-B4 saplings (50 cm apex to base and carrying 19 leaves on average) — were followed for 28 days. Half of the trees were grown in charcoal-filtered air while the other half were exposed to 120 ppb ozone for 11 h a day during the light period. The expanding leaf number 4 was tagged at the beginning of the experiment and finished expansion between 7 and 14 days. These leaves were harvested weekly for biochemical and proteome analyses using quantitative bidimensional electrophoresis (DiGE). Independent of the ozone treatment, all the analyses allowed a distinction between expanding and adult leaves. The results indicate that during the expansion phase (Days 0–7) the enzymatic machinery of the leaves is set up, and remains dynamically stable in the adult leaves (Days 14–28). Although ozone had no apparent effect on expanding leaves, the metabolic stability in fully expanded leaves observed in ozone-free plants was disturbed after 2 weeks of exposure and a stress- induced response became apparent. Keywords: air pollution, biochemistry, difference in gel electrophoresis (DiGE), photosynthesis, primary carbon metabolism, proteomics. Introduction The formation of leaves, the site of photosynthesis and thus the source from which the plant draws the energy for its life cycle, is an important event in plant development. Leaf for- mation can be divided into three phases: (i) leaf initiation at the site of the shoot apical meristem, which can be followed by bud dormancy, (ii) development to the state of a fully expanded adult leaf and finally (iii) senescence and abscis- sion. Among these three phases, leaf initiation and senescence are well studied in model plants such as Arabidopsis (initiation and senescence) (Grbic and Bleecker 1995, Buchanan-Wollaston et al. 2005) and poplar (mainly senescence) (Keskitalo et al. 2005); however, fewer studies focus on leaf expansion. The process of leaf initiation is tightly controlled (Fleming 2005) by multiple genes (Schoof et al. 2000, Saiga et al. 2008) and auxin fluxes (Benkova et al. 2003, Reinhardt et al. 2003). In the process of senescence initiation, several growth regulators (e.g. ethylene, salicylic acid and jasmonic acid) can be involved (Grbic and Bleecker 1995, Buchanan-Wollaston et al. 2005, Reinbothe et al. 2009). Like leaf initiation, senescence is tightly regu- lated (Hopkins et al. 2007), allowing the plant to recycle carbon and nitrogen (Andersson et al. 2004) before leaf abscission. Information about the physiological and biochemical vari- ation of a leaf between initiation and senescence is only poorly represented in the literature. It was shown that the photosynthetic rate increases in expanding leaves, that chlor- ophyll accumulates and that respiration is highest during the expansion phase (Kennedy and Johnson 1981, Reich 1983). There are some reports about the control underlying leaf shape development (Eshed et al. 2001), but only very few describe the metabolic changes in leaves during expansion and adult leaf life (Maayan et al. 2008). Tropospheric ozone is a secondary pollutant formed by the decomposition of nitric oxides under solar UV radiation, a decomposition catalyzed by a number of other atmos- pheric components such as volatile organic compounds and hydroxy radicals (Oke 1987). During the industrialization age, background concentrations and the number and inten- sity of peak episodes of ozone have increased. As recently reviewed, ozone has a negative effect on plants (Tkacz et al. 2008, Fuhrer 2009, Renaut et al. 2009). Ozone enters the leaves through the stomata and, upon contact with the apo- plast, the molecule degrades into reactive oxygen species Tree Physiology 30, 1415–1432 doi:10.1093/treephys/tpq082 © The Author 2010. Published by Oxford University Press. All rights reserved. For Permissions, please email: [email protected] at Universiteit Maastricht on February 9, 2011 treephys.oxfordjournals.org Downloaded from
-
Upload
healthfoodinnovationmanagement -
Category
Documents
-
view
1 -
download
0
Transcript of Differential impact of chronic ozone exposure on expanding and fully expanded poplar leaves
Differential impact of chronic ozone exposure on expanding and fullyexpanded poplar leaves
SACHA BOHLER,1,2 KJELL SERGEANT,1 ISABELLE LEFÈVRE,1 YVES JOLIVET,2
LUCIEN HOFFMANN,1 JENNY RENAUT,1 PIERRE DIZENGREMEL2
and JEAN-FRANCOIS HAUSMAN1,3
1 Department of Environment and Agro-biotechnologies, CRP-Gabriel Lippmann, 41 rue du Brill, L-4422 Belvaux, GD Luxembourg2 Nancy-Université, UMR 1137 Ecologie et Ecophysiologie Forestières, F-54506 Vandoeuvre-lès-Nancy, France3 Corresponding author ([email protected])
Received April 9, 2010; accepted August 16, 2010; handling Editor Marc Abrams
Summary Populus tremula L. × Populus albaL. (Populus×canescens (Aiton) Smith) — clone INRA 717-1-B4 saplings (50 cm apex to base and carrying 19 leaveson average) — were followed for 28 days. Half of the treeswere grown in charcoal-filtered air while the other half wereexposed to 120 ppb ozone for 11 h a day during the lightperiod. The expanding leaf number 4 was tagged at thebeginning of the experiment and finished expansionbetween 7 and 14 days. These leaves were harvested weeklyfor biochemical and proteome analyses using quantitativebidimensional electrophoresis (DiGE). Independent of theozone treatment, all the analyses allowed a distinctionbetween expanding and adult leaves. The results indicatethat during the expansion phase (Days 0–7) the enzymaticmachinery of the leaves is set up, and remains dynamicallystable in the adult leaves (Days 14–28). Although ozonehad no apparent effect on expanding leaves, the metabolicstability in fully expanded leaves observed in ozone-freeplants was disturbed after 2 weeks of exposure and a stress-induced response became apparent.
Keywords: air pollution, biochemistry, difference in gelelectrophoresis (DiGE), photosynthesis, primary carbonmetabolism, proteomics.
Introduction
The formation of leaves, the site of photosynthesis and thusthe source from which the plant draws the energy for its lifecycle, is an important event in plant development. Leaf for-mation can be divided into three phases: (i) leaf initiation atthe site of the shoot apical meristem, which can be followedby bud dormancy, (ii) development to the state of a fullyexpanded adult leaf and finally (iii) senescence and abscis-sion. Among these three phases, leaf initiation and
senescence are well studied in model plants such asArabidopsis (initiation and senescence) (Grbic and Bleecker1995, Buchanan-Wollaston et al. 2005) and poplar (mainlysenescence) (Keskitalo et al. 2005); however, fewer studiesfocus on leaf expansion.The process of leaf initiation is tightly controlled
(Fleming 2005) by multiple genes (Schoof et al. 2000,Saiga et al. 2008) and auxin fluxes (Benkova et al. 2003,Reinhardt et al. 2003). In the process of senescenceinitiation, several growth regulators (e.g. ethylene, salicylicacid and jasmonic acid) can be involved (Grbic andBleecker 1995, Buchanan-Wollaston et al. 2005, Reinbotheet al. 2009). Like leaf initiation, senescence is tightly regu-lated (Hopkins et al. 2007), allowing the plant to recyclecarbon and nitrogen (Andersson et al. 2004) before leafabscission.Information about the physiological and biochemical vari-
ation of a leaf between initiation and senescence is onlypoorly represented in the literature. It was shown that thephotosynthetic rate increases in expanding leaves, that chlor-ophyll accumulates and that respiration is highest during theexpansion phase (Kennedy and Johnson 1981, Reich 1983).There are some reports about the control underlying leafshape development (Eshed et al. 2001), but only very fewdescribe the metabolic changes in leaves during expansionand adult leaf life (Maayan et al. 2008).Tropospheric ozone is a secondary pollutant formed by
the decomposition of nitric oxides under solar UV radiation,a decomposition catalyzed by a number of other atmos-pheric components such as volatile organic compounds andhydroxy radicals (Oke 1987). During the industrializationage, background concentrations and the number and inten-sity of peak episodes of ozone have increased. As recentlyreviewed, ozone has a negative effect on plants (Tkacz et al.2008, Fuhrer 2009, Renaut et al. 2009). Ozone enters theleaves through the stomata and, upon contact with the apo-plast, the molecule degrades into reactive oxygen species
Tree Physiology 30, 1415–1432doi:10.1093/treephys/tpq082
© The Author 2010. Published by Oxford University Press. All rights reserved.For Permissions, please email: [email protected]
at Universiteit M
aastricht on February 9, 2011
treephys.oxfordjournals.orgD
ownloaded from
(ROS) (Rao et al. 2000). These highly reactive ROS attackcell components such as lipids and proteins, and induce aseries of signaling pathways involving several plant growthregulators (Kangasjärvi et al. 2005, Castagna and Ranieri2009). Reduction in biomass yield, symptoms such aschloroses and necroses on leaves and alterations of metab-olism are typical plant responses to ozone exposure (Guidiet al. 2001, Degl’Innocenti et al. 2002). It is well knownthat the impact that ozone may have on plants depends onthe effective ozone flux, which is a balance between thedegree of stomatal opening and the level of antioxidantdefense (Wieser and Matyssek 2007, Dizengremel et al.2008).In a previous study, we have shown that exposure of
poplar to 120 ppb ozone for 1 month leads to the formationof necroses in adult leaves, but not in expanding ones(Bohler et al. 2007). Variations in carbon metabolism andother cellular functions were clearly visible after14 days of treatment, but nearly absent after only a fewdays, except for ribulose-1,5-bisphosphate carboxylase oxy-genase activase (RuBisCO activase), which decreased asearly as after 3 days (Bohler et al. 2007). It was confirmedthat physiological parameters of photosynthesis and photo-respiration do not change in leaves under expansion underozone stress, and that variations appear only after fullexpansion of the leaves (Bagard et al. 2008).The present study attempts to give an overview of the
proteome changes observed during the development ofleaves upon ozone exposure. These results will be comparedwith the observed changes during normal leaf development.The discussion of the results of this proteomic study will besupported by morphological measurements and biochemicalanalyses of pigments and carbohydrates.
Materials and methods
Plant material and ozone treatment
Plant material was obtained and treated as previouslydescribed (Bohler et al. 2007). Briefly, poplar clones(Populus tremula L. × Populus alba L. (Populus×canescens(Aiton) Smith)—clone INRA 717-1-B4) were multiplied invitro, transferred to a mixture of peat/perlite (Gramoflor SP1Universel), transplanted into 5-l pots containing peat/perlitefertilized with 15 g of slow-release nutritive granules(Nutricote T-100, N/P/K/MgO 13/13/13/2, Fertil, Boulogne-Billancourt, France), and grown at 75/85% relative humidity(day/night) over a 14-h light period (Sun T Agro, Philips,Eindhoven, The Netherlands; intensity: 250–300 µmol m−2
s−1) and at 22/18 ± 2 °C (day/night) for a period of 5 weeks.For the ozone treatment, plants were transposed into eight
fumigation chambers with 10 plants per chamber. Fourchambers were randomly used as controls and four forozone treatment. Control plants were grown in charcoal-filtered air, whereas treated plants were exposed to charcoal-
filtered air supplemented with 120 ppb ozone for 13 h perday during the light period or to charcoal-filtered air forcontrols. All other conditions (humidity, light and tempera-ture) were as described above. Leaf number 4, counted fromthe last leaf emerged at the apex, was tagged at the begin-ning of the treatment on each plant. They are referred to asleaves of interest. Two leaves from each chamber were har-vested for analysis and immediately frozen in liquid nitro-gen after 0, 7, 14, 21 and 28 days of treatment.
Morphological measurements
Growth (height and diameter) and the number of newlyformed leaves were determined for each plant after 0, 7, 14,21 and 28 days of exposure. Height measurement was basedon the length of the stems from the collar to the apex, anddiameter expansion was estimated via measurements of thestem 1.5 cm above the collar with a caliper. The number ofabscised leaves was recorded daily. Concomitantly, visiblesymptoms of ozone treatment (chlorosis and necrosis) wererecorded.The lobe length (petiole excluded) and width of the
leaves of interest were measured on each sampling datebetween 0 and 21 days of treatment. Leaf area was calcu-lated using a formula developed specifically for this poplarclone (Bagard et al. 2008).
Chlorophyll fluorescence
Chlorophyll fluorescence measurements were performed onthe leaf just below the leaf of interest (leaf number 5) with aFluorescence Monitoring System (FMS 1; Hansatech,Norfolk, UK). Leaf clips were attached to target leaves 20min prior to measurements for dark acclimation. The fol-lowing program was created on the FluorescenceMonitoring Software 3.11 based on the default programfrom the manufacturer: gain setting 50, modulating lightintensity setting 1, script logging on. Fv/Fm was measuredfor 2.5 s at an intensity of 90 units with a light pulse of 0.8 s.After 10 s, actinic light was switched on to 30 units, andafter an additional 300 s PhiPSII was measured for 2.5 s atan intensity of 90 units with a light pulse of 0.8 s. Actiniclight was then switched off, and after 10 s Fo
0 was measuredfor 2 s. Three plants per chamber were measured at eachsampling date, amounting to 12 measurements per treatmentper sampling date.
Soluble protein extraction and labeling
Proteins were extracted from one leaf per chamber persampling date, i.e., four leaves per treatment and per date,amounting to four biological replicates. Soluble proteinextraction was carried out as described previously (Kiefferet al. 2009), with small modifications. Briefly, 300 mg offresh leaf material were ground in liquid nitrogen, and pro-teins were suspended in precipitation buffer (20% trichloro-acetic acid (TCA) and 0.1% w/v dithiothreitol (DTT) in
BOHLER ET AL.1416
TREE PHYSIOLOGY VOLUME 30, 2010
at Universiteit M
aastricht on February 9, 2011
treephys.oxfordjournals.orgD
ownloaded from
ice-cold acetone) and washed three times with ice-coldacetone containing 0.1% w/v DTT. Precipitated proteinpellets were freeze dried. Dried samples were re-solubilizedin labeling buffer (7 M urea, 2 M thiourea, 4% w/v 3-[(3-Cholamidopropyl)dimethylammonio]-1-propanesulfonate(CHAPS), 30 mM Tris) and the pH of the supernatant wasadjusted to 8.5. The protein concentration was determinedusing the 2D Quant Kit (GE Healthcare, Little Chalfont,UK) according to the manufacturer’s instructions. Afterextraction, proteins were used for a multiplex analysis byfluorescence difference in gel electrophoresis (DiGE)(Skynner et al. 2002).Protein extracts and a pooled internal standard were
labeled with CyDyes™ (GE Healthcare) prior to electro-phoresis as previously described (Kieffer et al. 2009).Ninety micrograms of proteins (two samples of 30 µg eachand 30 µg of internal standard) were loaded on each gel andseparated by 2D electrophoresis.
Bidimensional electrophoresis
To each sample mix consisting of two samples and theinternal standard and made up to 450 µl with lysis buffer(labeling buffer without Tris), 2.7 µl of Destreak reagent (GEHealthcare), 9 µl of IPG buffer 3–10 NL (GE Healthcare) and5 µl of a saturated bromophenol blue solution were added.Sample loading on ReadyStrip IPG strips pH 3–10 NL, 24cm (Biorad, Hercules, CA, USA), was carried out overnightby passive rehydration. Isoelectric focusing (IEF) was carriedout on an Ettan IPGphor Manifold (GE Healthcare) in anIPGphor IEF unit (GE Healthcare). The following protocolwas used: 150 V for 2 h, 300 V for 2 h, gradient to 1000 Vover 6 h, 1000 V for 1 h, gradient to 8000 V over 4 h, 8000V until �70,000 V h were reached at 20 °C with a maximumcurrent setting of 50 µA per strip. The second dimension wasrun as previously described (Kieffer et al. 2009).Additional preparative gels were run as described above
with 300 µg of an unlabeled protein sample. Glass plateswere pretreated with Bind Silane (GE Healthcare) to guaran-tee adherence of the gels to the glass plates during gelpicking. These gels were poststained with Lava Purple(Fluorotechnics, Sydney, Australia) according to the manu-facturer’s instructions.
Image capture and analysis
The gel images of the different samples were acquired usinga Typhoon Variable Mode Imager 9400 (GE Healthcare) ata resolution of 100 µm according to the instructions pro-vided for each dye. Images were analyzed using theDecyder v6.5.14.1 software (GE Healthcare). Selected spotsof interest (absolute abundance variation of at least 1.5-fold,ANOVA, P < 0.01) were located and a picking list was gen-erated. Spots of interest were excised and digested as pre-viously described (Bohler et al. 2007). MS and MS/MSspectra were acquired using an Applied Biosystems 4800Proteomics Analyzer (Applied Biosystems, Sunnyvale, CA,
USA). Calibration was carried out with the peptide masscalibration kit for 4700 (Applied Biosystems). Proteins wereidentified by searching against the NCBI poplar proteindatabases (downloaded 11 June 2009, 99,629 sequences)and poplar EST (downloaded 11 June 2009, 419,944sequences) using MASCOT (Matrix Science, http://www.matrixscience.com, London, UK). All searches were carriedout allowing for a mass window of 150 ppm for the precur-sor mass and 0.75 Da for fragment ion masses. The searchparameters allowed for carboxyamidomethylation ofcysteine as fixed modification. Oxidation of methionine,oxidation of tryptophan (single oxidation, double oxidationand kynurenin) and pyrrolidone carboxylic acid (N-terminalglutamine and glutamic acid) were set as variable modifi-cations. Homology identification was retained with prob-ability set at 95%.The sub-cellular localization of the proteins was estimated
with the following tools: ChloroP 1.1 Server (http://www.cbs.dtu.dk/services/ChloroP/), MITOPROT (http://ihg2.helmholtz-muenchen.de/ihg/mitoprot.html) and PTS1 predictor (http://mendel.imp.ac.at/mendeljsp/sat/pts1/PTS1predictor.jsp).
Chlorophyll and carotenoid analysis
Pigments were extracted from one leaf per chamber persampling date, i.e. four leaves per treatment and per date,amounting to four biological replicates. Two extracts weremade per sample, amounting to two technical replicates.Pigment extraction was carried out as previously described(Bohler et al. 2007). In order to assess the recovery of themethod, β-apo-80-carotenal was added as the internal stan-dard to the extraction mixture to reach a final concentrationof 20 µg ml-1. Identification and quantification of chloro-phylls and carotenoids were carried out as previouslydescribed (Andre et al. 2007), with some modifications. Agradient system was used involving four mobile phases:eluent A was 100% water, eluent B was 100% acetonitrile,eluent C was 80% methanol v/v with 0.5 M ammoniumacetate at pH 7.2 and eluent D was 100% ethyl acetate. Theflow rate was 1 ml min−1 and the column temperature was26 °C. The gradient elution profile was as previouslydescribed (Kieffer et al. 2009).
Carbohydrate analysis
Carbohydrates were extracted from one leaf per chamber persampling date, i.e. four leaves per treatment and per date,amounting to four biological replicates. Carbohydrate extrac-tion was carried out as previously described (Kieffer et al.2009). Carbohydrates were separated by high-performanceanion exchange chromatography coupled with pulsed ampero-metric detection as previously described (Oufir et al. 2008).
Starch analysis
Extraction was carried out as previously described(Gaucher et al. 2003), with some modifications.
LEAF DEVELOPMENT AND OZONE EXPOSURE 1417
TREE PHYSIOLOGY ONLINE at http://www.treephys.oxfordjournals.org
at Universiteit M
aastricht on February 9, 2011
treephys.oxfordjournals.orgD
ownloaded from
Approximately 100 mg of fresh weight poplar leaves wereground in liquid nitrogen, mixed thoroughly with 750 µl of70% v/v methanol and centrifuged for 10 min at 17,000g at4 °C. The pellet was re-suspended in 750 µl of 70 % v/vmethanol and centrifuged once more. The pellet containingthe starch was then dried for 1 h at 30 °C. Starch was sub-sequently degraded to glucose by adding 500 µl of 2% v/vHCl to the dried pellet and incubated at 99 °C for 2 h. Aftercentrifugation for 10 min at 17,000g and 4 °C, the super-natant was collected.Starch was quantified by a spectrophotometric method
using anthrone reagent. A glucose solution of 1 mg ml−1
was used as a standard. Lysate (5 µl) was mixed with 45 µlof water, 50 µl of 2% v/v HCl and 1.5 ml of anthronereagent (0.15% [w/v] anthrone, 71% v/v sulfuric acid),incubated at 99 °C for 20 min and cooled on ice. The absor-bance was read at 620 nm.
Statistical analysis
Statistical analysis was carried out with the followingnumber of replicates: 4 biological replicates for proteomics,carbohydrates and starch, 4 biological and 2 technical repli-cates for pigment analysis, 12 biological replicates for fluor-escence and 40 biological repetitions for growth, for eachcondition at each sampling date. The proteomic effects ofleaf development were tested with a one-way ANOVA oncontrol samples only. The average ratio was calculated foreach time point versus Day 0. The effects of ozone weretested with a two-way ANOVA, with treatment as factor oneand time as factor two. The average ratio was calculated foreach time point versus its control counterpart. Differentiallyabundant proteins with an absolute ratio of at least 1.5-foldfor minimum one time point and a P-value of <0.01 wereselected. A principal component analysis (PCA) was run forqualitative appreciation of the proteomic results. ANOVAand PCA were performed on Decyder Extended DataAnalysis (v.1.0.14.1). For morphological measurements,carbohydrates, starch and pigments, significance was calcu-lated via a one-way ANOVA, with control/treated as factorsand growth and concentration, respectively, as the response.These analyses were performed on MINITAB StatisticalSoftware v.15.1.1.0.
Results
Morphological measurements
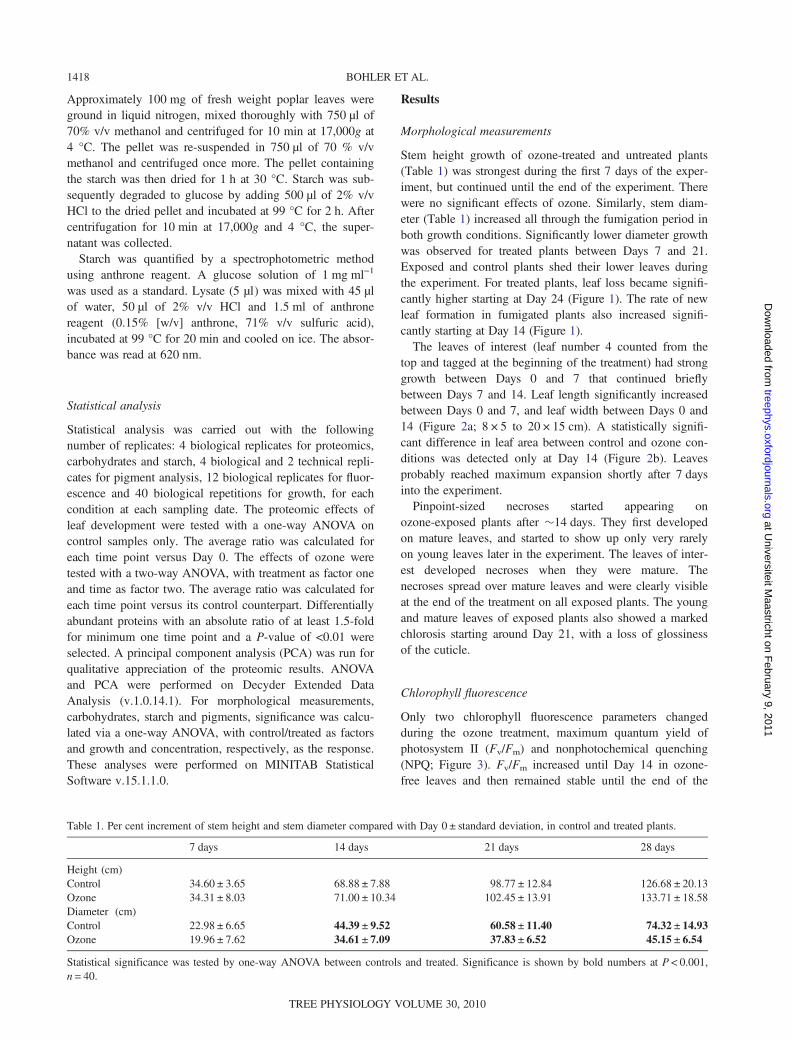
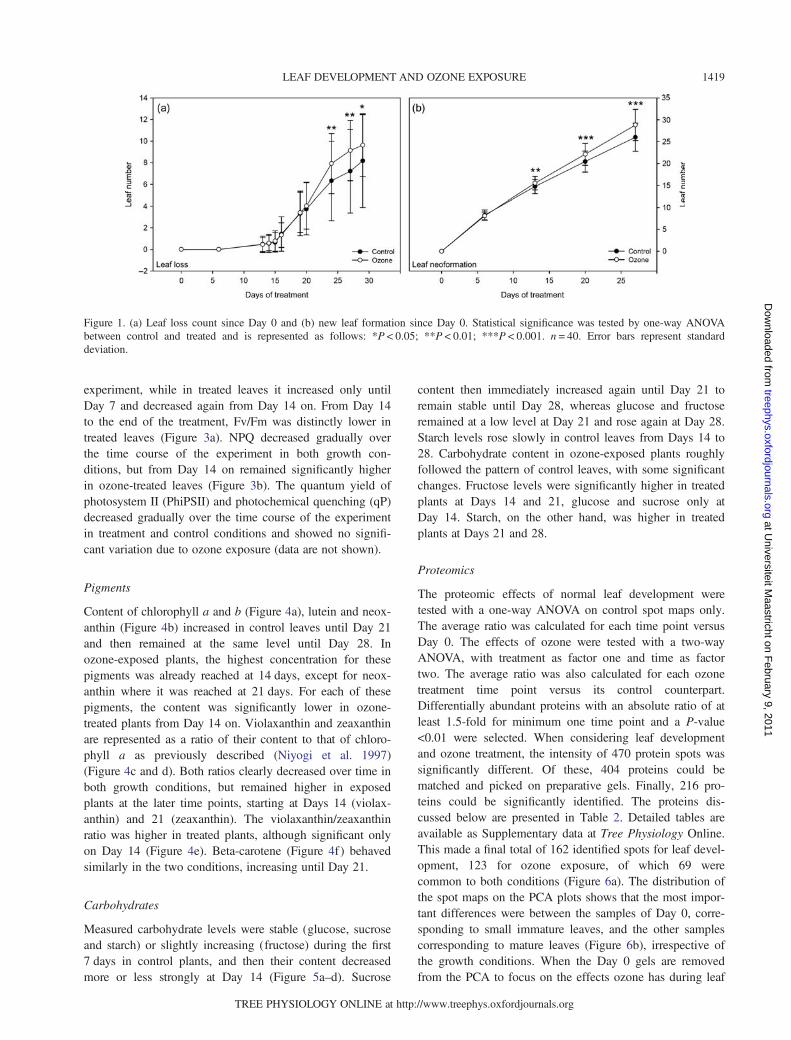
Stem height growth of ozone-treated and untreated plants(Table 1) was strongest during the first 7 days of the exper-iment, but continued until the end of the experiment. Therewere no significant effects of ozone. Similarly, stem diam-eter (Table 1) increased all through the fumigation period inboth growth conditions. Significantly lower diameter growthwas observed for treated plants between Days 7 and 21.Exposed and control plants shed their lower leaves duringthe experiment. For treated plants, leaf loss became signifi-cantly higher starting at Day 24 (Figure 1). The rate of newleaf formation in fumigated plants also increased signifi-cantly starting at Day 14 (Figure 1).The leaves of interest (leaf number 4 counted from the
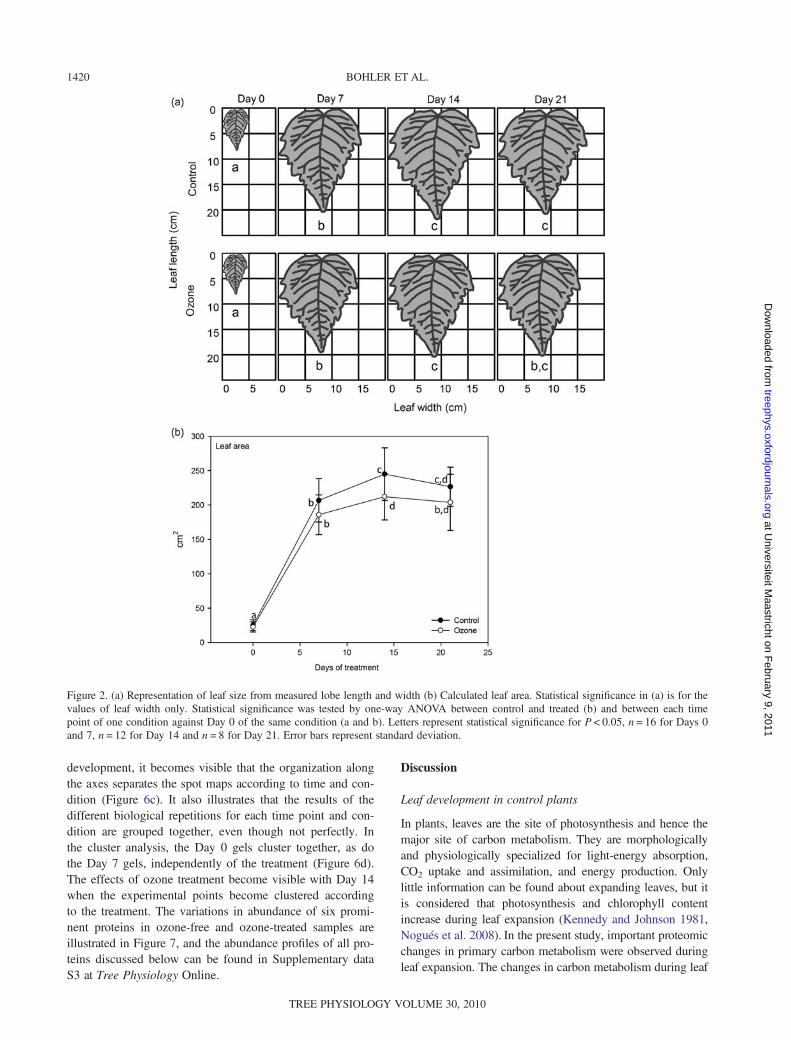
top and tagged at the beginning of the treatment) had stronggrowth between Days 0 and 7 that continued brieflybetween Days 7 and 14. Leaf length significantly increasedbetween Days 0 and 7, and leaf width between Days 0 and14 (Figure 2a; 8 × 5 to 20 × 15 cm). A statistically signifi-cant difference in leaf area between control and ozone con-ditions was detected only at Day 14 (Figure 2b). Leavesprobably reached maximum expansion shortly after 7 daysinto the experiment.Pinpoint-sized necroses started appearing on
ozone-exposed plants after �14 days. They first developedon mature leaves, and started to show up only very rarelyon young leaves later in the experiment. The leaves of inter-est developed necroses when they were mature. Thenecroses spread over mature leaves and were clearly visibleat the end of the treatment on all exposed plants. The youngand mature leaves of exposed plants also showed a markedchlorosis starting around Day 21, with a loss of glossinessof the cuticle.
Chlorophyll fluorescence
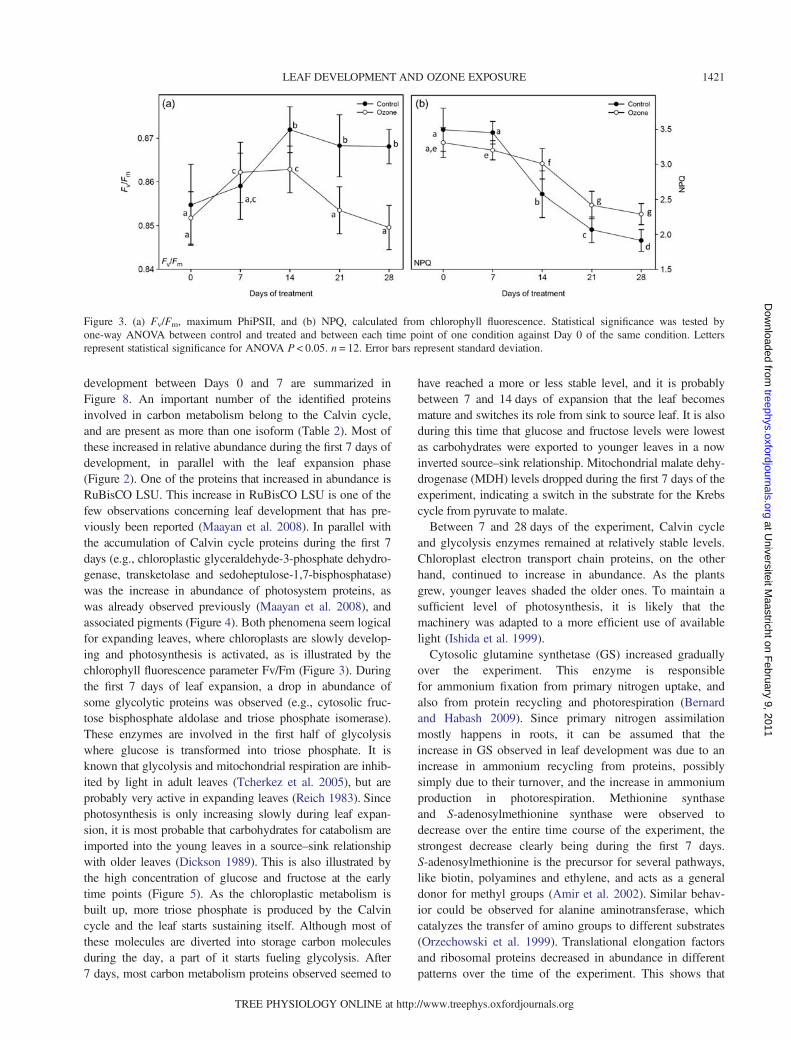
Only two chlorophyll fluorescence parameters changedduring the ozone treatment, maximum quantum yield ofphotosystem II (Fv/Fm) and nonphotochemical quenching(NPQ; Figure 3). Fv/Fm increased until Day 14 in ozone-free leaves and then remained stable until the end of the
Table 1. Per cent increment of stem height and stem diameter compared with Day 0 ± standard deviation, in control and treated plants.
7 days 14 days 21 days 28 days
Height (cm)Control 34.60 ± 3.65 68.88 ± 7.88 98.77 ± 12.84 126.68 ± 20.13Ozone 34.31 ± 8.03 71.00 ± 10.34 102.45 ± 13.91 133.71 ± 18.58Diameter (cm)Control 22.98 ± 6.65 44.39 ± 9.52 60.58 ± 11.40 74.32 ± 14.93Ozone 19.96 ± 7.62 34.61 ± 7.09 37.83 ± 6.52 45.15 ± 6.54
Statistical significance was tested by one-way ANOVA between controls and treated. Significance is shown by bold numbers at P < 0.001,n = 40.
BOHLER ET AL.1418
TREE PHYSIOLOGY VOLUME 30, 2010
at Universiteit M
aastricht on February 9, 2011
treephys.oxfordjournals.orgD
ownloaded from
experiment, while in treated leaves it increased only untilDay 7 and decreased again from Day 14 on. From Day 14to the end of the treatment, Fv/Fm was distinctly lower intreated leaves (Figure 3a). NPQ decreased gradually overthe time course of the experiment in both growth con-ditions, but from Day 14 on remained significantly higherin ozone-treated leaves (Figure 3b). The quantum yield ofphotosystem II (PhiPSII) and photochemical quenching (qP)decreased gradually over the time course of the experimentin treatment and control conditions and showed no signifi-cant variation due to ozone exposure (data are not shown).
Pigments
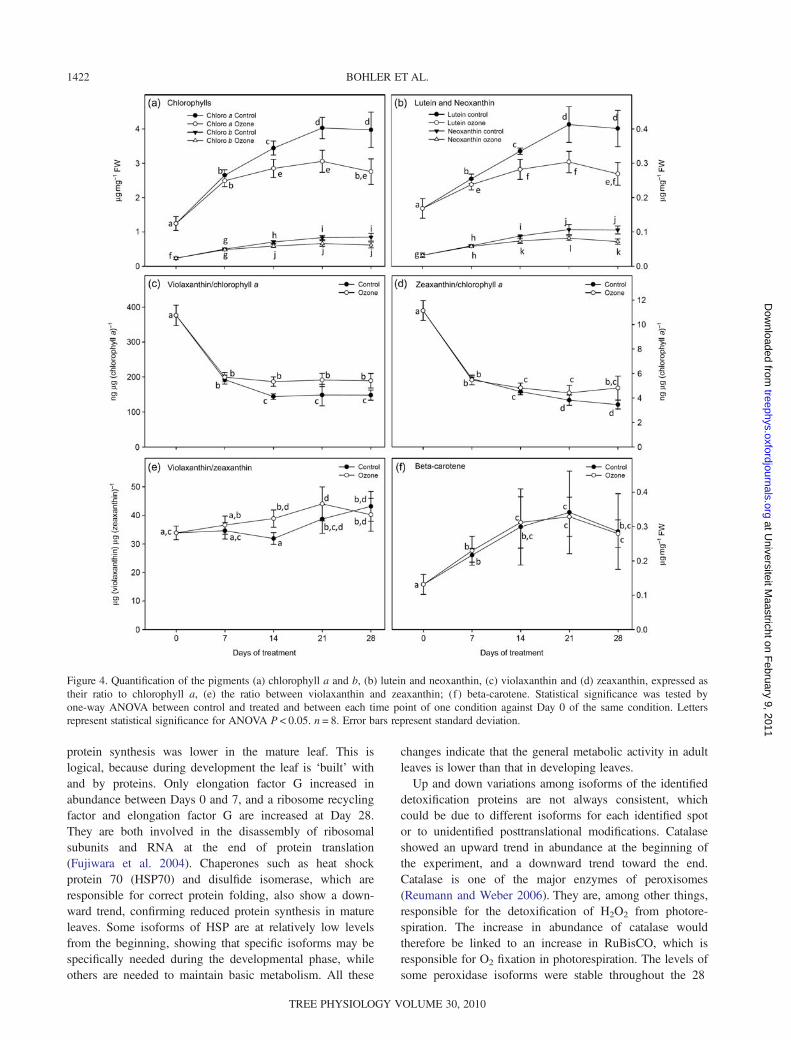
Content of chlorophyll a and b (Figure 4a), lutein and neox-anthin (Figure 4b) increased in control leaves until Day 21and then remained at the same level until Day 28. Inozone-exposed plants, the highest concentration for thesepigments was already reached at 14 days, except for neox-anthin where it was reached at 21 days. For each of thesepigments, the content was significantly lower in ozone-treated plants from Day 14 on. Violaxanthin and zeaxanthinare represented as a ratio of their content to that of chloro-phyll a as previously described (Niyogi et al. 1997)(Figure 4c and d). Both ratios clearly decreased over time inboth growth conditions, but remained higher in exposedplants at the later time points, starting at Days 14 (violax-anthin) and 21 (zeaxanthin). The violaxanthin/zeaxanthinratio was higher in treated plants, although significant onlyon Day 14 (Figure 4e). Beta-carotene (Figure 4f ) behavedsimilarly in the two conditions, increasing until Day 21.
Carbohydrates
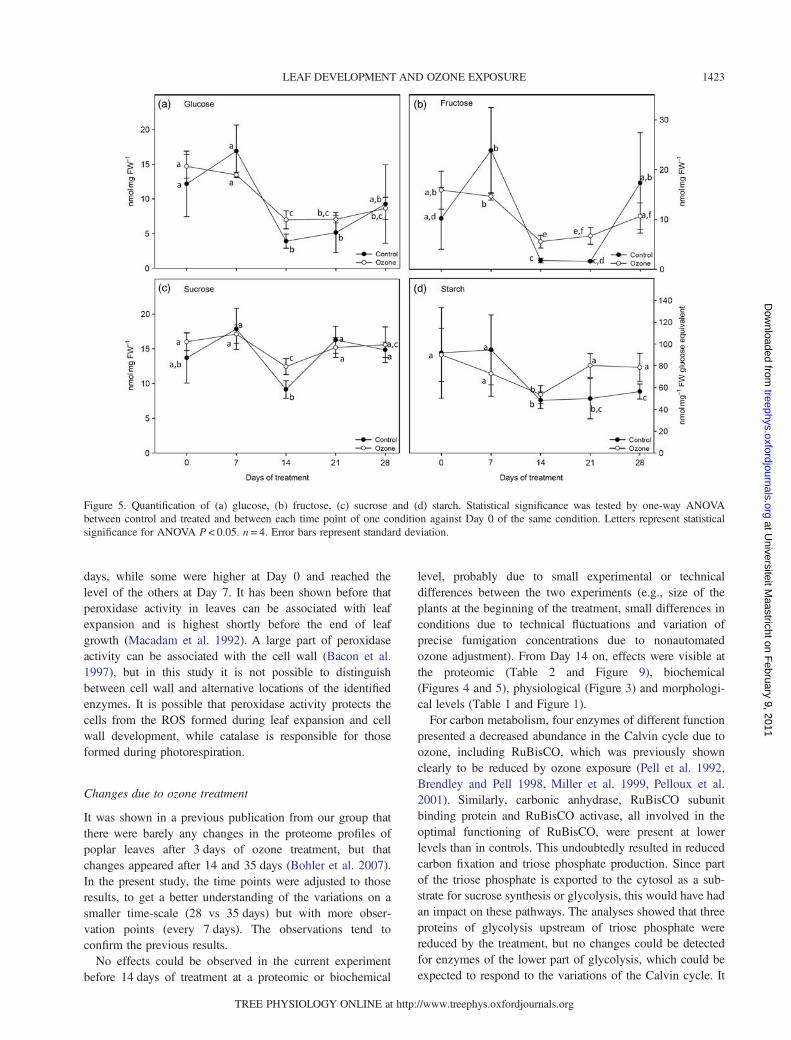
Measured carbohydrate levels were stable (glucose, sucroseand starch) or slightly increasing (fructose) during the first7 days in control plants, and then their content decreasedmore or less strongly at Day 14 (Figure 5a–d). Sucrose
content then immediately increased again until Day 21 toremain stable until Day 28, whereas glucose and fructoseremained at a low level at Day 21 and rose again at Day 28.Starch levels rose slowly in control leaves from Days 14 to28. Carbohydrate content in ozone-exposed plants roughlyfollowed the pattern of control leaves, with some significantchanges. Fructose levels were significantly higher in treatedplants at Days 14 and 21, glucose and sucrose only atDay 14. Starch, on the other hand, was higher in treatedplants at Days 21 and 28.
Proteomics
The proteomic effects of normal leaf development weretested with a one-way ANOVA on control spot maps only.The average ratio was calculated for each time point versusDay 0. The effects of ozone were tested with a two-wayANOVA, with treatment as factor one and time as factortwo. The average ratio was also calculated for each ozonetreatment time point versus its control counterpart.Differentially abundant proteins with an absolute ratio of atleast 1.5-fold for minimum one time point and a P-value<0.01 were selected. When considering leaf developmentand ozone treatment, the intensity of 470 protein spots wassignificantly different. Of these, 404 proteins could bematched and picked on preparative gels. Finally, 216 pro-teins could be significantly identified. The proteins dis-cussed below are presented in Table 2. Detailed tables areavailable as Supplementary data at Tree Physiology Online.This made a final total of 162 identified spots for leaf devel-opment, 123 for ozone exposure, of which 69 werecommon to both conditions (Figure 6a). The distribution ofthe spot maps on the PCA plots shows that the most impor-tant differences were between the samples of Day 0, corre-sponding to small immature leaves, and the other samplescorresponding to mature leaves (Figure 6b), irrespective ofthe growth conditions. When the Day 0 gels are removedfrom the PCA to focus on the effects ozone has during leaf
Figure 1. (a) Leaf loss count since Day 0 and (b) new leaf formation since Day 0. Statistical significance was tested by one-way ANOVAbetween control and treated and is represented as follows: *P < 0.05; **P < 0.01; ***P < 0.001. n = 40. Error bars represent standarddeviation.
LEAF DEVELOPMENT AND OZONE EXPOSURE 1419
TREE PHYSIOLOGY ONLINE at http://www.treephys.oxfordjournals.org
at Universiteit M
aastricht on February 9, 2011
treephys.oxfordjournals.orgD
ownloaded from
development, it becomes visible that the organization alongthe axes separates the spot maps according to time and con-dition (Figure 6c). It also illustrates that the results of thedifferent biological repetitions for each time point and con-dition are grouped together, even though not perfectly. Inthe cluster analysis, the Day 0 gels cluster together, as dothe Day 7 gels, independently of the treatment (Figure 6d).The effects of ozone treatment become visible with Day 14when the experimental points become clustered accordingto the treatment. The variations in abundance of six promi-nent proteins in ozone-free and ozone-treated samples areillustrated in Figure 7, and the abundance profiles of all pro-teins discussed below can be found in Supplementary dataS3 at Tree Physiology Online.
Discussion
Leaf development in control plants
In plants, leaves are the site of photosynthesis and hence themajor site of carbon metabolism. They are morphologicallyand physiologically specialized for light-energy absorption,CO2 uptake and assimilation, and energy production. Onlylittle information can be found about expanding leaves, but itis considered that photosynthesis and chlorophyll contentincrease during leaf expansion (Kennedy and Johnson 1981,Nogués et al. 2008). In the present study, important proteomicchanges in primary carbon metabolism were observed duringleaf expansion. The changes in carbon metabolism during leaf
Figure 2. (a) Representation of leaf size from measured lobe length and width (b) Calculated leaf area. Statistical significance in (a) is for thevalues of leaf width only. Statistical significance was tested by one-way ANOVA between control and treated (b) and between each timepoint of one condition against Day 0 of the same condition (a and b). Letters represent statistical significance for P < 0.05, n = 16 for Days 0and 7, n = 12 for Day 14 and n = 8 for Day 21. Error bars represent standard deviation.
BOHLER ET AL.1420
TREE PHYSIOLOGY VOLUME 30, 2010
at Universiteit M
aastricht on February 9, 2011
treephys.oxfordjournals.orgD
ownloaded from
development between Days 0 and 7 are summarized inFigure 8. An important number of the identified proteinsinvolved in carbon metabolism belong to the Calvin cycle,and are present as more than one isoform (Table 2). Most ofthese increased in relative abundance during the first 7 days ofdevelopment, in parallel with the leaf expansion phase(Figure 2). One of the proteins that increased in abundance isRuBisCO LSU. This increase in RuBisCO LSU is one of thefew observations concerning leaf development that has pre-viously been reported (Maayan et al. 2008). In parallel withthe accumulation of Calvin cycle proteins during the first 7days (e.g., chloroplastic glyceraldehyde-3-phosphate dehydro-genase, transketolase and sedoheptulose-1,7-bisphosphatase)was the increase in abundance of photosystem proteins, aswas already observed previously (Maayan et al. 2008), andassociated pigments (Figure 4). Both phenomena seem logicalfor expanding leaves, where chloroplasts are slowly develop-ing and photosynthesis is activated, as is illustrated by thechlorophyll fluorescence parameter Fv/Fm (Figure 3). Duringthe first 7 days of leaf expansion, a drop in abundance ofsome glycolytic proteins was observed (e.g., cytosolic fruc-tose bisphosphate aldolase and triose phosphate isomerase).These enzymes are involved in the first half of glycolysiswhere glucose is transformed into triose phosphate. It isknown that glycolysis and mitochondrial respiration are inhib-ited by light in adult leaves (Tcherkez et al. 2005), but areprobably very active in expanding leaves (Reich 1983). Sincephotosynthesis is only increasing slowly during leaf expan-sion, it is most probable that carbohydrates for catabolism areimported into the young leaves in a source–sink relationshipwith older leaves (Dickson 1989). This is also illustrated bythe high concentration of glucose and fructose at the earlytime points (Figure 5). As the chloroplastic metabolism isbuilt up, more triose phosphate is produced by the Calvincycle and the leaf starts sustaining itself. Although most ofthese molecules are diverted into storage carbon moleculesduring the day, a part of it starts fueling glycolysis. After7 days, most carbon metabolism proteins observed seemed to
have reached a more or less stable level, and it is probablybetween 7 and 14 days of expansion that the leaf becomesmature and switches its role from sink to source leaf. It is alsoduring this time that glucose and fructose levels were lowestas carbohydrates were exported to younger leaves in a nowinverted source–sink relationship. Mitochondrial malate dehy-drogenase (MDH) levels dropped during the first 7 days of theexperiment, indicating a switch in the substrate for the Krebscycle from pyruvate to malate.Between 7 and 28 days of the experiment, Calvin cycle
and glycolysis enzymes remained at relatively stable levels.Chloroplast electron transport chain proteins, on the otherhand, continued to increase in abundance. As the plantsgrew, younger leaves shaded the older ones. To maintain asufficient level of photosynthesis, it is likely that themachinery was adapted to a more efficient use of availablelight (Ishida et al. 1999).Cytosolic glutamine synthetase (GS) increased gradually
over the experiment. This enzyme is responsiblefor ammonium fixation from primary nitrogen uptake, andalso from protein recycling and photorespiration (Bernardand Habash 2009). Since primary nitrogen assimilationmostly happens in roots, it can be assumed that theincrease in GS observed in leaf development was due to anincrease in ammonium recycling from proteins, possiblysimply due to their turnover, and the increase in ammoniumproduction in photorespiration. Methionine synthaseand S-adenosylmethionine synthase were observed todecrease over the entire time course of the experiment, thestrongest decrease clearly being during the first 7 days.S-adenosylmethionine is the precursor for several pathways,like biotin, polyamines and ethylene, and acts as a generaldonor for methyl groups (Amir et al. 2002). Similar behav-ior could be observed for alanine aminotransferase, whichcatalyzes the transfer of amino groups to different substrates(Orzechowski et al. 1999). Translational elongation factorsand ribosomal proteins decreased in abundance in differentpatterns over the time of the experiment. This shows that
Figure 3. (a) Fv/Fm, maximum PhiPSII, and (b) NPQ, calculated from chlorophyll fluorescence. Statistical significance was tested byone-way ANOVA between control and treated and between each time point of one condition against Day 0 of the same condition. Lettersrepresent statistical significance for ANOVA P < 0.05. n = 12. Error bars represent standard deviation.
LEAF DEVELOPMENT AND OZONE EXPOSURE 1421
TREE PHYSIOLOGY ONLINE at http://www.treephys.oxfordjournals.org
at Universiteit M
aastricht on February 9, 2011
treephys.oxfordjournals.orgD
ownloaded from
protein synthesis was lower in the mature leaf. This islogical, because during development the leaf is ‘built’ withand by proteins. Only elongation factor G increased inabundance between Days 0 and 7, and a ribosome recyclingfactor and elongation factor G are increased at Day 28.They are both involved in the disassembly of ribosomalsubunits and RNA at the end of protein translation(Fujiwara et al. 2004). Chaperones such as heat shockprotein 70 (HSP70) and disulfide isomerase, which areresponsible for correct protein folding, also show a down-ward trend, confirming reduced protein synthesis in matureleaves. Some isoforms of HSP are at relatively low levelsfrom the beginning, showing that specific isoforms may bespecifically needed during the developmental phase, whileothers are needed to maintain basic metabolism. All these
changes indicate that the general metabolic activity in adultleaves is lower than that in developing leaves.Up and down variations among isoforms of the identified
detoxification proteins are not always consistent, whichcould be due to different isoforms for each identified spotor to unidentified posttranslational modifications. Catalaseshowed an upward trend in abundance at the beginning ofthe experiment, and a downward trend toward the end.Catalase is one of the major enzymes of peroxisomes(Reumann and Weber 2006). They are, among other things,responsible for the detoxification of H2O2 from photore-spiration. The increase in abundance of catalase wouldtherefore be linked to an increase in RuBisCO, which isresponsible for O2 fixation in photorespiration. The levels ofsome peroxidase isoforms were stable throughout the 28
Figure 4. Quantification of the pigments (a) chlorophyll a and b, (b) lutein and neoxanthin, (c) violaxanthin and (d) zeaxanthin, expressed astheir ratio to chlorophyll a, (e) the ratio between violaxanthin and zeaxanthin; (f ) beta-carotene. Statistical significance was tested byone-way ANOVA between control and treated and between each time point of one condition against Day 0 of the same condition. Lettersrepresent statistical significance for ANOVA P < 0.05. n = 8. Error bars represent standard deviation.
BOHLER ET AL.1422
TREE PHYSIOLOGY VOLUME 30, 2010
at Universiteit M
aastricht on February 9, 2011
treephys.oxfordjournals.orgD
ownloaded from
days, while some were higher at Day 0 and reached thelevel of the others at Day 7. It has been shown before thatperoxidase activity in leaves can be associated with leafexpansion and is highest shortly before the end of leafgrowth (Macadam et al. 1992). A large part of peroxidaseactivity can be associated with the cell wall (Bacon et al.1997), but in this study it is not possible to distinguishbetween cell wall and alternative locations of the identifiedenzymes. It is possible that peroxidase activity protects thecells from the ROS formed during leaf expansion and cellwall development, while catalase is responsible for thoseformed during photorespiration.
Changes due to ozone treatment
It was shown in a previous publication from our group thatthere were barely any changes in the proteome profiles ofpoplar leaves after 3 days of ozone treatment, but thatchanges appeared after 14 and 35 days (Bohler et al. 2007).In the present study, the time points were adjusted to thoseresults, to get a better understanding of the variations on asmaller time-scale (28 vs 35 days) but with more obser-vation points (every 7 days). The observations tend toconfirm the previous results.No effects could be observed in the current experiment
before 14 days of treatment at a proteomic or biochemical
level, probably due to small experimental or technicaldifferences between the two experiments (e.g., size of theplants at the beginning of the treatment, small differences inconditions due to technical fluctuations and variation ofprecise fumigation concentrations due to nonautomatedozone adjustment). From Day 14 on, effects were visible atthe proteomic (Table 2 and Figure 9), biochemical(Figures 4 and 5), physiological (Figure 3) and morphologi-cal levels (Table 1 and Figure 1).For carbon metabolism, four enzymes of different function
presented a decreased abundance in the Calvin cycle due toozone, including RuBisCO, which was previously shownclearly to be reduced by ozone exposure (Pell et al. 1992,Brendley and Pell 1998, Miller et al. 1999, Pelloux et al.2001). Similarly, carbonic anhydrase, RuBisCO subunitbinding protein and RuBisCO activase, all involved in theoptimal functioning of RuBisCO, were present at lowerlevels than in controls. This undoubtedly resulted in reducedcarbon fixation and triose phosphate production. Since partof the triose phosphate is exported to the cytosol as a sub-strate for sucrose synthesis or glycolysis, this would have hadan impact on these pathways. The analyses showed that threeproteins of glycolysis upstream of triose phosphate werereduced by the treatment, but no changes could be detectedfor enzymes of the lower part of glycolysis, which could beexpected to respond to the variations of the Calvin cycle. It
Figure 5. Quantification of (a) glucose, (b) fructose, (c) sucrose and (d) starch. Statistical significance was tested by one-way ANOVAbetween control and treated and between each time point of one condition against Day 0 of the same condition. Letters represent statisticalsignificance for ANOVA P < 0.05. n = 4. Error bars represent standard deviation.
LEAF DEVELOPMENT AND OZONE EXPOSURE 1423
TREE PHYSIOLOGY ONLINE at http://www.treephys.oxfordjournals.org
at Universiteit M
aastricht on February 9, 2011
treephys.oxfordjournals.orgD
ownloaded from
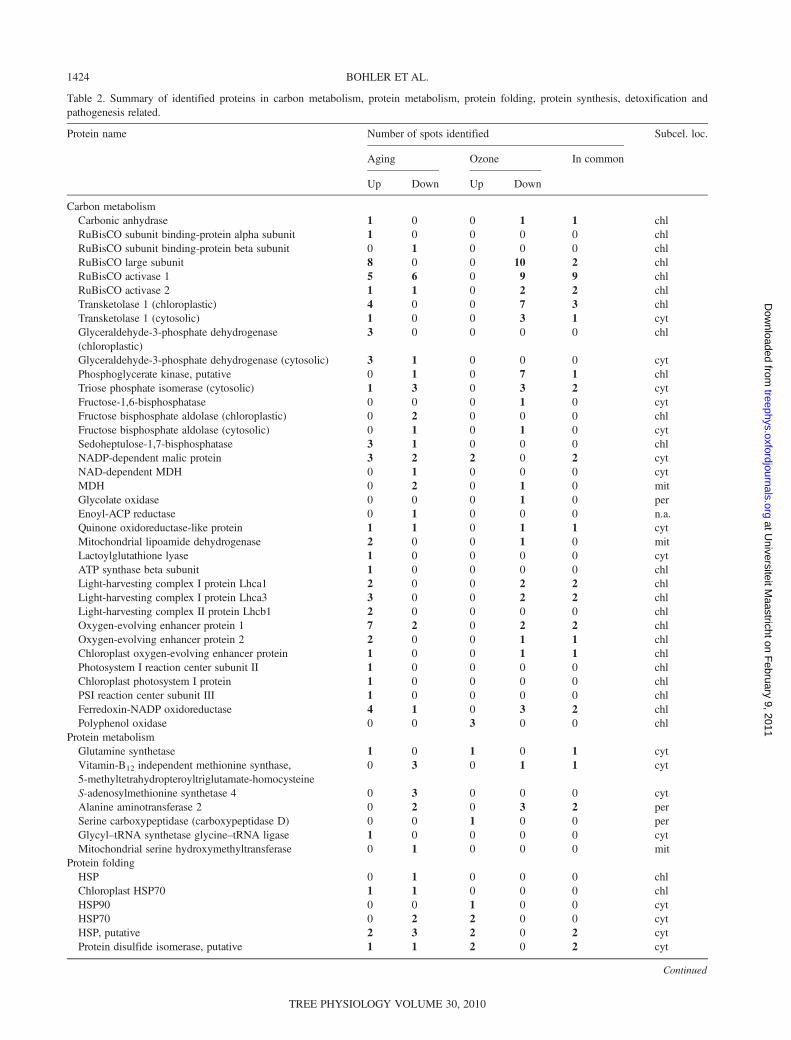
Table 2. Summary of identified proteins in carbon metabolism, protein metabolism, protein folding, protein synthesis, detoxification andpathogenesis related.
Protein name Number of spots identified Subcel. loc.
Aging Ozone In common
Up Down Up Down
Carbon metabolismCarbonic anhydrase 1 0 0 1 1 chlRuBisCO subunit binding-protein alpha subunit 1 0 0 0 0 chlRuBisCO subunit binding-protein beta subunit 0 1 0 0 0 chlRuBisCO large subunit 8 0 0 10 2 chlRuBisCO activase 1 5 6 0 9 9 chlRuBisCO activase 2 1 1 0 2 2 chlTransketolase 1 (chloroplastic) 4 0 0 7 3 chlTransketolase 1 (cytosolic) 1 0 0 3 1 cytGlyceraldehyde-3-phosphate dehydrogenase(chloroplastic)
3 0 0 0 0 chl
Glyceraldehyde-3-phosphate dehydrogenase (cytosolic) 3 1 0 0 0 cytPhosphoglycerate kinase, putative 0 1 0 7 1 chlTriose phosphate isomerase (cytosolic) 1 3 0 3 2 cytFructose-1,6-bisphosphatase 0 0 0 1 0 cytFructose bisphosphate aldolase (chloroplastic) 0 2 0 0 0 chlFructose bisphosphate aldolase (cytosolic) 0 1 0 1 0 cytSedoheptulose-1,7-bisphosphatase 3 1 0 0 0 chlNADP-dependent malic protein 3 2 2 0 2 cytNAD-dependent MDH 0 1 0 0 0 cytMDH 0 2 0 1 0 mitGlycolate oxidase 0 0 0 1 0 perEnoyl-ACP reductase 0 1 0 0 0 n.a.Quinone oxidoreductase-like protein 1 1 0 1 1 cytMitochondrial lipoamide dehydrogenase 2 0 0 1 0 mitLactoylglutathione lyase 1 0 0 0 0 cytATP synthase beta subunit 1 0 0 0 0 chlLight-harvesting complex I protein Lhca1 2 0 0 2 2 chlLight-harvesting complex I protein Lhca3 3 0 0 2 2 chlLight-harvesting complex II protein Lhcb1 2 0 0 0 0 chlOxygen-evolving enhancer protein 1 7 2 0 2 2 chlOxygen-evolving enhancer protein 2 2 0 0 1 1 chlChloroplast oxygen-evolving enhancer protein 1 0 0 1 1 chlPhotosystem I reaction center subunit II 1 0 0 0 0 chlChloroplast photosystem I protein 1 0 0 0 0 chlPSI reaction center subunit III 1 0 0 0 0 chlFerredoxin-NADP oxidoreductase 4 1 0 3 2 chlPolyphenol oxidase 0 0 3 0 0 chl
Protein metabolismGlutamine synthetase 1 0 1 0 1 cytVitamin-B12 independent methionine synthase,5-methyltetrahydropteroyltriglutamate-homocysteine
0 3 0 1 1 cyt
S-adenosylmethionine synthetase 4 0 3 0 0 0 cytAlanine aminotransferase 2 0 2 0 3 2 perSerine carboxypeptidase (carboxypeptidase D) 0 0 1 0 0 perGlycyl–tRNA synthetase glycine–tRNA ligase 1 0 0 0 0 cytMitochondrial serine hydroxymethyltransferase 0 1 0 0 0 mit
Protein foldingHSP 0 1 0 0 0 chlChloroplast HSP70 1 1 0 0 0 chlHSP90 0 0 1 0 0 cytHSP70 0 2 2 0 0 cytHSP, putative 2 3 2 0 2 cytProtein disulfide isomerase, putative 1 1 2 0 2 cyt
Continued
BOHLER ET AL.1424
TREE PHYSIOLOGY VOLUME 30, 2010
at Universiteit M
aastricht on February 9, 2011
treephys.oxfordjournals.orgD
ownloaded from
was notable that starch levels were higher in treated leaves.Starch accumulates during the day in chloroplasts, to be usedduring the night by carbon catabolism to produce energy andsustain growth (Smith and Stitt 2007). Possibly, the lowerlevels of carbon that still were produced during the day werepreferentially stored in the chloroplast as starch, which couldthen have been used in the night for respiration and repair. Itshould also be noted that an import of carbon moleculescould come from senescing leaves, which were more abun-dant in ozone-treated trees (Figure 1). Furthermore, phloemtranslocation could be impaired by ozone.The cytosolic NADP-dependent malic enzyme (NAD-ME)
downstream of glycolysis was higher in abundance intreated plants. This enzyme catalyzes the conversion ofmalate to pyruvate. Mitochondrial MDH, on the other hand,decreased in abundance. It has been shown that underozone exposure, phosphoenolpyruvate carboxylase (PEPc)is typically induced (Fontaine et al. 2003). The high mol-ecular weight of this enzyme made it impossible to observeit in this proteomic study. PEPc leads to malate productionthrough the anapleurotic pathway. This malate can then beimported into the mitochondrion and converted to pyruvateby NAD-ME, which has been shown to be induced byozone (Dizengremel et al. 1994). The NADH produced by
this conversion could then be used in the respiratory chain(Dizengremel 2001). Although no variation in NAD-MEcould be observed in the present study, the decreased MDHcould shift the balance to the conversion of malate to pyru-vate rather than oxaloacetate. Cytosolic NADP-ME wasobserved to increase in abundance, which would also pointto a preferential use of pyruvate as a precursor for the mito-chondrion, instead of malate. The reaction also leads to theproduction of NADPH in the cytosol, needed for the regen-eration of, e.g. ascorbate (Dizengremel et al. 2009).Although there is no evidence for this here, it has been pre-viously shown that the second half of glycolysis is inducedunder ozone exposure, as is the Krebs cycle. Increasedactivity of phosphofructokinase and fumarase was previouslyrevealed (Dizengremel et al. 1994; Sehmer et al. 1998).During ozone exposure, we also observed changes in two
enzymes involved in photorespiration, mitochondrial dihy-drolipoamide dehydrogenase and peroxisomal glycolateoxidase, which both showed a late downward trend.Although these are only two proteins of the pathway, theresults are in agreement with previously published obser-vations (Bagard et al. 2008). It is probable that a decreasein photorespiration is directly linked to the decrease inRuBisCO abundance, hence CO2 and O2 fixation.
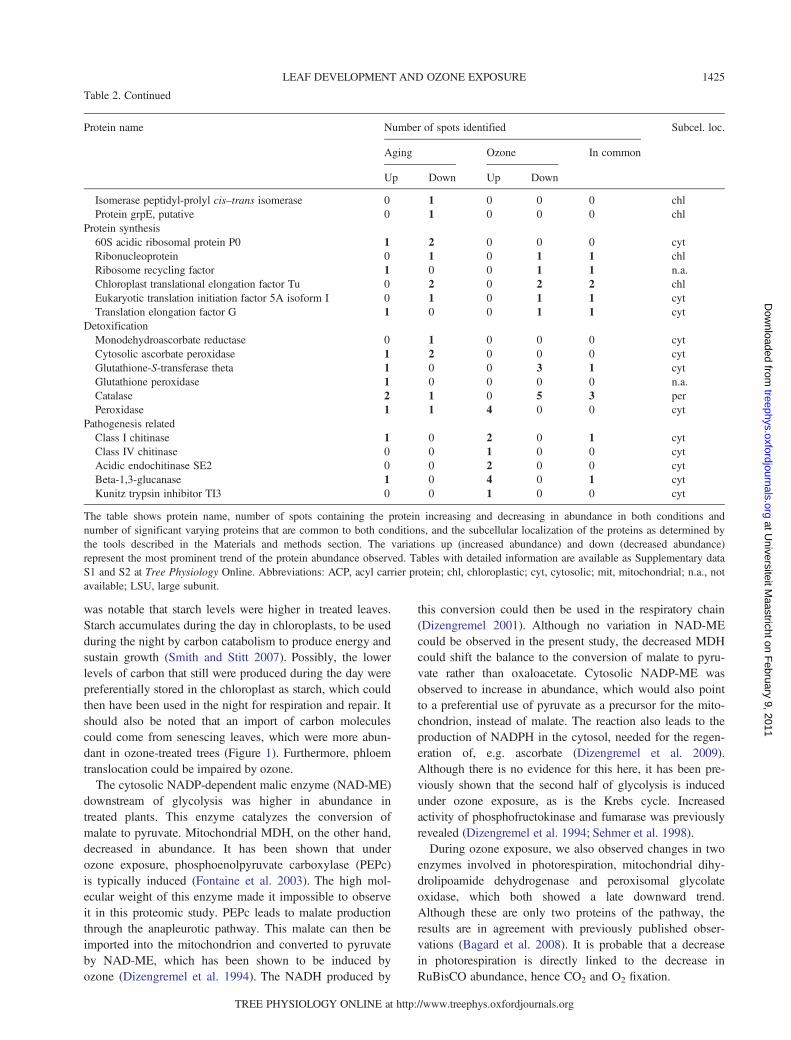
Table 2. Continued
Protein name Number of spots identified Subcel. loc.
Aging Ozone In common
Up Down Up Down
Isomerase peptidyl-prolyl cis–trans isomerase 0 1 0 0 0 chlProtein grpE, putative 0 1 0 0 0 chl
Protein synthesis60S acidic ribosomal protein P0 1 2 0 0 0 cytRibonucleoprotein 0 1 0 1 1 chlRibosome recycling factor 1 0 0 1 1 n.a.Chloroplast translational elongation factor Tu 0 2 0 2 2 chlEukaryotic translation initiation factor 5A isoform I 0 1 0 1 1 cytTranslation elongation factor G 1 0 0 1 1 cyt
DetoxificationMonodehydroascorbate reductase 0 1 0 0 0 cytCytosolic ascorbate peroxidase 1 2 0 0 0 cytGlutathione-S-transferase theta 1 0 0 3 1 cytGlutathione peroxidase 1 0 0 0 0 n.a.Catalase 2 1 0 5 3 perPeroxidase 1 1 4 0 0 cyt
Pathogenesis relatedClass I chitinase 1 0 2 0 1 cytClass IV chitinase 0 0 1 0 0 cytAcidic endochitinase SE2 0 0 2 0 0 cytBeta-1,3-glucanase 1 0 4 0 1 cytKunitz trypsin inhibitor TI3 0 0 1 0 0 cyt
The table shows protein name, number of spots containing the protein increasing and decreasing in abundance in both conditions andnumber of significant varying proteins that are common to both conditions, and the subcellular localization of the proteins as determined bythe tools described in the Materials and methods section. The variations up (increased abundance) and down (decreased abundance)represent the most prominent trend of the protein abundance observed. Tables with detailed information are available as Supplementary dataS1 and S2 at Tree Physiology Online. Abbreviations: ACP, acyl carrier protein; chl, chloroplastic; cyt, cytosolic; mit, mitochondrial; n.a., notavailable; LSU, large subunit.
LEAF DEVELOPMENT AND OZONE EXPOSURE 1425
TREE PHYSIOLOGY ONLINE at http://www.treephys.oxfordjournals.org
at Universiteit M
aastricht on February 9, 2011
treephys.oxfordjournals.orgD
ownloaded from
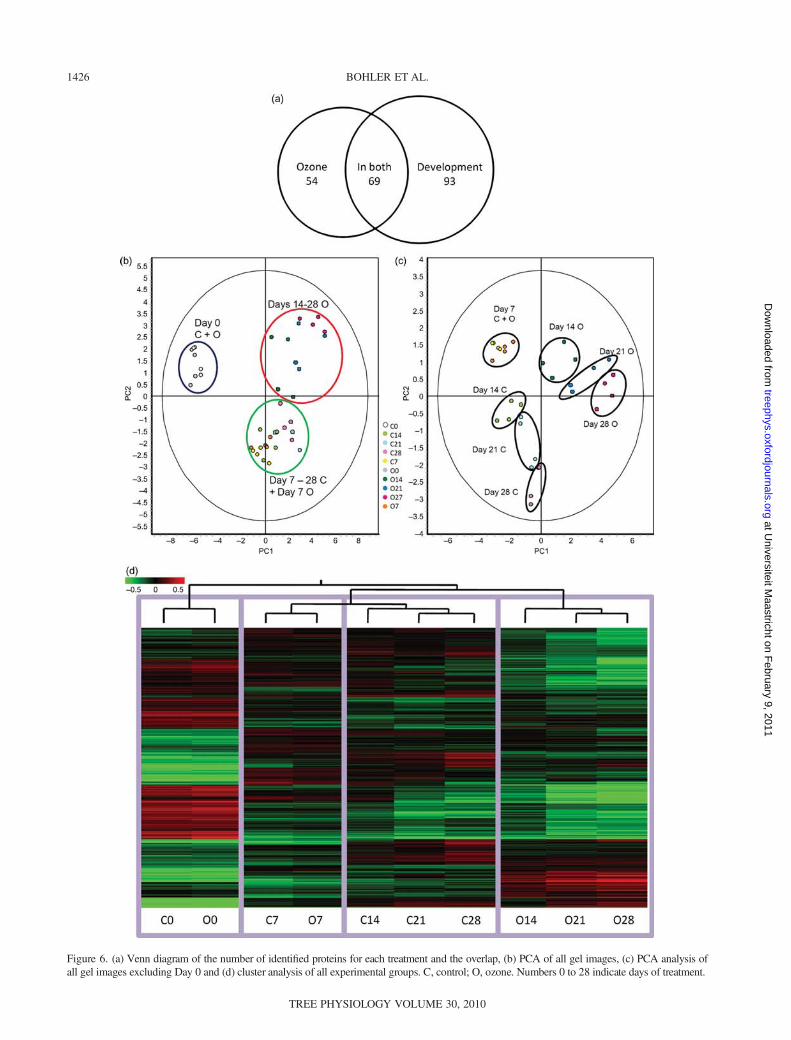
Figure 6. (a) Venn diagram of the number of identified proteins for each treatment and the overlap, (b) PCA of all gel images, (c) PCA analysis ofall gel images excluding Day 0 and (d) cluster analysis of all experimental groups. C, control; O, ozone. Numbers 0 to 28 indicate days of treatment.
BOHLER ET AL.1426
TREE PHYSIOLOGY VOLUME 30, 2010
at Universiteit M
aastricht on February 9, 2011
treephys.oxfordjournals.orgD
ownloaded from
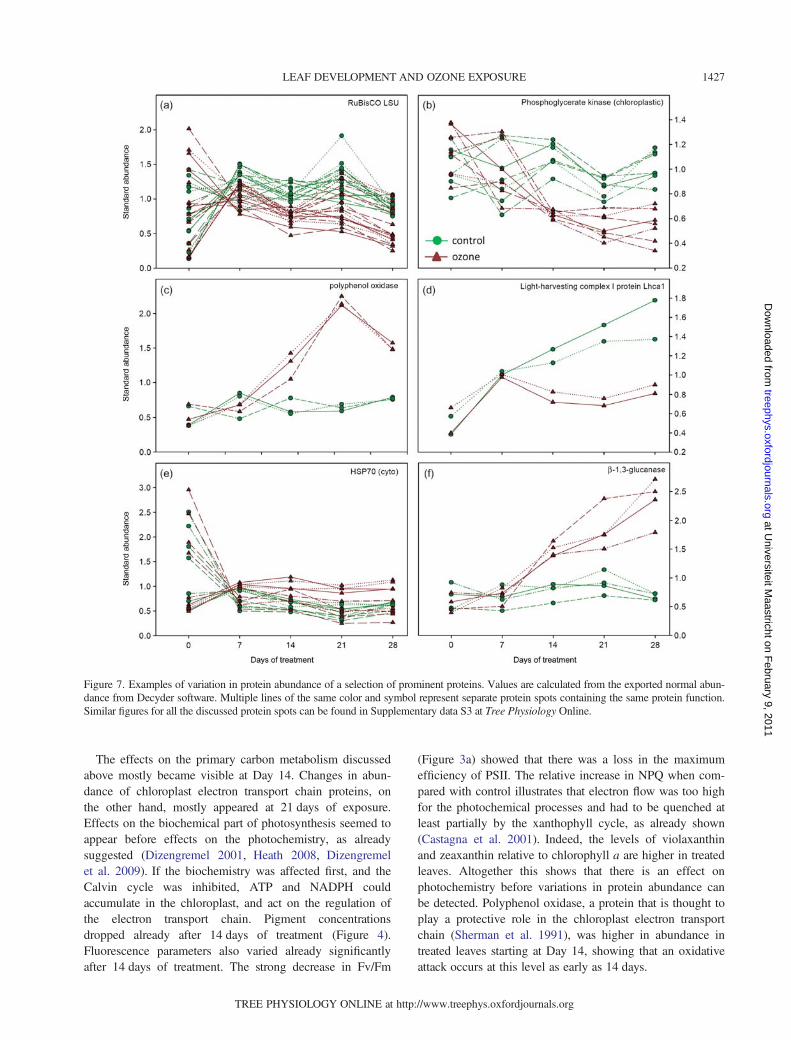
The effects on the primary carbon metabolism discussedabove mostly became visible at Day 14. Changes in abun-dance of chloroplast electron transport chain proteins, onthe other hand, mostly appeared at 21 days of exposure.Effects on the biochemical part of photosynthesis seemed toappear before effects on the photochemistry, as alreadysuggested (Dizengremel 2001, Heath 2008, Dizengremelet al. 2009). If the biochemistry was affected first, and theCalvin cycle was inhibited, ATP and NADPH couldaccumulate in the chloroplast, and act on the regulation ofthe electron transport chain. Pigment concentrationsdropped already after 14 days of treatment (Figure 4).Fluorescence parameters also varied already significantlyafter 14 days of treatment. The strong decrease in Fv/Fm
(Figure 3a) showed that there was a loss in the maximumefficiency of PSII. The relative increase in NPQ when com-pared with control illustrates that electron flow was too highfor the photochemical processes and had to be quenched atleast partially by the xanthophyll cycle, as already shown(Castagna et al. 2001). Indeed, the levels of violaxanthinand zeaxanthin relative to chlorophyll a are higher in treatedleaves. Altogether this shows that there is an effect onphotochemistry before variations in protein abundance canbe detected. Polyphenol oxidase, a protein that is thought toplay a protective role in the chloroplast electron transportchain (Sherman et al. 1991), was higher in abundance intreated leaves starting at Day 14, showing that an oxidativeattack occurs at this level as early as 14 days.
Figure 7. Examples of variation in protein abundance of a selection of prominent proteins. Values are calculated from the exported normal abun-dance from Decyder software. Multiple lines of the same color and symbol represent separate protein spots containing the same protein function.Similar figures for all the discussed protein spots can be found in Supplementary data S3 at Tree Physiology Online.
LEAF DEVELOPMENT AND OZONE EXPOSURE 1427
TREE PHYSIOLOGY ONLINE at http://www.treephys.oxfordjournals.org
at Universiteit M
aastricht on February 9, 2011
treephys.oxfordjournals.orgD
ownloaded from
Since ozone clearly leads to oxidative stress and to theformation of ROS such as H2O2 (Diara et al. 2005), it isexpected that detoxifying proteins would increase, mostnotably ascorbate-related detoxification (Luwe et al. 1993).In the present study, the abundance of the observed ascor-bate peroxidase did not vary under ozone exposure,although it has been shown to increase in activity (Sehmeret al. 1998). Other peroxidases increased in abundance.They could be responsible for some of the ozone-inducedROS detoxification, because they are often associated
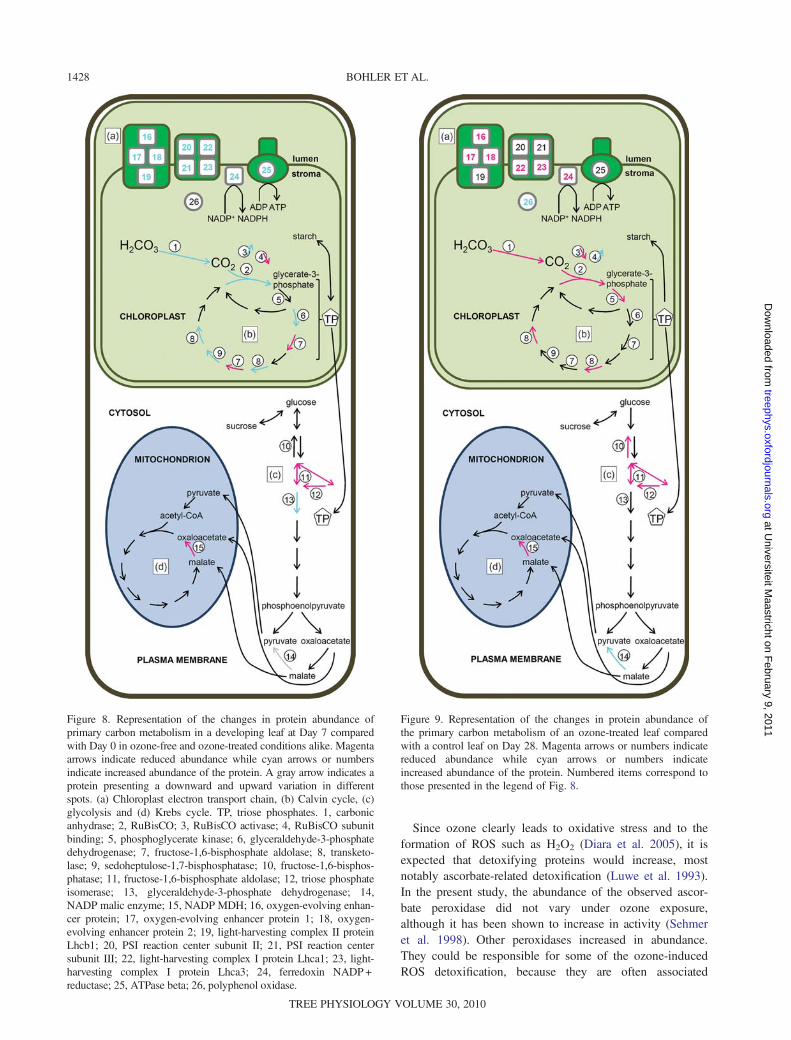
Figure 8. Representation of the changes in protein abundance ofprimary carbon metabolism in a developing leaf at Day 7 comparedwith Day 0 in ozone-free and ozone-treated conditions alike. Magentaarrows indicate reduced abundance while cyan arrows or numbersindicate increased abundance of the protein. A gray arrow indicates aprotein presenting a downward and upward variation in differentspots. (a) Chloroplast electron transport chain, (b) Calvin cycle, (c)glycolysis and (d) Krebs cycle. TP, triose phosphates. 1, carbonicanhydrase; 2, RuBisCO; 3, RuBisCO activase; 4, RuBisCO subunitbinding; 5, phosphoglycerate kinase; 6, glyceraldehyde-3-phosphatedehydrogenase; 7, fructose-1,6-bisphosphate aldolase; 8, transketo-lase; 9, sedoheptulose-1,7-bisphosphatase; 10, fructose-1,6-bisphos-phatase; 11, fructose-1,6-bisphosphate aldolase; 12, triose phosphateisomerase; 13, glyceraldehyde-3-phosphate dehydrogenase; 14,NADP malic enzyme; 15, NADP MDH; 16, oxygen-evolving enhan-cer protein; 17, oxygen-evolving enhancer protein 1; 18, oxygen-evolving enhancer protein 2; 19, light-harvesting complex II proteinLhcb1; 20, PSI reaction center subunit II; 21, PSI reaction centersubunit III; 22, light-harvesting complex I protein Lhca1; 23, light-harvesting complex I protein Lhca3; 24, ferredoxin NADP +reductase; 25, ATPase beta; 26, polyphenol oxidase.
Figure 9. Representation of the changes in protein abundance ofthe primary carbon metabolism of an ozone-treated leaf comparedwith a control leaf on Day 28. Magenta arrows or numbers indicatereduced abundance while cyan arrows or numbers indicateincreased abundance of the protein. Numbered items correspond tothose presented in the legend of Fig. 8.
BOHLER ET AL.1428
TREE PHYSIOLOGY VOLUME 30, 2010
at Universiteit M
aastricht on February 9, 2011
treephys.oxfordjournals.orgD
ownloaded from
with cell wall detoxification (Bacon et al. 1997), whereozone-induced ROS first appear. Catalases, on theother hand, were present at lower abundance in ozone-treated leaves. Because catalases are involved inphotorespiration-induced H2O2 detoxification (Reumann andWeber 2006), the reduction in RuBisCO abundance couldexplain the decrease of this enzyme. Reduced fixation of O2
would decrease the rate of photorespiration.Pathogenesis-related proteins are proteins that were initially
found to be involved in pathogen attack (Van Loon 1997),but recently also associated with different types of abioticstress (Sandermann et al. 1998, Renaut et al. 2004). Here, weobserved an increase in abundance of multiple isoforms ofchitinase. It is known that chitinases are induced by manystress conditions, ethylene, salicylic acid and jasmonic acid,all play a role in ozone stress signaling (Kangasjärvi et al.2005). It was also shown that acidic class III chitinases can besecreted into the apoplast, which is the primary location ofozone attack (Arie et al. 2000). Similar to chitinase, the abun-dance of several beta-1,3-glucanases increased. The upwardvariation of these two pathogenesis-related proteins was prob-ably due to the ozone-induced oxidative burst (Wohlgemuthet al. 2002) that is also typical of a pathogen attack.
Ozone and leaf expansion
If little is known about leaf expansion in general, even less isknown about it in combination with ozone exposure. It wasshown in previous observations that necroses only appearonce leaves are fully expanded (Bohler et al. 2007, Bagardet al. 2008). In the present study, it was shown that leaves
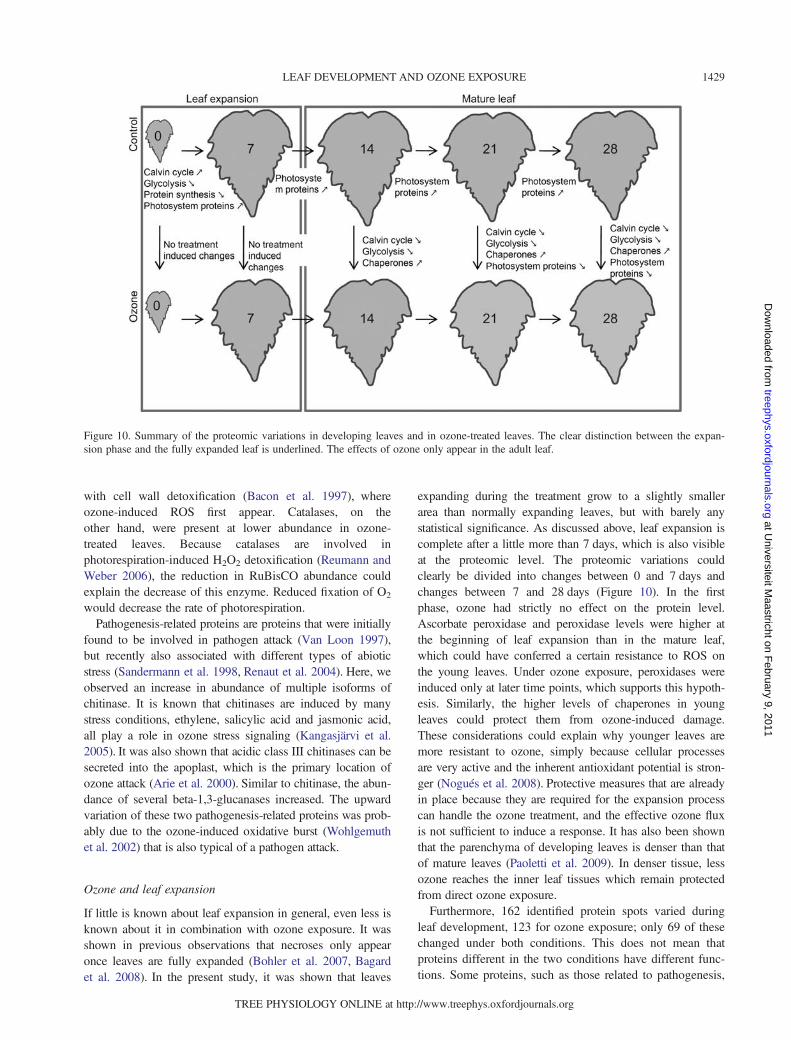
expanding during the treatment grow to a slightly smallerarea than normally expanding leaves, but with barely anystatistical significance. As discussed above, leaf expansion iscomplete after a little more than 7 days, which is also visibleat the proteomic level. The proteomic variations couldclearly be divided into changes between 0 and 7 days andchanges between 7 and 28 days (Figure 10). In the firstphase, ozone had strictly no effect on the protein level.Ascorbate peroxidase and peroxidase levels were higher atthe beginning of leaf expansion than in the mature leaf,which could have conferred a certain resistance to ROS onthe young leaves. Under ozone exposure, peroxidases wereinduced only at later time points, which supports this hypoth-esis. Similarly, the higher levels of chaperones in youngleaves could protect them from ozone-induced damage.These considerations could explain why younger leaves aremore resistant to ozone, simply because cellular processesare very active and the inherent antioxidant potential is stron-ger (Nogués et al. 2008). Protective measures that are alreadyin place because they are required for the expansion processcan handle the ozone treatment, and the effective ozone fluxis not sufficient to induce a response. It has also been shownthat the parenchyma of developing leaves is denser than thatof mature leaves (Paoletti et al. 2009). In denser tissue, lessozone reaches the inner leaf tissues which remain protectedfrom direct ozone exposure.Furthermore, 162 identified protein spots varied during
leaf development, 123 for ozone exposure; only 69 of thesechanged under both conditions. This does not mean thatproteins different in the two conditions have different func-tions. Some proteins, such as those related to pathogenesis,
Figure 10. Summary of the proteomic variations in developing leaves and in ozone-treated leaves. The clear distinction between the expan-sion phase and the fully expanded leaf is underlined. The effects of ozone only appear in the adult leaf.
LEAF DEVELOPMENT AND OZONE EXPOSURE 1429
TREE PHYSIOLOGY ONLINE at http://www.treephys.oxfordjournals.org
at Universiteit M
aastricht on February 9, 2011
treephys.oxfordjournals.orgD
ownloaded from
were indeed mostly stable during leaf development and onlyvaried under ozone treatment. But, in general, shiftsbetween different isoforms of the same protein functionwere observed. For instance, seven isoforms of phosphogly-cerate kinase varied under ozone exposure, and only oneduring leaf expansion. On the other hand, more differentisoforms of photosystem-related proteins varied in leafdevelopment than under ozone stress. This illustrates thespecificity of both processes. Unfortunately, the data couldnot clarify whether the different protein spots that wereidentified as having the same general function were trueisoforms or identical polypeptides separated during electro-phoresis due to post-translational modifications.
Conclusion
In the present study, we clearly showed that there is a differ-ence between expanding and mature leaves (Figure 10).Once the primary metabolism is set up, carbon sourceschange. Similarly, protein synthesis and protection mechan-isms change over that time. In ozone-treated plants, effectsdue to the exposure only appear once leaves are mature, andinvolve primary metabolism, detoxification, protein metab-olism and other functions. Expanding leaves, on the otherhand, show no variation whatsoever in response to ozone,and this could be because the very active cell processes inexpanding leaves are sufficient to cope with the ozonethreat. Furthermore, it was shown that specific isoforms ofthe same proteins vary in one or the other condition,showing the specificity of the natural process of leaf expan-sion and of the stress-induced ozone response.
Acknowledgments
We thank Mouhssin Oufir for his help with carbohydrate quantifi-cation, Dr Henry-Michel Cauchie and Dr Thomas Udelhoven fortheir help with statistics, Sébastien Planchon for his technicalassistance during the proteomic analyses and Jacques Banvoy forhis help with the fumigation chambers.
Funding
This study was supported by the Fonds National de la RechercheLuxembourg (FNR) (S.B.’s PhD scholarship AFR TR-PHDBFR06-044).
Supplementary data
Supplementary data for this article are available at TreePhysiology Online.
References
Amir, R., Y. Hacham and G. Galili. 2002. Cystathionine gamma-synthase and threonine synthase operate in concert to regulatecarbon flow towards methionine in plants. Trends Plant Sci.7:153–156.
Andersson, A., J. Keskitalo, A. Sjodin, et al. 2004. A transcrip-tional timetable of autumn senescence. Genome Biol. 5:R24.
Andre, C.M., M. Oufir, C. Guignard, L. Hoffmann, J.F. Hausman,D. Evers and Y. Larondelle. 2007. Antioxidant profiling ofnative Andean potato tubers (Solanum tuberosum L.) reveals cul-tivars with high levels of beta-carotene, alpha-tocopherol,chlorogenic acid, and petanin. J. Agric. Food Chem.55:10839–10849.
Arie, M., K. Hikichi, K. Takahashi and M. Esaka. 2000.Characterization of a basic chitinase which is secreted by cul-tured pumpkin cells. Physiol. Plant. 110:232–239.
Bacon, M.A., D.S. Thompson and W.J. Davies. 1997. Can cell wallperoxidase activity explain the leaf growth response of Loliumtemulentum L. during drought? J. Exp. Bot. 48:2075–2085.
Bagard, M., D. Le Thiec, E. Delacote, M.P. Hasenfratz-Sauder, J.Banvoy, J. Gerard, P. Dizengremel and Y. Jolivet. 2008.Ozone-induced changes in photosynthesis and photorespirationof hybrid poplar in relation to the developmental stage of theleaves. Physiol. Plant. 134:559–574.
Benkova, E., M. Michniewicz, M. Sauer, T. Teichmann,D. Seifertova, G. Jurgens and J. Friml. 2003. Local, efflux-dependent auxin gradients as a common module for plant organformation. Cell 115:591–602.
Bernard, S.M. and D.Z. Habash. 2009. The importance of cytosolicglutamine synthetase in nitrogen assimilation and recycling.New Phytol. 182:608–620.
Bohler, S., M. Bagard, M. Oufir, S. Planchon, L. Hoffmann, Y.Jolivet, J.-F. Hausman, P. Dizengremel and J. Renaut. 2007. ADiGE analysis of developing poplar leaves subjected to ozonereveals major changes in carbon metabolism. Proteomics7:1584–1599.
Brendley, B.W. and E.J. Pell. 1998. Ozone-induced changes in bio-synthesis of RuBisCO and associated compensation to stress infoliage of hybrid poplar. Tree Physiol. 18:81–90.
Buchanan-Wollaston, V., T. Page, E. Harrison et al. 2005.Comparative transcriptome analysis reveals significant differ-ences in gene expression and signalling pathways betweendevelopmental and dark/starvation-induced senescence inArabidopsis. Plant J. 42:567–585.
Castagna, A. and A. Ranieri. 2009. Detoxification and repairprocess of ozone injury: from O3 uptake to gene expressionadjustment. Environ. Pollut. 157:1461–1469.
Castagna, A., C. Nali, S. Ciompi, G. Lorenzini, G.F. Soldatiniand A. Ranieri. 2001. Ozone exposure affects photosynthesis ofpumpkin (Cucurbita pepo) plants. New Phytol. 152:223–229.
Degl’Innocenti, E., L. Guidi and G.F. Soldatini. 2002. Effect ofchronic O3 fumigation on the activity of some Calvin cycleenzymes in two poplar clones. Photosynthetica 40:121–126.
Diara, C., A. Castagna, B. Baldan, A.M. Sodi, T. Sahr,C. Langebartels, L. Sebastiani and A. Ranieri. 2005. Differences inthe kinetics and scale of signalling molecule production modulatethe ozone sensitivity of hybrid poplar clones: the roles of H2O2,ethylene and salicylic acid. New Phytol. 168:351–364.
Dickson, R.E. 1989. Carbon and nitrogen allocation in trees. Ann.Forest Sci. 46:631s–647s.
Dizengremel, P. 2001. Effects of ozone on the carbon metabolismof forest trees. Plant Physiol. Biochem. 39:729–742.
BOHLER ET AL.1430
TREE PHYSIOLOGY VOLUME 30, 2010
at Universiteit M
aastricht on February 9, 2011
treephys.oxfordjournals.orgD
ownloaded from
Dizengremel, P., W. Sasekt, K.J. Brown and C.J. Richardson. 1994.Ozone-induced changes in primary carbon metabolism enzymesof Loblolly pine needles. J. Plant Physiol. 144:300–306.
Dizengremel, P., D. Le Thiec, M. Bagard and Y. Jolivet. 2008. Ozonerisk assessment for plants: central role of metabolism-dependentchanges in reducing power. Environ. Pollut. 156:11–15.
Dizengremel, P., D. Le Thiec, M.-P. Hasenfratz-Sauder,M.-N. Vaultier, M. Bagard and Y. Jolivet. 2009. Metabolic-dependent changes in plant cell redox power after ozoneexposure. Plant Biol. 11:35–42.
Eshed, Y., S.F. Baum, J.V. Perea and J.L. Bowman. 2001.Establishment of polarity in lateral organs of plants. Curr. Biol.11:1251–60.
Fleming, A.J. 2005. The control of leaf development. New Phytol.166:9–20.
Fontaine, V., M. Cabané and P. Dizengremel. 2003. Regulation ofphosphoenolpyruvate carboxylase in Pinus halepensis needles sub-mitted to ozone and water stress. Physiol. Plant. 117:445–452.
Fuhrer, J. 2009. Ozone risk for crops and pastures in present andfuture climates. Naturwissenschaften 96:173–194.
Fujiwara, T., K. Ito, T. Yamami and Y. Nakamura. 2004.Ribosome recycling factor disassembles the post-terminationribosomal complex independent of the ribosomal translocaseactivity of elongation factor G. Mol. Microbiol. 53:517–528.
Gaucher, C., N. Costanzo, D. Afif, Y. Mauffette, N. Chevrierand P. Dizengremel. 2003. The impact of elevated ozone andcarbon dioxide on young Acer saccharum seedlings. Physiol.Plants. 117:392–402.
Grbic, V. and A.B. Bleecker. 1995. Ethylene regulates the timingof leaf senescence in Arabidopsis. Plant J. 8:595–602.
Guidi, L., C. Nali, G. Lorenzini, F. Filippi and G.F. Soldatini.2001. Effect of chronic ozone fumigation on the photosytheticprocess of poplar clones showing different sensitivity. Environ.Pollut. 113:245–254.
Heath, R.L. 2008. Modification of the biochemical pathways ofplants induced by ozone: what are the varied routes to change?Environ. Pollut. 155:453–463.
Hopkins, M., C. Taylor, Z. Liu, F. Ma, L. McNamara, T.W. Wangand J.E. Thompson. 2007. Regulation and execution of molecu-lar disassembly and catabolism during senescence. New Phytol.175:201–214.
Ishida, A., A. Uemura, N. Koike, Y. Matsumoto and A.L. Hoe.1999. Interactive effects of leaf age and self-shading on leafstructure, photosynthetic capacity and chlorophyll fluorescencein the rain forest tree, Dryobalanops aromatica. Tree Physiol.19:741–747.
Kangasjärvi, J., P. Jaspers and H. Kollist. 2005. Signalling and celldeath in ozone-exposed plants. Plant Cell Environ. 28:1021–1036.
Kennedy, R.A. and D. Johnson. 1981. Changes in photosyntheticcharacteristics during leaf development in apple. Photosynth.Res. 2:213–223.
Keskitalo, J., G. Bergquist, P. Gardestrom and S. Jansson. 2005. Acellular timetable of autumn senescence. Plant Physiol.139:1635–1648.
Kieffer, P., P. Schroder, J. Dommes, L. Hoffmann, J. Renaut and J.F. Hausman. 2009. Proteomic and enzymatic response of poplarto cadmium stress. J. Proteomics 72:379–396.
Luwe, M.W.F., U. Takahama and U. Heber. 1993. Role of ascor-bate in detoxifying ozone in the apoplast of spinach (Spinaciaoleracea L.) leaves. Plant Physiol. 101:969–976.
Maayan, I., F. Shaya, K. Ratner, Y. Mani, S. Lavee, B. Avidan,Y. Shahak and O. Ostersetzer-Biran. 2008. Photosyntheticactivity during olive (Olea europaea) leaf development correlates
with plastid biogenesis and RuBisCO levels. Physiol. Plant.134:547–558.
Macadam, J.W., R.E. Sharp and C.J. Nelson. 1992. Peroxidaseactivity in the leaf elongation zone of tall fescue: II. Spatial dis-tribution of apoplastic peroxidase activity in genotypes differingin length of the elongation zone. Plant Physiol. 99:879–885.
Miller, J.D., R.N. Arteca and E.J. Pell. 1999. Senescence-associ-ated gene expression during ozone-induced leaf senescence inArabidopsis. Plant Physiol. 120:1015–1023.
Niyogi, K.K., O. Bjorkman and A.R. Grossman. 1997. The rolesof specific xanthophylls in photoprotection. Proc. Natl Acad.Sci. USA 94:14162–14167.
Nogués, I., S. Fares, E. Oksanen and F. Loreto. 2008. Ozoneeffects on the metabolism and the antioxidant system of poplarleaves at different stages of development. In Photosynthesis:Energy from the Sun. Springer, pp 1317–1322.
Oke, T.R. 1987. Boundary layer climates. Routledge, London, pp.304–338.
Orzechowski, S., J. Socha-Hanc and A. Paszkowski. 1999. Alanineaminotransferase and glycine aminotransferase from maize (Zeamays L.) leaves. Acta Biochim. Pol. 46:447–457.
Oufir, M., S. Legay, N. Nicot, K. Van Moer, L. Hoffmann,J. Renaut, J.-F. Hausman and D. Evers. 2008. Gene expressionin potato during cold exposure: changes in carbohydrate andpolyamine metabolisms. Plant Sci. 175:839–852.
Paoletti, E., N. Contran, P. Bernasconi, M.S. Günthardt-Goergand P. Vollenweider. 2009. Structural and physiologicalresponses to ozone in Manna ash (Fraxinus ornus L.) leaves ofseedlings and mature trees under controlled and ambient con-ditions. Sci. Total Environ. 407:1631–1643.
Pell, E.J., N. Eckardt and A.J. Enyedi. 1992. Timing of ozonestress and resulting status of ribulose bisphosphate carboxylase/oxygenase and associated net photosynthesis. New Phytol.120:397–405.
Pelloux, J., Y. Jolivet, V. Fontaine, J. Banvoy and P. Dizengremel.2001. Changes in RuBisCO and RuBisCO activase geneexpression and polypeptide content in Pinus halepensisM. subjected to ozone and drought. Plant Cell Environ.24:123–131.
Rao, M.V., J.R. Koch and K.R. Davis. 2000. Ozone: a tool forprobing programmed cell death in plants. Plant Mol. Biol.44:345–358.
Reich, P.B. 1983. Effects of low concentrations of O3 on net photo-synthesis, dark respiration, and chlorophyll contents in aginghybrid poplar leaves. Plant Physiol. 73:291–296.
Reinbothe, C., A. Springer, I. Samol and S. Reinbothe. 2009. Plantoxylipins: role of jasmonic acid during programmed cell death,defence and leaf senescence. FEBS J. 276:4666–4681.
Reinhardt, D., E.R. Pesce, P. Stieger, T. Mandel, K. Baltensperger,M. Bennett, J. Traas, J. Friml and C. Kuhlemeier. 2003.Regulation of phyllotaxis by polar auxin transport. Nature426:255–260.
Renaut, J., S. Lutts, L. Hoffmann and J.F. Hausman. 2004.Response of poplar to chilling temperatures: proteomic andphysiological aspects. Plant Biol. 6:81–90.
Renaut, J., S. Bohler, J.-F. Hausman, L. Hoffmann, K. Sergeant,N. Ahsan, Y. Jolivet and P. Dizengremel. 2009. The impact ofatmospheric composition on plants: a case study of ozone andpoplar. Mass Spectrom. Rev. 28:495–516.
Reumann, S. and A.P. Weber. 2006. Plant peroxisomes respire inthe light: some gaps of the photorespiratory C2 cycle havebecome filled–others remain. Biochim. Biophys. Acta1763:1496–1510.
LEAF DEVELOPMENT AND OZONE EXPOSURE 1431
TREE PHYSIOLOGY ONLINE at http://www.treephys.oxfordjournals.org
at Universiteit M
aastricht on February 9, 2011
treephys.oxfordjournals.orgD
ownloaded from
Saiga, S., C. Furumizu, R. Yokoyama, T. Kurata, S. Sato, T. Kato,S. Tabata, M. Suzuki and Y. Komeda. 2008. The ArabidopsisOBERON1 and OBERON2 genes encode plant homeodomainfinger proteins and are required for apical meristem maintenance.Development 135:1751–1759.
Sandermann, H., Jr, D. Ernst, W. Heller and C. Langebartels.1998. Ozone: an abiotic elicitor of plant defence reactions.Trends Plant Sci. 3:47–50.
Schoof, H., M. Lenhard, A. Haecker, K.F. Mayer, G. Jurgensand T. Laux. 2000. The stem cell population of Arabidopsisshoot meristems is maintained by a regulatory loop between theCLAVATA and WUSCHEL genes. Cell 100:635–644.
Sehmer, L., V. Fontaine, F. Antoni and P. Dizengremel. 1998.Effects of ozone and elevated atmospheric carbon dioxide oncarbohydrate metabolism of spruce needles. Catabolic anddetoxification pathways. Physiol. Plant. 102:605–611.
Sherman, T.D., K.C. Vaughn and S.O. Duke. 1991. A limitedsurvey of the phylogenetic distribution of polyphenol oxidase.Phytochemistry 30:2499–2506.
Skynner, H.A., T.W. Rosahl, M.R. Knowles, K. Salim, L. Reid,R. Cothilf, G. McAllister and P.C. Guest. 2002. Alterations of
stress related proteins in genetically altered mice revealed bytwo-dimensional differential in-gel electrophoresis. Proteomics2:1018–1025.
Smith, A.M. and M. Stitt. 2007. Coordination of carbon supplyand plant growth. Plant Cell Environ. 30:1126–1149.
Tcherkez, G., G. Cornic, R. Bligny, E. Gout and J. Ghashghaie.2005. In vivo respiratory metabolism of illuminated leaves. PlantPhysiol. 138:1596–606.
Tkacz, B., B. Moody, J.V. Castillo and M.E. Fenn. 2008. Foresthealth conditions in North America. Environ. Pollut. 155:409–425.
Van Loon, L.C. 1997. Induced resistance in plants and the role ofpathogenesis-related proteins. Eur. J. Plant Pathol. 103:753–765.
Wieser, G. and R. Matyssek. 2007. Linking ozone uptake anddefense towards a mechanistic risk assessment for forest trees.New Phytol. 174:7–9.
Wohlgemuth, H., K. Mittelstrass, S. Kschieschan, J. Bender, H.-J.Weigel, K. Overmyer, J. Kangasjärvi, H. Sandermann and C.Langebartels. 2002. Activation of an oxidative burst is a generalfeature of sensitive plants exposed to the air pollutant ozone.Plant Cell Environ. 25:717–726.
BOHLER ET AL.1432
TREE PHYSIOLOGY VOLUME 30, 2010
at Universiteit M
aastricht on February 9, 2011
treephys.oxfordjournals.orgD
ownloaded from