
Differential expression ofHomer 1 gene by acute and chronic administration of antipsychotics and...
11
Differential Expression of Homer 1 Gene by Acute and Chronic Administration of Antipsychotics and Dopamine Transporter Inhibitors in the Rat Forebrain ALBERTO AMBESI-IMPIOMBATO, FABIO PANARIELLO, CARMELA DELL’AVERSANO, CARMINE TOMASETTI, GIOVANNI MUSCETTOLA, AND ANDREA DE BARTOLOMEIS * Laboratory of Molecular Psychiatry and Psychopharmacotherapy, Section of Psychiatry, Department of Neuroscience, University School of Medicine ‘‘Federico II,’’ Naples 80131, Italy KEY WORDS glutamate; schizophrenia; quetiapine; haloperidol; GBR 12909; ania-3; Homer 1a; gene expression ABSTRACT Neuronal expression of immediate-early genes in response to a drug is a powerful screening tool for dissecting anatomical and functional brain circuitry affected by psychoactive compounds. We examined the effect of dopaminergic perturbation on two Homer 1 gene splice variants, Homer 1a and ania-3, in rat forebrain. Rats were treated with the ‘‘typical’’ antipsychotic haloperidol, the ‘‘atypical’’ quetiapine, or the selective dopamine transporter (DAT) inhibitor GBR 12909 in acute and chronic para- digms. Our results show that the high affinity dopamine D 2 receptor antagonist haloperi- dol strongly induces Homer 1 gene expression in the caudate-putamen, whereas quetia- pine, a fast D2R dissociating antagonist, does not. This confirms that Homer 1 may be considered a predictor of ‘‘atypicality’’ of antipsychotic compounds in acute and also chronic regimens. Chronic treatment with GBR 12909 showed a strong induction in the parietal cortex, resembling the activation of ‘‘sensitization’’ circuitry by stimulants. Finally, we describe a differential spatial induction pattern of Homer 1 gene within the caudate-putamen by typical antipsychotics and DAT blockers, and propose a novel method to quantitate it. Synapse 61:429–439, 2007. V V C 2007 Wiley-Liss, Inc. INTRODUCTION Antipsychotic drugs are the mainstay of the treat- ment of schizophrenia. The new class of drugs referred to as ‘‘atypical’’ antipsychotics is now extensively adopted as pharmacological therapy of psychotic patients (Lieberman et al., 2005). Compared with the ‘‘typical’’ antipsychotics, these newer medications are equally effective in reducing the positive symptoms like hallucinations and delusions, and have a lower incidence of extrapyramidal side effects (EPSEs) (Arnt, 1998). Neuronal expression of immediate-early genes (IEGs) such as c-fos in response to antipsy- chotics (Morgan and Curran, 1991) may provide a bet- ter tool for the screening of their pharmacological pro- file, and for understanding the mechanisms that underlie the distinctive clinical features of atypical antipsychotics. Sampling the response to chronic treat- ments in animal models may more accurately resemble what is required in order to obtain the pharmaceutical effects in clinical practice, and it may help investigat- ing the long-term mechanisms involved in stimulus- induced neuronal plasticity. Typical and atypical antipsychotics have been demon- strated to affect differently neuronal gene expression in several preclinical paradigms (Angulo et al., 1990; Mer- chant and Dorsa, 1993; Robertson and Fibiger, 1992; Semba et al., 1996). In previous studies, we have shown that Homer 1 is strongly upregulated in caudate-puta- men and nucleus accumbens by haloperidol and only in accumbens by atypical antipsychotics such as clozapine and olanzapine (de Bartolomeis et al., 2002; Polese et al., 2002). Thus we have proposed the regulation of Homer 1 gene expression in rat striatum as a novel preclinical characterization of antipsychotics. Proteins of the Homer family are products of three distinct genes in mammals. They are localized at the Contract grant sponsor: AstraZeneca Italia. *Correspondence to: Andrea de Bartolomeis, Laboratory of Molecular Psychi- atry and Psychopharmacotherapy, Section of Psychiatry, Department of Neuro- science and Behavioral Science, University School of Medicine ‘‘Federico II,’’ Edificio 18, Via Pansini 5, Naples 80131, Italy. E-mail: [email protected] Received 4 September 2006; Accepted 19 December 2006 DOI 10.1002/syn.20385 Published online in Wiley InterScience (www.interscience.wiley.com). V V C 2007 WILEY-LISS, INC. SYNAPSE 61:429–439 (2007)
-
Upload
independent -
Category
Documents
-
view
3 -
download
0
Transcript of Differential expression ofHomer 1 gene by acute and chronic administration of antipsychotics and...
Differential Expression of Homer 1 Geneby Acute and Chronic Administration of
Antipsychotics and Dopamine TransporterInhibitors in the Rat Forebrain
ALBERTO AMBESI-IMPIOMBATO, FABIO PANARIELLO, CARMELA DELL’AVERSANO,CARMINE TOMASETTI, GIOVANNI MUSCETTOLA, AND ANDREA DE BARTOLOMEIS*
Laboratory of Molecular Psychiatry and Psychopharmacotherapy, Section of Psychiatry,Department of Neuroscience, University School of Medicine ‘‘Federico II,’’ Naples 80131, Italy
KEY WORDS glutamate; schizophrenia; quetiapine; haloperidol; GBR 12909;ania-3; Homer 1a; gene expression
ABSTRACT Neuronal expression of immediate-early genes in response to a drug isa powerful screening tool for dissecting anatomical and functional brain circuitry affectedby psychoactive compounds. We examined the effect of dopaminergic perturbation ontwo Homer 1 gene splice variants, Homer 1a and ania-3, in rat forebrain. Rats weretreated with the ‘‘typical’’ antipsychotic haloperidol, the ‘‘atypical’’ quetiapine, or theselective dopamine transporter (DAT) inhibitor GBR 12909 in acute and chronic para-digms. Our results show that the high affinity dopamine D2 receptor antagonist haloperi-dol strongly induces Homer 1 gene expression in the caudate-putamen, whereas quetia-pine, a fast D2R dissociating antagonist, does not. This confirms that Homer 1 may beconsidered a predictor of ‘‘atypicality’’ of antipsychotic compounds in acute and alsochronic regimens. Chronic treatment with GBR 12909 showed a strong induction in theparietal cortex, resembling the activation of ‘‘sensitization’’ circuitry by stimulants.Finally, we describe a differential spatial induction pattern of Homer 1 gene within thecaudate-putamen by typical antipsychotics and DAT blockers, and propose a novelmethod to quantitate it. Synapse 61:429–439, 2007. VVC 2007 Wiley-Liss, Inc.
INTRODUCTION
Antipsychotic drugs are the mainstay of the treat-ment of schizophrenia. The new class of drugs referredto as ‘‘atypical’’ antipsychotics is now extensivelyadopted as pharmacological therapy of psychoticpatients (Lieberman et al., 2005). Compared with the‘‘typical’’ antipsychotics, these newer medications areequally effective in reducing the positive symptomslike hallucinations and delusions, and have a lowerincidence of extrapyramidal side effects (EPSEs)(Arnt, 1998). Neuronal expression of immediate-earlygenes (IEGs) such as c-fos in response to antipsy-chotics (Morgan and Curran, 1991) may provide a bet-ter tool for the screening of their pharmacological pro-file, and for understanding the mechanisms thatunderlie the distinctive clinical features of atypicalantipsychotics. Sampling the response to chronic treat-ments in animal models may more accurately resemblewhat is required in order to obtain the pharmaceuticaleffects in clinical practice, and it may help investigat-ing the long-term mechanisms involved in stimulus-induced neuronal plasticity.
Typical and atypical antipsychotics have been demon-strated to affect differently neuronal gene expression inseveral preclinical paradigms (Angulo et al., 1990; Mer-chant and Dorsa, 1993; Robertson and Fibiger, 1992;Semba et al., 1996). In previous studies, we have shownthat Homer 1 is strongly upregulated in caudate-puta-men and nucleus accumbens by haloperidol and only inaccumbens by atypical antipsychotics such as clozapineand olanzapine (de Bartolomeis et al., 2002; Polese et al.,2002). Thus we have proposed the regulation of Homer 1gene expression in rat striatum as a novel preclinicalcharacterization of antipsychotics.
Proteins of the Homer family are products of threedistinct genes in mammals. They are localized at the
Contract grant sponsor: AstraZeneca Italia.
*Correspondence to: Andrea de Bartolomeis, Laboratory of Molecular Psychi-atry and Psychopharmacotherapy, Section of Psychiatry, Department of Neuro-science and Behavioral Science, University School of Medicine ‘‘Federico II,’’Edificio 18, Via Pansini 5, Naples 80131, Italy. E-mail: [email protected]
Received 4 September 2006; Accepted 19 December 2006
DOI 10.1002/syn.20385
Published online in Wiley InterScience (www.interscience.wiley.com).
VVC 2007 WILEY-LISS, INC.
SYNAPSE 61:429–439 (2007)
postsynaptic density (PSD) of excitatory synapses andinteract through a conserved amino-terminal EVH1domain which binds to a proline rich sequence, withthe C-terminal intracellular tail of group 1 metabo-tropic glutamate receptors (mGluRs), inositol 1-4-5-tri-phosphate receptor, ryanodine receptors, transientreceptors potential canonical-1 ion channels, and theNMDA glutamate receptor scaffolding protein shank(Tu et al., 1998; Xiao et al., 1998). Through its C-termi-nus coiled-coil (CC) domain, Homer proteins multimer-ize, creating a reticular machinery at the PSD. Homer1 gene encodes for a number of transcriptional var-iants some of which, such as Homer 1a and ania-3, areinduced as IEGs and play a relevant and direct role inthe modulation of glutamate synaptic plasticity at thelevel of the PSD. Both stimulus-responsive isoformscontain the EVH1 domain but lack the CC motifrequired for dimerization (Bottai et al., 2002), actingas natural ‘‘dominant negatives’’ by disrupting CC-Homer interactions with EVH1-bound proteins (Xiaoet al., 1998). Their overexpression ultimately results ina modification of synaptic architecture (Sala et al.,2003), a redistribution of CC-Homer expression (Inoueet al., 2004), and an alteration in excitatory synaptictransmission (Hennou et al., 2003; Minami et al.,2003). Homer 1a and ania-3 proteins differ only intheir C-terminal 10 and 41 amino acids, respectively,and it is not known whether they are differentiallyregulated, or if this difference in their amino acidsequence has any functional consequence. Homer 1gene family is implicated in several behavioral disor-ders (de Bartolomeis and Iasevoli, 2003; Lominacet al., 2005; Szumlinski et al., 2006b), such as schizo-phrenia (Norton et al., 2003; Szumlinski et al., 2005a),fragile X syndrome (Giuffrida et al., 2005), alcohol de-pendence (Szumlinski et al., 2005b), cocaine addiction(Dahl et al., 2005; Kalivas et al., 2004; Swanson et al.,2001; Szumlinski et al., 2004, 2006a), as well as motordysfunction (Tappe and Kuner, 2006).
In the present study, we investigated the differentialeffects of several agents that modulate the dopaminer-gic neurotransmission on Homer 1a and ania-3 geneexpression by means of quantitative in situ hybridiza-tion on rat forebrain slices. The treatments includedthe typical antipsychotic haloperidol and the atypicalquetiapine, as well as the dopamine transporter (DAT)inhibitor GBR 12909, all in acute and chronic regi-mens. Stimulants such as cocaine and amphetamineare also known to induce IEGs, and specifically Homer1 (Berke et al., 1998; Brakeman et al., 1997; Fujiyamaet al., 2003; Yano and Steiner, 2005). Moreover, theexpression patterns of stimulant-induced IEGs can bedirectly affected by pretreatment schedules (Curranet al., 1996). Since both antipsychotics and DAT inhibi-tors, with opposite effects on dopamine transmission,are known to upregulate Homer 1 gene expression, weattempted to detect any subtle differential response to
stimulating versus blocking dopamine transmission.With the chronic treatment schedule, we tried toassess whether there is tolerance phenomena toHomer 1a induction as found for IEG induction afterrepeated stimulant administration (Persico et al.,1993).
MATERIALS AND METHODSAnimals
Male Sprague–Dawley rats of �250 g were obtainedfrom Charles River Laboratories Italia (Lecco, Italy).The animals were housed and let to adapt to humanhandling in a temperature and humidity controlledcolony room with 12/12-h light/dark cycle (lights onfrom 6:00 a.m. to 6:00 p.m.) with ad libitum access tolab chow and water. All procedures were conducted inaccordance with the NIH Guide for Care and Use ofLaboratory Animals (NIH Publ. no. 85-23, revised,1985) and were approved by local Animal Care andUse Committee.
Drug treatment and tissue preparation
Quetiapine, as opposed to haloperidol, binds to thedopamine D2 receptor (D2R) with fast dissociation dy-namics, which is correlated to low propensity of thisdrug to induce EPSEs (Kapur et al., 2000b). In preclin-ical studies, quetiapine has been shown to have a clo-zapine-like activity in a wide range of behavioral andbiochemical tests, while showing no significant liabilityfor hematological side effects, such as neutropenia(Nemeroff et al., 2002). The selective DAT blocker GBR12909, also known as vanoxerine (1-{2-[bis-(4-fluoro-phenyl)methoxy]ethyl]}-4-(3-phenylpropyl)piperazine),shares the same mechanism of action as cocaine, as itblocks dopamine reuptake by selectively binding to theDAT. A DAT inhibitor was included in our experimentsbecause dopamine reuptake inhibitors have beenshown to regulate Homer 1 gene products in a region-ally selective manner (Swanson et al., 2001), andbecause Homer 1a is strongly induced in the striatumby cocaine (Brakeman et al., 1997).
Acute experiment
On the day of the experiment, rats were randomlyassigned to one of the following treatment groups: (a)0.9% NaCl (SAL); (b) 15 mg/kg quetiapine (QUE15); (c)30 mg/kg quetiapine (QUE30); (d) haloperidol 0.8 mg/kg (HAL); (e) GBR 12909 30 mg/kg (GBR). The animalswere sacrificed by decapitation 90 min after the treat-ment.
Chronic experiment
Rats were treated daily for 21 days after theirassignment to the following experimental groups: (a)0.9% NaCl (SAL); (b) 15 mg/kg quetiapine (QUE) (the
430 A. AMBESI-IMPIOMBATO ET AL.
Synapse DOI 10.1002/syn
daily dose was divided in two administration 12 h apart); (c) haloperidol 0.8 mg/kg (HAL); (d) GBR 1290915 mg/kg (GBR).
The drug dosages of the antipsychotics were chosenbased on previous animal studies in which behavioraleffects are elicited that are predictive of antipsychoticactivity. A dose ranging from 5 to 20 mg/kg is used inone acute study (Pira et al., 2004) and our choice ofusing the lower dose for the chronic quetiapine treat-ment is consistent with recent studies (He et al., 2006;Park et al., 2006). The dose of haloperidol most com-monly used in rat brain gene expression studies is1 mg/kg (Cochran et al., 2002; Merchant and Dorsa,1993; Robertson and Fibiger, 1992). However, somecontroversy has recently arisen over the appropriate-ness of this dose in animal studies (Kapur et al.,2000a), which might be considered too high when com-paring the effects of haloperidol to newer compoundsin most previous studies. Our dose of haloperidol is20% lower than the standard 1 mg/kg, thus it is con-sistent with the range 0.25–1 mg/kg used in a morerecent study (Rushlow et al., 2005), yet it might beargued that the haloperidol to quetiapine dose ratio wehave used is still higher than that clinically used inhumans. The dose of GBR 12909 is consistent witha previous study in which submaximal behavioral res-ponses are obtained (Lane et al., 2005). All treatmentswere performed intraperitoneally (ip).
The animals were sacrificed by decapitation 90 minafter the last injection. The brains were rapidly re-moved, quickly frozen on powdered dry ice, and storedat �708C prior to sectioning.
Tissue sectioning
Serial coronal sections of 12 mm were cut on a cryo-stat at �188C through the forebrain, using the ratbrain atlas by Paxinos and Watson (1997) as an ana-tomical reference (approximately from Bregma 1.20 to1.00 mm). Care was taken to select identical anatomi-cal levels of treated and control sections using thionin-stained reference slides. Sections were thaw-mountedonto gelatin-coated slides, and stored at �708C for sub-sequent analysis.
Radiolabeling and purification ofoligonucleotide probes
The Homer 1a probe was a 48-base oligodeoxyribo-nucleotide complementary to bases 2527–2574 of therat Homer mRNA (GenBank no. U92079) (MWG Bio-tech, Firenze, Italy). The ania-3 probe was a 48-baseoligodeoxyribonucleotide complementary to bases1847–1894 of the rat ania-3 mRNA (GenBank no.AF030088) (MWG Biotech). For each probe, a 50-lllabeling reaction mix was prepared on ice usingDEPC-treated water, 13 tailing buffer, 7.5 pmol/ll ofoligo, 125 U of TdT, and 100 mCi 35S-dATP. The mix
was incubated 20 min at 378C. The unincorporated nu-cleotides were separated from radiolabeled DNA usingProbeQuant G-50 Micro Columns (Amersham Bio-sciences, Milano, Italy). As an assessment of the probespecificity, the autoradiographic signal distributionwas compared and found to be consistent with previ-ous in situ hybridization studies (Brakeman et al.,1997; Polese et al., 2002). The specificity of each probewas also tested by a control experiment using the cor-responding sense oligo.
In situ hybridization
Sections were processed for radioactive in situhybridization (Ambesi-Impiombato et al., 2003). Allsolutions were prepared with sterile double-distilledwater. The sections were fixed in 1.5% formaldehyde in0.12 M sodium-phosphate-buffered saline (PBS, pH7.4), quickly rinsed three times with 1� PBS, andplaced in 0.25% acetic anhydride in 0.1 M triethanol-amine/0.9% NaCl, pH 8.0, for 10 min. Next, the sec-tions were dehydrated in 70, 80, 90, and 100% ethanol,delipidated in chloroform for 5 min, rinsed again in100 and 95% ethanol, and air dried.
Sections were hybridized with 0.4–0.6 � 106 cpm ofradiolabeled oligonucleotide in buffer containing 50%formamide, 600 mM NaCl, 80 mM Tris-HCl (pH 7.5),4 mM EDTA, 0.1% pyrophosphate, 0.2 mg/ml heparinsulfate, and 10% dextran sulfate. Slides were coveredwith coverslips and incubated at 378C in a humidchamber for 20 h. After hybridization, the coverslipswere removed in 1� SSC and the sections were washed4 � 15 min in 2� SSC/50% formamide at 408C, fol-lowed by two 30 min washes with 1� SSC at room tem-perature. The slides were rapidly rinsed in distilledwater and then in 70% ethanol.
Autoradiography
The sections were dried and exposed to Kodak-Biomax MR Autoradiographic film (Sigma-Aldrich,Milano, Italy). A slide containing a scale of 16 knownamounts of 14C standards was coexposed with thesamples. The optimal time of exposure was chosen tomaximize signal to noise ratio but to prevent opticaldensity from approaching the limits of saturation.Film development protocol included a 1.5-min dip inthe developer solution and 3 min in the fixer.
Image analysis
The quantitation of the autoradiographic signal wasperformed using a computerized image analysis sys-tem including a transparency film scanner ScanMaker9800 XL (Microtek Europe B.V., Rotterdam, The Neth-erlands), an Apple PowerPC G4, and ImageJ software(v. 1.36, Rasband, W.S., http://rsb.info.nih.gov/ij/). Sec-tions on film were captured individually. Each experi-
431DOPAMINE INDUCED RAT BRAIN GENE EXPRESSION
Synapse DOI 10.1002/syn
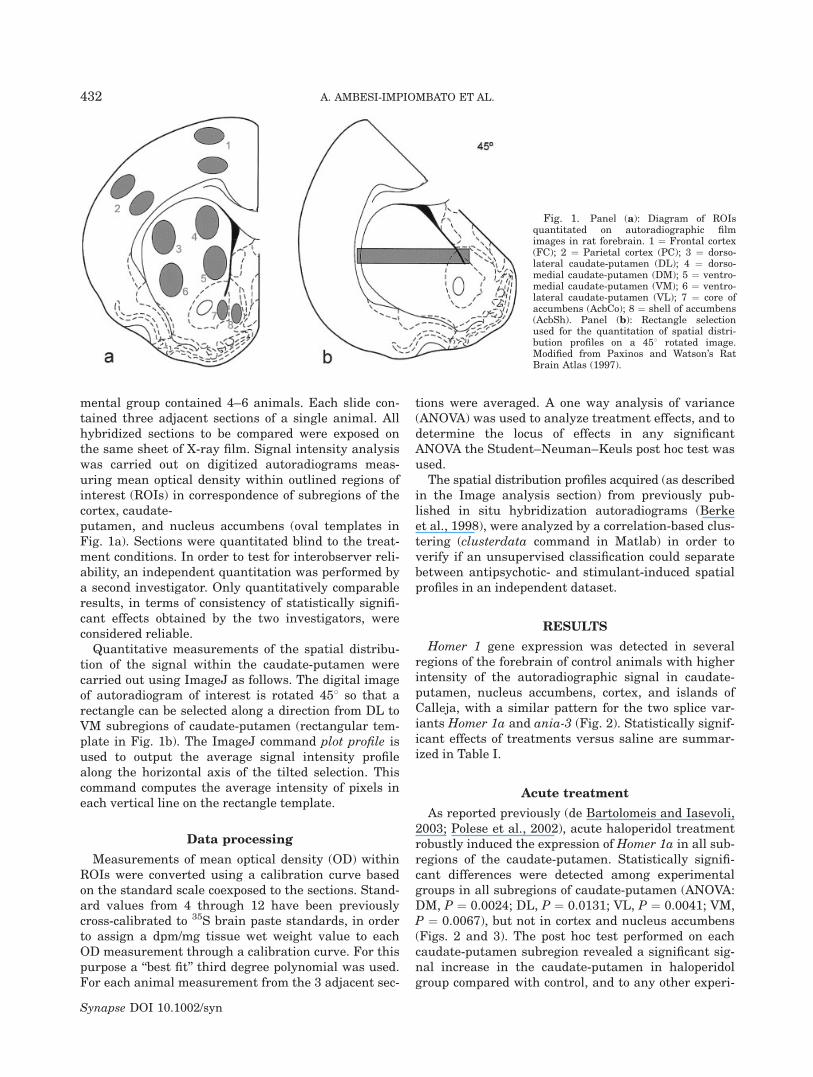
mental group contained 4–6 animals. Each slide con-tained three adjacent sections of a single animal. Allhybridized sections to be compared were exposed onthe same sheet of X-ray film. Signal intensity analysiswas carried out on digitized autoradiograms meas-uring mean optical density within outlined regions ofinterest (ROIs) in correspondence of subregions of thecortex, caudate-putamen, and nucleus accumbens (oval templates inFig. 1a). Sections were quantitated blind to the treat-ment conditions. In order to test for interobserver reli-ability, an independent quantitation was performed bya second investigator. Only quantitatively comparableresults, in terms of consistency of statistically signifi-cant effects obtained by the two investigators, wereconsidered reliable.
Quantitative measurements of the spatial distribu-tion of the signal within the caudate-putamen werecarried out using ImageJ as follows. The digital imageof autoradiogram of interest is rotated 458 so that arectangle can be selected along a direction from DL toVM subregions of caudate-putamen (rectangular tem-plate in Fig. 1b). The ImageJ command plot profile isused to output the average signal intensity profilealong the horizontal axis of the tilted selection. Thiscommand computes the average intensity of pixels ineach vertical line on the rectangle template.
Data processing
Measurements of mean optical density (OD) withinROIs were converted using a calibration curve basedon the standard scale coexposed to the sections. Stand-ard values from 4 through 12 have been previouslycross-calibrated to 35S brain paste standards, in orderto assign a dpm/mg tissue wet weight value to eachOD measurement through a calibration curve. For thispurpose a ‘‘best fit’’ third degree polynomial was used.For each animal measurement from the 3 adjacent sec-
tions were averaged. A one way analysis of variance(ANOVA) was used to analyze treatment effects, and todetermine the locus of effects in any significantANOVA the Student–Neuman–Keuls post hoc test wasused.
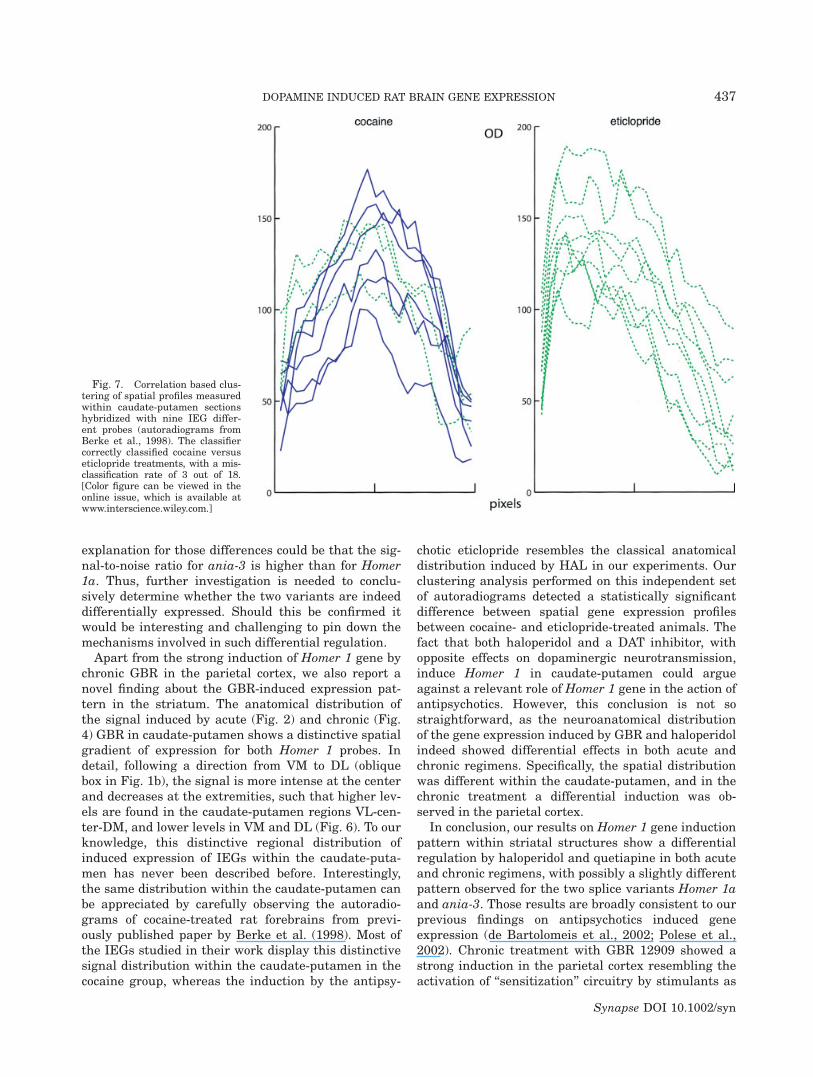
The spatial distribution profiles acquired (as describedin the Image analysis section) from previously pub-lished in situ hybridization autoradiograms (Berkeet al., 1998), were analyzed by a correlation-based clus-tering (clusterdata command in Matlab) in order toverify if an unsupervised classification could separatebetween antipsychotic- and stimulant-induced spatialprofiles in an independent dataset.
RESULTS
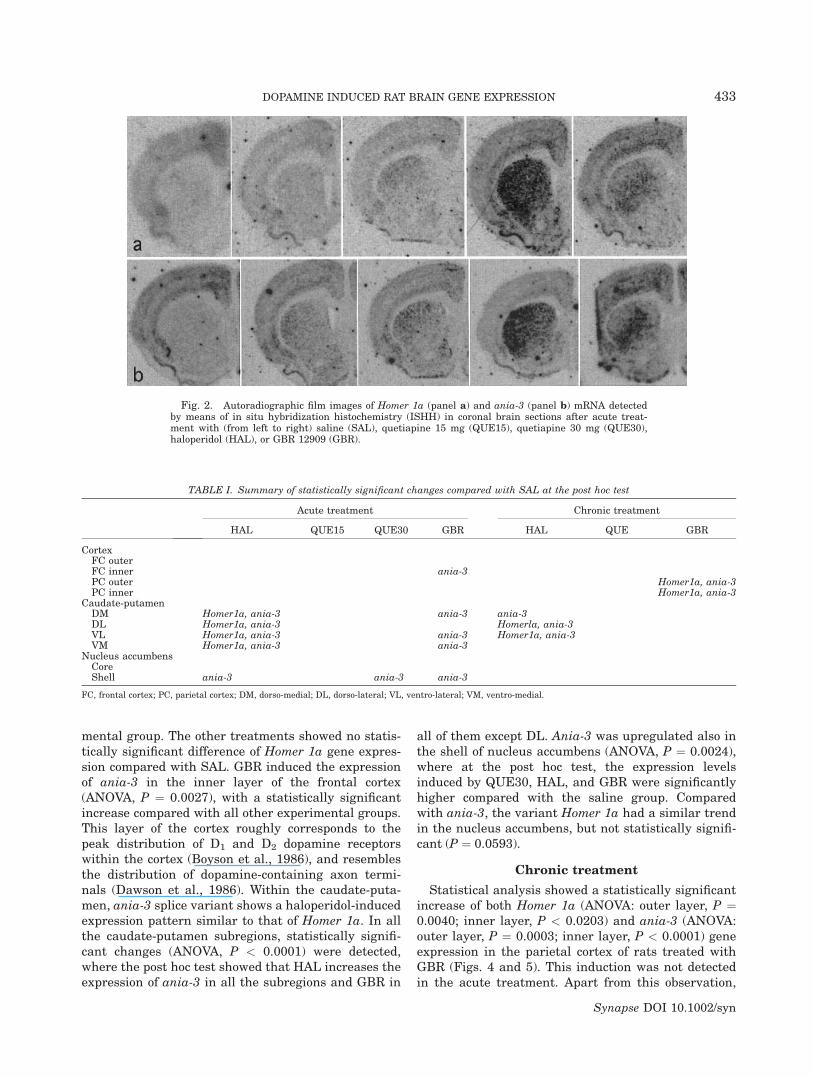
Homer 1 gene expression was detected in severalregions of the forebrain of control animals with higherintensity of the autoradiographic signal in caudate-putamen, nucleus accumbens, cortex, and islands ofCalleja, with a similar pattern for the two splice var-iants Homer 1a and ania-3 (Fig. 2). Statistically signif-icant effects of treatments versus saline are summar-ized in Table I.
Acute treatment
As reported previously (de Bartolomeis and Iasevoli,2003; Polese et al., 2002), acute haloperidol treatmentrobustly induced the expression of Homer 1a in all sub-regions of the caudate-putamen. Statistically signifi-cant differences were detected among experimentalgroups in all subregions of caudate-putamen (ANOVA:DM, P ¼ 0.0024; DL, P ¼ 0.0131; VL, P ¼ 0.0041; VM,P ¼ 0.0067), but not in cortex and nucleus accumbens(Figs. 2 and 3). The post hoc test performed on eachcaudate-putamen subregion revealed a significant sig-nal increase in the caudate-putamen in haloperidolgroup compared with control, and to any other experi-
Fig. 1. Panel (a): Diagram of ROIsquantitated on autoradiographic filmimages in rat forebrain. 1 ¼ Frontal cortex(FC); 2 ¼ Parietal cortex (PC); 3 ¼ dorso-lateral caudate-putamen (DL); 4 ¼ dorso-medial caudate-putamen (DM); 5 ¼ ventro-medial caudate-putamen (VM); 6 ¼ ventro-lateral caudate-putamen (VL); 7 ¼ core ofaccumbens (AcbCo); 8 ¼ shell of accumbens(AcbSh). Panel (b): Rectangle selectionused for the quantitation of spatial distri-bution profiles on a 458 rotated image.Modified from Paxinos and Watson’s RatBrain Atlas (1997).
432 A. AMBESI-IMPIOMBATO ET AL.
Synapse DOI 10.1002/syn
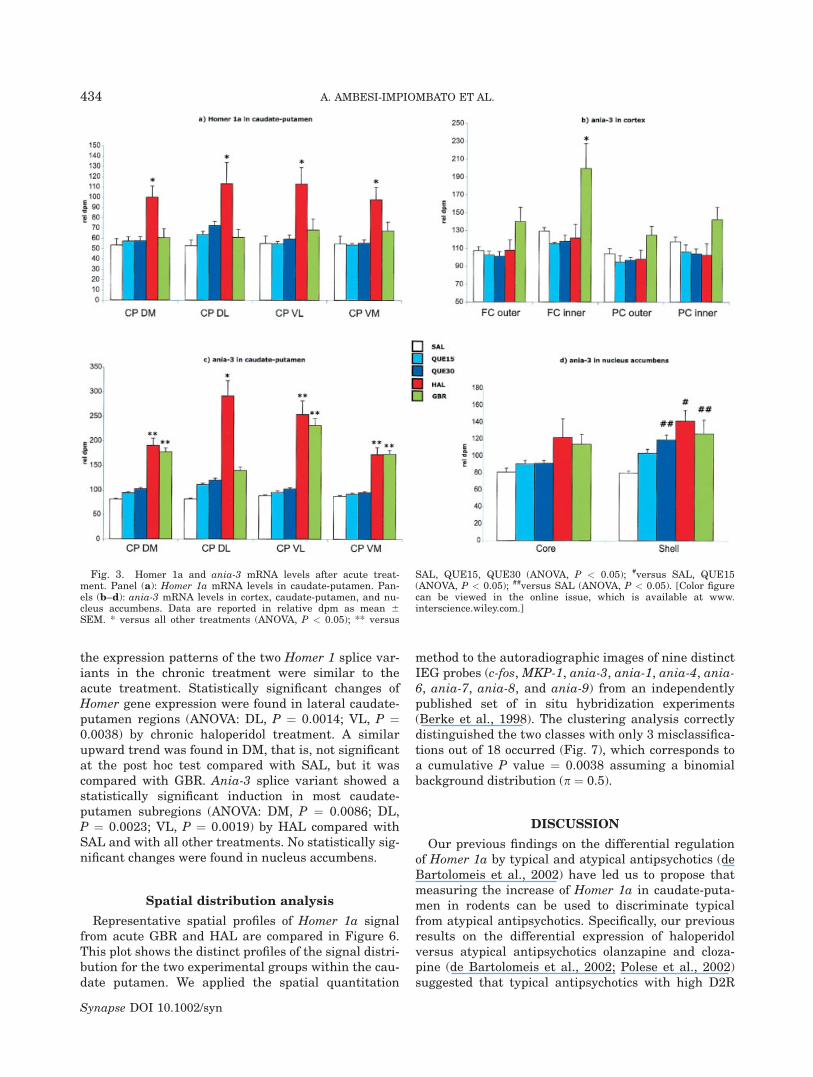
mental group. The other treatments showed no statis-tically significant difference of Homer 1a gene expres-sion compared with SAL. GBR induced the expressionof ania-3 in the inner layer of the frontal cortex(ANOVA, P ¼ 0.0027), with a statistically significantincrease compared with all other experimental groups.This layer of the cortex roughly corresponds to thepeak distribution of D1 and D2 dopamine receptorswithin the cortex (Boyson et al., 1986), and resemblesthe distribution of dopamine-containing axon termi-nals (Dawson et al., 1986). Within the caudate-puta-men, ania-3 splice variant shows a haloperidol-inducedexpression pattern similar to that of Homer 1a. In allthe caudate-putamen subregions, statistically signifi-cant changes (ANOVA, P < 0.0001) were detected,where the post hoc test showed that HAL increases theexpression of ania-3 in all the subregions and GBR in
all of them except DL. Ania-3 was upregulated also inthe shell of nucleus accumbens (ANOVA, P ¼ 0.0024),where at the post hoc test, the expression levelsinduced by QUE30, HAL, and GBR were significantlyhigher compared with the saline group. Comparedwith ania-3, the variant Homer 1a had a similar trendin the nucleus accumbens, but not statistically signifi-cant (P ¼ 0.0593).
Chronic treatment
Statistical analysis showed a statistically significantincrease of both Homer 1a (ANOVA: outer layer, P ¼0.0040; inner layer, P < 0.0203) and ania-3 (ANOVA:outer layer, P ¼ 0.0003; inner layer, P < 0.0001) geneexpression in the parietal cortex of rats treated withGBR (Figs. 4 and 5). This induction was not detectedin the acute treatment. Apart from this observation,
Fig. 2. Autoradiographic film images of Homer 1a (panel a) and ania-3 (panel b) mRNA detectedby means of in situ hybridization histochemistry (ISHH) in coronal brain sections after acute treat-ment with (from left to right) saline (SAL), quetiapine 15 mg (QUE15), quetiapine 30 mg (QUE30),haloperidol (HAL), or GBR 12909 (GBR).
TABLE I. Summary of statistically significant changes compared with SAL at the post hoc test
Acute treatment Chronic treatment
HAL QUE15 QUE30 GBR HAL QUE GBR
CortexFC outerFC inner ania-3PC outer Homer1a, ania-3PC inner Homer1a, ania-3
Caudate-putamenDM Homer1a, ania-3 ania-3 ania-3DL Homer1a, ania-3 Homerla, ania-3VL Homer1a, ania-3 ania-3 Homer1a, ania-3VM Homer1a, ania-3 ania-3
Nucleus accumbensCoreShell ania-3 ania-3 ania-3
FC, frontal cortex; PC, parietal cortex; DM, dorso-medial; DL, dorso-lateral; VL, ventro-lateral; VM, ventro-medial.
433DOPAMINE INDUCED RAT BRAIN GENE EXPRESSION
Synapse DOI 10.1002/syn
the expression patterns of the two Homer 1 splice var-iants in the chronic treatment were similar to theacute treatment. Statistically significant changes ofHomer gene expression were found in lateral caudate-putamen regions (ANOVA: DL, P ¼ 0.0014; VL, P ¼0.0038) by chronic haloperidol treatment. A similarupward trend was found in DM, that is, not significantat the post hoc test compared with SAL, but it wascompared with GBR. Ania-3 splice variant showed astatistically significant induction in most caudate-putamen subregions (ANOVA: DM, P ¼ 0.0086; DL,P ¼ 0.0023; VL, P ¼ 0.0019) by HAL compared withSAL and with all other treatments. No statistically sig-nificant changes were found in nucleus accumbens.
Spatial distribution analysis
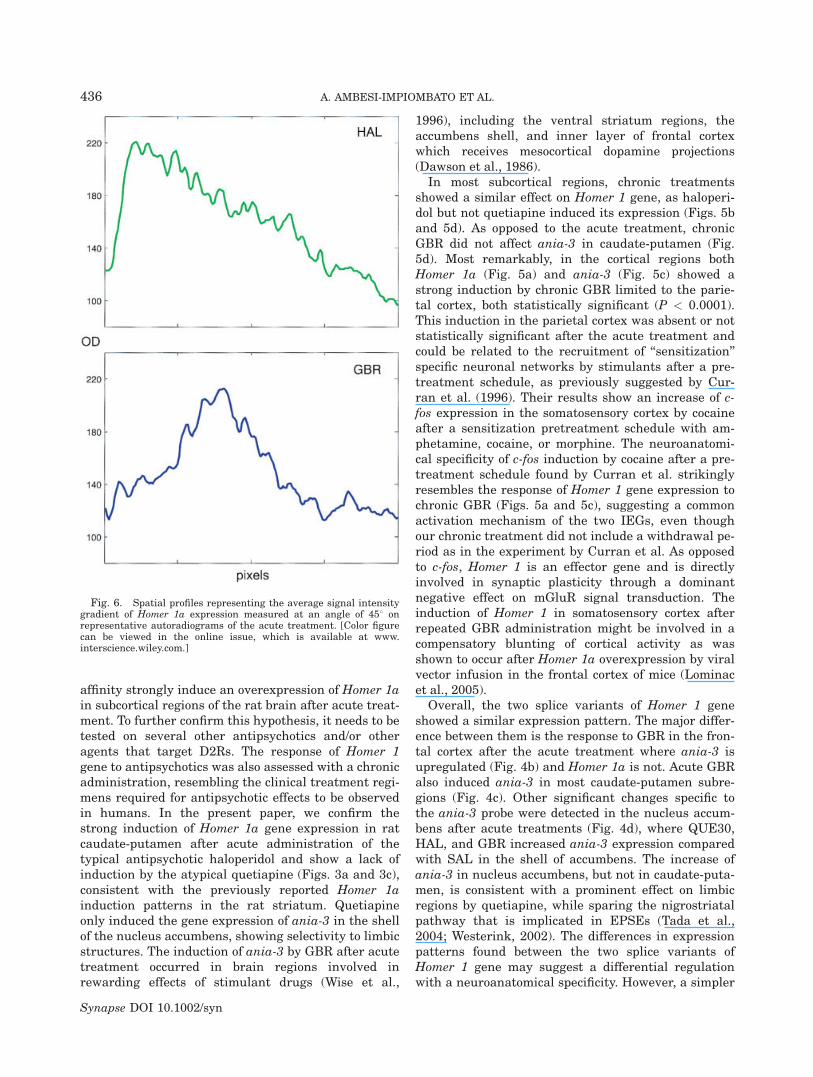
Representative spatial profiles of Homer 1a signalfrom acute GBR and HAL are compared in Figure 6.This plot shows the distinct profiles of the signal distri-bution for the two experimental groups within the cau-date putamen. We applied the spatial quantitation
method to the autoradiographic images of nine distinctIEG probes (c-fos, MKP-1, ania-3, ania-1, ania-4, ania-6, ania-7, ania-8, and ania-9) from an independentlypublished set of in situ hybridization experiments(Berke et al., 1998). The clustering analysis correctlydistinguished the two classes with only 3 misclassifica-tions out of 18 occurred (Fig. 7), which corresponds toa cumulative P value ¼ 0.0038 assuming a binomialbackground distribution (p ¼ 0.5).
DISCUSSION
Our previous findings on the differential regulationof Homer 1a by typical and atypical antipsychotics (deBartolomeis et al., 2002) have led us to propose thatmeasuring the increase of Homer 1a in caudate-puta-men in rodents can be used to discriminate typicalfrom atypical antipsychotics. Specifically, our previousresults on the differential expression of haloperidolversus atypical antipsychotics olanzapine and cloza-pine (de Bartolomeis et al., 2002; Polese et al., 2002)suggested that typical antipsychotics with high D2R
Fig. 3. Homer 1a and ania-3 mRNA levels after acute treat-ment. Panel (a): Homer 1a mRNA levels in caudate-putamen. Pan-els (b–d): ania-3 mRNA levels in cortex, caudate-putamen, and nu-cleus accumbens. Data are reported in relative dpm as mean 6SEM. * versus all other treatments (ANOVA, P < 0.05); ** versus
SAL, QUE15, QUE30 (ANOVA, P < 0.05); #versus SAL, QUE15(ANOVA, P < 0.05); ##versus SAL (ANOVA, P < 0.05). [Color figurecan be viewed in the online issue, which is available at www.interscience.wiley.com.]
434 A. AMBESI-IMPIOMBATO ET AL.
Synapse DOI 10.1002/syn
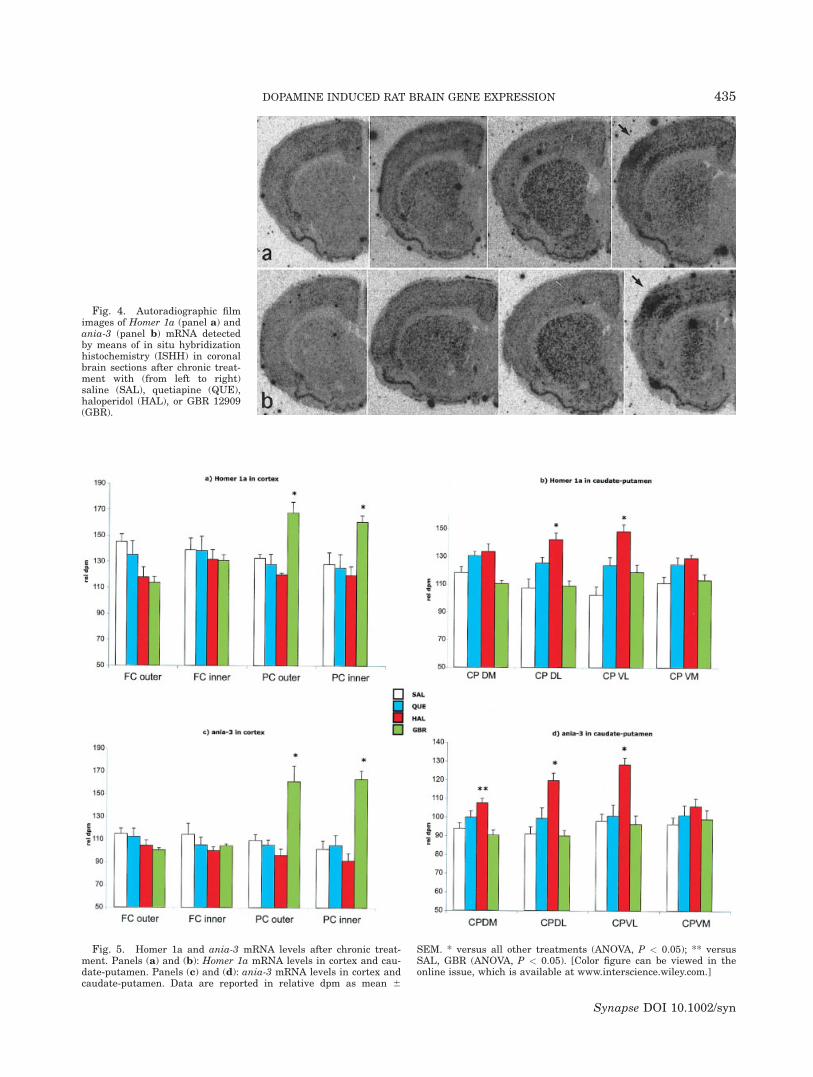
Fig. 4. Autoradiographic filmimages of Homer 1a (panel a) andania-3 (panel b) mRNA detectedby means of in situ hybridizationhistochemistry (ISHH) in coronalbrain sections after chronic treat-ment with (from left to right)saline (SAL), quetiapine (QUE),haloperidol (HAL), or GBR 12909(GBR).
Fig. 5. Homer 1a and ania-3 mRNA levels after chronic treat-ment. Panels (a) and (b): Homer 1a mRNA levels in cortex and cau-date-putamen. Panels (c) and (d): ania-3 mRNA levels in cortex andcaudate-putamen. Data are reported in relative dpm as mean 6
SEM. * versus all other treatments (ANOVA, P < 0.05); ** versusSAL, GBR (ANOVA, P < 0.05). [Color figure can be viewed in theonline issue, which is available at www.interscience.wiley.com.]
435DOPAMINE INDUCED RAT BRAIN GENE EXPRESSION
Synapse DOI 10.1002/syn
affinity strongly induce an overexpression of Homer 1ain subcortical regions of the rat brain after acute treat-ment. To further confirm this hypothesis, it needs to betested on several other antipsychotics and/or otheragents that target D2Rs. The response of Homer 1gene to antipsychotics was also assessed with a chronicadministration, resembling the clinical treatment regi-mens required for antipsychotic effects to be observedin humans. In the present paper, we confirm thestrong induction of Homer 1a gene expression in ratcaudate-putamen after acute administration of thetypical antipsychotic haloperidol and show a lack ofinduction by the atypical quetiapine (Figs. 3a and 3c),consistent with the previously reported Homer 1ainduction patterns in the rat striatum. Quetiapineonly induced the gene expression of ania-3 in the shellof the nucleus accumbens, showing selectivity to limbicstructures. The induction of ania-3 by GBR after acutetreatment occurred in brain regions involved inrewarding effects of stimulant drugs (Wise et al.,
1996), including the ventral striatum regions, theaccumbens shell, and inner layer of frontal cortexwhich receives mesocortical dopamine projections(Dawson et al., 1986).
In most subcortical regions, chronic treatmentsshowed a similar effect on Homer 1 gene, as haloperi-dol but not quetiapine induced its expression (Figs. 5band 5d). As opposed to the acute treatment, chronicGBR did not affect ania-3 in caudate-putamen (Fig.5d). Most remarkably, in the cortical regions bothHomer 1a (Fig. 5a) and ania-3 (Fig. 5c) showed astrong induction by chronic GBR limited to the parie-tal cortex, both statistically significant (P < 0.0001).This induction in the parietal cortex was absent or notstatistically significant after the acute treatment andcould be related to the recruitment of ‘‘sensitization’’specific neuronal networks by stimulants after a pre-treatment schedule, as previously suggested by Cur-ran et al. (1996). Their results show an increase of c-fos expression in the somatosensory cortex by cocaineafter a sensitization pretreatment schedule with am-phetamine, cocaine, or morphine. The neuroanatomi-cal specificity of c-fos induction by cocaine after a pre-treatment schedule found by Curran et al. strikinglyresembles the response of Homer 1 gene expression tochronic GBR (Figs. 5a and 5c), suggesting a commonactivation mechanism of the two IEGs, even thoughour chronic treatment did not include a withdrawal pe-riod as in the experiment by Curran et al. As opposedto c-fos, Homer 1 is an effector gene and is directlyinvolved in synaptic plasticity through a dominantnegative effect on mGluR signal transduction. Theinduction of Homer 1 in somatosensory cortex afterrepeated GBR administration might be involved in acompensatory blunting of cortical activity as wasshown to occur after Homer 1a overexpression by viralvector infusion in the frontal cortex of mice (Lominacet al., 2005).
Overall, the two splice variants of Homer 1 geneshowed a similar expression pattern. The major differ-ence between them is the response to GBR in the fron-tal cortex after the acute treatment where ania-3 isupregulated (Fig. 4b) and Homer 1a is not. Acute GBRalso induced ania-3 in most caudate-putamen subre-gions (Fig. 4c). Other significant changes specific tothe ania-3 probe were detected in the nucleus accum-bens after acute treatments (Fig. 4d), where QUE30,HAL, and GBR increased ania-3 expression comparedwith SAL in the shell of accumbens. The increase ofania-3 in nucleus accumbens, but not in caudate-puta-men, is consistent with a prominent effect on limbicregions by quetiapine, while sparing the nigrostriatalpathway that is implicated in EPSEs (Tada et al.,2004; Westerink, 2002). The differences in expressionpatterns found between the two splice variants ofHomer 1 gene may suggest a differential regulationwith a neuroanatomical specificity. However, a simpler
Fig. 6. Spatial profiles representing the average signal intensitygradient of Homer 1a expression measured at an angle of 458 onrepresentative autoradiograms of the acute treatment. [Color figurecan be viewed in the online issue, which is available at www.interscience.wiley.com.]
436 A. AMBESI-IMPIOMBATO ET AL.
Synapse DOI 10.1002/syn
explanation for those differences could be that the sig-nal-to-noise ratio for ania-3 is higher than for Homer1a. Thus, further investigation is needed to conclu-sively determine whether the two variants are indeeddifferentially expressed. Should this be confirmed itwould be interesting and challenging to pin down themechanisms involved in such differential regulation.
Apart from the strong induction of Homer 1 gene bychronic GBR in the parietal cortex, we also report anovel finding about the GBR-induced expression pat-tern in the striatum. The anatomical distribution ofthe signal induced by acute (Fig. 2) and chronic (Fig.4) GBR in caudate-putamen shows a distinctive spatialgradient of expression for both Homer 1 probes. Indetail, following a direction from VM to DL (obliquebox in Fig. 1b), the signal is more intense at the centerand decreases at the extremities, such that higher lev-els are found in the caudate-putamen regions VL-cen-ter-DM, and lower levels in VM and DL (Fig. 6). To ourknowledge, this distinctive regional distribution ofinduced expression of IEGs within the caudate-puta-men has never been described before. Interestingly,the same distribution within the caudate-putamen canbe appreciated by carefully observing the autoradio-grams of cocaine-treated rat forebrains from previ-ously published paper by Berke et al. (1998). Most ofthe IEGs studied in their work display this distinctivesignal distribution within the caudate-putamen in thecocaine group, whereas the induction by the antipsy-
chotic eticlopride resembles the classical anatomicaldistribution induced by HAL in our experiments. Ourclustering analysis performed on this independent setof autoradiograms detected a statistically significantdifference between spatial gene expression profilesbetween cocaine- and eticlopride-treated animals. Thefact that both haloperidol and a DAT inhibitor, withopposite effects on dopaminergic neurotransmission,induce Homer 1 in caudate-putamen could argueagainst a relevant role of Homer 1 gene in the action ofantipsychotics. However, this conclusion is not sostraightforward, as the neuroanatomical distributionof the gene expression induced by GBR and haloperidolindeed showed differential effects in both acute andchronic regimens. Specifically, the spatial distributionwas different within the caudate-putamen, and in thechronic treatment a differential induction was ob-served in the parietal cortex.
In conclusion, our results on Homer 1 gene inductionpattern within striatal structures show a differentialregulation by haloperidol and quetiapine in both acuteand chronic regimens, with possibly a slightly differentpattern observed for the two splice variants Homer 1aand ania-3. Those results are broadly consistent to ourprevious findings on antipsychotics induced geneexpression (de Bartolomeis et al., 2002; Polese et al.,2002). Chronic treatment with GBR 12909 showed astrong induction in the parietal cortex resembling theactivation of ‘‘sensitization’’ circuitry by stimulants as
Fig. 7. Correlation based clus-tering of spatial profiles measuredwithin caudate-putamen sectionshybridized with nine IEG differ-ent probes (autoradiograms fromBerke et al., 1998). The classifiercorrectly classified cocaine versuseticlopride treatments, with a mis-classification rate of 3 out of 18.[Color figure can be viewed in theonline issue, which is available atwww.interscience.wiley.com.]
437DOPAMINE INDUCED RAT BRAIN GENE EXPRESSION
Synapse DOI 10.1002/syn
shown for c-fos. Finally, our results provide strong evi-dence, compatible with independently published imag-ing data, of a differential anatomical induction patternby agents that directly affect dopaminergic neuro-transmission, namely, (typical) antipsychotics andDAT blockers.
REFERENCES
Ambesi-Impiombato A, D’Urso G, Muscettola G, de Bartolomeis A.2003. Method for quantitative in situ hybridization histochemistryand image analysis applied for Homer 1a gene expression in ratbrain. Brain Res Brain Res Protoc 11:189–196.
Angulo JA, Cadet JL, McEwen BS. 1990. Effect of typical and atypi-cal neuroleptic treatment on protachykinin mRNA levels in thestriatum of the rat. Neurosci Lett 113:217–221.
Arnt J. 1998. Pharmacological differentiation of classical and novelantipsychotics. Int Clin Psychopharmacol 13(Suppl 3):S7–S14.
Berke JD, Paletzki RF, Aronson GJ, Hyman SE, Gerfen CR. 1998. Acomplex program of striatal gene expression induced by dopami-nergic stimulation. J Neurosci 18:5301–5310.
Bottai D, Guzowski JF, Schwarz MK, Kang SH, Xiao B, Lanahan A,Worley PF, Seeburg PH. 2002. Synaptic activity-induced conver-sion of intronic to exonic sequence in Homer 1 immediate earlygene expression. J Neurosci 22:167–175.
Boyson SJ, McGonigle P, Molinoff PB. 1986. Quantitative autoradio-graphic localization of the D1 and D2 subtypes of dopamine recep-tors in rat brain. J Neurosci 6:3177–3188.
Brakeman PR, Lanahan AA, O’Brien R, Roche K, Barnes CA, Huga-nir RL, Worley PF. 1997. Homer: A protein that selectively bindsmetabotropic glutamate receptors. Nature 386:284–288.
Cochran SM, McKerchar CE, Morris BJ, Pratt JA. 2002. Inductionof differential patterns of local cerebral glucose metabolism andimmediate-early genes by acute clozapine and haloperidol. Neuro-pharmacology 43:394–407.
Curran EJ, Akil H, Watson SJ. 1996. Psychomotor stimulant- andopiate-induced c-fos mRNA expression patterns in the rat fore-brain: Comparisons between acute drug treatment and a drugchallenge in sensitized animals. Neurochem Res 21:1425–1435.
Dahl JP, Kampman KM, Oslin DW, Weller AE, Lohoff FW, FerraroTN, O’Brien CP, Berrettini WH. 2005. Association of a polymor-phism in the Homer1 gene with cocaine dependence in an AfricanAmerican population. Psychiatr Genet 15:277–283.
Dawson TM, Gehlert DR, McCabe RT, Barnett A, Wamsley JK.1986. D-1 dopamine receptors in the rat brain: A quantitative au-toradiographic analysis. J Neurosci 6:2352–2365.
de Bartolomeis A, Iasevoli F. 2003. The Homer family and the signaltransduction system at glutamatergic postsynaptic density: Poten-tial role in behavior and pharmacotherapy. Psychopharmacol Bull37:51–83.
de Bartolomeis A, Aloj L, Ambesi-Impiombato A, Bravi D, Caraco C,Muscettola G, Barone P. 2002. Acute administration of antipsy-chotics modulates Homer striatal gene expression differentially.Brain Res Mol Brain Res 98(1/2):124–129.
Fujiyama K, Kajii Y, Hiraoka S, Nishikawa T. 2003. Differential reg-ulation by stimulants of neocortical expression of mrt1, arc, andhomer1a mRNA in the rats treated with repeated methamphet-amine. Synapse 49:143–149.
Giuffrida R, Musumeci S, D’Antoni S, Bonaccorso CM, Giuffrida-Stella AM, Oostra BA, Catania MV. 2005. A reduced number ofmetabotropic glutamate subtype 5 receptors are associated withconstitutive homer proteins in a mouse model of fragile X syn-drome. J Neurosci 25:8908–8916.
He J, Yang Y, Yu Y, Li X, Li XM. 2006. The effects of chronic admin-istration of quetiapine on the methamphetamine-induced recogni-tion memory impairment and dopaminergic terminal deficit inrats. Behav Brain Res 172:39–45.
Hennou S, Kato A, Schneider EM, Lundstrom K, Gahwiler BH, Ino-kuchi K, Gerber U, Ehrengruber MU. 2003. Homer-1a/Vesl-1Senhances hippocampal synaptic transmission. Eur J Neurosci18:811–819.
Inoue Y, Honkura N, Kato A, Ogawa S, Udo H, Inokuchi K,Sugiyama H. 2004. Activity-inducible protein Homer1a/Vesl-1Spromotes redistribution of postsynaptic protein Homer1c/Vesl-1Lin cultured rat hippocampal neurons. Neurosci Lett 354:143–147.
Kalivas PW, Szumlinski KK, Worley P. 2004. Homer2 gene deletionin mice produces a phenotype similar to chronic cocaine-treatedrats. Neurotoxicol Res 6:385–387.
Kapur S, Wadenberg ML, Remington G. 2000a. Are animal studiesof antipsychotics appropriately dosed? Lessons from the bedside tothe bench. Can J Psychiatry 45:241–246.
Kapur S, Zipursky R, Jones C, Shammi CS, Remington G, SeemanP. 2000b. A positron emission tomography study of quetiapine inschizophrenia: A preliminary finding of an antipsychotic effectwith only transiently high dopamine D2 receptor occupancy. ArchGen Psychiatry 57:553–559.
Lane EL, Cheetham S, Jenner P. 2005. Dopamine uptake inhibitor-induced rotation in 6-hydroxydopamine-lesioned rats involvesboth D1 and D2 receptors but is modulated through 5-hydroxy-tryptamine and noradrenaline receptors. J Pharmacol Exp Ther312:1124–1131.
Lieberman JA, Stroup TS, McEvoy JP, Swartz MS, Rosenheck RA,Perkins DO, Keefe RS, Davis SM, Davis CE, Lebowitz BD, SevereJ, Hsiao JK. 2005. Effectiveness of antipsychotic drugs in patientswith chronic schizophrenia. N Engl J Med 353:1209–1223.
Lominac KD, Oleson EB, Pava M, Klugmann M, Schwarz MK, See-burg PH, During MJ, Worley PF, Kalivas PW, Szumlinski KK.2005. Distinct roles for different Homer1 isoforms in behaviorsand associated prefrontal cortex function. J Neurosci 25:11586–11594.
Merchant KM, Dorsa DM. 1993. Differential induction of neuroten-sin and c-fos gene expression by typical versus atypical antipsy-chotics. Proc Natl Acad Sci USA 90:3447–3451.
Minami I, Kengaku M, Smitt PS, Shigemoto R, Hirano T. 2003.Long-term potentiation of mGluR1 activity by depolarization-induced Homer1a in mouse cerebellar Purkinje neurons. Eur JNeurosci 17:1023–1032.
Morgan JI, Curran T. 1991. Stimulus-transcription coupling in thenervous system: Involvement of the inducible proto-oncogenes fosand jun. Annu Rev Neurosci 14:421–451.
Nemeroff CB, Kinkead B, Goldstein J. 2002. Quetiapine: Preclinicalstudies, pharmacokinetics, drug interactions, and dosing. J ClinPsychiatry 63(Suppl 13):5–11.
Norton N, Williams HJ, Williams NM, Spurlock G, Zammit S, JonesG, Jones S, Owen R, O’Donovan MC, Owen MJ. 2003. Mutationscreening of the Homer gene family and association analysis inschizophrenia. Am J Med Genet B Neuropsychiatr Genet 120:18–21.
Park SW, Lee SK, Kim JM, Yoon JS, Kim YH. 2006. Effects of que-tiapine on the brain-derived neurotrophic factor expression in thehippocampus and neocortex of rats. Neurosci Lett 402(1/2):25–29.
Paxinos G, Watson C. 1997. The rat brain sereotaxic coordiantes.New York: Academic Press.
Persico AM, Schindler CW, O’Hara BF, Brannock MT, Uhl GR.1993. Brain transcription factor expression: Effects of acute andchronic amphetamine and injection stress. Brain Res Mol BrainRes 20(1/2):91–100.
Pira L, Mongeau R, Pani L. 2004. The atypical antipsychotic quetia-pine increases both noradrenaline and dopamine release in therat prefrontal cortex. Eur J Pharmacol 504(1/2):61–64.
Polese D, de Serpis AA, Ambesi-Impiombato A, Muscettola G, deBartolomeis A. 2002. Homer 1a gene expression modulation byantipsychotic drugs: Involvement of the glutamate metabotropicsystem and effects of D-cycloserine. Neuropsychopharmacology27:906–913.
Robertson GS, Fibiger HC. 1992. Neuroleptics increase c-fos expres-sion in the forebrain: Contrasting effects of haloperidol and cloza-pine. Neuroscience 46:315–328.
Rushlow WJ, Seah YH, Belliveau DJ, Rajakumar N. 2005. Changesin calcineurin expression induced in the rat brain by the adminis-tration of antipsychotics. J Neurochem 94:587–596.
Sala C, Futai K, Yamamoto K, Worley PF, Hayashi Y, Sheng M.2003. Inhibition of dendritic spine morphogenesis and synaptictransmission by activity-inducible protein Homer1a. J Neurosci23:6327–6337.
Semba J, Sakai M, Miyoshi R, Mataga N, Fukamauchi F, Kito S.1996. Differential expression of c-fos mRNA in rat prefrontal cor-tex, striatum, N. accumbens and lateral septum after typical andatypical antipsychotics: An in situ hybridization study. Neuro-chem Int 29:435–442.
Swanson CJ, Baker DA, Carson D, Worley PF, Kalivas PW. 2001.Repeated cocaine administration attenuates group I metabotro-pic glutamate receptor-mediated glutamate release and behavio-ral activation: A potential role for Homer. J Neurosci 21:9043–9052.
Szumlinski KK, Dehoff MH, Kang SH, Frys KA, Lominac KD, Klug-mann M, Rohrer J, Griffin W III, Toda S, Champtiaux NP, BerryT, Tu JC, Shealy SE, During MJ, Middaugh LD, Worley PF, Kali-vas PW. 2004. Homer proteins regulate sensitivity to cocaine.Neuron 43:401–413.
438 A. AMBESI-IMPIOMBATO ET AL.
Synapse DOI 10.1002/syn
Szumlinski KK, Lominac KD, Kleschen MJ, Oleson EB, Dehoff MH,Schwarz MK, Seeburg PH, Worley PF, Kalivas PW. 2005a. Behav-ioral and neurochemical phenotyping of Homer1 mutant mice: Pos-sible relevance to schizophrenia. Genes Brain Behav 4:273–288.
Szumlinski KK, Lominac KD, Oleson EB, Walker JK, Mason A,Dehoff MH, Klugmann M, Cagle S, Welt K, During M, Worley PF,Middaugh LD, Kalivas PW. 2005b. Homer2 is necessary forEtOH-induced neuroplasticity. J Neurosci 25:7054–7061.
Szumlinski KK, Abernathy KE, Oleson EB, Klugmann M, LominacKD, He DY, Ron D, During M, Kalivas PW. 2006a. Homer iso-forms differentially regulate cocaine-induced neuroplasticity. Neu-ropsychopharmacology 31:768–777.
Szumlinski KK, Kalivas PW, Worley PF. 2006b. Homer proteins:Implications for neuropsychiatric disorders. Curr Opin Neurobiol16:251–257.
Tada M, Shirakawa K, Matsuoka N, Mutoh S. 2004. Combinedtreatment of quetiapine with haloperidol in animal models of anti-psychotic effect and extrapyramidal side effects: Comparison withrisperidone and chlorpromazine. Psychopharmacology (Berl) 176:94–100.
Tappe A, Kuner R. 2006. Regulation of motor performance andstriatal function by synaptic scaffolding proteins of the Homer1family. Proc Natl Acad Sci USA 103:774–779.
Tu JC, Xiao B, Yuan JP, Lanahan AA, Leoffert K, Li M, Linden DJ,Worley PF. 1998. Homer binds a novel proline-rich motif and linksgroup 1 metabotropic glutamate receptors with IP3 receptors.Neuron 21:717–726.
Westerink BH. 2002. Can antipsychotic drugs be classified by theireffects on a particular group of dopamine neurons in the brain?Eur J Pharmacol 455:1–18.
Wise SP, Murray EA, Gerfen CR. 1996. The frontal cortex-basalganglia system in primates. Crit Rev Neurobiol 10(3/4):317–356.
Xiao B, Tu JC, Petralia RS, Yuan JP, Doan A, Breder CD, RuggieroA, Lanahan AA, Wenthold RJ, Worley PF. 1998. Homer regulatesthe association of group 1 metabotropic glutamate receptors withmultivalent complexes of homer-related, synaptic proteins. Neu-ron 21:707–716.
Yano M, Steiner H. 2005. Methylphenidate (Ritalin) induces Homer1a and zif 268 expression in specific corticostriatal circuits. Neuro-science 132:855–865.
439DOPAMINE INDUCED RAT BRAIN GENE EXPRESSION
Synapse DOI 10.1002/syn