Differential Expression of PGC1α and Metabolic Sensors Suggest Age-Dependent Induction of...
11
Differential Expression of PGC-1a and Metabolic Sensors Suggest Age-Dependent Induction of Mitochondrial Biogenesis in Friedreich Ataxia Fibroblasts Jose ´ Luis Garcı´a-Gime ´ nez 1,2 , Amparo Gimeno 1,2 , Pilar Gonzalez-Cabo 1,3 , Francisco Dası´ 2 , Arantxa Bolinches-Amoro ´s 1,3 , Bele ´ n Molla ´ 1,3 , Francesc Palau 1,3 , Federico V. Pallardo ´ 1,2,4 * 1 Centro de Investigacio ´ n Biome ´ dica en Red de Enfermedades Raras (CIBERER), Valencia, Spain, 2 Fundacio ´ n del Hospital Clı ´nico Universitat de Valencia, FIHCUV-Incliva, Valencia, Spain, 3 Instituto de Biomedicina Valencia, Valencia, Spain, 4 Department of Physiology, Medical School, Universitat de Vale ` ncia, Valencia, Spain Abstract Background: Friedreich’s ataxia (FRDA) is a mitochondrial rare disease, which molecular origin is associated with defect in the expression of frataxin. The pathological consequences are degeneration of nervous system structures and cardiomyopathy with necrosis and fibrosis, among others. Principal Findings: Using FRDA fibroblasts we have characterized the oxidative stress status and mitochondrial biogenesis. We observed deficiency of MnSOD, increased ROS levels and low levels of ATP. Expression of PGC-1a and mtTFA was increased and the active form of the upstream signals p38 MAPK and AMPK in fibroblasts from two patients. Interestingly, the expression of energetic factors correlated with the natural history of disease of the patients, the age when skin biopsy was performed and the size of the GAA expanded alleles. Furthermore, idebenone inhibit mitochondriogenic responses in FRDA cells. Conclusions: The induction of mitochondrial biogenesis in FRDA may be a consequence of the mitochondrial impairment associated with disease evolution. The increase of ROS and the involvement of the oxidative phosphorylation may be an early event in the cell pathophysiology of frataxin deficiency, whereas increase of mitochondriogenic response might be a later phenomenon associated to the individual age and natural history of the disease, being more evident as the patient age increases and disease evolves. This is a possible explanation of heart disease in FRDA. Citation: Garcı ´a-Gime ´ nez JL, Gimeno A, Gonzalez-Cabo P, Dası ´ F, Bolinches-Amoro ´ s A, et al. (2011) Differential Expression of PGC-1a and Metabolic Sensors Suggest Age-Dependent Induction of Mitochondrial Biogenesis in Friedreich Ataxia Fibroblasts. PLoS ONE 6(6): e20666. doi:10.1371/journal.pone.0020666 Editor: Mel B. Feany, Brigham and Women’s Hospital, Harvard Medical School, United States of America Received September 27, 2010; Accepted May 10, 2011; Published June 7, 2011 Copyright: ß 2011 Garcı ´a-Gime ´ nez et al. This is an open-access article distributed under the terms of the Creative Commons Attribution License, which permits unrestricted use, distribution, and reproduction in any medium, provided the original author and source are credited. Funding: This work was supported by grants SAF2008-01338, SAF2006-01047 and SAF2009-07063 from the Ministerio de Ciencia e Innovacio ´ n and financial support from the CIBERER (Biomedical Network Research Center for Rare Diseases). A.G. thanks the Conselleria de Educacio ´ n of the Generalitat Valenciana for the financial support by grants GVPRE/2008/154. A.B.-A. is the recipient of a JAE-CSIC predoctoral fellowship. The CIBERER is an initiative of the Instituto de Salud Carlos III and INGENIO 2010. The funders had no role in study design, data collection and analysis, decision to publish, or preparation of the manuscript. Competing Interests: The authors have declared that no competing interests exist. * E-mail: [email protected] Introduction Friedreich Ataxia (FRDA) is an inherited autosomal recessive neurodegenerative disease in which over 96% of patients have a homozygous expansion of a GAA triplet repeat in the first intron of the frataxin (FXN) gene on chromosome 9 [1,2]. The consequence of deficiency on frataxin is that patients have progressive gait and limb ataxia, slurred speech, and peripheral axonal neuropathy associated with hypertrophic cardiomyopathy, diabetes mellitus or glucose intolerance and skeletal deformities. The evolution of the disease leads to severe disability in early adulthood [3,4]. Pathogenic consequences observed in cells deficient for frataxin include abnormal function of Fe-S clusters (ISC) biogenesis and decreased activities of Fe-S proteins, iron accumulation in mitochondrial matrix, increased reactive oxygen species (ROS) and impairment of the electron transport chain [5], which in turn, leads to decreased ATP production [6]. More recently, a role as an iron sensor involved in the ISC biosynthesis has been proposed for the bacterial frataxin [7]. The hypothesis involving frataxin in the ISC metabolism in mitochondria is the most generally accepted, but the precise sequence of events in FRDA cell pathophysiology still remains elusive. The relationship between FRDA and oxidative stress seems increasingly clear. This is directly related to disturbances of both iron metabolism and respiratory chain. Iron increases in mitochondrial matrix because of inefficient ISC synthesis and it induces ROS via Fenton chemistry. Moreover, impairment of respiratory chain complexes I, II, and III also induces accumu- lation of ROS in frataxin defective cells. Previous studies suggest that frataxin might detoxify ROS via activation of glutathione peroxidase and elevation of thiols [8]. FRDA is characterized by a reduction of free glutathione levels in the blood of patients, although total blood glutathione levels were not affected, suggesting extensive glutathionylation of proteins [9]. Additionally, antioxidant cell response is reduced in frataxin-deficient cells being especially relevant the failure to induce the mitochondrial superoxide dismutase, MnSOD. In patients decreased plasma PLoS ONE | www.plosone.org 1 June 2011 | Volume 6 | Issue 6 | e20666
Transcript of Differential Expression of PGC1α and Metabolic Sensors Suggest Age-Dependent Induction of...
Differential Expression of PGC-1a and Metabolic SensorsSuggest Age-Dependent Induction of MitochondrialBiogenesis in Friedreich Ataxia FibroblastsJose Luis Garcıa-Gimenez1,2, Amparo Gimeno1,2, Pilar Gonzalez-Cabo1,3, Francisco Dası2, Arantxa
Bolinches-Amoros1,3, Belen Molla1,3, Francesc Palau1,3, Federico V. Pallardo1,2,4*
1 Centro de Investigacion Biomedica en Red de Enfermedades Raras (CIBERER), Valencia, Spain, 2 Fundacion del Hospital Clınico Universitat de Valencia, FIHCUV-Incliva,
Valencia, Spain, 3 Instituto de Biomedicina Valencia, Valencia, Spain, 4 Department of Physiology, Medical School, Universitat de Valencia, Valencia, Spain
Abstract
Background: Friedreich’s ataxia (FRDA) is a mitochondrial rare disease, which molecular origin is associated with defect inthe expression of frataxin. The pathological consequences are degeneration of nervous system structures andcardiomyopathy with necrosis and fibrosis, among others.
Principal Findings: Using FRDA fibroblasts we have characterized the oxidative stress status and mitochondrial biogenesis.We observed deficiency of MnSOD, increased ROS levels and low levels of ATP. Expression of PGC-1a and mtTFA wasincreased and the active form of the upstream signals p38 MAPK and AMPK in fibroblasts from two patients. Interestingly,the expression of energetic factors correlated with the natural history of disease of the patients, the age when skin biopsywas performed and the size of the GAA expanded alleles. Furthermore, idebenone inhibit mitochondriogenic responses inFRDA cells.
Conclusions: The induction of mitochondrial biogenesis in FRDA may be a consequence of the mitochondrial impairmentassociated with disease evolution. The increase of ROS and the involvement of the oxidative phosphorylation may be anearly event in the cell pathophysiology of frataxin deficiency, whereas increase of mitochondriogenic response might be alater phenomenon associated to the individual age and natural history of the disease, being more evident as the patient ageincreases and disease evolves. This is a possible explanation of heart disease in FRDA.
Citation: Garcıa-Gimenez JL, Gimeno A, Gonzalez-Cabo P, Dası F, Bolinches-Amoros A, et al. (2011) Differential Expression of PGC-1a and Metabolic SensorsSuggest Age-Dependent Induction of Mitochondrial Biogenesis in Friedreich Ataxia Fibroblasts. PLoS ONE 6(6): e20666. doi:10.1371/journal.pone.0020666
Editor: Mel B. Feany, Brigham and Women’s Hospital, Harvard Medical School, United States of America
Received September 27, 2010; Accepted May 10, 2011; Published June 7, 2011
Copyright: � 2011 Garcıa-Gimenez et al. This is an open-access article distributed under the terms of the Creative Commons Attribution License, which permitsunrestricted use, distribution, and reproduction in any medium, provided the original author and source are credited.
Funding: This work was supported by grants SAF2008-01338, SAF2006-01047 and SAF2009-07063 from the Ministerio de Ciencia e Innovacion and financialsupport from the CIBERER (Biomedical Network Research Center for Rare Diseases). A.G. thanks the Conselleria de Educacion of the Generalitat Valenciana for thefinancial support by grants GVPRE/2008/154. A.B.-A. is the recipient of a JAE-CSIC predoctoral fellowship. The CIBERER is an initiative of the Instituto de SaludCarlos III and INGENIO 2010. The funders had no role in study design, data collection and analysis, decision to publish, or preparation of the manuscript.
Competing Interests: The authors have declared that no competing interests exist.
* E-mail: [email protected]
Introduction
Friedreich Ataxia (FRDA) is an inherited autosomal recessive
neurodegenerative disease in which over 96% of patients have a
homozygous expansion of a GAA triplet repeat in the first intron
of the frataxin (FXN) gene on chromosome 9 [1,2]. The
consequence of deficiency on frataxin is that patients have
progressive gait and limb ataxia, slurred speech, and peripheral
axonal neuropathy associated with hypertrophic cardiomyopathy,
diabetes mellitus or glucose intolerance and skeletal deformities.
The evolution of the disease leads to severe disability in early
adulthood [3,4].
Pathogenic consequences observed in cells deficient for frataxin
include abnormal function of Fe-S clusters (ISC) biogenesis and
decreased activities of Fe-S proteins, iron accumulation in
mitochondrial matrix, increased reactive oxygen species (ROS)
and impairment of the electron transport chain [5], which in turn,
leads to decreased ATP production [6]. More recently, a role as an
iron sensor involved in the ISC biosynthesis has been proposed for
the bacterial frataxin [7]. The hypothesis involving frataxin in the
ISC metabolism in mitochondria is the most generally accepted,
but the precise sequence of events in FRDA cell pathophysiology
still remains elusive.
The relationship between FRDA and oxidative stress seems
increasingly clear. This is directly related to disturbances of both
iron metabolism and respiratory chain. Iron increases in
mitochondrial matrix because of inefficient ISC synthesis and it
induces ROS via Fenton chemistry. Moreover, impairment of
respiratory chain complexes I, II, and III also induces accumu-
lation of ROS in frataxin defective cells. Previous studies suggest
that frataxin might detoxify ROS via activation of glutathione
peroxidase and elevation of thiols [8]. FRDA is characterized by a
reduction of free glutathione levels in the blood of patients,
although total blood glutathione levels were not affected,
suggesting extensive glutathionylation of proteins [9]. Additionally,
antioxidant cell response is reduced in frataxin-deficient cells being
especially relevant the failure to induce the mitochondrial
superoxide dismutase, MnSOD. In patients decreased plasma
PLoS ONE | www.plosone.org 1 June 2011 | Volume 6 | Issue 6 | e20666
free glutathione, increased plasma levels of the lipid peroxidation
product malondialdehyde, and increase urinary 8-hydroxy-29-
deoxyguanosine (a marker of oxidative DNA damage) support
evidence of oxidative stress associated with frataxin deficiency
[10].
ROS induce damage to mitochondrial DNA (mtDNA) and
proteins, and lipid peroxidation. Decreased levels of mtDNA have
been observed in cardiac tissue from FRDA patients and in FXN
deficient yeast models [11–13]. The mitochondria appear as the
affected organelle in FRDA. ROS powerfully induce peroxisome
proliferation activator receptor (PPAR) c-coactivator 1 (PGC-1aand PGC-1b), that in turn, regulate a complex and multifaceted
ROS defense system [14].
In the process of mitochondrial biogenesis, PGC-1a has
emerged as a master regulator. PGC-1a is a transcriptional
coactivator that transduces many physiological stimuli in impor-
tant specific metabolic programs, often by stimulating mitochon-
drial activity [15]. How PGC-1a activates mitochondrial biogen-
esis has been studied in detail [16]. First, PGC-1a activates
nuclear-encoded genes required for mitochondrial biogenesis by
co-activating at least three transcription factors termed NRF-1,
NRF-2 and ERRa. These transcriptional factors activate certain
regulatory promoter regions of several mitochondrial genes
encoded in the nuclear genome. PGC-1a also activates the
expression of mitochondrial transcription factor A (mtTFA) [16].
Then, mtTFA translocates from the nucleus to the mitochondria,
where it stimulates mitochondrial DNA replication and mito-
chondria gene expression [17,18]. Furthermore, mtTFA plays a
structural role in the maintenance of the mitochondrial chromo-
some, alternatively of its transcriptional activity. It appears
complexed with mtDNA forming nucleoid structures [19] and
promoting DNA compaction [20]. It also interacts physically with
the protein p53 [21], suggesting a role of mtTFA in DNA
repairing mechanisms.
Here, we have characterized the oxidative stress status and
mitochondrial biogenesis in FRDA fibroblasts. We observed
deficiency of MnSOD, increased ROS levels and low levels of
ATP. In addition, we also observed increased expression of PGC-
1a and mtTFA and the active form of the upstream signals p38
MAPK and AMPK in two patients. Interestingly, the expression of
energetic factors correlated with the natural history of disease of
the patients, the age when skin biopsy was performed and the size
of the GAA expanded alleles. We propose that induction of
mitochondrial biogenesis signals in FRDA could be a consequence
of the mitochondrial impairment associated with disease evolution.
Results
Evaluation of superoxide and ROS antioxidant enzymeslevels in FRDA fibroblasts
First, we tested frataxin expression in fibroblasts from three
FRDA by RT-PCR. When expression of FXN gene was analyzed
by RT-PCR all FRDA patients showed lower mRNA levels than
control fibroblasts (Figure S1).
In order to characterize our cellular model (Table 1), we
analyzed superoxide levels. We observed significantly higher
superoxide anion levels in FRDA patients than in control
fibroblasts cell lines, with the exception of the youngest patient
(FRDA3) (Figure 1A). Then, we decided to evaluate the
antioxidant capacity of FRDA fibroblasts. We measured mRNA
and protein levels of several ROS detoxifying enzymes as
MnSOD, CuZnSOD, catalase and glutathione peroxidase 1,
under basal culture conditions, without inducing oxidative stress.
We investigated superoxide metabolism by analyzing the first
ROS detoxifying step catalyzed by CuZnSOD and MnSOD,
which implies the dismutation of superoxide to hydrogen peroxide
and water. We did not observe any significant changes in SOD1
mRNA expression (Figure 1B). However, the CuZnSOD protein
levels in FRDA1 and FRDA2 fibroblasts were lower than FRDA 3
or the three control cell lines (Figures 1D). In addition, MnSOD
experiments showed a significant reduction of SOD2 mRNA
expression (Figure 1C) and protein levels (Figure 1D) of the
mitochondrial MnSOD in FRDA 1 and FRDA 2. Our results
rather indicate that MnSOD transcription fails in FRDA cultured
fibroblasts since mRNA levels appears diminished in FRDA
fibroblasts. These data suggest that part of the toxic mechanism in
FRDA may involve disruption of the regulatory pathway for
MnSOD expression.
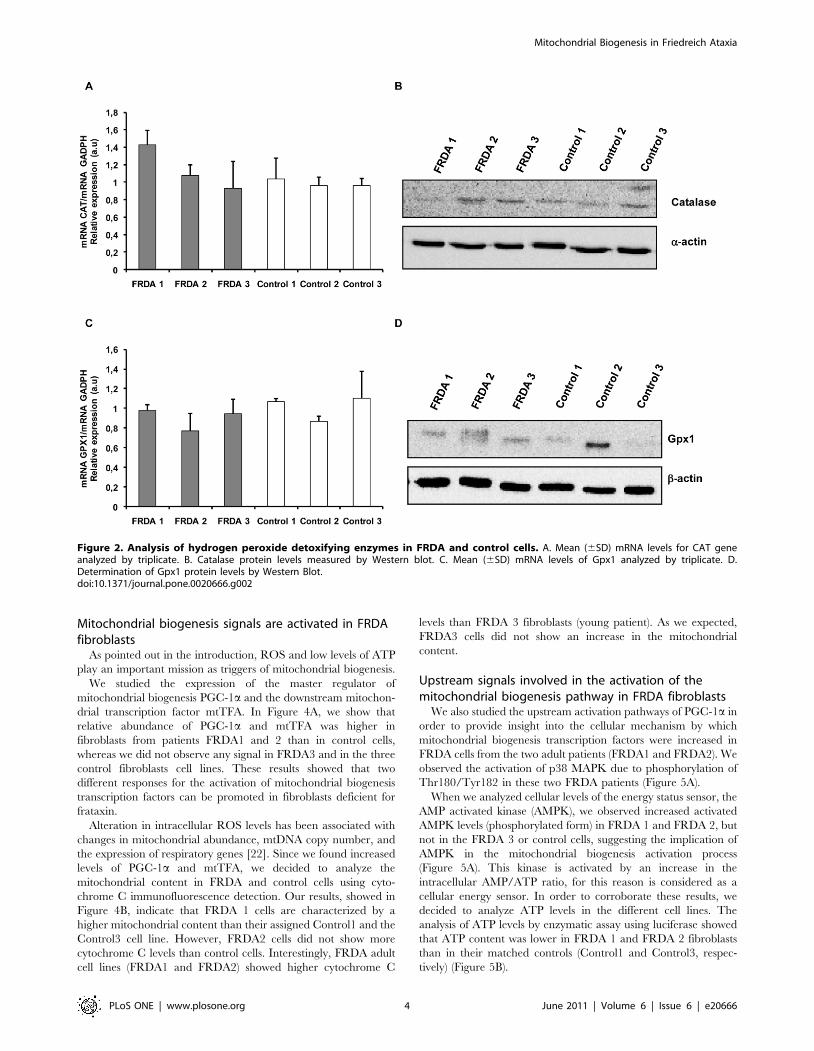
In a second step we investigated the status of the peroxide
detoxifying enzymes catalase and glutathione peroxidase 1. This
detoxification process gains importance in this disease, given that
iron accumulation and high levels of H2O2 can originate Fenton
reactions. RT-PCR experiments showed that CAT gene expres-
sion was not different between FRDA and control fibroblasts
(Figure 2A). In addition, Gpx1 (Figure 2C) mRNA levels were
similar in FRDA and control fibroblasts cell lines. Western blot
experiments were in accordance with the mRNA expression
results for catalase and Gpx1 of the patients’ samples (Figure 2B
and 2D). The catalase protein levels and mRNA for all three
patients showed no differences when compared to their matched
control cell lines. In any case, FRDA1 showed low levels for
catalase protein compared to the other two FRDA cell lines
(Figure 2B). The differences found between CAT expression and
catalase protein for FRDA1 may be related to the defects in the
correct assembly of the porphyrine heme groups of catalase in
these cells.
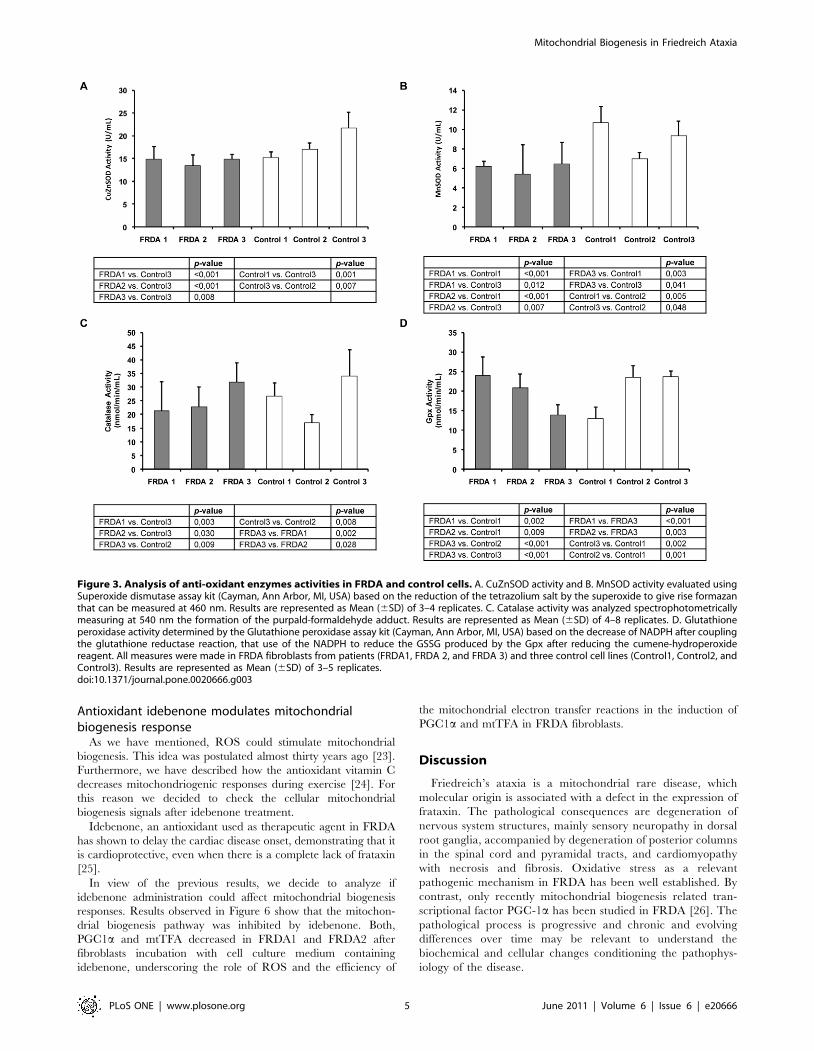
Evaluation of SOD, catalase and glutathione peroxidaseactivities in FRDA fibroblasts
To further characterize ROS antioxidants enzymes in fibro-
blasts from FRDA patients we determined the enzymatic activity
of the antioxidant systems studied. Superoxide dismutase activities
indicated that CuZnSOD activity (Figure 3A) was significantly
decreased in FRDA fibroblasts when compared to Control3, one
of the adult control cell lines. Results obtained for the
mitochondrial isoform of SOD (MnSOD), clearly demonstrated
that MnSOD activity was decreased in all FRDA cell lines
compared to the activity observed in the two adult control cell lines
(Control1 and control3) (Figure 3B). These adult control cell lines
showed higher MnSOD activity than fibroblasts obtained from the
young control (Control2) as well.
For catalase, results showed in Figure 3C demonstrate that
activities were similar in fibroblasts from the FRDA1 patient to
their age and gender matched Control1 cell line. However,
FRDA1 and FRDA2 fibroblasts showed lower catalase activity
than the other adult control cell line (Control3). In contrast,
FRDA3 fibroblasts from the youngest patient showed higher
catalase activity than their assigned Control2 cell line. Interest-
ingly, FRDA 1 and FRDA2 (fibroblasts from adult patients)
showed lower catalase activity than FRDA3 fibroblasts (Figure 3C).
Finally, the studies for glutathione peroxidase activity showed
no difference between fibroblasts obtained from FRDA2 patient
and their control cells (Control3) (Figure 3D). However, when we
compared Gpx activity between FRDA1 fibroblasts with their
Control1 we observed higher activity for the former. This was
different in the particular case of FRDA3, in which we observed
lower Gpx activity than their control cell line (Control2).
Mitochondrial Biogenesis in Friedreich Ataxia
PLoS ONE | www.plosone.org 2 June 2011 | Volume 6 | Issue 6 | e20666
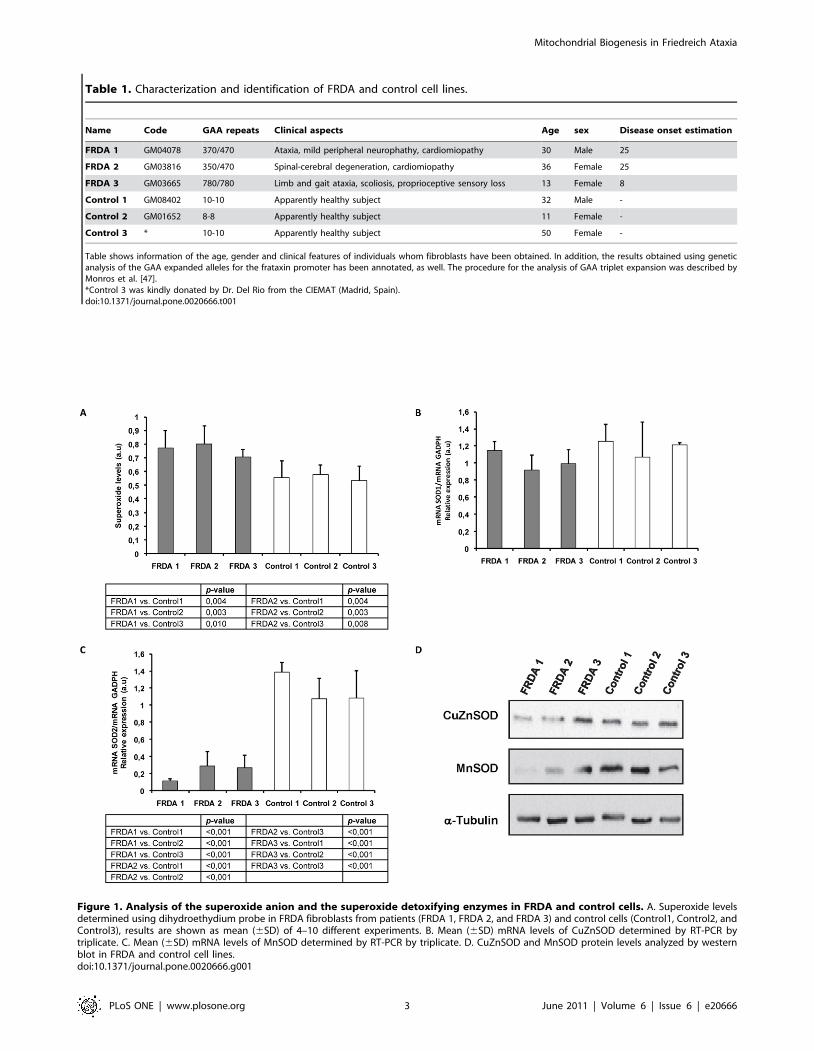
Figure 1. Analysis of the superoxide anion and the superoxide detoxifying enzymes in FRDA and control cells. A. Superoxide levelsdetermined using dihydroethydium probe in FRDA fibroblasts from patients (FRDA 1, FRDA 2, and FRDA 3) and control cells (Control1, Control2, andControl3), results are shown as mean (6SD) of 4–10 different experiments. B. Mean (6SD) mRNA levels of CuZnSOD determined by RT-PCR bytriplicate. C. Mean (6SD) mRNA levels of MnSOD determined by RT-PCR by triplicate. D. CuZnSOD and MnSOD protein levels analyzed by westernblot in FRDA and control cell lines.doi:10.1371/journal.pone.0020666.g001
Table 1. Characterization and identification of FRDA and control cell lines.
Name Code GAA repeats Clinical aspects Age sex Disease onset estimation
FRDA 1 GM04078 370/470 Ataxia, mild peripheral neurophathy, cardiomiopathy 30 Male 25
FRDA 2 GM03816 350/470 Spinal-cerebral degeneration, cardiomiopathy 36 Female 25
FRDA 3 GM03665 780/780 Limb and gait ataxia, scoliosis, proprioceptive sensory loss 13 Female 8
Control 1 GM08402 10-10 Apparently healthy subject 32 Male -
Control 2 GM01652 8-8 Apparently healthy subject 11 Female -
Control 3 * 10-10 Apparently healthy subject 50 Female -
Table shows information of the age, gender and clinical features of individuals whom fibroblasts have been obtained. In addition, the results obtained using geneticanalysis of the GAA expanded alleles for the frataxin promoter has been annotated, as well. The procedure for the analysis of GAA triplet expansion was described byMonros et al. [47].*Control 3 was kindly donated by Dr. Del Rio from the CIEMAT (Madrid, Spain).doi:10.1371/journal.pone.0020666.t001
Mitochondrial Biogenesis in Friedreich Ataxia
PLoS ONE | www.plosone.org 3 June 2011 | Volume 6 | Issue 6 | e20666
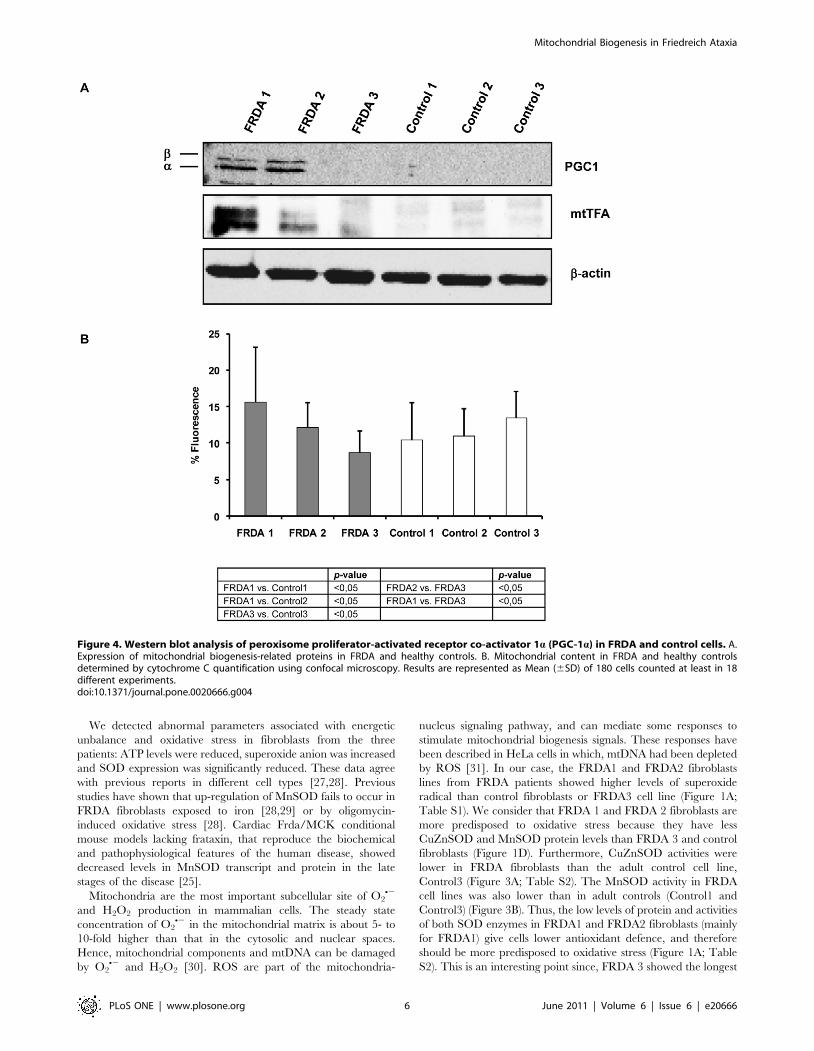
Mitochondrial biogenesis signals are activated in FRDAfibroblasts
As pointed out in the introduction, ROS and low levels of ATP
play an important mission as triggers of mitochondrial biogenesis.
We studied the expression of the master regulator of
mitochondrial biogenesis PGC-1a and the downstream mitochon-
drial transcription factor mtTFA. In Figure 4A, we show that
relative abundance of PGC-1a and mtTFA was higher in
fibroblasts from patients FRDA1 and 2 than in control cells,
whereas we did not observe any signal in FRDA3 and in the three
control fibroblasts cell lines. These results showed that two
different responses for the activation of mitochondrial biogenesis
transcription factors can be promoted in fibroblasts deficient for
frataxin.
Alteration in intracellular ROS levels has been associated with
changes in mitochondrial abundance, mtDNA copy number, and
the expression of respiratory genes [22]. Since we found increased
levels of PGC-1a and mtTFA, we decided to analyze the
mitochondrial content in FRDA and control cells using cyto-
chrome C immunofluorescence detection. Our results, showed in
Figure 4B, indicate that FRDA 1 cells are characterized by a
higher mitochondrial content than their assigned Control1 and the
Control3 cell line. However, FRDA2 cells did not show more
cytochrome C levels than control cells. Interestingly, FRDA adult
cell lines (FRDA1 and FRDA2) showed higher cytochrome C
levels than FRDA 3 fibroblasts (young patient). As we expected,
FRDA3 cells did not show an increase in the mitochondrial
content.
Upstream signals involved in the activation of themitochondrial biogenesis pathway in FRDA fibroblasts
We also studied the upstream activation pathways of PGC-1a in
order to provide insight into the cellular mechanism by which
mitochondrial biogenesis transcription factors were increased in
FRDA cells from the two adult patients (FRDA1 and FRDA2). We
observed the activation of p38 MAPK due to phosphorylation of
Thr180/Tyr182 in these two FRDA patients (Figure 5A).
When we analyzed cellular levels of the energy status sensor, the
AMP activated kinase (AMPK), we observed increased activated
AMPK levels (phosphorylated form) in FRDA 1 and FRDA 2, but
not in the FRDA 3 or control cells, suggesting the implication of
AMPK in the mitochondrial biogenesis activation process
(Figure 5A). This kinase is activated by an increase in the
intracellular AMP/ATP ratio, for this reason is considered as a
cellular energy sensor. In order to corroborate these results, we
decided to analyze ATP levels in the different cell lines. The
analysis of ATP levels by enzymatic assay using luciferase showed
that ATP content was lower in FRDA 1 and FRDA 2 fibroblasts
than in their matched controls (Control1 and Control3, respec-
tively) (Figure 5B).
Figure 2. Analysis of hydrogen peroxide detoxifying enzymes in FRDA and control cells. A. Mean (6SD) mRNA levels for CAT geneanalyzed by triplicate. B. Catalase protein levels measured by Western blot. C. Mean (6SD) mRNA levels of Gpx1 analyzed by triplicate. D.Determination of Gpx1 protein levels by Western Blot.doi:10.1371/journal.pone.0020666.g002
Mitochondrial Biogenesis in Friedreich Ataxia
PLoS ONE | www.plosone.org 4 June 2011 | Volume 6 | Issue 6 | e20666
Antioxidant idebenone modulates mitochondrialbiogenesis response
As we have mentioned, ROS could stimulate mitochondrial
biogenesis. This idea was postulated almost thirty years ago [23].
Furthermore, we have described how the antioxidant vitamin C
decreases mitochondriogenic responses during exercise [24]. For
this reason we decided to check the cellular mitochondrial
biogenesis signals after idebenone treatment.
Idebenone, an antioxidant used as therapeutic agent in FRDA
has shown to delay the cardiac disease onset, demonstrating that it
is cardioprotective, even when there is a complete lack of frataxin
[25].
In view of the previous results, we decide to analyze if
idebenone administration could affect mitochondrial biogenesis
responses. Results observed in Figure 6 show that the mitochon-
drial biogenesis pathway was inhibited by idebenone. Both,
PGC1a and mtTFA decreased in FRDA1 and FRDA2 after
fibroblasts incubation with cell culture medium containing
idebenone, underscoring the role of ROS and the efficiency of
the mitochondrial electron transfer reactions in the induction of
PGC1a and mtTFA in FRDA fibroblasts.
Discussion
Friedreich’s ataxia is a mitochondrial rare disease, which
molecular origin is associated with a defect in the expression of
frataxin. The pathological consequences are degeneration of
nervous system structures, mainly sensory neuropathy in dorsal
root ganglia, accompanied by degeneration of posterior columns
in the spinal cord and pyramidal tracts, and cardiomyopathy
with necrosis and fibrosis. Oxidative stress as a relevant
pathogenic mechanism in FRDA has been well established. By
contrast, only recently mitochondrial biogenesis related tran-
scriptional factor PGC-1a has been studied in FRDA [26]. The
pathological process is progressive and chronic and evolving
differences over time may be relevant to understand the
biochemical and cellular changes conditioning the pathophys-
iology of the disease.
Figure 3. Analysis of anti-oxidant enzymes activities in FRDA and control cells. A. CuZnSOD activity and B. MnSOD activity evaluated usingSuperoxide dismutase assay kit (Cayman, Ann Arbor, MI, USA) based on the reduction of the tetrazolium salt by the superoxide to give rise formazanthat can be measured at 460 nm. Results are represented as Mean (6SD) of 3–4 replicates. C. Catalase activity was analyzed spectrophotometricallymeasuring at 540 nm the formation of the purpald-formaldehyde adduct. Results are represented as Mean (6SD) of 4–8 replicates. D. Glutathioneperoxidase activity determined by the Glutathione peroxidase assay kit (Cayman, Ann Arbor, MI, USA) based on the decrease of NADPH after couplingthe glutathione reductase reaction, that use of the NADPH to reduce the GSSG produced by the Gpx after reducing the cumene-hydroperoxidereagent. All measures were made in FRDA fibroblasts from patients (FRDA1, FRDA 2, and FRDA 3) and three control cell lines (Control1, Control2, andControl3). Results are represented as Mean (6SD) of 3–5 replicates.doi:10.1371/journal.pone.0020666.g003
Mitochondrial Biogenesis in Friedreich Ataxia
PLoS ONE | www.plosone.org 5 June 2011 | Volume 6 | Issue 6 | e20666
We detected abnormal parameters associated with energetic
unbalance and oxidative stress in fibroblasts from the three
patients: ATP levels were reduced, superoxide anion was increased
and SOD expression was significantly reduced. These data agree
with previous reports in different cell types [27,28]. Previous
studies have shown that up-regulation of MnSOD fails to occur in
FRDA fibroblasts exposed to iron [28,29] or by oligomycin-
induced oxidative stress [28]. Cardiac Frda/MCK conditional
mouse models lacking frataxin, that reproduce the biochemical
and pathophysiological features of the human disease, showed
decreased levels in MnSOD transcript and protein in the late
stages of the disease [25].
Mitochondria are the most important subcellular site of O2N2
and H2O2 production in mammalian cells. The steady state
concentration of O2N2 in the mitochondrial matrix is about 5- to
10-fold higher than that in the cytosolic and nuclear spaces.
Hence, mitochondrial components and mtDNA can be damaged
by O2N2 and H2O2 [30]. ROS are part of the mitochondria-
nucleus signaling pathway, and can mediate some responses to
stimulate mitochondrial biogenesis signals. These responses have
been described in HeLa cells in which, mtDNA had been depleted
by ROS [31]. In our case, the FRDA1 and FRDA2 fibroblasts
lines from FRDA patients showed higher levels of superoxide
radical than control fibroblasts or FRDA3 cell line (Figure 1A;
Table S1). We consider that FRDA 1 and FRDA 2 fibroblasts are
more predisposed to oxidative stress because they have less
CuZnSOD and MnSOD protein levels than FRDA 3 and control
fibroblasts (Figure 1D). Furthermore, CuZnSOD activities were
lower in FRDA fibroblasts than the adult control cell line,
Control3 (Figure 3A; Table S2). The MnSOD activity in FRDA
cell lines was also lower than in adult controls (Control1 and
Control3) (Figure 3B). Thus, the low levels of protein and activities
of both SOD enzymes in FRDA1 and FRDA2 fibroblasts (mainly
for FRDA1) give cells lower antioxidant defence, and therefore
should be more predisposed to oxidative stress (Figure 1A; Table
S2). This is an interesting point since, FRDA 3 showed the longest
Figure 4. Western blot analysis of peroxisome proliferator-activated receptor co-activator 1a (PGC-1a) in FRDA and control cells. A.Expression of mitochondrial biogenesis-related proteins in FRDA and healthy controls. B. Mitochondrial content in FRDA and healthy controlsdetermined by cytochrome C quantification using confocal microscopy. Results are represented as Mean (6SD) of 180 cells counted at least in 18different experiments.doi:10.1371/journal.pone.0020666.g004
Mitochondrial Biogenesis in Friedreich Ataxia
PLoS ONE | www.plosone.org 6 June 2011 | Volume 6 | Issue 6 | e20666

GAA triplet expansion (Table 1) and the lowest levels of mRNA
FXN levels of the three patients analyzed (Figure S1; Table S1),
suggesting, that SOD depletion may be related with the
progression of the disease.
By contrast, we did not observe significant differences in other
antioxidant enzymes. The catalase mRNA and protein levels
(Figure 2A and 2B; Table S1) were similar between FRDA and
control fibroblasts. The study of the catalase activity showed a
particular pattern for FRDA and control fibroblasts (Figure 3C;
Table S2). Catalase activity for FRDA1 was similar to Control1
fibroblasts (Figure 3C, Table S2). However, catalase activity for
FRDA2 was lower than their matched Control3, while catalase
activity for FRDA3 was higher than Control2. These differences
may be because oxidative stress conditions have not been induced
in our cell culture model, to increase the antioxidant responses, as
was carried out in a previous report by Chantre-Groussard et al
[28]. Interestingly, catalase activity in FRDA1 and FRDA2 were
lower than in FRDA3 cells, suggesting that antioxidant enzymes
unbalance may be related with the progression of the disease.
Furthermore, our results did not show any differences in
glutathione peroxidase 1 expression (Figure 2C) when we
compared control and FRDA fibroblasts. These results were
similar to those obtained by Jauslin et al. [32]. However, when we
analyzed total glutathione peroxidase activity, we only observed
differences in Gpx total activity for FRDA1 compared to their
matched control (Figure 3D; Table S2). Probably, the high Gpx
Figure 5. Western blot analysis of upstream proteins involved in PGC-1a overexpression during mitochondrial biogenesis responsein FRDA and controls. A. Protein levels of p38 Kinase and phosphorylated p38 and the energy sensor AMPKa and phospho-AMPKa. B. ATP levelsmeasured by luciferase assay. Results are represented as Mean (6SD) of at least six independent experiments.doi:10.1371/journal.pone.0020666.g005
Figure 6. Western blot of PGC-1a and mtTFA after treatment with idebenone. Samples were obtained from FRDA 1 and 2 and Control1fibroblasts incubated with 5 mM of Idebenone during 5 days in 5% CO2 in air at 37uC at density of 20,000 cells/cm2.doi:10.1371/journal.pone.0020666.g006
Mitochondrial Biogenesis in Friedreich Ataxia
PLoS ONE | www.plosone.org 7 June 2011 | Volume 6 | Issue 6 | e20666
activity in FRDA1 and FRDA2 cell lines compared with FRDA3
is a cellular effort to compensate the low levels of catalase.
Under our opinion, these studies indicate that the levels of
CuZnSOD and the MnSOD are lower per se in all FRDA patients,
(and more drastically in FRDA 1 and FRDA 2 cells) suggesting
that, the mitochondrial pathogenesis of FRDA could be
aggravated by deficit in these variants of superoxide dismutase
and that the critical evolution of the disease with the age of
patients is accompanied by the depletion of the MnSOD.
The low levels of MnSOD and ATP (Figure 1D and Figure 5B,
respectively) measured in FRDA 1 and 2 cells indicate the
involvement of mitochondria in the physiopathology of Frie-
dreich’s ataxia, as it has been described by other authors [33]. For
this reason is necessary to elucidate distinct signaling pathways
that may occur in the cell to restore mitochondria function.
Oxidative stress has been involved in the activation of
mitochondrial biogenesis responses, through activation of different
signaling pathways [31,34,35].
There is evidence that oxidative stress and mtDNA damage
enhance the expression of nuclear mitochondrial biogenesis genes,
and ROS constitute a part of a mitochondria-nucleus regulatory
signaling pathway [31,35]. Furthermore, Suzuki et al., have
described that the expression of mitochondrial biogenesis is
governed by genes such as, mtTFA and NRF-1; and their DNA-
binding activities were increased in human cells with impaired
respiratory function [34].
The analysis of protein levels of PGC-1a and mtTFA proteins
in FRDA cells indicate an over-expression for both proteins in
FRDA 1 and FRDA 2 fibroblasts (Figure 4A), but not in FRDA
3 cells or control cells. The mitochondrial content in FRDA cell
lines analyzed by cytochrome C immunofluorescence confirmed
that only FRDA1 fibroblasts contained more mitochondria
(Figure 4B; Table S3). These results were consistent with the
downstream signal linked to mtTFA expression, in which
mtTFA levels were lower in FRDA2 than in FRDA1 fibroblasts
(Figure 4A). Although the whole upstream signaling involved in
the activation of PGC-1a is yet to be determined, several
pathways have been described. At the moment some mecha-
nisms have been clarified, and the activity of PGC-1a can be
modulated by numerous post-translational events, including
phosphorylation of the p38 MAPK [36,37] and AMP kinase
(AMPK) [38], among others. We have observed up-regulation of
the phosphorylated active form of both p38 MAPK and AMPK
kinases in fibroblasts from FRDA 1 and FRDA 2 patients but
not in FRDA 3 cells or control cell lines, indicating that it is a
feasible phenomenon involved in the activation of PGC-1a(Figure 5A). The observed activation of these pathways in
FRDA1 and FRDA2 cells might be originated by the increased
levels of ROS, p38 MAPK and reduction of ATP levels
(Figure 5B; Table S1; Table S3) and the subsequent activation
of AMPK pathway (Figure 5) [39–41].
A recent publication by Coppola et al. [42] has shown different
expression pattern of PGC-1a in tissues from frataxin-deficient
mice. In that case, they showed low levels of PGC-1a in several
tissues with the notable exception of cardiac muscle. This
exception is remarkable because it has been demonstrated that
continuous expression of PGC-1a in the myocardium, resulted in
a dilated cardiomyopathy [43]. Coppola et al. studied fibroblast
obtained from skin biopsies as well. In skin fibroblasts they
observed that PGC-1a was down-regulated in FRDA. Although
apparently their results are different to those obtained by us
(Figure 4), an analysis of their experimental procedure indicates
that fibroblasts were obtained from skin biopsies of FRDA patients
treated with idebenone (5 mg/kg).
In order to explain our results we try to identify if idebenone, an
antioxidant used as a therapeutic agent in FRDA, could have
inhibitory effects on the mitochondrial biogenesis response.
Previous works in other physiological situations using animal
models have shown that the administration of vitamin C
significantly decreases the expression of transcription factors
involved in mitochondrial biogenesis [24].
Coenzyme Q10 and its analog idebenone are being used for the
treatment of FRDA. CoQ10 increase the efficiency of electron
transfer through the respiratory chain and acts as an antioxidant
itself [44]. The effect of CoQ10 or the analog idebenone upon
cardiac hypertrophy in FRDA patients has been assessed using
echocardiography. After 6 months treatment with idebenone,
cardiac hypertrophy was decreased in up to half the patients
tested, although this was not always associated with improved
fraction shortening [45].
We propose that fibroblasts in absence of antioxidants have
higher levels of PGC-1a. However, when idebenone is added to
cells produces the inhibition of mitochondrial biogenesis responses
(Figure 6) by affecting, potentially, two pathways: Idebenone may
reduce ROS levels into the cells, reducing p38 activation and,
idebenone may improve the efficiency of the mitochondrial
respiratory chain, and then decreasing the levels of activated
AMPK. Our results are in accordance with the observations
showing that treatment with idebenone improves cardiac hyper-
trophy [45] and could represent a feasible explanation to the
mechanism mediated by idebenone to improve the cardiac
outcomes.
Thus, PGC-1a appears as a downstream effector of frataxin
deficiency. Moreover, idebenone may affect the downstream
signals, improving the pathophysiological consequences of frataxin
deficiency.
We have investigated the oxidative status and mitochondrial
bioenergetic regulation in fibroblasts from three FRDA patients.
We detected abnormal oxidative status and reduction of ATP in
fibroblasts from all of them; by contrast, the molecular analysis of
mitochondrial biogenesis signals showed two different patterns:
while FRDA1 and FRDA2 samples showed increase expression of
mtTFA transcription factor and the master regulator of mito-
chondrial biogenesis PGC-1a, and also of the active phosphory-
lated forms of p38 MAPK and the metabolic sensor AMPK. No
metabolic response was detected in fibroblasts from patient
FRDA3. Thus, there was no full coincidence on the oxidative
status and biogenesis metabolism in mitochondria.
There are, however, some clinical and genetic differences
among the patients that could explain the observed differential
status of oxidative stress and biogenesis response. Patients FRDA1
and 2 were 30 and 36 years old, respectively, when skin biopsy was
taken. Both individuals were carrying one GAA expanded allele
with a number of repeats under the threshold of 500 that is usually
associated with a late onset of the disease (Table 1) [3,46]. Both
patients showed cardiomyopathy, as well (Table 1). Based on the
GAA expansion of the smaller allele [46] the age at onset in both
patients FRDA 1 and FRDA 2 could be estimated at 25 years
(Table 1). In the same way the age at onset of patient FRDA 3
could be estimated at 8 years (Table 1); when skin biopsy was
performed at the age of 13 no cardiomyopathy was referred to
(Table 1). We propose that increase of ROS and involvement of
the oxidative phosphorylation may be an early event in the cell
pathophysiology of frataxin deficiency, whereas increase of
mitochondriogenic response might be a later phenomenon
associated to the individual age and natural history of the disease,
being more evident as the patient age increases and disease
evolves. This is a possible explanation of heart disease in FRDA.
Mitochondrial Biogenesis in Friedreich Ataxia
PLoS ONE | www.plosone.org 8 June 2011 | Volume 6 | Issue 6 | e20666
Several studies have suggested a correlation between cardiomy-
opathy and overexpression of PGC-1 [43,47]. In that way,
mitochondrial proliferation, a well recognized compensatory
mechanism in mitochondrial disease, could contribute to myocar-
dium remodeling because mitochondrial proliferation could
interfere with sarcomere alignment and contraction [47]. Al-
though more studies are necessary to translate these observations
to cells typically affected in FRDA, such as neurons and
cardiomyocytes, our observations in fibroblasts suggest a role of
mitochondrial biogenesis signals in the clinical evolution of the
Friedreich’s ataxia pathophysiology. Due to the rarity of the
disease, the scarcity of samples, the involved nature of the analyses,
and the interindividual variability of both the patients and the
healthy controls, it is difficult to establish firmly the role of PGC-
1a and other metabolic sensors on mitochondrial biogenesis in
Friedreich’s ataxia. But it is becoming increasingly evident from
this and other studies that the role of oxidative stress and
mitochondria must be taken into account if we want to build up a
complete picture of the pathophysiology of Friedreich’s ataxia.
Materials and Methods
Cell CultureFRDA fibroblasts (GM04078, GM03816 and GM03665) and
control fibroblasts (GM08402 and GM01652) were obtained from
Coriell Cell Repository (Camden, NJ). Control fibroblasts are age
and gender matched, being GM04072 the FRDA1 (male, 30
years); GM03816 the FRDA2 (female, 36 years); GM03665 the
FRDA3 (female, 13 years); GM08402 the Control1 (male, 32
years) and GM01652 the Control2 (female, 11 years). An
additional female adult control (Control3) was kindly donated by
Dra. Del Rio from the CIEMAT (Madrid, Spain). The cells were
cultured in Eagle’s minimum essential medium with Earle’s salts
and non-essential amino acids (DMEM, Gibco, Invitrogen)
supplemented with 15% fetal bovine serum inactivated, 1%
Glutamine and 1% penicillin-streptomycin (Sigma-Aldrich, St.
Louis, MO) in 5% CO2 in air at 37uC at density of 20,000 cells/
cm2. Trypsin-EDTA was used as the subculture method. Studies
were performed at cell confluence. Characteristics and clinical
aspects of patients as reported at the Coriell website have been
collected in Table 1. Genetic analysis of the GAA expanded alleles
were performed as previously reported by Monros et al. [47] and
have been collected in Table 1, as well. In some experiments,
FRDA and control fibroblasts were cultured in presence of
idebenone. Briefly, cells were incubated with idebenone (5 mM)
during 5 days using experimental conditions reported previously
by Jauslin et al. [48].
Superoxide levels determinationCells were cultured in 6 chamber plates for 6 days (at
confluence). After cells were washed 2 times with pre-warmed
PBS medium, 2 mL/mL of diluted dihydroethidium (Sigma, St.
Louis, USA) was added to the plate. Cells were incubated at 37uCfor 20 min. After washing the plate with PBS, medium was
replaced for another one without dihydroethidium for 1 hour at
37uC. The fluorescence was measured using fluorimeter spectra-
MAX GEMINIS (Molecular Devices, Sunnyvale, USA), with
530 nm of excitation wavelength and 610 nm of emission
wavelength. All samples were analyzed between 4–10 independent
experiments.
Real-time quantitative PCRRNA isolation and cDNA synthesis. Total RNA was
isolated from cells using the PARISTM Protein and RNA
Isolation System (Ambion, Austin, TX) according to the
manufacturer’s instructions. For reverse transcription reactions
(RT), 1 mg of the purified RNA was reverse transcribed using
random hexamers with the High-Capacity cDNA Archive kit
(Applied Biosystems, P/N: 4322171; Foster City, CA) according to
the manufacturer’s instructions. RT conditions comprised an
initial incubation step at 25uC for 10 min. to allow random
hexamers annealing, followed by cDNA synthesis at 37uC for
120 min, and a final inactivation step for 5 min. at 95uC.
Measurement of mRNA Levels. The mRNA levels were
determined by quantitative real-time PCR analysis using an ABI
Prism 7900 HT Fast Real-Time PCR System (Applied Biosystems,
Foster City, CA). Gene-specific primer pairs and probes for FXN
(Frataxin), SOD1 (SOD Cu/Zn), SOD2 (SOD Mn), GPX1 (Glutathione
peroxidase 1) and CAT (Catalase) (Assay-on-demand, Applied
Biosystems), were used together with 16 TaqManH Universal
PCR Master Mix (Applied Biosystems, P/N 4304437, Foster City,
CA) and 2 ml of reverse transcribed sample RNA in 20 ml reaction
volumes. PCR conditions were 10 min. at 95uC for enzyme
activation, followed by 40 two-step cycles (15 sec at 95uC; 1 min at
60uC). The levels of glyceraldehyde-3-phosphate dehydrogenase
(GAPDH) expression were measured in all samples to normalize
gene expression for sample-to-sample differences in RNA input,
RNA quality and reverse transcription efficiency. Each sample was
analyzed in triplicate, and the expression was calculated according
to the 22DDCt method [49].
Cell lysates and Western blot analysisApproximately 3?106 cells were lysed using lysis buffer (Hepes,
pH 7.4, 20 mM, tritonX-100 1%, NaCl 100 mM, NaF 50 mM,
b-glycerophosphate 10 mM, activated sodium orthovanadate
1 mM, PMSF 1 mM, protein proteases inhibitor cocktail 2 mL/
mL in ice about 15 minutes and then the suspension was spun-
down at 13000 g for 10 min at 4uC and the supernatants were
collected and stored at 280uC until their use. Protein content was
determined by a modified Lowry method [50]. Aliquots of cell
lysates (40–50 mg) were added to sample buffer with 10% b-
mercaptoethanol and then were immediately boiled for 5 min and
separated by electrophoresis in sodium dodecyl sulfate 12%
polyacrylamide gels (SDS-PAGE), 100V during two hours. After
electrophoresis, the proteins were electroblotted (Bio-Rad) onto
nitrocellulose membrane. Membranes were blocked with 0.05 g/
ml non-fat milk or BSA 0.05 g/ml in TBS-0.2% Tween 20
(TBST) according to the antibody, washed three times at room
temperature, and incubated with primary antibodies against
catalase (1:1000) (Sigma, St. Louis, USA), MnSOD (1:1000)
(Stressgen, Ann Arbor, MI, USA), CuZnSOD (1:1000, Stressgen,
Ann Arbor, MI, USA), Gpx1 (1:750, Abcam, Cambridge, MA,
USA), PGC1 (1:500, Cayman Chem. Ann Arbor, MI, USA),
PGC1 (1:750, Santa Cruz BioTech. USA), mtTFA (Santa Cruz
BioTech. California, USA), p38 and phosphorylated-p38 (1:1000,
Cell Signaling, Boston, MA, USA), AMPK and phosphorylated-
AMPK (1:1000, Cell Signaling, Boston, MA, USA) and a-tubulin
or a-actin (1:1000, Santa Cruz BioTech. USA) as loading control,
in TBST with 0.01 g/ml non-fat milk for 2 h at room
temperature. Thereafter, the blots were washed again with TBST
and further incubated for 1 h with a secondary mouse, rabbit or
goat antibody conjugated with horseradish peroxidase-linked.
After washing with TBST as above, blots were developed by using
the ECLTM Western Blotting Detection Reagents as specified by
the manufacturer (Amersham GE HealthcareBio-Sciences AB,
Uppsala, Sweden). Chemioluminescent signals were assessed using
a Fujifilm scanning densitometer (Fujifilm LAS-1000 plus).
Mitochondrial Biogenesis in Friedreich Ataxia
PLoS ONE | www.plosone.org 9 June 2011 | Volume 6 | Issue 6 | e20666
Measurement of CuZnSOD and MnSOD activityTo determine MnSOD and CuZnSOD activity the cells were
treated as is described in the Cayman ‘‘Superoxide Dismutase
Assay kit’’ (Ann Arbor, MI). After centrifugation at 10,000 g for
10 min, supernatant was used to measure CuZnSOD activity. The
mitochondrial pellet was lysed using a lysis buffer compatible with
the manufacturer’s instructions (10 mM HEPES, pH7.9, 420 mM
NaCl, 1,5 mM MgCl2, 0,5 mM EDTA, 0.1% Triton X-100) for
20 min on ice. After centrifugation at 12,000 g for 5 min, the
supernatant was collected for MnSOD activity assay. Measure-
ments of CuZnSOD and MnSOD activities were performed in a
96 well plate prepared using 3–4 replicates from different cellular
extracts for each sample. The final absorbance was measured at
450 nm using a spectrophotometer spectraMAXPLUS 384
(Molecular Devices, Sunnyvale, CA, USA).
Measurement of catalase activityThe method for measuring the catalase enzymatic activity was
based on the reaction of the enzyme with methanol in the presence
of hydrogen peroxide to produce formaldehyde. Cells were lysate
using freeze (liquid N2, 10 s) and thaw (ice, 15 min) procedure
repeated three times. After centrifugation of the cell lysate at 13000
rcf, for 10 min. at 4uC, supernatants were recovered and quantified
using Lowry method. A 96 well plate was prepared using at least 4
replicates for each sample, obtained from different cellular extracts.
Assay reaction consisted in mixing on a 96 well plate: 100 mL of
Kpi 100 mM pH 7.0; 30 mL methanol and 20 mL of the sample
with the same protein concentration). Then, the reaction was
started with 20 mL of 85 mM H2O2, maintained during 20 min at
room temperature and finally stopped using 30 mL of KOH 10 M.
The formaldehyde produced reacts with 35 mM purpald reagent
dissolved in 0,5 M HCl during 10 min at room temperature.
Finally, 10 mL of 0.5% KIO4 in KOH 0.5 M were added and the
absorbance at the wavelength of 540 nm was measured with
spectrophotometer spectra MAXPLUS 384 (Molecular Devices,
Sunnyvale, CA, USA).
Measurement of glutathione peroxidase activityGpx activity was measured by using a glutathione peroxidase
assay kit (Cayman (Ann Arbor, MI). Briefly, cells were collected and
lysated using cold buffer (50 mM Tris-HCl, pH 7.5, 5 mM EDTA
and 1 mM DTT) and two freeze-thaw cycles with liquid N2. The
lysates were centrifuged at 10000 g for 15 min at 4uC and the
supernatants recovered in fresh tubes. A 96 well plate was prepared
using at least 3 replicates for each sample from different cellular
extracts. After protein quantification by Lowry method, samples
containing 20 mg of total proteins were added to the 96 well plate
containing a solution with 1 mM GSH, 0.4 U/mL of glutathione
reductase, 0.2 mM NADPH. The reaction was initiated by adding
0.22 mM of cumene hydroperoxide and the reduction of the
absorbance was recorded at 340 nm each 1 min during 8 min. The
Gpx activity was determined by the rate of decrease in absorbance
at 340 nm (1 mU/mL Gpx). Molar coefficient extinction for
NADPH was 0.00622 mM21 cm21, and the pathlength of the
solution into the plate was established in 0.6 cm.
Fluorescent microscopy to evaluate mitochondrialdistribution and morphology
Cells were grown on coverslips inside a petri dish filled with
DMEM. 24 h later cells were fixed with 2% and 4% solution
paraformaldehyde successively and then permeabilized with a
solution of 0.5%PBS-Triton X-100, at 37uC, 5% CO2 during
10 min. Cells were probed with anti-cytochrome-C antibody
(Zymed, Millipore, Billerica. USA) in blocking solution (PBS/FBS
3%) and then incubated with fluorescent Alexa Fluor 488 secondary
antibody (Molecular probes). Appropriate negative controls were
made by incubating fixed cells with secondary antibodies only.
Coverslips were then fixed on microscope slides and digitized with a
Hamamatsu camera (Tokyo, Japan) connected to Leica DMR
microscopy (Nussloch, Germany). All images were captured under
constant exposure time, gain, and offset. Fluorescence measure-
ments were made using ImageJ and relative to the cell surface. At
least 180 cells were counted for each cell type in at least 18 different
experiments and the mean 6 SD calculated.
Quantification of ATP levelsBriefly, cells were trypsinized and resuspended in 0.5 mL PBS
(16106 cells/mL). The ATP levels were determined using the
adenosine 59-triphosphate (ATP) Bioluminiscent Assay (Sigma, St.
Louis, USA) following the manufacturer’s instructions After
releasing of the ATP from the cells, bioluminescent signal was
measured in triplicate for each cell type using Wallac Victor2TM
1420 multilabel Counter (PerkinElmer, Waltham, MA, USA) in at
least six independent experiments. Results were represented as
mean 6 SD.
Statistical analysesFor the statistical analysis of the results, the mean was taken as
the measurement of the main tendency, while standard deviation
was taken as the dispersion measurement. A one way analysis of
variance was used to determine the difference between groups
analyzing superoxide levels, expression of FXN, SOD1, SOD2,
CAT and GPX1 genes and activities for MnSOD, CuZnSOD,
catalase and glutathione peroxidase. When an interaction effect
was found, multiple comparisons using the Student-Newman-
Keuls method post hoc test were performed. When the normality
test failed (ATP and cytochrome C values) we performed a
Kruskal-Wallis one way ANOVA on ranks with multiple
comparisons using Dunn’s method. Each measure was performed
using independent experiments. Different number of technical
replicates was used in each analytical determination (see specific
technique for details).
The alpha level for statistical significance was set at p,0.05.
Supporting Information
Figure S1 Frataxin levels determined in FRDA andcontrol cells. Mean (6SD) mRNA levels of frataxin in FRDA
(FRDA1, FRDA2, and FRDA3) and control cells (Control1,
Control2, Control3) analyzed by triplicate. Results show lower
frataxin levels in FRDA than in control fibroblasts.
(TIF)
Table S1 Experimental values obtained for superoxideand mRNA levels for distinct antioxidant enzymes. Table
shows all experimental data as Mean (6SD) obtained for
superoxide quantification; mRNA levels for FXN, SOD1,
SOD2, CAT and GPX1 genes determined by RT-PCR.
(DOCX)
Table S2 Experimental values obtained for antioxidantenzymatic activities. Table shows all experimental data as
Mean (6SD) obtained for CuZnSOD, MnSOD, catalase and total
glutathione peroxidase activity.
(DOCX)
Table S3 Experimental values obtained for CytochromeC and ATP quantification. Table shows all experimental data
as Mean (6SD) obtained for Cytochrome C levels quantified using
Mitochondrial Biogenesis in Friedreich Ataxia
PLoS ONE | www.plosone.org 10 June 2011 | Volume 6 | Issue 6 | e20666
immunofluorescence and ATP levels quantified using the
luciferase assay.
(DOCX)
Acknowledgments
The authors wish to thank to G. Garcıa, A. Velazquez, C Perez-Quilis and
I. Esmoris for technical support.
Author Contributions
Conceived and designed the experiments: JLGG FP FVP. Performed the
experiments: JLGG AG PGC FD BM ABA. Analyzed the data: JLGG AG
PGC FD FP FVP. Contributed reagents/materials/analysis tools: FD FP
FVP. Wrote the paper: JLGG FP FVP.
References
1. Campuzano V, Montemini L, Molto MD, Pianese L, Cossee M, et al. (1996)Friedreich’s ataxia: autosomal recessive disease caused by an intronic GAA
triplet repeat expansion. Science 271: 1423–1427.2. Campuzano V, Montemini Lutz Y, Cova L, Hindelang C, Jiralespong S, et al.
(1997) Frataxin is reduced in Friedreich’s ataxia patients and is associated withmitochondrial membranes. Hum Mol Genet 6: 1771–1780.
3. Durr A, Cossee M, Agid Y, Campuzano V, Mignard C, et al. (1996) Clinical and
genetic abnormalities in patients with Friedreich’s ataxia. N Engl J Med 335:1169–1175.
4. Harding AE (1981) Friedreich’s ataxia: a clinical and genetic study of 90 familieswithan analysis of early diagnostic criteria and intrafamilial clustering of clinical
features. Brain 104: 589-520.
5. Puccio H, Simon D, Cossee M, Criqui-Filipe P, Tiziano F, et al. (2001) MouseModels for Friedreich ataxia exhibit cardiomiopathy, sensory nerve defect and
Fe-S enzyme deficiency followed by intramitochondrial iron deposits. Nature 27:181–186.
6. Calabrese V, Lodi R, Tonon C, D’Agata V, Sapienza M, et al. (2005) Oxidativestress, mitochondrial dysfunction and cellular stress response in Friedreich’s
ataxia. J Neurol Sci 233: 145–162.
7. Adinolfi S, Iannuzzi C, Prischi F, Pastore C, Iametti S, et al. (2009) Bacterialfrataxin CyaY is the gatekeeper of iron-sulfur cluster formation catalized by IscS.
Nat Struct Mol Biol 16: 390–396.8. Shoichet SA, Baumer AT, Stamenkovic D, Sauer H, Pfeiffer R, et al. (2002)
Frataxin promotes antioxidant defense in a thiol-dependent manner resulting in
diminished malignant transformation in vitro. Hum Mol Genet 11: 815–21.9. Piemonte F, Pastore A, Tozzi G, Tagliacozzi D, Santarelli FM, et al. (2001)
Glutathione in blood of patients with Friedreich’s ataxia. Eur J Clin Invest 31:1007–11.
10. Schulz JB, Dehmer T, Schols L, Mende H, Hardt C, et al. (2000) Oxidative
stress in patients with Friedreich ataxia. Neurology 55(11): 1719–21.11. Lamarche JB, Cote M, Lemieux B (1980) The cardiomyopathy of Friedreich’s
ataxia morphological observation in 3 cases. Can J Neurol Sci 7: 389–396.12. Bradley JL, Blake JC, Chamberlain S, Thomas PK, Cooper JM, et al. (2000)
Clinical, biochemical and molecular genetic correlations in Friedreich’s ataxia.Hum Mol Genet 9: 275–282.
13. Cavadini P, Gellera C, Patel PI, Isaya G (2000) Human frataxin maintains
mitochondrial iron homeostasis in Saccharomyces cerevisiae. Hum Mol Genet9: 2523–2530.
14. St-Pierre J, Drori S, Uldry M, Silvaggi JM, Rhee J, et al. (2006) Suppression ofReactive Oxygen Species and neurodegeneration by the PGC-1 transcriptional
coactivators. Cell 127: 397–408.
15. Kelly DP, Scarpulla RC (2004) Transcriptional regulatory circuits controllingmitochondrial biogenesis and function. Genes Dev 18: 357–368.
16. Lin J, Handschin C, Spiegelman BM (2005) Metabolic control through thePGC-1 family of transcription coactivators. Cell Metab 1: 361–370.
17. Garesse R, Vallejo CG (2001) Animal mitochondrial biogenesis and function: aregulatory cross-talk between two genomes. Gene 263: 1–16.
18. Larsson NG, Wang J, Wilhelmsson H, Oldfors A, Rustin P, et al. (1998)
Mitochondrial transcription factorA is necessary for mtDNA maintenance andembryogenesis in mice. Nat Genet 18: 231–236.
19. Alan TI, Kanki T, Muta T, Ukaji K, Abe Y, et al. (2003) Human mitochondrialDNA is packaged with mtTFA. Nucleic Acids Res 31: 1640–1645.
20. Fisher RP, Lisowsky T, Breen GA, Claton DA (1991) A rapid efficient method
for purifying DNA-binding proteins. Denaturation-renaturation chromatogra-phy of human and yeast mitochondrial extracts. J Biol Chem 266: 9153–9160.
21. Yoshida Y, Izumi H, Torigoe T, Ishiguchi H, Itoh H, et al. (2003) p53 physicallyinteracts with mitochondrial transcription factor A and differentially regulates
binding to damage DNA. Cancer Res 63: 3729–3734.22. Lee HC, Wei YH (2005) Mitochondrial biogenesis and mitochondrial DNA
maintenance of mammalian cells under oxidative stress. Int J Biochem Cell Biol
37: 822–834.23. Davies KJ, Quintanilha AT, Brooks GA, Packer L (1982) Free radicals and tissue
damage produced by exercise, Biochem Biophys Res Commun 107: 1198–1205.24. Gomez-Cabrera MC, Domenech E, Romagnoli M, Arduini A, Borras C, et al.
(2008) Oral administration of vitamin C decreases muscle mitochondrial
biogenesis and hampers training-induced adaptations in endurance perfor-mance. Am J Clin Nutr 87: 142–149.
25. Seznec H, Simon D, Monassier L, Criqui-Filipe P, Gansmuller A, et al. (2004)Idebenone delays the onset of cardiac function alteration without correction of
Fe-S enzymes deficit in a mouse model for Friedreich ataxia. Hum Mol Gen
13(10): 1017–1024.
26. Marmolino D, Manto M, Acquaviva F, Vergara P, Ravella A, et al. (2010) PGC-1alpha Down-regulation affects the antioxidant response in Friedreich’s ataxia.
Plos one 5(4): e10025.27. Lodi R, Cooper JM, Bradley JL, Manners D, Styles P, et al. (1999) Deficit of in
vivo mitochondrial ATP production in patients with Friedreich’s ataxia. ProcNatl Acad Sci USA 96: 11492–11495.
28. Chantrel-Groussard K, Geromel V, Puccio H, Koenig M, Munnich A, et al.
(2001) Disabled early recruitment of antioxidant defenses in Friedreich’s ataxia.Hum Mol Genet 10: 2061–2067.
29. Jiralerspong S, Ge B, Hudson TJ, Pandolfo M (2001) Manganese superoxidedismutase induction by iron is impaired in Friedreich ataxia cells. FEBS 509:
101–105.
30. Cadenas E, Davies KJA (2000) Mitochondrial free radical generation, oxidativestress and aging. Free Rad Biol Med 29: 222–230.
31. Miranda S, Foncea R, Guerrero J, Leighton F (1999) Oxidative stress and up-regulation of mitochondrial biogenesis in mitochondrial DNA depleted HeLa
cells. Biochem Biophys Res Commun 258: 44–49.32. Jauslin ML, Wirth T, Meier T, Shoumacher F (2002) A cellular model for
FRDA reveals small-molecule glutathione peroxidase mimetics as novel
treatment strategy. Hum Mol Genet 11: 3055–3063.33. Ristow M, Pfister MF, Yee AJ, Schubert M, Michael L, et al. (2000) Frataxin
activates mitochondrial energy conversion and oxidative phosphorylation. ProcNat Acad Sci 97: 12239–12243.
34. Suzuki H, Kumagai T, Goto A, Sugiura T (1998) Increase in intracellular
hydrogen peroxide and up-regulation of a nuclear respiratory gene evoked byimpairment of mitochondrial electron transfer in human cells. Biochem Biophys
Res Comm 249: 542–545.35. Lee HC, Yin PH, Lu CY, Chi CW, Wei YH (2000) Increase of mitochondria
and mitochondrial DNA in response to oxidative stress in human cells. Biochem J
348: 425–432.36. Puigserver P, Rhee J, Lin J, Wu Z, Yoon JC, et al. (2001) Cytokine stimulation of
energy expenditure through p38 MAP kinase activation of PPARgammacoactivator-1. Mol Cell 8: 971–982.
37. Ito K, Hirao A, Arai F, Takubo K, Matsuoka S, et al. (2006) Reactive oxygenspecies act through p38 MAPK to limit the lifespan of hematopoietic stem cells.
Nature Med 12: 446–451.
38. Fan M, Rhee J, St-Pierre J, Handschin C, Puigserver P, et al. (2004) Suppressionof mitochondrial respiration through recruitment of p160 myb binding protein
to PGC-1alpha: modulation by p38 MAPK. Genes Dev 18: 278–289.39. Bergeron R, Ren JM, Cadman KS, Moore IK, Perret P, et al. (2001) Chronic
activation of AMP Kinase results in NRF-1 activation and mitochondrial
biogenesis. Am J Physiol Endocrinol Metab 281: E1340–E1346.40. Hardie DG (2004) AMP-activated protein kinase: a key system mediating
metabolic responses to exercise. Med Sci Sports Exerc 36: 28–34.41. Hardie DG, Sakamoto K (2006) AMPK: a key sensor of fuel and energy status in
skeletal muscle. Physiology 21: 48–60.42. Coppola G, Marmolino D, Lu D, Wang Q, Cnop M, et al. (2009) Functional
genomic analysis of frataxin deficiency reveals tissue-specific alterations and
identifies the PPARgamma pathway as a therapeutic target in Friedreich’sataxia. Hum Mol Genet 18: 2452–61.
43. Lehman JJ, Barger PM, Kovacs A, Saffitz JE, Medeiros DM, et al. (2000)Peroxisome proliferator-activated receptor gamma coactivator-1 promotes
cardiac mitochondrial biogenesis. J Clin Invest 106: 847–856.
44. Cooper JM, Schapira AHV (2003) Friedreich’s ataxia: Disease mechanisms,antioxidant and Coenzyme Q10 therapy. Biofactors 18: 163–171.
45. Hausse AO, Aggoun Y, Bonnet D, Sidi D, Munnich A, et al. (2002) Idebenoneand reduced cardiac hypertrophy in Friedreich’s ataxia. Heart 87: 346–349.
46. Monros E, Molto MD, Martınez F, Canizares J, Blanca J, et al. (1997)Phenotype correlation and intergenerational dynamics of the Friedreich ataxia
GAA trinucleotide repeat. Am J Hum Genet 61(1): 101–10.
47. Sebastiani A, Giordano C, Nediani C, Travaglini C, Borchi E, et al. (2007)Induction of mitochondrial biogenesis is a maladaptive mechanism in
mitochondrial cardiomyopathies. J Am College Cardio 50: 1362–1369.48. Jauslin ML, Wirth T, Meier T, Schoumacher F (2002) A cellular model for
Friedreich ataxia reveals small-molecule glutathione peroxidase mimetics as
novel treatment strategy. Hum Mol Gen 11: 3055–3063.49. Livak KJ, Schmittgen TD (2001) Analysis of Relative Gene Expression Data
Using Real-Time Quantitative PCR and the 2-DDCt Method. Methods 25:402–408.
50. Peterson GL (1977) A simplification of the protein assay method of Lowry, et al.
Which is more generally applicable. Anal Biochem 83: 346–356.
Mitochondrial Biogenesis in Friedreich Ataxia
PLoS ONE | www.plosone.org 11 June 2011 | Volume 6 | Issue 6 | e20666