The influence of seagrass beds on carbonate sediments in the Bahamas
Upload
edithcowanCategory
view
0download
0
Differences in the species- and size-composition of fish assemblagesin three distinct seagrass habitats with differingplant and meadow structure
Received: 1 November 2001 / Accepted: 18 December 2002 / Published online: 26 March 2003� Springer-Verlag 2003
Abstract Fish faunas were sampled seasonally using alarge and a small beam trawl in three seagrass habitatscomprising predominantly Amphibolis griffithii or Pos-idonia sinuosa or Posidonia coriacea, which differ inseagrass and meadow structure. Amphibolis griffithiiand P. sinuosa both produce a relatively dense leafcanopy, but the former exhibits a distinct architecture,with the leaf canopy overlying relatively open spacessurrounding woody stems, compared to the uniformlydense blade-like leaves of P. sinuosa which emerge di-rectly from the sediment. In comparison, P. coriaceaprovides a landscape of patchy seagrass amongst areasof bare sand. Since the latter seagrass habitat containslarge areas of sand, fish were also sampled in adjacentunvegetated areas. The number of species and densityof fish were greater (P<0.05) in P. sinuosa than ineither A. griffithii or P. coriacea. The mean number ofspecies caught using the large trawl ranged from 16 to24 in the first of these habitats compared to 14–21 and9–15 in the last two habitats, respectively, and themean densities ranged between 78 and 291 fish1000 m)2 in P. sinuosa compared to 31–59 fish1000 m)2 in A. griffithii and 31–59 fish 1000 m)2 in P.coriacea. The biomass of fish was greater (P<0.05) in
both P. sinuosa and A. griffithii than in P. coriacea(4.2–5.3 kg and 3.3–6.2 kg versus 0.7–1.9 kg 1000 m)2,respectively). Furthermore, the size-structure of fishdiffered among these habitats, where the median weightof fish was 72.1 g in A. griffithii, compared to 7.5 g and19.8 g in P. sinuosa and P. coriacea, respectively. Or-dination and ANOSIM demonstrated that the species-composition differed markedly among the three sea-grass habitats (P<0.001), suggesting that fish speciesdisplay a distinct preference for particular seagrassescharacterised by different architecture. Differences inspecies-composition among the seagrass habitats partlyreflected the size-composition of fish in each habitat.The open space below the canopy of A. griffthii is likelyto allow larger fish to occupy this habitat, whereas onlysmall fish would be able to penetrate the dense foliageof P. sinuosa. Differences in species- and size-compo-sition of fish among these habitats may be the result ofsettlement-sized larvae discriminating between particu-lar seagrass and meadow structures, or fish beingsubject to different levels of predation and/or accessi-bility to food or space. The species-composition in P.coriacea was highly dispersed and did not differ fromthat of unvegetated areas. While several species wereassociated with both P. coriacea and bare-sand habi-tats, some species did display a high affinity with theseagrass P. coriacea. This may reflect an associationwith the sparse and narrower leaves of this seagrass orwith the patchy occurrence of the seagrass Heterozos-tera tasmanica, which commonly occurs as an under-storey in this habitat.
Introduction
The influence of seagrass structure on the compositionof the faunas in seagrass habitats has received consid-erable attention, but with mixed conclusions. Earlystudies concluded that increased seagrass complexityprovides fish with greater protection from predation,
Marine Biology (2003) 142: 1195–1206DOI 10.1007/s00227-003-1010-2
G. A. Hyndes Æ A. J. KendrickL. D. MacArthur Æ E. Stewart
Communicated by G.F. Humphrey, Sydney
G. A. Hyndes (&) Æ A. J. KendrickL. D. MacArthur Æ E. StewartSchool of Biological Sciences and Biotechnology,Murdoch University,6150 Murdoch, Western Australia, Australia
E-mail: [email protected]
Present address: G. A. HyndesCentre for Ecosystem Management,Edith Cowan University,Joondalup Drive, 6027 Joondalup,Western Australia, Australia
Present address: A. J. KendrickCentre for Ecosystem Management,Edith Cowan University,Joondalup Drive, 6027 Joondalup,Western Australia , Australia

resulting in higher densities of fish (Heck and Orth 1980;Orth et al. 1984). In contrast, Bell and Westoby (1986a)provided evidence that higher densities of fish in struc-turally more complex seagrass was a habitat preferencerather than a response to predation. Manipulative fieldtrials have shown that fish respond to thinning andshortening of seagrass leaves (e.g. Bell and Westoby1986a; Jenkins and Sutherland 1997). However, fishhave not been shown to be influenced by structuralchanges in seagrass over larger spatial scales (e.g. Belland Westoby 1986b; Bell et al. 1987; Worthington et al.1992), suggesting that fish settle indiscriminately intoseagrass habitats, irrespective of complexity. While somestudies have shown that post-settlement fish subse-quently undertake small-scale movements into preferredmicrohabitats (Bell and Westoby 1986b, 1986c), othersindicate that some species can migrate large distancesbetween vegetated habitats across bare substrata (e.g.Virnstein and Curran 1986; Sogard 1989).
In contrast to seagrasses, variations in the structuralcomplexity of reef algae appear to strongly influence thesettlement of larvae and/or the levels of predation ofpost-settlement fish in temperate reef habitats (Anderson1994; Carr 1994; Levin and Hay 1996). Furthermore, thesize of fish in the kelp Macrocystis pyrifera has beenshown to increase in the comparatively open spacesbelow the canopy (Anderson 1994). Thus, both thespecies-assemblage and size-composition of fish can beinfluenced by algal structure.
Although most studies of fishes in seagrass have beenrestricted to seagrass species with simple strap-likeleaves (e.g. Middleton et al. 1984; Bell and Westoby1986a; Jenkins and Sutherland 1997; Rotherham andWest 2002), seagrass architecture can differ markedlyamong species. For example, the leaf area index ofAmphibolis griffithii is 3.3 m2 leaf m)2 sediment com-pared to 5.1 m2 leaf m)2 sediment for Posidonia sinuosa(Cambridge 1999). Leaves account for some 40–50% ofthe above-ground biomass of A. griffithii, with the bulkof this occurring at the tips of long, wiry stems. Thisspecies grows to a height of 30–50 cm (Fig. 1). In con-trast, the blade-like leaves of P. sinuosa, which growfrom buried stems, emerge directly from the sediment(Kuo and McComb 1989; Cambridge 1999). Meadowsof A. griffithii, therefore, provide a distinct architecturewith relatively open spaces below a dense leaf canopy,whereas meadows of P. sinuosa consist of a uniformlydense leaf canopy arising directly from the sediment.While P. sinuosa and A. griffithii each provide 75–100%seagrass cover, Posidonia coriacea provides a patchycover of only 25–40% seagrass with a leaf area index ofonly 2.2 m2 leaf m)2 sediment (Cambridge 1999;Kendrick et al. 1999). Clumps of the relatively sparseblade-like leaves of this seagrass thus produce an inter-spersed and patchy landscape of seagrass and bare sand.
Large seagrass meadows comprising predominantlyAmphibolis griffithii or Posidonia sinuosa or Posidoniacoriacea, which display very different seagrass andmeadow architecture (Fig. 1; Kuo and McComb 1989;
Kendrick et al. 1999), occur in inshore, marine waters onthe south-western coast of Australia. A preliminarystudy, by examining a portion of the fish assemblage inthe region, has shown that the different seagrass habitatsare occupied by different species (Hyndes 2000). Fur-thermore, species belonging to the family Odacidae tendto occupy different seagrass habitats, with the largerspecies tending to reside in A. griffithii (MacArthur andHyndes 2001). We therefore aimed to establish whetherthe broader fish community exhibit similar trends. Thatis, whether species-composition varies amongst broad-scale seagrass habitats characterised by structurally di-vergent seagrass species, and whether any differences arereflected by larger fish being more prevalent in A. grif-fithii meadows, where they would be expected to occupythe open spaces beneath the seagrass canopy. SinceP. coriacea comprises a patchy landscape of seagrassand bare sand, we also aimed to determine whether thefish assemblage associated with this habitat reflects thepresence of both seagrass and bare sand.
Materials and methods
Sampling rationale and design
Fish were sampled in three seagrass habitats comprising predomi-nantly Amphibolis griffithii or Posidonia sinuosa or Posidonia cori-acea, and in an unvegetated habitat, in marine waters offshore from
Fig. 1 Schematic diagram showing the different seagrass andmeadow structures of the seagrasses Amphibolis griffithii, Posidoniasinuosa and Posidonia coriacea
1196

Fremantle (32�03.80¢S; 115�44.00¢E) on the south-western coast ofAustralia (Fig. 2). These seagrass and unvegetated habitats form amosaic of relatively interspersed meadows with adjacent unvege-tated areas throughout the study region with an area of �60 km2.Random replicate samples were collected from each habitat type atnight in each season between autumn 1997 and summer 1997/1998.To select sampling locations, the area of each habitat type in thestudy region was divided into 500·500-m grids. Prior to samplingin each season, four grids representing each habitat type wererandomly selected to be sampled for fish using two types of beamtrawl. Samples collected from the four grids in each habitat andseason constituted replicate samples for those habitats. Thesereplicate samples were collected in a random sequence over a pe-riod of 4–6 weeks in the last half of each season. At least one, andno more than three, samples from each habitat were collected atany one sampling time. This approach ensured that, for each sea-son, samples taken from each habitat were dispersed over the 4–6 week period. When a grid was selected for sampling in more thanone season, sampling in that grid was carried out at a differentlocation from the previous one.
Both a large and a small beam trawl were used during the studyto ensure that both small and large species and sizes of species andsize-composition of fish were representively collected from the var-ious habitat types. The large beam trawl had a mouth width andheight of 2.5 and 1.5 m, respectively, and had 25-mm mesh in thebody and 10-mm mesh in the cod-end. Trawling was carried outover a distance of 500 m, thereby sampling 0.5% of the total area ofeach grid. The small beam trawl, which had a mouth width andheight of 1.0 and 0.5 m, respectively, comprised 2.5-mmmesh in thebody and 1.0-mmmesh in the cod-end. This trawl was deployed overa distance of 50 m, which represented 0.02% of the total grid area.
The number of individuals and the total wet weight of eachspecies were recorded. The total length (to the nearest millimetre)and wet weight (to the nearest one hundredth of a gram ) of eachrepresentative of each species in each sample were recorded, exceptwhen catches were large. In those cases, the lengths and weights of100 randomly selected individuals of each species from the collec-tive samples from each habitat were recorded.
Since the area sampled by the large and small trawls was 1250and 50 m2, respectively, the density and biomass data were con-verted to areas of 1000 and 100 m2 for the respective trawls forsubsequent analyses. Using data collected over the four seasons,two-way analysis of variance (ANOVA) was employed to deter-mine whether the number of species, total densities and total bio-mass differed among habitats and seasons. Both factors wereconsidered fixed. Emphasis was placed on habitat, since season wasincluded in the model purely to show that habitat differences wereconsistent on a broad temporal scale. To test for differences be-tween seasons, replication across years would be required. Coch-ran’s C-test was used to test for homogeneity of variance. Wheredata were shown to be heteroscedastic, they were log10(n+1)-transformed, which usually resulted in homogeneity of variance. Ifdata remained heteroscedastic after transformation, factors wereconsidered to be significant at the 0.01 probability level (Under-wood 1981). Where factors were shown to be significant, Scheffe’s aposteriori multiple-comparison test was used to determine whichvalues differed significantly at the 0.05 probability level.
Multivariate analyses were carried out separately on the densitydata derived from samples collected by the large and small beamtrawls, using the PRIMER package (Clarke and Warwick 1994).The density and biomass data were root-root-transformed and theBray–Curtis similarity measure used to construct the associationmatrix (Field et al. 1982; Clarke 1993). The density and biomassdata for each species were ordinated using non-metric multidi-mensional scaling (nMDS). The mean density and biomass data,derived from the four replicate samples in each habitat and season,were ordinated to examine the overall patterns in similarities ofspecies-composition in the four habitats throughout the samplingperiod. Two-way crossed ANOSIM, employing the replicate den-sity and biomass data, was used to test for differences amonghabitats and seasons. Pair-wise comparisons within each factorwere then carried out to establish which habitat(s) or season(s)differed (Clarke 1993). Similarities of percentages (SIMPER) wasused to determine which species contributed the most to any dis-similarities among groups (Clarke and Warwick 1994). Multivari-ate dispersion (MVDISP) was used to examine the degree of
Fig. 2 Map showing thelocation and depth of thesampling region near Fremantleon the south-western coast ofAustralia
1197

variability of the dissimilarities within each group (Somerfield andClarke 1997). For both ANOVA and ANOSIM, emphasis wasplaced on the results of the habitat factor.
Results
Total catches and species contributions
Far more fish were caught using the large trawl inmeadows of P. sinuosa than in A. griffithii or P. coriaceameadows or adjacent unvegetated habitats (3,336 versus£ 866; Table 1). Between 56 and 61 species of fish werecollected in each of the four habitats. Over 80% of thetotal large-trawl catches of Pelsartia humeralis and Odaxacroptilus were found in A. griffithii (Table 1). Similarly,most Pelates sexlineatus, Cnidoglanis macrocephalus,Aracana aurita andNotolabrus parilus were caught in thishabitat, where they contributed 55.4–69.8% of the totallarge-trawl catch of each species. Siphonognathus radia-tus occurred in relatively high abundances in bothA. griffithii and P. sinuosa, but was more abundant in thelatter habitat. Gymnapistes marmoratus and Acanthalu-teres spilomelanurus were, however, almost entirelyrestricted to P. sinuosa (97.9% and 99.2% of the totalcatch, respectively). In the case of Apogon rueppellii andAcanthaluteres vittiger, ~86% of fish were caught inP. sinuosa, while 68% of Scobinichthys granulatus werealso caught in this habitat. Although the majority ofMaxillicosta scabricepswere found in P. sinuosa (58.1%),a relatively high proportion of this species (27.7%) wasalso caught in P. coriacea. In contrast, Torquigenerpleurogramma was far more abundant in P. coriacea thanin either of the other two seagrass habitats (61.3%versus £ 9.2%), but was also relatively abundant overunvegetated areas (24.8%). Similarly, Parequula melbo-urnensis was equally abundant in both P. coriacea andunvegetated areas, whereas Sillago bassensis was moreabundant (68.7%) in the latter habitat.
Similar to the large trawl, the small trawl collectedmore fish in P. sinuosa than any other habitat (1,404versus £ 509), with between 35 and 40 species beingcollected in each habitat (Table 1). Relatively few fishwere caught using the small trawl in A. griffithii com-pared to the other two seagrass habitats. Siphonogna-thus radiatus was by far the most abundant speciescaught by this trawl in A. griffithii, but this species wasfound in higher abundances in P. sinuosa (77 versus166 fish). Although only 25 Cristiceps australis werecaught in A. griffithii, these accounted for 86.2% ofthe total catch of this species in all habitats. In con-trast, A. rueppellii, Cochleoceps viridis, Cochleocepsspatula, A. spilomelanurus and G. marmoratus werealmost entirely restricted to P. sinuosa (‡94.9% of thetotal catch of each species). While Stigmatopora arguswas relatively abundant in both P. sinuosa and P. co-riacea, there were more than twice as many represen-tatives of this species in the former habitat. In the caseof the grass clingfish (Gobiesocidae Genus C sp.1;
Gomon et al. 1994) and Stigmatopora nigra, ‡82.9% ofthe total catch of these two species were collected fromP. coriacea, whereas S. bassensis was markedly moreabundant over unvegetated areas than in the threeseagrass habitats (70.9%).
Number of species, densities and biomass
ANOVAs of large-trawl data revealed that the numberof species, densities and biomass of fish differed signifi-cantly among habitats, but not among seasons (Table 2;Fig. 3). There was also no interaction between these twofactors. Scheffe’s test demonstrated that more specieswere found in P. sinuosa than in either P. coriacea orunvegetated areas and more species were present inA. griffithii than in unvegetated areas. The mean numberof species ranged from 16 to 24 in P. sinuosa, comparedto 14–21 in A. griffithii, 9–15 in P. coriacea, and 7–10 inunvegetated areas (Fig. 3).
Scheffe’s test showed that P. sinuosa contained higherdensities of fish than any of the other three habitats,whereas more fish occurred in A. griffithii than in theunvegetated areas. The mean densities of fish were 78–291 fish 1000 m)2 in P. sinuosa, compared to 31–59 and16–47 fish 1000 m)2 in A. griffithii and P. coriacea, re-spectively, whereas densities in unvegetated areas were9–21 fish 1000 m)2 (Fig. 3). Both P. sinuosa andA. griffithii contained a similar biomass of fish which wasgreater than that in P. coriacea and in unvegetated areas(Fig. 3). The mean biomass was 4,204–5,258 g 1000 m)2
and 3,277–6,209 g 1000 m)2 in A. griffithii and P. sinu-osa, respectively, compared to 738–1,900 g 1000 m)2 inP. coriacea and 622–1,008 g 1000 m)2 in unvegetatedareas.
Similarly, ANOVAs of small-trawl data showed thatthe number of species, densities and biomass of fishdiffered among habitats, but not among seasons (Ta-ble 2). In addition, with the exception of densities, therewere no significant interactions between habitat andseason. Scheffe’s tests showed that more species werepresent in P. sinuosa (8–14) than in the other threehabitats (2–9; Fig. 3). Scheffe’s test also revealed thatdensities of fish in P. sinuosa were greater than overunvegetated areas in both autumn and summer, whileP. coriacea also contained higher densities of fish thanunvegetated areas during autumn (Fig. 3). Scheffe’s testshowed that the biomass of fish was greater in P. sinuosathan in P. coriacea and unvegetated habitats, and wasgreater in A. griffithii than in unvegetated areas.
Species-composition
Ordination analyses of the mean densities and biomassfor each species in each habitat and season derivedfrom large-trawl catches were carried out initially toexamine the overall differences among the four habitatsover the four seasons. Using density data, samples for
1198

Table
1Totalabundance
ofthespeciescontributing
‡3%
tothetotalcatchin
atleastoneofthehabitatsAmphibolisgriffithii(A
g),Posidonia
sinuosa
(Ps),Posidonia
coriacea(Pc)
and
unvegetatedareas(U
)usingthelargeandsm
alltrawlbetweenautumn1997andsummer
1998.Percentages
referto
thecontributionofthetotalcatchofeach
speciesacross
allfour
habitats
Family
Species
Largetrawl
Smalltrawl
Ag
Ps
Pc
UAg
Ps
Pc
U
Number
%Number
%Number
%Number
%Number
%Number
%Number
%Number
%
Urolophidae
Trygonoptera
mucosa
315.8
210.5
736.8
717.4
1100.0
Plotosidae
Cnidoglanismacrocephalus
41
55.4
23
31.1
56.8
55.2
133.3
266.7
Gobiesocidae
Cochleocepsspatula
9100.0
128
97.0
10.8
32.3
Cochleocepsviridis
1100.0
21.1
180
97.3
10.5
21.1
Grass
clingfish
52.7
10.5
155
82.9
26
13.9
Syngnathidae
Stigmatopora
argus
43.0
105
78.9
17
12.8
76.6
82.7
184
62.2
90
30.4
14
4.7
Stigmatopora
nigra
360.0
240.0
21.8
100
88.5
11
9.7
Scorpaenidae
Maxillicostascabriceps
28
10.5
155
58.1
74
27.7
10
6.6
15.9
12
70.6
211.8
211.8
Gymnapistesmarm
oratus
60.5
1184
97.9
14
1.2
54.3
105
99.1
10.9
Platycephalidae
Levipora
inops
30
35.7
46
54.8
67.1
22.0
2100.0
Thysanophryscirronasus
614.6
16
39.0
614.6
13
17.9
150.0
150.0
Teraponidae
Pelatessexlineatus
130
60.2
76
35.2
94.2
10.9
Pelsartia
humeralis
85
83.3
98.8
65.9
22.0
3100.0
Apogonidae
Apogonrueppellii
40.8
434
86.5
61
12.2
32.0
10.3
362
96.8
61.6
51.3
Sillaginidae
Sillagobassensis
14.8
314.3
17
68.7
11.8
15
27.3
39
70.9
Gerreidae
Parequula
melbournensis
68.6
10
14.3
25
35.7
29
37.7
120.0
120.0
360.0
Mullidae
Upeneichthyslineatus
28
26.7
29
27.6
36
34.3
12
11.7
327.3
19.1
654.5
19.1
Labridae
Notolabrusparilus
30
69.8
11
25.6
12.3
11.0
3100.0
Odacidae
Siphonognathusradiatus
68
37.6
94
51.9
11
6.1
87.4
77
28.8
166
62.2
16
6.0
83.0
Odaxacroptilus
104
81.9
12
9.4
75.5
43.9
555.6
222.2
111.1
111.1
Leptoscopidae
Lesueurinaplatycephala
28.3
10
41.7
12
50.0
Clinidae
Cristicepsaustralis
25
37.3
27
40.3
12
17.9
33.2
25
86.2
13.4
13.4
26.9
Pleuronectidae
Ammotretiselongatus
38.8
38.8
20
58.8
817.5
Monacanthidae
Acanthaluteresvittiger
19
5.0
330
86.8
26
6.8
54.1
12
23.1
19
36.5
17
32.7
47.7
Scobinichthysgranulatus
68
18.8
246
68.1
35
9.7
12
9.0
21
23.6
43
48.3
24
27.0
11.1
Brachaluteresjacksonianus
22.8
48
66.7
13
18.1
99.8
626.1
939.1
730.4
14.3
Acanthaluteresspilomelanurus
258
99.2
20.8
111
94.9
54.3
10.9
Ostraciidae
Aracanaaurita
50
66.7
810.7
12
16.0
55.3
133.3
266.7
Tetraodontidae
Torquigener
pleurogramma
11
6.4
16
9.2
106
61.3
40
24.8
Totalcatch
866
3336
589
273
211
1404
509
161
1199

A. griffithii and P. sinuosa formed two discrete groupsto the left of the ordination plot, while those fromP. coriacea and unvegetated areas formed a highlydispersed group to the right of those from A. griffithii
and P. sinuosa (Fig. 4). Samples from A. griffithii andP. sinuosa displayed dispersion values of 0.63 and 0.54,respectively, which were lower than those values forP. coriacea (1.31) and unvegetated areas (1.52). Two-way
Table 2 Large and small trawl: mean squares (and their significance levels) for two-way ANOVAs for the number of species, totaldensities and total biomass of fish in the four habitats Amphibolis griffithii, Posidonia sinuosa, Posidonia coriacea and unvegetated areasbetween autumn 1997 and summer 1998. df degrees of freedom
Variable
df
Main effects Interactions Residual
Habitat (H) Season (S) H·S(3) (3) (9) (48)
Large trawlNumber of species 371.72 (<0.001) 32.89 (0.258) 27.02 (0.355) 23.71Density 3.09 (<0.001) 0.09 (0.291) 0.14 (0.081) 0.07Biomass 2.38 (<0.001) 0.11 (0.220) 0.08 (0.363) 0.07
Small trawlNumber of species 138.87 (<0.001) 25.46 (0.077) 14.11 (0.239) 10.48Density 2.65 (<0.001) 0.11 (0.595) 0.42 (0.023) 0.17Biomass 8.49 (<0.001) 2.18 (0.093) 0.48 (0.865) 0.96
Fig. 3 Large and small beamtrawl: mean (+SE) number ofspecies and density and biomassof fish found in the seagrassesAmphibolis griffithii (Ag),Posidonia sinuosa (Ps) andPosidonia coriacea (Pc) andover adjacent unvegetated areas(U) in the Owen Anchorageregion between autumn 1997and summer 1998
1200

ANOSIM of replicate data for each habitat in eachseason revealed that the species-composition differedamong both habitats and seasons (Table 3). However,the R-statistic was larger for the former factor (0.508versus 0.239). Pair-wise comparisons showed that thespecies-composition of fish in A. griffithii and P. sinu-osa differed from each other and also from those inP. coriacea and unvegetated habitat (Table 3). However,there was no significant difference between these last twohabitats. The results of ordination and ANOSIM ofbiomass data were virtually identical to those usingdensity data (Table 3; Fig. 4).
Using large-trawl density data, the results of SIM-PER showed that Odax acroptilus distinguished the fishfauna of A. griffithii from those of P. sinuosa, P. coriaceaand unvegetated areas (Table 4). Furthermore, Notola-brus parilus and Aracana aurita distinguished the fishfauna of A. griffithii from those of P. coriacea and un-vegetated areas. Gymnapistes marmoratus, Acanthalu-teres vittiger and Diodon nicthemerus distinguished thefauna of P. sinuosa from those in the other three habi-tats. No species were shown by SIMPER to be diag-nostic of P. coriacea or unvegetated areas, which is likelyto reflect the low and highly variable abundances ofspecies found in these two habitats. The results ofSIMPER using large-trawl data on biomass paralleledthose using density data (Table 4), except the ratio val-ues tended to be higher, indicating that those speciesaccounted for more of the dissimilarity between habitatgroups when biomass data were used.
Results of ordination and ANOSIM of data fromsmall-trawl catches parallelled those described above forthe large-trawl catches, with the exception that thesamples from A. griffithii were slightly more dispersed(Table 3; Fig. 4). Using density data, SIMPER showedthat Cochleoceps viridis and Cochleoceps spatula distin-guished the fauna of P. sinuosa from those of A. griffi-thii, P. coriacea and unvegetated areas. Furthermore,S. radiatus distinguished the fauna of A. griffithii andP. sinuosa from those in unvegetated areas. Using bio-mass data, fewer species were clearly diagnostic of par-ticular habitats. Cochleoceps viridis and C. spatuladistinguished the fish fauna in P. sinuosa from those inP. coriacea and unvegetated areas.
Weights of fish in different habitats
The median individual fish weight found in A. griffithiiwas 72.1 g, compared to far lower values of 7.5 g inP. sinuosa and 19.8 g in P. coriacea (Fig. 5). Further-more, the 75 percentile for fish weights was far greater inA. griffithii (125.5 g) than in P. sinuosa and P. coriacea
Fig. 4 Two-dimensional MDS ordination of the mean densitiesand biomass of each species recorded in Amphibolis griffithii (A),Posidonia sinuosa (S) and Posidonia coriacea (C) and over adjacentunvegetated areas (U) in the Owen Anchorage region betweenautumn 1997 and summer 1998
Table 3 Large and small trawl: R-statistic (and significance values) from two-way crossed ANOSIM of the species composition usingdensity and biomass data for habitat and season and pair-wise comparisons of the species composition in Amphibolis griffithii (Ag),Posidonia sinuosa (Ps), Posidonia coriacea (Pc) and unvegetated areas (U)
Large trawl Small trawl
Density Biomass Density Biomass
FactorHabitat 0.508 (P<0.001) 0.500 (P<0.001) 0.554 (P<0.001) 0.377 (P<0.001)Season 0.239 (P<0.001) 0.184 (P<0.001) 0.343 (P<0.001) 0.177 (P<0.001)
Habitat comparisonsAg versus Ps 0.592 (P<0.001) 0.605 (P<0.001) 0.568 (P<0.001) 0.293 (P<0.001)Ag versus Pc 0.802 (P<0.001) 0.755 (P<0.001) 0.799 (P<0.001) 0.720 (P<0.001)Ag versus U 0.560 (P<0.001) 0.552 (P<0.001) 0.332 (P<0.001) 0.314 (P<0.001)Ps versus Pc 0.598 (P<0.001) 0.632 (P<0.001) 0.861 (P<0.001) 0.553 (P<0.001)Ps versus U 0.658 (P<0.001) 0.613 (P<0.001) 0.593 (P<0.001) 0.489 (P<0.001)Pc versus U 0.064 (P=0.272) 0.014 (P=0.544) 0.218 (P=0.018) 0.047 (P=0.287)
1201
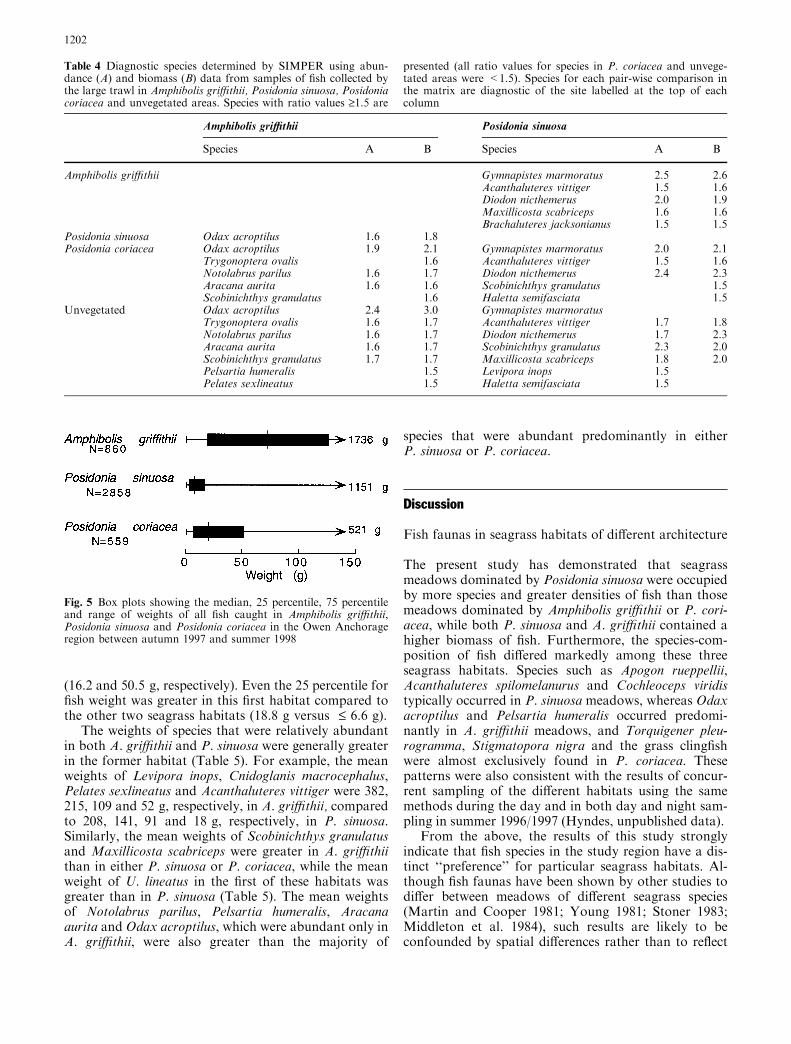
(16.2 and 50.5 g, respectively). Even the 25 percentile forfish weight was greater in this first habitat compared tothe other two seagrass habitats (18.8 g versus £ 6.6 g).
The weights of species that were relatively abundantin both A. griffithii and P. sinuosa were generally greaterin the former habitat (Table 5). For example, the meanweights of Levipora inops, Cnidoglanis macrocephalus,Pelates sexlineatus and Acanthaluteres vittiger were 382,215, 109 and 52 g, respectively, in A. griffithii, comparedto 208, 141, 91 and 18 g, respectively, in P. sinuosa.Similarly, the mean weights of Scobinichthys granulatusand Maxillicosta scabriceps were greater in A. griffithiithan in either P. sinuosa or P. coriacea, while the meanweight of U. lineatus in the first of these habitats wasgreater than in P. sinuosa (Table 5). The mean weightsof Notolabrus parilus, Pelsartia humeralis, Aracanaaurita and Odax acroptilus, which were abundant only inA. griffithii, were also greater than the majority of
species that were abundant predominantly in eitherP. sinuosa or P. coriacea.
Discussion
Fish faunas in seagrass habitats of different architecture
The present study has demonstrated that seagrassmeadows dominated by Posidonia sinuosa were occupiedby more species and greater densities of fish than thosemeadows dominated by Amphibolis griffithii or P. cori-acea, while both P. sinuosa and A. griffithii contained ahigher biomass of fish. Furthermore, the species-com-position of fish differed markedly among these threeseagrass habitats. Species such as Apogon rueppellii,Acanthaluteres spilomelanurus and Cochleoceps viridistypically occurred in P. sinuosa meadows, whereas Odaxacroptilus and Pelsartia humeralis occurred predomi-nantly in A. griffithii meadows, and Torquigener pleu-rogramma, Stigmatopora nigra and the grass clingfishwere almost exclusively found in P. coriacea. Thesepatterns were also consistent with the results of concur-rent sampling of the different habitats using the samemethods during the day and in both day and night sam-pling in summer 1996/1997 (Hyndes, unpublished data).
From the above, the results of this study stronglyindicate that fish species in the study region have a dis-tinct ‘‘preference’’ for particular seagrass habitats. Al-though fish faunas have been shown by other studies todiffer between meadows of different seagrass species(Martin and Cooper 1981; Young 1981; Stoner 1983;Middleton et al. 1984), such results are likely to beconfounded by spatial differences rather than to reflect
Fig. 5 Box plots showing the median, 25 percentile, 75 percentileand range of weights of all fish caught in Amphibolis griffithii,Posidonia sinuosa and Posidonia coriacea in the Owen Anchorageregion between autumn 1997 and summer 1998
Table 4 Diagnostic species determined by SIMPER using abun-dance (A) and biomass (B) data from samples of fish collected bythe large trawl in Amphibolis griffithii, Posidonia sinuosa, Posidoniacoriacea and unvegetated areas. Species with ratio values ‡1.5 are
presented (all ratio values for species in P. coriacea and unvege-tated areas were <1.5). Species for each pair-wise comparison inthe matrix are diagnostic of the site labelled at the top of eachcolumn
Amphibolis griffithii Posidonia sinuosa
Species A B Species A B
Amphibolis griffithii Gymnapistes marmoratus 2.5 2.6Acanthaluteres vittiger 1.5 1.6Diodon nicthemerus 2.0 1.9Maxillicosta scabriceps 1.6 1.6Brachaluteres jacksonianus 1.5 1.5
Posidonia sinuosa Odax acroptilus 1.6 1.8Posidonia coriacea Odax acroptilus 1.9 2.1 Gymnapistes marmoratus 2.0 2.1
Trygonoptera ovalis 1.6 Acanthaluteres vittiger 1.5 1.6Notolabrus parilus 1.6 1.7 Diodon nicthemerus 2.4 2.3Aracana aurita 1.6 1.6 Scobinichthys granulatus 1.5Scobinichthys granulatus 1.6 Haletta semifasciata 1.5
Unvegetated Odax acroptilus 2.4 3.0 Gymnapistes marmoratusTrygonoptera ovalis 1.6 1.7 Acanthaluteres vittiger 1.7 1.8Notolabrus parilus 1.6 1.7 Diodon nicthemerus 1.7 2.3Aracana aurita 1.6 1.7 Scobinichthys granulatus 2.3 2.0Scobinichthys granulatus 1.7 1.7 Maxillicosta scabriceps 1.8 2.0Pelsartia humeralis 1.5 Levipora inops 1.5Pelates sexlineatus 1.5 Haletta semifasciata 1.5
1202

habitat variation in faunal assemblages. For instance,the closer proximity of particular seagrasses to theshoreline in some of those studies is likely to influencethe recruitment patterns of fish into seagrasses, sincemany species undergo an ontogenetic movement fromshallow to deeper waters (e.g. Ruiz et al. 1993; Hyndeset al. 1996, 1999). However, such spatial variation isunlikely to exert a strong influence on the faunal as-semblages among the different seagrass habitats in thepresent study. All habitats were located in relativelyopen marine waters and their distributions overlapped,forming a patchwork of interspersed meadows over alarge spatial scale. Furthermore, samples from eachhabitat type were collected from a broad geographicalarea, which was subject to various levels of wind andwave energy, and presumably sediment type. Thus, eventhough the samples from each habitat type were rela-tively dispersed over a large study area, the speciescomposition of the replicate samples from the samehabitat were more similar to each other than to thosefrom other habitat types. The influence of factors suchas wave energy, which have been shown to influence fishassemblages in surf zone regions (Romer 1990; Clark1997), are unlikely to strongly influence the species-as-semblages among the three seagrass habitats examinedin the present study. The differential distribution of fishin the study region is more likely to reflect habitat type.
Differences in seagrass and meadow structuresamong seagrass species are likely to play a substantialrole, either directly or indirectly, in influencing thecomposition of the fish faunas in the seagrass habitatsexamined in the study region. While A. griffithii andP. sinuosa produce dense leaf canopies that provide 75–100% cover, the canopy of the former species overliesrelatively open spaces amongst the above-ground stems,
whereas the strap-like leaves of P. sinuosa emerge fromthe sediment to form a uniformly dense leaf canopy(Fig. 1; Kuo and McComb 1989; Cambridge 1999). Incomparison, the strap-like leaves of P. coriacea form apatchy landscape of seagrass clumps and bare sand.Variations in the fish faunas among these seagrasshabitats may therefore reflect: (1) differential predationlevels of fish in habitats of different architecture; (2)movement of fish after settlement into favoured habitats;(3) differential recruitment into seagrasses of differentarchitecture; and/or (4) different food availability indifferent seagrass habitats.
Orth and Heck (1980) hypothesised that fish assem-blages are structured primarily by predation, and thatlevel of predation should decrease with increasing sea-grass complexity. This, however, is unlikely to fully ex-plain differences in the fish assemblages in the threeseagrass habitats examined in the present study, sincerelatively few piscivorous fish were consistently caughtusing the large beam trawl (Table 1) and concurrentsampling using a 100-m-long purse seine (unpublisheddata). Furthermore, differences in level of predation areunlikely to explain the complete absence or extremerarity of several species in certain seagrass habitats. Forexample, small juvenile to mature-sized representativesof several relatively small species, such as A. rueppelliiand A. spilomelanurus, were highly abundant in P. sin-uosa, but absent from A. griffithii.
Instead of predation being the primary cause ofchanges in fish assemblages, Bell and Westoby (1986b,1986c) argued that fish recruit into seagrass meadowsirrespective of the structural complexity of seagrass, andafter a period of months, migrate into ‘‘preferred’’ mi-crohabitats within the seagrass meadow to avoid preda-tion. This lack of discrimination by fish for seagrasses of
Table 5 Mean weights (±SE) of abundant fish species in the three seagrass habitats Amphibolis griffithii, Posidonia sinuosa and Posidoniacoriacea. Data are provided when the sample size ‡19 fish. n sample size
Amphibolis griffithii Posidonia sinuosa Posidonia coriacea
Mean SE n Mean SE n Mean SE n
Notolabrus parilus 152.4 (±17.41) 30Pelsartia humeralis 119.0 (±5.30) 85Aracana aurita 63.6 (±7.34) 50Odax acroptilus 47.6 (±3.23) 104Levipora inops 381.8 (±0.96) 30 208.4 (±30.74) 46Cnidoglanis macrocephalus 214.9 (±34.69) 41 141.1 (±29.25) 23Pelates sexlineatus 109.1 (±3.35) 130 90.6 (±2.41) 76Acanthaluteres vittiger 52.0 (±12.29) 19 18.4 (±0.81) 306Siphonognathus radiatus 9.5 (±0.76) 68 9.8 (±2.93) 90Cristiceps australis 8.2 (±2.87) 25 10.4 (±2.04) 27Gymnapistes marmoratus 11.5 (±0.31) 625Acanthaluteres spilomelanurus 4.0 (±0.17) 249Brachaluteres jacksonianus 2.8 (±0.27) 44Stigmatopora argus 1.2 (±0.04) 210Apogon rueppellii 3.5 (±0.12) 397 4.6 (±0.33) 60Torquigener pleurogramma 49.1 (±1.55) 106Ammotretis elongatus 35.4 (±6.95) 20Upeneichthys lineatus 73.5 (±14.76) 28 37.4 (±14.03) 29 73.5 (±7.78) 36Scobinichthys granulatus 76.6 (±12.99) 68 12.1 (±7.62) 228 10.4 (±2.60) 28Maxillicosta scabriceps 23.6 (±1.74) 28 13.8 (±0.50) 155 15.1 (±0.83) 74
1203

varying structural complexity, over large spatial scales,has been supported by a number of other studies (e.g.Bell et al. 1988; Worthington et al. 1992). However, theseconclusions have been based on studies comparingseagrasses with strap-like leaves (e.g. Zostera, Hetero-zostera and Posidonia), whereas the present study hasdemonstrated that fish faunas differ in seagrasses that arewidely divergent in architecture. Thus, seagrass archi-tecture may influence the recruitment of fish into seagrassmeadows. Recruitment of species with limited larval-dispersion mechanisms is likely to be strongly influencedby the habitat preference of the adults. For example,A. rueppellii, a mouth brooder (Neira and Bruce 1998)that is highly abundant in P. sinuosa, would release itssettlement-sized juveniles directly into this habitat.However, species that undergo pelagic larval dispersionalso appeared to settle preferentially into certain seagrasshabitats. For example, small juveniles and mature-sizedA. spilomelanurus were restricted to P. sinuosa meadows.Since the eggs and larvae of monacanthids are pelagic(Aboussouan and Leis 1984), the larvae of this speciesare likely to disperse over a large area. Furthermore,since predation levels are likely to be relatively low (asdiscussed earlier), the presence of large numbers of ju-veniles of this species only in P. sinuosa suggests thatlarvae may discriminate between seagrasses and settleinto these meadows. Additionally, hydrological condi-tions, both within and immediately above the seagrasscanopy, may influence the settlement and retention offish in the different seagrass assemblages. Water move-ment is reduced in the canopy of A. griffithii (van Keulenand Borowitzka 2000). Alternatively, juveniles may movebetween seagrass habitats using the protection of driftingplant material (Virnstein and Curran 1986; Sogard 1989).This is likely to help explain the size-related movement ofthe pipefish Stigmatopora argus between the P. coriaceaand P. sinuosa habitats (Kendrick and Hyndes 2003).
The biomass of epiphytic flora and fauna can differbetween structurally divergent seagrass species (Jernak-off and Nielson 1998; Trautman and Borowitzka 1999),indicating that food availability may differ in seagrassesof varying structural complexity. Differences in theavailability of food, particularly between A. griffithii andP. sinuosa meadows, may explain variations in fish as-semblages between seagrass habitats. Alternatively, thesize and species-composition of fish in seagrass meadowscould be structured primarily by the availability of spaceand by the ability of fish to access food. Smaller fish mayhave a greater ability to penetrate the basal section ofthe leaves of Posidonia species, where their prey occur(Trautman and Borowitzka 1999), while larger fish maybe able to occupy the relatively large, open spaces belowthe canopy of A. griffithii meadows.
Size-structure of fish in seagrass assemblages
Although fish densities differed between A. griffithii andP. sinuosa, the biomass of fish was similar in both these
habitats. This indicates that fewer, but larger, fish oc-cupied A. griffithii, while more, but smaller, fish inhab-ited P. sinuosa. This is further emphasised by the factthat 75% of fish in A. griffithii exceeded �18 g wetweight, whereas 75% of fish in P. sinuosa were less than�16 g. Factors influencing the size-composition of fishin A. griffithii and P. sinuosa also influence the species-composition of fish occupying these two seagrass habi-tats. Larger fish in A. griffithii are typically representedby species such as Notolabrus parilus, Pelsartia humeralisand Odax acroptilus, whereas smaller fish in P. sinuosameadows were represented by species such as Gymnap-istes marmoratus, Acanthaluteres spilomelanurus, Apogonrueppellii and Stigmatopora argus.
As discussed earlier, the presence of relatively largeopen spaces below the canopy of A. griffithii is likely toallow larger fish to occupy this seagrass habitat, andgain access to food on the stems of this seagrass. Incontrast, only small fish are likely to penetrate the densefoliage of P. sinuosa, which may provide refuge frompredation, but also allow fish to gain access to epifaunaassociated with the basal region of the seagrass leaves.
Fish fauna of a patchy seagrass landscape
The species-composition of fish in both A. griffithii andP. sinuosa differed markedly from that in P. coriacea andadjacent unvegetated areas. However, the species com-position of fish did not differ markedly betweenP. coriacea and adjacent bare-sand areas, thereby con-trasting with the situation in other regions and seagrasstypes where fish faunas in these two habitat types areoften distinct (e.g. Orth and Heck 1980; Heck et al. 1989;Connolly 1994). Since P. coriacea comprises a mosaiclandscape of seagrass patches and bare sand, it is notsurprising that the number of species, density and bio-mass of fish were lower in this habitat than in A. griffithiiand P. sinuosa. Furthermore, it is no surprise that the fishfauna in P. coriacea included species commonly associ-ated with bare sand. However, certain species that aretypically associated with vegetation, exhibited an affinityfor either P. coriacea or P. sinuosa. For example, thegrass clingfish and Stigmatopora nigra displayed a dis-tinct preference for P. coriacea, whereas the clingfishspecies Cochleoceps viridis and C. spatula were closelyassociated with P. sinuosa. Such a result suggests thatthose species have a preference for the foliage providedeither by P. coriacea or P. sinuosa. Those fish species thatwere abundant only in P. coriaceamay have a preferencefor narrower leaves (�5 mm versus 8–10 mm) or thelower leaf density provided by this seagrass. Indeed,Stigmatopora nigra appears to display a preference fornarrow seagrass leaves (Kendrick and Hyndes 2003).Such a strong association of certain species with P. co-riaceamay also be related to the patchy occurrence of theseagrass Heterozostera tasmanica, which commonly oc-curs as an understorey in this habitat. The relatively shortand narrow leaves of this seagrass may provide a more
1204

heterogeneous structure to the P. coriacea habitat, andthus influence the species-composition of fish occupyingthis assemblage.
In conclusion, fish assemblages differed markedlyamong three distinct seagrass habitats, which werecharacterised by different plant and meadow architec-ture, in the study region of south-western Australia.Both settlement and post-settlement processes are likelyto explain differences in the fish assemblages, sincesettlement-sized and larger-sized fish representing par-ticular species were present in different seagrass habi-tats. The complete absence of particular species fromone habitat, but high abundance in another, suggeststhat fish species discriminate among seagrass habitatson a broad scale. While such differences may reflectdifferences in oceanographic conditions, the consistencyof the species-composition within a habitat type, de-spite the large spatial separation of the samples and theinterspersed nature of the seagrass habitats, suggeststhat the structural characteristics of each type of sea-grass meadow are likely to influence the fish assem-blages that reside in these habitats. Since large areas ofseagrass are being lost in coastal regions around theworld through natural and human causes, managers ofcoastal regions need to recognise that seagrass mead-ows comprising different structural characteristics canplay different ecological roles. Thus, management de-cisions regarding potential seagrass loss or revegetationprogrammes need a clear understanding of the eco-logical function of each habitat type.
Acknowledgements We thank S. Letch and crew members of Fre-mantle TAFE’s ‘‘Maritime Image’’ and the numerous people whohelped in the field. We are also grateful to S. Ayvazian and G.Kendrick and two anonymous referees for their constructive criti-cisms of the manuscript. Valuable discussions were provided by A.Brearley, M. Cambridge, G. Kendrick, P. Lavery, I. Potter and D.Walker, and statistical advice was provided by R. Clarke. Thisstudy was funded by Cockburn Cement Limited.
References
Aboussouan A, Leis JM (1984) Balistoidei: development. In: MoserHG, Richards WJ, Cohen DM, Fahay MP, Kendall AW,Richardson SL (eds) Ontogeny and systematics of fishes.American Society of Ichthyologists and Herpetologists. SpecialPublication 1, pp 450–459
Anderson TW (1994) Role of macroalgal structure in the distri-bution and abundance of a temperate reef fish. Mar Ecol ProgSer 113:279–290
Bell JD, Westoby M (1986a) Importance of local changes in leafheight and density to fish and decapods associated with seag-rasses. J Exp Mar Biol Ecol 104:249–274
Bell JD, Westoby M (1986b) Variation in seagrass height anddensity over a wide spatial scale: effects on common fish anddecapods. J Exp Mar Biol Ecol 104:275–295
Bell JD, Westoby M (1986c) Abundance of macrofauna in denseseagrass is due to habitat preference, not predation. Oecologia68:205–209
Bell JD, Westoby M, Steffe AS (1987) Fish larvae settling in sea-grass: do they discriminate between beds of different leaf den-sity? J Exp Mar Biol Ecol 111:133–144
Bell JD, Steffe AS, Westoby M (1988) Location of seagrass beds inestuaries: effects on associated fish and decapods. J Exp MarBiol Ecol 122:127–146
Cambridge ML (1999) Growth strategies of Rottnest Island seag-rasses. In: Walker DI, Wells FE (eds) The seagrass flora andfauna of Rottnest Island, Western Australia. Western Austra-lian Museum, Perth, pp 1–24
Carr MH (1994) Effects of macroalgal dynamics on the recruitmentof temperate reef fish. Ecology 75:1320–1333
Clark BM (1997) Variation in surf-zone fish community structureacross a wave-exposure gradient. Estuar Coast Shelf Sci 44:659–674
Clarke KR (1993) Non-parametric multivariate analyses ofchanges in community structure. Aust J Ecol 18:117–143
Clarke KR, Warwick RM (1994) Change in marine communities:an approach to statistical analysis and interpretations. Plym-outh Marine Laboratory, Plymouth
Connolly RM (1994) A comparison of fish assemblages from sea-grass and unvegetated areas of a southern Australian estuary.Aust J Mar Freshw Res 45:1033–1044
Field JG, Clarke KR, Warwick RM (1982) A practical strategy foranalysing multispecies distribution patterns. Mar Ecol Prog Ser8:37–52
Gomon MF, Glover JCM, Kuiter RH (1994) The fish of Austra-lia’s south coast. State Print, Adelaide
Heck KL Jr, Orth RJ (1980) Seagrass habitats: the roles of habitatcomplexity, competition and predation in structuring associatedfish and mobile macroinvertebrate assemblages. In: KennedyVS (ed) Estuarine perspectives. Academic Press, New York, pp449–462
Heck KL, Able KW, Fahay MP, Roman CT (1989) Fishes anddecapod crustaceans of Cape Cod eelgrass meadows: speciescomposition, seasonal abundance patterns and comparisonwith unvegetated substrates. Estuaries 12:59–65
Hyndes GA (2000) Do fish communities differ among seagrassassemblages? Soc Ital Biol Mar 7:227–230
Hyndes GA, Potter IC, Lenanton RCJ (1996) Habitat partitioningby whiting species (Sillaginidae) in coastal waters. Env Biol Fish45:21–40
Hyndes GA, Platell ME, Potter IC, Lenanton RCJ (1999) Does thecomposition of the demersal fish assemblages in temperatecoastal waters change with depth and undergo consistent sea-sonal changes? Mar Biol 134:335–352
Jenkins GP, Sutherland CR (1997) The influence of habitat struc-ture on nearshore fish assemblages in a southern Australianembayment: colonisation and turnover rate of fishes associatedwith artificial macrophyte beds of varying physical structure.J Exp Mar Biol Ecol 218:103–125
Jernakoff P, Nielson J (1998) Plant–animal associations in twospecies of seagrasses in Western Australia. Aquat Bot 60:359–376
Kendrick AJ, Hyndes GA (2003) Patterns in the abundance andsize distribution of syngnathid fishes among habitats in a sea-grass-dominated marine environment. Estuar Coast Shelf Sci,in press
Kendrick GA, Eckersley J, Walker DI (1999) Landscape-scalechanges in seagrass distribution over time: a case study fromSuccess Bank, Western Australia. Aquat Bot 65:293–309
Keulen M van, Borowitzka MA (2000) Comparison of water ve-locity profiles through morphologically dissimilar seagrasses.Biol Mar Medit 7:143–146
Kuo J, Cambridge ML (1989) A taxonomic study of the Posidoniaostenfeldii complex (Posidoniaceae) with description of fournew Australian species. Aquat Bot 20:267–295
Kuo J, McComb AJ (1989) Seagrass taxonomy, structure and de-velopment. In: Larkum AWD, McComb AJ, Shepherd SA (eds)Biology of seagrasses: a treatise on the biology of seagrasseswith special reference to the Australian region. Elsevier, Am-sterdam
Levin PS, Hay ME (1996) Responses of temperate reef fishes toalterations in algal structure and species composition. Mar EcolProg Ser 134:37–47
1205
MacArthur LD, Hyndes GA (2001) Differential use of seagrassassemblages by a suite of odacid species. Estuar Coast Shelf Sci52:79–90
Martin FD, Cooper M (1981) A comparison of fish faunas found intwo tropical Atlantic seagrasses, Thalassia festudinum and Sy-ringodium filiforme. Northeast Gulf Sci 5:31–37
Middleton MJ, Bell JD, Burchmore JJ, Pollard DA, Pease BC(1984) Structural differences in the fish communities of Zosteracapricorni and Posidonia australis seagrass meadows in BotanyBay, New South Wales. Aquat Bot 18:89–109
Neira FJ, Bruce BD (1998) Apogonidae: cardinalfishes. In: NeiraFJ, Miskiewicz AG, Trnski T (eds) Larvae of temperate Aus-tralian fishes. Laboratory guide for larval fish identification.University of Western Australian Press, Perth, pp 174–179
Orth RJ, Heck KL (1980) Structural components of the eelgrass(Zostera marina) meadows in the lower ChesapeakeBay—fishes. Estuaries 3:278–288
Orth RJ, Heck KL, Montfrans J van (1984) Faunal communities inseagrass beds: a review of the influence of plant structure andprey characteristics on predator–prey interactions. Estuaries7:339–350
Romer GS (1990) Surf zone fish community and species response toa wave energy gradient. J Fish Biol 36:279–287
Rotherham D, West RJ (2002) Do different seagrass species sup-port distinct fish communities in south-eastern Australia? FishMar Ecol 9:235–248
Ruiz GM, Hines AH, Posey MH (1993) Shallow water as a refugehabitat for fish and crustaceans in non-vegetated estuaries: anexample from Chesapeake Bay. Mar Ecol Prog Ser 99:1–16
Sogard SM (1989) Colonization of artificial seagrass by fishes anddecapod crustaceans: importance of proximity to natural eel-grass. J Exp Mar Biol Ecol 133:15–37
Somerfield PJ, Clarke KR (1997) A comparison of some methodscommonly used for the collection of sublittoral sediments andtheir associated fauna. Mar Environ Res 43:145–156
Stoner AW (1983) Distribution of fishes in seagrass meadows: roleof macrophyte biomass and species composition. Fish Bull US81:837–846
Trautman DA, Borowitzka MA (1999) Distribution of the epiph-ytic organisms on Posidonia australis and P. sinuosa, twoseagrasses with differing leaf morphology. Mar Ecol Prog Ser179:215–229
Underwood AJ (1981) Techniques of analysis of variance in ex-perimental marine biology and ecology. Oceanogr Mar BiolAnnu Rev 19:513–605
Virnstein RW, Curran MC (1986) Colonization of artificial sea-grass versus time and distance from source. Mar Ecol Prog Ser69:1352–1366
Worthington DG, Ferrell DJ, McNeill SE, Bell JD (1992) Effects ofshoot density of seagrass on fish and decapods: are correlationsevident over larger spatial scales? Mar Biol 112:139–146
Young PC (1981) Temporal changes in the vagile epibenthic faunaof two seagrass meadows (Zostera capricorni and Posidoniaaustralis). Mar Ecol Prog Ser 5:91–102
1206
Copyright © 2022 FDOKUMEN