Amphoteric Surfactants for PAH and Lead Polluted-Soil Treatment Using Flotation
Upload
independentCategory
view
0download
0
Environment International 64 (2014) 48–55
Contents lists available at ScienceDirect
Environment International
j ourna l homepage: www.e lsev ie r .com/ locate /env int
Differences in spatiotemporal variations of atmosphericPAH levels between North America and Europe: Data from twoair monitoring projects
Liang-Ying Liu a, Petr Kukučka b, Marta Venier a, Amina Salamova a, Jana Klánová b, Ronald A. Hites a,⁎a School of Public and Environmental Affairs, Indiana University, Bloomington, IN 47405, United Statesb Research Centre for Toxic Compounds in the Environment (RECETOX), Masaryk University Brno, Kamenice 5, 625 00 Brno, Czech Republic
⁎ Corresponding author.E-mail address: [email protected] (R.A. Hites).
0160-4120/$ – see front matter © 2013 Elsevier Ltd. All rihttp://dx.doi.org/10.1016/j.envint.2013.11.008
a b s t r a c t
a r t i c l e i n f oArticle history:Received 26 August 2013Accepted 10 November 2013Available online xxxx
Keywords:Polycyclic aromatic hydrocarbonsSpatial distributionsSeasonal trendsNorth AmericaEurope
Atmospheric concentrations of high molecular weight polycyclic aromatic hydrocarbons (PAHs) were measuredat five sites for almost two decades near the North American Great Lakes, as part of the Integrated AtmosphericDeposition Network (IADN), and at three remote sites around Europe, as part of the European Monitoring andEvaluation Programme (EMEP). The primary objectives were to reveal the spatial distributions, long-term tem-poral trends, and seasonal variations of atmospheric PAH concentrations and to investigate potential differencesbetween these two regions. Atmospheric PAH concentrations at the urban sites in Chicago and Cleveland nearGreat Lakes were about 20 times (depending on PAH congener and sampling site) greater than those at therural sites except for Košetice in the Czech Republic. Atmospheric PAH concentrations at Košetice, also a ruralsite, were about one-third of those at Chicago and Cleveland, but 10 times higher than those at other ruralsites (Sturgeon Point, Sleeping Bear Dunes, Eagle Harbor, Aspvreten, and Spitsbergen). Significant long-termdecreasing trends of all these PAH atmospheric concentrations were observed at Chicago and Cleveland. Forthe other sites, either less significant or no long-term decreasing trends were observed. Clear seasonality wasobserved at Sturgeon Point, Sleeping Bear Dunes, Košetice, and Spitsbergen,with the highest PAH concentrationsobserved in mid-January.
© 2013 Elsevier Ltd. All rights reserved.
1. Introduction
Polycyclic aromatic hydrocarbons (PAHs) are produced by thecombustion of fossil fuels and biomass (Lima et al., 2005; Ravindraet al., 2008). Sixteen PAHs have been identified as priority pollutantsbecause of their potential toxic, carcinogenic, ormutagenic characteristics(U.S. EPA, 2005). PAHs are globally distributed in various environmentalmedia, including sediment (Liu et al., 2012; Qiao et al., 2006), soil(Chrysikou et al., 2008; Tang et al., 2005), air (Delgado-Saborit et al.,2011; Vera Castellano et al., 2003), and biota (Chrysikou et al., 2008). Inparticular, atmospheric PAHs have garnered worldwide attentionbecause of their potential adverse effects on public health (Kim et al.,2013; Le et al., 2012).
To reduce atmospheric PAH concentrations, efforts have beenmade to lower PAH emissions by implementing laws and regulations,by improving combustion technologies, and by employing cleaner fuelsources, such as natural gas (Krystyna et al., 2007). To obtain cleanerair on a national scale, the United States passed the Clean Air Act in1970 (U.S. EPA, 2013). In 1979, 34 governments and the EuropeanCommunity signed the Convention on Long-range Trans-boundary Air
ghts reserved.
Pollution (CLRTAP), aiming at protecting the environment (UnitedNations Economic Commission for Europe (UNECE), 2013). Thisconvention entered into force in 1983. It has been extended by eightprotocols, and it now has 51 parties, who endeavor to limit and, as faras possible, reduce and prevent air pollution.
The effectiveness of PAH emission control measures can be trackedby sedimentary records (Heim and Schwarzbauer, 2013) or assessedby long-term measurements of atmospheric PAH concentrations(Meijer et al., 2008). Long-term air monitoring programs are essentialto understand the temporal trends of atmospheric PAH concentrationsand to assess the effect of legislation and source abatement measures.Internationally, there are several airmonitoring projects, including the In-tegrated Atmospheric DepositionNetwork (IADN) (Environment Canada,2010), the European Monitoring and Evaluation Programme (EMEP)(EMEP, 2013), the Toxic Organic Micro Pollutants Network (TOMP)(Meijer et al., 2008), the Arctic Monitoring and Assessment Programme(AMAP) (Hung et al., 2010), and others (Klánová and Harner, 2013).
The Integrated Atmospheric Deposition Network is a joint projectoperated by the United States and Canada. It was established in 1990to measure PAH and other persistent organic pollutant concentrationsin air and in precipitation around theGreat Lakes and to study the atmo-spheric input of toxic organic compounds to the Great Lakes (Buehlerand Hites, 2002). The EuropeanMonitoring and Evaluation Programme(EMEP, 2013), a scientifically based and policy driven program under
49L.-Y. Liu et al. / Environment International 64 (2014) 48–55
the CLRTAP, focuses on assessing the trans-boundary transport of airpollutants, including persistent organic pollutants, and regularly providesgovernments and subsidiary bodies with scientific information.
These long-term analyses of atmospheric PAH concentrations havesuggested that their concentrations are declining over time (Holoubeket al., 2007a; Meijer et al., 2008; Sun et al., 2006a, 2006b). For example,atmospheric PAH concentrations analyzed at six TOMP sites during thetime period 1991 to 2005 were found to have decreased (Meijer et al.,2008). Gas and particulate phase PAH concentrations around theGreat Lakes also seem to be declining over time (Cortes et al., 2000;Sun et al., 2006b; Venier and Hites, 2010b). These existing studieshave focused on a specific region, such as the United Kingdom (Meijeret al., 2008), the Czech Republic (Holoubek et al., 2007a, 2007b), theNorth American Great Lakes (Cortes et al., 2000; Sun et al., 2006a,2006b; Venier and Hites, 2010b), Germany (Schauer et al., 2003), andJapan (Kitazawa et al., 2006). Unfortunately, no study has investigatedthe potential differences of atmospheric PAH concentrations amongdifferent regions.
Because North America and Europe have different fuel use patterns,regulations and laws, population densities, and climate, the PAH levelsmay well be different in the two regions. We can assess these differ-ences using PAH data from two long-term air monitoring projects:IADN (Environment Canada, 2010) and EMEP (EMEP, 2013). Both ofthese monitoring efforts include 8–17 years of quality controlled data,and this long time baseline allows us to investigate, in detail, the spatialand temporal variations of atmospheric PAH concentrations betweenNorth America and Europe. Thus, the objectives of this study are todetermine the spatial distributions, temporal trends, and seasonal vari-ations of atmospheric PAH levels in selected regions of North Americaand Europe; to investigate the differences in the levels between NorthAmerica and Europe; and to assess the possible reasons for regionaldifferences, if any.
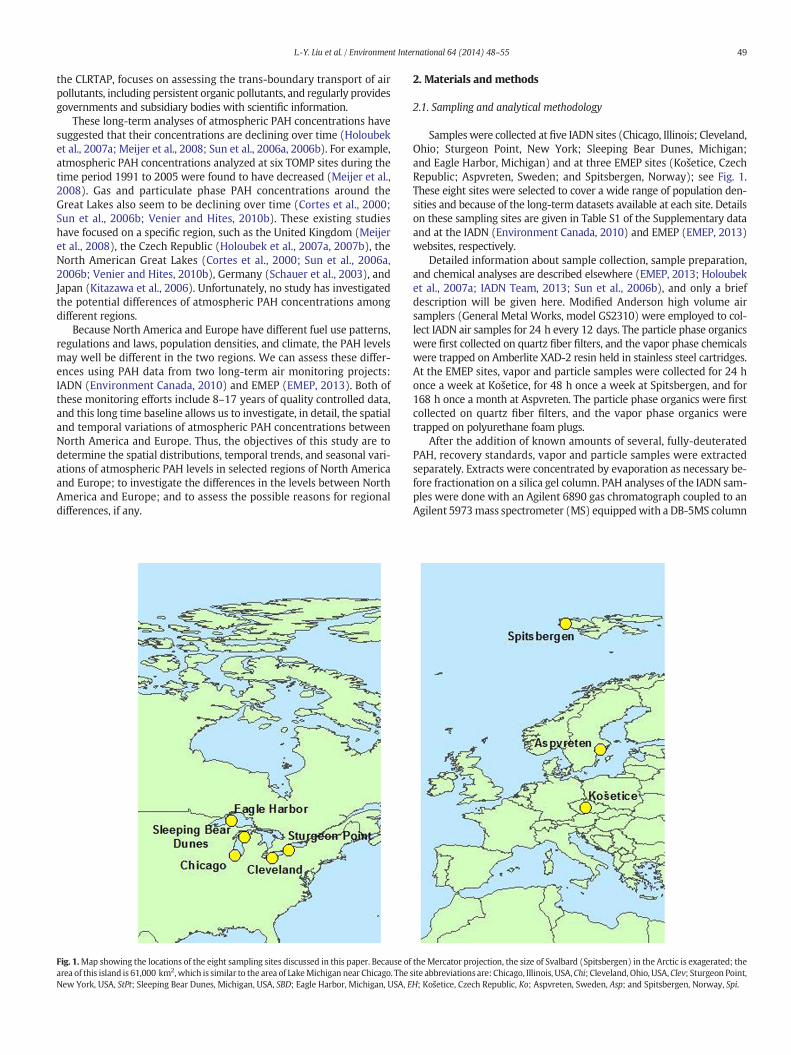
Fig. 1.Map showing the locations of the eight sampling sites discussed in this paper. Because ofarea of this island is 61,000 km2,which is similar to the area of LakeMichigan near Chicago. TheNew York, USA, StPt; Sleeping Bear Dunes, Michigan, USA, SBD; Eagle Harbor, Michigan, USA, E
2. Materials and methods
2.1. Sampling and analytical methodology
Sampleswere collected at five IADN sites (Chicago, Illinois; Cleveland,Ohio; Sturgeon Point, New York; Sleeping Bear Dunes, Michigan;and Eagle Harbor, Michigan) and at three EMEP sites (Košetice, CzechRepublic; Aspvreten, Sweden; and Spitsbergen, Norway); see Fig. 1.These eight sites were selected to cover a wide range of population den-sities and because of the long-term datasets available at each site. Detailson these sampling sites are given in Table S1 of the Supplementary dataand at the IADN (Environment Canada, 2010) and EMEP (EMEP, 2013)websites, respectively.
Detailed information about sample collection, sample preparation,and chemical analyses are described elsewhere (EMEP, 2013; Holoubeket al., 2007a; IADN Team, 2013; Sun et al., 2006b), and only a briefdescription will be given here. Modified Anderson high volume airsamplers (General Metal Works, model GS2310) were employed to col-lect IADN air samples for 24 h every 12 days. The particle phase organicswere first collected on quartz fiber filters, and the vapor phase chemicalswere trapped on Amberlite XAD-2 resin held in stainless steel cartridges.At the EMEP sites, vapor and particle samples were collected for 24 honce a week at Košetice, for 48 h once a week at Spitsbergen, and for168 h once a month at Aspvreten. The particle phase organics were firstcollected on quartz fiber filters, and the vapor phase organics weretrapped on polyurethane foam plugs.
After the addition of known amounts of several, fully-deuteratedPAH, recovery standards, vapor and particle samples were extractedseparately. Extracts were concentrated by evaporation as necessary be-fore fractionation on a silica gel column. PAH analyses of the IADN sam-ples were done with an Agilent 6890 gas chromatograph coupled to anAgilent 5973mass spectrometer (MS) equippedwith a DB-5MS column
theMercator projection, the size of Svalbard (Spitsbergen) in the Arctic is exagerated; thesite abbreviations are: Chicago, Illinois, USA,Chi; Cleveland,Ohio, USA,Clev; Sturgeon Point,H; Košetice, Czech Republic, Ko; Aspvreten, Sweden, Asp; and Spitsbergen, Norway, Spi.

50 L.-Y. Liu et al. / Environment International 64 (2014) 48–55
(J &W Scientific). The European samples were analyzed using gas chro-matographic mass spectrometry with HP 6890, HP 5972, and HP 5973instruments fitted with DB-5MS columns (J&W Scientific). In all cases,quantitation of PAHs used the internal standard method.
2.2. Quality control and quality assurance
Although there are inter-laboratory differences in sampling mediaand analytical methods, strict QA/QCmeasures have insured the qualityof PAH results for both projects. The details of the QA/QC plans are pub-lished in the IADN Quality Assurance Program Plan, the IADN QualityControl Project Plan (Environment Canada and USEPA, 2011; IADNTeam, 2013), EMEP/CCC reports (Aas and Breivik, 2012; EMEP, 2013),and in published papers (Holoubek et al., 2007a; Venier and Hites,2010b). In 2010, both laboratories participated in an inter-laboratorystudy for POP analysis organized by EMEP (Martin et al., 2012). Thisstudy included both the analysis of an air sample as well as twopure standards (analyzed in triplicate). We estimate the intra- andinter-laboratory variability is b20%. Differences in sample collectionand analysis procedures between IADN and EMEP would not affectthe comparison of acquired data.
2.3. Data analysis
Concentrations (in pg/m3) of the following high molecularweight PAH were measured at the five IADN sites and three EMEPsites: benz[a]anthracene (BaA), chrysene (Chry), benzo[a]pyrene(BaP), benzo[e]pyrene (BeP), benzo[k]fluoranthene (BkF), benzo[b]fluoranthene (BbF), indeno[1,2,3-cd]pyrene (I123P), benzo[ghi]perylene (BgP), and coronene (Cor). Concentrations in the vaporphasewere always verymuch lower than in the particle phase; neverthe-less, these two concentrations were summed before analysis of theirspatial and temporal variations.
PAH temporal trend analysis followed the approach previouslydescribed by Venier and Hites (2010b), and only a brief description isgiven here. The concentration data were transformed to their naturallogarithms, and these data were fitted using a harmonic regressionequation:
ln Cð Þ ¼ a0 þ a1 sin ztð Þ þ a2 cos ztð Þ þ a3t ð1Þ
where C is the concentration (gas + particulate, pg/m3), t is timeexpressed in Julian days starting from 1 January 1990, z is 2π/365.25(which fixes the periodicity at one year), a0 is an intercept that rectifiesthe units, a1 and a2 are harmonic coefficients that describe the seasonalvariations of the concentrations with time, and a3 is a first-order rateconstant (in days−1). Sigma Plot 11.0 was used to solve these multiplelinear regressions, and the coefficients, their errors, and the sum-of-squares associated with each term were tabulated. The first derivativeof Eq. (1) was calculated and set equal to zero to derive the datescorresponding to the maximum concentrations:
d ln Cð Þdt
¼ a1z cos ztmaxð Þ−a2z sin ztmaxð Þ þ a3 ¼ 0: ð2Þ
See the Supporting information of Venier and Hites (2010b) for thealgebraic details on solving this equation for tmax. The error associatedwith tmax was calculated from an error propagation using the errorsfor a1, a2, and a3 given by the regression. Halving times (in years)were calculated from the time coefficient
t1=2 ¼ − ln 2ð Þa3
� �1
365:25
� �: ð3Þ
3. Results and discussion
3.1. Spatial distributions of PAH concentrations
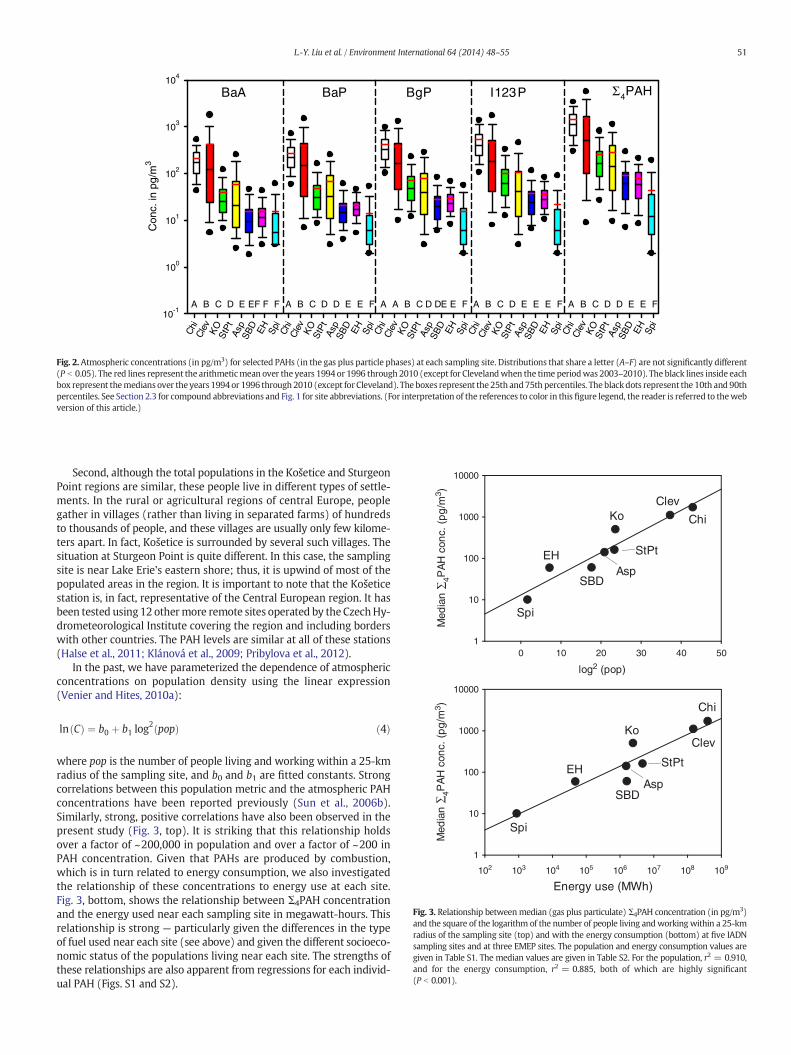
The distribution of selected PAH concentrations at each site is shownin Fig. 2, and the average andmedian concentrations of all PAHs at eachsite are given in Table S2. We define here Σ4PAH as the summed con-centrations of BaA, BaP, I123P, and BgP in the vapor plus particlephases. These four PAHs were selected because they weremeasured in all of the samples from all of the sites. Their concentra-tions (average ± standard error, median) at Chicago (2400 ± 1220,1700 pg/m3), Cleveland (1400 ± 74, 1100 pg/m3), and Košetice(1500 ± 130, 500 pg/m3) were significantly greater than those atAspvreten (290 ± 30, 140 pg/m3), Sturgeon Point (240 ± 13,160 pg/m3), Sleeping Bear Dunes (90 ± 8, 60 pg/m3), Eagle Harbor(76 ± 4, 59 pg/m3), and Spitsbergen (33 ± 5, 10 pg/m3). In general,the concentrations of each compound and of Σ4PAH at the two UnitedStates urban sites (Chicago and Cleveland) were higher than those at theother sites (Fig. 2 and Table S2), and this is confirmed by the ANOVAwhich is shown in Fig. 2. Specifically, atmospheric PAH concentrationsat Chicago and Cleveland were 5–170 (average 20) times greaterthan those at Aspvreten, Sturgeon Point, Sleeping Bear Dunes, EagleHarbor, and Spitsbergen, depending on the specific PAH and on thesampling site. Atmospheric PAH concentrations at Košetice were lowerthan those at Cleveland and Chicago, but 2–50 (average 10) times higherthan those at Sturgeon Point, Sleeping Bear Dunes, Eagle Harbor,Aspvreten, and Spitsbergen. Generally, the spatial distribution ofthe PAH concentrations followed the trend: Chicago N Cleveland N
Košetice N Aspvreten ≈ Sturgeon Point N Sleeping Bear Dunes ≈Eagle Harbor N Spitsbergen.
Urban areas are generally characterized by higher levels of atmo-spheric PAHs than rural sites (Liu et al., 2008; Prevedouros et al.,2004). For example, a previous study in which selected PAH concentra-tions were compiled from urban, rural, and remote sites in the UnitedKingdom, Sweden, Finland, and the Canadian Arctic suggested thatatmospheric PAH concentrations in the United Kingdom were 10–100times higher than those in rural Europe and up to 1000 times higherthan those in the Canadian Arctic (Prevedouros et al., 2004). Therefore,we expected to find relatively high PAH concentrations in the cities ofChicago and Cleveland, but it was unexpected that the atmosphericPAH concentrations at Košetice would be about 3 times higher than atSturgeon Point even though the population at the two locations isabout the same (70,000 people). Atmospheric levels of other persistentorganic pollutants at Košetice have also been reported to be significantlyhigher than those at other EMEP stations (Holoubek et al., 2007a). Thelow atmospheric PAH concentrations at Eagle Harbor and SleepingBear Dunes were also observed in previous studies and were suggestedto represent background levels around theGreat Lakes (Sun et al., 2006b).The lowest atmospheric PAH concentrations at Spitsbergen are ex-pected given that this site is located in anundisturbedArctic environment(EMEP, 2013).
Why are the PAH levels at Košetice so much higher than at SturgeonPoint? There are two possibilities:
First, the types of fuel used near these two sites are different. Naturalgas and petroleum are the primary fuels used in the Sturgeon Pointregion, but coal and wood are the primary fuels used in the CzechRepublic. The combustion of natural gas and petroleum tends toproduce lower levels of PAH per unit of energy than the combustionof coal or wood (Ravindra et al., 2008). This is a major factor: In theUnited States, solid fuels account for b30% of total energy consump-tion, but in the Czech Republic, solid fuels account for N85% of totalenergy consumption (United Nations Statistics Division, 2012).Solid fuels dominate in the Czech Republic because natural gas pricesare relatively high, and thus, around Košetice wood and coal consti-tute 92% of the total energy consumption for space heating (Dvorskáet al., 2012).
Chi
Cle
vK
OS
tPt
Asp
SBD EH Spi
Con
c. in
pg/
m3
10-1
100
101
102
103
104
A B C D E EF F F A B C D D E E F A A B C D DE E F A B C D E E E F A B C D D E E F
BaA BaP BgP I123P Σ4PAH
Chi
Cle
vK
OS
tPt
Asp
SBD EH Spi
Chi
Cle
vK
OS
tPt
Asp
SBD EH Spi
Chi
Cle
vK
OS
tPt
Asp
SBD EH Spi
Chi
Cle
vK
OS
tPt
Asp
SBD EH Spi
Fig. 2.Atmospheric concentrations (in pg/m3) for selected PAHs (in the gas plus particle phases) at each sampling site. Distributions that share a letter (A–F) are not significantly different(P b 0.05). The red lines represent the arithmeticmean over the years 1994 or 1996 through 2010 (except for Clevelandwhen the time periodwas 2003–2010). The black lines inside eachbox represent themedians over the years 1994or 1996 through 2010 (except for Cleveland). The boxes represent the 25th and75th percentiles. The blackdots represent the 10th and90thpercentiles. See Section 2.3 for compound abbreviations and Fig. 1 for site abbreviations. (For interpretation of the references to color in this figure legend, the reader is referred to thewebversion of this article.)
Spi
log2 (pop)
0 10 20 30 40 50
Med
ian
∑4P
AH
con
c. (
pg
/m3 )
Med
ian
∑4P
AH
con
c. (
pg
/m3 )
1
10
100
1000
10000
StPt
Ko
EH
Clev
Chi
SBDAsp
Spi
Energy use (MWh)102 103 104 105 106 107 108 109
1
10
100
1000
10000
StPt
Ko
EH
Clev
Chi
SBDAsp
Fig. 3. Relationship betweenmedian (gas plus particulate) Σ4PAH concentration (in pg/m3)and the square of the logarithm of the number of people living andworkingwithin a 25-kmradius of the sampling site (top) and with the energy consumption (bottom) at five IADNsampling sites and at three EMEP sites. The population and energy consumption values aregiven in Table S1. The median values are given in Table S2. For the population, r2 = 0.910,and for the energy consumption, r2 = 0.885, both of which are highly significant(P b 0.001).
51L.-Y. Liu et al. / Environment International 64 (2014) 48–55
Second, although the total populations in the Košetice and SturgeonPoint regions are similar, these people live in different types of settle-ments. In the rural or agricultural regions of central Europe, peoplegather in villages (rather than living in separated farms) of hundredsto thousands of people, and these villages are usually only few kilome-ters apart. In fact, Košetice is surrounded by several such villages. Thesituation at Sturgeon Point is quite different. In this case, the samplingsite is near Lake Erie's eastern shore; thus, it is upwind of most of thepopulated areas in the region. It is important to note that the Košeticestation is, in fact, representative of the Central European region. It hasbeen tested using 12 othermore remote sites operated by the CzechHy-drometeorological Institute covering the region and including borderswith other countries. The PAH levels are similar at all of these stations(Halse et al., 2011; Klánová et al., 2009; Pribylova et al., 2012).
In the past, we have parameterized the dependence of atmosphericconcentrations on population density using the linear expression(Venier and Hites, 2010a):
ln Cð Þ ¼ b0 þ b1 log2 popð Þ ð4Þ
where pop is the number of people living and working within a 25-kmradius of the sampling site, and b0 and b1 are fitted constants. Strongcorrelations between this population metric and the atmospheric PAHconcentrations have been reported previously (Sun et al., 2006b).Similarly, strong, positive correlations have also been observed in thepresent study (Fig. 3, top). It is striking that this relationship holdsover a factor of ~200,000 in population and over a factor of ~200 inPAH concentration. Given that PAHs are produced by combustion,which is in turn related to energy consumption, we also investigatedthe relationship of these concentrations to energy use at each site.Fig. 3, bottom, shows the relationship between Σ4PAH concentrationand the energy used near each sampling site in megawatt-hours. Thisrelationship is strong — particularly given the differences in the typeof fuel used near each site (see above) and given the different socioeco-nomic status of the populations living near each site. The strengths ofthese relationships are also apparent from regressions for each individ-ual PAH (Figs. S1 and S2).

SleepingBear Dunes0
369
Eagle Harbor
0
3
6
9
Chicago3
6
9
12
Cleveland3
6
9
12
SturgeonPoint
0
3
6
9
ln(c
onc
PA
H)
Kosetice036912
Spitsbergen
19931994
19951996
19971998
19992000
20012002
20032004
20052006
20072008
20092010
20112012
0369
Aspvreten0
3
6
9
Fig. 4. Regressions using Eq. (1) showing the data as the natural logarithms of the Σ4PAHconcentrations in pg/m3 vs. the date on which the sample was collected. The fitted equa-tions are shown in red; all regression parameters are given in Table S3. All regressions aresignificant at P b 0.001. (For interpretation of the references to color in this figure legend,the reader is referred to the web version of this article.)
52 L.-Y. Liu et al. / Environment International 64 (2014) 48–55
3.2. Temporal trends
Fig. 4 shows the Σ4PAH concentrations at each site for each sampleand the regression fitted using Eq. (1). It is clear that this harmonic ex-pression is a good fit for these data, that the amplitude of the peak-to-peak seasonality is greater for the European data than for the UnitedStates data, that some of these concentrations are decreasing signifi-cantly over time, and that the absolute values of the concentrations
Chi Clev StPt Ko
Hal
ving
tim
es (
year
s)
0
10
20
30
40
50BaABaPBkFBePChryCorI123PBgPBbFΣ4PAH
A AB BC C
Fig. 5.Halving times of atmospheric PAH concentrations (vapor plus particle phases) at five siterrors. If no bar is given, the regression of the a3 term in Eq. (1)was not significant at P b 0.05. Dinterpretation of the references to color in this figure legend, the reader is referred to the web
vary significantly from place to place. From the fitted values of thetime term, a3, halving times for each PAH at each sampling site werecalculated, and if these values were statistically significant, they aregiven in Fig. 5 and Table S3. It is encouraging that most of these concen-trations are decreasing and that they are decreasingmost rapidlywheretheir concentrations are the highest — in the cities. The atmosphericPAH concentrations in Chicago and Cleveland are significantly decreas-ing with halving-times of 6.1 ± 0.8 and 8.5 ± 2.4 years, respectively.This is the first study that reports a 15-year long-term decreasingtrend of atmospheric PAH concentrations at Chicago. The halvingtimes of atmospheric PAH concentrations at Chicago reported hereover this longer period (1996–2010)were similar to those reported pre-viously for the relatively shorter period (1997–2003): 3–10 years in thegas phase and 5–15 years in the particle phase (Sun et al., 2006b). Theatmospheric PAH concentration halving times at Chicago and Clevelandwere similar to those measured at six sampling sites around the UnitedKingdom (Meijer et al., 2008).
Temporal trends of atmospheric PAH concentrations at SturgeonPoint, Sleeping Bear Dunes, and Eagle Harbor over the periods 1991–1997 and 1997–2003 have been reported (Cortes et al., 2000; Sunet al., 2006b). Possibly due to the approach of a nonzero steady state(Schneider et al., 2001; Sun et al., 2006b), the average halving times(N16 years) (Sun et al., 2006b) of gas-phase PAH concentrations atthese three sites over the later period (1997–2003) were much slowerthan those during the earlier period (2.2–9.3 years, 1991–1997)(Cortes et al., 2000). For the time series reported in this study (1996–2010), atmospheric PAH concentrations at Sleeping Bear Dunes andEagleHarbor did not change significantlywith time, but those at SturgeonPoint decreased significantly at a relatively slow rate (13 ± 5 years). Insummary, atmospheric PAH concentrations at the urban and suburbansites (Chicago, Cleveland, Sturgeon Point) around the Great Lakesdecreased significantly, while those at remote background sites (SleepingBear Dunes and Eagle Harbor) did not. This observation is similar tofindings in the United Kingdom, where significant PAH concentrationdeclines were measured for urban sites but not at rural sites (Meijeret al., 2008).
For Europe, atmospheric PAH concentrations at Košetice andSpitsbergen decreased significantly but at slower rates, with averagehalving-times of 17 ± 7 and 16 ± 3 years, respectively (Fig. 5 andTable S3). These rates are statistically indistinguishable from eachother but are significantly slower than the rates observed at Chicagoand Cleveland (see the ANOVA in Fig. 5). A slow decline of atmospheric
Spi EH SBD Asp
C
es near the Great Lakes and three sites in the European Union. The error bars are standardistributions that share a large red letter (A–C) are not significantly different (P b 0.05). (Forversion of this article.)
53L.-Y. Liu et al. / Environment International 64 (2014) 48–55
PAH concentrations at Košetice was also reported in a previous study(Holoubek et al., 2007a). Atmospheric PAH concentrations at Aspvretenshowed no temporal decreasing trends. This is consistent with the sedi-mentary record of PAHs near Aspvreten, Sweden (Elmquist et al., 2007).In the 700 year sedimentary record, no decreasing trend of PAH concen-trations for the last two decades (1990–2004) was found, possiblyreflecting a slight increase in diesel fuel consumption and the doublingof softwood-pellets used for homeheating (Elmquist et al., 2007). Remotesites (such as Sleeping Bear Dunes and Eagle Harbor in North America),which are far away from emission sources, are characterized by fewsignificant temporal trends. Therefore, the slow decline found at theEuropean sites, Košetice and Spitsbergen, very likely suggests the influ-ence of local source emissions on atmospheric PAH concentrations atthese sites.
Widely observed declines of atmospheric PAH concentrations wereconsistent with the results from sedimentary records of PAHs aroundUnited States and Europe (Elmquist et al., 2007; Fernández et al.,2000; Heim and Schwarzbauer, 2013). These declines were generallyattributed to the switch from coal to cleaner fuels, such as oil and naturalgas and to worldwide efforts towards source emission controls andimproving combustion efficiency. The implementation of the Clean AirAct (U.S. EPA, 2013), the Toxic Substances Control Act (U.S. EPA,2012), and others in the U.S. was followed by improved abatementmeasures (for example, increased combustion efficiencies and reducedcoal use and industrial emissions) all of which have significantlyreduced the PAHemissions (CAROL, 2013). Bans on agricultural burningin the United Kingdom were another effective practice, which havereduced PAH emissions (Meijer et al., 2008).
Although the total energy consumption in the 27 EUMember States(EU-27) increased by 7.1% from 1990 to 2010, the efficiency of energyproduction and use also increased (European Environment Agency,2012b). The percentage of renewable energy to total energy consump-tion in the EU-27 increased from 8.5% in 2005 to 12.5% in 2010(European Environment Agency, 2012b). The energy efficiency inEurope has improved by 20% at an annual average rate of 1.1% during1990 and 2010 (European Environment Agency, 2012b). Probably as aresult of these gains, PAH emissions in the EU-27 were reported tohave decreased by 52% from 1990 to 2010 (European EnvironmentAgency, 2012a). TheUnited States has alsomade efforts to reduce atmo-spheric PAH concentrations by way of legislation that included theClean Air Act (1970) and the Clean Cities Program (1993). The EPA's
Chi Clev StPt Ko
Dat
e of
max
imum
con
c (m
onth
/day
)
12/17
12/31
1/14
1/28
2/11
2/25
BaABaPBkFBePChrCorI12BgPBbFΣ4P
CD AB EDA
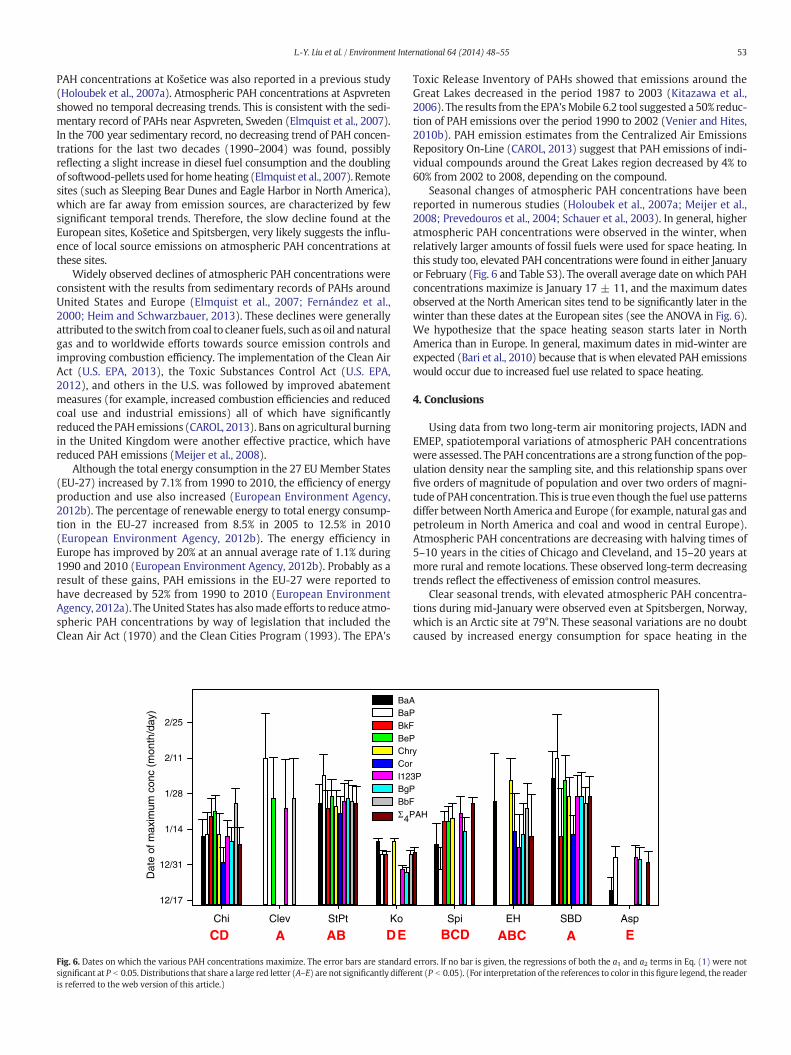
Fig. 6. Dates on which the various PAH concentrations maximize. The error bars are standardsignificant at P b 0.05. Distributions that share a large red letter (A–E) are not significantly differis referred to the web version of this article.)
Toxic Release Inventory of PAHs showed that emissions around theGreat Lakes decreased in the period 1987 to 2003 (Kitazawa et al.,2006). The results from the EPA'sMobile 6.2 tool suggested a 50% reduc-tion of PAH emissions over the period 1990 to 2002 (Venier and Hites,2010b). PAH emission estimates from the Centralized Air EmissionsRepository On-Line (CAROL, 2013) suggest that PAH emissions of indi-vidual compounds around the Great Lakes region decreased by 4% to60% from 2002 to 2008, depending on the compound.
Seasonal changes of atmospheric PAH concentrations have beenreported in numerous studies (Holoubek et al., 2007a; Meijer et al.,2008; Prevedouros et al., 2004; Schauer et al., 2003). In general, higheratmospheric PAH concentrations were observed in the winter, whenrelatively larger amounts of fossil fuels were used for space heating. Inthis study too, elevated PAH concentrations were found in either Januaryor February (Fig. 6 and Table S3). The overall average date on which PAHconcentrations maximize is January 17 ± 11, and the maximum datesobserved at the North American sites tend to be significantly later in thewinter than these dates at the European sites (see the ANOVA in Fig. 6).We hypothesize that the space heating season starts later in NorthAmerica than in Europe. In general, maximum dates in mid-winter areexpected (Bari et al., 2010) because that is when elevated PAH emissionswould occur due to increased fuel use related to space heating.
4. Conclusions
Using data from two long-term air monitoring projects, IADN andEMEP, spatiotemporal variations of atmospheric PAH concentrationswere assessed. The PAH concentrations are a strong function of the pop-ulation density near the sampling site, and this relationship spans overfive orders of magnitude of population and over two orders of magni-tude of PAH concentration. This is true even though the fuel use patternsdiffer between North America and Europe (for example, natural gas andpetroleum in North America and coal and wood in central Europe).Atmospheric PAH concentrations are decreasing with halving times of5–10 years in the cities of Chicago and Cleveland, and 15–20 years atmore rural and remote locations. These observed long-term decreasingtrends reflect the effectiveness of emission control measures.
Clear seasonal trends, with elevated atmospheric PAH concentra-tions during mid-January were observed even at Spitsbergen, Norway,which is an Arctic site at 79°N. These seasonal variations are no doubtcaused by increased energy consumption for space heating in the
Spi EH SBD Asp
y
3P
AH
ABC EABCD
errors. If no bar is given, the regressions of both the a1 and a2 terms in Eq. (1) were notent (P b 0.05). (For interpretation of the references to color in thisfigure legend, the reader
54 L.-Y. Liu et al. / Environment International 64 (2014) 48–55
winter. Why are the peak-to-peak seasonal variations in Europe greaterthan those in the United States? One possible explanation is that sea-sonal variations in combustion for space heating are much larger inEurope compared to North America, and that seasonal variations forenergy production are much smaller in Europe compared to NorthAmerica. Given that PAH emission controls from energy productiontend to be more effective than emission controls from space heating,these continental differences could lead to greater peak-to-peak vari-ability in Europe compared to North America. This suggests that com-bustion emission regulations have been successful in reducing industrialPAH sources (note the relatively short halving times in the big cities)but not in reducing space heating (particularly domestic space heating)PAH emissions.
Acknowledgments
We thank the IADN team for their operation of the network. Wealso acknowledge the Norwegian Institute for Air Research, theSwedish Water and Air Pollution Research Institute, and theCzech Hydrometeorological Institute for providing their data forEurope. This work has been supported by the United States Envi-ronmental Protection Agency's Great Lakes National Program Of-fice (Grant GL995656, Todd Nettesheim, project officer), theRECETOX Research Infrastructure Project (Ministry of Educationof the Czech Republic LM2011028), the CETOCOEN project of theEuropean Structure Funds (CZ.1.05/2.1.00/01.0001), the Employ-ment of Best Young Scientists for International Cooperation Em-powerment project (CZ.1.07/2.3.00/30.0037) co-financed fromthe European Social Fund and the state budget of the Czech Repub-lic and the AMVIS project (KONTAKT II, LH12074).
Appendix A. Supplementary data
Supplementary data to this article can be found online at http://dx.doi.org/10.1016/j.envint.2013.11.008.
References
Aas W, Breivik K. Heavy metals and POP measurements, 2010. Kjeller, NILU (EMEP/CCC,03/2012). available at: http://www.nilu.no/Default.aspx?tabid=62&ctl=PublicationDetails&mid=764&publicationid=26836, 2012. [accessed November 2013].
Bari MA, Baumbach G, Kuch B, Scheffknecht G. Particle-phase concentrations of polycyclicaromatic hydrocarbons in ambient air of rural residential areas in southern Germany.Air Qual Atmos Health 2010;3:103–16.
Buehler SS, Hites RA. Peer reviewed: the Great Lakes' Integrated Atmospheric DepositionNetwork. Environ Sci Technol 2002;36:354A–9A.
CAROL. Emission queries. available at: http://carol.glin.net/index.php, 2013. [accessedNovember 2013].
Chrysikou L, Gemenetzis P, Kouras A, Manoli E, Terzi E, Samara C. Distribution of persis-tent organic pollutants, polycyclic aromatic hydrocarbons and trace elements in soiland vegetation following a large scale landfill fire in northern Greece. Environ Int2008;34:210–25.
Cortes DR, Basu I, Sweet CW, Hites RA. Temporal trends in and influence of windon PAH concentrations measured near the Great Lakes. Environ Sci Technol2000;34:356–60.
Delgado-Saborit JM, Stark C, Harrison RM. Carcinogenic potential, levels and sourcesof polycyclic aromatic hydrocarbon mixtures in indoor and outdoor environ-ments and their implications for air quality standards. Environ Int 2011;37:383–92.
Dvorská A, Komprdová K, Lammel G, Klánová J, Plachá H. Polycyclic aromatic hydrocarbonsin background air in central Europe — seasonal levels and limitations for sourceapportionment. Atmos Environ 2012;46:147–54.
Elmquist M, Zencak Z, Gustafsson Ö. A 700 year sediment record of black carbon andpolycyclic aromatic hydrocarbons near the EMEP air monitoring station in Aspvreten,Sweden. Environ Sci Technol 2007;41:6926–32.
EMEP. European monitoring and evaluation programme. available at: http://www.emep.int/, 2013. [accessed November 2013].
Environment Canada. Integrated atmospheric deposition network. available at: https://www.ec.gc.ca/rs-mn/default.asp?lang=En&n=BFE9D3A3-1, 2010. [accessedNovember 2013].
Environment Canada, USEPA. Integrated atmospheric deposition network qualityassurance program plan; 2011.
European Environment Agency. European Union emission inventory report 1990–2010under the UNECE convention on Long-range Transboundary Air Pollution (LRTAP);2012a.
European Environment Agency. Indicators and fact sheets about Europe's environ-ment. available at: http://www.eea.europa.eu/data-and-maps/indicators/#c5=&c7=all&c0=10&b_start=70, 2012. [accessed November 2013].
Fernández P, Vilanova RM, Martínez C, Appleby P, Grimalt JO. The historical re-cord of atmospheric pyrolytic pollution over Europe registered in the sedi-mentary PAH from remote mountain lakes. Environ Sci Technol 2000;34:1906–13.
Halse AK, Schlabach M, Eckhardt S, Sweetman A, Jones KC, Breivik K. Spatial variability ofPOPs in European background air. Atmos Chem Phys 2011;11:1549–64.
Heim S, Schwarzbauer J. Pollution history revealed by sedimentary records: a review.Environ Chem Lett 2013;11:255–70.
Holoubek I, Klánová J, Jarkovský J, Kohoutek J. Trends in background levels ofpersistent organic pollutants at Kosetice observatory, Czech Republic. PartI. Ambient air and wet deposition 1996–2005. J Environ Monit 2007a;9:557–63.
Holoubek I, Klánová J, Jarkovský J, Kubík V, Helešic J. Trends in background levels ofpersistent organic pollutants at Kosetice observatory, Czech Republic. Part II.Aquatic and terrestrial environments 1996–2005. J Environ Monit 2007b;9:564–71.
Hung H, Kallenborn R, Breivik K, Su Y, Brorström-Lundén E, Olafsdottir K, et al. At-mospheric monitoring of organic pollutants in the Arctic under the Arctic Mon-itoring and Assessment Programme (AMAP): 1993–2006. Sci Total Environ2010;408:2854–73.
IADN Team. Analysis of PCBs, pesticides, PAHs, and flame retardants in air and precipita-tion samples. Bloomington, IN: Indiana University; 2013.
Kim K-H, Jahan SA, Kabir E, Brown RJC. A review of airborne polycyclic aromatichydrocarbons (PAHs) and their human health effects. Environ Int 2013;60:71–80.
Kitazawa A, Amagai T, Ohura T. Temporal trends and relationships of particulate chlori-nated polycyclic aromatic hydrocarbons and their parent compounds in urban air.Environ Sci Technol 2006;40:4592–8.
Klánová J, Harner T. The challenge of producing reliable results under highly variableconditions and the role of passive air samplers in the Global Monitoring Plan. TrAC,Trends Anal Chem 2013;46:139–49.
Klánová J, Čupr P, Holoubek I, Borůvková J, Přibylová P, Kareš R, et al. Towards the globalmonitoring of POPs — contribution of the MONET networks: RECETOX. Brno, CzechRepublic: Masaryk University; 2009.
Krystyna K, Bostjan P, Panagiota D. Small combustion installations: techniques, emissionsand measures for emission reduction. European Commission; 2007.
Le HQ, Batterman SA, Wirth JJ, Wahl RL, Hoggatt KJ, Sadeghnejad A, et al. Air pollutantexposure and preterm and term small-for-gestational-age births in Detroit, Michi-gan: long-term trends and associations. Environ Int 2012;44:7–17.
Lima ALC, Farrington JW, Reddy CM. Combustion-derived polycyclic aromatic hydrocarbonsin the environment — a review. Environ Forensic 2005;6:109–31.
Liu S, Tao S, Liu W, Dou H, Liu Y, Zhao J, et al. Seasonal and spatial occurrence and distri-bution of atmospheric polycyclic aromatic hydrocarbons (PAHs) in rural and urbanareas of the North Chinese Plain. Environ Pollut 2008;156:651–6.
Liu L-Y, Wang J-Z, Wei G-L, Guan Y-F, Zeng EY. Polycyclic aromatic hydrocarbons (PAHs)in continental shelf sediment of China: implications for anthropogenic influences oncoastal marine environment. Environ Pollut 2012;167:155–62.
Martin S, Rania F-C, Hayley H, Roland K, Yushan S, Wenche A. AMAP/EMEP/NCPinter-laboratory study for POP analysis 2010. Kjeller, Norway: Norwegian Institutefor Air Research; 2012.
Meijer SN, Sweetman AJ, Halsall CJ, Jones KC. Temporal trends of polycyclic aromatichydrocarbons in the U.K. atmosphere: 1991–2005. Environ Sci Technol 2008;42:3213–8.
Prevedouros K, Brorström-Lundén E, Halsall CJ, Jones KC, Lee RGM, Sweetman AJ. Seasonaland long-term trends in atmospheric PAH concentrations: evidence and implications.Environ Pollut 2004;128:17–27.
Pribylova P, Kares R, Boruvkova J, Cupr P, Prokes R, Kohoutek J, et al. Levels of persistentorganic pollutants and polycyclic aromatic hydrocarbons in ambient air of Centraland Eastern Europe. Atmos Pollut Res 2012;3:494–505.
Qiao M, Wang C, Huang S, Wang D, Wang Z. Composition, sources, and potential toxico-logical significance of PAHs in the surface sediments of the Meiliang Bay, Taihu Lake,China. Environ Int 2006;32:28–33.
Ravindra K, Sokhi R, Van Grieken R. Atmospheric polycyclic aromatic hydrocarbons:source attribution, emission factors and regulation. Atmos Environ 2008;42:2895–921.
Schauer C, Niessner R, Pöschl U. Polycyclic aromatic hydrocarbons in urban air particulatematter: decadal and seasonal trends, chemical degradation, and sampling artifacts.Environ Sci Technol 2003;37:2861–8.
Schneider AR, Stapleton HM, Cornwell J, Baker JE. Recent declines in PAH, PCB, andtoxaphene levels in the northern Great Lakes as determined from high resolutionsediment cores. Environ Sci Technol 2001;35:3809–15.
Sun P, Backus S, Blanchard P, Hites RA. Annual variation of polycyclic aromatic hydrocarbonconcentrations in precipitation collected near the Great Lakes. Environ Sci Technol2006a;40:696–701.
Sun P, Blanchard P, Brice KA, Hites RA. Trends in polycyclic aromatic hydrocarbonconcentrations in the Great Lakes atmosphere. Environ Sci Technol 2006b;40:6221–7.
Tang L, Tang X-Y, Zhu Y-G, Zheng M-H, Miao Q-L. Contamination of polycyclicaromatic hydrocarbons (PAHs) in urban soils in Beijing, China. Environ Int2005;31:822–8.

55L.-Y. Liu et al. / Environment International 64 (2014) 48–55
U.S. EPA. Priority pollutants. available at: http://www.waterboards.ca.gov/rwqcb7/board_decisions/adopted_orders/orders/2005/05_0082g.pdf, 2005. [accessedNovember 2013].
U.S. EPA. Toxic Substances Control Act. available at: http://www.epa.gov/oecaagct/lsca.html, 2012. [accessed November 2013].
U.S. EPA. Clean Air Act. available at: http://www.epa.gov/air/caa/index.html, 2013.[accessed November 2013].
United Nations Economic Commission for Europe (UNECE). Convention on long-rangetransboundary air pollution. available at: http://www.unece.org/env/lrtap/, 2013.[accessed November 2013].
United Nations Statistics Division. United Nations statistical yearbook. available at: http://unstats.un.org/unsd/syb/, 2012. [accessed November 2013].
Venier M, Hites RA. Regression model of partial pressures of PCBs, PAHs, and organ-ochlorine pesticides in the Great Lakes' atmosphere. Environ Sci Technol2010a;44:618–23.
Venier M, Hites RA. Time trend analysis of atmospheric POPs concentrations in the GreatLakes region since 1990. Environ Sci Technol 2010b;44:8050–5.
Vera Castellano A, López Cancio J, Santana Alemán P, Santana Rodríguez J. Polycyclicaromatic hydrocarbons in ambient air particles in the city of Las Palmas de GranCanaria. Environ Int 2003;29:475–80.
Copyright © 2022 FDOKUMEN