A blind extraction of temporally correlated but statistically dependent acoustic signals
www.elsevier.com/locate/visres
Vision Research 45 (2005) 1603–1614
Differences in perceived depth for temporally correlatedand uncorrelated dynamic random-dot stereograms
Elena Gheorghiu *, Casper J. Erkelens
Physics of Man Department, Helmholtz Institute, Utrecht University, Pricetonplain 5, P.O. Box 80 000, 3508 TA Utrecht, The Netherlands
Received 4 May 2004; received in revised form 20 December 2004
Abstract
We investigated the influence of temporal frequency on binocular depth perception in dynamic random-dot stereograms (DRS).
We used (i) temporally correlated DRS in which a single pair of images alternated between two disparity values, and (ii) temporally
uncorrelated DRS consisting of the repeated alternation of two uncorrelated image pairs each having one of two disparity values.
Our results show that disparity-defined depth is judged differently in temporally correlated and temporally uncorrelated DRS above
a temporal frequency of about 3 Hz. The results and simulations indicate that (i) above about 20 Hz, the complete absence of ste-
reomotion is caused by temporal integration of luminance, (ii) the difference in perceived depth in temporally correlated and tem-
porally uncorrelated DRS for temporal frequencies between 20 and 3 Hz, is caused by temporal integration of disparity.
� 2005 Elsevier Ltd. All rights reserved.
Keywords: Stereopsis; Stereomotion; Temporally correlated DRS; Temporal integration
1. Introduction
Since their introduction by Julesz (1960), random-dot
stereograms (RDS) and their dynamic version (DRS)
have often been used to study the relationship betweenbinocular disparity and depth perception in humans.
RDS and DRS are powerful tools because in these stere-
ograms disparity is the only source of depth. In order to
extract depth from RDS the binocular visual system
must solve the correspondence problem: which dots in
the left retinal image match those in the right retinal im-
age. This stereoscopic matching process is accomplished
by neurons in V1 and V2 of the visual cortex (Barlow,Blakemore, & Pettigrew, 1967; DeAngelis, Ohzawa, &
Freeman, 1991; Hubel & Livingstone, 1987; Poggio &
Fisher, 1977). However, depth perception does not
0042-6989/$ - see front matter � 2005 Elsevier Ltd. All rights reserved.
doi:10.1016/j.visres.2004.12.005
* Corresponding author. Tel.: +31 30 253 2807.
E-mail address: [email protected] (E. Gheorghiu).
always accurately reflect the disparity-defined depth of
the stimulus (Van Ee & Erkelens, 1996; Van Ee, Banks,
& Backus, 1999). This might also be valid in dynamic
conditions: what textural pattern we see and where in
depth we perceive the disparity-defined shape may notbe a simple matter of what is specified in the indepen-
dent images of the stimulus. In dynamic stimuli, it is
likely that stereoscopic matching is more complex.
DRS have been used to investigate (i) the levels of
interocular correlation required for stereopsis, and (ii)
stereomotion, that is referred to as motion-in-depth per-
ception from purely binocular processes, i.e. in the ab-
sence of monocular cues (Cumming & Parker, 1994;Howard & Rogers, 2002; Patterson, 1999). The general
assumption has been that subsequent images of DRS
are treated independently from each other by the binoc-
ular processes. A few studies measured perceived depth
from changing disparity in DRS composed of random-
dot textures that were either the same or dynamically
changed on every frame (Allison & Howard, 2000;
1604 E. Gheorghiu, C.J. Erkelens / Vision Research 45 (2005) 1603–1614
Cumming & Parker, 1994). In these studies disparity
was changed between frames at high rates (� 33 Hz),
for both types of texture. These studies showed that
matched depth was greater when the texture changed
than when it remained the same. Allison and Howard
(2000) explained the difference as a cue conflict betweenstereopsis and monocular depth cues. However, it is
obvious that before any binocular interaction can take
place, visual information is processed monocularly.
Thus, both disparity processing and depth perception
mechanisms could possibly be affected by temporal
properties of monocular luminance mechanisms.
Numerous psychophysical studies (Burr & Morrone,
1993; Ikeda, 1965, 1986; Swanson, Uneno, Smith, &Pokorny, 1987) have shown that responses to luminance
impulses are temporally biphasic, with a negative lobe
following the initial positive response (Burr & Morrone,
1993; Shinomori & Werner, 2003). These impulse re-
sponses, which last about 150 ms, reflect the temporal
properties of the visual system as a whole. Moreover,
electrophysiological studies (Chichilinisky & Kalmar,
2002; Kremers, Lee, Pokorny, & Smith, 1993) demon-strated that impulse responses of retinal ganglion cells
have similar temporal characteristics. Therefore, it is
possible that the temporal properties of binocular mech-
anisms for disparity and depth processing are limited by
the temporal (frequency tuning) characteristics of the
luminance system.
If this view is correct then, in order to derive the dis-
parity-defined depth information, the correspondenceproblem is solved between left and right monocular
luminance-averaged patterns that represent the retinal
images after having been subjected to temporal integra-
tion of luminance. Then, binocular correspondence in
DRS results from a cross-correlation-like operation be-
tween monocular luminance-averaged images. This
explanation implies that the mechanism that limits bin-
ocular processing is located at the monocular level.An alternative explanation for the temporal limita-
tions of disparity processing and stereomotion percep-
tion was proposed by a number of studies which
suggest that for temporal frequencies above about
8 Hz, depth in DRS and the failure to perceive stereomo-
tion result from temporal summation of disparity (Bever-
ley & Regan, 1974; Cumming & Parker, 1994; Howard &
Rogers, 2002; Reagan & Beverley, 1973; Patterson, 1999;White & Odom, 1985). According to this view, the mech-
anism responsible for temporal limitations of disparity
processing and stereomotion is located at binocular level.
In brief, it is not yet clear which of the above-men-
tioned explanations (i.e. monocular vs. binocular) are
responsible for the temporal limitations of disparity pro-
cessing and stereomotion in depth.
In the present study we investigate which processeslimit human binocular depth perception. First, we show
how different types of DRS can be used for this purpose.
Then, we present the experimental results that show: (i)
absence of stereomotion above 10 Hz in both temporally
correlated and uncorrelated DRS, (ii) gradual decrease
in stereomotion between 3 and 10 Hz in temporally cor-
related DRS, and (iii) gradual change from stereomo-
tion to transparency in temporally uncorrelated DRS.
2. Predictions
In order to explore the limitations of disparity pro-
cessing at high temporal frequencies we use two types
of DRS that enable us to make clear predictions. We
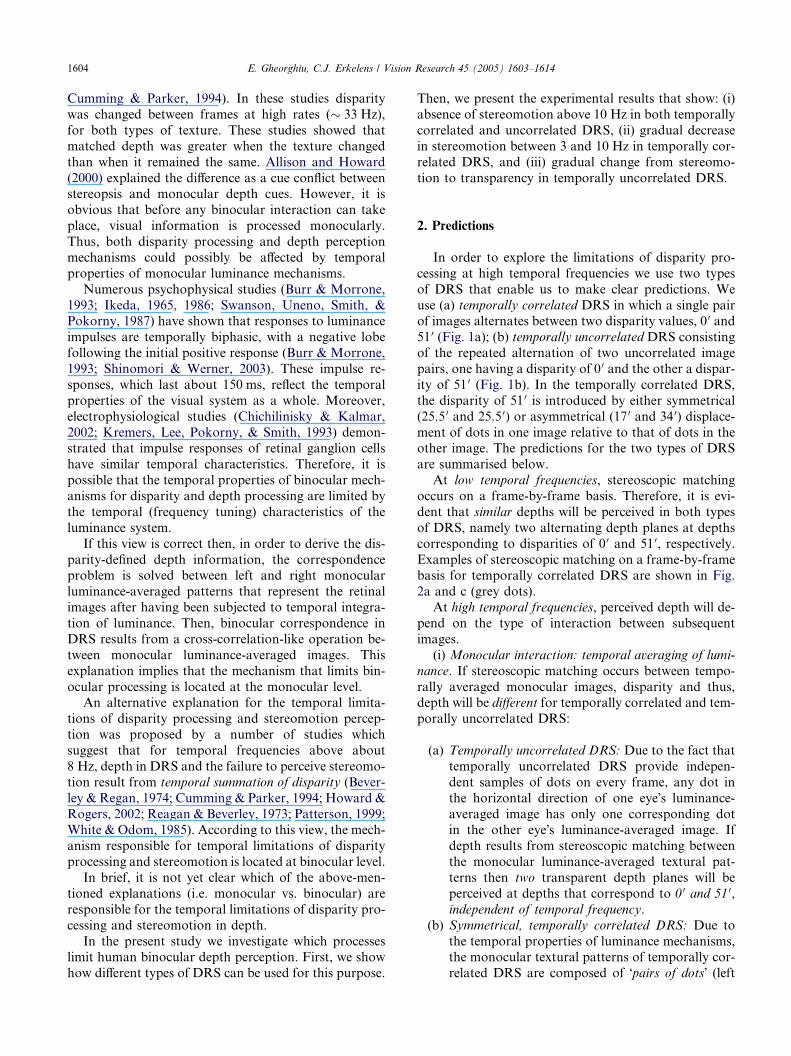
use (a) temporally correlated DRS in which a single pairof images alternates between two disparity values, 0 0 and
51 0 (Fig. 1a); (b) temporally uncorrelated DRS consisting
of the repeated alternation of two uncorrelated image
pairs, one having a disparity of 0 0 and the other a dispar-
ity of 51 0 (Fig. 1b). In the temporally correlated DRS,
the disparity of 51 0 is introduced by either symmetrical
(25.5 0 and 25.5 0) or asymmetrical (17 0 and 34 0) displace-
ment of dots in one image relative to that of dots in theother image. The predictions for the two types of DRS
are summarised below.
At low temporal frequencies, stereoscopic matching
occurs on a frame-by-frame basis. Therefore, it is evi-
dent that similar depths will be perceived in both types
of DRS, namely two alternating depth planes at depths
corresponding to disparities of 0 0 and 51 0, respectively.
Examples of stereoscopic matching on a frame-by-framebasis for temporally correlated DRS are shown in Fig.
2a and c (grey dots).
At high temporal frequencies, perceived depth will de-
pend on the type of interaction between subsequent
images.
(i) Monocular interaction: temporal averaging of lumi-
nance. If stereoscopic matching occurs between tempo-
rally averaged monocular images, disparity and thus,depth will be different for temporally correlated and tem-
porally uncorrelated DRS:
(a) Temporally uncorrelated DRS: Due to the fact that
temporally uncorrelated DRS provide indepen-
dent samples of dots on every frame, any dot in
the horizontal direction of one eye�s luminance-
averaged image has only one corresponding dotin the other eye�s luminance-averaged image. If
depth results from stereoscopic matching between
the monocular luminance-averaged textural pat-
terns then two transparent depth planes will be
perceived at depths that correspond to 0 0 and 51 0,
independent of temporal frequency.
(b) Symmetrical, temporally correlated DRS: Due to
the temporal properties of luminance mechanisms,the monocular textural patterns of temporally cor-
related DRS are composed of �pairs of dots� (left
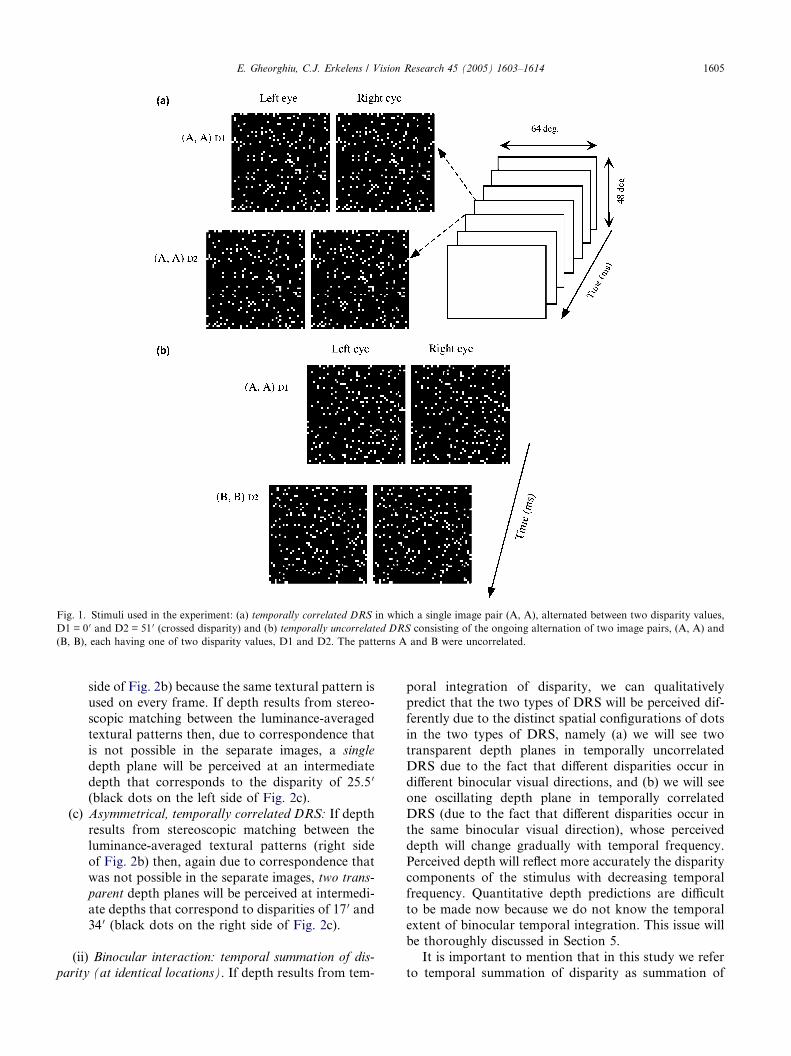
Fig. 1. Stimuli used in the experiment: (a) temporally correlated DRS in which a single image pair (A, A), alternated between two disparity values,
D1 = 0 0 and D2 = 51 0 (crossed disparity) and (b) temporally uncorrelated DRS consisting of the ongoing alternation of two image pairs, (A, A) and
(B, B), each having one of two disparity values, D1 and D2. The patterns A and B were uncorrelated.
E. Gheorghiu, C.J. Erkelens / Vision Research 45 (2005) 1603–1614 1605
side of Fig. 2b) because the same textural pattern is
used on every frame. If depth results from stereo-
scopic matching between the luminance-averaged
textural patterns then, due to correspondence that
is not possible in the separate images, a single
depth plane will be perceived at an intermediate
depth that corresponds to the disparity of 25.5 0
(black dots on the left side of Fig. 2c).
(c) Asymmetrical, temporally correlated DRS: If depth
results from stereoscopic matching between the
luminance-averaged textural patterns (right side
of Fig. 2b) then, again due to correspondence that
was not possible in the separate images, two trans-
parent depth planes will be perceived at intermedi-
ate depths that correspond to disparities of 17 0 and34 0 (black dots on the right side of Fig. 2c).
(ii) Binocular interaction: temporal summation of dis-
parity (at identical locations). If depth results from tem-
poral integration of disparity, we can qualitatively
predict that the two types of DRS will be perceived dif-
ferently due to the distinct spatial configurations of dots
in the two types of DRS, namely (a) we will see two
transparent depth planes in temporally uncorrelated
DRS due to the fact that different disparities occur in
different binocular visual directions, and (b) we will seeone oscillating depth plane in temporally correlated
DRS (due to the fact that different disparities occur in
the same binocular visual direction), whose perceived
depth will change gradually with temporal frequency.
Perceived depth will reflect more accurately the disparity
components of the stimulus with decreasing temporal
frequency. Quantitative depth predictions are difficult
to be made now because we do not know the temporalextent of binocular temporal integration. This issue will
be thoroughly discussed in Section 5.
It is important to mention that in this study we refer
to temporal summation of disparity as summation of
0'
+25.5' -25.5'
Image 1
0'
Image 2
Monocular visual direction
Left eye Right eye
Matching within separate images
0' 0'
+17' -34'
Monocular visual direction
Left eye Right eye
Image 1
Image 2
0' +25.5' -25.5' 0'
Image 1, 2
Monocular visual direction
Left eye Right eye
0' 0'+17' -34'
Monocular visual direction
Left eye
Image 1, 2
Matching within time-averaged images
-12.75 +12.750
0
25.5
51
Binocular visual direction
Pred
icte
d di
spar
ity(a
rcm
in) 0
51
34
17
-17 0-8.5 +8.5
Binocular visual direction
Pred
icte
d di
spar
ity(a
rcm
in)
Disparity and direction of matched pairs
Right eye
(a)
(b)
(c)
Symmetrical displacement Asymmetrical displacement
Fig. 2. Predictions for perceived depth in temporally correlated DRS in which the disparity of 51 0 was introduced by: (i) symmetrical (25.5 0 and 25.5 0)
and (ii) asymmetrical (17 0 and 34 0), displacement of the dots in one eye�s image relative to the dots in the other eye�s image (see text for explanations).
1606 E. Gheorghiu, C.J. Erkelens / Vision Research 45 (2005) 1603–1614
disparities at identical locations, and not to disparitiesacross different locations. If temporal summation of dis-
parity would occur across locations, then in all types of
DRS we would perceive a single depth plane at the dis-
parity of 25.5 0, independent of whether disparity would
be introduced by symmetrically or asymmetrically dis-
placed dots in the two images. If this would be the
case, than perceiving transparency in DRS would not
be possible.The above-mentioned predictions will be tested in the
next experiment.
3. Methods
3.1. Observers
Three subjects participated in all experiments. Two
subjects (LW and ME) were naive with respect to the
purpose of the experiments. None of the subjects
showed any visual or oculomotor pathologies other than
refraction anomalies. All had normal or corrected-to-normal visual acuity. They were checked for normal ste-
reopsis by means of a recently developed stereoscopic
depth perception test (Van Ee & Richards, 2002).
3.2. Stimuli and procedure
The stimuli were large RDS of 64 (width) · 48
(height) deg. The stereograms consisted of randomlydistributed bright dots (square-like elements) on a dark
background (5% dot density). The dot size was 8.5 0.
The RDS were generated in real time at a frequency
of 70 Hz by an HP 750 Graphics computer and back-
projected onto a fronto-parallel translucent screen by
a D-ILA projector (JVC DLA-G11E). Stereoscopic vi-
sion was made possible by placing red and green filters
in front of the observer�s eyes so that each image wasvisible to one of the eyes only (light separation between
red and green filters that were matched to the projector
guns was better than 99%). The experiments were per-
formed in an otherwise dark room. Before each trial,
E. Gheorghiu, C.J. Erkelens / Vision Research 45 (2005) 1603–1614 1607
the computer generated two stereograms whose left and
right image pairs (L, R) which we denote by (A, A) and
(B, B), were fully correlated. The patterns A and B were
uncorrelated. The DRS consisted of the ongoing alter-
nation of two image pairs. Successive images contained
different disparities, such that, when displayed in alter-nation, they resulted in a square-wave like modulation
of disparity over time. The size of the disparity-defined
square was 6.8� · 6.8� and the two disparities were
D1 = 0 0 and D2 = 51 0 (crossed disparity). Two types
of DRS were used as test stimuli (i) temporally corre-
lated DRS in which a single image pair (A, A) alter-
nated between two disparity values, 0 0 and 51 0 (Fig.
1a), (ii) temporally uncorrelated DRS that consisted ofthe continuous alternation of two image pairs: (A, A)
and (B, B) respectively, one having a disparity of 0 0
and the other a disparity of 51 0 (Fig. 1b). Due to the
fact that the same textural pattern is used in temporally
correlated DRS, the disparity-defined shape steps in
depth relative to a static background whereas in tempo-
rally uncorrelated DRS, the depth of the disparity-
defined square is judged in respect with a dynamicbackground. In order to make the relative depth judge-
ments as comparable as possible for the two types of
DRS, we used also a dynamic background for tempo-
rally correlated DRS (i.e. the background has different
random-dot textural pattern on every frame). In two
separate experiments, the disparity D2 was introduced
by displacing the dots in one image relative to the dots
in the other image (1) symmetrically (25.5 0 and 25.5 0),and (2) asymmetrically (17 0 and 34 0). For both types
of DRS, the presentation times of the two images were
adjustable in steps of 14 ms, between 14 and 210 ms.
The step size (14 ms) for the presentation times was dic-
tated by the frame rate of the projector. Different frame
durations, i.e. temporal frequencies were presented in a
random order within each individual session. For both
types of DRS, each temporal frequency was measuredten times. In the experiment in which disparity was
introduced by asymmetrical displacement of the images,
we used only very short frame durations, namely 14, 28,
and 42 ms. The reason was that for frame durations
longer than 56 ms, due to the asymmetrical displace-
ment of the images, motion in depth judgements might
be influenced by the lateral movement of the disparity-
defined shape. In all experiments, the DRS were pre-sented on the screen until the subject gave his/her
answer.
We used a forced-choice paradigm and a depth dis-
crimination task in which the subject indicated (by
pressing a key) whether the disparity-defined square in
the test or in the reference stimulus was most close to
him/her. The reference stimulus was a static image pair,
(A, A) that contained a disparity-defined square of con-stant disparity D. The disparity D of the reference stim-
ulus was varied in small steps (2.125 0) between 0 0 and
51 0. For each temporal frequency, a normal cumulative
distribution function was fitted to the depth discrimina-
tion data and the disparity at the 50% level was taken as
the value for matched depth. For both types of DRS,
two separate depth discrimination sessions were carried
out. In one session the subjects judged the depth ofthe near plane, whereas in the other they judged the
depth of the far plane.
A control experiment was carried out in order to
investigate whether monocular motion perception might
influence stereomotion perception in our temporally
correlated DRS. The reason is that stereomotion in tem-
porally correlated DRS might be detected by means of a
mechanism that first detects monocular motion (velocitysignals) separately in the two eyes and then computes
motion-in-depth from the interocular velocity differ-
ences. The stimulus used to examine monocular motion
perception was the monocular version of the symmetri-
cal, temporally correlated DRS. For this experiment,
two shapes (squares) whose random dot textural pattern
was the same on every frame were hidden on the left and
right side of each image. In successive images the twosquares were displaced either in the same direction (i.e.
in phase) or in opposite directions (i.e. out of phase).
The displacement was 25.5 0. The two shapes were
embedded in a dynamic background whose random
dot textural pattern changed on every frame. We used
a forced-choice paradigm and a motion direction dis-
crimination task in which the subjects (ME and LW
only) indicated whether the two squares moved in phaseor out of phase. The presentation times of the images
were adjustable in steps of 14 ms, between 14 and
252 ms. Each temporal frequency was presented 20
times to each subject in random order. We used a level
of 75% as the criterion for reliable motion direction
discrimination.
4. Results
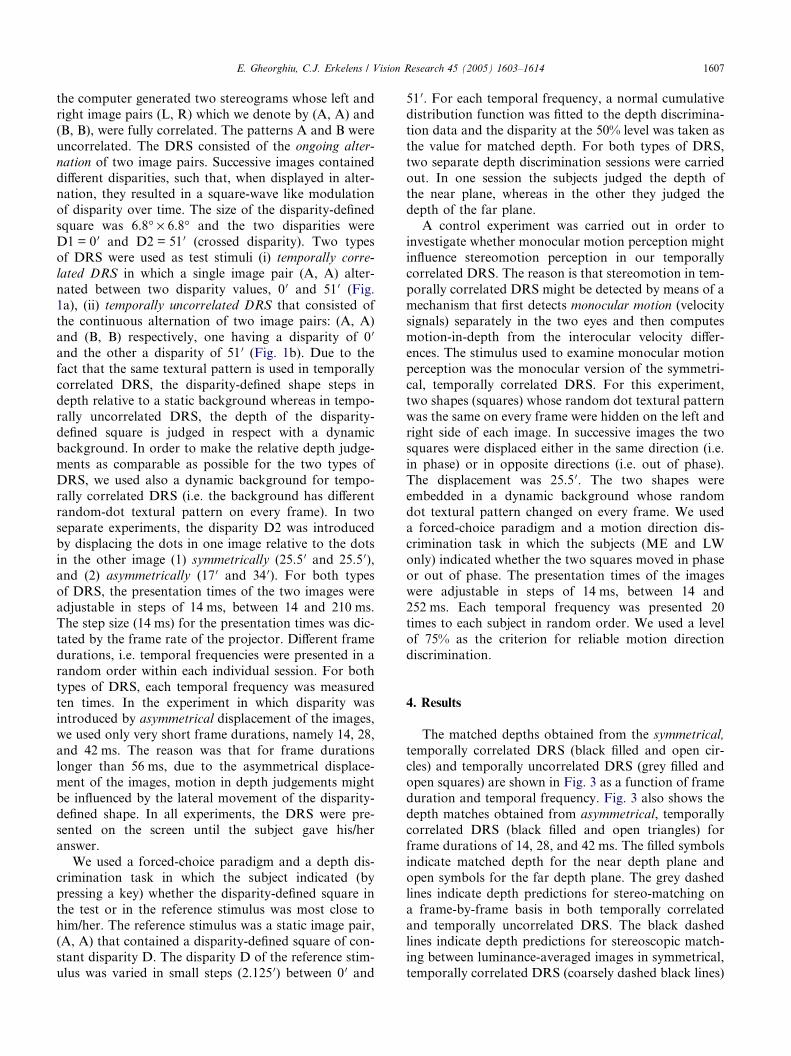
The matched depths obtained from the symmetrical,
temporally correlated DRS (black filled and open cir-
cles) and temporally uncorrelated DRS (grey filled and
open squares) are shown in Fig. 3 as a function of frame
duration and temporal frequency. Fig. 3 also shows the
depth matches obtained from asymmetrical, temporallycorrelated DRS (black filled and open triangles) for
frame durations of 14, 28, and 42 ms. The filled symbols
indicate matched depth for the near depth plane and
open symbols for the far depth plane. The grey dashed
lines indicate depth predictions for stereo-matching on
a frame-by-frame basis in both temporally correlated
and temporally uncorrelated DRS. The black dashed
lines indicate depth predictions for stereoscopic match-ing between luminance-averaged images in symmetrical,
temporally correlated DRS (coarsely dashed black lines)
-10
0
10
20
30
40
50
6035 20 7 5 4 3 210 6
LW
Mat
ched
dep
th (
arcm
in)
Temporal frequency (Hz)
14 28 42 56 70 84 98 112 126 140 154 168 182 196 210
EG
-10
0
10
20
30
40
50
6035 20 7 5 4 3 210 6
Mat
ched
dep
th (
arcm
in)
Frame duration (ms)
14 28 42 56 70 84 98 112 126 140 154 168 182 196 210
ME
-10
0
10
20
30
40
50
6035 20 7 5 4 3 210 6
Mat
ched
dep
th (
arcm
in)
14 28 42 56 70 84 98 112 126 140 154 168 182 196 210
Fig. 3. Matched depth results obtained from: (i) symmetrical, tempo-
rally correlated DRS (black filled and open circles), (ii) temporally
uncorrelated DRS (grey filled and open squares), and (iii) asymmet-
rical, temporally correlated DRS (black filled and open triangles), are
represented as a function of frame duration and temporal frequency.
The filled symbols indicate matched depth for the near depth plane and
open symbols for the far depth plane. The grey dashed lines indicate
depth predictions for stereoscopic matching on a frame-by-frame basis
in both temporally correlated and temporally uncorrelated DRS. The
black dashed lines indicate depth predictions for stereoscopic matching
between monocular luminance-averaged images in symmetrical, tem-
porally correlated DRS (coarsely dashed black lines) and in asymmet-
rical, temporally correlated DRS (fine-dashed black lines).
1608 E. Gheorghiu, C.J. Erkelens / Vision Research 45 (2005) 1603–1614
and in asymmetrical, temporally correlated DRS (fine-
dashed black lines).
On average, at temporal frequencies above 10 Hz
(frame durations shorter than 56 ms) in symmetrical,
temporally correlated DRS the subjects perceived a sin-
gle steady depth surface whose depth was matched to25.5 0 (black dots). At these temporal frequencies, in
asymmetrical, temporally correlated DRS the subjects
perceived two transparent depth surfaces whose depths
were matched to 34 0 and 17 0 (black filled and open trian-
gles), respectively. For temporally uncorrelated DRS,
the subjects perceived always two transparent depth
planes whose depths were matched to 51 0 (grey filled
squares) and 0 0 (grey open squares).At temporal frequencies lower than 10 Hz, for sym-
metrical, temporally correlated DRS, the subjects per-
ceived the single depth plane undergoing apparent
oscillation in depth. This oscillation was perceived as a
rapid movement towards and away from the observer.
The amplitude of the oscillation, i.e. the perceived depth
of the near and far depth planes (black filled and open
circles in Fig. 3) increased gradually with decreasingtemporal frequency. On average, when the frame dura-
tion was about 168 ms (corresponding to a temporal fre-
quency of about 3 Hz), the subjects perceived the single
depth plane oscillating in depth between the depths of
the separate image pairs, namely 51 0 and 0 0.
The results also indicate that the errors of estimating
the matched depths were different for the two types of
DRS (compare error bars for circles and squares). Fortemporally uncorrelated DRS (grey filled and open
squares) the size of error bars was small and approxi-
mately the same over the entire range of temporal fre-
quencies (36–2 Hz). For temporally correlated DRS
(black filled and open circles) the size of error bars var-
ied as a function of temporal frequency, namely the er-
rors were small for high and low temporal frequencies
(above 10 Hz and below 3 Hz) and were larger for inter-mediate temporal frequencies (between 10 and 3 Hz).
The variation in error size could be the result of short
inspection times for perceived near/far depth planes at
intermediate temporal frequencies and long inspection
times at high (static percept) and low temporal
frequencies.
One can notice that by using temporally uncorrelated
DRS consisting of the continuous alternation of only twodifferent patterns, (A, A) and (B, B) respectively, we ob-
tained similar depth percepts (i.e. two depth planes whose
depths were matched to the component disparities for the
entire range of temporal frequencies) as those reported by
authors who used temporally uncorrelated DRS in which
image pairs contained different textural patterns on every
successive frame (Norcia & Tyler, 1984).
One may think that the difference in matched depthfor the two types of DRS is due to an increased effective
dot density obtained by monocular integration mecha-
E. Gheorghiu, C.J. Erkelens / Vision Research 45 (2005) 1603–1614 1609
nisms across several frames. In pilot experiments in
which we used different dot densities, namely 10%,
15% and 20% respectively, we found the same pattern
of results as those obtained with 5% dot density. Thus,
we can reject the possibility that an increase in effective
dot density contributed to the difference in matcheddepth for the two types of DRS. Similar findings about
the role of dot density have been reported by Allison
and Howard (2000).
4.1. Control experiment
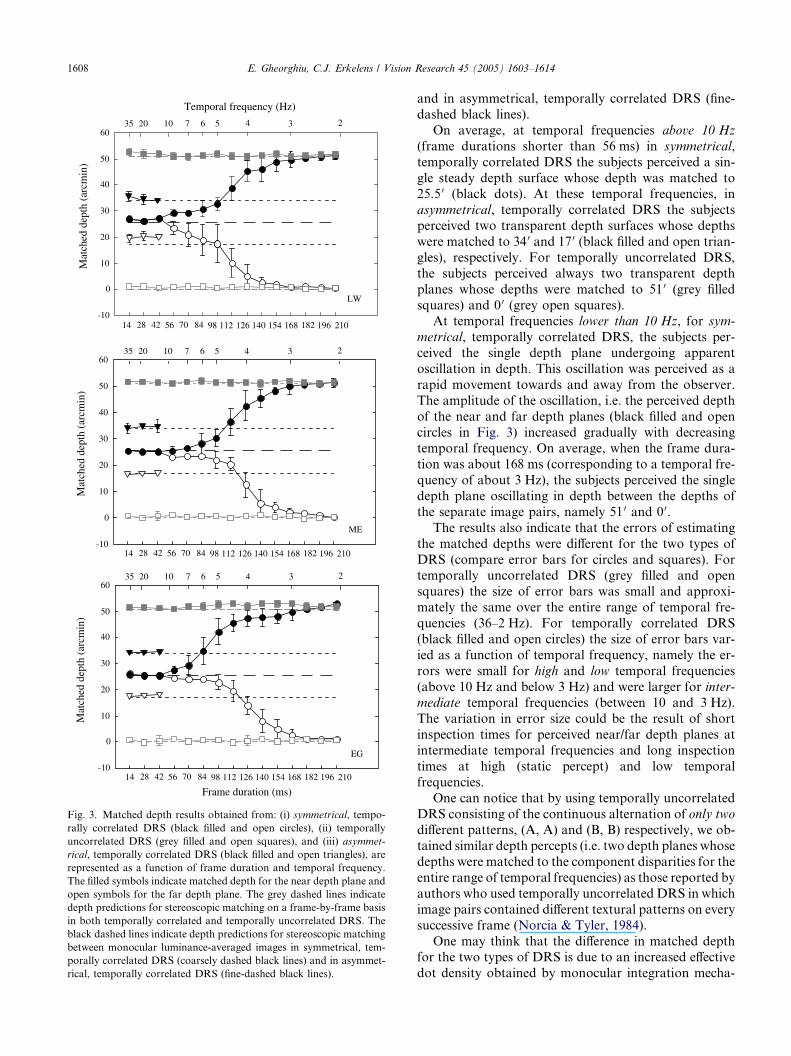
Monocular motion direction-discrimination results
(% correct answers) are shown in Fig. 4 as a functionof frame duration and temporal frequency, for subjects
ME and LW. The subjects performed below the 75% le-
vel for all temporal frequencies. These results indicate
that the monocular displacement of 25.5 0 was too large
to allow monocular motion perception.
MELW
0
20
40
60
80
100
14 42 70 98 126 154 182 210 238 252
Frame duration (ms)
% c
orre
ct a
nsw
ers
Temporal frequency (Hz)35 20 10 7 6 5 4 3 2
Fig. 4. Monocular motion direction-discrimination results as a func-
tion of frame duration and temporal frequency. The percentage correct
answers below the 75% level indicate that the monocular displacement
of 25.5 0 was too large to allow monocular motion perception.
L2L1 L1 ...Left eye
Right eyeR2R1 R1 ...
binocularmatching
monocular Level: binocular
monocular image formationbased on temporal integration
of luminance
Process: disparitydetection
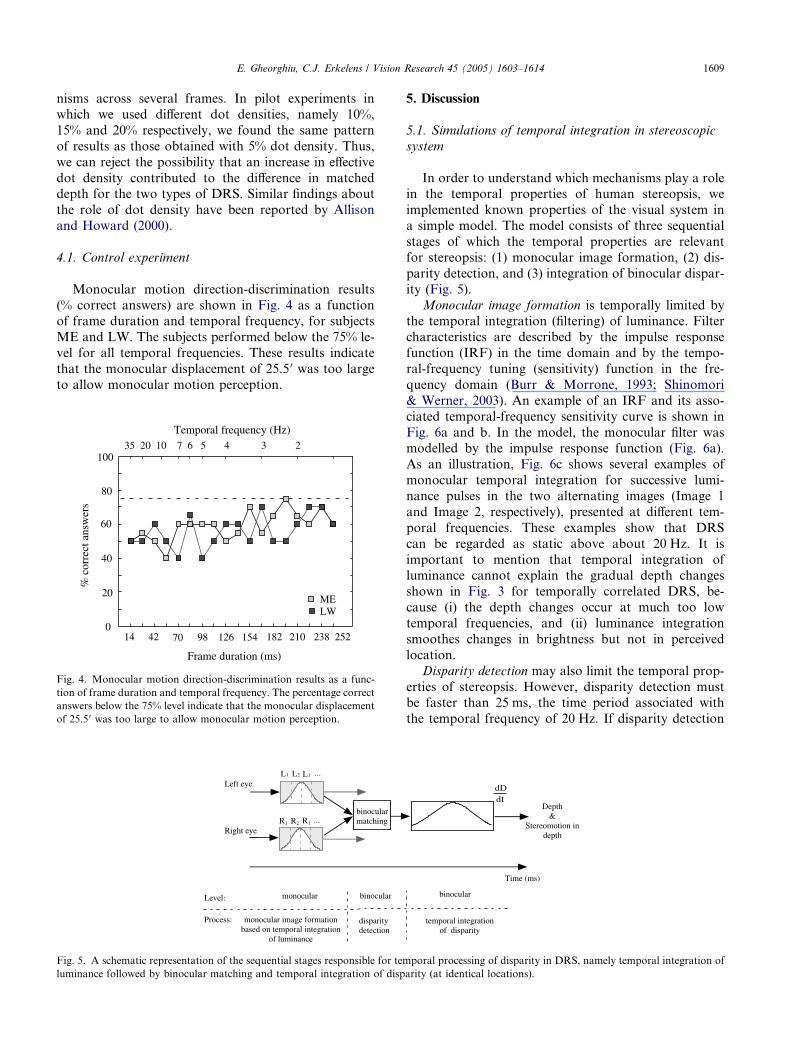
Fig. 5. A schematic representation of the sequential stages responsible for tem
luminance followed by binocular matching and temporal integration of disp
5. Discussion
5.1. Simulations of temporal integration in stereoscopic
system
In order to understand which mechanisms play a rolein the temporal properties of human stereopsis, we
implemented known properties of the visual system in
a simple model. The model consists of three sequential
stages of which the temporal properties are relevant
for stereopsis: (1) monocular image formation, (2) dis-
parity detection, and (3) integration of binocular dispar-
ity (Fig. 5).
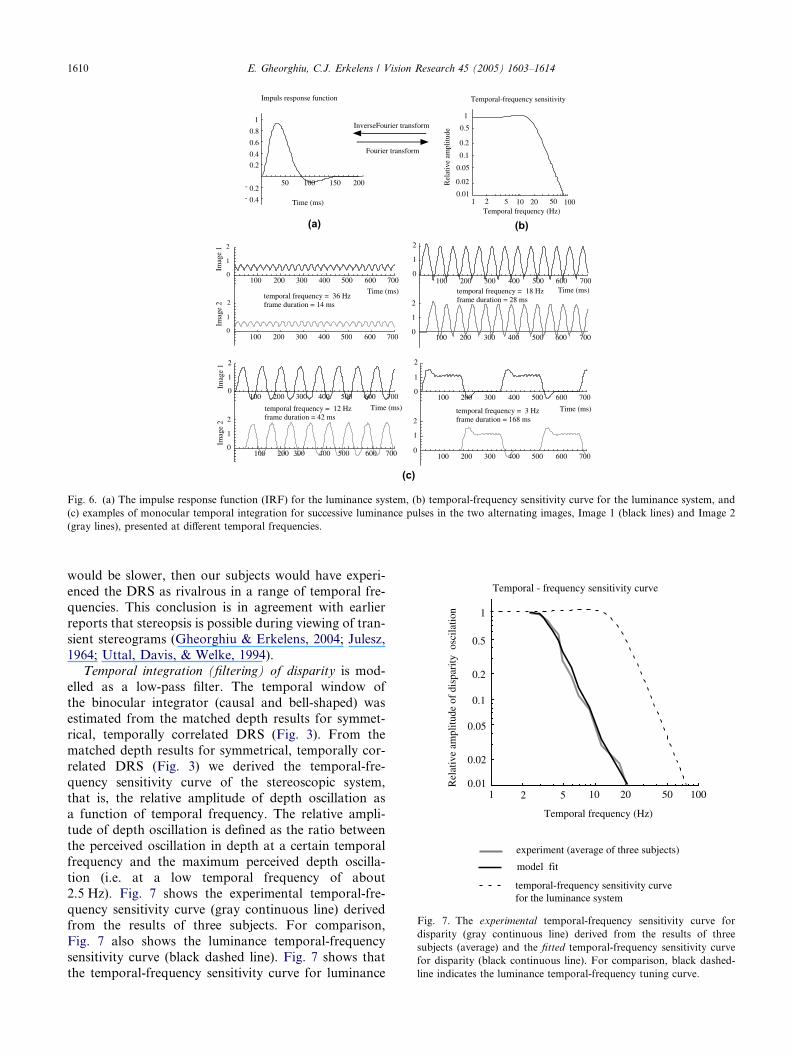
Monocular image formation is temporally limited bythe temporal integration (filtering) of luminance. Filter
characteristics are described by the impulse response
function (IRF) in the time domain and by the tempo-
ral-frequency tuning (sensitivity) function in the fre-
quency domain (Burr & Morrone, 1993; Shinomori
& Werner, 2003). An example of an IRF and its asso-
ciated temporal-frequency sensitivity curve is shown in
Fig. 6a and b. In the model, the monocular filter wasmodelled by the impulse response function (Fig. 6a).
As an illustration, Fig. 6c shows several examples of
monocular temporal integration for successive lumi-
nance pulses in the two alternating images (Image 1
and Image 2, respectively), presented at different tem-
poral frequencies. These examples show that DRS
can be regarded as static above about 20 Hz. It is
important to mention that temporal integration ofluminance cannot explain the gradual depth changes
shown in Fig. 3 for temporally correlated DRS, be-
cause (i) the depth changes occur at much too low
temporal frequencies, and (ii) luminance integration
smoothes changes in brightness but not in perceived
location.
Disparity detection may also limit the temporal prop-
erties of stereopsis. However, disparity detection mustbe faster than 25 ms, the time period associated with
the temporal frequency of 20 Hz. If disparity detection
Depth&
Stereomotion indepth
dD dt
Time (ms)
temporal integrationof disparity
binocular
poral processing of disparity in DRS, namely temporal integration of
arity (at identical locations).
Temporal frequency (Hz)
Rel
ativ
e am
plitu
de o
f di
spar
ity o
scila
tion
1 2 5 10 20 500.01
0.02
0.05
0.1
0.2
0.5
1
100
Temporal - frequency sensitivity curve
model fit
experiment (average of three subjects)
temporal-frequency sensitivity curvefor the luminance system
Fig. 7. The experimental temporal-frequency sensitivity curve for
disparity (gray continuous line) derived from the results of three
subjects (average) and the fitted temporal-frequency sensitivity curve
for disparity (black continuous line). For comparison, black dashed-
line indicates the luminance temporal-frequency tuning curve.
(a)
Time (ms)- 0.4
- 0.2
0.2
0.4
0.6
0.8
1
50 100 150 200
Impuls response function
Fourier transform
InverseFourier transform
1 2 5 10 20 50 100
0.02
0.05
0.1
0.2
0.5
1
0.01
Temporal frequency (Hz)
Temporal-frequency sensitivity
Rel
ativ
e am
plitu
de
(b)
temporal frequency = 36 Hzframe duration = 14 ms
0
2
0
1
2
Time (ms)
100 200 300 400 500 600 700
100 200 300 400 500 600 700
1
Imag
e 2
Imag
e 1
temporal frequency = 12 Hzframe duration = 42 ms
100 200 300 400 500 600 700 0
1
2
0
1
2
100 200 300 400 500 600 700
Imag
e 2
Imag
e 1
Time (ms)
temporal frequency = 18 Hzframe duration = 28 ms
100 200 300 400 500 600 700
0
1
2
0
1
2
100 200 300 400 500 600 700
Time (ms)
temporal frequency = 3 Hzframe duration = 168 ms
100 200 300 400 500 600 700
0
1
2
Time (ms)
100 200 300 400 500 600 700
0
1
2
(c)
Fig. 6. (a) The impulse response function (IRF) for the luminance system, (b) temporal-frequency sensitivity curve for the luminance system, and
(c) examples of monocular temporal integration for successive luminance pulses in the two alternating images, Image 1 (black lines) and Image 2
(gray lines), presented at different temporal frequencies.
1610 E. Gheorghiu, C.J. Erkelens / Vision Research 45 (2005) 1603–1614
would be slower, then our subjects would have experi-
enced the DRS as rivalrous in a range of temporal fre-
quencies. This conclusion is in agreement with earlier
reports that stereopsis is possible during viewing of tran-
sient stereograms (Gheorghiu & Erkelens, 2004; Julesz,
1964; Uttal, Davis, & Welke, 1994).Temporal integration (filtering) of disparity is mod-
elled as a low-pass filter. The temporal window of
the binocular integrator (causal and bell-shaped) was
estimated from the matched depth results for symmet-
rical, temporally correlated DRS (Fig. 3). From the
matched depth results for symmetrical, temporally cor-
related DRS (Fig. 3) we derived the temporal-fre-
quency sensitivity curve of the stereoscopic system,that is, the relative amplitude of depth oscillation as
a function of temporal frequency. The relative ampli-
tude of depth oscillation is defined as the ratio between
the perceived oscillation in depth at a certain temporal
frequency and the maximum perceived depth oscilla-
tion (i.e. at a low temporal frequency of about
2.5 Hz). Fig. 7 shows the experimental temporal-fre-
quency sensitivity curve (gray continuous line) derivedfrom the results of three subjects. For comparison,
Fig. 7 also shows the luminance temporal-frequency
sensitivity curve (black dashed line). Fig. 7 shows that
the temporal-frequency sensitivity curve for luminance
200 400 600 800 1000
10
20
30
40
50
0disp
arity
(ar
cmin
)
0
disp
arity
(ar
cmin
)200 400 600 800 1000
10
20
30
40
50
Frame duration = 70 msTemporal frequency = 7 Hz
200 400 600 800
10
20
30
40
50
01000
disp
arity
(ar
cmin
)
0
disp
arity
(ar
cmin
)
200 400 600 800 1000
10
20
30
40
50
Frame duration = 98 msTemporal frequency = 5 Hz
0 200 400 600 800 1000
10
20
30
40
50
disp
arity
(ar
cmin
)
0200 400 600 800 1000
10
20
30
40
50
disp
arity
(ar
cmin
)
Frame duration = 126 msTemporal frequency = 4 Hz
Frame duration = 168 msTemporal frequency = 3 Hz
0disp
arity
(ar
cmin
)
200 400 600 800 1000
10
20
30
40
50
Time (ms)
200 400 600 800
10
20
30
40
50
0
Time (ms)
disp
arity
(ar
cmin
)
1000
200 400 600 800 1000
10
20
30
40
50
0
disp
arity
(ar
cmin
)
0200 400 600 800 1000
10
20
30
40
50
disp
arity
(ar
cmin
)
Frame duration = 56 msTemporal frequency = 9 Hz
output of the binocular temporal filter Time (ms)
0100 200 300 400 500 600
- 0.2
0.2
0.4
0.6
0.8
1 binocular temporal filter
input to the binocular temporal filter
output of the binocular temporal filter
input to the binocular temporal filter
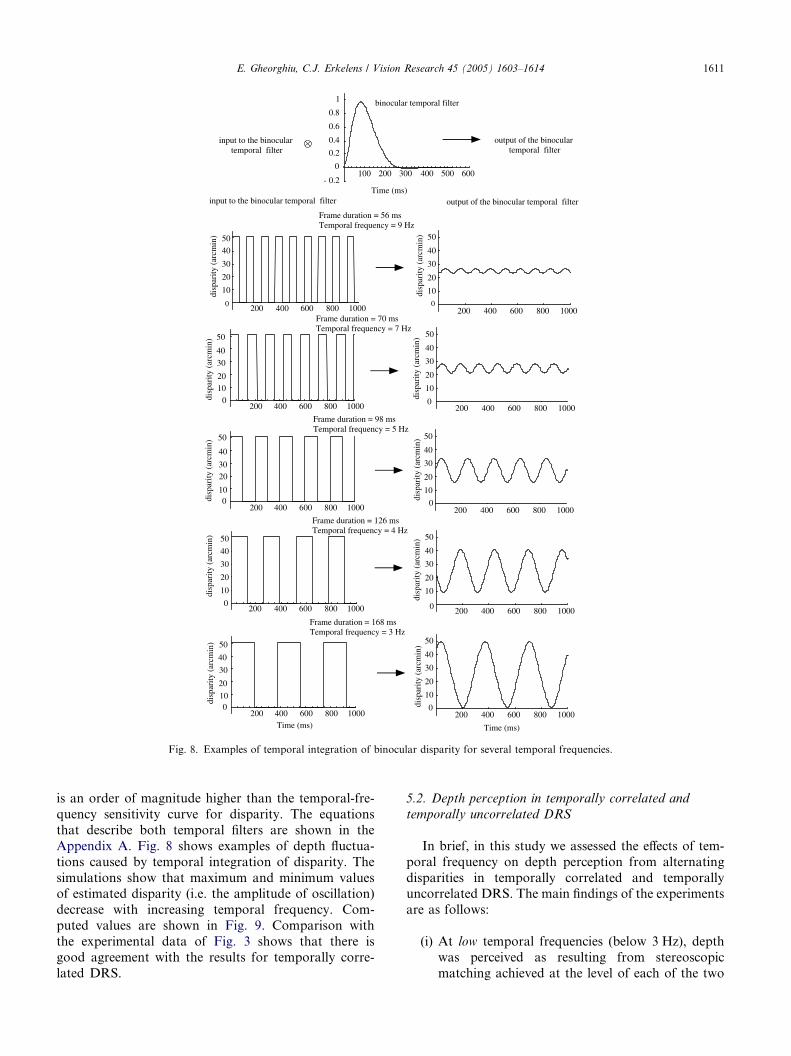
Fig. 8. Examples of temporal integration of binocular disparity for several temporal frequencies.
E. Gheorghiu, C.J. Erkelens / Vision Research 45 (2005) 1603–1614 1611
is an order of magnitude higher than the temporal-fre-
quency sensitivity curve for disparity. The equations
that describe both temporal filters are shown in the
Appendix A. Fig. 8 shows examples of depth fluctua-
tions caused by temporal integration of disparity. The
simulations show that maximum and minimum valuesof estimated disparity (i.e. the amplitude of oscillation)
decrease with increasing temporal frequency. Com-
puted values are shown in Fig. 9. Comparison with
the experimental data of Fig. 3 shows that there is
good agreement with the results for temporally corre-
lated DRS.
5.2. Depth perception in temporally correlated and
temporally uncorrelated DRS
In brief, in this study we assessed the effects of tem-
poral frequency on depth perception from alternating
disparities in temporally correlated and temporallyuncorrelated DRS. The main findings of the experiments
are as follows:
(i) At low temporal frequencies (below 3 Hz), depth
was perceived as resulting from stereoscopic
matching achieved at the level of each of the two
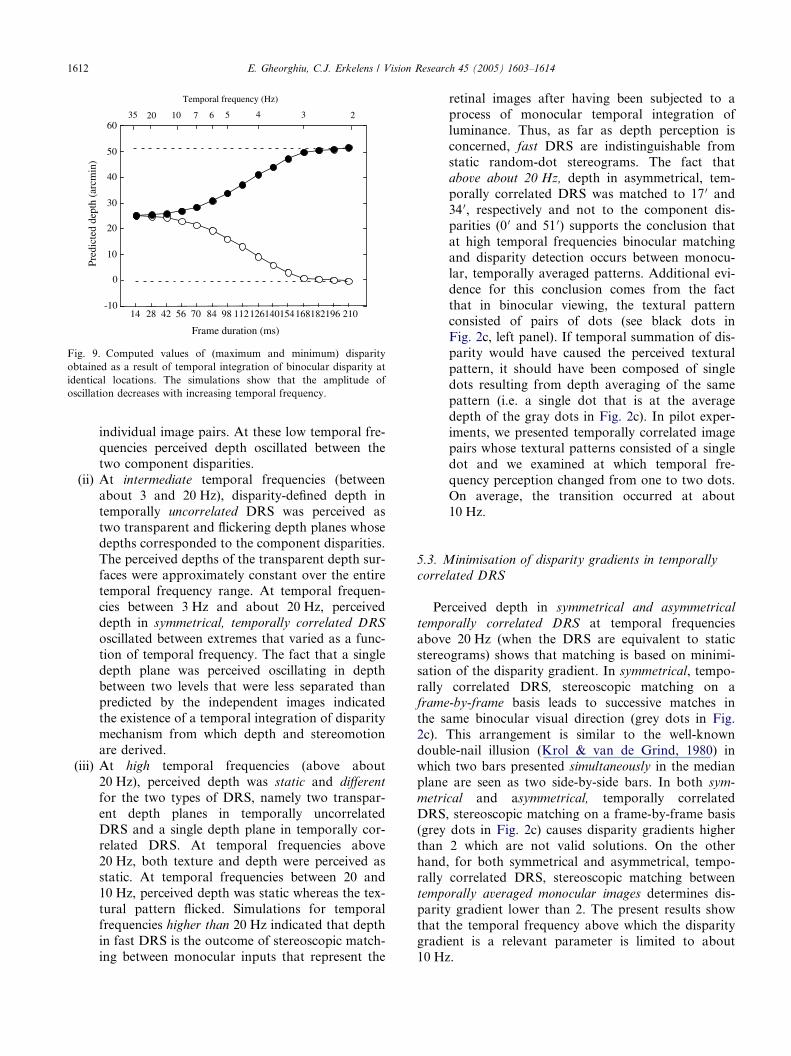
Pred
icte
d de
pth
(arc
min
)
Frame duration (ms)
Temporal frequency (Hz)
14 28 42 56 70 84 98 112126140154168182196 210-10
0
10
20
30
40
50
6035 20 7 5 4 3 210 6
Fig. 9. Computed values of (maximum and minimum) disparity
obtained as a result of temporal integration of binocular disparity at
identical locations. The simulations show that the amplitude of
oscillation decreases with increasing temporal frequency.
1612 E. Gheorghiu, C.J. Erkelens / Vision Research 45 (2005) 1603–1614
individual image pairs. At these low temporal fre-
quencies perceived depth oscillated between thetwo component disparities.
(ii) At intermediate temporal frequencies (between
about 3 and 20 Hz), disparity-defined depth in
temporally uncorrelated DRS was perceived as
two transparent and flickering depth planes whose
depths corresponded to the component disparities.
The perceived depths of the transparent depth sur-
faces were approximately constant over the entiretemporal frequency range. At temporal frequen-
cies between 3 Hz and about 20 Hz, perceived
depth in symmetrical, temporally correlated DRS
oscillated between extremes that varied as a func-
tion of temporal frequency. The fact that a single
depth plane was perceived oscillating in depth
between two levels that were less separated than
predicted by the independent images indicatedthe existence of a temporal integration of disparity
mechanism from which depth and stereomotion
are derived.
(iii) At high temporal frequencies (above about
20 Hz), perceived depth was static and different
for the two types of DRS, namely two transpar-
ent depth planes in temporally uncorrelated
DRS and a single depth plane in temporally cor-related DRS. At temporal frequencies above
20 Hz, both texture and depth were perceived as
static. At temporal frequencies between 20 and
10 Hz, perceived depth was static whereas the tex-
tural pattern flicked. Simulations for temporal
frequencies higher than 20 Hz indicated that depth
in fast DRS is the outcome of stereoscopic match-
ing between monocular inputs that represent the
retinal images after having been subjected to a
process of monocular temporal integration of
luminance. Thus, as far as depth perception is
concerned, fast DRS are indistinguishable from
static random-dot stereograms. The fact that
above about 20 Hz, depth in asymmetrical, tem-porally correlated DRS was matched to 17 0 and
34 0, respectively and not to the component dis-
parities (0 0 and 51 0) supports the conclusion that
at high temporal frequencies binocular matching
and disparity detection occurs between monocu-
lar, temporally averaged patterns. Additional evi-
dence for this conclusion comes from the fact
that in binocular viewing, the textural patternconsisted of pairs of dots (see black dots in
Fig. 2c, left panel). If temporal summation of dis-
parity would have caused the perceived textural
pattern, it should have been composed of single
dots resulting from depth averaging of the same
pattern (i.e. a single dot that is at the average
depth of the gray dots in Fig. 2c). In pilot exper-
iments, we presented temporally correlated imagepairs whose textural patterns consisted of a single
dot and we examined at which temporal fre-
quency perception changed from one to two dots.
On average, the transition occurred at about
10 Hz.
5.3. Minimisation of disparity gradients in temporally
correlated DRS
Perceived depth in symmetrical and asymmetrical
temporally correlated DRS at temporal frequencies
above 20 Hz (when the DRS are equivalent to static
stereograms) shows that matching is based on minimi-
sation of the disparity gradient. In symmetrical, tempo-
rally correlated DRS, stereoscopic matching on aframe-by-frame basis leads to successive matches in
the same binocular visual direction (grey dots in Fig.
2c). This arrangement is similar to the well-known
double-nail illusion (Krol & van de Grind, 1980) in
which two bars presented simultaneously in the median
plane are seen as two side-by-side bars. In both sym-
metrical and asymmetrical, temporally correlated
DRS, stereoscopic matching on a frame-by-frame basis(grey dots in Fig. 2c) causes disparity gradients higher
than 2 which are not valid solutions. On the other
hand, for both symmetrical and asymmetrical, tempo-
rally correlated DRS, stereoscopic matching between
temporally averaged monocular images determines dis-
parity gradient lower than 2. The present results show
that the temporal frequency above which the disparity
gradient is a relevant parameter is limited to about10 Hz.

E. Gheorghiu, C.J. Erkelens / Vision Research 45 (2005) 1603–1614 1613
5.4. Mechanisms for dynamic depth and stereoscopic
motion in depth perception
In the psychophysical literature, it has been suggested
that two mechanisms could be used for stereomotion
detection: (a) a mechanism sensitive to temporal changes
of binocular disparity (Cumming, 1995; Cumming &
Parker, 1994; Lages, Mamasian, & Graph, 2003; Norcia
& Tyler, 1984; Regan, 1993; Tyler, 1971). This mecha-
nism first detects disparities and then computes motion-
in-depth from their changes in time. This mechanism
can contribute to motion-in-depth in both temporally
correlated and temporally uncorrelatedDRS, (b) a mech-
anism sensitive to interocular velocity differences (Regan,1991; Regan & Beverley, 1979; Regan, Beverley, &
Cynader, 1979; Shioiri, Saisho, & Yaguchi, 2000). This
mechanism first detects monocular motion (velocity sig-
nals) separately in the two eyes and then computes mo-
tion-in-depth from the interocular velocity differences.
In the latter model, depth and motion-in-depth are com-
puted by independent mechanisms (Cumming & Parker,
1994). It is highly unlikely that interocular motion pro-cessing contributed to our results. One should be aware
of the fact that this system can only contribute to
motion-in-depth in temporally correlated DRS. The dis-
placements of the dots in the temporally correlated
DRS, however, were so large (25.5 0) that the monocular
images of these DRS did not induce monocular lateral
motion. Therefore, it is unlikely that interocular motion
processing system contributed much to motion-in-depth.Furthermore, one would expect motion-in-depth
between the component disparities in temporally corre-
lated DRS to be superior to that in temporally uncorre-
lated DRS. However, the reverse was the case. Our
results showed that stereomotion in temporally corre-
lated DRS, was perceived as depth modulations between
two depth planes that were less separated than predicted
by disparity in the independent images. Our simulationssuggested that the reduction in stereomotion results from
temporal integration of disparity. We suggest that the
differences in perceived depth for temporally correlated
and temporally uncorrelated DRS reported by Cumming
and Parker (1994) and Allison and Howard (2000) are
caused by temporal integration of disparity.
It has been suggested in the psychophysical literature
that even if motion-in-depth is based on dynamicchanges in disparity, it is still possible that these dy-
namic changes are detected by a mechanism that is inde-
pendent of the one that detects static disparities (Regan,
Erkelens, & Collewijn, 1986). However, Cumming
(1995) and Cumming and Parker (1994) suggested that
motion-in-depth relies on registering changes in the out-
put of the same disparity detectors as those that are used
to detect static disparity. Recently, neurophysiologicalexperiments (Nienborg, Bridge, Parker, & Cumming,
2004) showed that the temporal frequency up to which
disparity selective V1 neurons were able to modulate
their response in relation to disparity modulation was
10 Hz. This value was lower than the high cut-off fre-
quency in response to drifting luminance gratings. These
authors suggested that the difference might reflect thetime constant of some input elements. Nienborg et al.
(2004) highlighted the possibility that the output time
constant of disparity selective neurons in V1 limits tem-
poral resolution for disparity. In brief, these authors
suggested that the temporal resolution for detecting
modulation of disparity is limited by the temporal fre-
quency up to which disparity selective V1 neurons are
able to modulate their response.
Acknowledgements
This research was supported by the Netherlands
Organisation for Scientific Research (NWO). We wish
to thank the two anonymous referees for helpful
comments on the manuscript.
Appendix A
The equations that describe the monocular and bin-
ocular temporal filters are as follows. The monocular
temporal filter was modelled by the impulse response
function that is well approximated by an exponentiallydamped, frequency-modulated sinusoid:
MFðtÞ ¼ a0HðtÞt sinf2p½a1tðt þ 1Þa2 g expða3tÞ;where t is time, H(t) is the Heaviside function, i.e.,
H(t) = 0, for t < 0 and H(t) = 1 for t P 0.
The parameters a0, a1, a2 and a3 are all positive witha0 defining the overall gain, a1 the fundamental fre-
quency of oscillation, a2 the modulation frequency over
time and, a3 the steepness of the decay. In model simu-
lations a0 = 1/10, a1 = 1/180, a2 = 0, and a3 = 1/30.
The binocular temporal filter was approximated
by a similar function:
BFðtÞ ¼ b0HðtÞt sinf2p½b1tðt þ 1Þb2 g expðb3tÞ;
where t is time, b0 = 1/14, b1 = 1/510, b2 = 0, and b3 =
1/50.
References
Allison, R. S., & Howard, I. P. (2000). Stereopsis with persisting and
dynamic textures. Vision Research, 40, 3823–3827.
Barlow, H. B., Blakemore, C., & Pettigrew, J. D. (1967). The neural
mechanism of binocular depth discrimination. Journal of Physiol-
ogy, 193, 327–342.
Beverley, K. I., & Regan, D. (1974). Temporal integration of disparity in
stereoscopic perception. Experimental Brain Research, 19, 228–232.
1614 E. Gheorghiu, C.J. Erkelens / Vision Research 45 (2005) 1603–1614
Burr, D. C., & Morrone, M. C. (1993). Impulse-response functions for
chromatic and achromatic stimuli. Journal of Optical Society of
America, A10, 1706–1713.
Chichilinisky, E. J., & Kalmar, R. S. (2002). Functional asymmetries in
on and off ganglion cells of primate retina. Journal of Neuroscience,
22(7), 2737–2747.
Cumming, B. G. (1995). The relationship between stereoacuity and
stereomotion thresholds. Perception, 24, 105–114.
Cumming, B. G., & Parker, A. J. (1994). Binocular mechanisms for
detecting motion-in-depth. Vision Research, 34, 483–495.
DeAngelis, G. C., Ohzawa, I., & Freeman, R. D. (1991). Depth is
encoded in the visual cortex by a specialised receptive field
structure. Nature, 352, 156–159.
Gheorghiu, E., & Erkelens, C. J. (2004). Spatial-scale interaction in
human stereoscopic vision in response to sustained and transient
stimuli. Vision Research, 44, 563–575.
Howard, I. P., & Rogers, B. J. (2002). Seeing in depth. In I. Porteous
(Ed.). Depth perception (vol. 2). University of Toronto Press.
Hubel, D. C., & Livingstone, M. S. (1987). Segregation of form,
colour, and stereopsis in primate area 18. Journal of Neuroscience,
7, 3378–3415.
Ikeda, M. (1965). Temporal summation of positive and negative
flashes in the visual system. Journal of Optical Society of America,
55, 1527–1534.
Ikeda, M. (1986). Temporal impulse response. Vision Research, 26,
1431–1440.
Julesz, B. (1960). Binocular depth perception of computer generated
patterns. Bell Systems Technical Journal, 39, 1125–1162.
Julesz, B. (1964). Binocular depth perception without familiarity cues.
Science, 145, 356–362.
Kremers, J., Lee, B. B., Pokorny, J., & Smith, V. C. (1993). Responses
of macaque ganglion cells and human observers to compound
periodic waveforms. Vision Research, 33, 1997–2011.
Krol, J. D., & van de Grind, W. A. (1980). The double-nail illusion:
Experiments on binocular vision with nails, needles and pins.
Perception, 9, 651–669.
Lages, M., Mamasian, P., & Graph, E. W. (2003). Spatial and
temporal tuning of motion in depth. Vision Research, 43,
2861–2873.
Nienborg, H., Bridge, H., Parker, A. J., & Cumming, B. G. (2004).
Temporal resolution for disparity modulation may be limited by
the speed of response modulation in V1 [Abstract]. Journal of
Vision, 4(8), 170a.
Norcia, A. M., & Tyler, C. W. (1984). Temporal frequency limits for
stereoscopic apparent motion processes.Vision Research, 24, 395–401.
Patterson, R. (1999). Stereoscopic (cyclopean) motion sensing. Vision
Research, 39, 3329–3345.
Poggio, G. F., & Fisher, B. (1977). Binocular interaction and depth
sensitivity in striate and prestriate cortex of behaving rhesus
monkey. Journal of Neurophysiology, 40, 1392–1405.
Regan, D. (1991). Depth from motion and motion-in-depth. In D.
Regan (Ed.). Vision and visual dysfunctions, binocular vision (vol. 9,
pp. 137–160). London: Macmillan.
Regan, D. M. (1993). Binocular correlates of the direction of motion in
depth. Vision Research, 33, 2359–2360.
Reagan, D., & Beverley, K. I. (1973). The dissociation of sideways
movements from movements in depth: Psychophysics. Vision
Research, 13, 2703–2715.
Regan, D. M., & Beverley, K. I. (1979). Binocular and monocular
stimuli for motion in depth: Changing disparity and changing size
feed the same motion-in-depth stage. Vision Research, 19,
1331–1342.
Regan, D. M., Beverley, K. I., & Cynader, M. (1979). Separate
subsystems for position in depth and for motion in depth.
Proccedings of the Royal society of London B, 204, 485–501.
Regan, D. M., Erkelens, C. J., & Collewijn, H. (1986). Necessary
conditions for the perception of motion in depth. Investigative
Ophthalmology and Visual Science, 27, 584–597.
Shinomori, K., & Werner, J. S. (2003). Senescence of the temporal
impulse response to a luminous pulse. Vision Research, 43(6),
617–627.
Shioiri, S., Saisho, H., & Yaguchi, H. (2000). Motion in depth based
on inter-ocular velocity differences. Vision Research, 40, 2565–2572.
Swanson, W. H., Uneno, T., Smith, V. C., & Pokorny, J. (1987).
Temporal modulation sensitivity and pulse-duration thresholds for
chromatic and luminance perturbations. Journal of Optical Society
of America, A4, 1992–2005.
Tyler, C. W. (1971). Stereoscopic depth movement: two eyes less
sensitive than one. Science, 74, 958–968.
Uttal, W. R., Davis, N. S., & Welke, C. (1994). Stereoscopic
perception with brief exposures. Perception and Psychophysics,
56, 599–604.
Van Ee, R., Banks, M. S., & Backus, B. T. (1999). An analysis of
stereoscopic slant contrast. Perception, 28, 1121–1145.
Van Ee, R., & Erkelens, C. J. (1996). Anisotropy in Werner�s binoculardepth-contrast effect. Vision Research, 36, 2253–2262.
Van Ee, R., & Richards, W. (2002). A planar and a volumetric test for
stereoanomaly. Perception, 31, 51–64.
White, K. D., & Odom, J. V. (1985). Temporal integration in global
stereopsis. Perception and Psychophysics, 37, 139–144.
Copyright © 2022 FDOKUMEN