OREGON DOT
74
STRENGTH AND FATIGUE OF THREE GLASS FIBER REINFORCED COMPOSITE BRIDGE DECKS WITH MECHANICAL DECK TO STRINGER CONNECTIONS Final Report SR 500-490
-
Upload
khangminh22 -
Category
Documents
-
view
4 -
download
0
Transcript of OREGON DOT

STRENGTH AND FATIGUE OF THREE GLASS FIBER REINFORCED
COMPOSITE BRIDGE DECKS WITH MECHANICAL DECK TO STRINGER
CONNECTIONS
Final Report
SR 500-490

STRENGTH AND FATIGUE OF THREE GLASS FIBER REINFORCED COMPOSITE BRIDGE DECKS WITH
MECHANICAL DECK TO STRINGER CONNECTIONS
Final Report
SR 500-490
by Andrew Gleason, Graduate Research Assistant
Peter Dusicka, PhD PE, Associate Professor Portland State University
February 2012


i
Technical Report Documentation Page
1. Report No.
SR 500-490
2. Government Accession No.
3. Recipient’s Catalog No.
5. Report Date
February 2012
4. Title and Subtitle
Strength And Fatigue Of Three Glass Fiber Reinforced Composite Bridge Decks With Mechanical Deck To Stringer Connections 6. Performing Organization Code
7. Author(s)
Andrew Gleason, Graduate Research Assistant and Peter Dusicka, PhD PE, Associate Professor, Portland State University
8. Performing Organization Report No. SR 500-490
10. Work Unit No. (TRAIS)
9. Performing Organization Name and Address Oregon Department of Transportation Statewide Programs Unit 555 13th Street NE, Suite 2 Salem, OR 97301-4178
11. Contract or Grant No.
13. Type of Report and Period Covered Final Report
12. Sponsoring Agency Name and Address ODOT Local Government Section 4040 Fairview Industrial Dr. SE Salem, OR 97302-1142
14. Sponsoring Agency Code
15. Supplementary Notes 16. Abstract
Replacement of the steel grating deck on the lift span of the Morrison Bridge in Portland, OR, will utilize glass fiber reinforced polymer (FRP) panels to address ongoing maintenance issues of the deteriorated existing deck, improve driver safety and introduce bridge water runoff treatment. This report outlines the testing methods and results of an experimental program aimed primarily at evaluating a new open cell deck. While most FRP panels are connected via shear studs that are grouted within isolated pockets, the panels in this case were bolted directly to the steel stringers. Two different FRP deck options were evaluated for comparison: one with open cells and the other with more conventional closed box extrusions. The objective was to evaluate the strength of the FRP to steel stringer connection with individual bolt connection tests, the strength and fatigue resistance of the FRP decks themselves, and the relative lateral stiffness contribution of the panels. Additional related tests were also included to complement the research effort such as the inclusion of tests on a closed box deck removed from the Broadway Bridge in Portland, OR, and strength tests of a retrofit attachment option of FRP deck to stringer using bolted clamps.
While the monotonic, flexural, and shear strength of the deck exceeded the design values, the associated failure mode of the open cell panels was consistently via shear flow through the stem near the top flange. The residual displacement of failed FRP decks was found to be minimal, which would make visual identification of failed panels without applied load difficult in the field. Fatigue strength evaluation was conducted with two different protocols, where one was run to over 6 million cycles based on AASHTO defined loading and the other to 2 million cycles with higher than AASHTO defined loading. Fatigue failure was observed in only one specimen that was subjected to the higher loading condition, providing a sense of fatigue life of this material. Fatigue failure mode initiated in flexural fiber rupture, which was different to monotonic tests under the same loading configurations. Bolted deck to steel stringer connection tests indicated failure modes in the FRP with strength values that were in certain configurations well below the strength of the bolts. For cases where the bolted FRP deck was counted on to provide lateral stiffness, such as the case in the raised configuration of the bascule span, the closed cell was found to have approximately twice the stiffness. The results of these tests provide valuable data that can be applied to FRP bridge deck designs that utilize bolted connections and open and closed cell deck configurations under high traffic volumes.
17. Key Words
fiber reinforced polymers; bridge decks; structural connection; stringer; bolting; strength; fatigue; stiffness
18. Distribution Statement
Copies available from NTIS, and online at http://www.oregon.gov/ODOT/TD/TP_RES/
19. Security Classification (of this report)
Unclassified
20. Security Classification (of this page)
Unclassified 21. No. of Pages
74
22. Price
Technical Report Form DOT F 1700.7 (8-72) Reproduction of completed page authorized Printed on recycled paper

ii
SI* (MODERN METRIC) CONVERSION FACTORS
APPROXIMATE CONVERSIONS TO SI UNITS APPROXIMATE CONVERSIONS FROM SI UNITS
Symbol When You Know Multiply By To Find Symbol Symbol When You Know Multiply By To Find Symbol
LENGTH LENGTH
in inches 25.4 millimeters mm mm millimeters 0.039 inches in ft feet 0.305 meters m m meters 3.28 feet ft yd yards 0.914 meters m m meters 1.09 yards yd mi miles 1.61 kilometers km km kilometers 0.621 miles mi
AREA AREA
in2 square inches 645.2 millimeters squared mm2 mm2 millimeters squared 0.0016 square inches in2
ft2 square feet 0.093 meters squared m2 m2 meters squared 10.764 square feet ft2 yd2 square yards 0.836 meters squared m2 m2 meters squared 1.196 square yards yd2 ac acres 0.405 hectares ha ha hectares 2.47 acres ac mi2 square miles 2.59 kilometers squared km2 km2 kilometers squared 0.386 square miles mi2
VOLUME VOLUME fl oz fluid ounces 29.57 milliliters ml ml milliliters 0.034 fluid ounces fl oz gal gallons 3.785 liters L L liters 0.264 gallons gal ft3 cubic feet 0.028 meters cubed m3 m3 meters cubed 35.315 cubic feet ft3 yd3 cubic yards 0.765 meters cubed m3 m3 meters cubed 1.308 cubic yards yd3
NOTE: Volumes greater than 1000 L shall be shown in m3.
MASS MASS oz ounces 28.35 grams g g grams 0.035 ounces oz lb pounds 0.454 kilograms kg kg kilograms 2.205 pounds lb T short tons (2000 lb) 0.907 megagrams Mg Mg megagrams 1.102 short tons (2000 lb) T
TEMPERATURE (exact) TEMPERATURE (exact)
°F Fahrenheit (F-32)/1.8 Celsius °C °C Celsius 1.8C+32 Fahrenheit °F
*SI is the symbol for the International System of Measurement

iii
ACKNOWLEDGEMENTS
Grateful recognition is given to the Oregon Department of Transportation for sponsoring this research project. The support and assistance of the Multnomah County Bridge Section in acquiring and assembling many of the test specimens is also greatly appreciated, specifically, Kenneth Huntley for his support in this effort. Special thanks to the Portland State University Department of Civil and Environmental Engineering faculty, staff, and students especially those involved in the infraStructure Testing and Applied Research Laboratory for their assistance and support, especially during the grueling fatigue tests.
DISCLAIMER
This document is disseminated under the sponsorship of the Oregon Department of Transportation and the United States Department of Transportation in the interest of information exchange. The State of Oregon and the United States Government assume no liability of its contents or use thereof.
The contents of this report reflect the view of the authors who are solely responsible for the facts and accuracy of the material presented. The contents do not necessarily reflect the official views of the Oregon Department of Transportation or the United States Department of Transportation.
The State of Oregon and the United States Government do not endorse products of manufacturers. Trademarks or manufacturers’ names appear herein only because they are considered essential to the object of this document.
This report does not constitute a standard, specification, or regulation.

iv
TABLE OF CONTENTS
1.0 OVERVIEW AND REPORT STRUCTURE................................................................. 1
2.0 INTRODUCTION............................................................................................................. 3
2.1 THE MORRISON BRIDGE................................................................................................... 3 2.2 FIBER REINFORCED POLYMER DECK ALTERNATIVES...................................................... 4
2.2.1 Brief History of the Use, Benefits, and Limitations of FRP Bridge Deck..............................................4 2.2.2 Morrison Bridge FRP Deck Options .....................................................................................................6
2.3 GENERAL FRP CONCERNS AND RESEARCH NEEDS.......................................................... 7 2.4 RESEARCH OBJECTIVES OF THIS REPORT ......................................................................... 7
3.0 EXPERIMENTAL SETUP .............................................................................................. 9
3.1 DECK DESCRIPTION ....................................................................................................... 10 3.2 SPECIMEN DESCRIPTION ................................................................................................ 11
3.2.1 Martin Marietta Specimens .................................................................................................................11 3.2.2 ZellComp Specimens............................................................................................................................13 3.2.3 Modified ZellComp Specimens ............................................................................................................15
3.3 LOADING PROGRAM....................................................................................................... 18 3.3.1 Load Orientations................................................................................................................................18 3.3.2 Deck Displacement Measurements......................................................................................................18 3.3.3 Fatigue Testing Approach ...................................................................................................................19 3.3.4 Martin Marietta Loading Program .....................................................................................................20 3.3.5 ZellComp Loading Program................................................................................................................22 3.3.6 Modified ZellComp Loading Program ................................................................................................25
4.0 TEST RESULTS ............................................................................................................. 27
4.1 MARTIN MARIETTA ....................................................................................................... 27 4.1.1 Destructive Tests..................................................................................................................................27 4.1.2 Nondestructive tests .............................................................................................................................30
4.2 ZELLCOMP..................................................................................................................... 31 4.2.1 Destructive Tests..................................................................................................................................31 4.2.2 Nondestructive Tests ............................................................................................................................32
4.3 MODIFIED ZELLCOMP.................................................................................................... 33 4.3.1 Destructive Tests..................................................................................................................................33 4.3.2 Nondestructive Tests ............................................................................................................................37
5.0 DISCUSSION .................................................................................................................. 39
5.1 LOAD SHARING FOR MODIFIED ZELLCOMP ................................................................... 39 5.2 FLEXURE STRESS AND SHEAR FLOW FOR MODIFIED ZELLCOMP.................................. 41 5.3 FLEXURE STRENGTH COMPARISON ................................................................................ 42 5.4 STIFFNESS COMPARISON ................................................................................................ 43 5.5 OVERLAY OBSERVATIONS ............................................................................................. 44 5.6 FATIGUE OBSERVATIONS ............................................................................................... 45 5.7 CONNECTION EVALUATION............................................................................................ 47 5.8 BOLT PULL COMPARISON .............................................................................................. 48 5.9 DECK-TO-STRINGER CONNECTION COMPARISON.......................................................... 49

v
5.10 STRINGER TO DECK CLAMP .......................................................................................... 52 5.11 DIAPHRAGM EFFECTIVENESS EVALUATION ................................................................... 53
6.0 SUMMARY AND CONCLUSIONS ............................................................................. 55
7.0 AREAS OF FUTURE RESEARCH NEEDS................................................................ 57
8.0 REFERENCES................................................................................................................ 59
APPENDIX A – LATERAL TEST FRAME STIFFNESS

vi

1
1.0 OVERVIEW AND REPORT STRUCTURE
The research contained in this report was meant to not only advance the state of knowledge of FRP deck behavior in the near future, but primarily to be part of the immediate need of aiding Multnomah County decisions during the design process for the bridge deck replacement on the Morrison Bridge. The main body of the report consists of a description and the results of an experimental program that considered three fiber reinforced polymer (FRP) bridge deck panels, namely a Martin Marietta, ZellComp, and modified ZellComp panel. The modified ZellComp panel was effectively an inverted partial panel of ZellComp, which resulted in a shallower open bottom deck panel. Tests in excess of those originally proposed were conducted on these types of panels in order to fully understand the various loading conditions and behavior. As the preliminary results influenced the design process for the Morrison Bridge, further additional tests on the original ZellComp deck as well as on the Martin Marietta deck used on the Broadway Bridge were completed. These were for the most part completed within the budgetary scope of the original proposal and allowed the results and performance to be effectively compared.

2

3
2.0 INTRODUCTION
2.1 THE MORRISON BRIDGE
The Morrison Bridge of Portland, Oregon is undergoing a retrofit of the steel-grating deck on the draw span by Multnomah County. This report details an experimental program sponsored by the Oregon Department of Transportation and undertaken by the infraStructure Testing and Applied Research Laboratory at Portland State University in collaboration with Multnomah County, which influenced the deck replacement selection during the design stage. The pre-retrofit version of the Morrison Bridge was completed in the late 1950s. The draw span incorporated a 144.3mm (4.5 in) thick steel-grating deck. Pictures of the Morrison Bridge (TripWow 2012, Fanpop 2009) and a schematic of the draw span cross section provided by Multnomah County are shown in Fig. 1.
Several factors have prompted Multnomah County to retrofit the deck. In recent years, the steel-grating deck experienced deterioration under the environmental conditions of the Portland area. Weathering and rust caused cracking to form in the steel-grating deck. Significant time and resources were required for ongoing bridge inspection and maintenance. This issue was an initial factor in the decision to replace the deck.
The slickness of the steel-grating, especially when wet, has been an influence in several car crashes. For example, in March, 2005 one driver lost control on the wet surface and plunged into the Willamette River below (Learn 2011). Fortunately, the driver escaped through the broken windshield and no loss of life occurred. In addition to the safety issues associated with vehicular traffic, motorcyclists and bicyclists find the steel-grating particularly hazardous to cross. This problem influenced both the decision to replace the deck and also deck replacement type.
Another consideration associated with the steel-grating deck was vehicular byproducts containment. As rain water flowed through the deck, significant amounts of vehicle pollution were being carried into the Willamette River. By replacing the steel-grating with a solid surface, all of the rain water can be collected and treated before flowing into the river.

4
Fig. 1: Morrison Bridge (drawings courtesy of Multnomah County)
Replacement of the deck led to design challenges. With safety and environmental issues being a main concern, a solid deck was desired. Staying near the previous 144.3mm (4.5 in) thickness was also desired since this would decrease the amount of bridge modifications and construction time required. Finally, meeting the weight limitations of the draw span was crucial to making the project attainable. With the aforementioned factors of maintenance, roadway safety, environmental concerns, space restrictions, and weight-to-strength characteristics, a solution involving fiber reinforce polymer (FRP) bridge deck was sought.
2.2 FIBER REINFORCED POLYMER DECK ALTERNATIVES
2.2.1 Brief History of the Use, Benefits, and Limitations of FRP Bridge Deck
With the decision to use a FRP deck, an investigation into the common themes associated with FRP decking was needed. Topics which were relevant to the Morrison Bridge included – strength-to-weight, deflection, typical cross sections, connections, fatigue, overlay, and use in a draw span.

5
Fiber reinforced polymer (FRP) bridge decks have become an attractive option for bridge deck replacements (Zureick, Shih and Munley 1995). Due to the higher strength-to-weight ratio compared to conventional decks, FRP decks may increase the live load capacity for a retrofit and reduce the required supporting structure in a new bridge design (Reising, et al. 2004). The lightweight, prefabricated FRP panels allow for quality control and quick installation. A FRP deck provides a safer riding surface than a comparable steel grating deck. Environmental durability and corrosion resistance make FRP ideal for harsh weather conditions.
Several challenges arise when using FRP decks. The case-by-case basis by which FRP decks are designed have led to an inconsistency in deflection specifications (Bakis, et al. 2002), where deflection ranges have been estimated to vary from L/450 to L/1300 (Brown and Berman 2010). The suggested deflection limit for steel, aluminum and concrete decks under live load is L/800 (AASHTO 2010). This limitation has a basis in vibration response (Machado, Sotelino and Liu 2008). Since FRP has significantly different vibration characteristics than steel, aluminum, and reinforced concrete, the limitation of L/800 may not be appropriate for FRP. The suggestion has been made to drop the requirement to L/500 (Telang, et al. 2006).
Deflection limitations are further complicated when considering the FRP design process, which is wrought with possible inaccuracies (Daniel and Ishai 1994), giving only a range of values for desired information such as strength or deflection. This fact forces designers to incorporate additional experimental or analytical methods (Machado, Sotelino and Liu 2008). Design and fabrication costs have long discouraged FRP deck applications. However, even with the design challenges and implementation costs, specialized circumstances can make FRP decks a desirable and cost effective option.
As the use of FRP decks has started to become more common, several trends have grown to be apparent. The typical cross sections of pultruded FRP decks include honeycomb sandwich, solid core sandwich, and hollow core sandwich (Bakis, et al. 2002, Reising, et al. 2004, Brown and Berman 2010, Alagusundaramoorthy, Harik and Choo 2006, Telang, et al. 2006). These readily lend themselves to the analysis assumption of orthogonal plates because of the plate like qualities, (Davalos, et al. 1996). Panel-to-panel connections are usually made with either adhesive (Reising, et al. 2004) or mechanical connections (Brown and Berman 2010, Telang, et al. 2006). Connecting a panel to stringer is normally done with shear studs, bolts, or a bolt and lock plate combination (Brown and Berman 2010). Typically, the deck and stringer are not assumed to act compositely.
Another common issue with FRP decks is the uncertainty in fatigue performance. Fatigue issues that can arise when using FRP decks include stiffness degradation (Dutta, Lopez-Anido and Kwon 2007); local failures around joints, connections and details (Brown and Berman 2010, Reynaud and Karbhari 2001); and degradation of composite action between deck and stringer (Moses, et al. 2006). All of these contribute to making the structure more susceptible to failure. Numerous research efforts have addressed the lack of fatigue testing standards and experimental data on FRP decks (Brown and Berman 2010, Dutta, Lopez-Anido and Kwon 2007, Daly and Cuninghame 2006, Kumar, Chandrashekhara and Nanni 2004).
The Highway Innovative Technology Evaluation Center (HITEC) has proposed a FRP fatigue testing procedure (Reynaud and Karbhari 2001). The premise of the HITEC procedure assumes

6
that the FRP itself will be able to withstand the fatigue demands. This assumption is usually good for two reasons. First, FRP materials have been proven to withstand fatigue in applications other than bridge decks. Second, deflection limits predominantly control the design of FRP bridge decks giving an overabundance of strength. Thus, fatigue failure is assumed to be concentrated in local areas around joints and connections. The HITEC procedure, therefore, focuses on testing the deck assembly rather than the deck fatigue strength. Another fatigue testing procedure is presented in AASHTO (AASHTO 2010).
In addition to the aforementioned topics, deck overlay is usually a prominent FRP deck subject of interest. Overlays can significantly contribute stiffness to FRP decks, whereas overlays on reinforced concrete decks are typically neglected (Cai, Oghumu and Meggers 2009). Common problems with overlays include delamination from the FRP deck and cracking (Reising, et al. 2004). Since stiffness is often a controlling factor in FRP decks, quantifying the overlay’s stiffness contribution is important. However, the long term effectiveness of the overlay must be considered before the stiffness contribution can be included in design.
2.2.2 Morrison Bridge FRP Deck Options
Three FRP deck options were considered for the Morrison Bridge and are shown in Fig. 2. One deck option was designed by Martin Marietta Materials (see Fig. 2(a)). This option used a closed celled pultruded cross section and adhesively bonded connection between panels. Another option was the deck designed by ZellComp Inc. (see Fig. 2(b)). The ZellComp deck is delivered open celled with mechanical connections between panels. After installation, an additional FRP sheet is mechanically connected across the panels making the cross section closed. Implementation of these options were accomplished with little or no additional tests because both of these options had gone through manufacturer testing and independent research investigation (Brown and Berman 2010, Hong and Hastak 2006). Thus, only a few selected tests were performed on these decks in order to address the evolving design process for the Morrison Bridge application.
Fig. 2: FRP deck options
A third and non-conventional option was considered by Multnomah County. This option, referred to as modified ZellComp, was a variation of the ZellComp deck and is depicted in Fig. 2(c). In order to allow easy access and inspection, the deck was inverted and the attached FRP sheet was eliminated. This approach had several advantages over the other two more conventional options. First, the height of the deck matched the previous steel-grading height, resulting in minimal bridge modifications to fit the new deck. Second, the modified ZellComp deck was very close to the previous weight of the steel-grading deck. Using the modified ZellComp deck would allow replacement of the deck without adding any structural reinforcement or counter weights. Third, this open web approach would allow easy installation and inspection. The main issue with the modified ZellComp was that this approach had not been considered, tested or implemented before. Therefore, the majority of the tests discussed in this report were conducted on the modified ZellComp deck.

7
2.3 GENERAL FRP CONCERNS AND RESEARCH NEEDS
As stated previously, both the Martin Marietta and ZellComp decks did not require extensive additional testing. The main testing need for these decks was a fatigue test which would validate using the deck under the expected Morrison Bridge traffic demand. Some additional strength and stiffness tests were added because of easy access to the fatigue specimen. In addition, selected connection strength tests were desired to validate the deck-to-stringer connection approach.
The modified ZellComp option needed to be thoroughly evaluated for use in the Morrison Bridge since this was the first time that ZellComp had been used in this way. Unlike the majority of FRP decks, the intended implementation of the modified Zellcomp featured an open cell pultruded cross section, bolted connection from deck to stringer without lock plates, and bearing lap joints. In general, these characteristics were not typical for FRP decks. With these issues in mind, the modified ZellComp research areas were as follows:
strength
load sharing within panels
load sharing between panels
stiffness based on load orientation and placement
overlay contributions to stiffness
fatigue
strength of deck-to-stringer connections
response of the system to lateral loads
2.4 RESEARCH OBJECTIVES OF THIS REPORT
Based on the research needs presented, the report goals need to be articulated. The overriding objective of the research was to determine whether the deck options were able to meet the demands of the Morrison Bridge and, if so, how the relative performance of the decks compared. The particular research objectives of this report are summarized as follows:
Determine if the three deck options – Martin Marietta, ZellComp, and modified ZellComp – can handle the fatigue demand of the Morrison Bridge
Determine the flexure strength of the ZellComp and modified ZellComp decks
Determine the shear strength of the modified ZellComp deck
Determine how load is distributed within panels for the modified ZellComp deck

8
Determine how load is distributed across panels for the modified ZellComp deck
Determine the critical load placement and orientation through nondestructive stiffness tests and destructive flexure and shear tests for the modified ZellComp deck
Determine the added stiffness of overlay through a comparison of nondestructive stiffness tests before and after overlay for the modified ZellComp deck
Determine the mechanical connection strength of both the Martin Marietta and modified ZellComp decks by conducting bolt shear tests parallel and perpendicular to the FRP fibers and bolt tension tests
Determine the strength of a clamp for proposed use with the Martin Marietta deck and compare with conventional bolt tension.
Determine the strength of a full panel-to-stringer connection for the Martin Marietta and modified ZellComp decks
Determine the stiffness response of the ZellComp and modified ZellComp decks to lateral loads
9
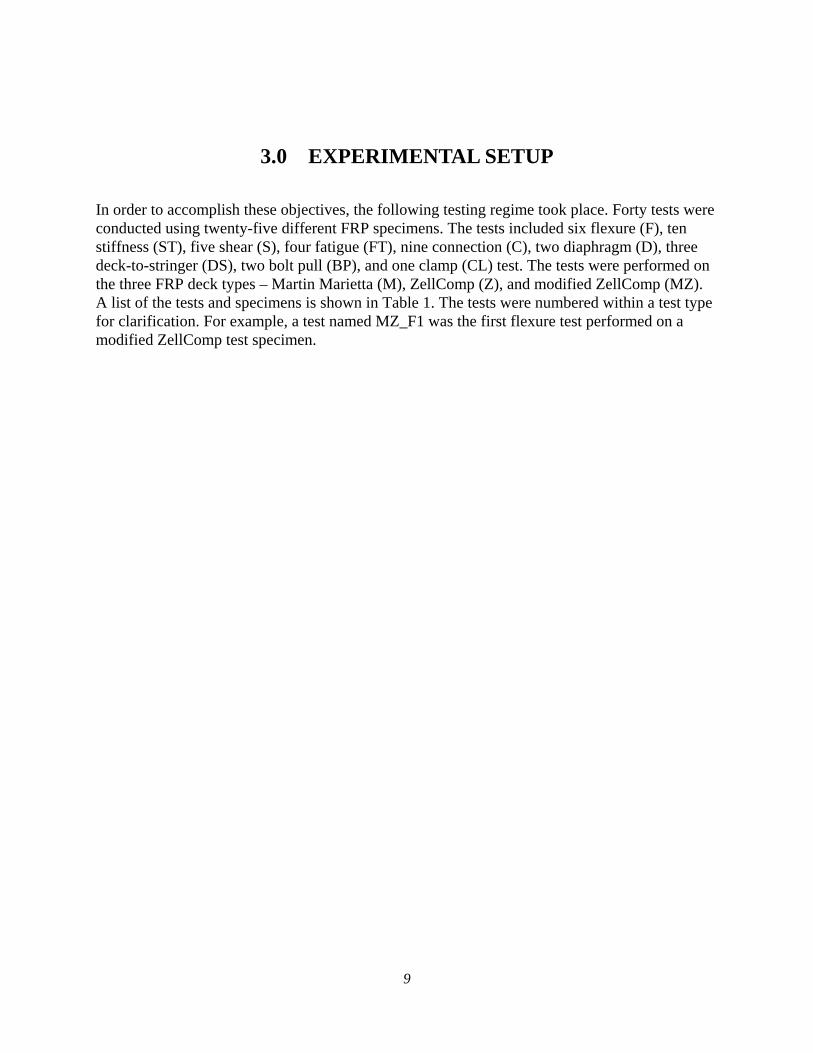
3.0 EXPERIMENTAL SETUP
In order to accomplish these objectives, the following testing regime took place. Forty tests were conducted using twenty-five different FRP specimens. The tests included six flexure (F), ten stiffness (ST), five shear (S), four fatigue (FT), nine connection (C), two diaphragm (D), three deck-to-stringer (DS), two bolt pull (BP), and one clamp (CL) test. The tests were performed on the three FRP deck types – Martin Marietta (M), ZellComp (Z), and modified ZellComp (MZ). A list of the tests and specimens is shown in Table 1. The tests were numbered within a test type for clarification. For example, a test named MZ_F1 was the first flexure test performed on a modified ZellComp test specimen.
10
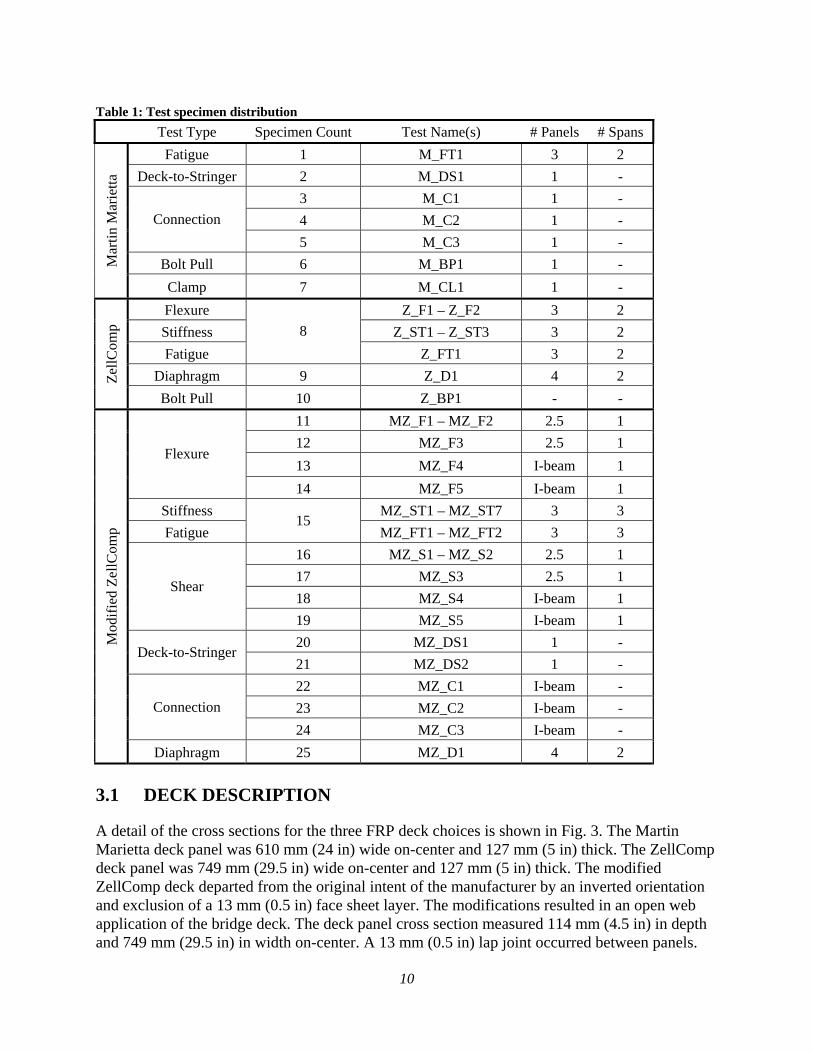
Table 1: Test specimen distribution
Test Type Specimen Count Test Name(s) # Panels # Spans
Fatigue 1 M_FT1 3 2
Deck-to-Stringer 2 M_DS1 1 -
3 M_C1 1 -
4 M_C2 1 - Connection
5 M_C3 1 -
Bolt Pull 6 M_BP1 1 - Mar
tin
Mar
iett
a
Clamp 7 M_CL1 1 -
Flexure Z_F1 – Z_F2 3 2
Stiffness Z_ST1 – Z_ST3 3 2
Fatigue
8
Z_FT1 3 2
Diaphragm 9 Z_D1 4 2 Zel
lCom
p
Bolt Pull 10 Z_BP1 - -
11 MZ_F1 – MZ_F2 2.5 1
12 MZ_F3 2.5 1
13 MZ_F4 I-beam 1 Flexure
14 MZ_F5 I-beam 1
Stiffness MZ_ST1 – MZ_ST7 3 3
Fatigue 15
MZ_FT1 – MZ_FT2 3 3
16 MZ_S1 – MZ_S2 2.5 1
17 MZ_S3 2.5 1
18 MZ_S4 I-beam 1 Shear
19 MZ_S5 I-beam 1
20 MZ_DS1 1 - Deck-to-Stringer
21 MZ_DS2 1 -
22 MZ_C1 I-beam -
23 MZ_C2 I-beam - Connection
24 MZ_C3 I-beam -
Mod
ifie
d Z
ellC
omp
Diaphragm 25 MZ_D1 4 2
3.1 DECK DESCRIPTION
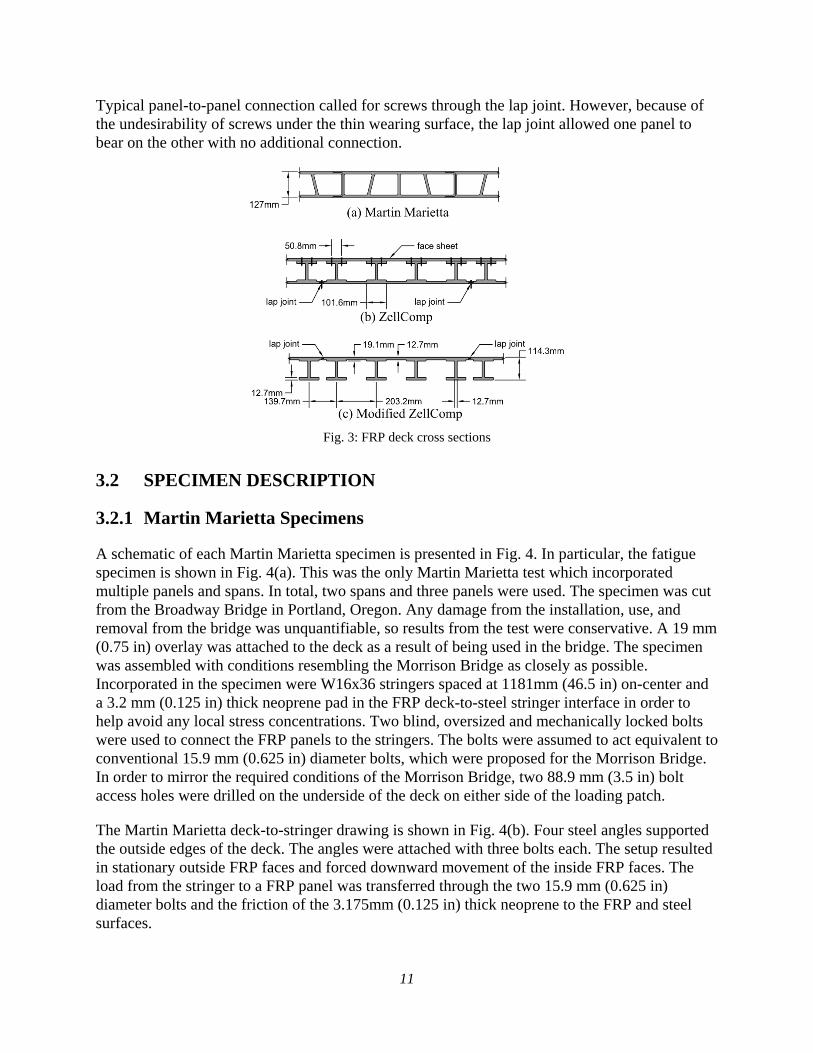
A detail of the cross sections for the three FRP deck choices is shown in Fig. 3. The Martin Marietta deck panel was 610 mm (24 in) wide on-center and 127 mm (5 in) thick. The ZellComp deck panel was 749 mm (29.5 in) wide on-center and 127 mm (5 in) thick. The modified ZellComp deck departed from the original intent of the manufacturer by an inverted orientation and exclusion of a 13 mm (0.5 in) face sheet layer. The modifications resulted in an open web application of the bridge deck. The deck panel cross section measured 114 mm (4.5 in) in depth and 749 mm (29.5 in) in width on-center. A 13 mm (0.5 in) lap joint occurred between panels.
11
Typical panel-to-panel connection called for screws through the lap joint. However, because of the undesirability of screws under the thin wearing surface, the lap joint allowed one panel to bear on the other with no additional connection.
Fig. 3: FRP deck cross sections
3.2 SPECIMEN DESCRIPTION
3.2.1 Martin Marietta Specimens
A schematic of each Martin Marietta specimen is presented in Fig. 4. In particular, the fatigue specimen is shown in Fig. 4(a). This was the only Martin Marietta test which incorporated multiple panels and spans. In total, two spans and three panels were used. The specimen was cut from the Broadway Bridge in Portland, Oregon. Any damage from the installation, use, and removal from the bridge was unquantifiable, so results from the test were conservative. A 19 mm (0.75 in) overlay was attached to the deck as a result of being used in the bridge. The specimen was assembled with conditions resembling the Morrison Bridge as closely as possible. Incorporated in the specimen were W16x36 stringers spaced at 1181mm (46.5 in) on-center and a 3.2 mm (0.125 in) thick neoprene pad in the FRP deck-to-steel stringer interface in order to help avoid any local stress concentrations. Two blind, oversized and mechanically locked bolts were used to connect the FRP panels to the stringers. The bolts were assumed to act equivalent to conventional 15.9 mm (0.625 in) diameter bolts, which were proposed for the Morrison Bridge. In order to mirror the required conditions of the Morrison Bridge, two 88.9 mm (3.5 in) bolt access holes were drilled on the underside of the deck on either side of the loading patch.
The Martin Marietta deck-to-stringer drawing is shown in Fig. 4(b). Four steel angles supported the outside edges of the deck. The angles were attached with three bolts each. The setup resulted in stationary outside FRP faces and forced downward movement of the inside FRP faces. The load from the stringer to a FRP panel was transferred through the two 15.9 mm (0.625 in) diameter bolts and the friction of the 3.175mm (0.125 in) thick neoprene to the FRP and steel surfaces.

12
A bolt shear parallel to the FRP fibers test for the Martin Marietta is pictured in Fig. 4(c). The bolts used were again the 15.9 mm (0.625 in) diameter bolts. Steel brackets, which mirrored the stringers of the Morrison Bridge, were used to pull bolts from the FRP panels. One steel bracket was attached with a single bolt, and the other was attached with three bolts. The 3.175mm (0.125 in) thick neoprene pad between steel and FRP was neglected since the neoprene was mainly used for loads which pressed the FRP and steel together. The FRP pieces were 305 mm (12 in) long. The same setup was used for the bolt shear perpendicular to the FRP fibers test as shown in Fig. 4(d). The only difference was that the steel brackets were rotated to pull the bolts in the perpendicular direction.
A bolt tension test is presented in Fig. 4(e). A steel bracket was used to pull two bolts out of the FRP. Another steel bracket, composed of a piece cut from a wide flange beam and two angles bolted together, was used to restrain the opposite side of the FRP panel. The FRP specimen was a single FRP panel with a length of 305 mm (12 in). A similar bolt tension test, called a bolt pull test, was performed with a different test setup in order to compare and contrast strengths and failure modes. The bolt pull test is shown in Fig. 4(f). In the bolt pull test, both the restraints and the load were applied to the same side of the FRP panel. Two bolts were again pulled from the FRP. Two angles were used to restrain the FRP from upward movement.
A possible approach to the bolted connection between the FRP deck and stringer is the use of a clamp designed by Oregon DOT for potential retrofit scenario. The clamp test specimen is shown in Fig. 4(g). A 559 mm (22 in) long specimen was used for the test. Two clamps were attached to the FRP and bore on the steel bracket. The steel bracket, which applied the load, was not physically attached to either the clamp or the FRP. A 15.9 mm (0.625 in) dowel pin, attached to the clamp, was inserted in a hole on the steel bracket. The purpose of the dowel pin was to prevent any slip of the clamp away from the steel bracket. The sides of the FRP were held down by steel angles.

13
Fig. 4: Martin Marietta specimens
3.2.2 ZellComp Specimens
The ZellComp specimen shown in Fig. 5(a) was used for all ZellComp stiffness, flexure, and fatigue tests. The tests were ordered as follows: one fatigue, three stiffness, and two flexure. As
14
shown, the specimen had three panels and two spans. The joints of the top sheets, which are attached with screws to the deck, were centered over points of zero moment. Four 15.9 mm (0.625 in) diameter bolts connected each deck panel to a stringer as shown in Fig. 5(a). The W16x36 stringers were spaced at 1181mm (46.5 in) on-center. A 3.2 mm (0.125 in) thick neoprene pad was placed between stringer and deck.
A ZellComp diaphragm test specimen is shown in Fig. 5(b). The four panel, two span test specimen was assembled in a similar manner as that discussed above. Due to a lack of ZellComp material, the panels for this test were the same as those used for the modified ZellComp diaphragm test. After the modified ZellComp diaphragm test, the deck was inverted and a FRP top sheet was attached as described in Fig. 3(b). Therefore, the deck had bolt holes and possibly some damage from the Modified ZellComp diaphragm test. Also, some minor repairs were made to the steel frame between diaphragm tests. As in the Morrison Bridge, each stringer was attached to a girder. The stringer-to-girder connection was accomplished with web-to-web welded angles. Notches in the flanges of the girders aided in connection to the stringers. Of the two girders used, one girder was fixed from movement via a weld, and the other girder was free to move in the plane of the deck but was restrained from out of plane motion through wheels.
A bolt pull test specimen is shown in Fig. 5(c). A 305 mm (12 in) long specimen was used for the test. The specimen, cut from a full ZellComp panel, only included two I-beams of the ZellComp panel. Two bolts were attached to the FRP. The sides of the FRP were held down by steel angles. A steel bracket was used to pull two bolts from the FRP specimen.

15
Fig. 5: ZellComp specimens
3.2.3 Modified ZellComp Specimens
Representative test schematics for the modified ZellComp specimens are shown in Fig. 6. Panel specimens incorporated W16x36 stringers spaced at 1181mm (46.5 in) on-center and a 3.2 mm

16
(0.125 in) thick neoprene pad in the FRP deck to steel stringer interface, in order to help avoid any local stress concentrations. In total, three different types of bolts were used. The bolts were distinguished by the ease of installation, but performed similarly in tests. Consequently, the different bolt types were assumed to be equivalent to the conventional 15.9 mm (0.625 in) diameter bolts used for the majority of the tests. Two bolt patterns were used, but no difference between bolt patterns was noticed. In preparation for an overlay, some specimens were sand blasted before testing, the effects of which were assumed to be negligible. A polymer overlay was used for some of the stiffness and the fatigue test. The desired thickness was between 9.5 mm (0.375 in) and 12.7 mm (0.5 in).
Altogether, five specimens experienced flexure, shear, and fatigue panel tests. Fig. 6(a) shows an example of the flexure and shear specimens and Fig. 6(b) shows the stiffness and fatigue specimen. In addition to panel tests, two flexure and two shear tests occurred using single FRP I-beams cut from test panels and were assumed to be undamaged. In some cases, the stringers were shimmed with steel plates to aid in instrumentation. For the specific case of shear testing, a significant amount of rotation was noticed in the actuator after the first two shear tests. To ensure vertical loading of the specimen, a wooden brace was added to keep the actuator straight in the subsequent three shear tests.
Two deck-to-stringer strength tests occurred as shown in Fig. 6(g). The difference between the two tests was the placement of the bolts. One test placed the bolts on the top of the FRP webs while the other placed the bolts under the FRP web as shown in Fig. 6(g). The difference reflected an effort to determine the individual strengths of top and bottom bolts knowing that a complete bolt pattern incorporates two top bolts and two bottom bolts. Steel angles supported the outside edges of the deck. The angles were attached with four bolts each. The setup resulted in stationary outside FRP faces and forced downward movement of the inside FRP faces.
Three connection tests took place, one for each direction of interest, as shown in Fig. 6(d, e, and f). Each test pulled bolts from the FRP in one of the three primary directions. The bolts were pulled in shear parallel to FRP fibers, shear perpendicular to FRP fibers, and in tension. The specimens consisted of I-beams often cut from parts of previous specimens assumed to be undamaged.
One diaphragm test occurred as shown in Fig. 6(c). In addition to the four FRP panels and three stringers, the test incorporated two girders. Welded web-to-web angles connected the stringers to girders. Notches in the flanges of the girders aided in connection of the stringers. A weld from the bottom flange of one girder to a beam bolted to the ground fixed the girder from movement. The other girder was allowed to move in the plane of the deck but was restrained from moving up and down by rollers. A distance of 3048 mm (120 in) separated the girders.

17
Fig. 6: Modified ZellComp specimens

18
3.3 LOADING PROGRAM
This section explains the loading and instrumentation of the previously described test specimens.
3.3.1 Load Orientations
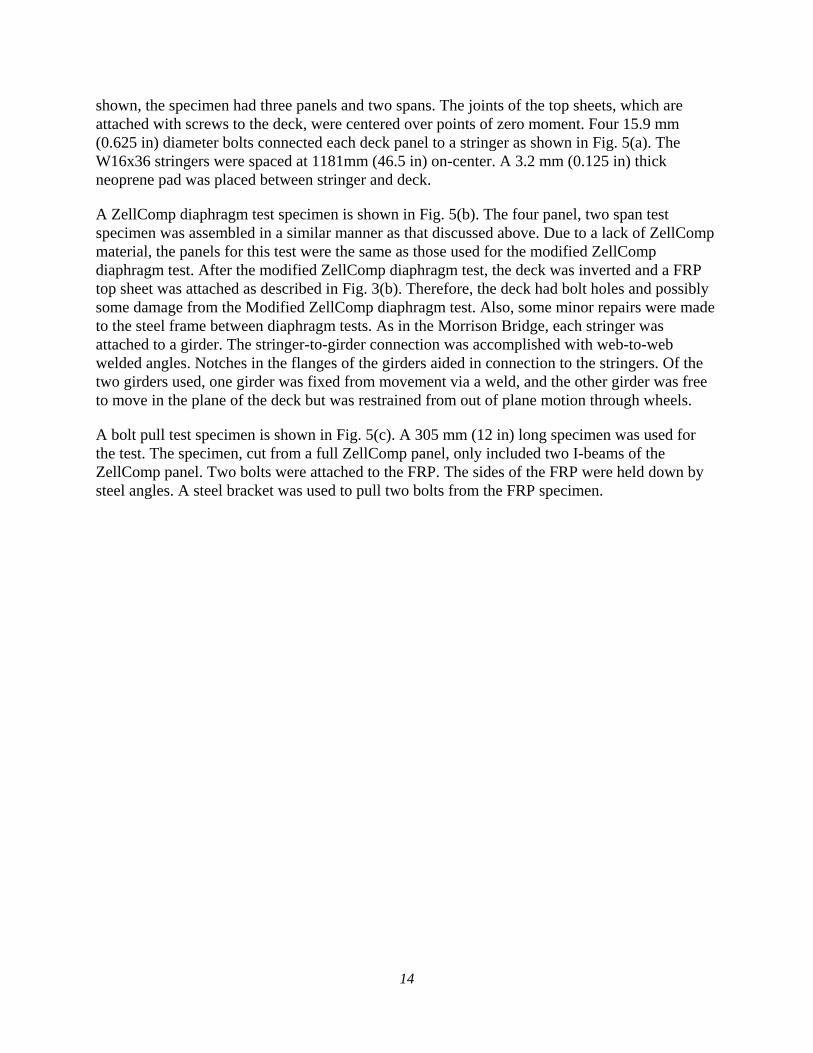
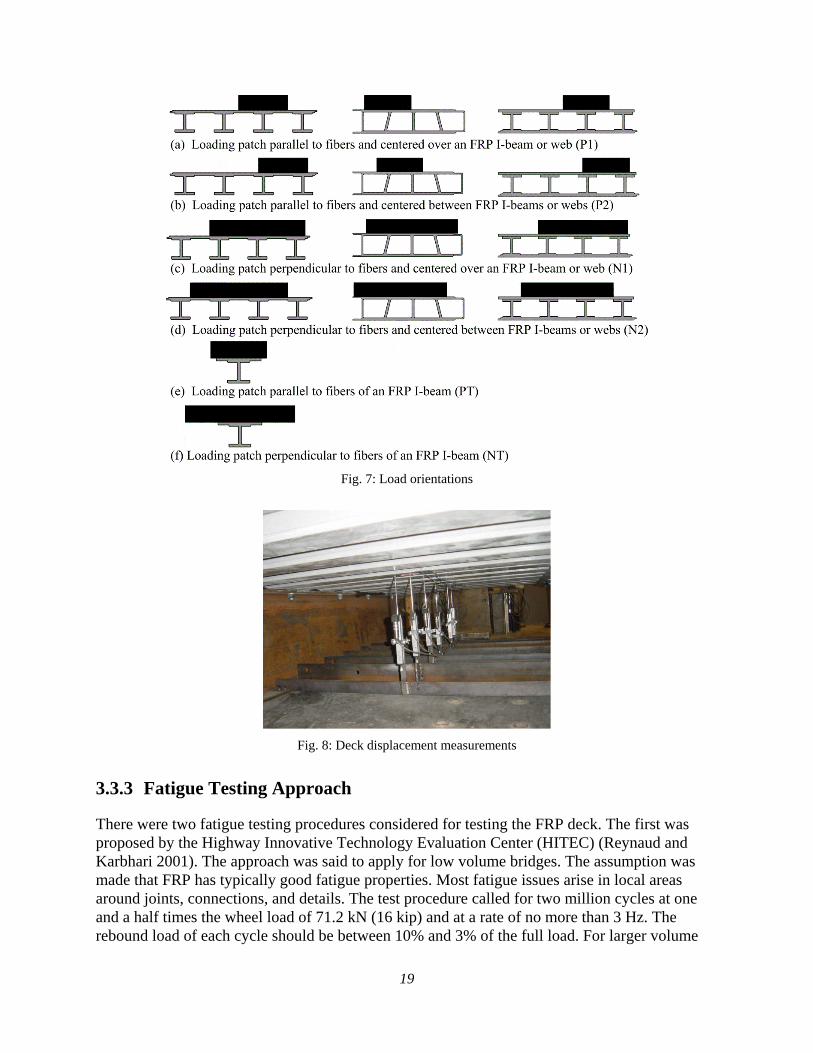
One area of investigation was the effect of load placement on the FRP panel. Because of the anisotropic nature of FRP and the geometry of the deck, the orientation and placement of the loading patch was found to significantly affect the test outcome. In order to highlight the different load placements within a panel, an addendum to each test name was created. For example, a test named MZ_F1_P1 was a flexure test performed on a modified ZellComp test specimen with the loading patch parallel to the FRP fibers and centered over panel I-beam or web. Summarized in Fig. 7 are several possible load orientations. The loading patch, which measured 508 mm (20 in) by 254 mm (10 in), represented the AASHTO load of two side-by-side truck tires. The loading patch consisted of a 50.8 mm (2 in) thick steel plate and a 25.4 mm (1 in) neoprene pad bonded together.
3.3.2 Deck Displacement Measurements
For panel tests (flexure, shear, stiffness, and fatigue), the displacement instrumentation was accomplished with linear voltage displacement transducers (LVDT). The LVDTs were clamped to angles. The angles were clamped or welded to the bottom flange of the stringers. A representative picture of the typical approach for displacement measurement is shown in Fig. 8. As such, the deformation measured was relative to the stringers and represented the deformation of the FRP panel.
19
Fig. 7: Load orientations
Fig. 8: Deck displacement measurements
3.3.3 Fatigue Testing Approach
There were two fatigue testing procedures considered for testing the FRP deck. The first was proposed by the Highway Innovative Technology Evaluation Center (HITEC) (Reynaud and Karbhari 2001). The approach was said to apply for low volume bridges. The assumption was made that FRP has typically good fatigue properties. Most fatigue issues arise in local areas around joints, connections, and details. The test procedure called for two million cycles at one and a half times the wheel load of 71.2 kN (16 kip) and at a rate of no more than 3 Hz. The rebound load of each cycle should be between 10% and 3% of the full load. For larger volume

20
bridges, the number of cycles should be increased to represent the twenty year fatigue life volume of traffic. Deck deflections should not increase by more than 10% of the initial deck deflection. FRP decks were the main focus of the procedure giving the HITEC approach an advantage over other fatigue procedures. The main drawbacks of the HITEC approach were that the choice of load magnitude and the number of cycles were not rationally justified nor were they related in any way to the expected the traffic demands of the Morrison Bridge.
Another fatigue testing approach was recommended by AASHTO. With a maximum wheel load of 71.2 kN (16 kip), an IM of 1.15, and a load combination factor of 0.75, the test load for one loading patch was 61.4 kN (13.8 kip). The load was cycled between 100% and 10% or less. Based on the traffic demands over the Morrison Bridge, the number of required cycles was 6,160,000 cycles. This AASHTO approach incorporated a more representative load and cycle number for the Morrison Bridge. The drawback of this approach was that the procedure was developed with typical decking materials like reinforced concrete in mind. And, the number of cycles required was well above that typically conducted under laboratory conditions due to length of time the testing would require to complete.
3.3.4 Martin Marietta Loading Program
A depiction of the loading and instrumentation for the Martin Marietta tests is shown in Fig. 9. The panel test performed was a fatigue test and is shown in Fig. 9(a). In this figure and Figures 10 and 11, loads, which were measured with load cells, are represented with the color black and the direction is indicated by arrows. A linear voltage displacement transducer measurement is colored white. Supports or steel brackets acting as supports are presented with cross hatched regions. The load was applied at the midspan of the stringers. The loading patch was oriented parallel to the fibers of the FRP and centered over a slanted web of the FRP cross section. The displacement was measured between the bottom of the deck and the bottom flange of the stringer.
The deck-to-stringer test, which is shown in Fig. 9(b), was accomplished by placing a load on the stringer while restraining the outside surface of the FRP deck with four bolted steel angles. The main load and displacement measurements were recorded from the actuator’s LVDT and load cell.
The loading for the bolt shear parallel to the FRP fibers Martin Marietta test is shown in Fig. 9(c). The load was applied with steel brackets representing the stringers of the bridge. One bracket had three bolts and held the FRP stationary, while the other bracket had one bolt and pulled the bolt through the FRP. Displacements were measured at an eccentric position between the steel and the FRP. The same brackets and approach apply for the bolt shear perpendicular to the FRP fibers test shown in Fig. 9(d). The only difference was the orientation of the brackets.
For the Martin Marietta bolt tension test, two bolts were pulled out of one face of the deck while the opposite face was held in place. Steel brackets prevented the bolts from being pulled and held the opposite face stationary. The load and displacement was measured via the actuator’s load cell and LVDT. The test loading and instrumentation diagram is shown in Fig. 9(e).

21
Similar to the bolt tension test, the Martin Marietta bolt pull test pulled two bolts from the FRP deck. The difference was that the FRP face from which the bolts were being pulled was restrained with steel angles as opposed to the opposite face being restrained in the bolt tension test. Displacements were measured at the four corners of the steel plate pulling the bolts and averaged. The load application and placement of the deflection measurements are shown in Fig. 9(f).
In the Martin Marietta clamp test, which is shown in Fig. 9(g), the load was applied to the steel bracket. From the steel bracket, the load traveled through the two clamps. The dowel pins prevented any slip between clamp and bracket. From the clamp, the load was applied to the FRP deck. The displacements were measured at the four corners of the steel bracket and averaged.

22
Fig. 9: Martin Marietta loading and instrumentation
3.3.5 ZellComp Loading Program
An example of the load application and displacement measurement for the flexure, stiffness, and fatigue testing of the ZellComp FRP deck is shown in Fig. 10(a). The load was applied with the 508 mm (20 in) by 254 mm (10 in) loading patch described previously. The load was centered at

23
the midspan of two stringers. Various placements of the loading patch over the FRP cross section were used for different tests. Displacements were measured from the bottom of the deck as previously described. The fatigue test used the AASHTO fatigue evaluation procedure of 61.4 kN (13.8 kip) and 6,160,000 cycles.
The loading and instrumentation for the ZellComp diaphragm test is shown in Fig. 10(b). The load was applied to the web of the girder which was allowed to move freely in the plane of the FRP deck. The load transferred through the web-to-web welded angle connection of the girder to the stringer and caused the stringers to try to rotate. The rotation imposed on the stringers was resisted by the four FRP ZellComp panels attached to the stringers. The opposite girder was fixed from movement by a weld along the bottom flange. Displacement was measured for the free girder. Displacements were also measured between stringer flanges directly under FRP deck joints.
The load application and displacement measurements for the ZellComp bolt pull test are shown in Fig. 10(c). The load was applied to two bolts with a steel bracket. The FRP face through which the bolts were attached was restrained from movement with steel angles. Displacements were measured at the four corners of the steel bracket and averaged.

24
Fig. 10: ZellComp loading and instrumentation

25
3.3.6 Modified ZellComp Loading Program
The load applications and instrumentation placements for the modified ZellComp are presented in Fig. 11. In the flexure (Fig. 11(a)) and stiffness (Fig. 11(c)) tests, the load was centered in between two stringers, and in the shear tests (Fig. 11(b)), the outside edge of the loading patch was placed over the inside edge of the stringer. The fatigue tests (Fig. 11(d)) employed a 1828.8 mm (72 in) spreader bar which evenly distributed the load application to two loading patches. One of the fatigue loading patches was centered between two stringers of an outside span. Displacement measurements for the flexure, shear, stiffness, and fatigue tests were made at the midspan of the stringers between the bottom of the deck and the bottom flange of the stringers.
The loading and instrumentation for the modified ZellComp diaphragm test is shown in Fig. 11(e). The load was applied to the web of the free girder which was allowed to move in the plane of the FRP deck. The load transferred through the web-to-web welded angle connection of the girder to the stringer and caused the stringers to try to rotate. The rotation imposed on the stringers was resisted by the four FRP ZellComp panels attached to the stringers. The fixed girder was restrained from movement by a weld along the bottom flange. Displacement was measured for the free girder. Displacements were also measured between stringer flanges directly under FRP deck joints.
The deck-to-stringer test, which is shown in Fig. 11(f), was accomplished by placing a load on the stringer while restraining the outside surface of the FRP deck with four bolted steel angles. The main load and displacement measurements were recorded from the actuator’s LVDT and load cell.
The loading for the bolt shear parallel to the FRP fibers modified ZellComp test is shown in Fig. 11(g). The load was applied with steel brackets representing the stringers of the bridge. One bracket had four bolts and held the FRP stationary while the other bracket had two bolts and pulled the bolts through the FRP. Displacements were measured at an eccentric position between the steel and the FRP. Using a similar approach, the bolt shear perpendicular to the FRP fibers loading is shown in Fig. 11(h).
For the modified ZellComp bolt tension test, two bolts were pulled out of one flange of the deck while the opposite face was held stationary. Steel brackets prevented the bolts from being pulled and held the opposite face stationary. The load and displacement were measured via the actuator’s load cell and LVDT. The test loading and instrumentation diagram is shown in Fig. 11(i).

26
Fig. 11: Modified ZellComp loading and instrumentation

27
4.0 TEST RESULTS
In order to fully maximize the potential of each test specimen, multiple tests were performed on the same specimen. A complete list of all tests performed on each specimen was presented in Table 1. There were instances when multiple tests were performed on a single specimen, each succeeding test incorporates any possible damage, whether known or unknown, from the previous tests. For example, the ZellComp flexure tests Z_F1 and Z_F2 were both performed on the same specimen. Due to limitations on the equipment, the failure point was not attained in test Z_F1. After a change in test setup, the flexure test Z_F2 was performed and failure was reached. So any damage incurred in Z_F1 may have affected Z_F2.
4.1 MARTIN MARIETTA
4.1.1 Destructive Tests
The load deflection curves, failure loads, and failure modes for the Martin Marietta tests are shown in Fig. 12, Table 2, and Fig. 13 respectively. The results of the deck-to-stringer test performed on the Martin Marietta FRP deck are shown in Fig. 12(a). The load was divided by four and presented on a per bolt basis for easy comparison with the other connection tests. Failure started at a load of 18.9 kN (4.25 kip) per bolt where the load deflection curve starts to become nonlinear. The ultimate load took place at 23.7 kN (5.3 kip) per bolt. The failure modes, as shown in Fig. 13(a), were delamination of webs and web bending.
The three Martin Marietta connection test results – bolt shear parallel to the FRP fibers, bolt shear perpendicular to the FRP fibers, and bolt tension – are presented in Fig. 12(b). For the bolt shear parallel to the fibers test, the FRP experienced some bolt bearing, but the major failure mode was bolt shear. The specimen failure is shown in Fig. 13(d). The ultimate load took place at 79.2 kN (17.8 kip) per bolt. The nominal strength of a A325 15.9 mm (0.625 in) diameter bolt is 65.3 kN (14.7 kip). The higher strength achieved in the test was due to the fact that the bolt rotated and incorporated both bolt shear and bolt tension forces. There was some nonlinearity in the initial portion of the curve. This nonlinearity was attributed to bearing of both the FRP and steel bracket as the bolt rotated. Since the failure was a bolt failure and not a FRP failure, the true FRP strength in this loading direction was not attained. The main result was that the FRP was shown to adequately support a 15.9 mm (0.625 in) diameter bolt in the parallel to the FRP fiber direction.
The bolt shear perpendicular to the FRP fibers test results are shown in Fig. 12(b). The major failure was FRP bearing. Also, the bolt was noticed to deform plastically. The damaged FRP and bolt are shown in Fig. 13(c). The ultimate load took place at 77.4 kN (17.4 kip) per bolt. Although both the parallel and perpendicular tests had similar ultimate loads, the parallel test failure was bolt sensitive, while the perpendicular failure was FRP sensitive.

28
For the Martin Marietta bolt tension test, the major failure, which is shown in Fig. 13(e), was delamination of the 305 mm (12 in ) long web from the FRP flange. The original intent of the test focused on pulling two bolts out of the deck. However, delamination of webs and top sheet occurred first. The longer length of a full size deck would give the web to top sheet connection more capacity. So the ultimate load of 11.6 kN (2.6 kip) per bolt serves as a lower bound for pulling bolts out of the deck.
The bolt pull test results are shown in Fig. 12(c). The major failure was bolts pulling through the FRP. The initial failure, however, resulted from bending and delamination of the FRP and is shown in Fig. 13(f). The longer length of a full size deck would increase the capacity and could negate the initial failure. The ultimate load of 27.1 kN (6.1 kip) per bolt occurred as the bolts pulled through the deck.
Load versus deflection results for the Martin Marietta clamp test are shown in Fig. 12(d). The major failure was shear flow driven delamination of the FRP due to bending between the steel angles. The failure is shown in Fig. 13(b). The longer length of a full size deck would increase the capacity and could negate the initial failure. Some slight damage was seen in the clamp and dowel pin. The ultimate failure was more a result of the FRP size, rather than the clamp, but the initial failure load of 25.5 kN (5.75 kip) per clamp can be used as a conservative capacity of the clamps. Since four of the five webs delaminated before a significant failure of the clamp areas, the test became a function of top plate shear flow capacity and the test was stopped with an ultimate load of 42.7 kN (9.6 kip) per clamp.

29
Fig. 12: Martin Marietta load deflection curves
Table 2: Martin Marietta test results
Test Type Test Name Ultimate Load Ultimate Displacement (kN) (kip) (mm) (in)
M_C1 11.6 2.6 5.6 0.219 M_C2 77.4 17.4 13.7 0.541 Connection
M_C3 79.2 17.8 18.3 0.722
Deck to Stringer M_DS1 23.7 5.3 13.4 0.529
Bolt Pull M_BP1 27.1 6.1 18.7 0.735
Clamp M_CL1 42.7 9.6 18.3 0.721

30
Fig. 13: Martin Marietta failure modes
4.1.2 Nondestructive tests
The maximum displacement for each cycle of the Martin Marietta fatigue test is shown in Fig. 14. The average maximum displacements of the first and last ten minutes were 2.33 mm (0.092 in) and 2.62 mm (0.103 in) respectively. From these two averages, the degradation was measured at 13%. No visible damage to deck, overlay, or deck-to-stringer connection was noticed.

31
Fig. 14: Martin Marietta fatigue test
4.2 ZELLCOMP
4.2.1 Destructive Tests
The ZellComp load deflection curves, failure loads, and failure modes are shown in Fig. 15, Table 3, and Fig. 16 respectively. The results for the ZellComp flexure tests are shown in Fig. 15(a). The first test, Z_F1_P1, was performed on unfatigued side panels, but reached the capacity of the actuator before significant failure occurred. The test was performed a second time (Z_F2_P1) on the center fatigued panel, and failed the deck initially at 343 kN (77.1 kip). The failure occurred under the joint of the attached top sheet, and appeared to be a web shear failure.
The results of the bolt pull test performed on the ZellComp deck are shown in Fig. 15(b). The major failure resulted from shear flow and delamination of the FRP and started at a load of 13.3 kN (3 kip) per bolt. The test ended as the bolts pulled through the FRP. An ultimate load of 20.5 kN (4.6 kip) per bolt occurred. The longer length of a full size deck would increase the capacity and could negate the initial shear flow failure.
Fig. 15: ZellComp load deflection curves

32
Table 3: ZellComp test results
Test Type Test Name Ultimate Load Ultimate Displacement (kN) (kip) (mm) (in)
Z_F1_P1* 229.1 51.5 10.9 0.431 Flexure
Z_F2_P1 343.0 77.1 19.2 0.754
Bolt Pull Z_BP1 20.5 4.6 18.9 0.744 *No failure occurred
Fig. 16: ZellComp failure modes
4.2.2 Nondestructive Tests
Three stiffness tests were performed on the fatigued ZellComp specimen and the results are shown in Table 4. Tests Z_ST1_P2 and Z_ST2_P1 were performed on the unfatigued side panels of the specimen. Test Z_ST3_P2 was performed with the same orientation of Z_ST1_P2, but on the fatigued center panel of the specimen.
Table 4: ZellComp stiffness
Test Name Secant Stiffness Secant Stiffness (kN/mm) (kip/in)
Z_ST1_P2 28.5 163 Z_ST2_P1 24.9 142 Z_ST3_P2 25.7 147
The maximum displacement for each cycle of the ZellComp fatigue test is shown in Fig. 17(a). The average maximum displacements of the first and last ten minutes were 2.51 mm (0.099 in) and 2.74 mm (0.108 in) respectively. From these two values, the degradation measured 9%. No visible damage to deck, overlay, or deck-to-stringer connection was noticed.
The free girder displacement of each cycle for the ZellComp diaphragm test is shown in Fig. 17(b). Slip of the fixed girder occurred after several cycles of loading, which prompted the test to be stopped before any failure of the deck. The displacement from under the deck was scaled to

33
mirror the pre-slip displacements and then used to estimate the last two cycles displacement. The maximum displacement was measured to be 55.9 mm (2.2 in) at a load of 116.5 kN (26.2 kip).
Fig. 17: ZellComp fatigue and diaphragm tests
4.3 MODIFIED ZELLCOMP
4.3.1 Destructive Tests
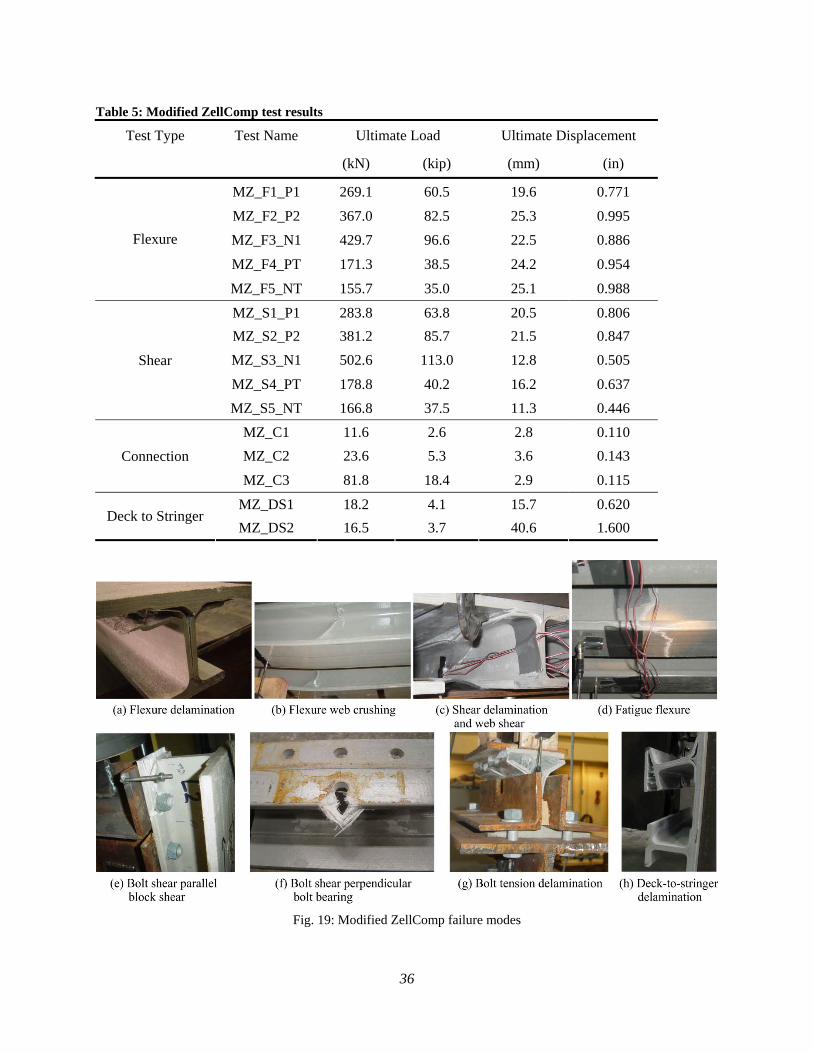
The load deflection curves, ultimate loads, and failure modes for the modified ZellComp are shown in Fig. 18, Table 5, and Fig. 19 respectively. Five modified ZellComp flexure tests were performed, three on panels and two on I-beams. Test MZ_F2_P2 was performed on an undamaged side panel from test MZ_F1_P1. Comparison plots of the three panel and two I-beam load deflection curves are shown in Fig. 18(a) and Fig. 18(b) respectively. The load orientation P1, which concentrated the load over a single T-beam, gave the lowest panel strength value of 269.1 kN (60.5 kip). Lap joint separation occurred on all tests. Shear flow failure resulting in delamination of the web and face sheet predominated the failure modes of each flexure test. The length of visible delamination varied from 73.7 mm (29 in) to 1333.5 mm (52.5 in). Web crushing emerged as a secondary failure mode. Also, face sheet cracking appeared around the loading patch. As an evolving pattern between panel tests, a load that was distributed over more I-beams led to more catastrophic failures and less residual strength. Pictures of the primary flexure failure modes are shown in Fig. 19(a) and Fig. 19(b). After unloading, the panels rebounded to a displacement between 6.1 mm (0.24 in) and 9.9 mm (0.39 in) making failure difficult to observe from above.
A summary of the five shear test results – three panel tests and two individual beam tests – is shown in Table 5. The major failure modes were web shear failure and delamination. The load deflection curves with deflection measured at midspan are shown in Fig. 18(c) and Fig. 18(d). As opposed to the flexure tests where delamination dominated the initial failure, the web shear failure seemed to dominate the initial failure. This result was especially evident in test
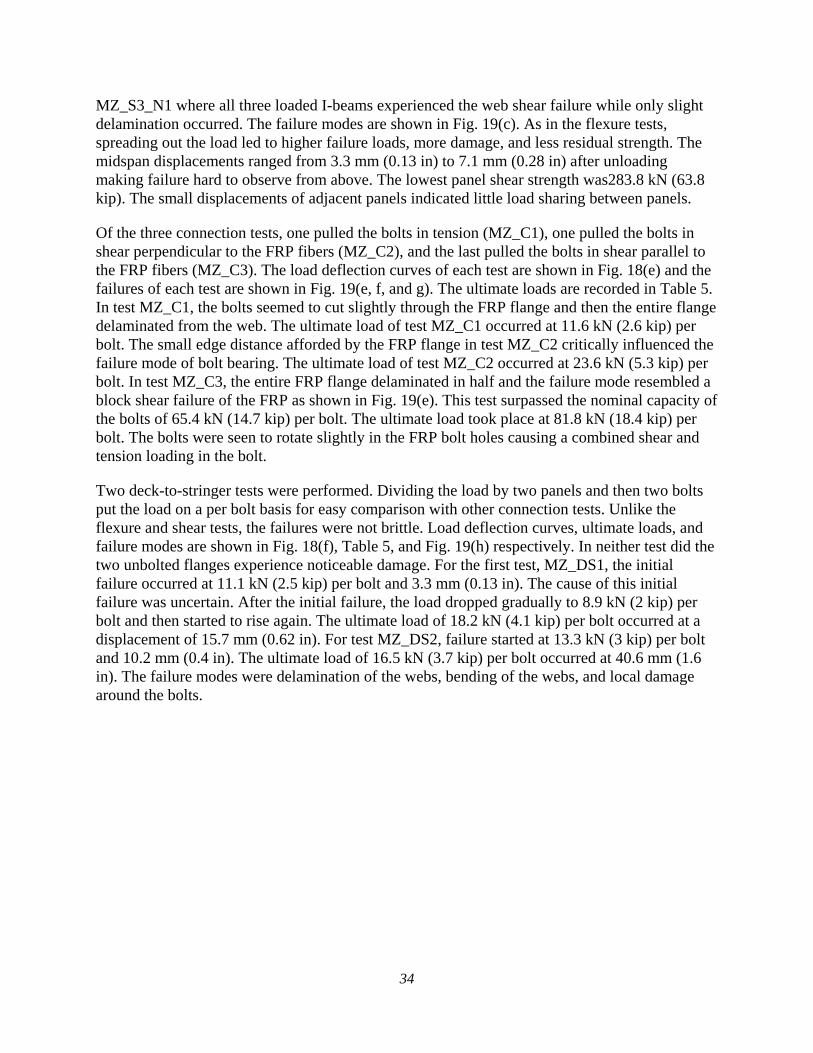
34
MZ_S3_N1 where all three loaded I-beams experienced the web shear failure while only slight delamination occurred. The failure modes are shown in Fig. 19(c). As in the flexure tests, spreading out the load led to higher failure loads, more damage, and less residual strength. The midspan displacements ranged from 3.3 mm (0.13 in) to 7.1 mm (0.28 in) after unloading making failure hard to observe from above. The lowest panel shear strength was283.8 kN (63.8 kip). The small displacements of adjacent panels indicated little load sharing between panels.
Of the three connection tests, one pulled the bolts in tension (MZ_C1), one pulled the bolts in shear perpendicular to the FRP fibers (MZ_C2), and the last pulled the bolts in shear parallel to the FRP fibers (MZ_C3). The load deflection curves of each test are shown in Fig. 18(e) and the failures of each test are shown in Fig. 19(e, f, and g). The ultimate loads are recorded in Table 5. In test MZ_C1, the bolts seemed to cut slightly through the FRP flange and then the entire flange delaminated from the web. The ultimate load of test MZ_C1 occurred at 11.6 kN (2.6 kip) per bolt. The small edge distance afforded by the FRP flange in test MZ_C2 critically influenced the failure mode of bolt bearing. The ultimate load of test MZ_C2 occurred at 23.6 kN (5.3 kip) per bolt. In test MZ_C3, the entire FRP flange delaminated in half and the failure mode resembled a block shear failure of the FRP as shown in Fig. 19(e). This test surpassed the nominal capacity of the bolts of 65.4 kN (14.7 kip) per bolt. The ultimate load took place at 81.8 kN (18.4 kip) per bolt. The bolts were seen to rotate slightly in the FRP bolt holes causing a combined shear and tension loading in the bolt.
Two deck-to-stringer tests were performed. Dividing the load by two panels and then two bolts put the load on a per bolt basis for easy comparison with other connection tests. Unlike the flexure and shear tests, the failures were not brittle. Load deflection curves, ultimate loads, and failure modes are shown in Fig. 18(f), Table 5, and Fig. 19(h) respectively. In neither test did the two unbolted flanges experience noticeable damage. For the first test, MZ_DS1, the initial failure occurred at 11.1 kN (2.5 kip) per bolt and 3.3 mm (0.13 in). The cause of this initial failure was uncertain. After the initial failure, the load dropped gradually to 8.9 kN (2 kip) per bolt and then started to rise again. The ultimate load of 18.2 kN (4.1 kip) per bolt occurred at a displacement of 15.7 mm (0.62 in). For test MZ_DS2, failure started at 13.3 kN (3 kip) per bolt and 10.2 mm (0.4 in). The ultimate load of 16.5 kN (3.7 kip) per bolt occurred at 40.6 mm (1.6 in). The failure modes were delamination of the webs, bending of the webs, and local damage around the bolts.

35
Fig. 18: Modified ZellComp load deflection curves
36
Table 5: Modified ZellComp test results
Test Type Test Name Ultimate Load Ultimate Displacement
(kN) (kip) (mm) (in)
MZ_F1_P1 269.1 60.5 19.6 0.771
MZ_F2_P2 367.0 82.5 25.3 0.995
MZ_F3_N1 429.7 96.6 22.5 0.886
MZ_F4_PT 171.3 38.5 24.2 0.954
Flexure
MZ_F5_NT 155.7 35.0 25.1 0.988
MZ_S1_P1 283.8 63.8 20.5 0.806
MZ_S2_P2 381.2 85.7 21.5 0.847
MZ_S3_N1 502.6 113.0 12.8 0.505
MZ_S4_PT 178.8 40.2 16.2 0.637
Shear
MZ_S5_NT 166.8 37.5 11.3 0.446
MZ_C1 11.6 2.6 2.8 0.110
MZ_C2 23.6 5.3 3.6 0.143 Connection
MZ_C3 81.8 18.4 2.9 0.115
MZ_DS1 18.2 4.1 15.7 0.620 Deck to Stringer
MZ_DS2 16.5 3.7 40.6 1.600
Fig. 19: Modified ZellComp failure modes
37
4.3.2 Nondestructive Tests
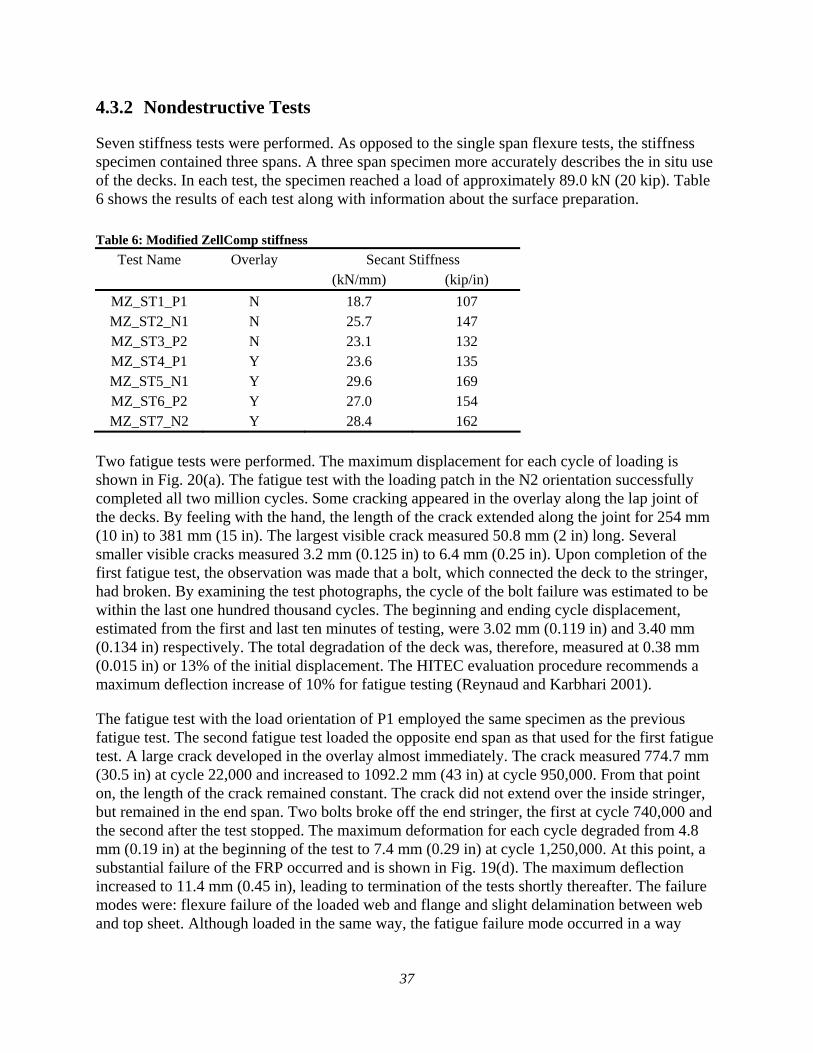
Seven stiffness tests were performed. As opposed to the single span flexure tests, the stiffness specimen contained three spans. A three span specimen more accurately describes the in situ use of the decks. In each test, the specimen reached a load of approximately 89.0 kN (20 kip). Table 6 shows the results of each test along with information about the surface preparation.
Table 6: Modified ZellComp stiffness
Test Name Overlay Secant Stiffness (kN/mm) (kip/in)
MZ_ST1_P1 N 18.7 107 MZ_ST2_N1 N 25.7 147 MZ_ST3_P2 N 23.1 132 MZ_ST4_P1 Y 23.6 135 MZ_ST5_N1 Y 29.6 169 MZ_ST6_P2 Y 27.0 154 MZ_ST7_N2 Y 28.4 162
Two fatigue tests were performed. The maximum displacement for each cycle of loading is shown in Fig. 20(a). The fatigue test with the loading patch in the N2 orientation successfully completed all two million cycles. Some cracking appeared in the overlay along the lap joint of the decks. By feeling with the hand, the length of the crack extended along the joint for 254 mm (10 in) to 381 mm (15 in). The largest visible crack measured 50.8 mm (2 in) long. Several smaller visible cracks measured 3.2 mm (0.125 in) to 6.4 mm (0.25 in). Upon completion of the first fatigue test, the observation was made that a bolt, which connected the deck to the stringer, had broken. By examining the test photographs, the cycle of the bolt failure was estimated to be within the last one hundred thousand cycles. The beginning and ending cycle displacement, estimated from the first and last ten minutes of testing, were 3.02 mm (0.119 in) and 3.40 mm (0.134 in) respectively. The total degradation of the deck was, therefore, measured at 0.38 mm (0.015 in) or 13% of the initial displacement. The HITEC evaluation procedure recommends a maximum deflection increase of 10% for fatigue testing (Reynaud and Karbhari 2001).
The fatigue test with the load orientation of P1 employed the same specimen as the previous fatigue test. The second fatigue test loaded the opposite end span as that used for the first fatigue test. A large crack developed in the overlay almost immediately. The crack measured 774.7 mm (30.5 in) at cycle 22,000 and increased to 1092.2 mm (43 in) at cycle 950,000. From that point on, the length of the crack remained constant. The crack did not extend over the inside stringer, but remained in the end span. Two bolts broke off the end stringer, the first at cycle 740,000 and the second after the test stopped. The maximum deformation for each cycle degraded from 4.8 mm (0.19 in) at the beginning of the test to 7.4 mm (0.29 in) at cycle 1,250,000. At this point, a substantial failure of the FRP occurred and is shown in Fig. 19(d). The maximum deflection increased to 11.4 mm (0.45 in), leading to termination of the tests shortly thereafter. The failure modes were: flexure failure of the loaded web and flange and slight delamination between web and top sheet. Although loaded in the same way, the fatigue failure mode occurred in a way

38
unlike any of the flexure tests. The increase in shear flow capacity of three spans and two broken bolts allowing greater FRP connection rotation contributed to the change in failure mode.
The load deflection for the cyclic diaphragm test is shown in Fig. 20(b). The displacement shown is the displacement of the free girder and the load is the load applied to the free girder. Five and one half cycles were completed before the test was ended. A subsequent test without the deck showed that the stringer and girder steel frame resisted less than 2.7 kN (0.6 kip) showing that the great majority of the load was carried by the deck. Starting at ±12.7 mm (0.5 in), each cycle added 12.7 mm (0.5 in) until the last cycle accomplished ±63.5 mm (2.5 in). An additional half cycle was completed before the steel frame failed.
Fig. 20: Modified ZellComp fatigue and diaphragm tests
39
5.0 DISCUSSION
5.1 LOAD SHARING FOR MODIFIED ZELLCOMP
The load distribution for the modified ZellComp between multiple panels and also within a single panel were of interest. Graphs are shown in Fig. 21 from which load sharing properties both across panels and within panels is seen. First, the load distributed across panels was considered. As seen from Fig. 21(a) where the load was applied on the bottom panel of the lap joint, little deflection, and thus load, was transferred across the joint. Some load sharing between panels occurred when the load was applied on the top panel of the lap joint as in test F3_N1 (see Fig. 21(b)), but the amount of load sharing was still insignificant when compared to the total load. The conservative assumption is that no load is transferred between panels. Thus, the typical modeling approach of a homogeneous plate, which assumes that panels completely transfer load across joints, should not be used for this type of deck.
Two methods were used to estimate the load distribution within a single panel. The first method assumed that the deflection of each individual I-beam of the panel was proportional to the stress or load experienced by that beam, and that the sum the individual beam deflections was proportional to the total load. By comparing an individual beam deflection to the sum of all the beam deflections, the percent of load distribution to a beam could be estimated. For example, the deflections of all the beams for test MZ_F1_P1 at 100% of the failure displacement can be seen in Fig. 21(a). The sum of all the beam deflections was 36.0 mm (1.4 in). The beam that experienced failure first had a deflection of 19.6 mm (0.8 in). From the ratios of these numbers, the beam was estimated to carry 54% of the full panel load. Using a similar procedure for test MZ_F3_N1, the failure beam was estimated to carry 30% of the panel load. Knowing that these two tests represented the extreme cases of loading conditions – load concentrated over a single beam and load spread over three beams – the load distribution within a panel to the critical beam was estimated to be between 30% and 54%. This method could not be used for the test MZ_F2_P2 due to instrumentation limitations.
The second method is shown in Fig. 21(c and d). This method compared the load deflection plots of an I-beam test with the panel test having a corresponding load orientation. As an example of this method, consider the curves for tests MZ_F1_P1 and MZ_F4_PT shown in Fig. 21(c). Assuming that no load is transferred to adjacent panels, the panel test load represents the total load while the I-beam test load represents the load taken by a single beam. For a common deflection, the ratio of the I-beam to panel loads is an estimation of the load distributed to a single beam. At 12.7 mm (0.5 in), the panel experienced a load of 191.9 kN (43.1 kip) while the I-beam experienced 99.0 kN (22.3 kip). From the ratio of these two numbers, the beam was estimated to carry 52% of the total load. In a similar fashion with tests MZ_F3_N1 and MZ_F5_NT, the beam was estimated to carry 33% of the panel load. So according to the second method the load distribution within a panel to a single beam was between 33% and 52%. The first method percentages of 30% and 54% were very close to those of the second method giving
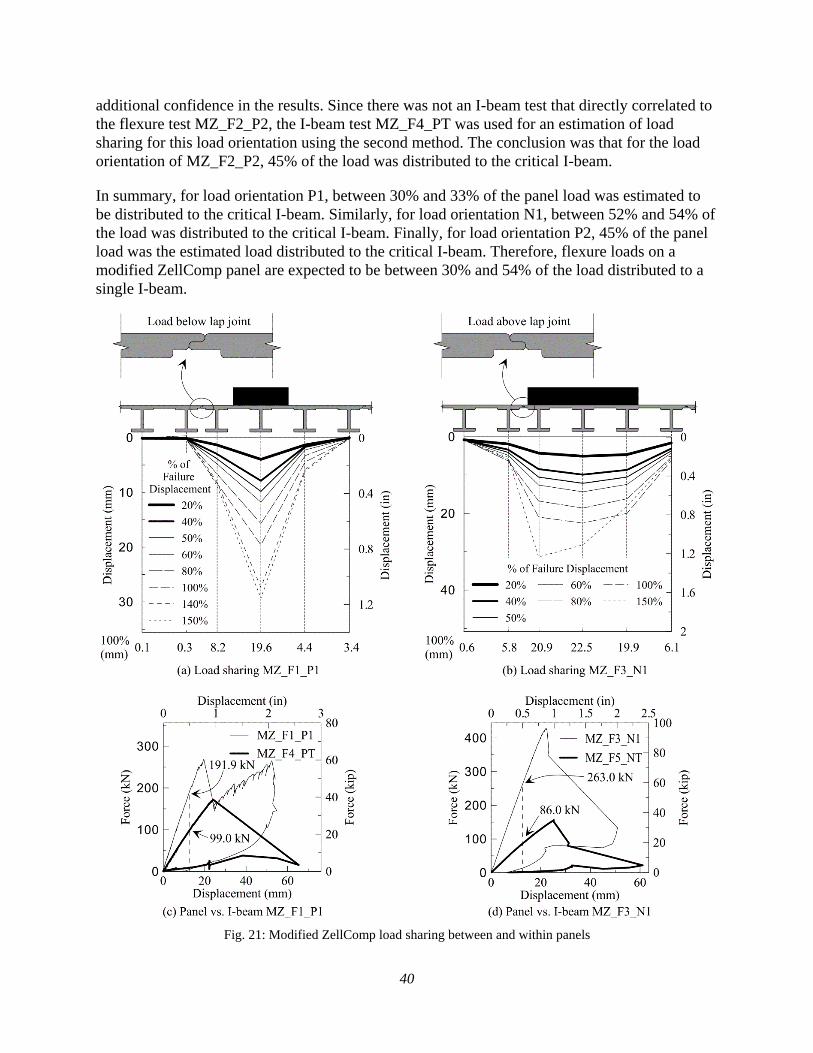
40
additional confidence in the results. Since there was not an I-beam test that directly correlated to the flexure test MZ_F2_P2, the I-beam test MZ_F4_PT was used for an estimation of load sharing for this load orientation using the second method. The conclusion was that for the load orientation of MZ_F2_P2, 45% of the load was distributed to the critical I-beam.
In summary, for load orientation P1, between 30% and 33% of the panel load was estimated to be distributed to the critical I-beam. Similarly, for load orientation N1, between 52% and 54% of the load was distributed to the critical I-beam. Finally, for load orientation P2, 45% of the panel load was the estimated load distributed to the critical I-beam. Therefore, flexure loads on a modified ZellComp panel are expected to be between 30% and 54% of the load distributed to a single I-beam.
Fig. 21: Modified ZellComp load sharing between and within panels

41
5.2 FLEXURE STRESS AND SHEAR FLOW FOR MODIFIED ZELLCOMP
With better understanding of the load distributions to a single I-beam within a panel, calculating failure stresses for the flexure specimens became possible. The quantities of interest were bending stress, given the flexural nature of the test setup, and shear flow, due to the subsequent observed failure mode. Initially the load was considered a point load; however, given the relative length, 508 mm (20 in), of the loading patch compared to the spacing between stringers of 1,181 mm (46.5 in), additional calculations were made taking the distributed load into account. The single I-beam cross section dimensions are presented in Fig. 22.
Fig. 22: Modified ZellComp I-beam cross section
For a point load, the flexure stress and shear flow , assuming simply supported beam conditions, can be calculated as follows:
Where P is the load imposed on the I-beam. Specifically, for test MZ_F1_P1, P is the average of 52% and 54% or 53% of the panel load. For test MZ_F2_P2, P is 45% of the panel load. For test MZ_F3_N1, P is the average of 30% and 33% or 31.5% of the panel load. For tests MZ_F4_PT and MZ_F5_PN, P is 100% of the test load. L is the stringer spacing minus the stringer flange width and measures 1003 mm (39.5 in). c is the distance from the centroid of the cross section to the extreme beam face 73 mm (2.88 in). I is the moment of inertia about the bending axis 10,320,000 mm4 (24.8 in4). A shear flow plane was chosen which was typical for shear flow failure experienced in the flexure tests. A is the area above the plane of interest for the shear flow 2903 mm2 (4.5 in2). is the distance from the centroid of the cross section to the centroid of the area above the shear flow plane 34 mm (1.34 in).
For a distributed load approach, the flexure stress and shear flow, assuming simply supported beam conditions, are calculated as follows:
42
Where a is the distance from the end support to the edge of the loading patch. a is 248 mm (9.75 in) for the loading patch oriented parallel to the FRP fibers and 375 mm (14.75 in) for the loading patch oriented perpendicular to the FRP fibers. w is the load P divided by 508 mm (20 in) for the loading patch oriented parallel to the FRP fibers and divided by 254 mm (10 in) for the loading patch oriented perpendicular to the FRP fibers. The variables q, P, c, A, I, and
remain the same as previously defined.
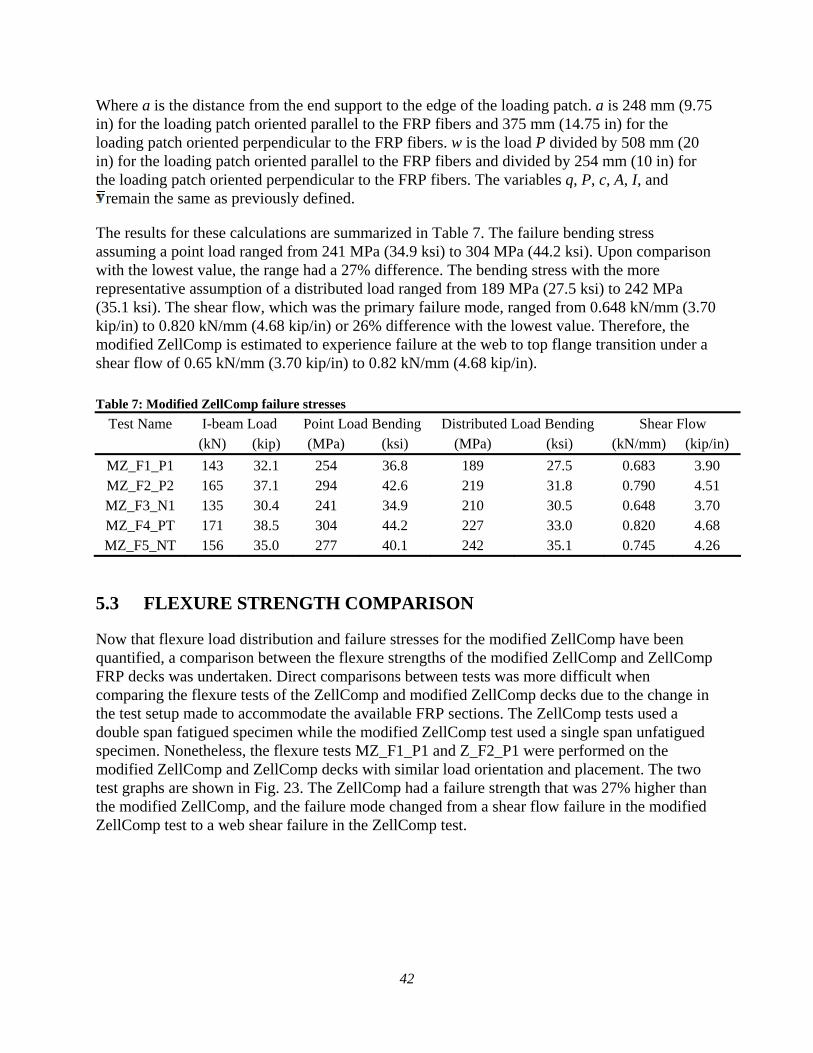
The results for these calculations are summarized in Table 7. The failure bending stress assuming a point load ranged from 241 MPa (34.9 ksi) to 304 MPa (44.2 ksi). Upon comparison with the lowest value, the range had a 27% difference. The bending stress with the more representative assumption of a distributed load ranged from 189 MPa (27.5 ksi) to 242 MPa (35.1 ksi). The shear flow, which was the primary failure mode, ranged from 0.648 kN/mm (3.70 kip/in) to 0.820 kN/mm (4.68 kip/in) or 26% difference with the lowest value. Therefore, the modified ZellComp is estimated to experience failure at the web to top flange transition under a shear flow of 0.65 kN/mm (3.70 kip/in) to 0.82 kN/mm (4.68 kip/in).
Table 7: Modified ZellComp failure stresses
Test Name I-beam Load Point Load Bending Distributed Load Bending Shear Flow (kN) (kip) (MPa) (ksi) (MPa) (ksi) (kN/mm) (kip/in)
MZ_F1_P1 143 32.1 254 36.8 189 27.5 0.683 3.90 MZ_F2_P2 165 37.1 294 42.6 219 31.8 0.790 4.51 MZ_F3_N1 135 30.4 241 34.9 210 30.5 0.648 3.70 MZ_F4_PT 171 38.5 304 44.2 227 33.0 0.820 4.68 MZ_F5_NT 156 35.0 277 40.1 242 35.1 0.745 4.26
5.3 FLEXURE STRENGTH COMPARISON
Now that flexure load distribution and failure stresses for the modified ZellComp have been quantified, a comparison between the flexure strengths of the modified ZellComp and ZellComp FRP decks was undertaken. Direct comparisons between tests was more difficult when comparing the flexure tests of the ZellComp and modified ZellComp decks due to the change in the test setup made to accommodate the available FRP sections. The ZellComp tests used a double span fatigued specimen while the modified ZellComp test used a single span unfatigued specimen. Nonetheless, the flexure tests MZ_F1_P1 and Z_F2_P1 were performed on the modified ZellComp and ZellComp decks with similar load orientation and placement. The two test graphs are shown in Fig. 23. The ZellComp had a failure strength that was 27% higher than the modified ZellComp, and the failure mode changed from a shear flow failure in the modified ZellComp test to a web shear failure in the ZellComp test.

43
Fig. 23: ZellComp and modified ZellComp flexure comparison
5.4 STIFFNESS COMPARISON
The serviceability limit states also need to be considered during design. Based on AASHTO recommendations for bridge decks, the deflection levels should be limited to L/800 with L measured in inches for a live load of 71.2 kN (16 kip) in ordinary bridges. A list of the stiffness results for all the stiffness tests is summarized in Table 8. Also included were fatigue and flexure results from which the information could be obtained or extrapolated. Some of the significant specimen differences including fatigue cycle, overlay use, and number of stringer spans, were shown for comparison purposes. The maximum deflections ranged from L/263 to L/577 or 204% and 39% above the L/800 AASHTO limitation recommendation. This increase in deflection highlights the significant deflection differences between FRP and the traditional reinforced concrete, prestressed concrete, and steel bridge decks.
The discussion of whether the AASHTO recommendation of L/800 is appropriate for FRP decks needs to be approached. According to one source, the institution of the AASHTO serviceability limits were heavily influenced by the vibrational response of the typical bridge decks (Machado, Sotelino and Liu 2008). Since FRP decks differ significantly from conventional decks in vibration response given the low mass and since FRP decks are not usually attached compositely with girders as other deck types, the implication is that AASHTO serviceability limitations are not appropriate for FRP bridge decks. Knowing that AASHTO serviceability limitations are not appropriate for FRP decks, the question of what the appropriate deflections limits should be for FRP was raised. One source suggested relaxing the requirement to L/500 (Telang, et al. 2006). Under monotonic load conditions, this relaxed deflection limitation could be achieved.

44
Table 8: Deflection comparison
Test Name Fatigue Cycle Overlay Spans L/#***
M_FT1_P1 (start) 1500** Yes 2 442
M_FT1_P1 (end) 6.2 million Yes 2 394
Z_F1_P1 1* No 2 410
Z_F2_P1 6.2 million No 2 380
Z_ST1_P2 1* No 2 474
Z_ST2_P1 1* No 2 413
Z_ST3_P2 6.2 million No 2 427
Z_FT1_P1 (start) 1500** No 2 410
Z_FT1_P1 (end) 6.2 million No 2 394
MZ_F1_P1 1 No 1 263
MZ_F2_P2 1 No 1 311
MZ_F3_N1 1 No 1 347
MZ_ST1_P1 1 No 3 311
MZ_ST2_N1 1 No 3 427
MZ_ST3_P2 1 No 3 384
MZ_ST4_P1 1 Yes 3 392
MZ_ST5_N1 1 Yes 3 491
MZ_ST6_P2 1 Yes 3 448
MZ_ST7_N2 1* Yes 3 471
MZ_FT1_N2 (start) 1000** Yes 3 577
MZ_FT1_N2 (end) 2 million Yes 3 523
MZ_FT2_P1 (start) 1000** Yes 3 381 * fatigued specimen but test performed on unfatigued side panels ** estimated for first ten minutes of testing *** deflection scaled to 71.2 kN (16kip) where necessary 5.5 OVERLAY OBSERVATIONS
The effects of overlay on improved stiffness performance was evaluated on those tests in which an overlay was applied. The presence of overlay distinguished tests MZ_ST1 through MZ_ST3 from tests MZ_ST4 through MZ_ST6. The results of these tests were presented in Table 6. After the application of overlay, the stiffness of the deck increased by 26%, 15%, and 17% for load orientations P1, N1, and P2 respectively. The deck stiffness had a lower bound of 18.7 kN/mm (107 kip/in) without overlay and 23.6 kN/mm (135 kip/in) with overlay.
The added stiffness with an overlay is not a new observation. From previous studies, an overlay has been shown to contribute up to 15% in stiffness in honeycomb FRP decks. Also, finite element analysis has been used to estimate the contributions of an overlay (Cai, Oghumu and Meggers 2009). Caution needs to be used when an overlay is counted on for added stiffness. Because of differential stiffness across joints and transitions from FRP to other materials, an overlay has a tendency to crack. This fact was shown to be true during the two modified

45
ZellComp fatigue tests across panel joints. However, in the Martin Marietta fatigue test, no overlay problems were observed with the stiffer deck and thicker overlay. Another problem sometimes experienced by an overlay is delamination from the FRP (Telang, et al. 2006). Wearing of the overlay should also be taken into consideration. Before an overlay can be counted on for stiffness contributions, the overlay needs to be tested for quality control. Issues regarding the application of an overlay in harsh weather environments need to be considered. A further discussion of overlay response to fatigue is included in the fatigue discussion section.
5.6 FATIGUE OBSERVATIONS
Four fatigue tests were completed – one with Martin Marietta, one with ZellComp, and two with modified ZellComp decks. The Martin Marietta and ZellComp tests used the AASHTO fatigue testing procedure and the modified ZellComp used the HITEC fatigue evaluation approach. Of the four tests, three completed the full amount of cycles while one of the modified ZellComp tests failed at 1.4 million cycles. The maximum deflection per cycle is shown for all four tests in Fig. 24. Fatigue displacement degradation measured between 9% and 13% for the three completed fatigue tests. Based on the two modified ZellComp fatigue tests, broken bolts were found to be a common sign that the deck to stringer system is susceptible to fatigue degradation and possible deck failure could follow.
Fig. 24: Fatigue comparison
One of the previously discussed topics was the possible added stiffness of an overlay. An issue with depending on an overlay for added design stiffness is that some polymer overlays have had problems with cracking and/or delaminating from the FRP deck over time. Before an overlay can be counted for added stiffness, the specific overlay being used must be shown to withstand the appropriate amount of fatigue loading without significant delamination. Both of the modified ZellComp fatigue tests incorporated a 9.5 mm (0.375 in) thick overlay and the Martin Marietta
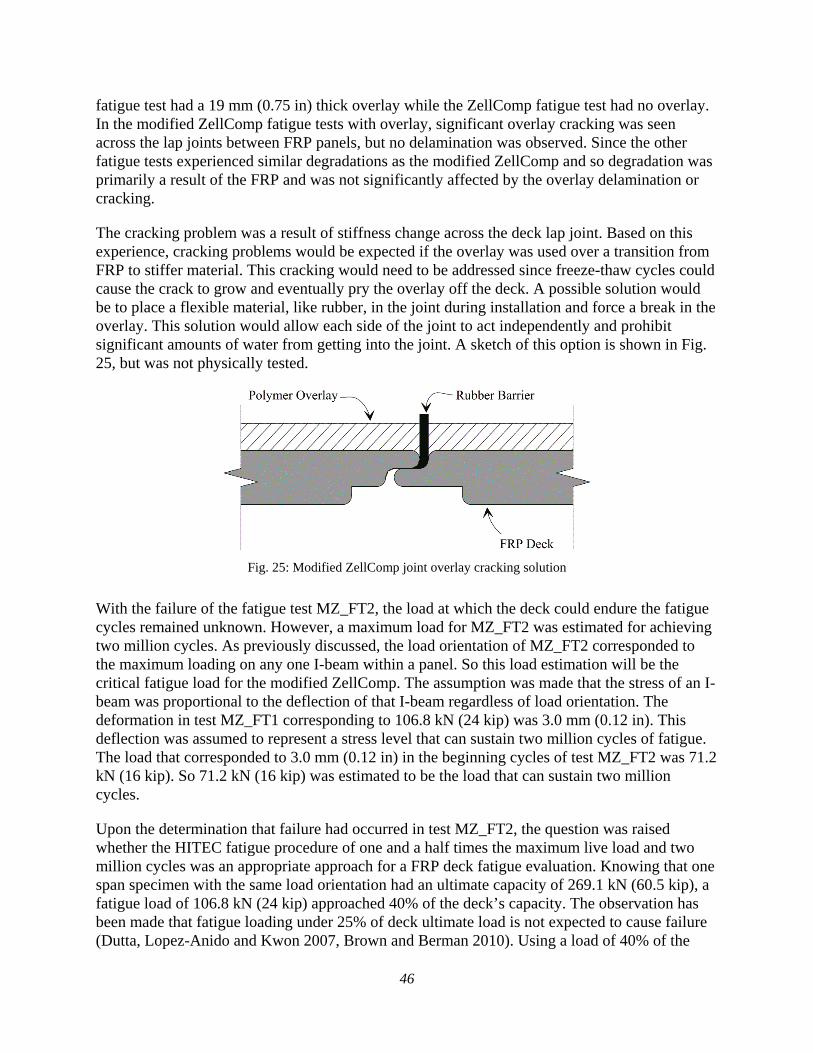
46
fatigue test had a 19 mm (0.75 in) thick overlay while the ZellComp fatigue test had no overlay. In the modified ZellComp fatigue tests with overlay, significant overlay cracking was seen across the lap joints between FRP panels, but no delamination was observed. Since the other fatigue tests experienced similar degradations as the modified ZellComp and so degradation was primarily a result of the FRP and was not significantly affected by the overlay delamination or cracking.
The cracking problem was a result of stiffness change across the deck lap joint. Based on this experience, cracking problems would be expected if the overlay was used over a transition from FRP to stiffer material. This cracking would need to be addressed since freeze-thaw cycles could cause the crack to grow and eventually pry the overlay off the deck. A possible solution would be to place a flexible material, like rubber, in the joint during installation and force a break in the overlay. This solution would allow each side of the joint to act independently and prohibit significant amounts of water from getting into the joint. A sketch of this option is shown in Fig. 25, but was not physically tested.
Fig. 25: Modified ZellComp joint overlay cracking solution
With the failure of the fatigue test MZ_FT2, the load at which the deck could endure the fatigue cycles remained unknown. However, a maximum load for MZ_FT2 was estimated for achieving two million cycles. As previously discussed, the load orientation of MZ_FT2 corresponded to the maximum loading on any one I-beam within a panel. So this load estimation will be the critical fatigue load for the modified ZellComp. The assumption was made that the stress of an I-beam was proportional to the deflection of that I-beam regardless of load orientation. The deformation in test MZ_FT1 corresponding to 106.8 kN (24 kip) was 3.0 mm (0.12 in). This deflection was assumed to represent a stress level that can sustain two million cycles of fatigue. The load that corresponded to 3.0 mm (0.12 in) in the beginning cycles of test MZ_FT2 was 71.2 kN (16 kip). So 71.2 kN (16 kip) was estimated to be the load that can sustain two million cycles.
Upon the determination that failure had occurred in test MZ_FT2, the question was raised whether the HITEC fatigue procedure of one and a half times the maximum live load and two million cycles was an appropriate approach for a FRP deck fatigue evaluation. Knowing that one span specimen with the same load orientation had an ultimate capacity of 269.1 kN (60.5 kip), a fatigue load of 106.8 kN (24 kip) approached 40% of the deck’s capacity. The observation has been made that fatigue loading under 25% of deck ultimate load is not expected to cause failure (Dutta, Lopez-Anido and Kwon 2007, Brown and Berman 2010). Using a load of 40% of the
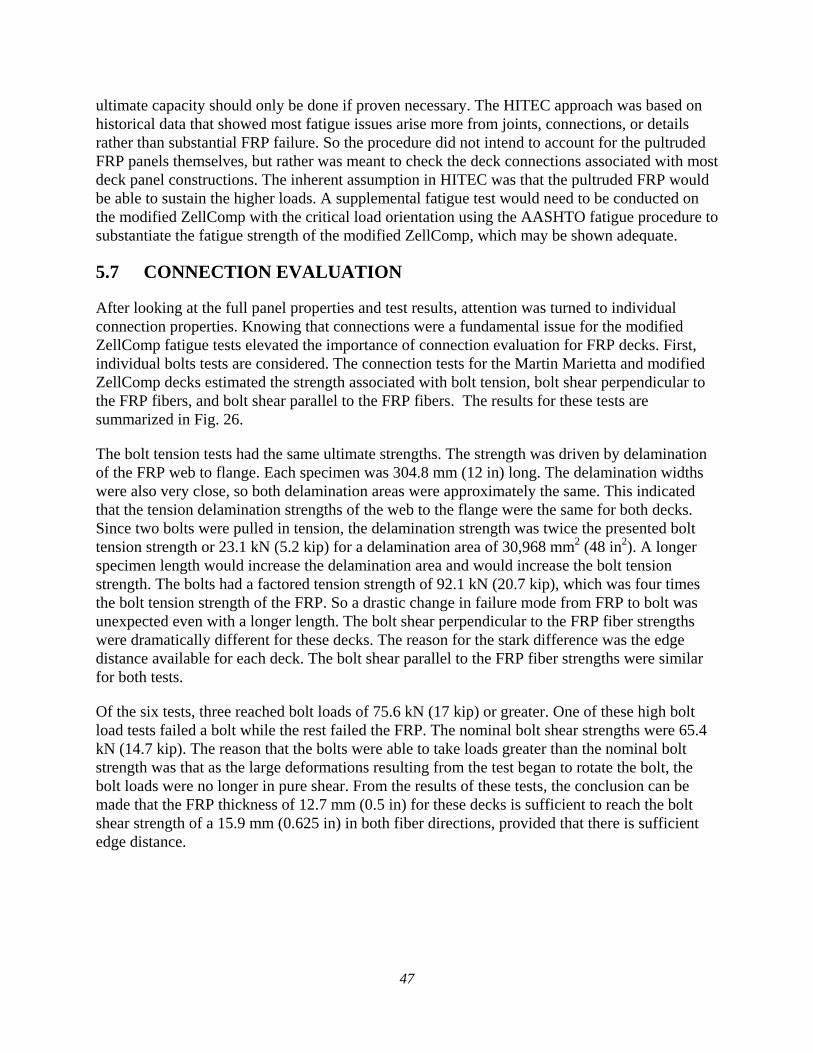
47
ultimate capacity should only be done if proven necessary. The HITEC approach was based on historical data that showed most fatigue issues arise more from joints, connections, or details rather than substantial FRP failure. So the procedure did not intend to account for the pultruded FRP panels themselves, but rather was meant to check the deck connections associated with most deck panel constructions. The inherent assumption in HITEC was that the pultruded FRP would be able to sustain the higher loads. A supplemental fatigue test would need to be conducted on the modified ZellComp with the critical load orientation using the AASHTO fatigue procedure to substantiate the fatigue strength of the modified ZellComp, which may be shown adequate.
5.7 CONNECTION EVALUATION
After looking at the full panel properties and test results, attention was turned to individual connection properties. Knowing that connections were a fundamental issue for the modified ZellComp fatigue tests elevated the importance of connection evaluation for FRP decks. First, individual bolts tests are considered. The connection tests for the Martin Marietta and modified ZellComp decks estimated the strength associated with bolt tension, bolt shear perpendicular to the FRP fibers, and bolt shear parallel to the FRP fibers. The results for these tests are summarized in Fig. 26.
The bolt tension tests had the same ultimate strengths. The strength was driven by delamination of the FRP web to flange. Each specimen was 304.8 mm (12 in) long. The delamination widths were also very close, so both delamination areas were approximately the same. This indicated that the tension delamination strengths of the web to the flange were the same for both decks. Since two bolts were pulled in tension, the delamination strength was twice the presented bolt tension strength or 23.1 kN (5.2 kip) for a delamination area of 30,968 mm2 (48 in2). A longer specimen length would increase the delamination area and would increase the bolt tension strength. The bolts had a factored tension strength of 92.1 kN (20.7 kip), which was four times the bolt tension strength of the FRP. So a drastic change in failure mode from FRP to bolt was unexpected even with a longer length. The bolt shear perpendicular to the FRP fiber strengths were dramatically different for these decks. The reason for the stark difference was the edge distance available for each deck. The bolt shear parallel to the FRP fiber strengths were similar for both tests.
Of the six tests, three reached bolt loads of 75.6 kN (17 kip) or greater. One of these high bolt load tests failed a bolt while the rest failed the FRP. The nominal bolt shear strengths were 65.4 kN (14.7 kip). The reason that the bolts were able to take loads greater than the nominal bolt strength was that as the large deformations resulting from the test began to rotate the bolt, the bolt loads were no longer in pure shear. From the results of these tests, the conclusion can be made that the FRP thickness of 12.7 mm (0.5 in) for these decks is sufficient to reach the bolt shear strength of a 15.9 mm (0.625 in) in both fiber directions, provided that there is sufficient edge distance.
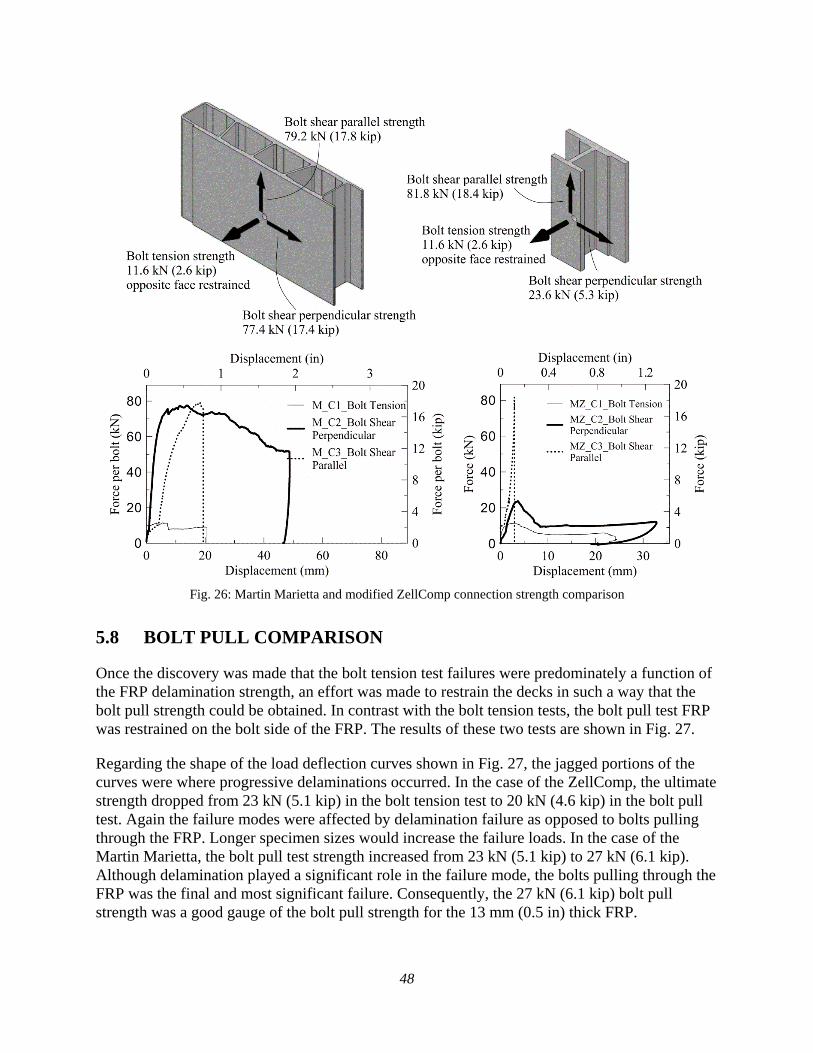
48
Fig. 26: Martin Marietta and modified ZellComp connection strength comparison
5.8 BOLT PULL COMPARISON
Once the discovery was made that the bolt tension test failures were predominately a function of the FRP delamination strength, an effort was made to restrain the decks in such a way that the bolt pull strength could be obtained. In contrast with the bolt tension tests, the bolt pull test FRP was restrained on the bolt side of the FRP. The results of these two tests are shown in Fig. 27.
Regarding the shape of the load deflection curves shown in Fig. 27, the jagged portions of the curves were where progressive delaminations occurred. In the case of the ZellComp, the ultimate strength dropped from 23 kN (5.1 kip) in the bolt tension test to 20 kN (4.6 kip) in the bolt pull test. Again the failure modes were affected by delamination failure as opposed to bolts pulling through the FRP. Longer specimen sizes would increase the failure loads. In the case of the Martin Marietta, the bolt pull test strength increased from 23 kN (5.1 kip) to 27 kN (6.1 kip). Although delamination played a significant role in the failure mode, the bolts pulling through the FRP was the final and most significant failure. Consequently, the 27 kN (6.1 kip) bolt pull strength was a good gauge of the bolt pull strength for the 13 mm (0.5 in) thick FRP.

49
Fig. 27: Martin Marietta and ZellComp bolt pull strength comparison
5.9 DECK-TO-STRINGER CONNECTION COMPARISON
Once the individual bolt strengths were identified, attention was moved to the deck-to-stringer connection of a single panel. The results of the three deck-to-stringer tests are shown in Fig. 28 with all loads shown on a per bolt basis for easy comparison with the previously discussed connection tests. One test was performed on the Martin Marietta deck with two bolts connecting a stringer to the deck as per the typical connection approach. Two tests were performed on the modified ZellComp deck. The typical connection approach is four bolts per deck-to-stringer connection. Of the four bolts, two are placed above the FRP webs and two below the FRP webs. In order to investigate the individual effects of placing bolts above or below the FRP webs, one modified ZellComp deck-to-stringer test used two bolts above the FRP web, and the other test used two bolts below the FRP web. Thus, the Martin Marietta ultimate load was representative of the full load available to the deck-to-stringer connection while the modified ZellComp ultimate loads represented individual capacities of two bolts either above or below the webs.
When considering the modified ZellComp deck-to-stringer tests, the ultimate loads were 18.2 kN (4.1 kip) per bolt for bolts below the web and 16.5 kN (3.7 kip) per bolt for bolts above the web. The percent increase from the bolts above the web test was 11%. The surprising observation

50
from these tests was that the even though the bolts below the web were handicapped with a small edge distance, the ultimate load was greater than the bolts above the web test. The ultimate load from the previous connection test for bolt shear perpendicular to the FRP fibers was 23.6 kN (5.3 kip), which was above the ultimate loads of both the bolts above and below the web deck-to-stringer tests. So, the failure was independent of the bearing edge distance in this case because the failure was within the deck and not the connection itself. The bolt above the web test was less restrained allowing uplift of the FRP flange as shown in Fig. 29. Thus, the modified ZellComp deck-to-stringer test with the bolts below the web was both stiffer and stronger than the bolts deck-to-stringer test with the bolts above the web.
An ultimate strength for a full modified ZellComp deck-to-stringer connection can be estimated from the load deflection graph of Fig. 28. The test MZ_DS1 was stiffer and experienced the first ultimate load of 18 kN (4.1 kip) at a displacement of 15.9 mm (0.625 in). For this displacement, test MZ_DS2 resisted a load of 15 kN (3.3 kip). Thus with two bolts below the web and two bolts above the web, a deck-to-stringer connection will have a strength of 66 kN (14.8 kip) per panel.
After the ultimate load for the modified ZellComp was estimated, a comparison of the Martin Marietta and modified ZellComp deck-to-stringer strengths was undertaken. The Martin Marietta had an ultimate load of 23.7 kN (5.3 kip) per bolt or 47.4 kN (10.6 kip) per panel. The modified ZellComp was estimated to have an ultimate strength of 65.8 kN (14.8 kip) per panel. Thus, the ultimate load was increased by 40% from the Martin Marietta to the modified ZellComp. The failures were not bolt related and would not be expected to increase with more bolts. Rather the failures were functions of FRP web bending and delamination of the FRP web from the flange. Given this failure, mode appropriate quantification would be to normalize the total load by the length of the deck. The Martin Marietta test was bending five 762 mm (30 in) long webs with a combined thickness of 25.4 mm (1 in). The modified ZellComp bends four webs of similar length but with a combined web thickness of 50.8 mm (2 in). Thus, stronger modified ZellComp tests was attributed to significantly thicker webs.

51
Fig. 28: Martin Marietta and modified ZellComp deck-to-stringer strength comparison

52
Fig. 29: Modified ZellComp deck-to-stringer discussion
5.10 STRINGER TO DECK CLAMP
One of the problems identified with FRP deck-to-stringer connections over time is uplift of the FRP from the stringer caused by loads between adjacent stringers. Since all decks to date have been closed cell and not accessible to tighten any of the bolts, a proposed solution for this connection problem is the use of a steel clamp. A proposed design by ODOT is shown in Fig. 30. For a gauge of how well the clamp performed, the load deflection graphs for the clamp and the bolt pull tests were compared and are shown in Fig. 30. Both of these tests were performed with the same load application and displacement measurement apparatus. The difference between the tests was that the bolt pull test used bolts to attach the FRP to the stringer while the clamp test used clamps. The initial stiffness similarity was accounted for in the fact that the clamp test had a span that was 83% longer than the bolt pull test. Thus, the clamp stiffens and strengthens the deck-to-stringer connection.

53
Fig. 30: Martin Marietta clamp strength comparison
5.11 DIAPHRAGM EFFECTIVENESS EVALUATION
After panel and connection strengths were investigated, the focus was shifted to the diaphragm properties of the ZellComp and modified ZellComp deck. This investigation was especially significant for FRP deck use in a draw span bridge. When in the raised position, any lateral loads will put a significant amount of stress in the deck. The load deflection curves for both diaphragm tests are shown in Fig. 31. Also, the minimum and maximum loads for each cycle with the corresponding displacements are shown for each test in a separate graph for better comparison.
Both specimens used four deck panels that resulted in a 3048 mm (120 in) distance between the loaded and fixed ends. The ZellComp deck experienced a load of 116.5 kN (26.2 kip) at a lateral displacement of 55.9 mm (2.2 in) for a lateral stiffness of 2.1 kN/mm (11.9 kip/in). For the modified ZellComp deck, at a load of 60.1 kN (13.5 kip), the displacement measured 61.0 mm (2.4 in) giving a lateral stiffness of 1.0 kN/mm (5.6 kip/in). Therefore, the ZellComp deck had a lateral stiffness that was 113% greater than the modified ZellComp deck. This difference was mainly caused by the lack of a direct diaphragm plate at the top flange of the stringer in the open cell modified ZellComp case. Failure of the deck was not reached in either test due to limitations in the steel frame portion of the specimen. The choice of stringers, girders, and connections in the steel frame attempted to mirror the application of the Morrison Bridge. Therefore, as a diaphragm, the deck significantly affected the stiffness of the system used, but the ultimate strength depended more on connection of the stringers and girders for this particular system.
Two additional tests were performed on the steel frame. The results are shown in the section Appendix A - Lateral Test Frame Stiffness. The conclusion from these tests was that the steel frame did not carry a significant amount of load when no deck was present. Hence the loads achieved were attributed to the relative deck configurations.

54
Fig. 31: ZellComp and modified ZellComp diaphragm strength comparison

55
6.0 SUMMARY AND CONCLUSIONS
Experimental evaluation of three FRP bridge decks under various load conditions was accomplished. The three decks included a Martin Marietta deck, a ZellComp deck, and a modified ZellComp deck. Both the Martin Marietta and ZellComp decks had been tested in the past and so tests performed on these decks focused on meeting specific design needs for the Morrison Bridge. The modified ZellComp deck, on the other hand, was a new application and needed to be investigated more extensively.
The flexure, shear and connection strengths of the modified ZellComp FRP bridge deck were obtained. The critical load orientation was found and quantified through nondestructive stiffness testing. The load sharing properties between and within modified ZellComp panels were found. By relating deflection to stress, a single I-beam in a panel was found to carry up to 54% of the load. As demonstrated by small deflections in adjacent panels, an insignificant amount of load was distributed across panel joints. As a result, panels should be assumed to act independently and design assumptions for modeling should be restricted to single panels. The dominant failure mode of the FRP decks for the considered span in monotonic loading was a shear flow failure. Estimations for the failure flexure and shear flow stresses were made for the modified ZellComp deck. An overlay was found to add between 15% and 26% to the stiffness of an unfatigued deck.
Of particular interest was the fatigue performance of each deck. The four fatigue tests showed that the Martin Marietta and ZellComp decks were adequate for the Morrison Bridge. Unfortunately, there were insufficient data to make the same determination for the modified ZellComp option. The modified ZellComp deck failed in fatigue testing according to the HITEC fatigue testing procedure; however, this procedure was found to not be representative of the Morrison Bridge. In both modified ZellComp fatigue tests, bolt failures occurred and should therefore be monitored in field situations. Fatigue testing cracked the overlay over the lap joints in the modified ZellComp fatigue tests, but fatigue was not found to damage the overlay in other places on the deck.
The bolted mechanical connections for the modified ZellComp and Martin Marietta decks were evaluated by individual bolt tests as well as deck-to-stringer tests and then compared. The diaphragm stiffness for the ZellComp and modified ZellComp decks was found. A clamp test for the Martin Marietta showed that increased stiffness and strength can be obtained in deck-to-stringer connections through clamps.

56

57
7.0 AREAS OF FUTURE RESEARCH NEEDS
One of the main gaps of knowledge that became increasingly apparent deals with understanding the fatigue behavior of FPR pultruded materials, the panel-to-panel connections and the associated overlay integrity. While individual bridge application of FRP decks can be investigated based on the traffic flow patterns using AASHTO, such approaches are not practical if FRP decks are to be more broadly adopted. General fatigue curves of the pultruded material based on the number of cycles to failure given a nominal stress needs to be developed in a broader sense. In this way, guidance can be provided to the designer and provide less uncertainty for adoption of these materials. Since panels are typically connected in the field to make full decks, the connections in terms of structural as well as overlay integrity need to be understood.
Another area of potential research that would be of benefit include the development of service load deflection guidelines. FRP decks are less stiff than conventional, but that is not necessarily problematic given that they do not have the same vibration issues that drive the current criteria.

58

59
8.0 REFERENCES
AASHTO, American Association of State Highway Transportations Officials. "AASHTO LRFD Bridge Design Specifications." 2010.
Alagusundaramoorthy, P., I. E. Harik, and C. C. Choo. "Structural behavior of FRP composite bridge deck panels." Journal of Bridge Engineering (American Society of Civil Engineers) 11, no. 4 (July 2006): 384-393.
Bakis, C. E., et al. "Fiber-reinforced polymer composites for construction - State-of-the-art review." Journal of Composites for Construction (American Society of Civil Engineers) 6, no. 2 (May 2002): 73-87.
Brown, David L., and Jeffrey W. Berman. "Fatigue and strength evaluation of two glass fiber-reinforced polymer bridge decks." Journal of Bridge Engineering (American Society of Civil Engineers) 15, no. 3 (2010): 290-301.
Cai, C. S., S. O. Oghumu, and David A Meggers. "Finite-element modeling and development of equivalent properties for FRP bridge panels." Journal of Bridge Engineering (American Society of Civil Engineers) 14, no. 2 (2009): 112-121.
Daly, Albert F., and John R. Cuninghame. "Performance of a fibre-reinforced polymer bridge deck under dynamic wheel loading." Composites Part A: Applied Science and Manufacturing (Elsevier Ltd) 37, no. 8 (August 2006): 1180-1188.
Daniel, Isaac M., and Ori Ishai. Engineering mechanics of composite materials. Oxford, New York: Oxford University Press, 1994.
Davalos, J. F., H. A. Salim, P. Qiao, R. Lopez-Anido, and E. J. Barbero. "Analysis and design of pultruded FRP shapes under bending." Composites Part B: Engineering (Elsevier Science Ltd, Oxford, United Kingdom) 27, no. 3-4 (1996): 295-305.
Dutta, Piyush K., Roberto Lopez-Anido, and Soon-Chul Kwon. "Fatigue durability of FRP composite bridge decks at extreme temperatures." International Journal of Materials and Product Technology (Inderscience Enterprises Ltd) 28, no. 1-2 (2007): 198-216.
Fanpop. Fanpop. 2009. http://www.fanpop.com/spots/portland/images/696675/title/morrison-bridge-photo (accessed 1 19, 2012).
Hong, Taehoon, and Makarand Hastak. "Construction, inspection, and maintenance of FRP deck panels." Journal of Composites for Construction (American Society of Civil Engineers) 10, no. 6 (2006): 561-572.

60
Kumar, Prakash, K. Chandrashekhara, and Antonio Nanni. "Structural performance of a FRP bridge deck." Construction and Building Materials (Elsevier Ltd) 18, no. 1 (February 2004): 35-47.
Learn, Scott. OregonianLive. 11 5, 2011. http://www.oregonlive.com/environment/index.ssf/2011/11/multnomah_county_construction.html (accessed 1 19, 2012).
Machado, Marcelo A.S., Elisa D. Sotelino, and Judy Liu. "Modeling technique for honeycomb FRP deck bridges via finite elements." Journal of Structural Engineering (American Society of Civil Engineers) 134, no. 4 (2008): 572-580.
Moses, Jonathan P., Kent A. Harries, Christopher J. Earls, and Wahyu Yulismana. "Evaluation of effective width and distribution factors for GFRP bridge decks supported on steel girders." Journal of Bridge Engineering (American Society of Civil Engineers) 11, no. 4 (July 2006): 401-409.
Qiao, Pizhong, Julio F. Davalos, and Brian Brown. "Systematic analysis and design approach for single-span FRP deck-stringer bridges." Composites Part B: Engineering (Elsevier Science Ltd) 31, no. 6-7 (October 2000): 593-609.
Reising, Reiner M. W., Bahram M. Shahrooz, Victor J. Hunt, Andy R. Neumann, Arthur J. Helmicki, and Makarand Hastak. "Close look at construction issues and performance of four fiber-reinforced polymer composite bridge decks." Journal of Composites for Construction (American Society of Civil Engineers) 8, no. 1 (January 2004): 33-42.
Reynaud, David, and Vistasp M. Karbhari. "HITEC evaluation plan for assessment of FRP bridge deck systems." 46th International SAMPE Symposium and Exhibition -2001 a Materials and Processes Odyssey. Long Beach: Soc. for the Advancement of Material and Process Engineering, 2001. 2366-2379.
Telang, Niket M., Chris Dumlao, Armin B. Mehrabi, Adrian T. Ciolko, and Jim Gutierrez. NCHRP report 564: field inspection of in-service FRP bridge decks. National Cooperative Highway Research Program, Washington, DC: Transportation Research Board, 2006.
TripWow. TripWow. 1 19, 2012. http://tripwow.tripadvisor.com/slideshow-photo/morrison-bridge-opens-to-let-tug-boat-pass-portland-united-states.html?sid=11835622&fid=upload_12899312092-tpfil02aw-9407 (accessed 1 19, 2012).
Zureick, A., B. Shih, and E. Munley. "Fiber-reinforced polymeric bridge decks." Structural Engineering Review 7, no. 3 (1995): 257-266.

APPENDIX A –
LATERAL TEST FRAME STIFFNESS


1
A drawing of the specimen used for the steel frame diaphragm test is shown in Fig. A1(a). The test specimen was assembled in a similar manner as those discussed for the modified ZellComp deck diaphragm specimen in section 3.2. One girder was fixed from movement via a weld. The other girder was free to move in the plane of the deck but was restrained from out of plane motion through wheels. Fig. A1(a) shows the loading and instrumentation of the test. The load was applied at the free girder end, and the displacement was measured from the ground to the free girder. Fig. A1(b) shows the displacement of each cycle for the diaphragm test. The maximum displacement was measured to be 63.5 mm (2.5 in) at a load of 1.6 kN (0.35 kip).
Fig. A1: Diaphragm steel frame
A drawing of the specimen used for the steel frame diaphragm test is shown in Fig. A2(a). The test specimen was assembled in a similar manner as those discussed for the modified ZellComp deck diaphragm specimen in section 3.2. One girder was fixed from movement via a weld. The other girder was free to move in the plane of the deck but was restrained from out of plane motion through wheels. Two stiffeners were added and a weld fixed after the modified ZellComp diaphragm test. Fig. A2(a) shows the loading and instrumentation of the test. The load was applied at the free girder end, and the displacement was measured from the ground to the free girder. Fig. A2(b) shows the displacement of each cycle for the diaphragm test. The maximum displacement was measured to be 63.5 mm (2.5 in) at a load of 1.7 kN (0.375 kip).

2
Fig. A2: Modified diaphragm steel frame