Dietary Diversity and N utrient Adequacy In Women of ...
107
Dietary Diversity and Nutrient Adequacy In Women of Childbearing Age In a Senegalese Peri-urban Community Dina L. Spigelski School of Dietetics and Ruman Nutrition McGill University, Montreal A Thesis submitted to the Faculty of Graduate Studies and Research in partial fulfillment of the requirements for a Master of Science May 2004 © Dina L. Spigelski, 2004
-
Upload
khangminh22 -
Category
Documents
-
view
2 -
download
0
Transcript of Dietary Diversity and N utrient Adequacy In Women of ...

Dietary Diversity and N utrient Adequacy
In Women of Childbearing Age
In a Senegalese Peri-urban Community
Dina L. Spigelski
School of Dietetics and Ruman Nutrition McGill University, Montreal
A Thesis submitted to the Faculty of Graduate Studies and Research in partial fulfillment of the requirements for a Master of Science
May 2004
© Dina L. Spigelski, 2004

1+1 Library and Archives Canada
Bibliothèque et Archives Canada
Published Heritage Branch
Direction du Patrimoine de l'édition
395 Wellington Street Ottawa ON K1A ON4 Canada
395, rue Wellington Ottawa ON K1A ON4 Canada
NOTICE: The author has granted a nonexclusive license allowing Library and Archives Canada to reproduce, publish, archive, preserve, conserve, communicate to the public by telecommunication or on the Internet, loan, distribute and sell th es es worldwide, for commercial or noncommercial purposes, in microform, paper, electronic and/or any other formats.
The author retains copyright ownership and moral rights in this thesis. Neither the thesis nor substantial extracts from it may be printed or otherwise reproduced without the author's permission.
ln compliance with the Canadian Privacy Act some supporting forms may have been removed from this thesis.
While these forms may be included in the document page count, their removal does not represent any loss of content from the thesis.
• •• Canada
AVIS:
Your file Votre référence ISBN: 0-612-98743-4 Our file Notre référence ISBN: 0-612-98743-4
L'auteur a accordé une licence non exclusive permettant à la Bibliothèque et Archives Canada de reproduire, publier, archiver, sauvegarder, conserver, transmettre au public par télécommunication ou par l'Internet, prêter, distribuer et vendre des thèses partout dans le monde, à des fins commerciales ou autres, sur support microforme, papier, électronique et/ou autres formats.
L'auteur conserve la propriété du droit d'auteur et des droits moraux qui protège cette thèse. Ni la thèse ni des extraits substantiels de celle-ci ne doivent être imprimés ou autrement reproduits sans son autorisation.
Conformément à la loi canadienne sur la protection de la vie privée, quelques formulaires secondaires ont été enlevés de cette thèse.
Bien que ces formulaires aient inclus dans la pagination, il n'y aura aucun contenu manquant.

Acknowledgements
Wat gaal yegoo (Together the community raises the pirogue)
Lébou expression
This research project was made possible through the support and cooperation of a number ofkey institutions. The School of Dietetics and Human Nutrition and the Centre for Indigenous Peoples' Nutrition and Environment (CINE) at McGill University and the Centre de Ressources pour l'Émergence Sociale Participative (CRESP) in Yoffprovided office space and logistical support. The Équipe de Nutrition in the Faculté des Sciences et Techniques at Université Cheikh Anta Diop (UCAD) in Dakar provided valuable advice and technical assistance. The Faculté de Médecine at UCAD kindly provided the HemoCue™ machine. The Centre de Santé Philippe Maguilen Senghor provided important medical counsel and support. The Canadian International Development Agency (CIDA) provided financial support for this project through their Awards Programfor Canadians. Le Fonds de la recherche en santé Québec (FRSQ) provided personal funding through their Bourses de recherche en santé (2e cycle) pro gram.
During the course of this research 1 have had the good fortune to work with many remarkable individuals both in Canada and in Senegal. Primary among these are my supervisors and committee members. 1 am deeply indebted to my supervisor Dr. Timothy Johns for his confidence in me. His creativity and passion for exploration fed my mind and spirit. Thank you to my co-supervisor Dr. Katherine Gray-Donald for keeping my feet on the ground and pointed in the right direction. 1 also extend thanks to Dr. Harriet Kuhnlein for her encouragement and thoughtful insight and to the project collaborator, Dr. Marian Zeitlin who introduced me to the very special community ofYoff.
ln Senegal, 1 received much support from research colleagues and assistants. 1 thank the staff at CRESP who provided invaluable administrative support. Special thanks to As N'Gala who helped me adapt my methodology to the reality of the village and helped me gain a deeper understanding of the community and the complexity of the village structure. 1 also extend many thanks to Dr. Ly and the support staff at the Centre de Santé Philippe Maguilen Senghor for their encouragement, interest and involvement in this project. 1 thank Aita Sarr from the Équipe de Nutrition at UCAD for her friendly encouragement. 1 would like to express my sincere gratitude to the Lô family who kindly accepted me into their home, offered me their friendship, and acted as key informants throughout the research process. Sarah Klein cannot be thanked enough for her encouragement and words of wisdom when they were most needed. Very special thanks go to Salimata N'Doye my community research partner. Her intelligence, professionalism, sense ofhumor, and commitment to her community made her an ideal partner. 1 am forever grateful that she welcomed me into her life and indebted to her for her candor and patience as we walked the research path together. 1 am deeply thankful to aIl study participants. These women warmly welcomed me into their homes and readily found the time to answer my questions amidst cooking, caring for babies, cleaning the
1

house and eaming a living. These women are truly remarkable and are a testament to the strength of the human spirit. It is my greatest hope that in discovering each other and in problem solving together they have leamed as much as l have.
At McGill, l thank Louise Johnson-Down for her invaluable guidance with CANDAT and SAS. l thank all my fellow graduate students who supported me in many ways and were very generous with their time. Thank you very much to Lise Grant and Francine Tardif whose support has never been taken for granted.
l am very grateful to Barbara Butler, a true friend who has never stopped supporting me. l thank my mother, father and sisters. It is their faith in me that has allowed me to believe that anything is possible and has given me the courage to challenge myself.
11

Abstract
The validity of two measures of dietary diversity derived from a qualitative
diversity questionnaire (reference periods of 1 or 7 days) by comparison with nutrient
intake from three 24-hour recalls was investigated in 51 women (18 - 45 y) in a peri
urban community in Senegal, West Africa. Significant positive correlations (range: r =
0.30 to r = 0.64) were found between intakes of calcium, iron, zinc, vitamin A, vitamin C,
thiamine, riboflavin and vitamin B6 and diversity score based on number of different
individual foods derived from data obtained from the 7-day reference period. Data from
the diversity score from the I-day reference period was less well correlated with the 24-hr
recalls. Our data suggest that a diversity measure based on foods derived from a diversity
questionnaire would be useful in the monitoring of nutrient intake changes over time
within populations.
111

Résumé
La validité de deux mesures de diversité alimentaire dérivé d'un questionnaire de
diversité qualitatif (périodes de référence étant de 1 ou 7 jours) en comparaison avec
l'apport nutritif de trois rappels de 24 heures a été examiné chez 51 femmes (18 - 45 ans)
d'une communauté peri-urbaine du Sénégal. Des corrélations positives (r = 0.30 à
r = 0.64) ont été établies entre la consommation de calcium, de fer, de zinc, de vitamine
A, de vitamine C, de thiamine, de riboflavine et de vitamine B6 et le score de diversité
basé sur le nombre d'aliments obtenus de la période de référence de 7 jours. Le score de
diversité obtenu de la période de référence de 1- jour corrélait moins avec les rappels de
24 heures. Nos résultats suggèrent qu'une mesure de diversité estimée des aliments
rapportés sur un questionnaire de diversité puisse être utile pour le monitorage de
changements temporels d'apport de nutriments chez des populations.
IV

Contribution of Authors
The candidate worked with Dr. T. Johns, the thesis supervisor and Dr. K. GrayDonald, the thesis co-supervisor to deve10p the research question and project objectives. The candidate sought out and obtained funding for the project.
Subsequently, the candidate deve10ped the questionnaire tools, hired a local research partner, and collected all data with the research partner. The candidate was responsible for data management, which included coding of raw data, verifying data, and building CANDAT and SAS files. The candidate conducted all analyses and prepared initial draft ofmanuscript. For further data analysis and interpretation, Dr. T. Johns and Dr. K. Gray-Donald provided guidance.
The paper Dietary Diversity and Nutrient Adequacy in Women ofChildbearing Age in a Peri-Urban Community in Senegal, West Africa was co-authored by the members of the committee.
v

Table 2.1
Table 3.1
Table 3.2
Table 3.3
Table 3.4
Table 3.5
Table 3.6
List of Tables
Summary of studies in developing countries that have investigated dietary diversity and nutrient adequacy .......................................... 32
Characteristics of study participants .............................................. 59
Frequency of food items cited for diversity questionnaire (Id and 7d periods) and 24-hour recall (3d period) ............................. 60
Distribution of adjusted nutrient intakes from mean of three 24-hour recalls compared to the F AO/WHO vitamin and mineraI recommended nutrient intakes (FAO/WHO, 2002) .............................................. 63
Food diversity scores (FDS) and group diversity scores (GDS) for IdDQ, 7dDQ and 24-hour recall ................................................ 64
Correlation statistics for adjusted micro- and macronutrient intakes and food diversity score (FDS) for IdDQ, 7dDQ and 24-hour recaI1.. ..... 65
Mean and percent contribution of most important contributors from mean of three 24-hour recalls ................................................... 66
List of Figures
Figure 3.1 Distribution ofhemoglobin (Hb) concentrations (n=59) ....................... 69
Figure 3.2 Frequency bar chart for Food Diversity Score (FDS) for IdDQ (no fatloil, sweets, spices, supplements) ......................................... 70
Figure 3.3 Frequency bar chart for Group Diversity Score (GDS) for IdDQ (no fatloil, sweets, spices, supplements) ......................................... 71
Figure 3.4 Frequency bar chart for Food Diversity Score (FDS) for 7dDQ (no fatloit, sweets, spices, supplements) .......................................... 72
Figure 3.5 Frequency bar chart for Group Diversity Score (GDS) for 7dDQ (no fat/oil, sweets, spices, supplements) .......................................... 73
VI

Table of Contents
1.0 Introduction ..................................................................................... 1
2.0 Review of the Literature ..................................................................... .4
2.1 Estimating Dietary Intake ................................................................... .4
2.2 Dietary Diversity: Terms Defined ........................................................ 8
2.3 Dietary Diversity: Developing Country Studies ........................................ 10
2.4 Dietary Diversity: The Urban Setting ................................................... 21
2.5 Iron Intake and Millet ...................................................................... 22
2.6 Target Population ........................................................................ 25
2.7 Study Rationale ........................................................................... 30
2.8 Study Objectives .......................................................................... 31
3.0 Manuscript ..................................................................................... 35
Dietary Diversity and Nutrient Adequacy in Women of Childbearing Age in a Peri-Urban Community in Senegal, West Africa
3.1 Abstract .................................................................................... 36
3.2 Introduction .............................................................................. 37
3.3 Subjects and Methods ................................................................... .38
3.4 Results ..................................................................................... 45
3.5 Discussion ................................................................................. 52
4.0 Conclusion .................................................................................... 74
5.0 References ..................................................................................... 77
6.0 Appendices ................................................................................... A-l
6.1 Consent Form for Study Participants ................................................... A-3
vu

6.2 Socio-demographic Questionnaire ...................................................... A-6
6.3 Diversity Questionnaire .................................................................. A-9
6.4 24-Hour Recall Questionnaire .......................................................... A-II
6.5 McGill University Ethics Certificate ................................................. A-13
viii

1.0 Introduction
Dietary diversity is identified as an important element of a high quality diet
(Tucker, 2001; Johns, 2003). Although there are few data to defend the health benefits of
a diverse diet, it has been the mainstay of public health recommendations for many years
(Krebs-Smith et al, 1987; Hertzler et al, 1974). Dietary guidelines in developed countries
advocate consumption of a variety of foods both within foods groups and between food
groups (US Department of Agriculture Human Nutrition Information Service, 1992;
Health Canada, 1992). Several reasons have been postulated as to why a diet containing a
variety of foods might ensure health. The first of these reasons is an adequate intake of
nutrients, in part due to our limited knowledge of the repertoire of dietary components
beneficial for health as weIl as the known variation of nutrient composition between
foods. In addition, the bioavailability of important micronutrients is greatly improved
when selected foods are consumed in combination (Rao & Prabhavathi, 1978;
FAO/WHO, 2002). Dietary diversity is also thought to decrease the chances ofboth
deficiency and excess and to decrease the chances ofunhealthy levels oftoxicants. There
is much evidence of the benefits of dietary diversity. A more diverse diet has been
associated with a number of improved health outcomes such as birth weight (Rao et al,
2001), child anthropometric status (Allen et al, 1991; Hath:JY et al, 2000; Onyango et al,
1998; Taren & Chen, 1993; Tarini et al, 1999), improved hemoglobin concentrations
(Bhargava et al, 2001), reduced incidence of hypertension (Miller et al, 1992), and
reduced risk of mortality from cardiovascular disease and cancer (Kant et al, 1995) and
reduced morbidity (Wahlqvist et al, 1989; Hsu-Hage & Wahlqvist, 1996).
1

Dietary diversity in the context of the developing world is particularly relevant.
Diets are typically low in dietary diversity with emphasis on a small number of starchy
staples and a limited quantity of animal products and fresh fruits and vegetables. This
type of diet is at risk ofleading to deficiencies or excesses of several micro or
macronutrients (Tontisirin et al, 2002). Because diversity is considered to protect against
nutrient deficiency and excess, food-based approaches emphasizing diversity are strongly
advocated as sustainable approaches in the effort to improve nutrient status (WHO/F AO,
1996; Underwood, 2000; ILS l, 2002).
Simple, reliable and valid tools are important in development work for the
purposes of assessment, the design of targeted intervention programs, and the monitoring
and evaluating of the impact of poli ci es and programs. To this end, researchers have
explored the use of dietary diversity indicators as proxy measures of diet quality in
general and adequacy of certain nutrients in particular, an important health concem in the
deve10ping world. If a diet with a high leve1 of diversity do es provide an adequate amount
of required nutrients, then measuring that diversity would be a good way of measuring
adequacy. Dietary diversity indicators are promising because they are potentially based
on simple, easy to collect data.
Documentation of dietary data is important in planning, evaluating and justifying
policies and strategies re1ated to nutrition interventions. Dietary assessment in deve10ping
countries is particularly challenging and quantification of food intake is particularly
difficult in populations that eat from shared bowls (Torheim et al, 2001). With poor
2

health and nutrient deficiencies common to the deve10ping world, and methods of diet
assessment often costly, an inexpensive simple tool to assess the nutritional quality of a
diet in a community would be very useful. Studies measuring dietary diversity in the
deve10ping world have indicated that tools based on dietary diversity can capture
important aspects of a population's diet (Arimond & Ruel, 2002; Hatl0Y et al, 1998;
Hatl0Y et al, 2000; Ogle et al, 2001; Onyango et al, 1998; Rose et al, 2002; Rose &
Tschirley, 2003; Tarini et al, 1999; Torheim et al, 2003).
3

2.0 Review of the Literature
2.1 ESTIMATING DIETARY INTAKE
Dietary intake estimation involves collection of infonnation on types and
quantities of foods eaten. The method chosen is dictated by the dietary infonnation of
interest, the population being studied, the precision desired, the cost, the length of time
and the social and physical context (Dwyer, 1999). For individual dietary assessment, diet
history, multiple 24-hour recalls, weighed food records, and food frequency
questionnaires have been used.
Researchers have often used weighed food records to collect quantitative dietary
intake data in deve10ping countries, because it is thought to be one of the most accurate of
methods. It is however, time consuming and expensive. In addition, it has a high
respondent burden and because it can be disruptive to daily routines, it may not be an
accurate reflection ofusual intake (Gibson, 1990).
The food frequency questionnaire also examines individual intake. This method
requires that the participants recall usual frequency of consumption over a given period,
which could be daily, weekly, or monthly. The semi-quantitative food frequency
questionnaire inc1udes estimates of usual portion sizes such as small, medium or large or
in comparison to a "standard" serving size. The quantitative food frequency inc1udes
more precise food portion sizes such as usual weight, volume or household measures
4

(Thompson & Byers, 1994). Nutrient intake is determined by summing the reported
frequency multiplied by the amount consumed over all reported foods and expressed in
grams consumed per day. It is a reflection of a longer period of consumption, and may
allow observations of seasonality.
The 24-hour recall is re1atively easy and less time consuming than weighed food
records and may be better at characterizing individual intakes than food frequency
questionnaires. Indeed, some researchers have found that African women are better able
to respond to specifie questions re1ated to the previous day rather than to report habituaI
food habits and intakes over a period oftime (Gibson & Ferguson, 1999). This method is
a reflection of CUITent dietary consumption. Participants are required to recall aIl food and
beverages consumed during a 24-hour period. One of the principal advantages of the 24-
hour recall is the speed and ease ofits administration. In addition, the respondent's
literacy leve1 does not affect the quality of information and the respondent burden is
limited. Furthermore, the immediacy of the recall period means that respondents are
usually capable of remembering the food consumed. AIso, because the recaIls take place
after the food has been consumed, the assessment method does not interfere with dietary
behaviour.
Although the 24-hour recall is fairly easy to complete, participants may vary in
their ability and willingness to recall, describe, and quantify foods that have been
consumed. Therefore, it is important that interviewers are trained to ask probing questions
to facilitate recall. The probes must remain neutral such that the interviewer do es not
influence the responses. In order to obtain adequate description of food items,
5

interviewers must ask about the preparation of foods and brand names in addition to types
of specific ingredients. Food portion models and calibrated utensils have been
successfully used in previous studies to help participants in description of quantities and
types offoods (Posner et al, 1992; Moore et al, 1967; Labadarios, 1999; Ferguson et al,
1995).
When administering the 24-hour recall, there are several important issues to
consider. Respondents may overestimate information that is perceived as having more
status, such as consumption of meat and refined cereals. For the opposite reason,
consumption ofvegetables and unrefined cereals and use oftobacco and alcohol may be
under reported (Gibson & Ferguson, 1999). In addition, single 24-hour recalls can only be
used to describe food intake of groups, not individuals. Because of intra individual
variation in intake, multiple recalls are required in order to obtain an estimate ofusual
intake (Gibson, 1990). Finally, non-consecutive days should be inc1uded for repeating 24-
hour recalls in an effort to minimize error introduced by dietary intakes on adjacent days
(National Research Council, 1986).
Twenty-four hour recalls have been used successfully in the developing country
context. For example, this method was used to assess intakes in pregnant women in
Malawi (Ferguson et al, 1995). Relative validity was measured by comparing the intakes
from two 24-hour recalls to weighed records of the same days. Iron and zinc measures
were similar for both methods. Later, dietary information obtained from three 24-hour
recalls in the same population compared well to biochemical indices of iron such as
6

serum iron and percentage transferrin saturation and zinc from hair (Gibson & Huddle,
1998).
There are several challenges to measuring food intake in a West African
population. Most notably, meals are often consumed from a common bowl, and therefore
quantities may be difficult to establish. In addition, the successful execution of the 24-
hour reca1l requires professionals trained in the collection of dietary intake.
Recently, a research group set out to validate a quantitative food-frequency
(QFFQ) in Mali (Torheim et al, 2001). The tool was designed to measure habituaI food
and nutrient intake of one season in rural communities in Mali. Food intake for the week
preceding the interview was measured with a 69-item QFFQ. These intakes were
subsequently compared with intakes from 2-day combined weighed and recalled diet
records. Subjects were men and women aged 15-59 years. Spearman rank correlations
between intake of food groups from the QFFQ and the diet record were ca1culated. The
median correlation coefficient for nutrient intake was 0.40. Men were found to have
higher coefficients than women. Overall, intakes of most food groups and nutrients
determined from the QFFQ were higher than those measured by the diet record.
Therefore, a moderate correlation was observed, but the QFFQ overestimated intake
when compared to the diet record.
A revised version of this QFFQ was tested in Mali by the same group (Parr et al,
2002). The dietary intake for the week prior to the interview was assessed with a 164-item
QFFQ. This intake was compared to the intake measured with a 2-day weighed record
7

with weighed recipes. Subjects were men and women aged 15-45 years. Spearman's rank
correlation for energy and nutrients ranged from 0.16 (% energy from protein) to 0.62
(retinol equivalents). This version ofthe QFFQ underestimated total food weight. The
ability to rank and categorize subjects according to dietary intake was similar in both
versions. However, the QFFQ did not determine absolute intakes in a consistent manner.
Although it is important to recognize cultural differences between memory and
ability to quantify portions, these studies provide promise for the use of a FFQ in similar
populations. The question remains as to whether removing the quantitative nature of the
QFFQ disturbs the ability to categorize subjects according to nutrient intake.
2.2 DIETARY DIVERSITY: TERMS DEFINED
The following is an overview of the literature on dietary diversity and nutrient
adequacy in the context of the deve10ping world. To begin, several terms are defined.
Nutrient adequacy has referred to the attainment of recommended intakes of key
nutrients for health. However, in the literature there has been no gold standard list of
nutrients and nutrient levels to define adequacy. Instead, researchers have chosen
nutrients based on relevance to the community and data base availability. For the
measurement of adequacy, sorne studies have chosen the Nutrient Adequacy Ratio (NAR)
and the Mean Nutrient Adequacy Ratio (MAR). The use of these terms was first explored
by Madden & Yoder (1972) and further deve10ped by Guthrie & Scheer (1981).
Subsequently, the concept has been used in both developed and developing countries
8

(Krebs-Smith et al, 1987; Hat10Y et al, 1998). NAR is the ratio ofan individual's intake
of a nutrient over the recommended intake of that nutrient (the requirement for 97% of
the population). MAR is the average of the NARs. Each NAR is usuaUy truncated at
100% so that a very high intake of one nutrient is limited in its ability to mask a low
intake of another. Although this masking effect is limited, difficulties remain in
interpretation if a population or an individual consumes a diet high in sorne nutrients but
low in others. Another important limitation ofusing the MAR index is that aU nutrients
are given equal weight. For instance, in calculating the score riboflavin, iron and vitamin
A are treated in the same manner. Certainly, aU nutrients are important, however
deficiencies of sorne are more urgent health priorities than others.
Dietary diversity is most commonly defined as the number of different foods or
food groups consumed over a given dietary measurement period. Food Variety Score
(FVS) and Dietary Diversity Score (DDS) are two indices that have been used as
measures of diversity. FVS is obtained from a count of the number of foods consumed
over a given reference period and DDS is from a count of food groups consumed over a
given reference period. The measurement period has most commonly ranged from 1 to 3
days or 7 days. In deve10ped countries, a basic count of foods or food groups has been
employed (Krebs-Smith et al, 1987). Altemative1y, other researchers have further
analyzed food intake such that the number of servings of different food groups may be
accounted for or food items are differentiaUy weighted (Kant et al, 1993). However,
studies conducted in developing countries have tended to use only single food counts or
food group counts. Several research groups have used both unique food counts and food
9
group counts. Several studies have used dietary diversity indicators by household rather
than by individual.
2.3 DIETARY DIVERSITY: DEVELOPING COUNTRY STUDIES
While dietary diversity research in the developed world context is extensive
(Hodgson et al, 1994; Kant, 1996; Drewnowski et al, 1997), the investigation of dietary
diversity as an indicator of nutrient adequacy in developing countries has only been
recent. A review of the literature to date has found studies conducted in Niger (Tarini et
al, 1999), Kenya (Onyango et al, 1998), Vietnam (Ogle et al, 2001), Mali (Hat1ey et al,
1998; Hat1ey et al, 2000; Torheim et al, 2003), Ghana and Malawi (Ferguson et al, 1993),
Mozambique (Rose et al, 2002; Rose & Tschirley, 2003), Ethiopia (Arimond & Ruel,
2002) and China (Stookey et al, 2000). These studies have used different numbers of
foods and food groups as well as different measurement time periods, different cut-off
values, and sorne have used mathematical models. The choice of subjects has also varied.
Dietary measurement has been on either adult women, or adult men and women, or
children, or whole households.
The following is a summary ofthese studies and a description ofhow well their
dietary diversity indicators address nutrient adequacy. Table 2.1 (page 32) provides a
summary ofthe salient points. For additional information, two comprehensive review
articles provide more detailed descriptions of diet quality indexes tested in the developed
world (Kant, 1996) and dietary diversity in relation to dietary quality, nutrient adequacy,
measures of nutritional status and food security in the developing world (Ruel, 2002).
10

Two indices of dietary diversity were validated against nutrient adequacy in 77
children 13 - 58 months of age living in Mali (Hatl0Y et al, 1998). The study employed
two diversity scores: FVS and DDS. FVS, based on a count of number of foods and DDS,
based on 8 food groups were calculated based upon quantitative dietary assessment of
each child using direct food weighing for 2-3 days. A count of the number of food groups
or food items consumed provided a good assessment of the nutritional adequacy of the
diet. The food groups were divided as follows: staples (e.g.: ground nuts, rice, millet,
beans), vegetables, fruit, meat, milk, fish, egg, green leaves, other (e.g.: oil, sugar,
sweets). Participants cited 75 different food items. Nutrients that were examined were:
protein, fat, vitamin A, vitamin C, thiamine, ribotlavin, niacin, folic acid, iron, calcium in
addition to overall energy. Researchers measured nutrient adequacy using NAR and
MAR. A MAR equal to 0.75 was used as a cut-off point for a nutritionally adequate diet.
A positive but weak correlation was found between FVS and MAR (r = 0.33, P < 0.001)
and between DDS and MAR (r = 0.39, P < 0.001). In regression analysis, DDS was found
to be more strongly associated with nutrient adequacy than FVS. The implication being
that increasing the number of food groups has a greater impact on dietary quality than
increasing the number of foods in the diet. However, this interpretation by the authors
must be considered cautiously. Correlations of 0.33 and 0.39 are not likely to be different
enough in a practical sense to warrant using one score over another.
The authors tested different cut-offpoints for FVS and DDS in order to find the
optimal values that could correctly identify as many inadequate diets as possible (high
sensitivity) without losing too much ability to identify those with a nutritionallY adequate
11

diet (speeifieity). The best eut-off points found to prediet nutrient adequaey were 6 for
food group diversity and 23 for food variety. With a eut-off for FVS of23, the sensitivity
was 87% and the specificity was 29%. With a eut-off for DDS of 6, the sensitivity was
77% and the specificity was 33%. The authors recognized that the results are site-specifie,
however they suggested that the methodological approach used might be considered in
future study areas. Given the poor sensitivity and specificity, further research would be
useful in determining whether these values could be improved.
Recently, the same research group investigated the use of a Quantitative Food
Frequency Questionnaire (QFFQ) to assess food variety (Torheim et al, 2003). The
validity of three diet quality indexes (FVS, DDS and MAR) was evaluated using data
obtained from QFFQ validation exercises that involved two separate study groups: A
(sample size = 75) and B (sample size = 70). FVS, DDS, and MAR derived from the
QFFQ were compared to the same indexes obtained from 2-day weighed records (WR).
They conc1uded that FVS and DDS can be assessed by the QFFQ. In addition, the ranking
of individuals according to FVS and DDS from the QFFQ was compared to the ranking
ofindividuals according to MAR obtained from WR. Spearman's correlation coefficients
between FVS obtained from the QFFQ and WR for men were 0.49 (p < 0.01) and 0.35 (p
< 0.05) in study A and B, respectively. Values for DDS were 0.20 (not significant) and
0.39 (p < 0.05) for study A and B respeetively. Correlations for women were lower and
not significant. For the total sample, Spearman's correlation coefficients between MAR
obtained from QFFQ and WR were 0.40 (p < 0.01) and 0.49 (p < 0.01) for study A and B,
respectively. The researchers investigated to what extent the two diet variety scores
derived from the QFFQ reflect overall nutritional quality (MAR based on WR). FVS and
12

DDS derived from the QFFQ weakly correlated with MAR from the WR. Correlations for
study A were 0.36 (p < 0.01) and 0.35 (p < 0.01) for FVS and DDS, respectively.
Correlations for study B were 0.24 (p < 0.05) and 0.29 (p < 0.05) for FVS and DDS,
respectively. These correlations are similar to work done previously by this group (HatIey
et al, 1998). Ranking ofindividuals in study A found 36% of the subjects placed in the
same quartiles of FVS and MAR, while 5% were in opposite quartiles. For DDS, the
values were 43% and 8%, respectively. In study B, 29% were classified into the same
quartiles ofFVS and MAR, while 9% were in opposite quartiles. For DDS, the values
were 34% and 6%, respectively. This study was able to demonstrate weak correlations
between diversity measures obtained from QFFQ and WR.
Ogle et al (2001) employed a similar methodology to HatIey et al (1998) in order
to explore the association between food variety (as described by FVS and DDS) and
nutrient intake among 217 rural Vietnamese women, aged 19 - 60 years. Data were
grouped into two geographic regions: the Mekong Delta and the Central Highlands. FVS
and DDS were calculated on the basis of an adapted food frequency methodology with a
recall period of seven consecutive days (7dFFQ). Face to face interviews were conducted
in the homes of the participants. The questionnaire included commonly used foods that
were divided into 12 food categories. These food categories were those used by the
National Institute of Nutrition in previous national surveys: rice, other cereals, starchy
roots, green leafy vegetables, other vegetables, fishlseafood, meat, eggs, nuts/legumes,
fruits/juice, oils/fats, beverages/biscuits/sweets. In order to determine usual portion sizes,
life-sized photos of foods and prepared dishes were used during interviews. In addition,
several households were asked to weigh and record aU foods used during three days, and
13

team members weighed foods whenever possible. The 7dFFQ registered 120 different
food items. The FYS for individual women ranged from 6 to 39. The number of food
groups, or the DDS, ranged from 5 to Il. The nutrients that were examined were
carbohydrate, protein, fat, calcium, iron, zinc, vitamin A, thiamine, ribotlavin, niacin,
vitamin C, and folate, in addition to overall energy.
Associations between variables were tested by grouping values into three
categories (terciles). In each region, the group in the highest variety tercile was compared
to that ofthe lowest. Women in the highest tercile ofFYS (consumed 21 or more
different foods in 7 days) had significantly higher (actual values not reported) intake of
most nutrients that were studied compared to those in the lowest tercile FYS (consumed
15 foods or less). In the Mekong Delta, women in the high FYS group had significantly
higher mean intakes of all nutrients compared to the low FYS group (p < 0.01 for energy,
protein, calcium and zinc; p < 0.001 for carbohydrate, fat, iron, vitamin A, thiamine,
ribotlavin, niacin, folate and vitamin C). In the Central Highlands, the difference was
significant for only several nutrients (p < 0.05 for energy and thiamine; p < 0.001 for
protein, fat and niacin). Women with a DDS greater or equal to 8 had significantly higher
nutrient adequacy ratios for energy, protein, niacin, vitamin C, and zinc. The high FYS
group was found to have intakes of21-39 items. The lower end ofthis scale agrees well
with the best cut-offpoint of23 items that was calculated by Hatl0Y et al (1998). The
authors were also interested in the significance ofwild vegetables in the diet. An analysis
ofwild vegetable consumption and FYS found that a greater variety ofwild vegetables
paralleled a higher dietary diversity. Despite these interesting findings, the authors
describe no strong associations between both FYS and DDS and nutritional status
14
indicators such as hemoglobin, serum ferritin, serum retinol and anthropometric measures
(actual values not reported).
Onyango et al (1998) found that dietary diversity as defined by the number of
different foods consumed was associated with nutrient intake in 154 Kenyan children of
1-3 yearS of age. Three non-consecutive 24-hour recalls were conducted in order to
determine food intake. A dietary diversity score was calculated by counting the number of
unique food items consumed by the child during each of the three days. The reported
score was an average of the three days. The nutrients investigated were protein, vitamin
C, vitamin A, thiamine, riboflavin, niacin, iron, and calcium in addition to energy. Data
were divided into two groups for comparison of variables: those with a diet diversity
score over five, and those with a score less than or equal to five. A diet diversity score
over 5 found significantly higher intakes of most nutrients compared to those with a score
offive or lower (p < 0.001 for calcium, riboflavin and thiamine; p < 0.01 for energy and
niacin; p < 0.05 for protein, vitamin A and vitamin C).
Another study that looked at the association between diversity and nutrient intake
also confirmed the positive association between dietary diversity and intake of a variety
of nutrients (Tarini et al, 1999). The diet in 60 children 2 - 4 yearS old in rural Niger was
assessed with a 3-day modified weighed intake technique. AH food items consumed by
each participant wererecorded over a 3-day period. Raw ingredients ofmeals were
weighed as weH as the final cooked amount. For meals that were shared from a common
bowl, the number of mouthfuls was counted and multiplied by the mean mouthful weight
derived from the average weight of three mouthful samples. Diversity score was defined
15

as number of food groups over the three days. Eleven food groups were defined as:
cereals, green leafy vegetables, other vegetables, pulses/nuts, roots/tubers, fat, fruits,
legumes, milk/eggs, meat and sugar. Diversity score was measured against a nutritional
quality score (NQS) that examined energy, protein, vitamin A, and zinc. A diversity score
less than or equal to 5 was associated with a significantly lower NQS compared to a score
greater than or equal to 6.
However, an additional study conducted in Ghana and Malawi reports only a
weak association between diversity and nutrient intakes (Ferguson et al, 1993). Food
intake was measured by weighing over a 3-day period in rural children from Ghana and
Malawi. The average number of different food items consumed per day was the measure
of dietary diversity. The total number of food items recorded ranged from 62 in Malawi to
76 in Ghana. Dietary diversity was positively associated with consumption of prestigious
foods such as chicken, meat, milk, eggs, tea and bread. In Malawi, dietary diversity was
positively associated with energy intakes (r = 0.33 - 0.41, P < 0.02), which was probably
related to snacking. Those individuals who had more diverse diets consumed more snacks
such as fruits, roots, groundnuts, sugar cane and local cakes. In both Malawi and Ghana,
dietary diversity was not correlated with protein, fat and calcium densities of the diets.
The association between dietary diversity and child nutritional status has been
explored in several countries in the developing world. Arimond & Ruel (2002) in
Ethiopia drew on dietary data from the large Ethiopia 2000 Demographic and Health
Survey to derive food group diversity measures. These values were significantly
associated with height-for-age Z-scores. Hatl0Y et al (2000) also investigated diversity
16
and child growth in urban Mali. With socio-economic factors controlled, low FVS or
DDS was associated with twice the risk ofbeing stunted or underweight. In Kenya,
researchers used the average of three 24-hour recalls to sum the number of individual
foods eaten by a toddler (Onyango et al, 1998). This diversity score was associated with
the following nutritional status measures: height for age, weight for age, weight for
height, triceps skinfold, and mid upper arm circumference. AlI measures were higher in
the group with diversity score greater than five, with only weight for age being
significantly higher (p = 0.005).
In Mozambique, researchers tested the Mozambican Diet Assessment Tool, a low
cost rapid tool, for how well it assessed the quality (diversity) of 616 household diets
(Rose et al, 2002) by classifying them into three categories. A food-group classification
and scoring system was applied to household data previously collected in a quantitative
diet study in northem rural Mozambique. The tool is based on a simple qualitative diet
assessment using a 24-hour recall ofhousehold food intake. In each household, the person
in charge of food preparation was asked to recall all food items that had been eaten by all
household members during the previous 24 hours. Points were given to each food item
based on the food group it be10nged to. The four food groups, in descending order of
score value, were as follows: animal foods (e.g.: meats, fish, eggs), legumes and nuts,
cereals and tubers, vegetables and fruits. The scoring rationale was based upon nutrient
density, bioavailability, and usual portion sizes consumed (those foods eaten in smaller
quantities were allocated a lower score than those foods with similar nutrient content but
eaten in larger quantities). AIl points were summed for each household. Diets with a score
of at least 20 were considered to be of acceptable quality. Diets ofless than 12 points
17

were considered to be of very low quality. Those households identified by the tool as
having a diet of acceptable quality had significantly higher mean intakes of energy,
protein, and iron (there was no difference for vitamin A) (p < 0.05) and also had
significantly higher mean scores on the Mozambican Diet Quality Index (p < 0.05). The
index functioned as a gold standard measure of overall diet quality. It was a composite
measure based on the nutrient intakes of energy, protein, vitamin A, iron, and seven other
nutrients computed from data from the quantitative household-level 24-hour recal1. A
maximum of 2 points was assigned to each component of the index to yie1d a range of 0
to 10. To determine each component score, the NAR for the nutrient is calculated for the
household (truncated at 1.0) and multiplied by 2. Rouseholds that scored 7.5 or higher
were considered to have a high quality diet. Although the tool c1assified diets into three
groups that were significantly different with respect to nutrient content, there was a great
deal of misc1assification. Sensitivity, ability to detect those with low intakes, was quite
10w at the cut-offpoint of20. For energy, protein, vitamin A and iron, sensitivity was
67.7,83.0,44.1 and 65.1 %, respective1y. Increasing the cut-offpoint to 23 improved the
sensitivity to 81.2, 90.2, 60.5 and 77.0%, respectively, but of course decreased the
specificity. Rence, the tool shows potential to describe the diet ofhouseholds; however
increasing sensitivity at the expense of specificity jeopardizes its practical use.
Also at the household leve1, Rose & Tschirley (2003) reported that when the
number of adult equivalents in a household was known, the number of times per day that
a household consumed a food from each of Il food groups was good at predicting
nutrient intake. Food groups inc1uded grains, tubers, beans, nuts and seeds, animal
products, vitamin A-rich fruits and vegetables, vitamin C-rich fruits and vegetables, other
18

fruits and vegetables, sugars, oils, and other foods (e.g.: beverages, candy). Researchers
deve10ped a dietary intake prediction mode1 based on the types of foods eaten in the
previous 24-hour period with the purpose ofpredicting a household's dietary intake leve1
without having to perform detailed quantitative data collection. The study used previously
collected data from a quantitative 24-hour recall technique performed on 388 households
in 16 rural villages in Northem Mozambique. Two recall interviews for each of the three
main seasons were performed. Researchers asked the person who prepared food most
often to identify all food items that had been consumed in the household the previous 24
hours. A total of 119 food items were recorded. Linear regression was employed to he1p
develop a method to predict nutrient intakes from food group consumption. Nutrient
intake of each household was described by a Nutrient Intake Ratio (NIR), the equivalent
of a NAR for a household. The numerator is the sum of all individual intakes of a nutrient
in a household and the denominator is the sum of all recommended nutrient intakes. The
predicted frequency oflow intakes (less than 75% ofthe recommendation) for energy,
protein, vitamin A and iron was very similar to the measured frequency, but significance
level was not mentioned. The authors conclude that these results demonstrate an
inexpensive method for monitoring diets at the population leve1 in Mozambique, which
would be very useful for assessing progress in targeted areas.
In summary, much of the recent research on dietary diversity and nutrient
adequacy in the developing world is indicating a positive association between the two
variables. A summation of individual food items consumed has been found to be
positive1Y associated with nutrient intake (Ferguson et al, 1993; Onyango et al, 1998).
Studies that investigated food groups also found a positive association (Rose & Tschirley,
19

2003; Arimond & Ruel, 2002; Tarini et al, 1999). Both food groupings and individual
foods have been found to be significantly associated with nutrient intake (Hatl0Y et al,
1998; Ogle et al, 2001). In addition, a recent study found that a measure ofindividual
foods given a score based on food group association was able to correctly categorize a
household according to nutrient intake (Rose et al, 2002). Most of the studies have not
controlled for energy, which may account for these positive results.
For those studies that have explored the use of food groups, researchers have
developed groupings based on available foods; however not aIl researchers have
classified food items in the same manner. In order for a dietary diversity indicator based
on food groups to relate to nutrient intake, the groupings must be developed with
consideration for nutrient content of each individual item in the group. The question
remains as to whether different animal foods should be placed in separate categories or
grouped together. Moreover, sorne researchers believe that food groups should be
weighted given differences in nutrient density, bioavailability and usual quantities
consumed (Rose et al, 2002). Another study has emphasized the importance of the
frequency of food groups consumed (Rose & Tschirley, 2003).
The dietary measurement period in these studies has also varied. The aim has been
to use a long enough period such that the information cOllected is meaningful, but a short
enough period such that data collection is feasible. In addition, researchers have either
obtained data on an individuallevel or a household level.
20

The ability to determine the proportion of a population or to identify a particular
area that is nutritionally at risk or deficient is an important goal. To this end, researchers
have looked at scoring systems. Diversity indicator eut-off values have varied from study
to study and comparisons may not be appropriate given contextual differences. Sorne
studies have assigned eut-off values based on data distribution. For example, Ogle et al
(2001) used terciles. Sorne have used an approach based on sensitivity and specificity
(Hat10Y et al, 1998; Rose et al, 2002). Further research is needed to confirm the
effectiveness and applicability of such a concept to dietary monitoring of populations.
2.4 DIETARY DIVERSITY: THE URBAN SETTING
Most research investigating dietary diversity in the deve10ping world has taken
place in the rural setting, however, urban and peri-urban diets are an emerging concem
for nutrition researchers. Dietary habits ofboth the rich and poor are shifting towards a
greater emphasis on calories, saturated fats, added sugars and added salts (Popkin, 2001;
Haddad, 2003). In urban and peri-urban centers, the shift of diet from one rich in diversity
to one comprising a smaller number ofhigh-energy foods is driven by changing food
preferences due to income growth, changes in relative food priees, urbanization, changing
food choices resulting from food technology, and changes in food distribution systems
(Haddad, 2003). Along with decreased activity leve1s, this nutrition transition is
associated with increased levels of chronic diseases, such as cardiovascular disease,
diabetes, cancer and obesity that are currently being witnessed in the urban setting (King,
1998; WHOIFAO, 2003). Meanwhile, diseases more commonly associated with
deve10ping countries persist. This "double burden" of disease where non-communicable
21

diseases are emerging while infectious diseases and problems of under-nutrition remain
significant is seen not only within populations (Vorster et al, 1999; WHO/FAO, 2003) but
also within households (Garrett & Ruel, 2003). A tool that could monitor change over
time in areas experiencing rapid dietary transition would be very useful and dietary
diversity indicators might be helpful in this regard.
Although the urban experience tends to lead to these aforementioned changes, this
may not always be the case. For instance, Huang & Bouis (1996) found that urban
migration of a population in China led to an increased consumption of fruit, meat, fish,
milk and eggs, which were positive changes relative to their previous diet. Therefore,
although there are c1ear data supporting the unhealthy influence ofurbanization on diet,
this may not always be the case.
2.5 IRON INTAKE AND MILLET
Countries in sub-Saharan Africa have experienced increasing difficulty in meeting
urban food needs with local products. A shift away from domestically produced cereals
such as millet to imported rice and wheat is particularly notable in urban Senegal
(Reardon, 1993), illustrated by the increase in annual per capita rice consumption from 50
kg in the 1960's to 60 kg in the 1990's (Tardif-Douglin & Diouf, 1998). Increased
consumption of imported rice in Dakar is thought to result from the desire for
convenience foods. As urban women enter the workforce, the local coarse grains such as
traditional millet and domestic rice become less desirable due to longer preparation times
22

(Ross, 1980). Moreover, priees tend to be relatively low for cereal products as a result of
low world cereal priees, food aid, overvalued exchange rates, and direct subsidization
(Pearce, 1990).
Causes of anemia include low iron intake, parasites, chelators, blood loss and
other nutrient factors such as vitamin A deficiency (Hodges et al, 1978). Iron deficiency
anemia is often caused by inadequate iron intake in habituaI diets in concert with poor
bioavailability of dietary iron usually from a diet mainly consisting of plant foods. The
absorption of iron from food is a complex proeess intluenced by the form and quantity of
iron, the presence of modifiers such as inhibitors and enhancers of iron absorption, and an
individual's iron status (Hallberg, 1981).
Although pearl millet has been measured to contain between 4.5 (Oyenuga, 1968)
and Il (Agte et al, 1995) times more iron than rice, it also has higher levels ofphytates,
which are major inhibitors of iron availability (Hallberg, 1981; Harland & Oberleas,
1987; Reddy et al, 1989). In addition, the iron in millet is non-heme, a less bioavailable
form of the mineraI (Hazell, 1987). In Senegal, millet gruel and porridge are often eaten
mixed with powdered milk, which further decreases iron availability. However,
indications are that if cooked with several key iron enhancers, the availability of iron can
be increased (Rao & Prabhavathi, 1978; FAO/WHO, 2002). For example, in Senegal,
millet is also eaten as a prepared dish (thiaré diene) containing tomato and fish, which are
important iron enhancers. Although promising, studies are conflicting as to whether total
iron bioavailability is greater than, less than, or equal to riee.
23

One study compared total iron content and iron bioavailability of three commonly
consumed meals in Senegal that were comprised of either pearl millet (Pennisetum
typhoïdes) or imported white rice (Guiro, 1991). Subjects consumed each of the following
meals: a pearl millet couscous dish, pearl millet gruel dish, and a rice dish. The extrinsic
tag method was used to measure in vivo iron absorption. The iron absorption was 4.8%
for the pearl millet couscous dish, 1.2% for the pearl millet gruel dish, and 10.4% for the
rice dish. Although percent of total iron absorption from the meal was greater for the dish
with rice, the pearl millet couscous dish yie1ded a greater amount ofbioavailable iron
(0.326 mg compared to 0.279 mg), presumably due to the greater initial iron content
coming from millet. The pearl millet gruel dish, however yielded an unexplained much
lower amount ofbioavailable iron (0.069 mg). It remains uncIear whether substitution of
rice with millet would yield a greater overall amount ofbioavailable iron, the same
amount, or less.
Another study conducted on prepared Indian meals comprised of either rice or
pearl millet (Pennisetum typhoïdes) showed that the bioavailability ofiron in millet is
significantly changed when it is consumed as a composite meal (Agte et al, 1995). In
vitro percent dialysability under simulated gastrointestinal conditions was used as an
indicator of iron bioavailability. Meals only differed with respect to cereal used. The total
amount of dialyzable iron was greater and statistically significant for pearl millet meals
(mean = 3.16 mg± 1.49) compared to rice meals (mean = 0.69 mg ± 0.28). The iron
availability measured from the composite meals was greater and statistically different
24

(p < 0.05) from the weighted average ofbioavailabilities of individual ingredients,
indicating that an interaction between ingredients is altering the state of iron availability.
2.6 TARGET POPULATION
2.6.1 Senegal: Diet Diversity
Concern for the preservation of diet variety in Senegal heightened in the late
1990's. Structural adjustment policies led to currency devaluation in West Africa in 1994.
Studies showed that subsequent food consumption patterns were altered in urban areas
(Diagana, 1999). One important change observed was a reduction in diet variety,
particularly in the poorest communities. Consumers sacrificed consumption of non-staple
foods in order to defend caloric intake levels. These non-staple foods included meat,
edible oils, fruit and vegetables and imported canned milk. Moreover, when vegetables
were consumed, a decreased variety in those chosen was noted, with an obvious move
towards cheaper produce. This is particularly important given that previous research had
already indicated low levels of dietary diversity in West African po or (Reardon, 1993)
and low intake ofvitamins and protein (Kelly et al, 1995).
Yoff, Senegal was chosen as the study site for reasons additional to the above.
Firstly, Yoff has been threatened culturally and physically by modem industrial
developments, with increased severity over the past several decades. Recent construction
has decreased potential areas of agriculturalland use, and in particular, has destroyed
sorne ofthe permanent food sources such as fruit trees. Secondly, years of French
25

colonialism have brought the "green revolution" and cash crops to Senegal. This has
drastically altered traditional agricultural practices and devastated the generational
information base about se1f-sufficient natural farming. Thirdly, the inhabitants ofYoff do
not belong to one socio-economic class, and therefore differences between eating habits
of families are expected. This is important if one wants to investigate the re1ationship
between diversity and adequacy. Fourthly, working as a westemer in a developing
country context, one anticipates sorne difficulty with collaboration. The NGO CRESP had
worked successfully in the village for several years, and hence a certain degree of
cooperation from the villagers was expected.
2.6.2 Senegal: Food Habits
In Yoff, transition from a rural to a peri-urban community resulted in change from
the traditional water-based method of cooking to one based on oils. Moreover, traditional,
local foods were replaced with imported foods. Indeed, Senegalese people in general have
shifted their diet to one high in energy-dense foods and low in micronutrients (Ministère
de la Santé, 1999). The diet is described to contain a high amount of fats and oils, rice,
bread, potatoes and manioc, and a low amount of fish, legumes, animal products and
fruits and vegetables. Several studies are indicating that anemia might be an important
health concem in women and children (Charbonneau & Laberge Gaudin, 2001; Ministère
de la Santé, 1999).
Meals are served and eaten from a common plate, usually placed on the floor.
Diners surround the plate and eat from the side closest to them using either a hand or a
26

spoon. Only the very old and the chiefs ofthe village have their own separate bowls. If
families are very large, men, women and children may all eat in separate groups.
Historically, plant foods have been important to the Senegalese diet. For example,
traditionalleafy vegetables have been used as condiments and as flavoring agents in
stews. They have adapted well to the dry c1imate of the Sahel, and are relative1y
inexpensive to produce. During the rainy season, they may be harvested and dried for
later use in the dry season. In addition, fruit trees have been an important source of
essential nutrients. Unfortunate1y, the pressures of a growing population, increasing
urbanization, industrialization, and modem agriculture, and the resulting cultural changes
are negative1y affecting plant resources. Indeed, a recent survey in Senegal describing the
importance of traditionalleafy vegetables in the culture, medicine and local cuisine (Seck
et al 1999), noted that their use in the diet is decreasing.
In fact, the population tends to consume a low amount of fruits and vegetables in
general. Reasons inc1ude affordability and accessibility on a personal scale, and poor
weather and soil conditions and loss of small-scale farmland on a population scale.
Following the 1994 devaluation of the Senegalese currency, a study of food consumption
suggested that this economic change had a significant impact on dietary habits (Fouere et
al, 2000). In particular, the quantity and diversity of fruit and vegetable intake dec1ined,
especially among the poor. In addition, poor infrastructure has resulted in low
accessibility of fresh produce from rural areas to the urban centres. Low consumption has
also been the result of poor soil quality due to intensive agricultural practices, drought,
industry and construction.
27

2.6.3 Senegal: Geography
Senegal is the western-most country on the African continent. It is, for the most
part, flat with a natural vegetation of dry savannah woodland. It lies between 12 and 17
degrees latitude north of the equator, at the western end of the Sahel. The western border
of the country runs 600 km along the Atlantic Ocean. The Cap Vert peninsula, jutting into
the ocean contains the capital city, Dakar, with its surrounding suburbs and satellite
towns, ofwhich Yoffis one. In 2001 the population ofSenegal was estimated at over 10
million with a population growth rate of2.93%. Since the 1960's the population has been
rapidly shifting to the urban centers. Today, fi ft y percent of the population lives in cities.
Indications are that this figure is still increasing. Literacy, as defined as those over the age
of 15 who can read and write, is 33%. Senegal's economy is based on agriculture and is
large1y dependent on groundnuts (peanuts) as a cash crop. Production levels of
subsistence crops such as corn, millet and sorghum are in decline and Senegal now
imports more than 35% of its food requirements. Fishing, an important activity on the
coast, supplies domestic and overseas markets. The climate pattern is defined by rainfall.
The rainy season is considered June to October, and the dry season November to May.
Yoff is an old traditional fishing village that was established over 400 years ago,
before the colonization of Africa (Zeitlin, 1996). Historically, its inhabitants participated
in fishing, farming, and herding of cattle on a large tract of land. In 1964, however, the
govemment appropriated the land and the community moved from a state of
independence to a suburb of Dakar, the capital city of Senegal. Currently, Yoff is
28

cornprised of seven districts: Tonghor, Ndeungagne, Layène, Ngaparou, Ndénatte,
Dagoudane and Mbenguène. Although fishing continues today, there has been a decrease
in fishing stock in the past several decades (Durnez & Kâ, 2000). In addition, Yoffhas
witnessed an overall decrease in farming and an increase in unernployment. The
population ofYoffhas increased frorn a population of 25,000 ten years ago to nearly
50,000 today resulting in decreased land available for crops and fruit trees (Mack, 1996;
Durnez & Kâ, 2000). The village consists rnainly of the Lébou, an ethnic group that
shares the Wolof language. As a consequence of past French role, rnany also speak
French to varying degrees. Several other groups found in the village are the Sérères, the
Diolas, the Pulhars and sorne non-Senegalese such as Ghanaians and Nigerians. Although
Islam was weIl established sorne 700 years ago in West Africa, the Lebou rnix traditional
spiritual practices with Muslirn traditions (UNESCO, 1997).
2.6.4 Women and Nutrition
The goal of good nutrition for cornrnunities is a worthy one unto itself, however
there are other reasons for its importance. Healthy, nutritionally adequate communities
have a better chance at being prosperous, economically viable, and sustainable. The
health ofwomen is directly linked to the health of communities. Women bear children,
are caregivers, are household managers and oft:en times work outside the home (WHO,
2000). Given the importance ofboth the productive and reproductive roles ofwomen, it is
c1ear that healthy women help to ensure healthy communities. Achieving and maintaining
good nutritional status are important to ensuring good overall health and therefore good
nutrition and healthy eating are important goals for women especially throughout the
29

childbearing years (Tinker, 1998; Tinker & Ransom, 2002). Women of childbearing years
were also chosen because of the paucity ofhealth and nutrition data in this population in
Yoff.
2.7 STUDY RATIONALE
A well-nourished population is requisite to the long-term deve10pment of a
country. Poor nutrition is well known to decrease productivity and to exert considerable
strain on available resources. The evaluation and monitoring of the move towards
adequate nutrition in a population is an important component of deve1opment. However,
nutritional assessment of populations often requires more time and resources than are
available. Moreover, overall measures of nutritional status rather than detailed analyses
are often all that are required to monitor progress over time, and hence low-cost methods
designed for this purpose would be very useful. To this end, measures of dietary diversity
have been proposed to assess the adequacy of nutrient intakes.
With po or health and nutrient deficiencies common to the developing world, and
methods of diet assessment often costly, an inexpensive simple tool to assess the
nutritional quality of a diet in a community would be very useful. Researchers to date
have derived measures of diversity from established methods of dietary assessment such
as 24-hour recalls and food frequency questionnaires, however a tool that specifically
measures diversity directly has yet to be validated.
30

2.8 STUDY OBJECTIVES
• To determine whether a tool that measures food diversity (as measured by both a food
count and a food group count) can be used as a proxy measure of nutrient intake for
three 24-hour recalls collected from women of childbearing years in the peri-urban
village ofYoff, Senegal.
• To assess whether hemoglobin, a biochemical indicator of nutritional status, is
associated with dietary diversity.
• To document usual dietary intake ofwomen of childbearing years in the peri-urban
community ofYoff, Senegal during the dry season (December - March).
The focus of the manuscript that follows is an investigation into the ability of a non
quantitative food frequency questionnaire to obtain dietary diversity data that reflects
nutrient intake in a population. The study community is an old fishing village in Senegal
that has experienced a great change in dietary habits within the past 20 years primarily
due to urban expansion.
31

i
w N
Table 2.1 Summary of studies in developing countries that have investigated dietary diversity and nutrient adequacy.
Author Country Subjects Dietary Measured Dietary Diversity Food Groups Nutrient Adequacy/ Measure Outcome Indicator Nutritional Status
Results Arimond Ethiopia M&F 24-h food Height 24-hfood group diversity: Grains, roots/tubers, Positive correlation between: & Ruel, 1-3y group forAge # different food groups vitamin A-rich F & V s, Food group diversity 2002 recall Z-scores eaten during 24-h period otherF&Vs, (24-h food & 7-d) & HAZ
n=4,624 (HAZ) (total=8) meatlpoultry/fish/egg/ 7-d food cheese/yogurt, RAZ significantly difJerent group 7-dfood group diversity: milk, between: recall # difJerent food groups legumes, fats/oils Lowest and highest tercile of 24-h
eaten during 7-d period diversity (total=7) (grains combined with roots/tubers)
Fergusson Ghana M&F Mean of Nutrient DD: NA No correlation between: et al, 1993 & 3-6y 3 days densities: # difJerentfoods eatenld DD & fatab proteinab calciumab , , ,
Malawi Direct fat, protein, (mean of 3 days) zinca, irona densities n=148a/65b Weighing iron, calcium, (total=768/62b
)
zinc Negative correlation between: DD & ironb, zincb densities
Positive correlation between: DD & energy intake b
Hat10Y Mali M&F Mean of MAR: FVS: Staples Pearson's correlation: et al, 1998 1-5y 2-3 days energy, fat, # different foods eaten (rice, millet, beans), MAR & FVS = 0.33
Direct protein, iron, during 2-3 d period GL V, other vegetables, MAR & DDS = 0.39 n=77 Weighing calcium, (total=75) fruit, meat, fish, milk,
vitaminA, egg, Best Cut-Off Points: Bh~,B3,C, DDS: other DDS=6
folate # different food groups (sugar, sweets) FVS=23 eaten during 2-3 d period (total=8)
DD=Dietary Diversity; FVS=Food Variety Score; DDS=Dietary Diversity Score; GLV=Green Leafy Vegetables; HH=Households; NA=Not Applicable; MUAC=mid-upper arm circumference; TSF=triceps skinfold; HA=height for age; HW=height for weight; WH=weight for height; FFQ=food frequency questionnaire; MAR=mean adequacy ratio; NQS=nutritional quality score; a Study in Ghana; b Study in Malawi; C Study in 1996; d Study in 1999
w w
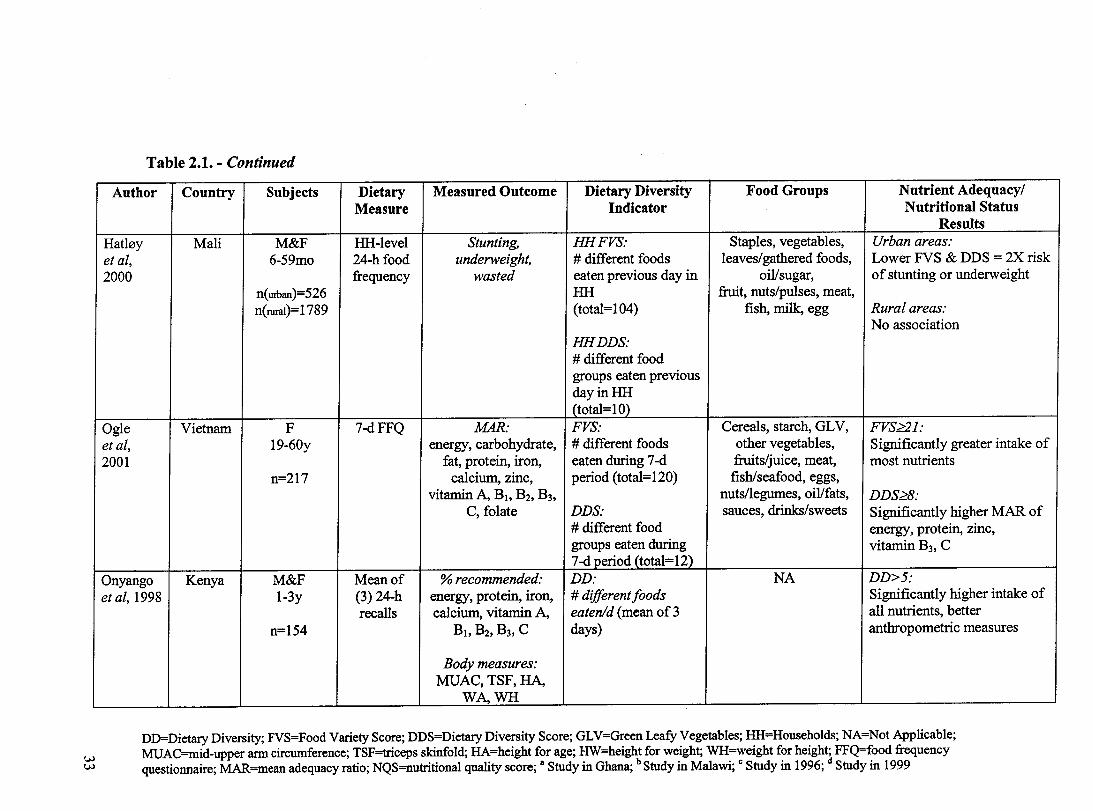
Table 2.1. - Continued
Author Country Subjects Dietary Measured Outcome Dietary Diversity Food Groups Nutrient Adequacy/ Measure Indicator Nutritional Status
Results Hat10y Mali M&F HH-Ievel Stunting, HHFVS: Staples, vegetables, Urban areas: et al, 6-59mo 24-h food underweight, # different foods leaves/gathered foods, Lower FVS & DDS = 2X risk 2000 frequency wasted eaten previous day in oil/sugar, of stunting or underweight
n(UIban)=526 HH fruit, nuts/pulses, meat, n(ruraI)=1789 (totaI=104) fish, miIk, egg Rural areas:
No association HHDDS: # different food groups eaten previous dayinHH (totaI=10)
Ogie Vietnam F 7-dFFQ MAR: FVS: Cereals, starch, GL V, FVS~l: et al, 19-60y energy, carbohydrate, # different foods other vegetabIes, Significantly greater intake of 2001 fat, protein, iron, eaten during 7-d fruits/juice, meat, most nutrients
n=217 calcium, zinc, period (total=120) fish/seafood, eggs, vitamin A, BI. B2' B3, nuts/legumes, oil/fats, DDS~8:
C, folate DDS: sauces, drinks/sweets Significantly higher MAR of # different food energy, protein, zinc, groups eaten during vitamin B3, C 7-<1 period (total=12)
Onyango Kenya M&F Mean of % recommended: DD: NA DD>5: et al, 1998 1-3y (3) 24-h energy, protein, iron, # different foods Significantly higher intake of
recalls calcium, vitamin A, eatenld (mean of 3 all nutrients, better n=154 BI. B2,B3, C days) anthropometric measures
Body measures: MUAC, TSF,HA,
WA,WH ----
DD=Dietary Diversity; FVS=Food Variety Score; DDS=Dietary Diversity Score; GL V=Green Leafy Vegetables; HH=Households; NA=Not Applicable; MUAC=mid-upper arm circumference; TSF=triceps skinfold; HA=height for age; HW=height for weight; WH=weight for height; FFQ=food frequency questionnaire; MAR=mean adequacy ratio; NQS=nutritional quality score; a Study in Ghana; b Study in Malawi; C Study in 1996; d Study in 1999

Table 2.1. - Continued
Author Country Subjects Dietary Measured Dietary Diversity Food Groups Nutrient Adequacy/ Measure Outcome Indicator Nutritional Status
Results Rose Mozambique AlI HH-Ievel Diet Quality Index Mozambique Diet I.Vegetables, Positive correlation between: etai, members quantitative (DQl): Assessment Tool fruits, oils, MDAT & DQI for aU nutrients 2002 ofHH 24-hrecaU Composite measure (MDAT): sugars, except vitamin A
basedon: AlI foods eaten by aIl condiments n=388HH energy members of HH in 2. Cereals, tubers Best Cut-Off Point:
vitaminA previous 24 hrs. 3. Beans, nuts MDAT ~ 23 (acceptable quality) iron Ea food given score 4. Meats, fish,
proteins (1-4) based on food eggs, milk prods 7 nutrients group association
Tarini Niger M&F Mean of NQS: Diversity Score (DS): Cereals, DS:::6: et al, 2-4y 3 days energy, protein, # different food roots/tubers, GLV, Significantly greater NQS 1999 modified vitamin A, zinc groups eaten during other vegetables,
n=60 weighed 3-d period (total=ll) fruits, meat, intake milk/eggs,
pulses/nuts, legumes, fat, sugar
Torheim Mali M&F Mean of MAR: FVSfroma 7-dFFQ: Cereals, legumes, Spearman 's rank correlationc:
et al, 15-59yc 2days energy, fat, protein, # different foods eaten vegetables, green M~)&FVS(7-dFFQ)=O.36 2003 15-45yd weighed/ iron, calcium, during 7-d period leaves, fruit, meat, ~)&DDS(7_dFFQ)=0.35
recalled food vitamin A, BI. B2' (total=69cor 164~ fish, milk, eggs, n=75c/70d record B3,C oillsugar, other Spearman 's rank correlationd
:
(WR) DDSfroma 7-dFFQ: (spices, tea, coffee) ~)&FVS(7-dFFQ)=O.24 # different food M~WR)&DDS(7_dFFQ)=O.29 groups eaten during 7-dperiod (total=l1)
DD=Dietary Diversity; FVS=Food Variety Score; DDS=Dietary Diversity Score; GLV=Green Leafy Vegetables; llli=Households; NA=Not Applicable; w MUAC=mid-upper arm circumference; TSF=triceps skinfold; HA=height for age; HW=height for weight; WH=weight for height; FFQ=food frequency ~ questionnaire; MAR=mean adequacy ratio; NQS=nutritional quality score; a Study in Ghana; b Study in Malawi; C Study in 1996; d Study in 1999

3.0 Manuscript
Dietary Diversity and Nutrient Adequacy in Women of Childbearing Age
in a Peri-Urban Community in Senegal, West Africa
Spigelski Dl, Johns Tl, Gray-Donald KI
ISchool of Dietetics and Ruman Nutrition, McGill University, Montreal, Canada
35

3.1 ABSTRACT
Objective: To assess the validity oftwo measures of dietary diversity derived from a
qualitative diversity questionnaire by comparison with nutrient intake from three 24-hour
recalls in a peri-urban community in Senegal.
Design: Three non-consecutive 24-hour recalls were conducted during the dry season
(December 2003 - March 2004). Nutrient intakes were compared with a Food Diversity
Score (FDS) and a Food Group Diversity Score (GDS) created from a Diversity
Questionnaire for 1 day (ldDQ) and 7 days (7dDQ) as weIl as from the same data set.
FDS represented a total of 60 foods and GDS a total of Il food groups.
Subjects: Sixt y-one women (18 - 45 y) from randomly selected households in Yoff, a
community on the coast of Senegal.
Results: Positive correlations (range: r = 0.3 to r = 0.64) were found between intakes of
several key nutrients (calcium, iron, zinc, vitamin A, vitamin C, thiamine, riboflavin and
vitamin B6) and FDS from the 7dDQ. Correlations were weaker or non-existent for the
1dDQ. Weaker correlations were found for GDS.
Conclusions: The 7dDQ is a quick and simple tool providing a measure of diversity and
shows promise in the assessment of nutrient intake at the population level. Future
research could confirm its potential as a component of population surveys that aim to
describe the overall condition of a population.
Sponsorship: Canadian International Development Agency (CIDA), Le Fonds de la
recherche en santé Québec (FRSQ).
Descriptors: dietary diversity, food variety, Africa, Senegal, nutrient adequacy, dietary
intake ofwomen, dietary assessment methods
36

3.2 INTRODUCTION
While the evaluation and monitoring of malnutrition is an important component of
development work, nutritional assessment of populations often requires more time and
resources than are available. However, overaU nutritional measures rather than detailed
analyses are often aU that are required to monitor progress over time, and hence low-cost
methods designed for this purpose would be useful. To this end, measures of dietary
diversity have been proposed to assess the adequacy of nutrient intakes. ConceptuaUy,
dietary diversity is identified as an important element of a high quality diet (Tucker,
2001) and in practice, it is supported though government guidelines (US Department of
Agriculture Human Nutrition Information Service, 1992; Health Canada, 1992) and
international organizations (WHO/FAO, 1996).
A diet consisting of a variety of foods is thought to ensure nutritional adequacy
associated with the known variation of nutrient composition between foods, the
enhancement of the bioavailability of sorne important nutrients and our limited
knowledge of the repertoire of dietary components beneficial for health. If diversity does
indeed provide an adequate amount of required nutrients, then measuring diversity would
be a good way of measuring adequacy. Recent research in developing countries has
explored dietary diversity as an indicator of nutrient adequacy (Hat10Y et al, 1998; Ogle et
al, 2001; Onyango et al, 1998; Tarini et al, 1999; Torheim et al, 2003; Ruel, 2003) and
food security (Hoddinott & Yohannes, 2002; Ruel, 2003).
37
The value ofusing dietary diversity indicators has yet to be clearly established and
has been little explored in a peri-urban setting. The aim ofthis study is to determine
whether a tool that measures food diversity can be used as a proxy measure of nutrient
intake for three 24-hour recalls in a peri-urban community in Senegal, West Africa. In
addition, the association between hemoglobin, a biochemical indicator of nutritional
status, and dietary diversity was investigated.
3.3 SUBJECTS AND METHODS
3.3.1 Study Area and Population
The investigation was carried out in the West African peri-urban community of
Yoff, Senegal, a coastal village of over 50 000 inhabitants and 15 km from the capital city
of Dakar. With loss of cultivated fields and fruit trees as well as diminishing fish stocks
and diversity (Dumez & Kâ, 2000) in recent years, and the suggested high prevalence of
anemia in children (Ministère de la Santé, 1999; Charbonneau & Laberge Gaudin, 2001),
nutrient adequacy has become a source of concem.
Criteria for inclusion in the study were female, CUITent residence in the village,
age 18 to 45 years, and absence of debilitating illness. Of the total of 77 households
approached, five dec1ined to participate due to lack of interest or time and 2 households
did not have women of childbearing years. Of the 70 households that agreed to
participate, 6 ofthe women withdrew from the studyand 3 moved from the village during
38

the course of the study, leaving 61 women to complete aIl three 24-hour recalls. Fifty-one
women completed the diversity questionnaire.
Approval for the study was granted by McGill University's Ethics Committee. In
the village, permission for the study was secured by the Mayor' s office in Yoff
subsequent to a presentation of the objectives and methods of the study to the community
eIders. AlI participants gave verbal and written consent. Upon completion of data
collection, preliminary study results were presented to the community at a village
meeting.
3.3.2 Study Design
A descriptive, cross-sectional study design was employed to assess food
consumption. A nutritionist and a local female community worker with previous training
in basic nutrition conducted most interviews together. Both participated in the
development of the methods and questionnaires to ensure a common understanding of the
goals and objectives of the project and the meaning of the questions in the questionnaires.
To ensure that the verbal translations by the community worker would be accurate, the
worker's written translation of the questionnaire tools from French into Wolofwere
compared to the tools that were translated back into French by a second community
worker. Discrepancies and ambiguities between the two versions were addressed. A pilot
study tested the appropriateness of the 24-hour recall method and the socio-demographic
questionnaire and the functionality of the proposed tools. Any needed changes in
approach were made accordingly.
39

3.3.3 Sampling Procedure
Data were collected during the dry season for the period beginning December
2002 and ending March 2003. AlI 7 districts in Yoffvillage were inc1uded in the study,
with the proportion of participants chosen from each district based on census data. The
random walk sampling method (Gibson & Ferguson, 1999) was used to select participants
from each district. Each of the 7 districts has a traditional administrative center called the
"pene" from which several roads spring and lead outwards towards the geographical
periphery. Sampling in each district began at this center moving outward along a
randomly chosen road. The first household on the road was visited and subsequently
every third household until the district boundary was reached or the required number of
participants was obtained. If the district boundary was reached before aIl participants had
been recruited, researchers retumed to the center to randomly choose another road until
the required number of women was obtained.
In each household, defined as a group of people who consumed the main meals
together, the researchers explained the study to the family head and obtained hislher
permission before explaining the study to aIl women available in the house at that time. If
more than one woman of childbearing years was interested in participating in the study,
one woman was randomly chosen by lottery, her questions were answered, and written
consent was obtained.
40

3.3.4 Interviews
A nutritionist and a local community partner coIlected aIl dietary, demographic,
anthropometric data. Both spoke French and the community partner spoke fluent Wolof,
the local language ofYoff. AlI interviews were conducted in the homes of the
participants.
Socio-Demographic Assessment
A socio-demographic survey was directed at both the household head, if present,
and the participant. The survey included demographic information and data on
socioeconomic conditions such as housing and employment.
Dietary Assessment
Three non-consecutive 24-hour dietary recaIl interviews with an approximate
month separation between each were used to describe food intake. Participants were
asked to recaIl and describe aIl items consumed, including liquids and non-food items,
during the previous 24-hour period, commencing with the tirst item eaten after waking up
and ending with the last item eaten before waking up the foIlowing moming. Food
models and calibrated local utensils were available at each interview to help participants
describe quantities of foods eaten. In addition, monetary value was used to quantify
several individuaIly purchased food items and street foods such as bread, butter and
donuts. Weight equivalency of each individual food item cited was determined by
weighing tive samples of the item using an electronic scale with a precision of ± 1 g. The
41

average weight was calculated for edible portions. In order to facilitate the quantification
of non-solid food items such as rice dishes and porridge, participants ate main meals in a
separate calibrated bowl provided by the researchers or in their own dishware that was
subsequently referred to during the 24-hour recall interview. Information regarding
ingredients and preparation methods for multi-ingredient recipes consumed in the
community was obtained during the 24-hour recalls. In addition, the researchers created
standardized recipes by assisting five women during the cooking process of each recipe.
In total, 31 recipes were compiled and used in the calculation of intake from the
24-hour recall questionnaires. These recipes were broken down and their components
were added to a general food list. In addition, several food items were combined for
practical purposes. For example, all species of fish were combined under one heading, as
were different forms of pasta. The result was 86 unique food items that were eaten either
as purchased or as incorporated into recipes. These 86 foods were considered for
inclusion in the diversity scores. The contribution of 3 cereals (ri ce, wheat and millet) to
the overall caloric intake of the sample population was determined by combining all
recalls collected and calculating the percent kilocalories.
The CANDAT Nutrient Calculation System (2000) was used to process the
dietary data obtained from the 24-hour recalls. Nutrient composition data for foods
consumed by the participants were derived from the WorldFood2 Dietary Assessment
System (1996) and incorporated into the program.
42

To assess validity of 24-hour recall data, prediction equations (Schofield, 1985)
based on weight, age and sex were used to estimate the basal metabolic rates (BMR) of
the subjects. The ratio ofreported energy intake to BMR was subsequently calculated and
compared to values used by Black et al (1996).
A Diversity Questionnaire (DQ) was conducted on 51 of the participants. This
non-quantitative food frequency questionnaire was conducted before the initiation of the
third 24-hour recall for each participant. The food list, meant to coyer all major food
items consumed, was based on information obtained from the first two 24-hour recalls of
all subjects as well as discussions with key informants in the village. Each participant was
asked to identify which of the 87 foods or recipes in a li st they had consumed during the
previous 24-hour period (ldDQ) and 7-day period (7dDQ) prior to the interview.
Diversity Indexes
For this study, two indexes of diversity were used: Food Diversity Score (FDS)
and Group Diversity Score (GDS). FDS was defined as the total number of different food
items consumed during the recall period; GDS was defined as the total number of
different food groups consumed during the recall period. Both indexes were calculated
from the three dietary measures: the summation ofthree 24-hour recalls, the 1dDQ and
the 7dDQ, corresponding to recall periods of3 days, 1 day and 7 days, respective1y. The
total number of food groups was Il: Cereal1(rice & wheat), cereal2 (millet), milklmilk
products, meat, poultry, eggs, fish, fruit, vegetable 1, vegetable 2 (starchy vegetables),
nuts/legumes. Table 3.2 provides food group description and a list of major food items
43

consumed. There was no quantity threshold for including an ingredient as a consumed
food item. The food groupings used are similar to those established by Torheim et al
(2003) where nutrient-rich animal foods are emphasized. The GDS and FDS did not
include fats/oils and sweets given that energy deficiency was not considered to be an
important problem in the study village and spices were excluded because they were not
considered to provide great enough quantities of nutrients compared to other foods.
Anthropometry and Biochemistry
Age and height were obtained from the national identity card of each participant.
Weight was measured using a mechanical spring scale on the second recall visit. During
the period of weight measurement, the scale was assessed every moming for accuracy
with a known quantity ofwater. Body Mass Index (BMI) was computed by
weight(kg)/height( mi.
After completing the third 24-hour recall, hemoglobin (Hb) values were analyzed
immediately using a HemoCue™ unit (HemoCue AB, Angelholm, Sweden). Participants
with low Rb values were offered ferrous sulphate / folie acid tablets to be taken for 21
days, anti-parasitic tablets to be taken for 3 days and were referred to the local hospital
for a free consultation with a health-care worker and further free treatment if necessary.
3.3.5 Data Analysis
Dietary data were analyzed using the SAS system for windows version 8.2 (SAS
Institute, 1999-2001). Most nutrient intakes were not normally distributed, therefore the
44

data were transformed. Adjusted nutrient intakes were calculated on transformed data and
converted back to original units to be used as estimates of the distribution of usual
intakes. Pearson's correlation coefficients were used to assess the degree of association
between the diversity measures and individual nutrients obtained from the reference
method. For a one-sided distribution with ci = 0.05 and â = 0.20 and the ability to identify
a correlation of 0.35 or greater, 49 subjects were required (HuUey et al, 2001).
3.4 RESULTS
3.4.1 Sample Characteristics
Women were between the ages of 18 and 45 years (Table 3.1). Most had always
lived in the village and most were ofthe Lébou culture and Muslim. No participant was
visibly pregnant at the time of interviewing. Mean BMI was 22 and positive1y correlated
(r = 0.43, P < 0.001) with age. BMI ranged from 16 - 39 with 29.5% having a BMI below
18.5, the cut-off point used by the WHO to identify chronic energy deficiency, and 28%
having a BMI over 25. Three quarters of the participants were married. Two thirds had
children, with halfhaving children less than 5 years of age. One quarter ofthe women had
never been to school. More than one third of the women cited sorne form of employment,
with the vending of food items most common.
Hemoglobin concentration measurement revealed 56% below the WHO cutoff
value for anemia of <12 g/dL for non-pregnant women (WHOIUNU/UNICEF, 2001)
(Figure 3.1). Nineteen percent feU be10w the cut-offpoint for moderate anemia (10 g/dL)
45

and 3% fell be10w the cut-offpoint for severe anemia (7 gldL). The mean hemoglobin
concentration was Il.4 ± 1.7 gldL.
3.4.2 Food Intakes
For the purpose of evaluating the contribution of individual food items to the diet,
aU recipes were separated into their individual food components and frequency of
consumption was determined using a spreadsheet program. When recipes were broken
down into their components, the DQ obtained similar frequency results to the 24-hour
recaU (Table 3.2). Looking at total frequency for the group, the IdDQ corresponded weIl
to the 24-hour recaU for the most universaUy eaten food items such as white French
bread, white rice, milk, fish, tomato, onion and garlic. However, less ubiquitous items
such as millet gruel (fondé), banana, jujube (Zizyphus spp.), or baobab fruit (Adansonia
spp.) juice were not captured as weIl. The 7dDQ was a much better approximation to the
24-hour recall for these less eaten items.
The 7 dDQ provided important information regarding overaU food habits of the
women in the community. AU participants ate sorne type of cereal. AU had eaten white
French bread at least once. Most individuals had white rice, milk, fish, tomato, onion and
garlic during the week. Fruit was less common, with tamarind as an ingredient in sauces
being the most common foUowed by orange, banana and jujube.
46

3.4.3 Nutrient Intakes
The distribution of adjusted intakes for protein, vitamins and mineraIs is described
in quantiles along with the mean (Table 3.3). Values are compared to FAO/WHO
recommendations. Participants at the 50th percentile met the recommended intakes for
vitamin B12 and vitamin A. Participants at the 75th percentile met the recommendations
for vitamin C, riboflavin, niacin, and vitamin B6. The mean protein intake was higher
than the calculated mean requirement. However, the 90th percentile value for calcium,
iron, zinc and thiamine, was below the recommended values. The overall ratio of energy
intake to BMR was calculated to be 1.8.
3.4.4 Diversity Scores
Mean diversity scores when fats/oils, spices, sweets, and supplements were
exc1uded were out of a possible total of 60 food items (Table 3.4). Scores were calculated
for ldDQ, 7dDQ and the three 24-hour recalls. The ldDQ yielded a lower mean FDS
compared to the 7dDQ and the 24-hour recalls. The mean GDS was also lower for the
ldDQ compared to the 7dDQ and the 24-hour recalls, but the difference was not as
striking. Mean values ofFDS and GDS for the 7dDQ were similar to the corresponding
values for the 24-hour recalls.
Table 3.5 outlines the Pearson's correlations between FDS derived from ldDQ,
7dDQ and three 24-hour recalls and nutrient intakes derived from the average ofthree 24-
hour recalls. Carbohydrate, calcium, iron, zinc, vitamin A, vitamin C, thiamine,
47

riboflavin, vitamin B6 and vitamin B12 correlate weIl with FDS derived from the 24-hour
recalls (range: 0.36 - 0.64). Carbohydrate and vitamin C correlations were the same for
FDS derived from the 7dDQ, but calcium, iron, zinc, thiamine and riboflavin correlations
were slightly lower (range: 0.35 - 0.52) and vitamin A, niacin, vitamin B6 and vitamin
B12 were higher (0.39 - 0.54). Although the IdDQ gave positive correlations, the values
were usually lower than for the 7dDQ. OveraIl, calcium, vitamin A, vitamin C, thiamine,
riboflavin and vitamin B6 had the highest correlations, with zinc and iron having slightly
weaker correlations. Scatter plots of aIl correlations were examined and no further
information was gained. Including fats/oils, spices, sweets, and supplements in the
diversity scores resulted in no substantial change in correlations and in sorne cases,
worsened the correlation. Using Pearson's correlation, no association was found between
hemoglobin measurement and either of the diversity scores.
The overall distribution of values for the diversity score that represents total
number offoods (FDS) was compared to that for the diversity score that represents total
number offoods groups (GDS). FDS values more closely approached a Gaussian
distribution than did GDS values. Figure 3.2 describes the distribution of FDS for the
IdDQ with a value range of7 - 17. This FDS distribution is contrasted by that ofGDS
for 1 dDQ (Figure 3.3) with a smaller value range of 4 - 10. Similarly, the FDS
distribution for the 7dDQ has a greater range ofvalues (12 - 29) (Figure 3.4) compared
to the GDS distribution (5 - 9) (Figure 3.5). Moreover, FDS had a unimodal distribution
for the 7dDQ, which contrasts the bimodal distribution ofGDS for the 7dDQ.
48

3.4.5 Nutrient and Food Diversity
The major contributors of energy intake were tomato rice stew with fish, white
wheat French bread, and white rice stew with fish. This corresponded very well to the
original diversity questionnaire where most people consumed these 3 items.
The major contributors of protein were fish, white wheat French bread and whole
dry cow's milk. This also corresponded well with the diversity questionnaire where most
people consumed these 3 items.
The three main cereals consumed in the village are imported white rice (24% total
caloric intake), imported wheat (consumed as bleached flour baked into bread) (13 % total
caloric intake), and local pearl millet (Pennïsetum typhoïdes) (9% total caloric intake).
A summary of the main contributors of sorne key nutrients to the diet of the study
population is found in Table 3.6. In total, participants cited 143 different food items
inc1uding individual foods and prepared recipes. Foods or recipes contributing up to 50%
of the mean nutrient intake are listed.
Little variety in calcium contributors to the diet was found. The most significant
source of calcium is whole dry cow's milk. According to the IdDQ, most people consume
it every day (Table 3.2) and yet calcium intake correlates well with FDS. This suggests
that those who eat a more diverse diet, rather than just a greater quantity, are more likely
to consume greater quantities of milk. Although sorne individuals consumed more
49
calcium than others, not one person met the F AO/WHO recommendation of 1000 mg, a
value based on Western European, American and Canadian data.
Important iron contributors are millet, fish and mutton, with millet providing the
greatest quantity. The most frequently consumed ofthese three is fish. Iron intake
correlates with FDS, suggesting that the consumption of millet and mutton helps to
distinguish between individuals in a diversity score with respect to iron. No individual
met the requirement for iron intake. Moreover, because the diet consists mainly of non
heme iron bioavailability is relatively low. No association was found between iron intake
and hemoglobin concentration suggesting that factors other than inadequate iron intake
might be contributing to anemia, such as low iron bioavailability from foods or infection.
An in depth analysis exploring heme and non-heme sources of foods and hemoglobin was
not done given the large proportion of iron intake derived from plant sources and the
established clinical practice in this area of treating anemia with mebendazole, an
anthelmintic medication. The latter indicates common knowledge that parasites are
prevalent, which can affect iron status.
French baguette, mutton and tomato rice stew with fish are the top three
contributors of zinc. None ofthese foods contribute large amounts ofthe nutrient, and this
is evident when one considers that very few individuals met the requirement. Most
individuals eat most foods mentioned for zinc and therefore those foods do not help to
discriminate between individuals in a diversity score. The one exception is mutton and
hence, presumably zinc correlates with FDS in part due to whether someone has eaten
mutton.
50

The main source ofvitamin A is carrot cooked in stews followed by butter.
Although liver was available in the village, very few individuals ate it. Likewise, red
palm oil, used to prepare a special sauce (soupa kandia), was not eaten on a regular basis
due to the cost of okra, an essential ingredient in this particular sauce. Over half of the
participants surpassed vitamin A intake recommendations. Given that carrots and butter
are available year-round, it is postulated that the number of people who have met
requirements would not decrease over different seasons but only rise, for example during
mango season, and okra season. Vitamin A is correlated with FDS. Presumably, those
individuals who eat a greater variety of foods tend to eat carrots. These values were
calculated using Retinol Equivalents (RE). Using the new Retinol Activity Equivalents
(RAE) might yie1d a lower total vitamin A intake due to the different activity of
provitamin A carotenoids.
Vitamin C is the nutrient most highly correlated with FDS. The top three vitamin
C contributors are oranges, cassava, and millet couscous stew with fish. AlI of these items
are not eaten by all individuals on a regular basis and therefore a diversity score may be
able to discriminate between individuals. Moreover, the variety existing within the
vitamin C contributors (fruits, stews, vegetable) also allows a diversity score to identify
those individuals with a lower vitamin C intake.
Thiamine intake is well correlated with FDS. The top sources ofthiamine are
French baguette, whole milk, millet couscous stew with fish, and millet porridge. Most
51

individuals consume baguette and milk; therefore millet foods are those most likely to
distinguish individuals.
Riboflavin is also weIl correlated with FDS. The top contributors are whole milk,
mutton, baguette, curdled milk, and millet couscous stew with fish. Again, the majority of
individuals consume milk and baguette therefore the other food items contribute to a
greater extent to the FDS.
3.5 DISCUSSION
In this study, a measure of food diversity derived from a qualitative food
frequency questionnaire was compared to nutrient intake obtained from the mean of three
24-hour recalls. Food diversity was defined by the number offoods consumed (FDS) or
the number of food groups consumed (GDS). We found that measures of diversity were
associated with calcium, iron, zinc, vitamin A, vitamin C, thiamine, riboflavin and
vitamin B6 as documented by the three 24-hour recalls. These results are similar to earlier
studies that have suggested that diversity indicators might be good predictors of nutrient
adequacy. We found that FDS correlated better than GDS with nutrient intake. These
results differ from Hatl0Y et al (1998) where a score based on food groups had a stronger
correlation than a score based on individual foods. The difference in results may be partly
attributed to what was inc1uded in the score. Their individual food score inc1uded aIl food
items consumed. Foods with little or no nutritional content such as condiments and spices
were also part of the score, which may have weakened the association between the
individual food score and nutrient intake. AIso, the difference between the correlation for
52

individual foods compared to that for food groups is very small and hence not likely to be
different enough in a practical sense to warrant using one score over another.
The diversity questionnaire with the 7-day recall period yielded very similar
diversity scores to the sum of the three 24-hour recalls which suggests that the former
would be useful in describing overall dietary habits. The diversity questionnaire was also
able to highlight those foods that are eaten by most of the population, suggesting that the
7dDQ would be useful for identifying food fortification possibilities. Although the
diversity score might be used for community monitoring over a period of time, the
absence of quantified food intake limits its usefulness because frequency of consumption
does not necessarily reflect importance of intake. For example, according to the mean of
the 24-hour recalls, millet is the greatest contributor of iron (Table 3.6), however the
most frequently consumed of the top iron contributors is fish (Table 3.2).
A dietary diversity index has additionallimitations. High variability of certain
nutrients such as vitamin A is common (Rose et al, 2002) and hence a single tool that
assesses all components of dietary intake may be ambitious. Also, there may be other
factors affecting nutritional status. Hemoglobin was used here as one important
biochemical indicator of nutritional status. Although the distribution curve for
hemoglobin is wide and skewed to the left, suggesting a population with a high
prevalence of anemia, we were unable to relate iron intake to Hb. Low bioavailability of
iron-ri ch foods and parasitic infections are likely to be responsible for anemia, and hence
a diversity score would not identify this problem.
53

The FDS had a consistently better overall distribution of values than its food
group counterpart, suggesting that a FDS is a more sensitive measure than a GDS. Studies
in other countries that used different food groupings did not find this to be the case,
perhaps highlighting the importance of setting and food group definition when applying
the diversity concept.
An average of three 24-hour recalls was used as the dietary reference method to
obtain nutrient intake values that could be compared to GDS and FDS obtained from the
DQ. There are several advantages to the 24-hour recall method. For instance, it is open
ended and relies on memory of only the past 24 hours. Furthermore, it is less invasive
than food records. There are, however, certain limitations of the 24-hour methodology
that must be acknowledged. For instance, under- and over-reporting of food intake have
been well documented (Westerterp et al, 2002). Overestimation of items perceived to
have more status and underestimation of items associated with lower status are often a
concern. Under or overestimation was considered to be minimal by the community
worker who was born and raised in the village. The ratio of El to BMR was calculated to
be 1.8, an expected value for a population whose daily activities inc1ude standing work
such as cooking, c1eaning, and caring for children (Black et al, 1996). Therefore overaH
bias to reported energy intake is considered minimal. Additionallimitations inc1ude
unintentional memory lapses and unintentional inaccuracy of food quantity estimation. To
circumvent the problem of po or recall and difficulty with portion estimation, food mode1s
were used as in previous studies (Moore et al, 1967; Labadarios, 1999; Ferguson et al,
1995). In addition, a trained nutritionist was in charge of aH data collection to ensure
accuracy and consistency of the information obtained.
54
One important limitation of the 24-hour methodology cited has been the necessity
for repeated interviews on different days and seasons in order to minimize error due to
intra individual intake (Gibson, 1990; National Research Council, 1986). The present
study aimed to describe habituaI food habits for the months of December through to
March. This period is part of the dry season when fresh pro duce is typically less available
and more expensive, and hence presumably when nutrient intake is lower than during
more plentiful seasons. Three 24-hour recalls were thought to be sufficient in order to
obtain average nutrient intake values for that time period.
The quantification of food can be difficult because of the custom of eating the
main meals from a common bowl. Sorne researchers have circumvented this problem by
counting number ofhandfuls or spoonfuls eaten (Torheim et al, 2001). While this
approach certainly has its advantages, namely that the participant is not required to
change their usual eating style, it tends to be time-consuming and has the potential to
greatly influence both food quantity and quality, given that the consumption of each meal
is observed by a researcher in the home of the participant. Moreover, this method is at
risk of great error through multiplication if quantity contained in a handful or spoonful is
inaccuratelyestimated.
To quantify non-solid food items, such as rice, participants were asked to eat main
meals in a separate bowl. Given the social importance of mealtime, eating in this manner
may have contributed to a decreased appetite and hence a decreased intake of main meals.
However, women in the village are accustomed to eating separately from time to time
55

when they are pregnant, ill, arrive late from work or work away from home during
mealtime. Moreover, most participants indicated little change in satiation from regular
meal days.
The quality of the diversity questionnaire results may have been influenced by the
previous two 24-hour recalls. As with aIl dietary assessment methods, the DQ is subject
to errors associated with the respondent's willingness and ability to communicate
accurate information. As the study progressed, participants became more comfortable
answering questions regarding food intake and were able to express themselves with
greater facility. Had the DQ been conducted prior to all24-hour recaIls, it is possible that
participants would have been less willing or able to provide information. It is also
possible, however, that participants moditied their responses to the DQ based upon prior
24-hour recall experience with the interviewers. Given the different line of questioning
and the simplicity of the DQ, this issue is thought to be minimal.
The quality of the DQ results may have been influenced by the previous 24-hour
recalls. As with aIl dietary assessment tools, the questionnaire is subject to errors
associated with the respondent's willingness and ability to communicate accurate
information. As the study progressed, participants became more comfortable answering
questions and were able to express themselves with greater facility. Had the DQ been
conducted tirst, it is possible that participants would have been less willing or able to
pro vide information.
Although in theory absolute number of foods consumed would be very useful for
determining adequacy in a population, the establishment of international diversity cut-off
56
points may be unrealistic. Diets vary from one country to another with respect to food
types and quantities consumed. A value in one setting may be meaningless in another.
Rather, dietary diversity might be most useful for monitoring changes in a given
population. In addition, to measuring diversity, the DQ tool itselfhas the potential to
discover new opportunities for food fortification, given that it oudines the foods that are
ubiquitous in the diet.
The 7dDQ was easier to implement and required less time to complete than the
24-hour recaIls. Between five to ten minutes were required to carry out the DQ compared
to 30 minutes for each 24-hour recaIl. While the information gained from the DQ was not
quantitative, it provided a good representation of the important food items consumed in
the community. The 7 dDQ corresponded weIl to the 24-hour recaIl for frequency of food
items eaten. The 7dDQ also correlated with the same nutrients as the 24-hour recaIl.
This study provides evidence for usefulness of indicators of diversity derived from
a 7dDQ to evaluate nutrient intake over time for populations. The FDS correlated weIl
with calcium, iron, zinc, vitamin A, vitamin C, thiamine, riboflavin and vitamin B6. The
FDS derived from the 7dDQ was found to be very similar to that derived from the 24-
hour recall. Rence, the 7dDQ might be the key to the applicability of the food diversity
concept to nutrient assessment in population studies. Future research might investigate the
geographic applicability of this methodology.
57

Acknowledgements
We thank the staffmembers ofONG - CRESP (Centre de Ressources pour l'Émergence
Sociale Participative) for their support and Louise Johnson-Down for her invaluable he1p
with CANDAT and SAS. We also thank Salimata N'Doye, our community research
partner, for her dedication and we extend our sincere gratitude to the women of Yoff who
participated in this study.
58

Table 3.1 Characteristics of study participants.
Variable Age (ytb
BMI (kglm2)ab BMI = 16 - 18.49 (%) BMI = 18.5 - 24.9 (%) BMI = 25 - 29.9 (%) BMI = 30 - 40 (%) Married (%)b Have children (%)b Have children < 5 (%)b Never been to school (%)b Employed (% t Hemoglobin (gldLt No. people in householdab
a Values are mean ± s.d. b n=61 c n=59
Value 30± 8 22 ± 5 30 41 18 11 74 67 49 25 39 11.4 ± 1.7 14.7 ± 7.3
59

0'1 o
Table 3.2 Frequency of food items cited for diversity questionnaire (Id and 7d periods) and 24-hour recall (3d period). If cited by an individual, item is counted once regardless of frequency or quantity consumed. AlI recipes broken down into individual food items. Spices, fats/oils, sweets, and supplements excluded. Number of individual food items = 55.
Food Group Food Item
Cereall
Cereal2
Pennisetum typhoides)
MilkIMilk Products
Meats
FishlSeafood

Table 3.2 - Continued
oodGroup
Fruits
0\ -
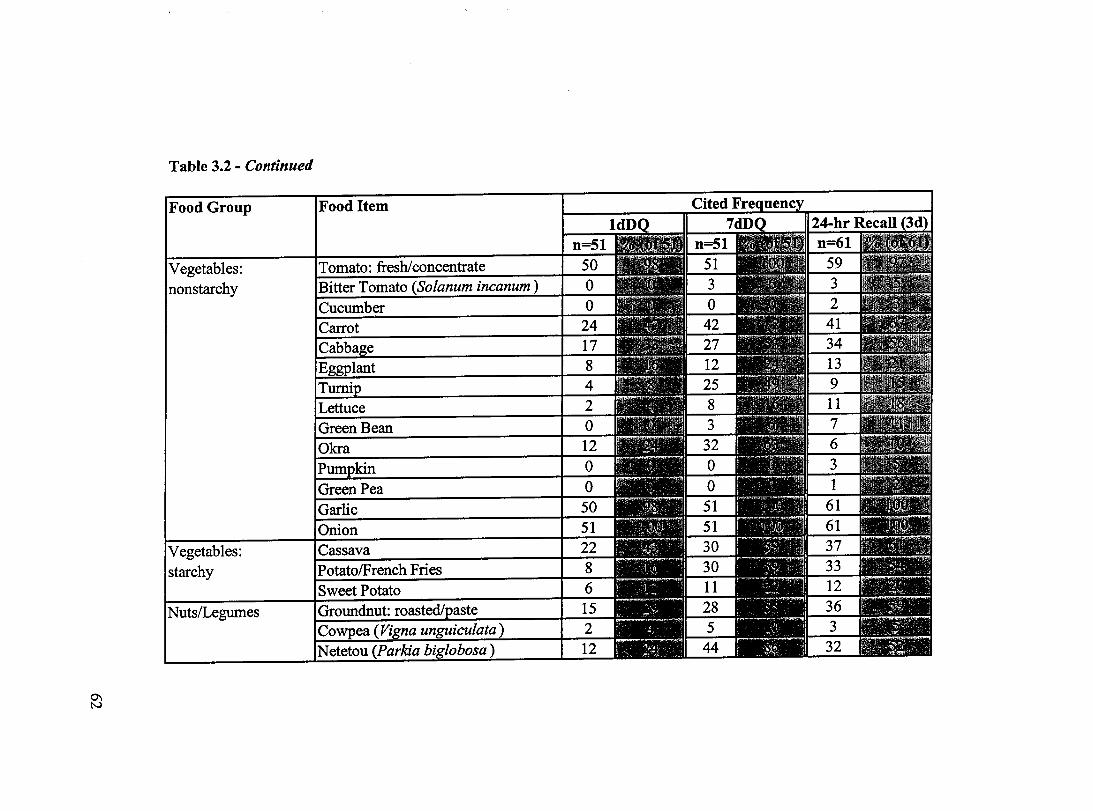
0'1 N
Table 3.2 - Continued
Food Group
Vegetables: starchy
Food Item

Table 3.3 Distribution of adjusted nutrient intakes from mean ofthree 24-hour recalls compared to the F AO/wHO vitamin and mineraI recommended nutrient intakes (F AO/WHO, 2002).
Nutrient FAO/ Mean Percentile WHO lOth 25th 50th 75th 90th
Protein (g) T 47 69 53 59 68 76 86 (mean) 26-80 (range)
Calcium (mg) 1000 434 282 333 422 505 620
Iron (mg) 29.4+ 9.6 5.3 7.6 9.4 11.6 13.4
Zinc (mg) 9.8 7.9 5.6 6.8 7.8 8.7 9.7
Vitamin A (RE) 500 717 332 476 605 901 1110
Vitamin C (mg) 45 38 16 27 34 52 60
Thiamine (mg) 1.1 0.8 0.5 0.6 0.8 0.9 1.0
Riboflavin (mg) * 1.1 1.0 0.5 0.7 0.9 1.2 1.4
Niacin (mg) * 14 13 9 10 12 16 18
Vitamin B6 (mg) ** 1.3 1.3 0.8 0.9 1.2 1.5 1.8
Vitamin B12 (mcg) ** 2.4 3.5 1.1 1.7 2.6 4.4 5.8
tUsing 0.75 g!kg/d (FAO, WHO & UNU, 1985) t Assuming 10% dietary iron bioavailabi1ity (diet of small amounts of fish and vitamin C) *Data transformation not required **Data transformation not possible
63

Table 3.4 Food diversity scores (FDS) and group diversity scores (GDS) for 1dDQ, 7dDQ and 24-hour recall. Fat/oi1, spices, sweets and supplements are exc1uded. Values are expressed as mean (range) ± s.d. [95% confidence interval].
Questionnaire Tooi Food Diversity Score Group Diversity Score (FDS) (GDS)
(total # foods = 60) (total # food groups = Il; representing 60 food items)
1dDQ (n=51) 11.8 (7 - 17) ± 2.5 [11.1, 12.5] 6.3 (4 - 10) ± 1.2 [6.0,6.6] 7dDQ (n=51) 19.5 (12 - 29) ± 3.5 [18.5,20.5] 7.9 (5 - 9) ± 1.0 [7.6, 8.2] 24-hour recall (n=61) 18.6 (9 - 25) ± 3.5 [17.7, 19.5] 8.1 (4 - Il) ± 1.2 [7.8, 8.4]
64

Table 3.5 Correlation statistics for adjusted micro- and macronutrient intakes and food diversity score (FDS) for IdDQ, 7dDQ and 24-hour recall. Total number of food items = 60 (fat/oil, spices, sweets and supplements exc1uded).
Nutrient IdDQ (n=51)
recall period= 1 d Pearson p-value
correlation (r)
Kcal 0.27 0.0586 Protein 0.30 0.0304 Carbohydrate 0.34 0.0134 Fat 0.09 0.5484 Calcium 0.32 0.0223 Iron 0.40 0.0041 Zinc 0.31 0.0262 VitaminA 0.55 <0.0001 Vitamin C 0.37 0.0079 Thiamine 0.45 0.0008 Riboflavin * 0.37 0.0071 Niacin * 0.39 0.0044 Vitamin B6 ** 0.43 0.0016 Vitamin B12** 0.41 0.0026
* Data transformation not required ** Data transformation not possible
7dDQ 24-hour Recall (n=51) (n=61)
recall period=7 d recall period=3d Pearson p-value Pearson p-value
correlation correlation (r) (r)
0.36 0.0086 0.34 0.0074 0.39 0.0052 0.37 0.0038 0.41 0.0030 0.41 0.0010 0.21 0.1381 0.16 0.2077 0.46 0.0007 0.59 <0.0001 0.39 0.0044 0.47 0.0001 0.35 0.0117 0.48 0.0001 0.52 <0.0001 0.41 0.0009 0.64 <0.0001 0.64 <0.0001 0.52 0.0001 0.53 <0.0001 0.48 0.0004 0.59 <0.0001 0.39 0.0044 0.32 0.0107 0.54 <0.0001 0.48 <0.0001 0.51 0.0001 0.36 0.0049
65

Table 3.6 Mean and percent contribution of most important contributors from mean of three 24-hour recalls. Values are to 50% of mean energy and nutrient intake. Total number ofindividual foods and mixed dishes = 143. N=61.
Energy & Nutrients Food Items Mean (%) Energy Tomato rice stew with fish (thiebu diene bu xonx) 308 (12.7) (kcal) White wheat French bread 288 (11.9)
White rice stew with fish (thiebu diene bu weex) 211 (8.7) White rice, plain 171 (7.0) Millet couscous stew with fish (thiaré diene) 137 (5.6) White granulated sugar 128 (5.3) Total of food list 1243 (51.2) Overall mean intake 2428 kcal
Protein Fish 16 (22.3) (g) White wheat French bread 9 (13.3)
Whole dry cow's milk 5 (6.9) Mutlon (sheep meat) 4 (6.3) Tomato rice stew with fish (thiebu diene bu xonx) 4 (5.3) Total of food list 38 (54.1) Overall mean intake 70g
Carbohydrate White wheat French bread 55 (16.3) (g) Tomato rice stew with fish (thiebu diene bu xonx) 43 (12.8)
White rice, plain 38 (11.2) White granulated sugar 33 (9.8) Total of food list 169 (50.1) Overall mean intake 337 g
Fat Tomato rice stew with fish (thiebu diene bu xonx) 13 (14.6) (g) Butler 9 (9.5)
Millet couscous stew with fish (thiaré diene) 8 (8.3) White rice stew with fish (thiebu diene bu weex) 7 (8.2) Whole dry cow's milk 5 (5.4) Mayonnaise 4 (4.5) Total of food list 46 (50.5) Overall mean intake 91 g
Calcium Whole dry cow's milk 166 (38.0) (mg) Curdled cow's milk (lait caillé) 42 (9.5)
Tap water 24 (5.4) Total of food list 232 (52.9) Overall mean intake 439 mg
66

Table 3.6 - Continued
Nutrients Food Items Mean(%) Iron Millet couscous stew with fish (thiaré diene) 1.6 (16.2) (mg) Millet gruel (fondé) 1.0 (10.4)
Millet couscous (thiaré) 0.9 (9.0) Fish 0.6 (6.3) Mutton (sheep meat) 0.6 (6.1) White wheat French bread 0.5 (5.4) Total of food list 5.2 (53.4) Overall mean intake 9.7 mg
Zinc White wheat French bread 0.9 (11.8) (mg) Mutton 0.9 (10.6)
Tomato rice stew with fish (thiebu diene bu xonx) 0.6 (7.9) Whole dry cow's milk 0.6 (7.6) White rice, plain 0.5 (6.8) White rice stew with fish (thiebou diene bu weex) 0.5 (6.1) Total of food list 4.0 (50.8) Overall mean intake 7.9 mg
VitaminA Carrots 335 (44.4) (RE) Butter 79 (10.5)
Total of food list 414 (54.9) Overall mean intake 754 RE
Vitamin C Orange 10 (21.9) (mg) Fruit drink 3 (6.8)
Cassava 3 (6.7) Millet couscous stew with fish (thiaré diene) 2 (5.1) Tomato rice stew with fish (thiebu diene bu xonx) 2 (4.6) Whole dry cow's milk 2 (3.6) Cabbage 1 (3.1) Total of food list 23 (51.8) Overall mean intake 44 mg
Thiamine White wheat French bread 0.11 (14.6) (mg) Fish 0.10 (12.6)
Whole dry cow's milk 0.05 (6.7) Millet couscous stew with fish (thiaré diene) 0.05 (6.2) Millet grue1 (fondé) 0.04 (5.0) Tomato rice stew with fish (thiebu diene bu xonx) 0.04 (4.6) Millet couscous (thiaré) 0.03 (4.3) Total of food list 0.42 (54.0) Overall mean intake 0.80 mg
67

Table 3.6 - Continued
Nutrients Food Items Mean(%) Riboflavin Whole dry cow's milk 0.22 (22.5) (mg) Mutton (sheep meat) 0.10 (10.1)
White wheat French bread 0.08 (8.5) Fish 0.06 (6.1) Curdled cow's milk (lait caillé) 0.05 (5.0) Total of food list 0.51 (52.2) Overall mean intake 0.98 mg
Niacin Fish 3.8 (28.9) (mg) White wheat French bread 0.9 (7.1)
Tomato rice stew with fish (thiebu diene bu xonx) 0.7 (5.2) Mutton (sheep meat) 0.6 (4.8) White rice stew with fish (thiebou diene bu weex) 0.6 (4.4) Total of food list 6.6 (50.4) Overall mean intake 13.1 mg
Vitamin B6 Fish 0.3 (22.6) (mg) Tomato rice stew with fish (thiebu diene bu xonx) 0.09 (7.0)
White rice stew with fish (thiebou diene bu weex) 0.08 (6.1) Millet couscous stew with fish (thiaré diene) 0.07 (5.6) White rice, plain 0.07 (5.3) Whole dry cow's milk 0.06 (4.3) Total of food list 0.67 (50.9) Overall mean intake 1.3 mg
Vitamin B12 Fish 1.3 (37.8) (mcg) Sheep's liver 0.6 (17.2)
Total of food list 1.9 (55.0) Overall mean intake 3.5 mcg
68

18
16
14
12
= .. e 10 C> ~ ..... C>
0 8 Z
6
4
2
0
17
2
0
10'71 1\,'71 10' 1\,'
Db concentration g/dL
Figure 3.1 Distribution ofhemoglobin (Rb) concentrations (n=59). Cut-offused for classifying anemia: Rb < 12 gldL.
69

-.l o
Frequency 16 **** •
• **.* 15 *.*.*
* •••• 14 ••• * •
••••• 13 •••••
* •• ** 12 ** •• * •• * ••
* •• *. * •••• 11 ••••• *** ••
••••• ..* .. 10 ••••• * ••••
••••• • •••• 9 * •••• ..* .. ** •• *
••••• ** •• * * ••• * 8 * •• ** •• * •• *.* ••
••••• * •• *. • •••• 7 ** ••• • •• *. ** •••
* •• ** *** •• * ••• * 6 *** •• *.*.* *.* •• * ••• *
*.*** **.*. * •••• ** •• * 5 *.* •• • •••• *.* •• ** ••• • •• **
*.**. * •••• *.**. *** •• • ••• * 4 *.* •• * ••• * • •••• ** •• * •• *.*
*** •• *.* •• * ••• * *.**. ** •• * 3 ** •• * * •••• *.* •• * •••• *** •• * ••• *
* •••• *** •• • •••• ***** *.* •• ** •• * 2 * •••• • •••• *.**. * ••• * *.* •• ••• **
* •••• * •••• • •••• * •••• * ••• * *.* •• * •••• • •••• ****. * •• ** ** ••.• * •• ** *.*.* ••••• ** •• * * •••• * •• *. * ••• *
7 9 11 13 15 17
FOS Figure 3.2 Frequency bar chart for Food Diversity Score (FDS) for IdDQ (no fatloil, sweets, spices, supplements).

-...l -
Frequency ***** *****
30 ***** ***** ***** ***** *****
25 1r**1r*
***** ***** ***** *****
20 ***** 1r****
***** ***** *****
15 ***** ***** ***** ***** *****
10 ***** ***** ***** ***** ***** ***** ***** ***** ***** *****
5 ***** ***** ***** ***** ***** *****
***** ***** ***** ***** ***** ***** 1r**** **-**
***** ***** ***** ***** *****
4.2 5.4 6.6 7.8 9.0 10.2
GDS Figure 3.3 Frequency bar chart for Group Diversity Score (ODS) for IdDQ (no fatloïl, sweets, spices,
supplements).

.....:1 N
Frequency ••• ** *** •• ••••• *.*.*
15 ••••• • •••• * •• ** •• * •• * •••• • •••• ••••• ..* .. ••••• * •• *.
10 ••• ** * •• * • • * ••• .* ...
•• * •• • ***. *.** • ••••• ** ••• * •••• ••••• .***. • •• *.
5 ••••• • •••• **.*. • •••• •• * •• • •••• • •• *. • •• ** ** ••• ..* .. • ***. ••••• ••••• • * •• * ..* .. * •••• • •••• • •••• •• * •• *.* •• • •• *. • •••• • •••• * •• **
13.5 16.5 19.5 22.5 25.5 28.5
FOS
Figure 3.4 Frequencybar chart for Food Diversity Score (FDS) for 7dDQ (no fatloil, sweets, spices, supplements) .

-...l w
Frequency ***** ***** *****
20 ***** ***** ***** ***** *****
15 *1t1t1t*
**1t1t* ***** *1t*1t* ***** ***** ***** ***** *****
10 ***** ***** ***** ***** 1t***1t
***** ***** ***** ***** ***1t* ***** ***** ***** *****
5 ***** ***** 1t****
***** ***** ***** **1t** ***** ***** *****
***** ***** ***** ***** ***** ***** ***** ***** ***** *****
5.2 6.0 6.8 7.6 8.4 9.2
GDS
Figure 3.5 Frequency bar chart for Group Diversity Score (GDS) for 7dDQ (no fat/oil, sweets, spices, supplements).

4.0 Conclusion
This study has explored whether dietary diversity, defined as the number of
different foods or food groups consumed, can serve as a proxy indicator of nutrient intake
in a peri-urban community in West Africa. To directly measure dietary diversity, Hath~y
et al (2000) used a simplified food li st questionnaire to deterrnine the number of foods
consumed in the household the previous day. To our knowledge, ours is the first such
questionnaire aimed at the individual.
The results of the study provide evidence that a diversity indicator based on
nurnbers of food items consumed over a 7 -day period as measured by a diversity
questionnaire food li st is able to evaluate nutrient intake in a population. Strong
associations were seen between diversity score and intake of vitamin A, vitamin C,
thiamine, vitarnin B6 and vitamin B12• Weaker, but still significant associations were
found for calcium, iron, zinc, ribotlavin and niacin. These results support previous
research in developing countries that has also demonstrated that the nutritional quality of
the diet improves with a greater number of individual foods (Hatl0Y et al, 1998; Ogie et
al, 2001; Onyango et al, 1998; Rose et al, 2002; Tarini et al, 1999; Torheim et al, 2003).
However, contrary to severai studies (Hatl0Y et al, 1998; Ogie et al, 2001), grouping
foods resulted in weaker correlations despite attempts to group food in a variety of ways.
This study suggests that a score based on individual food items might be more useful.
Further research in diverse settings would help to further elaborate on this.
74
Studies have shown an association between diversity and anthropometric status
(Arimond & Ruel, 2002; Hat10Y et al, 2000; Onyango et al, 1998). In the present study,
hemoglobin, a biochemical indicator of nutritional status, was not associated with iron
intake or diversity indices. Hemoglobin status is influenced by a variety of factors in
addition to iron intake, and hence hemoglobin may not be an ideal indicator for dietary
diversity. The hemoglobin distribution, however, does have value in describing the
sample population. It suggests that anemia is an important health issue for women in the
community.
Overall, protein intake was adequate in the study population. However, for most
individuals, the consumption of calcium, iron, zinc and thiamine was be10w
recommended levels. Vitamin A intake was met at the 50th percentile of intake
distribution. Vitamin C intake was met at the 75th percentile ofintake distribution. This
study was conducted during the dry season when fresh produce is less available, therefore
one must interpret these data cautiously.
In summary, our data suggest that the women in the community are lacking
several important micronutrients in their diet. Further dietary studies at different times of
the year would he1p to confirm this. In addition, hemoglobin measurements indicate that
anemia might be an important health issue. Finally, the data suggest that dietary diversity
indicators can act as proxy measures of nutrient intake. The implication being that these
indicators would be useful in documenting the rapid changes occurring in peri-urban and
75

urban settings of the developing world, and in the monitoring of change resulting from
nutrition interventions. Further studies with larger sample sizes and additional indicators
of nutritional status would help in the exploration of the relationship between measures of
diversity and nutrient intake.
Globally, undemutrition still affects a larger percentage of the population,
however diseases related to ovemutrition are emerging as a new health threat.
Contributing factors are urbanization and changing economies, which have lead to
simplification of diets emphasizing small numbers of energy-dense, nutrient-poor foods.
The resulting decrease in dietary diversity is a common theme in many rapidly evolving
communities such as Yoffvillage and threatens the good health and longevity offered by
a diverse diet that prevents nutritional deficiencies and chronic diseases. Promotion of
dietary diversity will be an important component in the arsenal addressing several key
nutrition issues such as micronutrient deficiency, the nutrition transition and nutrient
bioavailability.
76

5.0 References
Agte VV, Gokhale MK, Paknikar KM and Chiplonkar SA (1995): Assessment of pearl millet vs rice based diets for bioavailability of four trace metals. Plant Foods Hum. Nutr. 48, 149-158.
Allen LH, Black AK, Backstrand JR, Pelto GH, Ely RD, Molina E and Chavez A (1991): An analytic approach for exploring the importance of dietary quality versus quantity in the growth of Mexican children. Food Nutr. Bull. 13,95-104.
Arimond M and Ruel MT (2002): Summary indieators for infant and ehild feeding praetices: An examplefrom the Ethiopia Demographie and Health Survey 2000. Food Consumption and Nutrition Division Discussion Paper. Washington DC: International Food Policy Research Institute.
Bhargava A, Bouis HE and Scrimshaw NS (2001): Dietary intakes and socioeconomic factors are associated with the hemoglobin concentration of Bangladeshi women. J. Nutr. 131, 758-764.
Black AE, Coward W A, Cole TJ and Prentice AM (1996): Human energy expenditure in affluent societies: analysis of 574 doubly-Iabelled water measurements. Eur. J. Clin. Nutr. 50, 72-92.
CANDAT (2000): CANDAT: A Nutrient Calculation System 5.0. London: Godin London Incorporated.
Charbonneau A and Laberge Gaudin V (2001) : Etude sur le changement de comportement et de pratiques alimentaires: Approche familiale Yoff Senegal. Report written for course NTR-18672. Quebec: Université de Laval.
Diagana B and Reardon T (1999): Household consumption responses to the franc CFA devaluation: evidence from urban Senegal. Food Polïcy 24,495-515.
Drewnowski A, Henderson SA, Driscoll A and RoUs BJ (1997): The Dietary Variety Score: assessing diet quality in healthy young and oIder adults. J. Am. Diet. Assoe. 97, 266-271.
Dumez R and Kâ M (2000) : Yoff Le Territoire Assiégé: Un village Lébou dans la banlieue de Dakar. Paris: UNESCO.
Dwyer J (1999): Dietary Assessment. In Modern Nutrition in Health and Disease, eds. ME Shils, JA OIson, M Shike and AC Ross, pp 937-959. Baltimore: Lippincott, Williams and Wilkins.
77

FAO, WHO and UNU (1985): Energy and Protein Requirements. Report of a joint F AO/WHOIUNU Expert Consultation, Technical Report Series no. 724. Geneva: WHO.
F AO/WHO (2002): Ruman Vitamin and Mineral Requirements. Report of a joint F AO/WHO expert consultation, Bangkok, Thailand. Rome: F AO.
Ferguson EL, Gibson RS, Opare-Obisaw C, Osei-Opare F, Lamba C and Ounpuu S (1993): Seasonal food consumption patterns and dietary diversity of rural preschool Ghanaian and Malawian children. Ecol. Food Nutr. 29,219-234.
Ferguson EL, Gadowsky SL, Huddle JM, Cullinan TR, Lehrfeld J and Gibson RS (1995): An interactive 24-h recalI technique for assessing the adequacy of trace mineraI intakes ofrural Malawian women; its advantage and limitations. Eur. J. Clin. Nutr. 49,565-578.
Fouere T, Maire B, De1peuch F, Martin-Prevel Y, Tchibindat F and Adoua-Oyila G (2000): Dietary changes in African urban households in response to currency devaluation: foreseeable risks for health and nutrition. Public Realth Nutr. 3,293-301.
Garrett J and Rue1 M (2003): Stunted child-overweight mother pairs: An emerging policy concern? Food Consumption and Nutrition Division Discussion Paper. No. 148. Washington DC: International Food Policy Research Institute.
Gibson RS (1990): Principles ofNutritional Assessment. New York: Oxford University Press.
Gibson RS and Ferguson EL (1999): An Interactive 24-hour Recallfor Assessing the Adequacy of Iron and Zinc Intakes in Developing Countries. Washington DC: International Life Sciences Institute.
Gibson RS and Huddle JM (1998): Suboptimal zinc status in pregnant Malawian women: its association with low intakes of poorly available zinc, frequent reproductive cycling, and malaria. Am. J. Clin. Nutr. 67, 702-709.
Guiro AT, Galan P, Cherouvrier F, SalI MG and Hercberg S (1991): Iron absorption from African pearl millet and rice meals. Nutr. Res. 11,885-893.
Guthrie HA and Scheer J (1981): Validity of a dietary score for assessing nutrient adequacy. J. Am. Diet. Assoc. 78,240-245.
Haddad L (2003): Redirecting the diet transition: What can food policy do? Dev. Policy Rev. 21,599-614.
HalIberg L (1981): Bioavailability of dietary iron in man. Annu. Rev. Nutr. 1, 123-147.
Harland BF and Oberleas D (1987): Phytate in foods. World Rev. Nutr. Diet. 52,235-259.
78

Hat10Y A, Torheim LE and Oshaug A (1998): Food variety - a good indicator of nutritional adequacy of the di et? A case study from an urban area in Mali, West Africa. Eur. J Clin. Nutr. 52,891-898.
Hatl0Y A, Hallund J, Diarra MM and Oshaug A (2000): Food variety, socioeconomic status and nutritional status in urban and rural areas in Koutiala (Mali). Public Bealth Nutr. 3, 57-65.
Hazell T and Johnson IT (1987): In vitro estimation ofiron availability from a range of plant foods: influence ofphytate, ascorbate and citrate. Br. J Nutr. 57,223-233.
Health Canada (1992): Food Guide Facts: Backgroundfor Educators and Communicators. Ottawa: Minister of Supply and Services Canada.
Hertzler AA and Anderson HL (1974): Food guides in the United States: An historical review. J Am. Diet. Assoc. 64, 19-28.
Hoddinott J and Yohannes Y (2002): Dietary diversity as a householdfood security indicator. Washington DC: Food and Nutrition Technical Assistance Project, Academy for Educational Development.
Hodges RE, Sauberlich HE and Canham JE (1978): Hematopoietic studies in vitamin A deficiency. Am. J Clin. Nutr. 31, 876-885.
Hodgson JM, Hsu-Hage BHH and Wahlqvist ML (1994): Food variety as a quantitative descriptor of food intake. Ecol. Food Nutr. 32, 137-148.
Hsu-Hage BH and Wahlqvist ML (1996): Food variety of adult Melbourne Chinese: A case study of a population in transition. World Rev. Nutr. Diet. 79,53-69.
Huang KS and Bouis H (1996): Structural changes in the demandfor food in Asia. IFPRI Food, Agriculture, and the Environment Discussion Paper No. Il. Washington DC: International Food Policy Research Institute.
Hulley SB, Cummings SR, Browner WS, Grady D, Hearst N and Newman TB (2001): Designing Clinical Research: An Epidemiological Approach. Philadelphia: Lippincott Williams and Wilkin.
ILSI (2002): International Life Sciences Institute News. Washington DC: International Life Sciences Institute.
Johns T (2003): Plant biodiversity and malnutrition: Simple solutions to complex problems. Afr. J Food Agr. Nutr. Dev. 3, 45-52.
Kant AK, Schatzkin A, Harris TB, Ziegler RG and Block G (1993): Dietary diversity and subsequent mortality in the First National Health and Nutrition Examination Survey Epidemiologic Follow-up Study. Am. J Clin. Nutr. 57,434-440.
79

Kant AK, Schatzkin A and Ziegler RG (1995): Dietary diversity and subsequent causespecific mortality in the NHANES I epidemiologic follow-up study. J. Am. Coll. Nutr. 14,233-238.
Kant AK (1996): Indexes of overall diet quality: a review. J. Am. Diet. Assoc. 96, 785-791.
Kelly V, Reardon T, Diagana Band Abdoulaye Fall A (1995): Impacts of devaluation on Senegalese households: policy implications. Food Policy 20,299-313.
King H, Aubert RE and Herman WH (1998): Global burden of diabetes, 1995-2025: Prevalence, numerical estimates, and projections. Diabetes Care 21, 1414-1431.
Krebs-Smith SM, Smiciklas-Wright H, Guthrie HA and Krebs-Smith J (1987): The effects ofvariety in food choices on dietary quality. J. Am. Diet. Assoc. 87,897-903.
Labadarios D (1999): The National Food Consumption Survey (NFCS): Children aged 1-9 years, South Africa. Stellenbosch: Directorate, Nutrition, Department of Health.
Mack T (1997): Third International Eco-City Conference and Permaculture Design Certification Course Yoff, Senegal, 1996. Paper presented at the International Permaculture Conference. Perth: Permaculture Association of Western Australia Incorporated.
Madden JP and Yoder MD (1972): Program evaluation: Food stamps and commodity distribution in rural areas of central Pennsylvania. Pennsylvania Agr. Exp. Station Bull. 78, 1-119.
Maxwell D, Levin C, Armar-Klemesu M, Ruel M, Morris S, and Ahiadeke C (2000): Urban Livelihoods and Food and Nutrition Security in Greater Accra, Ghana. Research Report No. 112. Washington DC: International Food Policy Research Institute in collaboration with the Noguchi Memorial Institute for Medical Research, Ghana, and the W orld Health Organization.
Mennen LI, Mbanya JC, Cade J, Balkau B, Sharma S, Chungong Sand Cruickshank JK (2000): The habituaI diet in rural and urban Cameroon. Eur. J. Clin. Nutr. 54, 150-154.
Miller WL, Crabtree BF and Evans DK (1992): Exploratory study ofthe relationship between hypertension and diet diversity among Saba Islanders. Public Health Rep. 107, 426-432.
Ministère de la Santé (1999) : Guide alimentaire à l'intention des agents de santé et de l'action sociale. Sénégal: USAID/BASICS.
Moore MC, Judlin BC and Kennemur PM (1967): Using graduated food models in taking dietary histories. J. Am. Diet. Assoc. 51,447-450.
80

National Research Council (1986): Nutrient Adequacy: Assessment using Food Consumption Surveys. Subcommittee on Criteria for Dietary Evaluation, Coordinating Committee on Evaluation of Food Consumption Surveys. Food and Nutrition Board, Commission on Life Sciences. Washington DC: National Academy Press.
Ogle BM, Hung PH and Tuyet HT (2001): Significance ofwi1d vegetab1es in micronutrient intakes ofwomen in Vietnam: an ana1ysis of food variety. Asia Pac. J. Clin. Nutr. 10,21-30.
Onyango A, Koski KG and Tucker KL (1998): Food diversity versus breastfeeding choice in determining anthropometric status in rural Kenyan toddlers. Int. Epidemiol. Assoc. 27,484-489.
Oyenuga VA (1968): Nigeria's food andfeeding stuff. Ibadan, Nigeria: University Press.
Parr CL, Barikmo l, Torheim LE, Ouattara F, Kaloga A and Oshaug A (2002): Validation of the second version of a quantitative food-frequency questionnaire for use in Western Mali. Public Health Nutr. 5,769-781.
Pearce R (1990): Traditional food crops in sub-Saharan Africa. Food Policy 15,374-382.
Popkin BM (2001): Nutrition in transition: The changing global nutrition challenge. Asia Pac. J. Clin. Nutr. 10, S13-S18.
Posner BM, Smigelski C, Duggal A, Morgan JL, Cobb J and Cupples LA (1992): Validation of two-dimensional models for estimation of portion size in nutrition research. J. Am. Diet. Assac. 92,738-741.
Rao BSN and Prabhavathi T 1978): An in vitro method for predicting the bioavailability of iron from foods. Am. J. Clin. Nutr. 31, 169-175.
Rao S, Yajnik CS, Kanade A, FaU CHD, Margetts BM, Jackson AA, Shier R, Joshi S, Rege S, Lubree H and Desai B (2001): Intake ofmicronutrient-rich foods in rural Indian mothers is associated with the size of their babies at birth: Pune MaternaI Nutrition Study. J. Nutr. 131, 1217-1224.
Reardon T (1993): Cereals demand in the Sahel and potential impacts ofregional cereals protection. World Dev. 21, 17-35.
Reddy NR, Pierson MD, Sathe SK and Salunkhe DK (1989): Phytates in Cereals and Legumes. Boca Raton: CRC Press.
Rose D, Meershoek S, Ismael C and McEwan M (2002): Evaluation of a rapid field tool for assessing household diet quality in Mozambique. Food Nutr. Bull. 23, 181-189.
Rose D and Tschirley D (2003): Predicting dietary intakes with simple food recall information: a case study from rural Mozambique. Eur. J. Clin. Nutr. 57, 1212-1221.
81

Ross CG (1980): Grain demand and consumer preferences in Senegal. Food Policy 5, 273-281.
Ruel MT (2002): Is Dietary Diversity an Indicator of Food Security or Dietary Quality? A Review of Measurement Issues and Research Needs. Food Consumption and Nutrition Division Discussion Paper No. 140. Washington DC: International Food Policy Research Institute.
Ruel MT (2003): Operationalizing Dietary Diversity: A Review of Measurement Issues and Research Priorities. J. Nutr. 133, 3911S-3926S.
Ruel MT, Brown KH and Caulfield LE (2003): Moving Forward With Complementary Feeding: Indicators and Research Priorities. Food Consumption and Nutrition Division Discussion Paper No. 146. Washington DC: International Food Policy Research Institute.
SAS (2001): SAS 8.2 System for Windows. Cary: SAS Institute Incorporated.
Schofield WN (1985): Predicting basal metabolic rate, new standards and review of previous work. Hum. Nutr. Clin. Nutr. 39 (Suppl 1), 5-41.
Seck A, Sow 1 and Niass M (1999): Senegal. In The Biodiversity of Traditional Leafy Vegetables, eds. JA Chweya and PB Eyzaguirre, pp 85-110. Rome: International Plant Genetic Resources Institute.
Stookey JD, Wang Y, Ge K, Lin H and Popkin BM (2000): Measuring diet quality in China: the INFH-UNC-CH Diet Quality Index. Eur. J. Clin. Nutr. 54,811-821.
Tardif-Douglin D and Diouf A (1998): Rice consumption and the effects ofrice sector reforms in Senegal. RSAP/APAP No. 15. Bethesda: Development Alternatives Incorporated.
Taren D and Chen J (1993): A positive association between extended breast-feeding and nutritional status in rural Hubei Province, People's Republic of China. Am. J. Clin. Nutr. 58, 862-867.
Tarini A, Bakari Sand Delisle H (1999): The overall nutritional quality of the diet is reflected in the growth of Nigerian children. Santé 9,23-31.
Thompson FE and Byers T (1994): Dietary assessment resource manual. J. Nutr. 124, 2245S-2317S.
Tinker A (1998): Safe Motherhood is a Vital Social and Economie Investment. In The Safe Motherhood Action Agenda: Priorities for the Next Decade. Report on the Safe Motherhood Technical Consultation 18-23 October 1997, ed. A Starrs, pp 15-19. Colombo, Sri Lanka: Inter-Agency Group for Safe Motherhood.
Tinker A and Ransom E (2002): Healthy Mo th ers and Healthy Newborns: The Vital Link. Washington DC: Population Reference Bureau.
82
Tontisirin K, Nantel Gand Bhattacharjee L (2002): Food-based strategies to meet the challenges ofmicronutrient malnutrition in the developing world. Proc. Nutr. Soc. 61, 243-250.
Torheim LE, Barikmo l, Hatl0Y A, Diakite M, Solvoll K, Diarra MM and Oshaug A (2001): Validation of a quantitative food-frequency questionnaire for use in Western Mali. Public Health Nutr. 4, 1267-1277.
Torheim LE, Barikmo l, Parr CL, Hatl0Y A, Ouattara F and Oshaug A (2003): Validation of food variety as an indicator of diet quality assessed with a food frequency questionnaire for Western Mali. Eur. J. Clin. Nutr. 57, 1283-1291.
Tucker KL (2001): Eat a variety ofhealthful foods: old advice with new support. Nutr. Rev. 59, 156-158.
Underwood BA (2000): Dietary approaches to the control ofvitamin A deficiency: an introduction and overview . Food Nutr. Bull. 2, 117-123.
UN ACC/SCN (2000): Fourth Report on the World Nutrition Situation: Nutrition Throughout the Lifecycle. UN ACC/SCN.
UNESCO (1997) : Situation Démographique du Village de YofJ. Programme Interdisciplinaire MOST PROJET CITIES. Paris: UNESCO Bureau Régional D'Éducation Pour L'Afrique.
US Department of Agriculture Human Nutrition Information Service (1992): Food Guide Pyramid: A Guide to Daily Food Choices. Home and Garden Bulletin No. 252. Washington DC: US Department of Agriculture.
Vant' Riet H, den Hartog AP, Mwangi AM, Mwadime RKN, Foeken DWJ and van Staveren W A (2001): The role of street foods in the dietary pattern oftwo low-income groups in Nairobi. Eur. J. Clin. Nutr. 55,562-570.
Vorster HH, Boume LT, Venter CS and Oosthuizen W (1999): Contribution of nutrition to the health transition in deve10ping countries: a framework for research and intervention. Nutr. Rev. 57,341-349.
Wahlqvist ML, Lo CS and Myers KA (1989): Food variety is associated with less macrovascular disease in those with Type II diabetes and their healthy controls. J. Am. Coll. Nutr. 8,515-523.
Westerterp KR and Goris AH (2002): Validity of the assessment of dietary intake: problems ofmisreporting. Curr. Opin. Clin. Nutr. Metab. Care 5,489-493.
WHO (2000): Nutritionfor Health and Development: A Global Agenda for Combating Malnutrition - Progress Report. Geneva: World Health Organization.
83

WHO/F AO (1996): Preparation and use of food-based dietary guidelines. Report of a joint FAO/WHO consultation. Geneva: World Health Organization.
WHO/FAO (2003): Diet, Nutrition and the Prevention ofChronic Diseases. Report ofa Joint WHO/FAO Expert Consultation. WHO Technical Report Series. No. 916. Geneva: World Health Organization.
WHOIUN UniversitylUNICEF (2001): Iron deficiciency anaemia, assessment, prevention and control: a guide for programme managers. Geneva: World Health Organization.
WorldFood (2003): WorldFood 2.0 Dietary Assessment System. Berkeley: The Regents of the University of Califomia.
Zeitlin M (1996): The Eco-YofJNewsletter. Yoff, Senegal: YoffEco-Community Program.
84
Appendices

Contents
Appendix l: Consent Fonn for Study Participants ........................................... A-3
Appendix 2: Socio-demographic Questionnaire .............................................. A-6
Appendix 3: Diversity Questionnaire .......................................................... A-9
Appendix 4: 24-Hour Recall Questionnaire .................................................. A-II
Appendix 5: McGill University Ethics Certificate ........................................... A-13
A-2

Appendix 1
Consent Form for Study Participants

La diversité alimentaire et le niveau des nutriments à YofJ, Sénégal: Un sondage des femmes de 18 à 45 ans
FORMULAIRE DE CONSENTEMENT Chercheur: Dina Spigelski ONG CRESP (820.92.00)
DECLARATION DE PARTICIPANTE
Moi, ............................................................................... , confirme que:
L'ONG CRESP et l'Université Mc Gill au Canada m'ont demandé de participer dans ce sondage C'était bien expliquer que:
• Il Y a trois buts de ce sondage: • De déterminer le genre et la quantité des aliments que les femmes à Yoff mangent pour
nous indiquer si les femmes mangent les bons aliments pour la santé. • De déterminer le taux d'anémie au sein de la population Yoffoise. • De déterminer le taux du diabète au sein de la population Y offoise. • Pour avoir l'information par rapport aux aliments: • On me demandera des questions par rapport au genre et à la quantité des aliments que je
mange. • On me demandera ces questions 3 fois; chaque fois sera un jour différent. • On demande cette information de 65 femmes â Yoff. • Chaque entrevue durera 30 minutes. • L'information que je donne sera confidentielle. • Pour avoir l'information par rapport au taux d'anémie et au diabète: • On me demande d'être piqué 2 fois, 2 jours différents. • Le chercheur piquera sur mon doigt pour avoir une goutte de sang selon le processus
suivant: • On nettoie le doigt avec l'alcool • On pique le doigt avec une aiguille neuve • On utilise un petit tube pour récupérer une goutte de sang • On met le tube dans une machine pour lire les résultats • Il n'y a pas de risques associés avec ce processus. • Les résultats anonymes du groupe seront présentés à une réunion à la fin de l'étude
(environ le mois de mars). • La chercheure me donnera les résultats des tests pour l'anémie et le diabète. • Je pourrai contacter le chercheur pour connaître mes résultats personnels par rapport à la
nutrition. • Je pourrai arrêter ou refuser de participer à n'importe quel point durant les entrevues. • Le fait de refuser de participer ou de ne plus répondre aux questions, ne m'endommage
pas. • L'information ci dessus a été expliquée • par .............................................................. (nom de chercheur ou de traducteur) • en ............. (lang.) et je comprends cette langue et j'ai bien compris les explications. • On m'a donné le temps de poser des questions quand je n'ai pas bien compris les
explications. • Je ne suis pas obligée de participer à cette étude.
A-4
J'accepte volontairement de participer à cette étude.
Lieu: ........................................................................ .
Date: ............................................................................. .
x ..................................................................................... . (Signature)
DECLARATION DE CHERCHEUR
Moi, Dina Spigelski, confirme que: • J'ai expliqué toute l'information dans ce document à la participante. • Je lui ai dit de demander des questions s'il y a quelque chose qui n'est pas claire.
Lieu: ........................................................................... ..
Date: ............................................................................. .
x ..................................................................................... . (Signature)
DECLARATION DE TRADUCTEUR
Moi, ........................................................................................ , confirme que:
• J'ai traduit ce document de français à wolof. • J'ai traduit toutes les questions de la participante au chercheur. • J'ai traduit toutes les réponses du chercheur à la participante.
Lieu: ............................................................................ .
Date: ............................................................................. .
x ..................................................................................... . (Signature)
A-5

Appendix2
Socio-demographic Questionnaire

La diversité alimentaire et le niveau des nutriments à Yoff, Sénégal: Un sondage des femmes de 18 à 45 ans
QUESTIONNAIRE SOCIOIDÉMO/SANTÉ
1 Code du sujet: 2 Date de l'interview: dec (1)/ jan (2) / fev (3)/ mar (4) 3 Type de logement: Bâtiment à étages (1) / maison détachée (2) / concession (3) 4 La cour: Carreaux (1) / dalle (2) / sable (3) 5 Fleurs / plantes: Oui (1) / non (2) 6 Quartier: Tonghor (1) / Ndénatte (2) / Dagoudane (3) / Ndengagne (4) / Mbenguène (5) / Ngaparou (6) / Layène (7)
LE MÉNAGE
7 Nom du chef de la famille (CDF)
8 Est-ce que le CDF travaille? Oui (1)
Non (2)
9 Est-ce que vous êtes mariée? Mariée (1), Séparée (2), Divorcée (3), Célibataire (4), Veuve (5)
10 Est-ce que le CDF est votre mari? Oui (1)
Non (2)
NA (9)
11 Est-ce que votre mari travaille? Oui (1)
Non (2)
NA (9)
12 Est-ce que vous travaillez? Ne travaille pas hors ménage & ne fait pas de commerce(1)
Travaille à domicile et fait du commerce de chez soi (2) ___
Travaille hors du ménage (3)
13 Il Y a combien de personnes dans la famille?
14 Est-ce que la famille a des membres à l'étranger? Oui (1) Non (2)
15 Est-ce que la famille a des membres qui suivent Oui (1) des études a une école privée au Sénégal? Non (2)
A-7

HABITUDES ALIMENTAIRES
16 Est-ce qu'il y a quelqu'un dans la famille qui pêche? Oui (1) 1 Non (2)
17 Est-ce que votre famille mange ces poissons que Oui (1) 1 Non (2) 1 NA (9)
vous pêchez?
18 Est-ce que votre famille cultive des fruits et légumes? Oui (1) 1 Non (2)
19 Est-ce que vous les mangez? Oui (1) 1 Non (2) 1 NA (9)
20 Si oui, lesquels? INA (9)
21 A part des fêtes, est-ce que votre famille mange des Oui (1) 1 Non (2)
animaux que vous élevez?
22 Si oui, lesquels? Poulets (1) 1 Moutons (2) 1 Chèvres (3) 1 NA (9)
23 En générale, est-ce qu'il y a des aliments que vous Oui (1) 1 Non (2)
vouliez manger de plus?
24 Si oui, ils sont lesquels? INA (9)
25 Pourquoi vous ne les mangez pas assez? Trop chère (1) 1 Pas disponible à Yoff (2) 1
Autres à préciser (3) INA (9)
LA RÉPONDANTE
26 Quelle est votre age?
27 Quel est votre groupe ethnie? Lébou (1) 1 Wolof (2) 1 Sérère (3) 1 Pulaar (4) 1 autre (5) __
28 Quel est votre dernier niveau d'instruction à l'école? Primaire (1) 1 moyen (2) 1 secondaire (3) 1 supérieure (4) 1
jamais était à l'école (5)
29 Est-ce que vous avez des enfants? Oui (1) 1 Non (2)
30 Combien? _/NA(9)
31 Combien <5ans? _/NA(9)
32 Est-ce que vous allaitez un enfant maintenant? Oui (1) 1 Non (2) 1 NA (9)
33 Est-ce qu'un médecin vous a dit que vous avez le Oui (1) 1 Non (2) diabète?
34 Est-ce que vous le soignez maintenant? Oui (1) 1 Non (2) 1 NA (9)
35 Comment? INA (9)
36 Est-ce qu'un médecin vous a dit que vous avez Oui (1) 1 Non (2) l'anémie?
37 Est-ce que vous la soignez maintenant? Oui (1) / Non (2) / NA (9)
38 Comment? INA (9)
A-8

Appendix3
Diversity Questionnaire

La diversité alimentaire et le niveau des nutriments à Yoff, Sénégal: Un sondage des femmes de 18 à 45 ans
FORMULAIRE DE DIVERSITÉ Code du sujet: __ Date de l'interview: ------- Journée de manger: ____ _
Hier 7jrs Hier 7jrs Céréale: Importé Fruits Riz (blanc) Orange / Mandarine Sombi Pomme Nouilles au riz Ananas Pain (baguette) Mangue Macaroni/spaghetti Gerte Toubab Couscous marocain Banane Mooxams Jujube Croissant Pastèque Céréale: Locale Tamarin Fonde Citron Lax Pamplemousse Thiare Noix de coco Bouille au mil Jus de bissap Pain au mil Jus de bouye Beignets au mil Raisin sec Lait / Prod Laitier Légumes Lait en poudre Tomate Lait caillé Diahoute Crème à soo Concombre Lait en liquide Carotte Fromage Choux Lait concentré Aubergine Yaourt Navet Viande Laitue Mouton Haricot vert Chèvre Gombo Bœuf Courge Foie Sauce soble Saucisse Pois vert Volaille Cassava Poulet Pomme de terre / frits Œufs Patate sucrée Œuf NoixlLéf(umineuses Poisson/Fruit de mer Arachide Morceau Ndambe (pâte au niebe) Thon pour ndeki Soul (pâte au nététou) Boulettes de poisson Gras additionné Crevette Huile de palme Yet Beurre / margarine Repas:Sauce (iiaari chin) Mayonnaise Soupo kandialdomoda Graisse de mouton Mafé Mets sucré Basse!Mboum Sucre Thiou Boisson (coka, fanta) Repas (benechin) Biscuit Thieb bu weex/xonx/mbaxal Chocolat Daxine Crème glacée Thiare gen Bonbon
Fataya Chewinggum
Journée normale? Suppléments: Fer
A-lO

Appendix 4
24-Hour Recall Questionnaire

La diversité alimentaire et le niveau des nutriments à Yoff, Sénégal: Un sondage des femmes de 18 à 45 ans
RAPPEL DE 24-HRES
Date de l'interview: dec (1) / jan (2) / fev (3) / mar (4) / 2 / 3 Journée de manger: lun (1) / mar (2) / mer (3) / ·eu (4) / ven (5) / sam (6) / dim (7)
S'il vous plait, dites-nous tous ce que vous avez mangé et bu hier. Commencez avec la première chose que vous avez pris après avoir vous réveiller.
Hre Lieu Aliments & breuvages Quantité Poids (g) m=maison a~ami(e) Repas Description
NDEKI Pain Beurre Café Lait Sucre
AIN:
REER:
5. Journée normale? Oui/non 6. Suppléments? Oui/non 7. Argile? Oui/ non 8. Cigarettes? Pourquoi? Oui/non
Si non, pourquoi? Lesquels? Quantité/jour: #/jour: __
Commentaires/recettes a développer:
A-12

Appendix 5
McGill University Ethics Certificate