Diagnostic performance of PI-RADS version 2.1 compared to ...
10
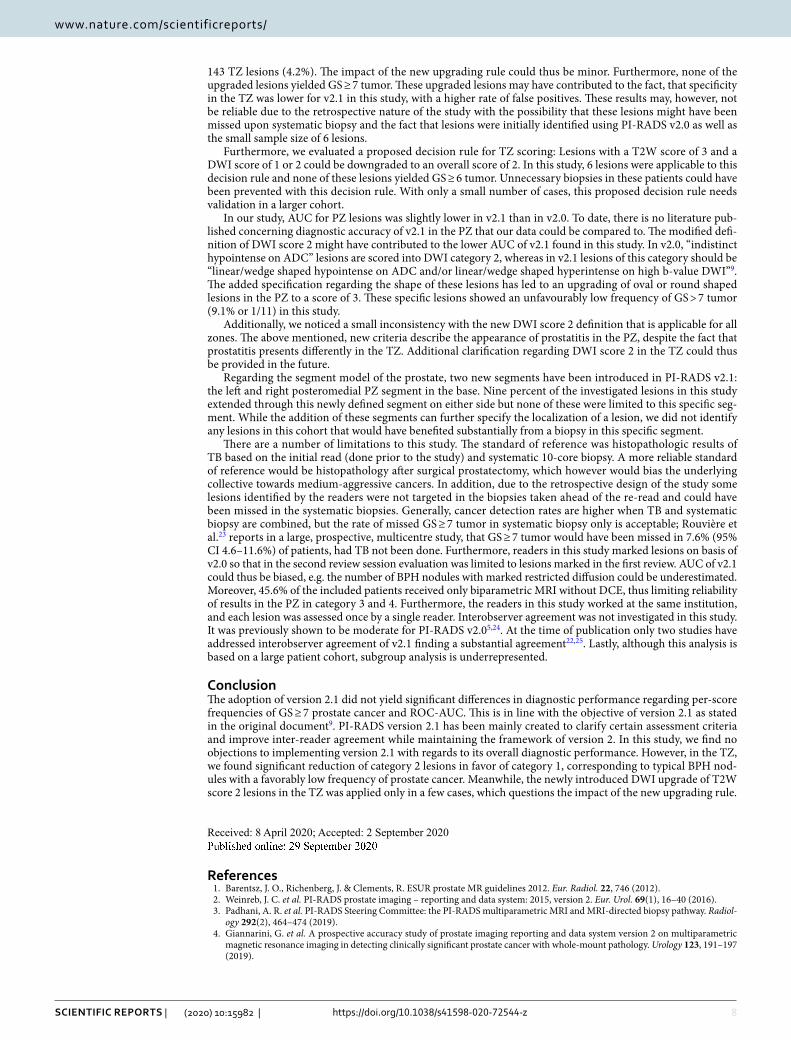
1 Vol.:(0123456789) SCIENTIFIC REPORTS | (2020) 10:15982 | https://doi.org/10.1038/s41598-020-72544-z www.nature.com/scientificreports Diagnostic performance of PI‑RADS version 2.1 compared to version 2.0 for detection of peripheral and transition zone prostate cancer Madhuri Monique Rudolph 1* , Alexander Daniel Jacques Baur 1 , Hannes Cash 2 , Matthias Haas 1 , Samy Mahjoub 1,3 , Alexander Hartenstein 1 , Charlie Alexander Hamm 1 , Nick Lasse Beetz 1 , Frank Konietschke 4 , Bernd Hamm 1 , Patrick Asbach 1 & Tobias Penzkofer 1,5* The purpose of this study is to compare diagnostic performance of Prostate Imaging Reporting and Data System (PI‑RADS) version (v) 2.1 and 2.0 for detection of Gleason Score (GS) ≥ 7 prostate cancer on MRI. Three experienced radiologists provided PI‑RADS v2.0 scores and at least 12 months later v2.1 scores on lesions in 333 prostate MRI examinations acquired between 2012 and 2015. Diagnostic performance was assessed retrospectively by using MRI/transrectal ultrasound fusion biopsy and 10‑core systematic biopsy as the reference. From a total of 359 lesions, GS ≥ 7 tumor was present in 135 lesions (37.60%). Area under the ROC curve (AUC) revealed slightly lower values for peripheral zone (PZ) and transition zone (TZ) scoring in v2.1, but these differences did not reach statistical significance. A significant number of score 2 lesions in the TZ were downgraded to score 1 in v2.1 showing 0% GS ≥ 7 tumor (0/11). The newly introduced diffusion‑weighted imaging (DWI) upgrading rule in v2.1 was applied in 6 lesions from a total of 143 TZ lesions (4.2%). In summary, PI‑RADS v2.1 showed no statistically significant differences in overall diagnostic performance of TZ and PZ scoring compared to v2.0. Downgraded BPH nodules showed favorable cancer frequencies. The new DWI upgrading rule for TZ lesions was applied in only few cases. e prostate imaging and reporting data system (PI-RADS) was created to standardize prostate MRI reporting with the goals of improving prostate cancer detection in MRI and achieving a more structured and comparable reporting quality 1,2 . e standard is based on the consensus of a group of experts incorporating scientific evi- dence and their experience in prostate MRI. In 2012 the first version of PI-RADS was published 1 , and in late 2014 PI-RADS v2.0 was released 2 . PI-RADS has been rapidly accepted among the radiological and urological community and is being incorporated into clinical care pathways 3 , as many studies have shown good diagnostic accuracy of the reporting system 4–8 . In March 2019, modifications to PI-RADS version 2, termed PI-RADS v2.1, were published with carefully selected improvements and the assertion that further research was required to corroborate the incremental value 9 . PI-RADS v2.1 includes modifications to technical specifications as well as revisions in the scoring of prostate OPEN 1 Department of Radiology, Charité – Universitätsmedizin Berlin, Freie Universität Berlin, Humboldt-Universität zu Berlin and Berlin Institute of Health, Augustenburger Platz 1, 13353 Berlin, Germany. 2 Department of Urology, Charité – Universitätsmedizin Berlin, Freie Universität Berlin, Humboldt-Universität zu Berlin and Berlin Institute of Health, Charitéplatz 1, 13353 Berlin, Germany. 3 Department of Urology, Cologne University Hospital, 50937 Cologne, Germany. 4 Institute of Biometry and Clinical Epidemiology, Charité – Universitätsmedizin Berlin, Freie Universität Berlin, Humboldt-Universität zu Berlin and Berlin Institute of Health, 10117 Berlin, Germany. 5 Berlin Institute of Health (BIH), Anna-Louisa-Karsch-Str. 2, 10178 Berlin, Germany. * email: [email protected]; [email protected]
-
Upload
khangminh22 -
Category
Documents
-
view
2 -
download
0
Transcript of Diagnostic performance of PI-RADS version 2.1 compared to ...

1
Vol.:(0123456789)
Scientific RepoRtS | (2020) 10:15982 | https://doi.org/10.1038/s41598-020-72544-z
www.nature.com/scientificreports
Diagnostic performance of PI‑RADS version 2.1 compared to version 2.0 for detection of peripheral and transition zone prostate cancerMadhuri Monique Rudolph1*, Alexander Daniel Jacques Baur1, Hannes cash2, Matthias Haas1, Samy Mahjoub1,3, Alexander Hartenstein1, Charlie Alexander Hamm1, Nick Lasse Beetz1, frank Konietschke4, Bernd Hamm1, Patrick Asbach1 & Tobias Penzkofer1,5*
The purpose of this study is to compare diagnostic performance of Prostate Imaging Reporting and Data System (PI‑RADS) version (v) 2.1 and 2.0 for detection of Gleason Score (GS) ≥ 7 prostate cancer on MRI. Three experienced radiologists provided PI‑RADS v2.0 scores and at least 12 months later v2.1 scores on lesions in 333 prostate MRI examinations acquired between 2012 and 2015. Diagnostic performance was assessed retrospectively by using MRI/transrectal ultrasound fusion biopsy and 10‑core systematic biopsy as the reference. From a total of 359 lesions, GS ≥ 7 tumor was present in 135 lesions (37.60%). Area under the ROC curve (AUC) revealed slightly lower values for peripheral zone (PZ) and transition zone (TZ) scoring in v2.1, but these differences did not reach statistical significance. A significant number of score 2 lesions in the TZ were downgraded to score 1 in v2.1 showing 0% GS ≥ 7 tumor (0/11). The newly introduced diffusion‑weighted imaging (DWI) upgrading rule in v2.1 was applied in 6 lesions from a total of 143 TZ lesions (4.2%). In summary, PI‑RADS v2.1 showed no statistically significant differences in overall diagnostic performance of TZ and PZ scoring compared to v2.0. Downgraded BPH nodules showed favorable cancer frequencies. The new DWI upgrading rule for TZ lesions was applied in only few cases.
The prostate imaging and reporting data system (PI-RADS) was created to standardize prostate MRI reporting with the goals of improving prostate cancer detection in MRI and achieving a more structured and comparable reporting quality1,2. The standard is based on the consensus of a group of experts incorporating scientific evi-dence and their experience in prostate MRI. In 2012 the first version of PI-RADS was published1, and in late 2014 PI-RADS v2.0 was released2. PI-RADS has been rapidly accepted among the radiological and urological community and is being incorporated into clinical care pathways3, as many studies have shown good diagnostic accuracy of the reporting system4–8.
In March 2019, modifications to PI-RADS version 2, termed PI-RADS v2.1, were published with carefully selected improvements and the assertion that further research was required to corroborate the incremental value9. PI-RADS v2.1 includes modifications to technical specifications as well as revisions in the scoring of prostate
open
1Department of Radiology, Charité – Universitätsmedizin Berlin, Freie Universität Berlin, Humboldt-Universität zu Berlin and Berlin Institute of Health, Augustenburger Platz 1, 13353 Berlin, Germany. 2Department of Urology, Charité – Universitätsmedizin Berlin, Freie Universität Berlin, Humboldt-Universität zu Berlin and Berlin Institute of Health, Charitéplatz 1, 13353 Berlin, Germany. 3Department of Urology, Cologne University Hospital, 50937 Cologne, Germany. 4Institute of Biometry and Clinical Epidemiology, Charité – Universitätsmedizin Berlin, Freie Universität Berlin, Humboldt-Universität zu Berlin and Berlin Institute of Health, 10117 Berlin, Germany. 5Berlin Institute of Health (BIH), Anna-Louisa-Karsch-Str. 2, 10178 Berlin, Germany. *email: [email protected]; [email protected]
2
Vol:.(1234567890)
Scientific RepoRtS | (2020) 10:15982 | https://doi.org/10.1038/s41598-020-72544-z
www.nature.com/scientificreports/
lesions. The scoring of transition zone (TZ) lesions has changed with regards to scores 1–3: typical benign pros-tatic hyperplasia (BPH) nodules are now scored as T2 weighted (T2W) score 1 as opposed to previously score 2. Atypical nodules, that are mostly encapsulated or homogenous without encapsulation, are now scored as T2W score 2 as opposed to previously score 3. Furthermore, a TZ lesion with a T2W score of 2 can be upgraded to an overall score of 3 when a DWI score of 4 or 5 is assigned. Another important change concerns DWI scores 2 and 3 for all zones: a linear or wedge-shaped ADC-hypointense or DWI-hyperintense lesion should be scored as score 2 now, whereas formerly indistinct ADC-hypointense lesions were scored into this category. The criteria for DWI score of 3 have been slightly modified: in PI-RADS v2.1 focal ADC-hypointense and/or focal DWI hyperintense lesions are scored a 3. Signal intensities can be marked in one of the sequences but should not be marked in both sequences. The definition of “marked” has been clarified as “a more pronounced signal change than any other focus in the same zone”9. With these updates in the scoring system, changes in the diagnostic accuracy of the scoring system are possible.
The purpose of this study was to directly compare diagnostic performance of PI-RADS v2.0 and v2.1 for detection of GS ≥ 7 tumor using targeted MRI/transrectal ultrasound fusion biopsy (TB) and systematic 10-core biopsy as a reference standard.
MethodsPatient cohort. This retrospective, single-center study was approved by the institutional review board (Ethikkommission der Charité – Universitätsmedizin Berlin) and patient consent was waived by the latter. All methods were carried out in accordance with relevant guidelines and regulations. All patients who received prostate MRI and subsequent MRI/TRUS fusion prostate biopsy in combination with 10-core systematic biopsy at our institution between January 2012 and July 2015 were considered eligible for this study (n = 454). Exclusion criteria were incomplete or non-standard MRI. Subgroups of the same collective have been included in earlier studies with endpoints independent from this study10–16. Patients were assigned randomly to initially four read-ers, 112 to 114 lesions by each radiologist. One reader was not available for the re-read after 12 months. The remaining 342 patients were re-read, 9 patients were then excluded because of unclear documentation of the targeted lesion’s location in TB (n = 7) or because no lesion was identified by the reader (n = 2), leaving a final study cohort of 333 patients. Figure 1 contains a STARD 2015-compliant patient flow diagram.
MR imaging. MRI was acquired according to relevant ESUR guidelines. All imaging was performed on one of two identical 3T MRI scanners (Skyra, Siemens Healthineers, Erlangen, Germany). All patients received at least biparametric MRI including T2W and DW images. In 186 patients (54.4%) DCE was performed addi-tionally. Typical parameters were: Axial and coronal T2W imaging (3.0 × 0.47 × 0.47 mm, 18 cm FoV), axial diffusion-weighted imaging (3.0 × 1.4 × 1.4 mm, 17 cm FoV, with b-values of 0, 50, 500, 800/1000 or calculated b = 1400 s/mm2). Axial T1-weighted imaging (3.0 × 0.6 × 0.6 mm, 32 cm FoV) of the whole pelvis and axial dynamic contrast enhanced imaging (3.0 × 1.4 × 1.4 mm, 18.6 cm FoV, at a temporal resolution of 5 s, 3 ml/s injection flow, Gd-DO3A-butrol, Gadovist, Bayer Healthcare, Leverkusen, Germany).
Imaging review. 342 MRI datasets were divided into equally sized subgroups and assigned to one of three board certified radiologists with extensive experience in prostate MRI (P.A., A.B, M.H., all with > 5 years of expe-rience in prostate MRI). Reviewing was performed in a blinded and randomized setting by using a standardized, in-house built reviewing software. Readers were blinded to histopathological results and all other patient-related data. In the first round, readers were instructed to mark dominant prostate lesions, to assign DWI-, T2W- and DCE-scores according to PI-RADS v2.0 guidelines, and to tag the localization of the lesion according to the seg-mentation model of PI-RADS v2.0. For MRI datasets without DCE images lesions were scored according to the rules for assessment without adequate DCE as specified in the PI-RADS v2.0 guidelines. At least 12 months later, the previously marked MRI datasets were presented to the same readers. Readers assessed the same patients as in the previous session. They were blinded to their previous assessment and were instructed to assign PI-RADS v2.1 scores to every lesion they had marked before as well as identify the matching v2.1 segments. This led to a 1:1 comparison of PI-RADS v2.0 and v2.1 for the same reader on a per lesion basis. The overall score per lesion was assigned in accordance with the respective algorithm for PI-RADS v2.0 or v2.1, following the dominant sequence and upgrading rules. Furthermore, lesions were attributed to either the peripheral zone (PZ) or the transition zone (TZ). Lesions that extended through PZ as well as TZ and lesions that were located in the ante-rior stroma (AS) or central zone (CZ) were assigned to either the PZ or the TZ group depending on the most likely zone of origin.
Reference standard. All patients had undergone targeted MRI/TRUS fusion biopsy (TB) in combination with a 10-core systematic biopsy in the same session. Histopathological findings of cancerous lesions were clas-sified according to the Gleason grading system. A GS of 3 + 4 or higher on TB or in a matching segment on sys-tematic biopsy was considered positive for clinically significant prostate cancer (csPCa). If no cancerous tissue was found upon TB or systematic biopsy in the segment of the suspicious MR lesion, the respective lesion was considered negative for PCa. Histopathological findings that indicated non-cancerous changes were: no tumor cells, acute prostatitis, chronic prostatitis, granulomatous prostatitis, prostatic intraepithelial neoplasia or benign prostatic hyperplasia, each without the additional mentioning of a neoplastic disease.
Statistical analysis. Data was analyzed on a per lesion basis and was modeled in terms of a factorial diag-nostic trial involving the factors “scoring system” (PI-RADS v2.0 versus PI-RADS v2.1) and “reader”. The area under the ROC curve (AUC) of each reader and scoring system combination assessed the diagnostic accuracy.

3
Vol.:(0123456789)
Scientific RepoRtS | (2020) 10:15982 | https://doi.org/10.1038/s41598-020-72544-z
www.nature.com/scientificreports/
Since data are measured on an ordinal scale, we applied the nonparametric ANOVA-type statistic17 to test differ-ences between the AUC of the two scoring systems and the three readers as well as interactions between readers and scoring systems18. Proportions of cancerous lesions per score were compared using the two-proportions Z-Test. Sensitivity, specificity, positive predictive value (PPV) and negative predictive value were calculated after dichotomizing the PI-RADS assessment categories using a predefined cut-off value: a PI-RADS category of ≥ 3 was defined as positive. Sensitivity and specificity of the two versions were compared using the McNemar’s test. PPV and NPV were compared using the test by Lange and Brunner19.
Results were declared to be significant if p < 5%. Statistical analysis was performed by F.K. and T.P. using R version 1.1.419 (www.r-proje ct.org) and SAS version 9.4.
ResultsPatient and lesion characteristics. The final study cohort consisted of 333 patients with a mean age of 66.8 years and a mean PSA level of 12.8 ng/ml. Patient characteristics are summarized in Table 1. Readers marked 359 lesions in the 333 MRI datasets. GS ≥ 6 tumor was detected in 193 (53.8%) lesions, including GS ≥ 7 tumor in 135 (37.6%) lesions. In the PZ, 216 (60.2%) lesions were marked; prevalence of GS ≥ 7 tumor in PZ lesions was 87 (40.3%). In the TZ, 143 lesions (39.8%) were marked; prevalence of GS ≥ 7 tumor in TZ lesions was 48 (33.6%).
Head to head comparison and statistical interactions. Diagnostic performance of the scoring sys-tems was assessed by ROC curves and AUC. ROC-Curves for the overall score of PZ and TZ lesions are given in Fig. 2. ROC-Curves and AUC values separated by readers are given in the supplemental material (supplemental
Subject IdentificationAll consecutive patients with in-house prostate MRI and in-house MRI/US fusion-guided
targeted biopsy and systematic 10-core biopsy from 1/2012 - 7/2015 (n=454)
342 MRI data were read by three experienced radiologists
Final study cohort:359 lesions in 333 patients
PZ lesions(n=216)
TZ lesions
(n=143)
benign or GS6(n=129)
GS ≥7(n=87)
benign or GS6(n=95)
GS ≥7(n=48)
Reference Standard: prostate biopsy including MRI/TRUS fusion-targeted and systematic10-core biopsy
112 patients excluded because onereader was not available for the re-
read
Exclusions:
No lesions identified in 2 patients
7 patients with uncleardocumentation of biopsy location
Figure 1. Study workflow with patient population. PZ peripheral zone, TZ transition zone, TRUS transrectal ultrasound, GS Gleason Score.

4
Vol:.(1234567890)
Scientific RepoRtS | (2020) 10:15982 | https://doi.org/10.1038/s41598-020-72544-z
www.nature.com/scientificreports/
Table 1 and supplemental Figure 1). Evaluation with and without DCE did not yield significant differences in AUC for both PI-RADS v2.0 and v2.1 (supplemental Table 2 and supplemental Figure 2).
For the PZ, ROC analysis revealed a slightly higher AUC for v2.0 (AUC 0.767 in v2.0 vs. AUC 0.738 in v2.1; p > 0.05), but the difference did not reach statistical significance. In TZ lesions, the AUC was also slightly higher for PI-RADS v2.0 (AUC 0.807 in v2.0 vs. AUC 0.803 in v2.1; p > 0.05), again the difference did not reach statistical significance. Furthermore, no significant difference between performances of the three readers and no interactions between readers and scoring systems could be detected using the nonparametric ANOVA-type statistic (p > 0.05)17.
Frequency of assigned scores are compared in Table 2. In PI-RADS v2.1, significantly more TZ lesions were assigned an overall score of 1 (4.2% in v2.0 vs. 11.2% in v2.1, p = 0.046) while significantly less TZ lesions were assigned an overall score of 2 (32.9% in v2.0 vs. 18.9% in v2.1, p = 0.010). In both zones, more lesions were assigned an overall score of 3 in v2.1, but the difference was not statistically significant. The frequency of GS ≥ 7 tumor per score did not differ significantly between the two versions (Table 2, Fig. 3). Frequency of GS ≥ 7 tumor for scores 4 and 5 were high in both versions, ranging from 40 to 57.1% (PI-RADS 4) and 59.3% to 72.1% (PI-RADS 5), respectively. For scores 1 to 3 frequency of GS ≥ 7 tumor ranged from 0 to 18.8% in both versions.
Table 1. Patient characteristics. Values are given as mean ± standard deviation [range] for continuous variables and absolute frequency (relative frequency) for biopsy results. PSA prostate-specific antigen, PIN prostatic intraepithelial neoplasia.
Parameter Value ± standard deviance [min–max]
Number of patients 333
Age (years) 66.8 ± 7.4 [47–85]
PSA (ng/ml) 12.8 ± 11.7 [1.47–112]
Prostate volume (ml) 62.8 ± 32.1 [6.10–203.66]
Biopsy result (highest grade)
No cancer nor inflammation 56 (16.8%)
Inflammation (chronic or acute) 51 (15.3%)
PIN 10 (3.0%)
3 + 3 64 (19.2%)
3 + 4 44 (13.2%)
4 + 3 31 (9.3%)
4 + 4 57 (17.1%)
4 + 5 13 (3.9%)
5 + 4 4 (1.2%)
5 + 5 3 (0.9%)
Figure 2. ROC for Gleason Score ≥ 7 tumor detection in PI-RADS v2.0 and v2.1 regarding overall PI-RADS scores per lesion. Differences in area under the ROC curves (AUC) were not significant. v version.

5
Vol.:(0123456789)
Scientific RepoRtS | (2020) 10:15982 | https://doi.org/10.1038/s41598-020-72544-z
www.nature.com/scientificreports/
Table 2. Frequencies of assigned scores and frequencies of Gleason Score ≥ 7 tumor per overall PI-RADS score in peripheral and transition zone lesions. Significantly more TZ lesions were assigned to category 1 in v2.1 while significantly less TZ lesions were assigned to category 2. Differences in GS ≥ 7 tumor frequencies were not significant. Note: Data in parentheses are absolute values and 95% confidence interval. Statistical differences were analyzed with pairwise comparisons using the two-proportions Z-Test. *Results were declared to be significant if p < 5%.
Zone Overall Score
Frequency of assigned score Frequency of GS ≥ 7 tumor
PI-RADS v2.0 PI-RADS v2.1 p value PI-RADS v2.0 PI-RADS v2.1 p value
PZ
1 3.2% (7/216) 6.0% (13/216) 0.25 14.3% (1/7) 15.4% (2/13) 1.00
2 17.1% (37/216) 10.6% (23/216) 0.071 8.1% (3/37) 13.0% (3/23) 0.86
3 10.6% (23/216) 14.4% (31/216) 0.31 13.0% (3/23) 10.0% (3/30) 1.00
4 40.7% (88/216) 39.8% (86/216) 0.92 42.4% (36/85) 42.9% (36/84) 1.00
5 28.2% (61/216) 29.2% (63/216) 0.92 72.1% (44/61) 68.3% (43/63) 0.78
TZ
1 4.2% (6/143) 11.2% (16/143) 0.046* 0.0% (0/6) 6.3% (1/16) 1.00
2 32.9% (47/143) 18.9% (27/143) 0.010* 4.3% (2/47) 7.4% (2/27) 0.97
3 11.9% (17/143) 17.5% (25/143) 0.24 18.8% (3/16) 8.3% (2/24) 0.64
4 9.8% (14/143) 10.5% (15/143) 1.00 57.1% (8/14) 40.0% (6/15) 0.58
5 41.3% (59/143) 42.0% (60/143) 1.00 59.3% (35/59) 61.7% (37/60) 0.94
1/7 3/37 3/23 37/88 44/612/13 3/23 4/31 36/86 43/630.0%
20.0%
40.0%
60.0%
80.0%
100.0%
1 2 3 4 5
Freq
uenc
y
PI-RADS Score
Peripheral Zone Significant Cancer Frequency
PI-RADS 2.0PI-RADS 2.1
0/6 2/47 3/17 8/14 35/591/16 2/27 2/25 6/15 37/600.0%
20.0%
40.0%
60.0%
80.0%
100.0%
1 2 3 4 5
Freq
uenc
y
PI-RADS Score
Transition Zone Significant Cancer Frequency
PI-RADS 2.0PI-RADS 2.1
Figure 3. Frequency of significant cancer defined as Gleason Score (GS) ≥ 7 tumor separated by zone (PZ left, TZ right), compared by version (blue: PI-RADS v2.0, orange: PI-RADS v2.1) and score (x-axis). Differences in GS ≥ 7 tumor frequencies were not significant.
Table 3. Diagnostic sensitivity, specificity, positive predictive value (PPV) and negative predictive value (NPV) for detection of Gleason Score ≥ 7 tumor were calculated for PI-RADS version 2.0 and 2.1. PI-RADS assessment categories were dichotomized using a predefined cut-off value: a PI-RADS category of ≥ 3 was defined as positive. Specificity in the TZ was significantly lower for PI-RADS version 2.1. All other diagnostic values did not differ significantly. *Results were declared to be significant if p < 5%.
PZ TZ
PI-RADS v2.0 (%) PI-RADS v2.1 (%) p value PI-RADS v2.0 (%) PI-RADS v2.1 (%) p value
Sensitivity 95.4 94.3 1.00 95.8 93.8 1.00
Specificity 31.2 24.2 0.10 53.7 42.1 0.03*
PPV 48.8 46.1 0.61 51.1 45.0 0.40
NPV 90.9 86.1 0.51 96.2 93.0 0.50

6
Vol:.(1234567890)
Scientific RepoRtS | (2020) 10:15982 | https://doi.org/10.1038/s41598-020-72544-z
www.nature.com/scientificreports/
Specificity in TZ lesions was significantly lower in v2.1 (Table 3). Specificity for the PZ as well as sensitivity, PPV and NPV for both zones did not differ significantly in both versions.
Per‑lesion analysis. The change of scoring on a per lesion basis between the two PI-RADS versions is visualized using alluvial plots in Fig. 4. The alluvial plot for PZ lesions illustrates that a substantial number of formerly category 2 lesions in the PZ were upgraded to category 3 in PI-RADS v2.1 (n = 11). Among these only one GS ≥ 7 tumor was confirmed (9.1%). Figure 5a illustrates an example. In addition, as depicted in the alluvial plot (Fig. 4), a noticeable amount of TZ lesions scored as category 2 in v2.0 were downgraded into category 1 in v2.1. Specifically, this applied to 11 out of 84 lesions, all of which showed no tumor upon biopsy (see Fig. 5b for an example). Furthermore, 12 formerly category 2 lesions in the TZ were upgraded to category 3 in v2.1 (Fig. 4). The newly introduced DWI upgrading rule in v2.1 has contributed to this change; it was applied to 6 lesions out of 33 TZ lesions with a T2W score of 2, resulting in an upgrade to an overall score of 3 due to a DWI score of 4 or 5 (see Fig. 5c,d for two examples). None of these 6 lesions corresponded to GS ≥ 7 tumors upon systematic biopsy (0%).
Proposed DWI downgrading decision rule. A proposed decision rule recommending a downgrade of TZ lesions with a T2W score of 3 and a DWI score of ≤ 2 to an overall score of 2 was evaluated: In this study, 6 lesions out of 23 lesions with a T2W score of 3 were applicable to this decision rule and none of these lesions yielded GS ≥ 6 tumor upon biopsy.
Segment model. The newly introduced segments (left and right posteromedial PZ segment in the base) in v2.1 were marked in 31 of the lesions (9.06%). In all of these lesions neighboring segments were additionally marked.
Figure 4. Alluvial plots depicting the change from PI-RADS v2.0 assessments to v2.1 assessment for peripheral (left) and transition zone (right) lesions. Lesion biopsy status is encoded as follows: red: clinically significant (Gleason ≥ 3 + 4), orange non-significant (Gleason 3 + 3) and grey no cancer. Cancer frequencies in category 4 and 5 in PZ and in category 5 in TZ were high in both versions. Variation between the two scoring systems is seen especially in lower scores 1–3. In the PZ, 11 formerly category 2 lesions were upgraded to category 3 in PI-RADS v2.1. Among these only one GS ≥ 7 tumor was confirmed. In the TZ, 11 TZ lesions were downgraded from category 2 into category 1 in v2.1, all of which showed no tumor upon biopsy. 12 formerly category 2 lesions in the TZ were upgraded to category 3 in v2.1, one of them was a GS ≥ 7 cancer. V version, PZ peripheral zone, TZ transition zone, GS Gleason Score.

7
Vol.:(0123456789)
Scientific RepoRtS | (2020) 10:15982 | https://doi.org/10.1038/s41598-020-72544-z
www.nature.com/scientificreports/
DiscussionThis study aimed at comparing the diagnostic performance of the recently released PI-RADS v2.1 to its predeces-sor version 2 using TB and systematic biopsy results as a reference. Our data demonstrate similar AUC and per-score frequencies of GS ≥ 7 tumor in both versions with no statistically significant differences. The distribution of GS ≥ 7 tumor per score in this cohort are comparable to those reported for PI-RADS v2.0 in other studies11,20,21.
For the TZ we found very similar AUC for v2.0 and v2.1 with no significant differences. In a recently published study investigating TZ lesions in 58 patients read retrospectively by two radiologists, AUC for v2.1 was slightly higher without statistical significance (0.786 vs. 0.847 for reader 1, and 0.808 vs. 0.858 for reader 2)22. A reason for this different outcome may be the different study design in which only TZ lesions that were suspicious based on v2.0 were evaluated. With fundamental changes in the definitions of T2W-based scores 1 and 2 for TZ lesions in v2.1, some stirring up in lesion distributions in categories 1 to 3 could be expected. In v2.0 typical BPH-nodules that show a round shape and complete encapsulation were assigned to category 2, while in v2.1 they are scored into category 1. Likewise, in this study a significant number of TZ lesions scored as category 2 in v2.0 were downgraded into category 1 in v2.1, all of which showed no tumor upon biopsy (0/11). This change constitutes an important improvement in the new version; typical BPH nodules are highly unlikely to be GS ≥ 7 cancer and accordingly are now classified as category 1 lesions for which biopsy is typically not advised. Although this change may not yield a change of outcome for the majority of patients, since neither PI-RADS 1 nor 2 lesions are usu-ally biopsied in practice, it improves the conclusiveness of the radiological report and can prevent unnecessary biopsies in patients with high clinical risk factors and without suspicious MR lesions.
Another significant change in PI-RADS v2.1 is the newly introduced DWI upgrade of T2W score 2 to an overall score of 3 in TZ lesions. In this study, this new upgrade was applied to only 6 lesions out of a total of
Figure 5. (a) Oval-shaped lesion in the left PZ with DWI isointensity and mild indistinct ADC hypointensity. It was scored a 2 according to PI-RADS v2.0 and a 3 according to PI-RADS v2.1. TB of this lesion revealed no cancer. Patient age: 68 years. (b) Fully encapsulated and heterogeneous nodule in the right TZ with a diameter of 1.5 cm. It shows heterogeneous signal on high b-value DWI and on ADC images. It was scored into category 2 according to PI-RADS v2.0 and into category 1 according to PI-RADS v2.1 and showed no cancer upon systematic biopsy. Patient age: 56 years. (c) Incompletely encapsulated nodule in the left TZ with marked DWI hyperintensity and marked ADC hypointensity. Patient age: 59 years. (d) Lesion in the right apical TZ with the same characteristics as in c. Patient age: 52 years. The new DWI upgrading rule was applied to lesions in c and d. In both cases systematic biopsy showed no cancer.
8
Vol:.(1234567890)
Scientific RepoRtS | (2020) 10:15982 | https://doi.org/10.1038/s41598-020-72544-z
www.nature.com/scientificreports/
143 TZ lesions (4.2%). The impact of the new upgrading rule could thus be minor. Furthermore, none of the upgraded lesions yielded GS ≥ 7 tumor. These upgraded lesions may have contributed to the fact, that specificity in the TZ was lower for v2.1 in this study, with a higher rate of false positives. These results may, however, not be reliable due to the retrospective nature of the study with the possibility that these lesions might have been missed upon systematic biopsy and the fact that lesions were initially identified using PI-RADS v2.0 as well as the small sample size of 6 lesions.
Furthermore, we evaluated a proposed decision rule for TZ scoring: Lesions with a T2W score of 3 and a DWI score of 1 or 2 could be downgraded to an overall score of 2. In this study, 6 lesions were applicable to this decision rule and none of these lesions yielded GS ≥ 6 tumor. Unnecessary biopsies in these patients could have been prevented with this decision rule. With only a small number of cases, this proposed decision rule needs validation in a larger cohort.
In our study, AUC for PZ lesions was slightly lower in v2.1 than in v2.0. To date, there is no literature pub-lished concerning diagnostic accuracy of v2.1 in the PZ that our data could be compared to. The modified defi-nition of DWI score 2 might have contributed to the lower AUC of v2.1 found in this study. In v2.0, “indistinct hypointense on ADC” lesions are scored into DWI category 2, whereas in v2.1 lesions of this category should be “linear/wedge shaped hypointense on ADC and/or linear/wedge shaped hyperintense on high b-value DWI”9. The added specification regarding the shape of these lesions has led to an upgrading of oval or round shaped lesions in the PZ to a score of 3. These specific lesions showed an unfavourably low frequency of GS > 7 tumor (9.1% or 1/11) in this study.
Additionally, we noticed a small inconsistency with the new DWI score 2 definition that is applicable for all zones. The above mentioned, new criteria describe the appearance of prostatitis in the PZ, despite the fact that prostatitis presents differently in the TZ. Additional clarification regarding DWI score 2 in the TZ could thus be provided in the future.
Regarding the segment model of the prostate, two new segments have been introduced in PI-RADS v2.1: the left and right posteromedial PZ segment in the base. Nine percent of the investigated lesions in this study extended through this newly defined segment on either side but none of these were limited to this specific seg-ment. While the addition of these segments can further specify the localization of a lesion, we did not identify any lesions in this cohort that would have benefited substantially from a biopsy in this specific segment.
There are a number of limitations to this study. The standard of reference was histopathologic results of TB based on the initial read (done prior to the study) and systematic 10-core biopsy. A more reliable standard of reference would be histopathology after surgical prostatectomy, which however would bias the underlying collective towards medium-aggressive cancers. In addition, due to the retrospective design of the study some lesions identified by the readers were not targeted in the biopsies taken ahead of the re-read and could have been missed in the systematic biopsies. Generally, cancer detection rates are higher when TB and systematic biopsy are combined, but the rate of missed GS ≥ 7 tumor in systematic biopsy only is acceptable; Rouvière et al.23 reports in a large, prospective, multicentre study, that GS ≥ 7 tumor would have been missed in 7.6% (95% CI 4.6–11.6%) of patients, had TB not been done. Furthermore, readers in this study marked lesions on basis of v2.0 so that in the second review session evaluation was limited to lesions marked in the first review. AUC of v2.1 could thus be biased, e.g. the number of BPH nodules with marked restricted diffusion could be underestimated. Moreover, 45.6% of the included patients received only biparametric MRI without DCE, thus limiting reliability of results in the PZ in category 3 and 4. Furthermore, the readers in this study worked at the same institution, and each lesion was assessed once by a single reader. Interobserver agreement was not investigated in this study. It was previously shown to be moderate for PI-RADS v2.05,24. At the time of publication only two studies have addressed interobserver agreement of v2.1 finding a substantial agreement22,25. Lastly, although this analysis is based on a large patient cohort, subgroup analysis is underrepresented.
ConclusionThe adoption of version 2.1 did not yield significant differences in diagnostic performance regarding per-score frequencies of GS ≥ 7 prostate cancer and ROC-AUC. This is in line with the objective of version 2.1 as stated in the original document9. PI-RADS version 2.1 has been mainly created to clarify certain assessment criteria and improve inter-reader agreement while maintaining the framework of version 2. In this study, we find no objections to implementing version 2.1 with regards to its overall diagnostic performance. However, in the TZ, we found significant reduction of category 2 lesions in favor of category 1, corresponding to typical BPH nod-ules with a favorably low frequency of prostate cancer. Meanwhile, the newly introduced DWI upgrade of T2W score 2 lesions in the TZ was applied only in a few cases, which questions the impact of the new upgrading rule.
Received: 8 April 2020; Accepted: 2 September 2020
References 1. Barentsz, J. O., Richenberg, J. & Clements, R. ESUR prostate MR guidelines 2012. Eur. Radiol. 22, 746 (2012). 2. Weinreb, J. C. et al. PI-RADS prostate imaging – reporting and data system: 2015, version 2. Eur. Urol. 69(1), 16–40 (2016). 3. Padhani, A. R. et al. PI-RADS Steering Committee: the PI-RADS multiparametric MRI and MRI-directed biopsy pathway. Radiol-
ogy 292(2), 464–474 (2019). 4. Giannarini, G. et al. A prospective accuracy study of prostate imaging reporting and data system version 2 on multiparametric
magnetic resonance imaging in detecting clinically significant prostate cancer with whole-mount pathology. Urology 123, 191–197 (2019).

9
Vol.:(0123456789)
Scientific RepoRtS | (2020) 10:15982 | https://doi.org/10.1038/s41598-020-72544-z
www.nature.com/scientificreports/
5. Muller, B. G. et al. Prostate cancer: interobserver agreement and accuracy with the revised prostate imaging reporting and data system at multiparametric MR imaging. Radiology 277(3), 741–750 (2015).
6. Greer, M. D. et al. Accuracy and agreement of PIRADSv2 for prostate cancer mpMRI: a multireader study. J. Magn. Reson. Imaging 45(2), 579–585 (2017).
7. Tewes, S. et al. Standardized reporting of prostate MRI: comparison of the prostate imaging reporting and data system (PI-RADS) version 1 and version 2. PLoS ONE 11(9), e0162879 (2016).
8. Becker, A. S. et al. Direct comparison of PI-RADS version 2 and version 1 regarding interreader agreement and diagnostic accuracy for the detection of clinically significant prostate cancer. Eur. J. Radiol. 94, 58–63 (2017).
9. Turkbey, B. et al. Prostate imaging reporting and data system version 2.1: 2019 update of prostate imaging reporting and data system version 2. Eur. Urol. 76(3), 340–351 (2019).
10. Cash, H. et al. Prostate cancer detection on transrectal ultrasonography-guided random biopsy despite negative real-time magnetic resonance imaging/ultrasonography fusion-guided targeted biopsy: reasons for targeted biopsy failure. BJU Int. 118(1), 35–43 (2016).
11. Cash, H. et al. The detection of significant prostate cancer is correlated with the Prostate Imaging Reporting and Data System (PI-RADS) in MRI/transrectal ultrasound fusion biopsy. World J Urol. 34(4), 525–532 (2016).
12. Günzel, K. et al. The addition of a sagittal image fusion improves the prostate cancer detection in a sensor-based MRI/ultrasound fusion guided targeted biopsy. BMC Urol. 17(1), 7 (2017).
13. Günzel, K. et al. Predictive parameters identifying men eligible for a sole MRI/ultrasound fusion-guided targeted biopsy without an additional systematic biopsy. Urol. Int. 98(1), 15–21 (2017).
14. Maxeiner, A. et al. Primary magnetic resonance imaging/ultrasonography fusion-guided biopsy of the prostate. BJU Int. 122(2), 211–218 (2018).
15. Maxeiner, A. et al. Added value of multiparametric ultrasonography in magnetic resonance imaging and ultrasonography fusion–guided biopsy of the prostate in patients with suspicion for prostate cancer. Urology 86(1), 108–114 (2015).
16. Rudolph, M.M. et al. Validation of the PI-RADS language: predictive values of PI-RADS lexicon descriptors for detection of prostate cancer. Eur. Radiol. 30(8), 4262–4271 (2020).
17. Kaufmann, J., Werner, C. & Brunner, E. Nonparametric methods for analysing the accuracy of diagnostic tests with multiple read-ers. Stat. Methods Med. Res. 14(2), 129–146 (2005).
18. Konietschke, F. & Brunner, E. Nonparametric analysis of clustered data in diagnostic trials: estimation problems in small sample sizes. Comput. Stat. Data Anal. 53(3), 730–741 (2009).
19. Lange, K. & Brunner, E. Analysis of predictive values based on individual risk factors in multi-modality trials. Diagnostics (Basel) 3(1), 192–209 (2013).
20. Rosenkrantz, A. B., Babb, J. S., Taneja, S. S. & Ream, J. M. Proposed Adjustments to PI-RADS version 2 decision rules: impact on prostate cancer detection. Radiology 283(1), 119–129 (2017).
21. Thai, J. N. et al. Validation of PI-RADS version 2 in transition zone lesions for the detection of prostate cancer. Radiology 288(2), 485–491 (2018).
22. Tamada, T. et al. Comparison of PI-RADS version 2 and PI-RADS version 2.1 for the detection of transition zone prostate cancer. Eur. J. Radiol. 121, 108704 (2019).
23. Rouvière, O. et al. Use of prostate systematic and targeted biopsy on the basis of multiparametric MRI in biopsy-naive patients (MRI-FIRST): a prospective, multicentre, paired diagnostic study. Lancet Oncol. 20(1), 100–109 (2019).
24. Rosenkrantz, A. B. et al. Interobserver reproducibility of the PI-RADS version 2 Lexicon: a multicenter study of six experienced prostate radiologists. Radiology 280(3), 793–804 (2016).
25. Brembilla, G. et al. Interreader variability in prostate MRI reporting using prostate imaging reporting and data system version 2.1. Eur. Radiol. 30, 3383–3392 (2020).
Author contributionsM.R. wrote the main manuscript text, prepared all tables and Figs. 1 and 5. Conceptualisation and supervision of the study was led by T.P. A.B., M.H. and P.A. read the prostate MRIs. F.K. and T.P. did the statistical evalua-tion. H.C. acquired and provided prostate biopsy results. T.P. prepared Figs. 2, 3, and 4. S.M., A.H., C.H., N.B. supported in conceptualisation of the study. B.H. supported in supervision and provided prostate MRIs. All authors reviewed the manuscript.
FundingOpen Access funding provided by Projekt DEAL. Dr. Penzkofer was supported by Berlin Institute of Health (Clinician Scientist Grant, Platform Grant) and reports research agreements (no personal payments, outside of submitted work) with AGO, Aprea AB, ARC AGY -GINECO, Astellas Pharma Global Inc. (APGD), Astra Zeneca, Clovis Oncology, Inc., Dohme Corp, Holaira, Incyte Corporation, Karyopharm, Lion Biotechnologies, Inc., MedImmune, Merck Sharp, Millennium Pharmaceuticals, Inc., Morphotec Inc., NovoCure Ltd., PharmaMar S.A. and PharmaMar USA, Inc., Roche, Siemens Healthineers, and TESARO Inc. Prof. Asbach reports grant support from Deutsche Forschungsgemeinschaft DFG (SFB 1340/1) and cooperations with Siemens Healthineers, Canon Medical Systems, European Society of Radiology (ESR), Deutsche Röntgengesellschaft (DRG), Norddeutsche Röntgengesellschaft, Chinese Society of Radiology (CCR), b.e.imaging, and European Journal of Radiology (Elsevier). Prof. Hamm reports agreements (grant money to the Department of Radiology, Charité Berlin) with the following companies or non-profit organizations: Abbott, AbbVie, Ablative Solutions, Accovion, Achaogen Inc., Actelion Pharmaceuticals, ADIR, Aesculap, AGO, AIF Arbeitsgemeinschaft industrieller Forschungsvereini-gungen, AIO: Arbeitsgemeinschaft Internistische Onkologie, Alexion Pharmaceuticals, Amgen, AO Foundation, Arena Pharmaceiticals, ARMO Biosciences, Inc., art photonics GmbH Berlin, ASR Advanced sleep research, Astellas, AstraZeneca, BARD, Bayer Healthcare, Bayer Schering Pharma, Bayer Vital, BBraun (Sponsoring eines Workshops), BerlinBrandenburger Centrum für Regenerative Therapien (BCRT), Berliner Krebsgesellschaft, Biotronik, Bioven, BMBF, Boehring Ingelheimer, Boston Biomedical Inc., BRACCO Group, Brainsgate, Bristol-Myers Squibb, Cascadian Therapeutics, Inc., Celgene, CELLACT Pharma, Celldex Therapeutics, CeloNova Bio-Sciences, Charité research organisation GmbH, Chiltern, CLOVIS ONCOLOGY, INC., Covance, CUBIST, Cure-Vac AG, Tübingen, Curis, Daiichi, DC Devices, Inc. USA, Delcath Systems, Dermira Inc., Deutsche Krebshilfe, Deutsche Rheuma Liga, DFG, DSM Nutritional Products AG, Dt. Stiftung für Herzforschung, Dynavax, Eisai Ltd., European Knowledge Centre, Mosquito Way, Hatfield, Eli Lilly and Company Ltd., EORTC, Epizyme, Inc., Essex Pharma, EU Programmes, Euroscreen S.A., Fibrex Medical Inc., Focused Ultrasound Surgery Foundation,

10
Vol:.(1234567890)
Scientific RepoRtS | (2020) 10:15982 | https://doi.org/10.1038/s41598-020-72544-z
www.nature.com/scientificreports/
Fraunhofer Gesellschaft, Galena Biopharma, Galmed Research and Development Ltd., Ganymed, GE, Genen-tech. Inc., GETNE (Grupo Español de Tumores Neuroendocrinos), Gilead Sciences, Inc., Glaxo Smith Kline, Glycotope GmbH, Berlin, Goethe Uni Frankfurt, Guerbet, Guidant Europe NV, Halozyme, Hewlett Packard GmbH, Holaira Inc., ICON (CRO), Idera Pharmaceuticals, Inc., Ignyta, Inc., Immunomedics Inc., Immuno-core, Incyte, INC Research, Innate Pharma, InSightec Ltd., Inspiremd, inVentiv Health Clinical UK Ltd., Inven-tivhealth, IOMEDICO, IONIS, IPSEN Pharma, IQVIA, ISA Therapeutics, Isis Pharmaceuticals Inc., ITM Solucin GmbH, Jansen, Kantar Health GmbH (CRO), Kartos Therapeutics, Inc., Karyopharm Therapeutics, Inc., Kendle/ MorphoSys AG, Kite Pharma, Kli Fo Berlin Mitte, La Roche, Land Berlin, Lilly GmbH, Lion Biotechnology, Lombard Medical, Loxo Oncology, Inc., LSK BioPartners; USA, Lundbeck GmbH, LUX Biosciences, LYSARC, MacroGenics, MagForce, MedImmune Inc., MedImmune Limited, Medpac, Medpace Germany GmbH (CRO), MedPass (CRO), Medronic, Merck, Merrimack Pharmaceuticals Inc., MeVis Medical Solutions AG, Millen-nium Pharmaceuticals Inc., Mologen, Monika Kutzner Stiftung, MSD Sharp, NeoVacs SA, Newlink Genentics Corporation, Nexus Oncology, NIH, Novartis, Novocure, Nuvisan, Ockham oncology, OHIRC Kanada, Orion Corporation Orion Pharma, Parexel CRO Service, Perceptive, Pfizer GmbH, PharmaCept GmbH, Pharma Mar, Pharmaceutical Research Associates GmbH (PRA), Pharmacyclics Inc., Philipps, PIQUR Therapeutics Ltd., Pluristem, PneumRX. Inc., Portola Pharmaceuticals, PPD (CRO), PRAint, Premier-research, Provectus Biop-harmaceuticals, Inc., psi-cro, Pulmonx International Sàrl, Quintiles Gmbh, Regeneron Pharmaceuticals, Inc., Respicardia, Roche, Samsung, Sanofi, sanofis-aventis S.A, Schumacher GmbH, Seattle Genetics, Servier (CRO), SGS Life Science Services (CRO), Shire Human Genetic Therapies, Siemens, Silena Therapeutics, Spectranetics GmbH, Spectrum Pharmaceuticals, St. Jude Medical, Stiftung Wolfgang Schulze, Symphogen, Taiho Oncol-ogy, Inc., Taiho Pharmaceutical Co., TauRx Therapeutics Ltd., Terumo Medical Corporation, Tesaro, tetec-ag, TEVA, Theorem, Theradex, Threshold Pharmaceuticals Inc., TNS Healthcare GMbH, Toshiba, UCB Pharma, Uni München, VDI / VDE, Vertex Pharmaceuticals Incorporated, winicker-norimed, Wyeth Pharma, Xcovery Holding Company, Zukunftsfond Berlin (TSB).
competing interests The authors declare no competing interests.
Additional informationSupplementary information is available for this paper at https ://doi.org/10.1038/s4159 8-020-72544 -z.
Correspondence and requests for materials should be addressed to M.M.R. or T.P.
Reprints and permissions information is available at www.nature.com/reprints.
Publisher’s note Springer Nature remains neutral with regard to jurisdictional claims in published maps and institutional affiliations.
Open Access This article is licensed under a Creative Commons Attribution 4.0 International License, which permits use, sharing, adaptation, distribution and reproduction in any medium or
format, as long as you give appropriate credit to the original author(s) and the source, provide a link to the Creative Commons licence, and indicate if changes were made. The images or other third party material in this article are included in the article’s Creative Commons licence, unless indicated otherwise in a credit line to the material. If material is not included in the article’s Creative Commons licence and your intended use is not permitted by statutory regulation or exceeds the permitted use, you will need to obtain permission directly from the copyright holder. To view a copy of this licence, visit http://creat iveco mmons .org/licen ses/by/4.0/.
© The Author(s) 2020