Diagnostic electrocardiography in epidemiological studies of Chagas' disease: multicenter evaluation...
14
Diagnostic electrocardiography in epidemiological studies of Chagas’ disease: Multicenter evaluation of a standardized method Julio O. Lázzari, 1 Mauricio Pereira, 2 Carlos M. F. Antunes, 3 Armenio Guimarães, 4 Álvaro Moncayo, 5 Rafael Chávez Domínguez, 6 Otto Hernández Pieretti, 7 Vanize Macedo, 8 Anis Rassi, 9 James Maguire, 10 and Alfredo Romero 11 An electrocardiographic recording method with an associated reading guide, designed for epi- demiological studies on Chagas’ disease, was tested to assess its diagnostic reproducibility. Six cardiologists from five countries each read 100 electrocardiographic (ECG) tracings, including 30 from chronic chagasic patients, then reread them after an interval of 6 months. The read- ings were blind, with the tracings numbered randomly for the first reading and renumbered randomly for the second reading. The physicians, all experienced in interpreting ECGs from chagasic patients, followed printed instructions for reading the tracings. Reproducibility of the readings was evaluated using the kappa (k) index for concordance. The results showed a high degree of interobserver concordance with respect to the diagnosis of normal vs. abnormal trac- ings (k = 0.66; SE 0.02). While the interpretations of some categories of ECG abnormalities were highly reproducible, others, especially those having a low prevalence, showed lower lev- els of concordance. Intraobserver concordance was uniformly higher than interobserver con- cordance. The findings of this study justify the use by specialists of the recording of readings method proposed for epidemiological studies on Chagas’ disease, but warrant caution in the in- terpretation of some categories of electrocardiographic alterations. ABSTRACT Electrocardiography is the standard method used in field studies to analyze the prevalence of heart lesions in chronic Chagas’ disease (1–5). It is non- invasive, easy to apply, and of high sensitivity. However, researchers use various criteria to interpret the electro- cardiograms (ECG), and this makes it difficult to compare the results of dif- ferent studies. In April 1988, specialists from Argentina, Bolivia, Brazil, Mex- ico, and Venezuela met in Buenos Aires to devise a standard method for read- ing ECG tracings, including recording and mounting directions, and opera- tive definitions. 12 The present study evaluated intra- and interobserver vari- ability in ECG interpretation with the new method. Rev Panam Salud Publica/Pan Am J Public Health 4(5), 1998 317 1 Hospital Pirovano, Cardiology Division, Buenos Aires, Argentina. Correspondence should be sent to this author at: Hospital Pirovano, Coronel Díaz 2277, 1425 Buenos Aires, Argentina. E-mail: [email protected] 2 University of Brasilia, Faculty of Health Sciences, Brasilia, Brazil. 3 Federal University of Minas Gerais, Institute of Bi- ological Sciences, Minas Gerais, Belo Horizonte, MG, Brazil. 4 Federal University of Bahia, Faculty of Medicine, Salvador, BA, Brazil. 5 World Health Organization, Trypanosomiases and Leishmaniases Control, TDR, Geneva, Switzer- land. Requests for reprints should be sent to this author at: World Health Organization, 1211 Ge- neva 27, Switzerland. 6 Ignacio Chaves National Institute of Cardiology, Mexico City, Mexico. 7 Hospital Vargas, Cardiology Section, Caracas, Venezuela. 8 University of Brasilia, Faculty of Health Sciences, Brasilia, Brazil. 9 Federal University of Goias, Faculty of Medicine, Goiania, GO, Brazil. 10 Brigham and Women’s Hospital, Boston, Massa- chusetts, U.S.A. 11 Heart Institute, Santa Cruz, Bolivia. 12 The meeting and the present study received finan- cial support from the United Nations Develop- ment Project/World Bank/World Health Organi- zation Special Program for Research and Training in Tropical Diseases (Project TDR-880342).
Transcript of Diagnostic electrocardiography in epidemiological studies of Chagas' disease: multicenter evaluation...
Diagnostic electrocardiography inepidemiological studies of Chagas’ disease:Multicenter evaluation of a standardized method
Julio O. Lázzari,1 Mauricio Pereira,2 Carlos M. F. Antunes,3
Armenio Guimarães,4 Álvaro Moncayo,5 Rafael ChávezDomínguez,6 Otto Hernández Pieretti,7 Vanize Macedo,8
Anis Rassi,9 James Maguire,10 and Alfredo Romero11
An electrocardiographic recording method with an associated reading guide, designed for epi-demiological studies on Chagas’ disease, was tested to assess its diagnostic reproducibility. Sixcardiologists from five countries each read 100 electrocardiographic (ECG) tracings, including30 from chronic chagasic patients, then reread them after an interval of 6 months. The read-ings were blind, with the tracings numbered randomly for the first reading and renumberedrandomly for the second reading. The physicians, all experienced in interpreting ECGs fromchagasic patients, followed printed instructions for reading the tracings. Reproducibility of thereadings was evaluated using the kappa (k) index for concordance. The results showed a highdegree of interobserver concordance with respect to the diagnosis of normal vs. abnormal trac-ings (k = 0.66; SE 0.02). While the interpretations of some categories of ECG abnormalitieswere highly reproducible, others, especially those having a low prevalence, showed lower lev-els of concordance. Intraobserver concordance was uniformly higher than interobserver con-cordance. The findings of this study justify the use by specialists of the recording of readingsmethod proposed for epidemiological studies on Chagas’ disease, but warrant caution in the in-terpretation of some categories of electrocardiographic alterations.
ABSTRACT
Electrocardiography is the standardmethod used in field studies to analyzethe prevalence of heart lesions inchronic Chagas’ disease (1–5). It is non-
invasive, easy to apply, and of highsensitivity. However, researchers usevarious criteria to interpret the electro-cardiograms (ECG), and this makes it
difficult to compare the results of dif-ferent studies. In April 1988, specialistsfrom Argentina, Bolivia, Brazil, Mex-ico, and Venezuela met in Buenos Airesto devise a standard method for read-ing ECG tracings, including recordingand mounting directions, and opera-tive definitions.12 The present studyevaluated intra- and interobserver vari-ability in ECG interpretation with thenew method.
Rev Panam Salud Publica/Pan Am J Public Health 4(5), 1998 317
1 Hospital Pirovano, Cardiology Division, BuenosAires, Argentina. Correspondence should be sentto this author at: Hospital Pirovano, Coronel Díaz2277, 1425 Buenos Aires, Argentina. E-mail:[email protected]
2 University of Brasilia, Faculty of Health Sciences,Brasilia, Brazil.
3 Federal University of Minas Gerais, Institute of Bi-ological Sciences, Minas Gerais, Belo Horizonte,MG, Brazil.
4 Federal University of Bahia, Faculty of Medicine,Salvador, BA, Brazil.
5 World Health Organization, Trypanosomiases andLeishmaniases Control, TDR, Geneva, Switzer-
land. Requests for reprints should be sent to thisauthor at: World Health Organization, 1211 Ge-neva 27, Switzerland.
6 Ignacio Chaves National Institute of Cardiology,Mexico City, Mexico.
7 Hospital Vargas, Cardiology Section, Caracas,Venezuela.
8 University of Brasilia, Faculty of Health Sciences,Brasilia, Brazil.
9 Federal University of Goias, Faculty of Medicine,Goiania, GO, Brazil.
10 Brigham and Women’s Hospital, Boston, Massa-chusetts, U.S.A.
11 Heart Institute, Santa Cruz, Bolivia.
12 The meeting and the present study received finan-cial support from the United Nations Develop-ment Project/World Bank/World Health Organi-zation Special Program for Research and Trainingin Tropical Diseases (Project TDR-880342).
MATERIALS AND METHODS
The standardized ECG method
The recommended procedures forrecording, mounting, labeling, andreading ECGs are described in Annex 1.
ECG collection and distribution
Three centers—in Argentina, Bra-zil, and Venezuela—provided 120ECG tracings recorded according tothe recommended methods. Of these,100 were selected: one-third fromchronic chagasic patients with elec-trocardiographic alterations, one-third from patients with nonchagasiccardiopathies, and one-third normal.The tracings were numbered from 1to 100 by means of a random numberstable. Copies of the tracings were sentto six readers from six different coun-tries.13 All were cardiologists with ex-pertise in the electrocardiographic di-agnosis of cardiopathies, includingchronic chagasic heart lesions. Thereaders also received information onthe gender and age of each patientand forms to record the ECG interpre-tation (Annex 2). A manual with com-plete procedural instructions was alsoprovided.
The readers recorded nine character-istics of each ECG tracing: normal vs.abnormal; rhythm; supraventriculararrhythmias; ventricular arrhythmias;atrioventricular conduction; intraven-tricular conduction; abnormalities ofthe initial portion of the QRS complex;primary alterations of ST-T waves; andmiscellaneous signs.
Study stages
In stage 1 of the study, the six read-ers read the 100 ECGs, which wererandomly numbered from 1 to 100, toprovide data for evaluating interob-
server variability. The core laboratorythen collected the ECGs and all othermaterials from the readers. In stage 2,six months later, the readers receivedthe same 100 ECGs, now randomlyrenumbered 101 to 200, and rereadthem using the same interpretive pro-cedures. Comparison of these resultswith those of stage 1 provided data onintraobserver variability.
Statistics
The readers’ ECG interpretationswere analyzed using PC-AGREE, acomputerized software program thatmeasures interobserver agreement (6). The program expresses results invalues of crude and specific concor-dance—the latter including correctionfor agreement due to pure chance—using the kappa (k) index (7). Potentialvalues in this index range from �1.00(perfect discordance) to +1.00 (perfectconcordance). The degree of readerconcordance was assessed using Lan-dis and Koch’s interpretive scale for kvalues (8): 0.81–1.00, almost perfect;0.61–0.80, substantial; 0.41–0.60, mod-erate; 0.21–0.40, fair; 0.00–0.20, slight;and <0.00, poor. Values of the k indexare shown along with the standarderror to evaluate statistical significance.
RESULTS
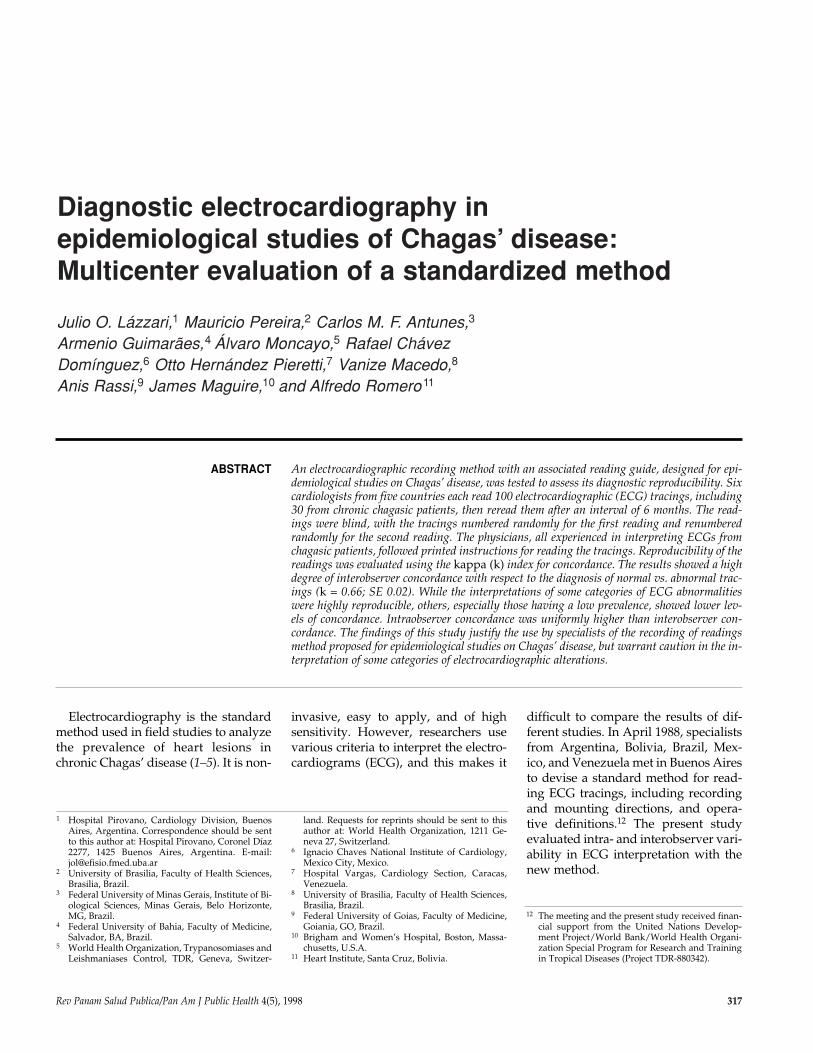
In the first reading, the paired read-ers’ concordances with respect to thediagnosis of normal vs. abnormal trac-ings ranged from 78% (readers 5 and6) to 92% (readers 1 and 4) (Table 1).The corresponding k values rangedfrom 0.51 to 0.83, with most falling inthe range of 0.60 to 0.83, indicating“substantial” or “almost perfect” inter-observer concordance. In general,readers 3 and 5 tended to agree withother readers least often.
The overall pattern of concordancein the second readings of the ECGs, 6months after the first, was similar tothat of the first reading, but withhigher values, as would be expected(Table 1). This time, the paired readersconcurred on the diagnosis of normalvs. abnormal tracings in 79% (readers3 and 5) to 93% of cases (readers 1 and2, readers 2 and 4), with correspond-ing k values of 0.54 to 0.85. Reader 5agreed with other readers more oftenthan the previous time.
The concordances, k values, andstandard errors from the six readers’first global evaluations are presentedfor each category in which the k indexcould be calculated (Table 2). Thecrude concordance as to the diagnosisof normal vs. abnormal tracings was
318 Lázzari et al. • Diagnostic electrocardiography in Chagas’ disease
13 The readers were R. Chávez, O. Hernández Pieretti,J. Lázzari, V. Macedo, A. Rassi, and A. Romero.
TABLE 1. Six readers’ paired interobserver agreementa concerning the overall diagnosis ofnormal vs. abnormal ECG tracings on first and second reading
Observernumber 1 2 3 4 5 6
First reading1 — 91 (0.80) 85 (0.64) 92 (0.83) 81 (0.55) 87 (0.72)2 — — 86 (0.67) 91 (0.80) 82 (0.58) 90 (0.79)3 — — — 83 (0.60) 80 (0.54) 80 (0.56)4 — — — — 83 (0.60) 87 (0.72)5 — — — — — 78 (0.51)6 — — — — — —
Second reading1 — 93 (0.85) 82 (0.57) 90 (0.79) 89 (0.77) 88 (0.73)2 — — 81 (0.55) 93 (0.85) 88 (0.75) 87 (0.71)3 — — — 82 (0.59) 79 (0.54) 84 (0.61)4 — — — — 89 (0.77) 88 (0.74)5 — — — — — 81 (0.60)6 — — — — — —
a Percentage of agreement and (k value).
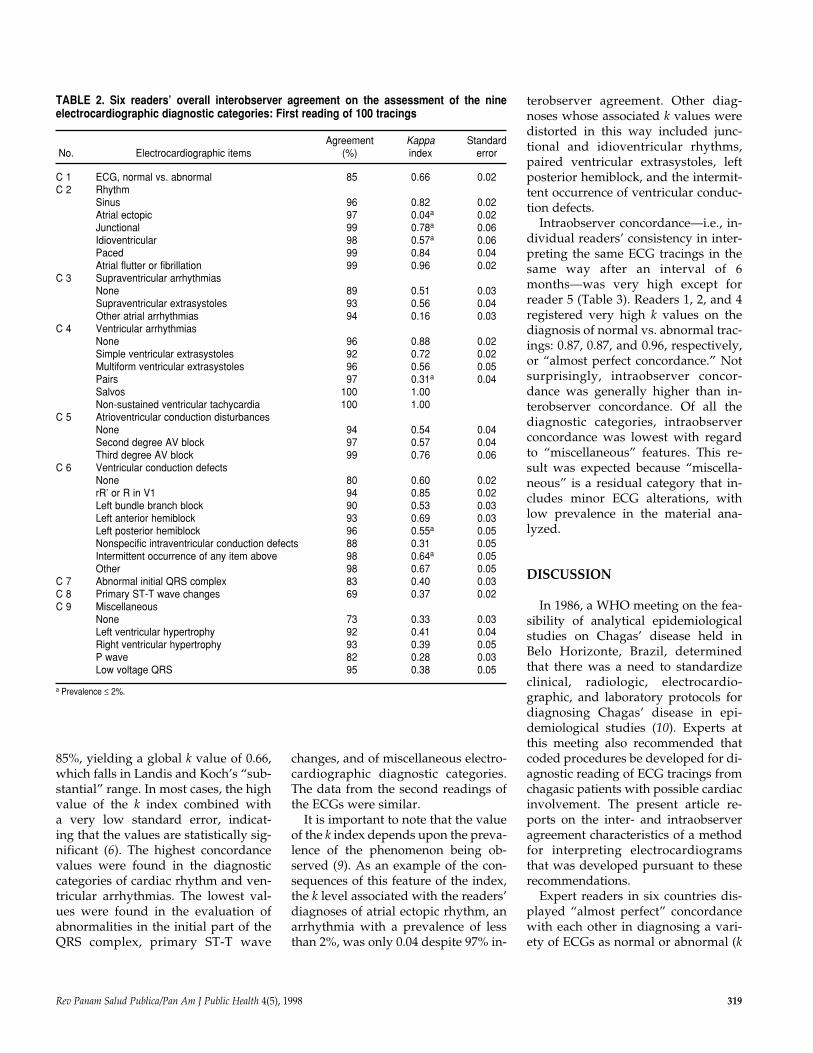
85%, yielding a global k value of 0.66,which falls in Landis and Koch’s “sub-stantial” range. In most cases, the highvalue of the k index combined with a very low standard error, indicat-ing that the values are statistically sig-nificant (6). The highest concordancevalues were found in the diagnosticcategories of cardiac rhythm and ven-tricular arrhythmias. The lowest val-ues were found in the evaluation ofabnormalities in the initial part of theQRS complex, primary ST-T wave
changes, and of miscellaneous electro-cardiographic diagnostic categories.The data from the second readings ofthe ECGs were similar.
It is important to note that the valueof the k index depends upon the preva-lence of the phenomenon being ob-served (9). As an example of the con-sequences of this feature of the index,the k level associated with the readers’diagnoses of atrial ectopic rhythm, anarrhythmia with a prevalence of lessthan 2%, was only 0.04 despite 97% in-
terobserver agreement. Other diag-noses whose associated k values weredistorted in this way included junc-tional and idioventricular rhythms,paired ventricular extrasystoles, leftposterior hemiblock, and the intermit-tent occurrence of ventricular conduc-tion defects.
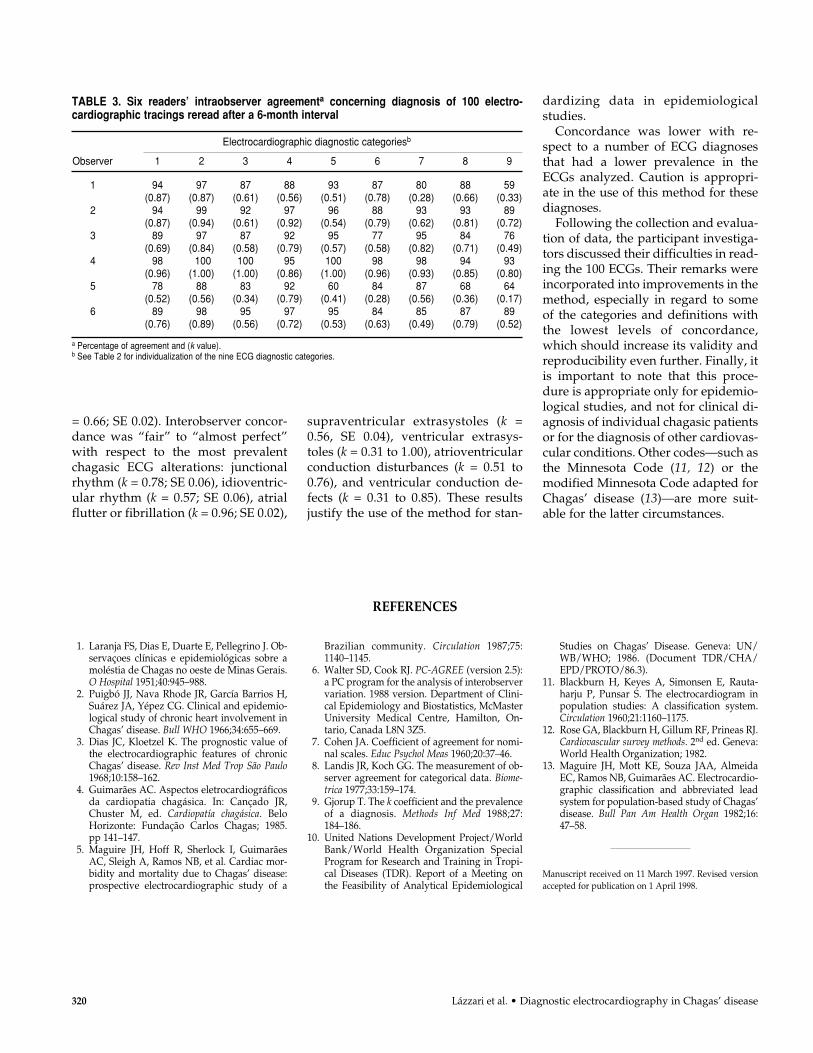
Intraobserver concordance—i.e., in-dividual readers’ consistency in inter-preting the same ECG tracings in thesame way after an interval of 6months—was very high except forreader 5 (Table 3). Readers 1, 2, and 4registered very high k values on thediagnosis of normal vs. abnormal trac-ings: 0.87, 0.87, and 0.96, respectively,or “almost perfect concordance.” Notsurprisingly, intraobserver concor-dance was generally higher than in-terobserver concordance. Of all thediagnostic categories, intraobserverconcordance was lowest with regardto “miscellaneous” features. This re-sult was expected because “miscella-neous” is a residual category that in-cludes minor ECG alterations, withlow prevalence in the material ana-lyzed.
DISCUSSION
In 1986, a WHO meeting on the fea-sibility of analytical epidemiologicalstudies on Chagas’ disease held inBelo Horizonte, Brazil, determinedthat there was a need to standardizeclinical, radiologic, electrocardio-graphic, and laboratory protocols fordiagnosing Chagas’ disease in epi-demiological studies (10). Experts atthis meeting also recommended thatcoded procedures be developed for di-agnostic reading of ECG tracings fromchagasic patients with possible cardiacinvolvement. The present article re-ports on the inter- and intraobserveragreement characteristics of a methodfor interpreting electrocardiogramsthat was developed pursuant to theserecommendations.
Expert readers in six countries dis-played “almost perfect” concordancewith each other in diagnosing a vari-ety of ECGs as normal or abnormal (k
Rev Panam Salud Publica/Pan Am J Public Health 4(5), 1998 319
TABLE 2. Six readers’ overall interobserver agreement on the assessment of the nineelectrocardiographic diagnostic categories: First reading of 100 tracings
Agreement Kappa StandardNo. Electrocardiographic items (%) index error
C 1 ECG, normal vs. abnormal 85 0.66 0.02C 2 Rhythm
Sinus 96 0.82 0.02Atrial ectopic 97 0.04a 0.02Junctional 99 0.78a 0.06Idioventricular 98 0.57a 0.06Paced 99 0.84 0.04Atrial flutter or fibrillation 99 0.96 0.02
C 3 Supraventricular arrhythmiasNone 89 0.51 0.03Supraventricular extrasystoles 93 0.56 0.04Other atrial arrhythmias 94 0.16 0.03
C 4 Ventricular arrhythmiasNone 96 0.88 0.02Simple ventricular extrasystoles 92 0.72 0.02Multiform ventricular extrasystoles 96 0.56 0.05Pairs 97 0.31a 0.04Salvos 100 1.00Non-sustained ventricular tachycardia 100 1.00
C 5 Atrioventricular conduction disturbancesNone 94 0.54 0.04Second degree AV block 97 0.57 0.04Third degree AV block 99 0.76 0.06
C 6 Ventricular conduction defectsNone 80 0.60 0.02rR’ or R in V1 94 0.85 0.02Left bundle branch block 90 0.53 0.03Left anterior hemiblock 93 0.69 0.03Left posterior hemiblock 96 0.55a 0.05Nonspecific intraventricular conduction defects 88 0.31 0.05Intermittent occurrence of any item above 98 0.64a 0.05Other 98 0.67 0.05
C 7 Abnormal initial QRS complex 83 0.40 0.03C 8 Primary ST-T wave changes 69 0.37 0.02C 9 Miscellaneous
None 73 0.33 0.03Left ventricular hypertrophy 92 0.41 0.04Right ventricular hypertrophy 93 0.39 0.05P wave 82 0.28 0.03Low voltage QRS 95 0.38 0.05
a Prevalence ≤ 2%.
1. Laranja FS, Dias E, Duarte E, Pellegrino J. Ob-servaçoes clínicas e epidemiológicas sobre amoléstia de Chagas no oeste de Minas Gerais.O Hospital 1951;40:945–988.
2. Puigbó JJ, Nava Rhode JR, García Barrios H,Suárez JA, Yépez CG. Clinical and epidemio-logical study of chronic heart involvement inChagas’ disease. Bull WHO 1966;34:655–669.
3. Dias JC, Kloetzel K. The prognostic value ofthe electrocardiographic features of chronicChagas’ disease. Rev Inst Med Trop São Paulo1968;10:158–162.
4. Guimarães AC. Aspectos eletrocardiográficosda cardiopatia chagásica. In: Cançado JR,Chuster M, ed. Cardiopatía chagásica. BeloHorizonte: Fundação Carlos Chagas; 1985.pp 141–147.
5. Maguire JH, Hoff R, Sherlock I, GuimarãesAC, Sleigh A, Ramos NB, et al. Cardiac mor-bidity and mortality due to Chagas’ disease:prospective electrocardiographic study of a
Brazilian community. Circulation 1987;75:1140–1145.
6. Walter SD, Cook RJ. PC-AGREE (version 2.5):a PC program for the analysis of interobservervariation. 1988 version. Department of Clini-cal Epidemiology and Biostatistics, McMasterUniversity Medical Centre, Hamilton, On-tario, Canada L8N 3Z5.
7. Cohen JA. Coefficient of agreement for nomi-nal scales. Educ Psychol Meas 1960;20:37–46.
8. Landis JR, Koch GG. The measurement of ob-server agreement for categorical data. Biome-trica 1977;33:159–174.
9. Gjorup T. The k coefficient and the prevalenceof a diagnosis. Methods Inf Med 1988;27:184–186.
10. United Nations Development Project/WorldBank/World Health Organization SpecialProgram for Research and Training in Tropi-cal Diseases (TDR). Report of a Meeting onthe Feasibility of Analytical Epidemiological
Studies on Chagas’ Disease. Geneva: UN/WB/WHO; 1986. (Document TDR/CHA/EPD/PROTO/86.3).
11. Blackburn H, Keyes A, Simonsen E, Rauta-harju P, Punsar S. The electrocardiogram inpopulation studies: A classification system.Circulation 1960;21:1160–1175.
12. Rose GA, Blackburn H, Gillum RF, Prineas RJ.Cardiovascular survey methods. 2nd ed. Geneva:World Health Organization; 1982.
13. Maguire JH, Mott KE, Souza JAA, AlmeidaEC, Ramos NB, Guimarães AC. Electrocardio-graphic classification and abbreviated leadsystem for population-based study of Chagas’disease. Bull Pan Am Health Organ 1982;16:47–58.
Manuscript received on 11 March 1997. Revised versionaccepted for publication on 1 April 1998.
REFERENCES
= 0.66; SE 0.02). Interobserver concor-dance was “fair” to “almost perfect”with respect to the most prevalentchagasic ECG alterations: junctionalrhythm (k = 0.78; SE 0.06), idioventric-ular rhythm (k = 0.57; SE 0.06), atrialflutter or fibrillation (k = 0.96; SE 0.02),
supraventricular extrasystoles (k =0.56, SE 0.04), ventricular extrasys-toles (k = 0.31 to 1.00), atrioventricularconduction disturbances (k = 0.51 to0.76), and ventricular conduction de-fects (k = 0.31 to 0.85). These resultsjustify the use of the method for stan-
dardizing data in epidemiologicalstudies.
Concordance was lower with re-spect to a number of ECG diagnosesthat had a lower prevalence in theECGs analyzed. Caution is appropri-ate in the use of this method for thesediagnoses.
Following the collection and evalua-tion of data, the participant investiga-tors discussed their difficulties in read-ing the 100 ECGs. Their remarks wereincorporated into improvements in themethod, especially in regard to someof the categories and definitions withthe lowest levels of concordance,which should increase its validity andreproducibility even further. Finally, itis important to note that this proce-dure is appropriate only for epidemio-logical studies, and not for clinical di-agnosis of individual chagasic patientsor for the diagnosis of other cardiovas-cular conditions. Other codes—such asthe Minnesota Code (11, 12) or themodified Minnesota Code adapted forChagas’ disease (13)—are more suit-able for the latter circumstances.
320 Lázzari et al. • Diagnostic electrocardiography in Chagas’ disease
TABLE 3. Six readers’ intraobserver agreementa concerning diagnosis of 100 electro-cardiographic tracings reread after a 6-month interval
Electrocardiographic diagnostic categoriesb
Observer 1 2 3 4 5 6 7 8 9
1 94 97 87 88 93 87 80 88 59(0.87) (0.87) (0.61) (0.56) (0.51) (0.78) (0.28) (0.66) (0.33)
2 94 99 92 97 96 88 93 93 89(0.87) (0.94) (0.61) (0.92) (0.54) (0.79) (0.62) (0.81) (0.72)
3 89 97 87 92 95 77 95 84 76(0.69) (0.84) (0.58) (0.79) (0.57) (0.58) (0.82) (0.71) (0.49)
4 98 100 100 95 100 98 98 94 93(0.96) (1.00) (1.00) (0.86) (1.00) (0.96) (0.93) (0.85) (0.80)
5 78 88 83 92 60 84 87 68 64(0.52) (0.56) (0.34) (0.79) (0.41) (0.28) (0.56) (0.36) (0.17)
6 89 98 95 97 95 84 85 87 89(0.76) (0.89) (0.56) (0.72) (0.53) (0.63) (0.49) (0.79) (0.52)
a Percentage of agreement and (k value). b See Table 2 for individualization of the nine ECG diagnostic categories.
ANNEX 1. The electrocardiographic recording and reading method
This annex describes the electrocardiographic (ECG) recording and reading methoddesigned for epidemiological studies on Chagas’ disease and computer analysis, as itwas used in this study. This code should not be used for the diagnosis of individualpatients or for other pathologic conditions.
In the first part of the reading, some ECG measurements are recorded, such as heartrate, PR interval, and QRS interval and axis. Using these measurements, the computerwill automatically diagnose certain ECG abnormalities, such as sinus tachycardia,atrioventricular (AV) conduction disturbances, or the presence and degree of bundlebranch block. Manual entry of those diagnoses is not required. For example, there isno need to code “first degree AV block,” since the computer will make the diagnosisfrom the measurement of the AV interval, taking into account age and heart rate. Sim-ilarly, the computer will diagnose “complete” and “incomplete” bundle branch blocksusing the measurement of the QRS interval. The computer will diagnose bradycardiaand tachycardia from the heart rate.
For similar reasons, combinations of abnormalities of the same category are enteredin isolated form when they occur in the same patient. For example, in a patient withright bundle branch block (rR’) and left anterior hemiblock, the items “right bundlebranch block” and “left anterior hemiblock” are entered separately. The first columnof Table 2 shows the items used in this study to enter each ECG diagnosis.
The definitions of terms used in this method are strictly operational definitions andmay not coincide exactly with those generally accepted in the literature.
GENERAL PROCEDURES
Recording ECGs
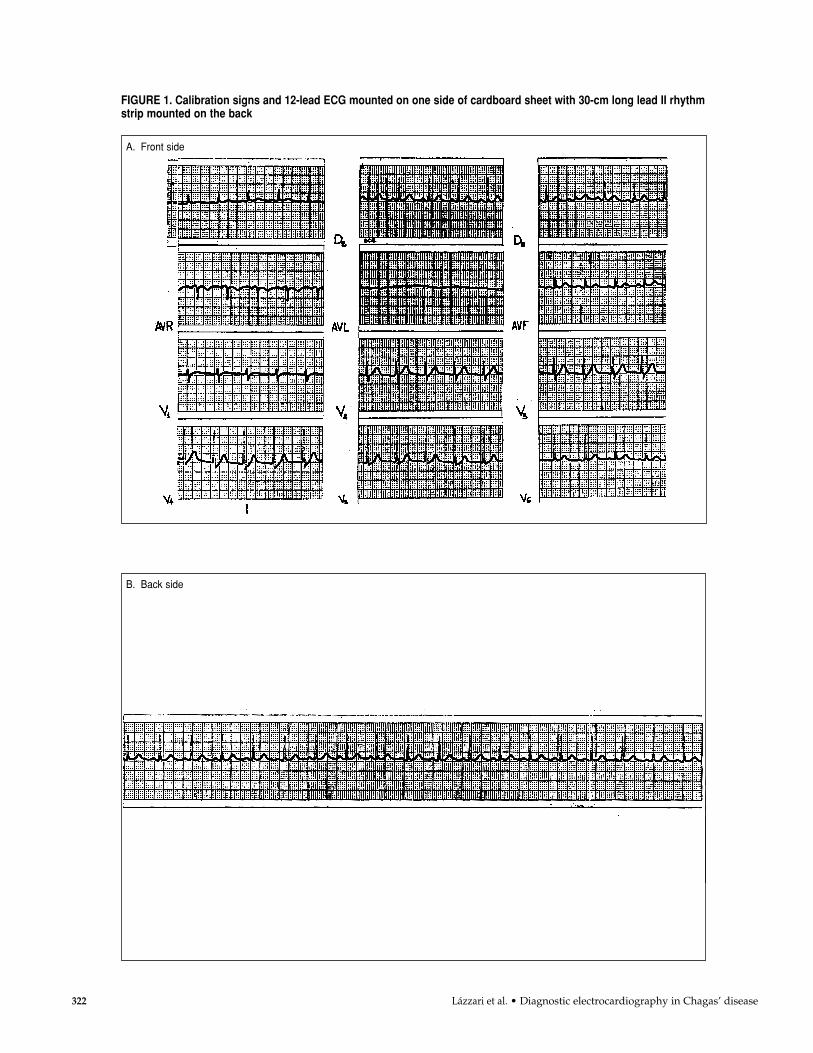
To obtain comparable information, all recordings are 12-lead ECGs taken on single-channel machines. Recordings include at least three QRS complexes in each 7 to 9 cmlong lead, and a final 30-cm lead II rhythm strip.
Electrocardiographs are calibrated such that 1 mV = 10 mm. Each electrocardiogramis marked with a calibration signal. The calibration signal should have a rectangularshape. Any overshooting, overdamping, or abnormal slope should be corrected.
Each lead is identified, during or immediately following the recording, in the mar-gin of the recording paper.
Only tracings of good quality should be accepted, avoiding artifacts, tremors, wan-dering baseline, and 50/60-cycle alternating current interference. The use of alternatecurrent or muscle tremor filters should be disallowed.
ECG mounting and labeling
The 12 leads are mounted on one side of a cardboard sheet measuring 21 x 30 cm,as shown in Figure 1. The calibration signs along with the 12-lead ECG are mountedon one side. The 30-cm long lead II rhythm strip is mounted on the back of the samesheet.
Rev Panam Salud Publica/Pan Am J Public Health 4(5), 1998 321
322 Lázzari et al. • Diagnostic electrocardiography in Chagas’ disease
B. Back side
FIGURE 1. Calibration signs and 12-lead ECG mounted on one side of cardboard sheet with 30-cm long lead II rhythmstrip mounted on the back
A. Front side
A IDENTIFICATIONA1 Center identificationA2 Subject identificationA3 AgeA4 Sex (Male/Female)A5 Date (dd/mm/yyyy)
B ELECTROCARDIOGRAPHICMEASUREMENTSB1 Heart rate (bpm)B2 PR interval (sec/100)B3 QRS duration (sec/100)B4 QRS axisB5 Number of ventricular
extrasystoles
C ELECTROCARDIOGRAPHICPATTERNC1 ECG (Normal/Abnormal)C2 Rhythm
SinusAtrial ectopicSupraventricular tachycardiaAtrial flutter or fibrillationJunctionalIdioventricularSustained ventricular
tachycardiaPacedUnidentified
C3 Supraventricular arrhythmiasNoneSupraventricular extrasystolesSupraventricular tachycardiaAtrial flutter or fibrillationOther atrial arrhythmias
C4 Ventricular arrhythmiasNoneSimple ventricular
extrasystolesMultiform ventricular
extrasystolesPairs
SalvosR/T phenomenonNonsustained VTSustained VT
C5 Atrioventricular conductiondisturbancesNoneType I second degree AV blockType II second degree
AV block2:1 AV blockHigh degree AV blockThird degree AV blockAtrioventricular dissociationVentricular pre-excitationNoncodifiable
C6 Ventricular conduction defectsNonerR’ or R in V1Left bundle branch blockLeft anterior hemiblockLeft posterior hemiblockNonspecific ventricular
conduction defectIntermittent Noncodifiable
C7 Abnormal initial portion ofthe QRS complexNonePresentNoncodifiable
C8 Primary ST-T wave changesNonePresentNoncodifiable
C9 MiscellaneousNoneLeft ventricular hypertrophyRight ventricular hypertrophyP wave changesLow voltage QRSOther ECG changes. Please
identify:
Rev Panam Salud Publica/Pan Am J Public Health 4(5), 1998 323
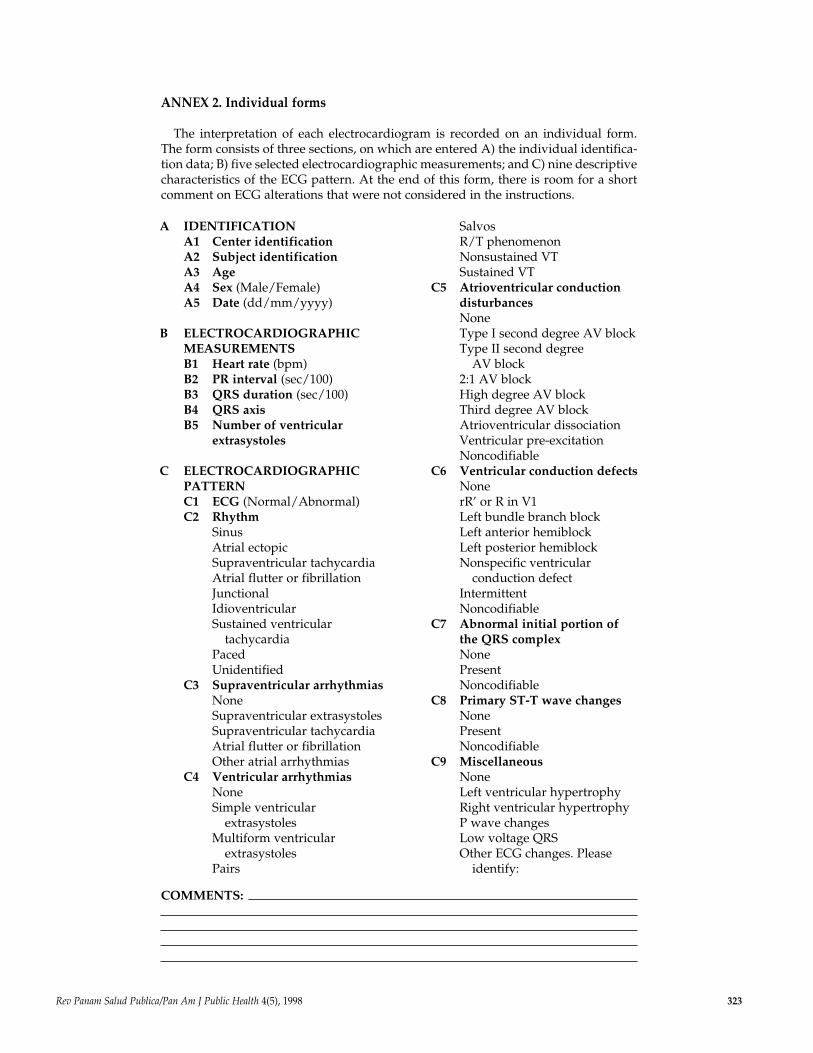
ANNEX 2. Individual forms
The interpretation of each electrocardiogram is recorded on an individual form.The form consists of three sections, on which are entered A) the individual identifica-tion data; B) five selected electrocardiographic measurements; and C) nine descriptivecharacteristics of the ECG pattern. At the end of this form, there is room for a shortcomment on ECG alterations that were not considered in the instructions.
COMMENTS:
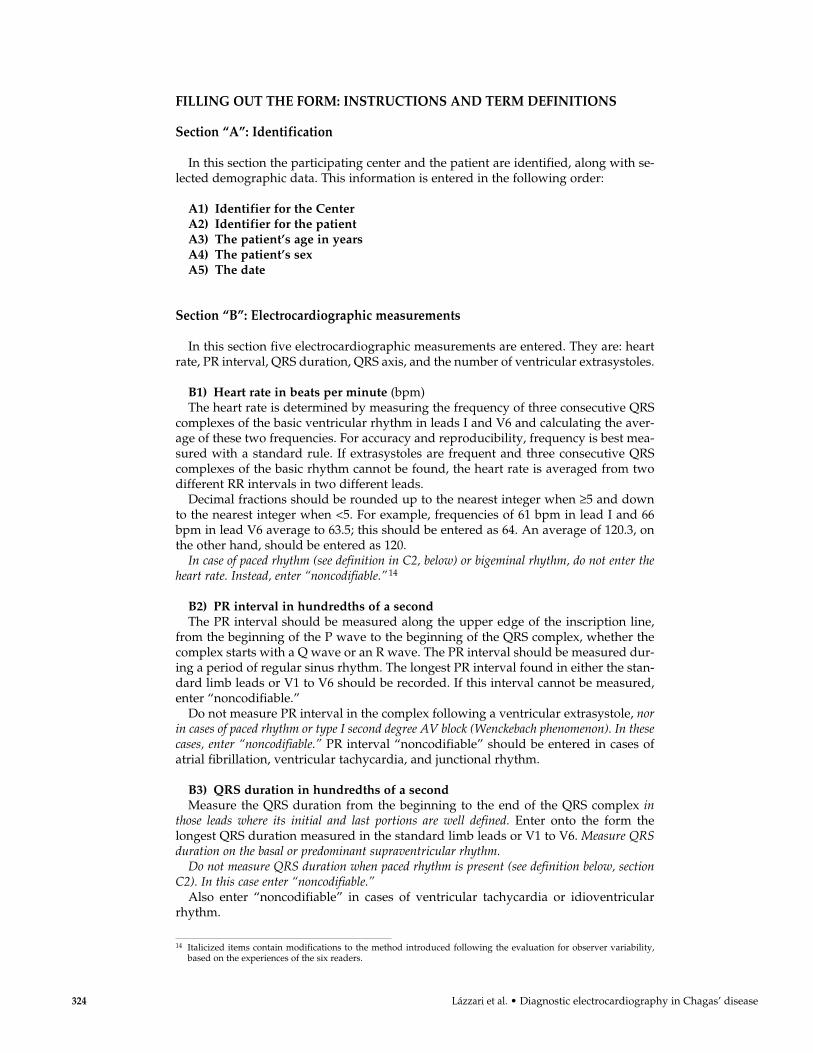
FILLING OUT THE FORM: INSTRUCTIONS AND TERM DEFINITIONS
Section “A”: Identification
In this section the participating center and the patient are identified, along with se-lected demographic data. This information is entered in the following order:
A1) Identifier for the Center A2) Identifier for the patientA3) The patient’s age in yearsA4) The patient’s sexA5) The date
Section “B”: Electrocardiographic measurements
In this section five electrocardiographic measurements are entered. They are: heartrate, PR interval, QRS duration, QRS axis, and the number of ventricular extrasystoles.
B1) Heart rate in beats per minute (bpm)The heart rate is determined by measuring the frequency of three consecutive QRS
complexes of the basic ventricular rhythm in leads I and V6 and calculating the aver-age of these two frequencies. For accuracy and reproducibility, frequency is best mea-sured with a standard rule. If extrasystoles are frequent and three consecutive QRScomplexes of the basic rhythm cannot be found, the heart rate is averaged from twodifferent RR intervals in two different leads.
Decimal fractions should be rounded up to the nearest integer when ≥5 and downto the nearest integer when <5. For example, frequencies of 61 bpm in lead I and 66bpm in lead V6 average to 63.5; this should be entered as 64. An average of 120.3, onthe other hand, should be entered as 120.
In case of paced rhythm (see definition in C2, below) or bigeminal rhythm, do not enter theheart rate. Instead, enter “noncodifiable.”14
B2) PR interval in hundredths of a secondThe PR interval should be measured along the upper edge of the inscription line,
from the beginning of the P wave to the beginning of the QRS complex, whether thecomplex starts with a Q wave or an R wave. The PR interval should be measured dur-ing a period of regular sinus rhythm. The longest PR interval found in either the stan-dard limb leads or V1 to V6 should be recorded. If this interval cannot be measured,enter “noncodifiable.”
Do not measure PR interval in the complex following a ventricular extrasystole, norin cases of paced rhythm or type I second degree AV block (Wenckebach phenomenon). In thesecases, enter “noncodifiable.” PR interval “noncodifiable” should be entered in cases ofatrial fibrillation, ventricular tachycardia, and junctional rhythm.
B3) QRS duration in hundredths of a secondMeasure the QRS duration from the beginning to the end of the QRS complex in
those leads where its initial and last portions are well defined. Enter onto the form thelongest QRS duration measured in the standard limb leads or V1 to V6. Measure QRSduration on the basal or predominant supraventricular rhythm.
Do not measure QRS duration when paced rhythm is present (see definition below, sectionC2). In this case enter “noncodifiable.”
Also enter “noncodifiable” in cases of ventricular tachycardia or idioventricularrhythm.
324 Lázzari et al. • Diagnostic electrocardiography in Chagas’ disease
14 Italicized items contain modifications to the method introduced following the evaluation for observer variability,based on the experiences of the six readers.
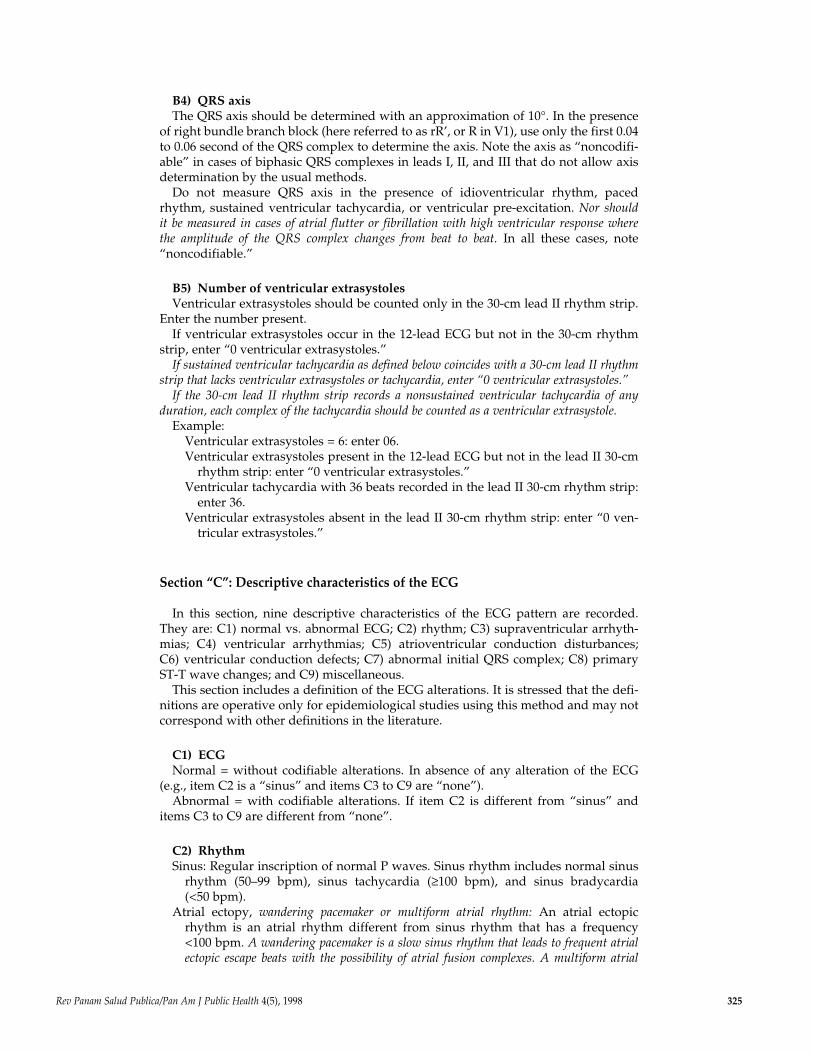
B4) QRS axisThe QRS axis should be determined with an approximation of 10°. In the presence
of right bundle branch block (here referred to as rR’, or R in V1), use only the first 0.04to 0.06 second of the QRS complex to determine the axis. Note the axis as “noncodifi-able” in cases of biphasic QRS complexes in leads I, II, and III that do not allow axisdetermination by the usual methods.
Do not measure QRS axis in the presence of idioventricular rhythm, paced rhythm, sustained ventricular tachycardia, or ventricular pre-excitation. Nor should it be measured in cases of atrial flutter or fibrillation with high ventricular response where the amplitude of the QRS complex changes from beat to beat. In all these cases, note“noncodifiable.”
B5) Number of ventricular extrasystolesVentricular extrasystoles should be counted only in the 30-cm lead II rhythm strip.
Enter the number present.If ventricular extrasystoles occur in the 12-lead ECG but not in the 30-cm rhythm
strip, enter “0 ventricular extrasystoles.”If sustained ventricular tachycardia as defined below coincides with a 30-cm lead II rhythm
strip that lacks ventricular extrasystoles or tachycardia, enter “0 ventricular extrasystoles.”If the 30-cm lead II rhythm strip records a nonsustained ventricular tachycardia of any
duration, each complex of the tachycardia should be counted as a ventricular extrasystole.Example:
Ventricular extrasystoles = 6: enter 06.Ventricular extrasystoles present in the 12-lead ECG but not in the lead II 30-cm
rhythm strip: enter “0 ventricular extrasystoles.”Ventricular tachycardia with 36 beats recorded in the lead II 30-cm rhythm strip:
enter 36.Ventricular extrasystoles absent in the lead II 30-cm rhythm strip: enter “0 ven-
tricular extrasystoles.”
Section “C”: Descriptive characteristics of the ECG
In this section, nine descriptive characteristics of the ECG pattern are recorded.They are: C1) normal vs. abnormal ECG; C2) rhythm; C3) supraventricular arrhyth-mias; C4) ventricular arrhythmias; C5) atrioventricular conduction disturbances; C6) ventricular conduction defects; C7) abnormal initial QRS complex; C8) primaryST-T wave changes; and C9) miscellaneous.
This section includes a definition of the ECG alterations. It is stressed that the defi-nitions are operative only for epidemiological studies using this method and may notcorrespond with other definitions in the literature.
C1) ECGNormal = without codifiable alterations. In absence of any alteration of the ECG
(e.g., item C2 is a “sinus” and items C3 to C9 are “none”).Abnormal = with codifiable alterations. If item C2 is different from “sinus” and
items C3 to C9 are different from “none”.
C2) RhythmSinus: Regular inscription of normal P waves. Sinus rhythm includes normal sinus
rhythm (50–99 bpm), sinus tachycardia (≥100 bpm), and sinus bradycardia (<50 bpm).
Atrial ectopy, wandering pacemaker or multiform atrial rhythm: An atrial ectopicrhythm is an atrial rhythm different from sinus rhythm that has a frequency<100 bpm. A wandering pacemaker is a slow sinus rhythm that leads to frequent atrialectopic escape beats with the possibility of atrial fusion complexes. A multiform atrial
Rev Panam Salud Publica/Pan Am J Public Health 4(5), 1998 325
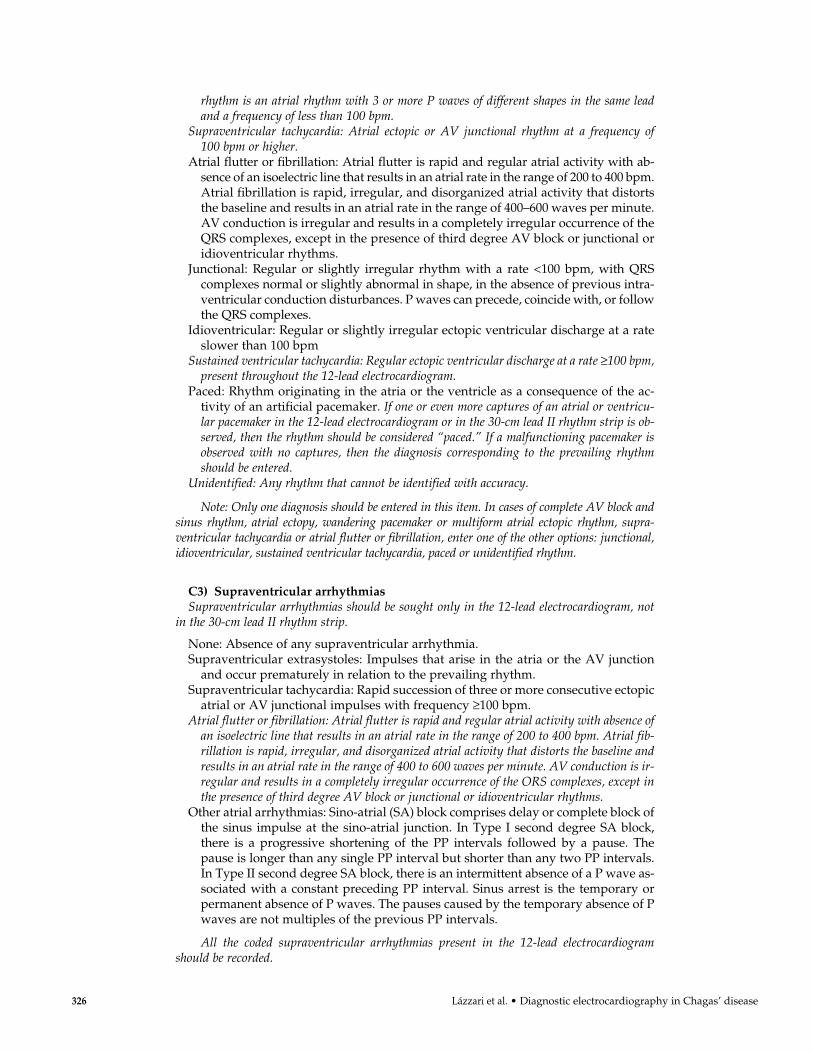
rhythm is an atrial rhythm with 3 or more P waves of different shapes in the same leadand a frequency of less than 100 bpm.
Supraventricular tachycardia: Atrial ectopic or AV junctional rhythm at a frequency of100 bpm or higher.
Atrial flutter or fibrillation: Atrial flutter is rapid and regular atrial activity with ab-sence of an isoelectric line that results in an atrial rate in the range of 200 to 400 bpm.Atrial fibrillation is rapid, irregular, and disorganized atrial activity that distortsthe baseline and results in an atrial rate in the range of 400–600 waves per minute.AV conduction is irregular and results in a completely irregular occurrence of theQRS complexes, except in the presence of third degree AV block or junctional oridioventricular rhythms.
Junctional: Regular or slightly irregular rhythm with a rate <100 bpm, with QRScomplexes normal or slightly abnormal in shape, in the absence of previous intra-ventricular conduction disturbances. P waves can precede, coincide with, or followthe QRS complexes.
Idioventricular: Regular or slightly irregular ectopic ventricular discharge at a rateslower than 100 bpm
Sustained ventricular tachycardia: Regular ectopic ventricular discharge at a rate ≥100 bpm,present throughout the 12-lead electrocardiogram.
Paced: Rhythm originating in the atria or the ventricle as a consequence of the ac-tivity of an artificial pacemaker. If one or even more captures of an atrial or ventricu-lar pacemaker in the 12-lead electrocardiogram or in the 30-cm lead II rhythm strip is ob-served, then the rhythm should be considered “paced.” If a malfunctioning pacemaker isobserved with no captures, then the diagnosis corresponding to the prevailing rhythmshould be entered.
Unidentified: Any rhythm that cannot be identified with accuracy.
Note: Only one diagnosis should be entered in this item. In cases of complete AV block andsinus rhythm, atrial ectopy, wandering pacemaker or multiform atrial ectopic rhythm, supra-ventricular tachycardia or atrial flutter or fibrillation, enter one of the other options: junctional,idioventricular, sustained ventricular tachycardia, paced or unidentified rhythm.
C3) Supraventricular arrhythmiasSupraventricular arrhythmias should be sought only in the 12-lead electrocardiogram, not
in the 30-cm lead II rhythm strip.
None: Absence of any supraventricular arrhythmia.Supraventricular extrasystoles: Impulses that arise in the atria or the AV junction
and occur prematurely in relation to the prevailing rhythm.Supraventricular tachycardia: Rapid succession of three or more consecutive ectopic
atrial or AV junctional impulses with frequency ≥100 bpm.Atrial flutter or fibrillation: Atrial flutter is rapid and regular atrial activity with absence of
an isoelectric line that results in an atrial rate in the range of 200 to 400 bpm. Atrial fib-rillation is rapid, irregular, and disorganized atrial activity that distorts the baseline andresults in an atrial rate in the range of 400 to 600 waves per minute. AV conduction is ir-regular and results in a completely irregular occurrence of the ORS complexes, except inthe presence of third degree AV block or junctional or idioventricular rhythms.
Other atrial arrhythmias: Sino-atrial (SA) block comprises delay or complete block ofthe sinus impulse at the sino-atrial junction. In Type I second degree SA block,there is a progressive shortening of the PP intervals followed by a pause. Thepause is longer than any single PP interval but shorter than any two PP intervals.In Type II second degree SA block, there is an intermittent absence of a P wave as-sociated with a constant preceding PP interval. Sinus arrest is the temporary orpermanent absence of P waves. The pauses caused by the temporary absence of Pwaves are not multiples of the previous PP intervals.
All the coded supraventricular arrhythmias present in the 12-lead electrocardiogramshould be recorded.
326 Lázzari et al. • Diagnostic electrocardiography in Chagas’ disease
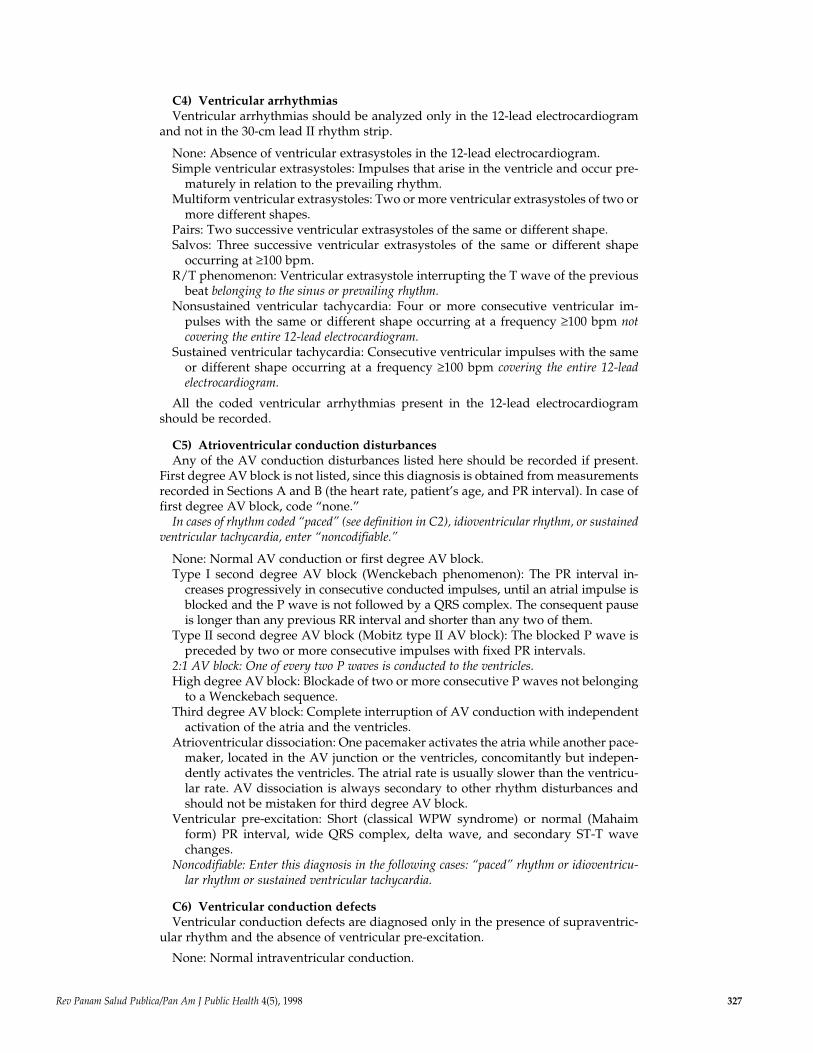
C4) Ventricular arrhythmiasVentricular arrhythmias should be analyzed only in the 12-lead electrocardiogram
and not in the 30-cm lead II rhythm strip.
None: Absence of ventricular extrasystoles in the 12-lead electrocardiogram.Simple ventricular extrasystoles: Impulses that arise in the ventricle and occur pre-
maturely in relation to the prevailing rhythm.Multiform ventricular extrasystoles: Two or more ventricular extrasystoles of two or
more different shapes.Pairs: Two successive ventricular extrasystoles of the same or different shape.Salvos: Three successive ventricular extrasystoles of the same or different shape
occurring at ≥100 bpm.R/T phenomenon: Ventricular extrasystole interrupting the T wave of the previous
beat belonging to the sinus or prevailing rhythm.Nonsustained ventricular tachycardia: Four or more consecutive ventricular im-
pulses with the same or different shape occurring at a frequency ≥100 bpm notcovering the entire 12-lead electrocardiogram.
Sustained ventricular tachycardia: Consecutive ventricular impulses with the sameor different shape occurring at a frequency ≥100 bpm covering the entire 12-leadelectrocardiogram.
All the coded ventricular arrhythmias present in the 12-lead electrocardiogramshould be recorded.
C5) Atrioventricular conduction disturbancesAny of the AV conduction disturbances listed here should be recorded if present.
First degree AV block is not listed, since this diagnosis is obtained from measurementsrecorded in Sections A and B (the heart rate, patient’s age, and PR interval). In case offirst degree AV block, code “none.”
In cases of rhythm coded “paced” (see definition in C2), idioventricular rhythm, or sustainedventricular tachycardia, enter “noncodifiable.”
None: Normal AV conduction or first degree AV block.Type I second degree AV block (Wenckebach phenomenon): The PR interval in-
creases progressively in consecutive conducted impulses, until an atrial impulse isblocked and the P wave is not followed by a QRS complex. The consequent pauseis longer than any previous RR interval and shorter than any two of them.
Type II second degree AV block (Mobitz type II AV block): The blocked P wave ispreceded by two or more consecutive impulses with fixed PR intervals.
2:1 AV block: One of every two P waves is conducted to the ventricles.High degree AV block: Blockade of two or more consecutive P waves not belonging
to a Wenckebach sequence.Third degree AV block: Complete interruption of AV conduction with independent
activation of the atria and the ventricles.Atrioventricular dissociation: One pacemaker activates the atria while another pace-
maker, located in the AV junction or the ventricles, concomitantly but indepen-dently activates the ventricles. The atrial rate is usually slower than the ventricu-lar rate. AV dissociation is always secondary to other rhythm disturbances andshould not be mistaken for third degree AV block.
Ventricular pre-excitation: Short (classical WPW syndrome) or normal (Mahaimform) PR interval, wide QRS complex, delta wave, and secondary ST-T wavechanges.
Noncodifiable: Enter this diagnosis in the following cases: “paced” rhythm or idioventricu-lar rhythm or sustained ventricular tachycardia.
C6) Ventricular conduction defectsVentricular conduction defects are diagnosed only in the presence of supraventric-
ular rhythm and the absence of ventricular pre-excitation.
None: Normal intraventricular conduction.
Rev Panam Salud Publica/Pan Am J Public Health 4(5), 1998 327
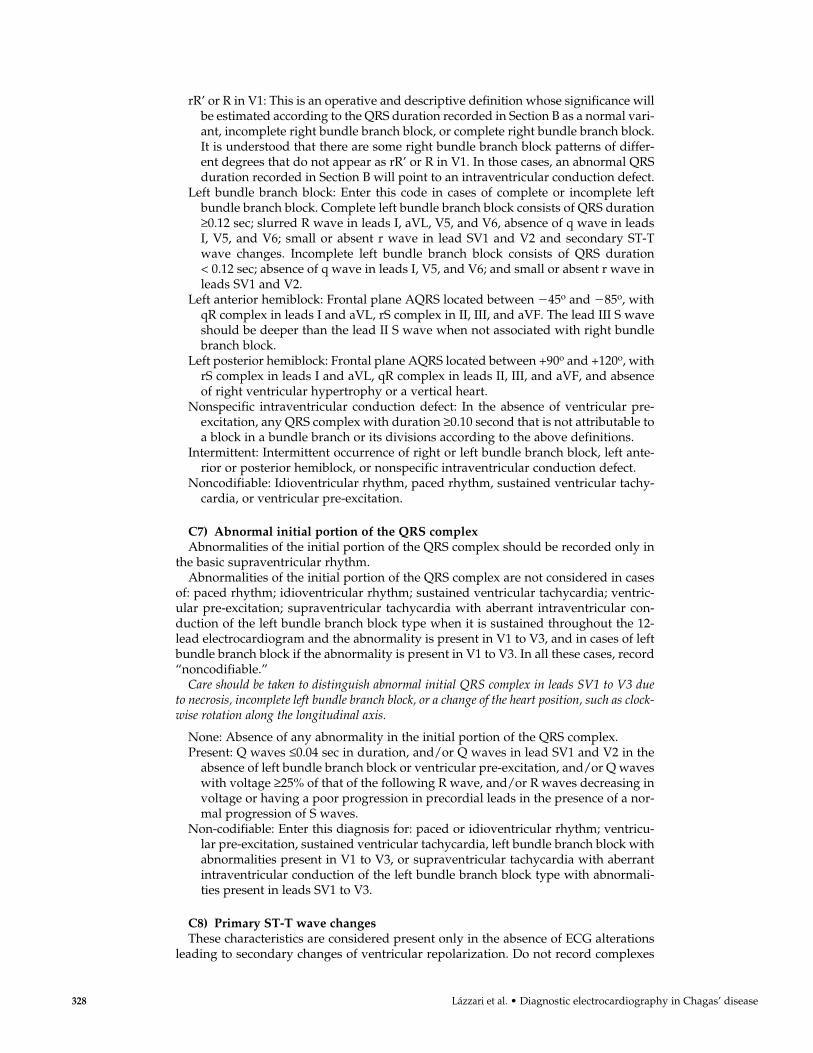
rR’ or R in V1: This is an operative and descriptive definition whose significance willbe estimated according to the QRS duration recorded in Section B as a normal vari-ant, incomplete right bundle branch block, or complete right bundle branch block.It is understood that there are some right bundle branch block patterns of differ-ent degrees that do not appear as rR’ or R in V1. In those cases, an abnormal QRSduration recorded in Section B will point to an intraventricular conduction defect.
Left bundle branch block: Enter this code in cases of complete or incomplete leftbundle branch block. Complete left bundle branch block consists of QRS duration≥0.12 sec; slurred R wave in leads I, aVL, V5, and V6, absence of q wave in leadsI, V5, and V6; small or absent r wave in lead SV1 and V2 and secondary ST-Twave changes. Incomplete left bundle branch block consists of QRS duration< 0.12 sec; absence of q wave in leads I, V5, and V6; and small or absent r wave inleads SV1 and V2.
Left anterior hemiblock: Frontal plane AQRS located between �45o and �85o, withqR complex in leads I and aVL, rS complex in II, III, and aVF. The lead III S waveshould be deeper than the lead II S wave when not associated with right bundlebranch block.
Left posterior hemiblock: Frontal plane AQRS located between +90o and +120o, withrS complex in leads I and aVL, qR complex in leads II, III, and aVF, and absenceof right ventricular hypertrophy or a vertical heart.
Nonspecific intraventricular conduction defect: In the absence of ventricular pre-excitation, any QRS complex with duration ≥0.10 second that is not attributable toa block in a bundle branch or its divisions according to the above definitions.
Intermittent: Intermittent occurrence of right or left bundle branch block, left ante-rior or posterior hemiblock, or nonspecific intraventricular conduction defect.
Noncodifiable: Idioventricular rhythm, paced rhythm, sustained ventricular tachy-cardia, or ventricular pre-excitation.
C7) Abnormal initial portion of the QRS complexAbnormalities of the initial portion of the QRS complex should be recorded only in
the basic supraventricular rhythm.Abnormalities of the initial portion of the QRS complex are not considered in cases
of: paced rhythm; idioventricular rhythm; sustained ventricular tachycardia; ventric-ular pre-excitation; supraventricular tachycardia with aberrant intraventricular con-duction of the left bundle branch block type when it is sustained throughout the 12-lead electrocardiogram and the abnormality is present in V1 to V3, and in cases of leftbundle branch block if the abnormality is present in V1 to V3. In all these cases, record“noncodifiable.”
Care should be taken to distinguish abnormal initial QRS complex in leads SV1 to V3 dueto necrosis, incomplete left bundle branch block, or a change of the heart position, such as clock-wise rotation along the longitudinal axis.
None: Absence of any abnormality in the initial portion of the QRS complex.Present: Q waves ≤0.04 sec in duration, and/or Q waves in lead SV1 and V2 in the
absence of left bundle branch block or ventricular pre-excitation, and/or Q waveswith voltage ≥25% of that of the following R wave, and/or R waves decreasing involtage or having a poor progression in precordial leads in the presence of a nor-mal progression of S waves.
Non-codifiable: Enter this diagnosis for: paced or idioventricular rhythm; ventricu-lar pre-excitation, sustained ventricular tachycardia, left bundle branch block withabnormalities present in V1 to V3, or supraventricular tachycardia with aberrantintraventricular conduction of the left bundle branch block type with abnormali-ties present in leads SV1 to V3.
C8) Primary ST-T wave changesThese characteristics are considered present only in the absence of ECG alterations
leading to secondary changes of ventricular repolarization. Do not record complexes
328 Lázzari et al. • Diagnostic electrocardiography in Chagas’ disease
Rev Panam Salud Publica/Pan Am J Public Health 4(5), 1998 329
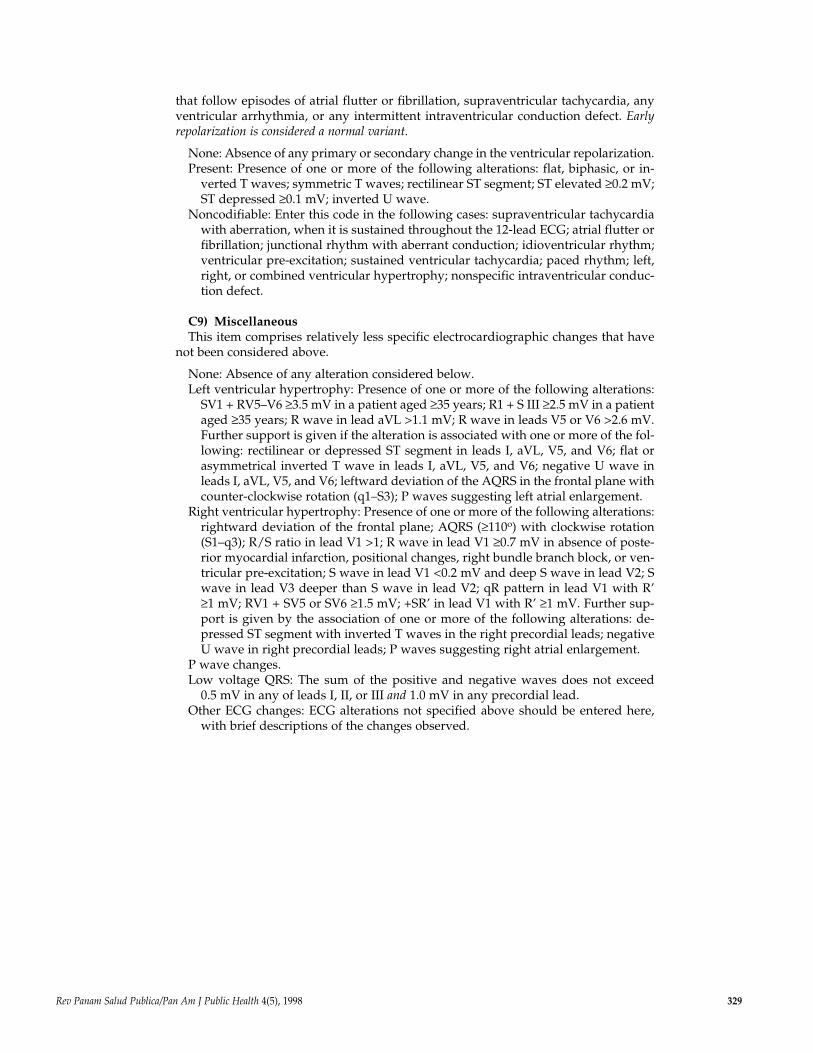
that follow episodes of atrial flutter or fibrillation, supraventricular tachycardia, anyventricular arrhythmia, or any intermittent intraventricular conduction defect. Earlyrepolarization is considered a normal variant.
None: Absence of any primary or secondary change in the ventricular repolarization.Present: Presence of one or more of the following alterations: flat, biphasic, or in-
verted T waves; symmetric T waves; rectilinear ST segment; ST elevated ≥0.2 mV;ST depressed ≥0.1 mV; inverted U wave.
Noncodifiable: Enter this code in the following cases: supraventricular tachycardiawith aberration, when it is sustained throughout the 12-lead ECG; atrial flutter orfibrillation; junctional rhythm with aberrant conduction; idioventricular rhythm;ventricular pre-excitation; sustained ventricular tachycardia; paced rhythm; left,right, or combined ventricular hypertrophy; nonspecific intraventricular conduc-tion defect.
C9) MiscellaneousThis item comprises relatively less specific electrocardiographic changes that have
not been considered above.
None: Absence of any alteration considered below.Left ventricular hypertrophy: Presence of one or more of the following alterations:
SV1 + RV5–V6 ≥3.5 mV in a patient aged ≥35 years; R1 + S III ≥2.5 mV in a patientaged ≥35 years; R wave in lead aVL >1.1 mV; R wave in leads V5 or V6 >2.6 mV.Further support is given if the alteration is associated with one or more of the fol-lowing: rectilinear or depressed ST segment in leads I, aVL, V5, and V6; flat orasymmetrical inverted T wave in leads I, aVL, V5, and V6; negative U wave inleads I, aVL, V5, and V6; leftward deviation of the AQRS in the frontal plane withcounter-clockwise rotation (q1–S3); P waves suggesting left atrial enlargement.
Right ventricular hypertrophy: Presence of one or more of the following alterations:rightward deviation of the frontal plane; AQRS (≥110o) with clockwise rotation(S1–q3); R/S ratio in lead V1 >1; R wave in lead V1 ≥0.7 mV in absence of poste-rior myocardial infarction, positional changes, right bundle branch block, or ven-tricular pre-excitation; S wave in lead V1 <0.2 mV and deep S wave in lead V2; Swave in lead V3 deeper than S wave in lead V2; qR pattern in lead V1 with R’≥1 mV; RV1 + SV5 or SV6 ≥1.5 mV; +SR’ in lead V1 with R’ ≥1 mV. Further sup-port is given by the association of one or more of the following alterations: de-pressed ST segment with inverted T waves in the right precordial leads; negativeU wave in right precordial leads; P waves suggesting right atrial enlargement.
P wave changes.Low voltage QRS: The sum of the positive and negative waves does not exceed
0.5 mV in any of leads I, II, or III and 1.0 mV in any precordial lead.Other ECG changes: ECG alterations not specified above should be entered here,
with brief descriptions of the changes observed.
Con objeto de evaluar su reproducibilidad diagnóstica, se ensayó un método de re-gistrar resultados electrocardiográficos con una guía para su lectura, diseñado paraestudios epidemiológicos de la enfermedad de Chagas. Seis cardiólogos de cincopaíses interpretaron, cada uno independientemente, los trazos de 100 electrocardio-gramas (ECG), incluidos 30 de pacientes chagásicos crónicos, que los mismos cardió-logos releyeron después de un intervalo de 6 meses. Las lecturas se hicieron a ciegas,con los trazos enumerados al azar para la primera interpretación y reenumerados dela misma forma para la segunda lectura. Todos los cardiólogos que participaron en elestudio tenían experiencia en la interpretación de ECG de pacientes chagásicos y si-guieron instrucciones impresas para la lectura. La reproducibilidad de las interpreta-ciones se evaluó por medio del índice kappa (k) de concordancia. Los resultados in-dicaron un alto grado de concordancia entre observadores con respecto al diagnósticode gráfico normal frente a anormal (k = 0,66: EE 0,02). En tanto que las interpreta-ciones de algunas categorías de anormalidades ECG fueron reproducibles en altogrado, otras, especialmente las de baja prevalencia, tuvieron grados menores de con-cordancia. La concordancia intraobservador fue en todos casos mayor que la interob-servador. Los resultados de este estudio justifican el uso por especialistas del métodode lectura propuesto para estudios epidemiológicos sobre la enfermedad de Chagas,pero se recomienda interpretar con precaución ciertas categorías de alteraciones elec-trocardiográficas.
RESUMEN
Diagnósticoelectrocardiográfico
en estudios epidemiológicosde la enfermedad de Chagas:
evaluación multicéntrica de un método estandarizado
330 Lázzari et al. • Diagnostic electrocardiography in Chagas’ disease