Developmental stability and adaptive radiation in the Spalax ehrenbergi superspecies in the...
15
Developmental stability and adaptive radiation in the Spalax ehrenbergi superspecies in the Near-East J.-C. AUFFRAY,* S. RENAUD,* P. ALIBERT* & E. NEVO *Institut des Sciences de l’Evolution (UMR 5554 CNRS), CC064, Universite´ Montpellier 2, 34095 Montpellier Cedex 5, France Institute of Evolution, University of Haifa, Mount Carmel, Haifa 31905, Israel Introduction The subterranean mole rat Spalax ehrenbergi superspecies in the Near-East is probably the most documented model of chromosomal speciation associated with an adaptive radiation (see Nevo, 1991, for review; Nevo et al., 1994a,b, 1995). Five chromosomal species present a southward trend of increasing chromosomal number in Israel (2n 52, 54, 58 and 60I) and Northern Egypt (2n 60E) (Fig. 1). Each of these species occurs in distinct climatic regions, the two extremes being repre- sented by the cool and semihumid Golan heights (2n 54) and the arid Negev desert (2n 60I). Stud- ies on numerous characters including physiological, ecological and behavioural traits have shown that each of the chromosomal species of Israel displays distinct adaptive strategies underlying the adaptive radiation into four climatic regimes associated with the chromosomal speciation process within this superspecies. Among the chromosomal species, the genetic diversity increases southwards, toward xeric environments (Nevo & Cleve, 1978; Nevo et al., 1996). More precisely, heterozygosity positively correlates with aridity stress, climatic unpre- dictability and increased steppic conditions (Nevo et al., 1994b, 1995). Recently, the chiasma frequency was shown to increase with chromosomal number among species (Nevo et al., 1996). It has been hypothesized that the adaptation of species to a more xeric environment at Keywords: chromosomal evolution; environmental stress; fluctuating asymmetry; heterozygosity. Abstract Chromosomal species of the mole rat, Spalax ehrenbergi, in Israel have been shown to display distinct adaptive strategies to increasing aridity. This adaptive radiation appeared to be associated with an increase in allozymic heterozy- gosity. In the present study, the developmental stability (DS) estimated by fluctuating asymmetry (FA) of dental traits was used to assess the suitability of habitat and the efficiency of adaptation to local environmental conditions among populations and chromosomal species. Although FA levels were highly heterogeneous among populations, they were not found to differ between species. DS of populations appeared, however, to be impaired at higher altitudes and in indurate soils. Since these environmental features were largely covariant, the effect of each one could not be precisely determined. Interestingly, while aridity is considered as the major selective force acting on populations southwards, DS was not altered under arid conditions, suggesting that mole rat populations were adapted to their local conditions of aridity. However, the cline of aridity is matched to several environmental and genetic clines among which are the increasing heterozygosity and recombination rate among species southwards. In studies of natural populations, the potential complementary effects of environmental and genetics on DS have to be considered and hamper the interpretation of habitat suitability expressed by DS in terms of adaptive strategies. Correspondence: Jean-Christophe Auffray, Institut des Sciences de l’Evo- lution, CC064, Universite ´ Montpellier 2, 34095 Montpellier Cedex 05, France. Tel: (33) 4 67 14 47 82; fax: (33) 4 67 14 36 22; e-mail: [email protected] J. EVOL. BIOL. 12 (1999) 207–221 ª 1999 BLACKWELL SCIENCE LTD 207
-
Upload
u-bourgogne -
Category
Documents
-
view
1 -
download
0
Transcript of Developmental stability and adaptive radiation in the Spalax ehrenbergi superspecies in the...
Developmental stability and adaptive radiationin the Spalax ehrenbergi superspecies in the Near-East
J.-C. AUFFRAY,* S. RENAUD,* P. ALIBERT* & E. NEVO *Institut des Sciences de l'Evolution (UMR 5554 CNRS), CC064, Universite Montpellier 2, 34095 Montpellier Cedex 5, France
Institute of Evolution, University of Haifa, Mount Carmel, Haifa 31905, Israel
Introduction
The subterranean mole rat Spalax ehrenbergi superspecies
in the Near-East is probably the most documented model
of chromosomal speciation associated with an adaptive
radiation (see Nevo, 1991, for review; Nevo et al.,
1994a,b, 1995). Five chromosomal species present a
southward trend of increasing chromosomal number in
Israel (2n � 52, 54, 58 and 60I) and Northern Egypt
(2n � 60E) (Fig. 1). Each of these species occurs in
distinct climatic regions, the two extremes being repre-
sented by the cool and semihumid Golan heights
(2n � 54) and the arid Negev desert (2n � 60I). Stud-
ies on numerous characters including physiological,
ecological and behavioural traits have shown that each
of the chromosomal species of Israel displays distinct
adaptive strategies underlying the adaptive radiation into
four climatic regimes associated with the chromosomal
speciation process within this superspecies. Among the
chromosomal species, the genetic diversity increases
southwards, toward xeric environments (Nevo & Cleve,
1978; Nevo et al., 1996). More precisely, heterozygosity
positively correlates with aridity stress, climatic unpre-
dictability and increased steppic conditions (Nevo et al.,
1994b, 1995). Recently, the chiasma frequency was
shown to increase with chromosomal number among
species (Nevo et al., 1996). It has been hypothesized that
the adaptation of species to a more xeric environment at
Keywords:
chromosomal evolution;
environmental stress;
¯uctuating asymmetry;
heterozygosity.
Abstract
Chromosomal species of the mole rat, Spalax ehrenbergi, in Israel have been
shown to display distinct adaptive strategies to increasing aridity. This adaptive
radiation appeared to be associated with an increase in allozymic heterozy-
gosity. In the present study, the developmental stability (DS) estimated by
¯uctuating asymmetry (FA) of dental traits was used to assess the suitability of
habitat and the ef®ciency of adaptation to local environmental conditions
among populations and chromosomal species. Although FA levels were highly
heterogeneous among populations, they were not found to differ between
species. DS of populations appeared, however, to be impaired at higher
altitudes and in indurate soils. Since these environmental features were
largely covariant, the effect of each one could not be precisely determined.
Interestingly, while aridity is considered as the major selective force acting on
populations southwards, DS was not altered under arid conditions, suggesting
that mole rat populations were adapted to their local conditions of aridity.
However, the cline of aridity is matched to several environmental and genetic
clines among which are the increasing heterozygosity and recombination rate
among species southwards. In studies of natural populations, the potential
complementary effects of environmental and genetics on DS have to be
considered and hamper the interpretation of habitat suitability expressed by
DS in terms of adaptive strategies.
Correspondence: Jean-Christophe Auffray, Institut des Sciences de l'Evo-
lution, CC064, Universite Montpellier 2, 34095 Montpellier Cedex 05,
France.
Tel: (33) 4 67 14 47 82; fax: (33) 4 67 14 36 22;
e-mail: [email protected]
J . E V O L . B I O L . 1 2 ( 1 9 9 9 ) 2 0 7 ± 2 2 1 ã 1 9 9 9 B L A C K W E L L S C I E N C E L T D 207

each step of increasing diploid number could be favoured
by the higher level of genetic diversity ampli®ed and
maintained by the increase in recombination rates
related to higher 2n. This phenomenon does not seem
to be limited to this superspecies: S. leucodon studied in
Turkey clearly exhibits the same trend of increasing
diploid number associated with an increase in genetic
diversity toward arid, contrasted and thus stressful
environments (Nevo et al., 1994b, 1995).
Responses to a new environmental stress at individual
or population levels are required to avoid extinction or to
allow the colonization of new areas characterized by
different environmental features than those of the
original range. Stress responses are complex and could
result in several kinds of adaptation according to the
types of selection induced (see Hoffmann & Parsons,
1991, for review). Apart from stress evasion, adaptation
results from a selection for stress resistance (Hoffmann &
Parsons, 1991) extending the tolerance of the species to
more extreme habitats.
A relevant measure of habitat suitability in wild
populations can be provided by the estimation of the
level of developmental stability of morphological char-
acters (Parsons, 1990a, b; Hoffmann & Parsons, 1991;
Graham et al., 1993). Developmental stability is a com-
ponent of the developmental homeostasis which is
de®ned as the ability of an organism to withstand genetic
and environmental disturbances encountered during
development, so as to produce a predetermined optimum
phenotype (Zakharov, 1989). The other component of
the developmental homeostasis is canalization, referring
to the processes by which consistent phenotypes are
produced despite the variability of genetic and environ-
mental conditions. The developmental stability of organ-
isms, often estimated by ¯uctuating asymmetry (FA)
levels, i.e. the variability of the distributions of right-
minus-left measurements of normally symmetrical bilat-
eral characters, is known to be dependent on both
genetic and environmental conditions (see Parsons,
1990a,b; Markow, 1995, for review). The impairing
effect of environmental stresses, e.g. thermic and audio-
genic stresses, protein deprivation or pollution, on
developmental stability has been established on a wide
variety of organisms (see Parsons, 1990a, for review).
Concerning the genetic basis, it has been shown that the
level of developmental stability of organisms is related to
both genomic heterozygosity and coadaptation (Palmer &
Strobeck, 1986; Clarke, 1993). The role of genomic
coadaptation has clearly been established by studies of
hybrid zones which reported that coadaptive gene com-
plexes in hybrid populations were disrupted inasmuch as
parental taxa were highly divergent (see Graham, 1992,
for review). In contrast, the role of heterozygosity is still
debated (see Clarke, 1993, for review). Several examples
exist in wild populations (Kat, 1982; Vrijenhoek &
Lerman, 1982) in which a cline of heterozygosity
matches that of developmental stability. In these cases,
the developmental instability is believed to be imputable
to the high level of homozygosity subsequent to founder
effects in marginal populations. However, Clarke (1993)
suggested that it could rather result from the ®xation of
deleterious recessive alleles or from environmental
stresses in these nonoptimal habitats and emphasized
that, for developmental stability studies, the `use of
natural populations is fraught with danger unless there is
a good understanding of the genetic structure and
evolutionary history of the populations under
examination.'
The evolutionary history of the S. ehrenbergi super-
species is well known and may be a relevant model to
discuss the effect of genomic and environmental stresses
on the developmental stability. In contrast with the
examples cited above, in which heterozygosity levels in
natural populations decrease towards marginal and
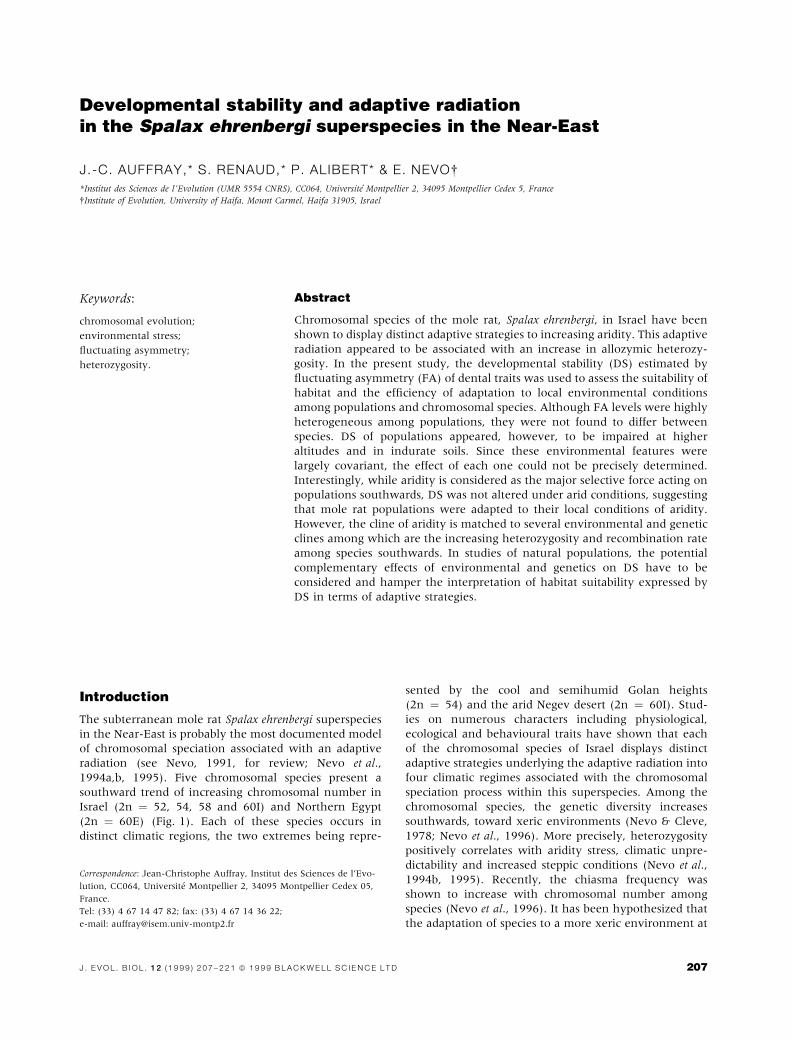
Fig. 1 Distribution of chromosomal species of Spalax ehrenbergi in
Israel and Egypt and sample locations.
208 J.-C. AUFFRAY
J . E V O L . B I O L . 1 2 ( 1 9 9 9 ) 2 0 7 ± 2 2 1 ã 1 9 9 9 B L A C K W E L L S C I E N C E L T D

stressful environments, heterozygosity in the mole rat is
believed to be a major component of adaptation to a
more xeric and unpredictable environment southwards
(Nevo & Beiles, 1988). In order to appraise the suitability
of the various habitats of S. ehrenbergi, we estimated the
level of developmental stability among several natural
populations over the Near-Eastern range of the species.
Additionally, the relationships between the level of
developmental stability and several environmental fea-
tures were studied to determine which of the latter may
be considered as stressful. The quality and the ef®ciency
of the distinct adaptive strategies displayed by popula-
tions and chromosomal species in response to their local
environmental conditions ± with special emphasis on the
increase in aridity southwards ± is then discussed with
respect to the heterozygosity levels previously estimated
for all localities considered in this study (Nevo et al.,
1994a) as well as in the light of the evolutionary history
of the chromosomal radiation.
Materials and methods
Samples
A total of 15 samples (Table 1) grouping 340 individuals
belonging to the ®ve chromosomal species of the Spalax
ehrenbergi superspecies in Israel and Egypt were exam-
ined in this study. These animals represent all those
available in the S. ehrenbergi collection of E. Nevo at the
Institute of Evolution (University of Haifa). Several
authors have underlined the biases related to the use of
museum collection material for studies on developmental
stability (Swaddle et al., 1994, 1995; Simmons et al.,
1995). Particularly, pooling samples of different years or
seasons may confound different environmental condi-
tions. Swaddle et al. (1994) recommended comparing the
subsamples of different years from a single locality before
pooling them into a total sample. As for most subterra-
nean rodents, S. ehrenbergi is dif®cult to capture and
collecting an adequate sample size over the range of the
superspecies in Israel and Northern Egypt requires
several years of trapping. The samples considered in this
study were trapped over 3±10 years (median: 6) from
1979 to 1991 and yielded too small sample sizes to test
the year effect within localities.
Measurements
Fluctuating asymmetry was independently estimated on
eight tooth measurements: the maximum length and
width of the three lower molars (LM1, WM1, LM2,
WM2, LM3, WM3) as routinely used in studies of FA in
rodents (Bader, 1965; Alibert et al., 1994, 1997; Auffray
et al., 1996) and the transversal (TI) and anterioposterior
(API) diameters of the incisor. Molar measurements were
taken using a Nikon measuroscope (0.001 mm) by S.R.
and incisor measurements using a Mituyo calliper
(0.01 mm) by J.-C.A. Some of the teeth were missing
or broken depending on the preservation of skulls, which
resulted in unequal sample sizes (Table 2). In Spalax,
incisors are hypsodont, i.e. palliating wear, they grow
during the lifetime of an individual. We do not have any
evidence on the conservation of FA along the incisor. TI
and API measurements were taken as close as possible to
the incisor gap.
Measurement error appraisal was based on Palmer
(1994). Using individuals from the locality ANZ, all
measurements were taken twice during two different
sessions. A mixed model ANOVAANOVA was performed for each
trait considering the individual as the random effect, the
side as the ®xed one and their interaction. The signi®-
cance of the interaction variance showed that the
difference between sides varied more among individuals
than would have been expected given the size of the
measurement error (Palmer, 1994). Moreover, the results
of these ANOVAANOVAs allow us to express the nondirectional
asymmetry and the error of measurement in terms of the
percentage of the total variance for each character. Error
measurement was performed several months after the
estimation of FA levels reported here. Although some
additional individuals have increased the sample size for
this locality, most incisors have been used for enamel
analyses rendering them unavailable for appraisal of
error. Consequently, the error estimation was based on
37 individuals for the ®rst two molars, 23 for the third
molar and 12 for incisor.
Statistical treatments
The FA is assessed by any estimator of the range of
variability of the right-minus-left (R ) L) distribution of a
symmetrical bilateral character. However, this variability
may not only represent the ¯uctuating asymmetry.
Several preliminary tests have to be conducted before
one may estimate and test levels of FA among characters
and samples. The procedure we followed is largely based
on Palmer & Strobeck (1986) and Palmer (1994) who
exhaustively depicted the successive steps in the estima-
tion and statistical comparison between FA levels among
samples. Here, we have considered eight parameters and
15 samples leading to 120 distributions of (R ) L) and
consequently to 120 FA indices.
Normality assessment. Our samples cumulated several
years of capture. Ross & Robertson (1990) have reported
that some hybrid ant populations exhibit leptokurtic
(R ) L) distributions which may have resulted from
pooling populations characterized by different levels of
developmental stability (Graham, 1992). Without apply-
ing a sequential Bonferroni test, the normality of 23 out
of the 120 distributions was rejected using the Dallal and
Wilkinson approximation of the Lilliefors test (Sokal &
Rohlf, 1995). Additionally, among the remaining normal
distributions, 13 were shown to be skewed and/or
leptokurtic. We considered this result as unsatisfactory
Developmental stability and adaptive radiation 209
J . E V O L . B I O L . 1 2 ( 1 9 9 9 ) 2 0 7 ± 2 2 1 ã 1 9 9 9 B L A C K W E L L S C I E N C E L T D

Tab
le1
Gen
eti
can
den
vir
on
men
tal
vari
able
sfo
rth
esa
mple
sof
Spala
xer
hen
ber
gi.
Sam
ple
size
Genetic
varia
ble
sE
nvi
ronm
enta
lfe
atu
res
Flu
ctu
atin
gG
enetic
AP
(1%
)P
(5%
)H
HE
ALT
TM
TJ
TA
TD
RD
RN
HU
Soil
Localit
yC
od
e2n
asy
mm
etr
yap
pro
ach
Isra
el
Qiry
at
shem
ona
QY
S52
10
14
1.3
06
0.2
78
0.1
11
0.0
35
0.0
47
187
19.0
9.5
26.0
16.5
60
655
49
Hard (T
err
aro
ssa)
Kere
m-B
en-
Zim
ra
KB
Z52
36
18
1.4
44
0.4
17
0.3
06
0.0
56
0.0
64
700
16.5
7.0
23.3
16.3
59
650
49
Hard
(Basa
lt)
Maalo
tM
AA
52
23
13
1.3
89
0.3
61
0.1
39
0.0
39
0.0
49
500
16.8
8.1
23.2
15.1
53
785
53
Hard (T
err
aro
ssa)
Mount
Herm
on
HE
R54
18
12
1.3
06
0.3
06
0.2
20
0.0
44
0.0
63
1300
12.4
3.0
20.1
17.1
65
1450
60
Hard (T
err
aro
ssa)
Quneitr
aQ
UN
54
16
10
1.2
78
0.2
50
0.1
94
0.0
48
0.0
50
950
14.9
6.1
22.7
16.6
65
857
49
Hard
(Basa
lt)
ElA
lE
LA
54
27
12
1.3
61
0.3
33
0.1
39
0.0
40
0.0
48
300
18.7
9.6
26.0
16.4
52
464
45
Hard
(Basa
lt)
Kab
riK
AB
58
20
14
1.5
00
0.4
17
0.3
61
0.0
58
0.0
88
100
20.0
10.5
26.0
15.5
50
600
58
Lig
ht
(Rend
zina)
Zip
pori
ZIP
58
16
15
1.5
56
0.4
12
0.3
33
0.0
76
0.0
94
250
18.5
10.4
26.0
15.6
53
500
48
Lig
ht
(Rend
zina)
Mount
Carm
el
CA
R58
17
15
1.4
72
0.4
72
0.3
89
0.0
98
0.1
21
400
17.0
11.5
24.0
12.5
55
720
58
Lig
ht
(Marl)
A®q
AFI
58
18
11
1.3
06
0.3
06
0.2
22
0.0
62
0.0
66
325
18.8
10.5
26.7
16.2
51
460
44
Hard
(Basa
lt)
Anza
AN
Z60I
26
18
1.4
44
0.3
89
0.1
94
0.0
65
0.0
64
400
18.0
9.6
24.5
14.9
46
630
47
Lig
ht
(Rend
zina)
Jeru
sale
mJE
R60I
28
18
1.6
67
0.5
56
0.4
17
0.0
87
0.1
15
700
17.5
8.7
23.9
15.2
42
500
51
Hard (T
err
aro
ssa)
Sed
e-B
oke
rS
BK
60I
19
11
1.4
17
0.4
17
0.3
89
0.0
92
0.1
10
450
19.1
9.6
25.3
15.7
15
91
36
Lig
ht
(Loess
)
Lahav
LA
H60I
27
16
1.5
28
0.4
72
0.3
61
0.0
70
0.1
00
400
18.8
11.0
26.0
15.0
33
303
45
Lig
ht
(Loess
)
Egyp
t
EL
Ham
man
EG
Y60E
38
17
1.2
50
0.2
50
0.1
94
0.0
29
0.0
38
32
20.2
14.4
26.9
12.5
29
184
63
Lig
ht
(Loess
)
A;
Mean
nu
mber
of
all
ele
sper
locu
s.P(1
%);
Mean
pro
port
ion
of
loci
poly
morp
hic
per
popu
lati
on
.Th
elo
cus
isco
nsi
dere
das
poly
morp
hic
ifth
epro
port
ion
of
the
com
mon
all
ele
isn
ot
gre
ate
rth
an
0.9
9.
P(5
%);
Mean
pro
port
ion
of
loci
poly
morp
hic
per
popu
lati
on
.Th
elo
cus
isco
nsi
dere
das
poly
morp
hic
ifth
epro
port
ion
of
the
com
mon
all
ele
isn
ot
gre
ate
rth
an
0.9
5.
H;
Mean
pro
port
ion
of
loci
hete
rozy
gou
sper
indiv
idu
al.
HE
;G
en
ediv
ers
ity.
Equ
al
toexpect
ed
hete
rozy
gosi
tyu
nder
pan
mix
is.
ALT;
Alt
itu
de
inm
.TM
;M
ean
an
nu
al
tem
pera
ture
in°C
.TJ;
Mean
Jan
uary
tem
pera
ture
in°C
.TA
;M
ean
Au
gu
stte
mpera
ture
in°C
.TD
;Seaso
nal
tem
pera
ture
dif
fere
nce
°C.
RD
;M
ean
nu
mber
of
rain
ydays.
RN
;M
ean
an
nu
al
rain
fall
inm
m.H
U;
Mean
hu
mid
ity
at
14:0
0in
%.
210 J.-C. AUFFRAY
J . E V O L . B I O L . 1 2 ( 1 9 9 9 ) 2 0 7 ± 2 2 1 ã 1 9 9 9 B L A C K W E L L S C I E N C E L T D

from a biological point of view but also from a statistical
one, since we intended to test the population and species
effects by applying ANOVAANOVAs. However, from a biological
point of view, the rejection of normality for the (R ) L)
distributions might be more likely to be the result of the
very heterogeneous levels of tooth wear observed on this
material than of the pooling of samples exhibiting
different directional asymmetry (DA) indices or antisym-
metry (AS) patterns. DA occurs when one side of a
bilateral character is systematically larger than the other,
while in AS, which also corresponds to a systematic
deviation from symmetry, the side that is larger varies at
random among individuals (Palmer, 1994). Conse-
quently, the test of Grubbs (1969; Sokal & Rohlf, 1995)
for detecting outlier observations was applied to each of
the 120 distributions. By using this procedure, 28
individual asymmetries were detected as outliers out of
the total of 2377, i.e. only 1.2% of the whole data set,
and these were excluded from further analyses.
Normality for each of the 120 resulting (R ) L)
distributions was tested using the Dallal and Wilkinson
approximation of the Lilliefors test of normality (Sokal &
Rohlf, 1995). Skewness and kurtosis were estimated and
tested for all these distributions.
Directional asymmetry was tested within each of the 120
distributions of (R ) L) by a t-test, the null hypothesis
being the equality between the mean of distribution and 0.
Size dependence of FA was appraised within and among
populations for each variable. The within-sample depen-
dence was tested by the signi®cance of the linear
regression of jR ) Lj on (R + L)/2. Size dependence
among samples was assessed by the linear regression
between the mean of (R + L)/2 and log(var(R ) L)).
During these preliminary treatments, numerous statis-
tical tests were performed increasing the occurrence of
type 1 error. A sequential Bonferroni technique would
have been too conservative if, as proposed by Palmer
(1994), it was applied over the 120 related statistical tests
performed at each step of these preliminary treatments,
i.e. appraisals of normality, skewness, kurtosis, direction-
al asymmety, and size dependence within samples.
Rather, and in order to establish independently the
response of the traits at each step of this procedure, we
conducted a Bonferroni test on each collection of k � 15
sample-related tests according to Rice (1989).
FA assessment and testing. Following the recommenda-
tions of Palmer (1994), two indices of FA, FA1 and FA4,
were retained in this study. The FA1 index corresponds
to the mean of the jR ) Lj distribution and is considered
as being probably the most generally useful index for
moderate to large sample sizes (Palmer, 1994). FA4
corresponds to the variance of the (R ) L) distribution.
This index is more sensitive to sample size but, in contrast
to FA1, it is unbiased by DA.
The most appropriate way to test the differences of FA
among chromosomal species and localities was to per-
form for each variable a two-level nested ANOVAANOVA on the
jR ) Lj data sets used to calculate FA1. However,
considering all traits together, we also performed a
Levene's test as suggested by Palmer (1994). This test
corresponds to a two-way model ANOVAANOVA performed on
the total jR ) Lj data set, implying locality and trait as
®xed effects and their interaction. To test the differences
among species, the same procedure was applied but the
locality effect was replaced by the chromosomal species
one.
Finally, Kendall's coef®cient of concordance was
applied to test the concordance of FA indices, for FA1
and FA4, respectively, for the eight characters among
populations. This allowed us to establish for each sample
a synthetic ranking Rj of FA level over all traits which
corresponds to the sum of the ranking each sample has
obtained for all parameters.
Relationships between FA, genetic and environmental fea-
tures were appraised among populations by correlation
tests between these features and FA1 indices for each
trait independently. Gamma correlation tests of rank
(Siegel & Castellan, 1988) were also performed between
each genetic or environmental variable and the sum of
ranks Rj. The effect of the hardness of soils was tested by
a Kruskall±Wallis analysis on each FA trait as well as on
Rj, considering two groups of populations, those living in
hard soils (basalt and terra rossa) versus those in light
ones (rendzina, loess and marl). We also tested the
relationships among samples between FA levels consid-
ered trait by trait and heterozygosity estimates considered
locus per locus for 25 polymorphic loci as provided by
Nevo et al. (1994a) for subsamples of those used in the
present study (Ada, Adk, aGpdh, Ald, Ap-1, Ap-2, Est-3, Est-
4, Got-1, Got-2, G6pdh, Hk-2, Idh-1, Ldh-1, Mdh-1, Mdh-2,
Me-1, Me-2, Mpi, Np, Pgi, Pgm-1, Pglm-2, Sdh, 6Pgdh).
When P values are not provided, they are encoded as
follows: *: P < 0.05; **: P < 0.01; ***: P < 0.001.
Results
Preliminary treatments
Following the exclusion of outliers and the application of
the sequential Bonferroni correction per traits, the
normality was rejected for one distribution (trait TI for
sample EGY). Also, three (R ) L) distributions were
skewed and leptokurtic (TI and LM2 for JER and TI for
LAH) and one was leptokurtic (API for CAR) (Table 2). TI
trait thus appeared often to depart from a normal
distribution. However, we did not consider this as
suf®cient evidence to remove TI trait from the data set,
but rather that it required special care.
None of the 120 means (R ) L) statistically differed
from 0 after having applied the sequential Bonferroni test
(Table 2). Similarly, none of the 120 linear regressions of
jR ) Lj on (R + L)/2 was signi®cant, revealing the inde-
pendence of size character and asymmetry within sam-
ples (Table 2). The F value of the linear regression of
Developmental stability and adaptive radiation 211
J . E V O L . B I O L . 1 2 ( 1 9 9 9 ) 2 0 7 ± 2 2 1 ã 1 9 9 9 B L A C K W E L L S C I E N C E L T D

Tab
le2
Deta
iled
pre
sen
tati
on
of
FA
resu
lts
foll
win
gre
com
men
dati
on
sof
Palm
er
(1994)
(see
Table
1an
dte
xt
for
Codes)
.
(R+
L)/
2S
lop
e(R
)L)
|R)
L|
Localit
ym
ean
SE
Var
(FA
4)
mean
(FA
1)
SE
Sp
ecie
scod
eTra
itsn
mean
SE
mean
SE
(a)
´100
´1000
(b)
´1000
Ske
wS
E(c
)K
urt
osi
sS
E(d
)´
100
´100
2n
=52
QY
SA
PI
10
2.4
50.0
53
0.0
56
0.0
95
)2.3
02.1
54.6
20.3
80.6
9)
0.9
61.3
35.3
01.4
5
TI
10
1.8
40.0
32
)0.1
48
0.0
92
)3.4
02.0
24.0
90.1
40.6
9)
1.5
71.3
35.8
01.2
8
LM
18
2.4
80.0
49
)0.0
03
0.0
74
)1.3
81.6
92.3
0)
0.4
60.7
5)
0.8
61.4
84.0
50.8
9
WM
18
2.0
90.0
37
)0.0
14
0.0
90
)0.0
61.2
41.2
41.1
50.7
51.2
61.4
82.4
60.8
3
LM
27
2.2
00.0
45
)0.0
35
0.1
17
)2.7
61.8
32.3
5)
0.2
50.7
9)
0.7
81.5
94.3
91.1
9
WM
27
2.1
90.0
49
0.0
12
0.0
59
)0.6
71.0
60.7
9)
0.7
90.7
90.3
51.5
92.1
90.6
4
LM
34
2.0
90.0
46
0.0
97
0.0
27
)3.9
00.4
8)
0.0
91.6
01.0
12.3
92.6
23.9
00.4
8
WM
35
1.8
80.0
84
0.0
18
0.0
87
)1.8
21.9
41.8
90.2
00.9
1)
2.5
62.0
03.4
61.2
7
Rj
59
67
KB
ZA
PI
30
2.4
80.0
41
0.0
16
0.0
31
)0.5
70.9
62.7
80.0
70.4
30.2
50.8
33.9
00.6
4
TI
30
1.8
40.0
36
0.0
08
0.0
30
)0.7
30.7
9*
1.8
70.8
50.4
30.2
70.8
33.0
70.5
6
LM
136
2.4
80.0
23
0.0
78
0.0
42
)0.7
80.8
42.5
50.1
90.3
90.9
60.7
73.6
50.5
9
WM
135
2.0
10.0
35
0.0
17
0.0
25
1.7
70.9
43.0
8)
0.0
10.4
0)
0.8
70.7
84.9
50.5
0
LM
236
2.1
80.0
20
0.0
28
0.0
53
0.6
60.9
53.2
70.3
60.3
90.8
10.7
74.4
20.6
0
WM
236
2.0
90.0
42
)0.0
26
0.0
18
)0.5
90.7
21.8
50.5
70.3
9)
0.2
60.7
73.3
20.4
6
LM
327
2.0
80.0
36
0.0
14
0.0
36
2.1
70.9
22.2
8)
0.1
90.4
51.3
00.8
73.9
80.6
5
WM
328
1.8
50.0
33
)0.0
51
0.0
37
)2.1
10.8
92.2
4)
0.0
20.4
41.2
40.8
63.8
60.6
4
Rj
79
79
MA
AA
PI
19
2.3
50.0
53
0.0
04
0.0
37
)1.7
91.2
12.7
6)
0.2
80.5
22.1
01.0
14.2
10.8
0
TI
19
1.7
30.0
32
)0.0
15
0.0
35
)1.0
00.8
51.3
7)
0.1
40.5
2)
0.9
61.0
13.2
10.4
5
LM
120
2.4
30.0
23
0.0
32
0.0
41
)0.9
20.8
31.3
7)
0.7
10.5
1)
0.2
80.9
93.2
60.4
1
WM
120
2.0
10.0
27
)0.0
39
0.0
55
1.3
61.0
42.1
5)
0.1
20.5
1)
0.7
80.9
93.8
00.6
4
LM
222
2.1
00.0
18
0.0
33
0.1
07
)1.5
91.3
33.9
00.7
50.4
91.1
00.9
54.8
20.8
9
WM
222
2.0
90.0
26
0.0
62
0.0
39
0.3
10.8
31.5
1)
0.4
00.4
9)
0.1
70.9
53.1
10.4
8
LM
320
2.0
90.0
37
0.0
11
0.0
25
0.3
50.6
90.9
5)
0.5
60.5
1)
0.4
60.9
92.4
90.3
9
WM
320
1.8
40.0
26
)0.0
62
0.0
66
)1.0
71.2
02.8
70.7
50.5
1)
0.0
80.9
94.2
20.7
5
Rj
62
66
2n
=54
HE
RA
PI
17
2.5
40.0
43
0.1
36
0.0
64
)1.0
61.9
46.3
8)
0.3
20.5
50.4
91.0
66.1
21.2
2
TI
17
1.9
00.0
31
)0.0
37
0.0
52
0.0
61.0
51.8
8)
0.8
90.5
50.4
01.0
63.1
20.7
1
LM
117
2.5
60.0
21
0.0
42
0.1
12
)3.3
01.5
44.0
3)
0.0
30.5
5)
0.6
71.0
65.9
90.9
0
WM
116
2.1
40.0
26
)0.0
19
0.0
76
)1.6
71.1
32.0
50.4
30.5
6)
0.6
21.0
93.7
40.7
3
LM
216
2.1
90.0
25
)0.0
43
0.0
55
)1.5
90.9
41.4
20.1
00.5
6)
1.4
61.0
93.4
30.5
2
WM
217
2.2
50.0
32
0.0
63
0.0
48
)0.9
91.1
72.3
1)
0.1
30.5
5)
0.3
91.0
64.0
40.6
4
LM
313
2.2
00.0
44
0.0
00
0.0
53
)2.3
91.0
41.4
00.2
80.6
2)
0.8
01.1
93.3
60.7
8
WM
313
1.9
80.0
35
)0.0
52
0.0
51
)0.4
21.0
11.3
3)
0.4
50.6
20.1
51.1
92.7
80.6
2
Rj
68
70
QU
NA
PI
16
2.6
80.0
54
0.0
58
0.0
49
)1.8
11.8
85.6
80.5
10.5
60.0
21.0
96.4
41.0
0
TI
16
1.9
40.0
40
0.0
76
0.0
30
)0.3
80.9
31.3
7)
0.3
70.5
6)
0.4
91.0
92.8
80.5
6
LM
116
2.6
00.0
28
0.0
47
0.0
97
)4.3
11.5
84.0
1)
0.5
50.5
6)
0.2
61.0
96.3
61.0
2
WM
116
2.1
80.0
42
)0.0
14
0.0
77
1.4
91.8
25.3
21.0
10.5
61.7
51.0
95.4
41.2
2
212 J.-C. AUFFRAY
J . E V O L . B I O L . 1 2 ( 1 9 9 9 ) 2 0 7 ± 2 2 1 ã 1 9 9 9 B L A C K W E L L S C I E N C E L T D

LM
216
2.2
90.0
31
0.0
79
0.0
66
)0.2
11.2
52.5
0)
0.3
80.5
60.8
01.0
93.7
10.8
0
WM
216
2.2
60.0
49
)0.0
08
0.0
54
)3.1
71.2
62.5
50.5
40.5
6)
0.1
31.0
94.4
10.9
8
LM
316
2.2
80.0
33
0.0
05
0.0
59
0.5
91.2
32.4
40.4
00.5
60.1
31.0
93.9
00.7
3
WM
316
2.0
50.0
33
)0.0
30
0.0
35
)0.4
50.9
21.3
70.0
50.5
6)
0.9
31.0
93.1
50.4
5
Rj
87
88
`E
LA
AP
I24
2.6
10.0
48
0.0
37
0.0
33
1.0
01.2
63.8
1)
0.7
00.4
70.4
30.9
24.9
20.7
6
TI
24
1.9
20.0
31
0.0
57
0.0
26
)0.2
10.7
01.1
9)
0.0
20.4
70.0
60.9
22.6
30.4
5
LM
125
2.6
00.0
26
)0.0
48
0.0
38
)1.3
40.8
01.6
1)
0.2
50.4
6)
0.2
80.9
03.4
20.4
8
WM
124
2.1
70.0
33
)0.0
31
0.0
55
1.6
81.2
23.5
5)
0.7
40.4
70.8
10.9
24.5
10.8
5
LM
223
2.2
70.0
19
)0.0
38
0.0
45
0.0
20.8
01.4
60.2
80.4
8)
0.7
00.9
33.2
10.4
1
WM
222
2.2
80.0
30
)0.0
71
0.0
32
)0.6
70.7
91.3
80.1
70.4
9)
0.2
70.9
52.9
70.4
8
LM
320
2.2
60.0
40
)0.0
09
0.0
30
)0.6
60.8
01.2
7)
0.8
00.5
10.8
30.9
92.7
80.5
0
WM
321
2.0
30.0
29
0.0
50
0.0
40
)2.0
00.9
01.6
9)
0.4
30.5
0)
0.6
60.9
73.8
30.5
2
Rj
55
54
2n
=58
KA
BA
PI
19
2.3
40.0
63
0.0
36
0.0
33
0.3
21.2
12.8
00.6
10.5
22.1
41.0
13.5
80.8
8
TI
19
1.7
40.0
53
0.0
35
0.0
23
1.7
90.7
81.1
60.2
70.5
20.5
31.0
13.0
50.5
2
LM
119
2.4
90.0
29
0.0
17
0.0
40
)1.0
90.6
80.8
80.4
90.5
20.0
61.0
12.3
40.4
8
WM
120
2.0
10.0
40
)0.0
13
0.0
32
0.5
80.8
51.4
6)
0.5
10.5
1)
0.4
80.9
92.9
40.5
4
LM
219
2.1
60.0
23
)0.0
32
0.0
41
)1.4
70.8
81.4
8)
0.2
70.5
2)
1.4
21.0
13.6
40.4
0
WM
220
2.0
90.0
42
0.0
13
0.0
24
0.9
40.6
50.8
60.2
30.5
1)
0.1
10.9
92.3
50.4
3
LM
320
2.1
50.0
44
)0.0
24
0.0
53
)1.9
61.3
83.8
00.5
00.5
10.2
70.9
94.6
50.9
8
WM
320
1.8
60.0
39
)0.0
42
0.0
51
)2.4
31.3
83.8
20.0
30.5
1)
1.0
90.9
95.2
60.8
7
Rj
56
57
ZIP
AP
I14
2.3
20.0
60
0.0
24
0.0
31
1.0
71.1
21.7
51.2
90.6
01.3
81.1
53.5
00.6
3
TI
15
1.6
90.0
37
0.0
43
0.0
38
0.3
30.9
01.2
1)
0.5
60.5
8)
0.5
01.1
22.7
30.5
3
LM
115
2.4
10.0
31
)0.0
06
0.0
64
2.7
91.0
61.6
70.2
00.5
8)
1.1
81.1
24.1
20.6
8
WM
115
1.9
80.0
28
)0.0
30
0.0
62
0.0
80.9
51.1
1)
0.7
30.6
01.2
51.1
52.6
80.6
3
LM
215
2.1
10.0
30
)0.0
09
0.0
81
)1.6
21.1
82.0
90.9
80.5
81.7
61.1
23.3
70.8
8
WM
215
2.0
70.0
25
0.0
43
0.0
39
0.9
70.7
30.8
00.2
00.5
8)
1.0
61.1
22.5
40.3
7
LM
313
2.1
40.0
39
)0.0
10
0.0
52
)0.8
51.2
11.9
1)
0.2
00.6
2)
0.6
11.1
93.6
00.6
7
WM
312
1.9
30.0
37
0.0
39
0.0
35
)0.1
00.9
00.9
8)
1.0
80.6
4)
0.0
41.2
32.6
20.4
4
Rj
38
41
CA
RA
PI
13
2.3
10.0
52
)0.0
31
0.0
70
1.1
51.6
03.3
3)
1.7
40.6
24.5
21.1
9**
3.7
71.2
2
TI
14
1.6
80.0
32
)0.0
17
0.0
62
0.1
40.8
91.1
1)
0.3
40.6
0)
0.1
01.1
52.2
90.6
2
LM
116
2.4
70.0
25
)0.0
15
0.0
64
)1.6
91.2
42.4
4)
0.3
60.5
6)
0.7
81.0
94.5
10.6
0
WM
114
1.9
70.0
36
)0.0
25
0.0
26
1.3
80.5
00.7
51.5
00.5
82.6
71.1
21.9
50.3
3
LM
216
2.0
90.0
19
)0.0
99
0.1
22
)0.3
11.3
02.6
90.7
50.5
61.8
61.0
93.6
60.8
9
WM
216
2.0
60.0
35
0.0
00
0.0
76
1.8
01.3
72.9
9)
0.6
50.5
60.3
91.0
94.0
50.9
9
LM
314
2.1
20.0
41
)0.1
02
0.0
62
1.4
31.2
52.2
0)
0.5
70.6
00.4
21.1
53.2
40.9
6
WM
313
1.8
80.0
41
0.0
33
0.0
36
)0.9
10.8
00.8
3)
1.5
00.6
22.9
01.1
92.3
10.5
1
Rj
57
46
AFI
AP
I18
2.4
10.0
51
0.0
48
0.0
29
0.1
11.0
31.8
90.3
30.5
4)
0.7
11.0
43.3
30.6
3
TI
17
1.7
60.0
44
)0.0
06
0.0
26
1.1
80.6
40.7
0)
0.9
20.5
50.1
31.0
62.0
00.5
0
LM
117
2.5
00.0
35
0.0
47
0.0
40
)1.9
50.9
41.5
1)
0.0
60.5
5)
0.3
71.0
63.6
00.5
6
WM
118
2.0
20.0
52
)0.0
35
0.0
45
2.0
41.4
43.7
3)
0.6
30.5
4)
0.6
01.0
44.8
90.9
5
Developmental stability and adaptive radiation 213
J . E V O L . B I O L . 1 2 ( 1 9 9 9 ) 2 0 7 ± 2 2 1 ã 1 9 9 9 B L A C K W E L L S C I E N C E L T D

Tab
le2
(con
tin
ued)
(R+
L)/
2S
lop
e(R
)L)
|R)
L|
Localit
ym
ean
SE
mean
SE
(a)
mean
SE
Var
(FA
4)
mean
(FA
1)
SE
Sp
ecie
scod
eTra
itsn
´100
´1000
(b)
´1000
Ske
wS
E(c
)K
urt
osi
sS
E(d
)´
100
´100
LM
218
2.2
00.0
27
0.1
07
0.0
40
)0.4
80.9
31.5
6)
0.1
00.5
4)
0.2
81.0
43.2
10.5
2
WM
218
2.1
20.0
53
0.0
41
0.0
36
)1.3
31.3
43.2
5)
0.5
60.5
40.4
71.0
44.6
60.8
0
LM
316
2.2
30.0
50
)0.0
45
0.0
63
)1.5
71.6
54.3
4)
0.0
40.5
60.9
31.0
94.6
71.1
9
WM
313
1.9
60.0
42
0.0
32
0.0
60
)2.7
91.4
42.7
1)
0.6
50.6
20.2
61.1
94.9
30.8
4
Rj
71
68
2n
=60
AN
ZA
PI
23
2.4
90.0
42
0.0
34
0.0
29
1.5
20.8
41.6
3)
0.7
20.4
80.7
90.9
33.2
60.5
7
(Isra
el)
TI
24
1.8
20.0
29
0.0
69
0.0
41
0.0
00.9
52.1
7)
0.0
10.4
70.0
40.9
23.5
80.5
9
LM
126
2.4
50.0
18
0.0
65
0.0
44
)0.3
20.7
01.2
9)
0.1
30.4
60.0
10.8
92.8
60.4
2
WM
126
1.9
30.0
33
0.0
32
0.0
43
1.2
41.0
42.8
2)
0.6
50.4
60.7
90.8
94.0
70.7
0
LM
226
2.1
60.0
18
0.0
04
0.0
44
)0.4
30.6
61.1
30.1
60.4
6)
0.3
50.8
92.7
30.3
8
WM
226
2.0
00.0
32
)0.0
19
0.0
31
0.5
80.7
31.3
91.0
50.4
61.8
50.8
92.8
00.4
8
LM
323
2.0
40.0
41
)0.0
63
0.0
39
0.1
91.2
63.6
71.5
00.4
82.4
10.9
34.3
90.8
5
WM
322
1.7
90.0
30
0.0
14
0.0
26
)1.2
80.5
80.7
3)
0.0
30.4
9)
1.5
60.9
52.4
90.3
4
Rj
49
45
JER
AP
I23
2.3
60.0
29
0.1
17
0.0
47
1.0
91.2
13.3
5)
0.1
70.4
8)
0.3
00.9
34.7
40.7
0
TI
23
1.7
80.0
48
0.0
55
0.0
41
0.5
71.1
63.1
1)
1.8
50.4
8**
4.6
90.9
3**
3.6
10.8
8
LM
123
2.4
10.0
25
)0.0
66
0.0
63
0.4
71.3
03.8
90.6
20.4
8)
0.2
20.9
35.0
30.7
4
WM
123
1.9
70.0
30
0.0
81
0.0
49
2.0
51.0
42.4
7)
0.4
00.4
80.8
80.9
34.1
30.7
0
LM
224
2.1
40.0
17
0.3
01
0.1
05
2.0
61.1
93.3
9)
1.8
20.4
7**
5.4
80.9
2**
3.7
50.9
9
WM
224
2.0
50.0
25
0.0
24
0.0
52
)0.6
61.1
12.9
30.6
90.4
70.2
80.9
24.4
30.6
2
LM
321
2.1
10.0
32
0.0
28
0.0
81
0.6
01.6
75.8
40.0
40.5
01.0
60.9
75.4
81.1
4
WM
321
1.8
20.0
24
0.0
61
0.0
91
)3.5
71.2
13.0
90.9
20.5
00.6
20.9
74.8
40.9
7
Rj
101
100
SB
KA
PI
15
2.4
00.0
81
)0.0
22
0.0
16
1.0
71.0
21.5
60.6
30.5
8)
0.2
61.1
23.4
70.5
2
TI
15
1.8
30.0
56
)0.0
13
0.0
23
0.8
00.7
10.7
5)
0.4
10.5
8)
0.5
81.1
22.1
30.4
7
LM
118
2.4
40.0
34
0.0
42
0.0
69
)1.9
11.3
93.4
80.6
80.5
4)
0.2
31.0
44.6
30.9
4
WM
118
1.9
10.0
37
)0.0
10
0.0
50
)0.7
51.2
42.7
80.2
50.5
4)
0.7
01.0
44.1
70.7
4
LM
218
2.2
00.0
21
)0.0
83
0.0
88
)0.6
91.2
82.9
3)
0.0
80.5
4)
0.4
81.0
44.2
90.7
6
WM
218
2.0
50.0
34
0.0
19
0.0
54
0.6
61.2
62.8
40.5
00.5
4)
0.0
81.0
44.2
40.7
4
LM
313
2.0
60.0
34
)0.0
78
0.0
75
)0.6
81.3
12.2
51.2
10.6
21.0
31.1
93.4
00.9
0
WM
313
1.8
40.0
53
0.0
63
0.0
73
1.5
01.9
95.1
5)
0.6
70.6
20.9
91.1
95.3
81.3
2
Rj
73
74
LA
HA
PI
20
2.3
80.0
50
)0.0
05
0.0
29
)0.9
51.1
12.4
50.2
90.5
1)
0.2
90.9
93.9
50.6
7
TI
20
1.8
00.0
40
)0.0
09
0.0
61
)1.0
51.1
82.7
91.9
60.5
1**
4.0
10.9
9**
3.3
50.9
3
LM
126
2.3
90.0
16
)0.0
05
0.0
76
0.1
20.9
92.5
70.3
00.4
6)
0.4
50.8
93.9
90.5
9
WM
124
1.9
10.0
29
0.0
50
0.0
27
1.5
00.6
61.0
40.1
90.4
7)
0.0
70.9
22.9
30.4
0
LM
224
2.1
00.0
17
)0.0
48
0.0
52
)1.3
70.6
61.0
5)
0.2
10.4
70.1
10.9
22.7
70.4
3
WM
224
2.0
00.0
29
0.0
05
0.0
40
)0.8
50.7
51.3
41.0
40.4
70.6
40.9
22.6
50.5
3
LM
314
2.0
80.0
49
)0.0
33
0.0
44
)1.3
11.1
11.7
4)
0.0
50.6
00.3
61.1
53.2
10.7
6
WM
315
1.8
50.0
31
0.1
31
0.0
49
)1.7
11.0
61.6
90.5
00.5
80.3
11.1
23.5
30.6
7
Rj
49
50
214 J.-C. AUFFRAY
J . E V O L . B I O L . 1 2 ( 1 9 9 9 ) 2 0 7 ± 2 2 1 ã 1 9 9 9 B L A C K W E L L S C I E N C E L T D

log(var(R ) L)) on mean((R + L)/2) was signi®cant only
for API (F � 5.58, d.f. 1,13, P � 0.034). Applying the
Fisher method for multiple independent tests (Manly,
1985) (v2 � 17.5, d.f. 16, P � 0.35), no signi®cant size
dependence of FA among traits was shown.
The interaction term of mixed model ANOVAANOVAs to test the
error of measurement was highly signi®cant for all traits
(10)29 < P < 10)5) indicating that the difference between
sides varied much more among individuals that would
have been expected given the measurement error. Over
all traits and on the subsample used for the estimation of
measurement error, the nondirectional asymmetry ex-
plains between 1.61% (trait API) and 5.66% (LM1) of the
total variance, while the error of measurement accounts
for 0.14% (API) and 1.5% (LM1).
FA levels among populations and chromosomalspecies
Estimates of FA1 and FA4 for all localities are provided in
Table 2. The unbalanced and two-level nested (locality
within chromosomal species) ANOVAANOVA on the jR ) Lj data
set indicated that FA levels were strongly heterogeneous
among localities (Table 3). The chromosomal species
effect, even if signi®cant for the trait API, may not be
considered as signi®cant over all traits (after applying the
Fisher method for combining independent tests), where-
as the population effect remained highly signi®cant
(Table 3).
The Levene's test using locality and trait has shown
that these effects and their interaction were signi®cant
(locality: F � 2.95***, d.f. 14,2257; trait: F � 4.24***,
d.f. 7,2257; interaction: F � 1.48***, d.f. 98,2257).
When the species effect replaced the locality effect, it
was not signi®cant (species: F � 2.37 ns, d.f. 4,2345;
trait: F � 4.62***, d.f. 7,2345; interaction: F � 2.32 ns,
d.f. 28,2345).
Additionally, Bonferroni±Dunn tests performed on
each pair of localities showed that some of the popula-
tions exhibiting the highest levels of FA (QUN (2n � 54)
and JER (2n � 60I)) were signi®cantly different from
those exhibiting the lowest levels (LAH (2n � 60I), ZIP
(2n � 58), CAR (2n � 58), ANZ (2n � 60I) and EGY
(2n � 60E)). The pattern of signi®cantly differing pop-
ulations showed no species-related pattern of develop-
mental stability.
FA levels among traits
The signi®cance of the trait effect at the preceeding step of
the treatments indicated that some traits were better than
others for revealing differences among localities. The plot
of FA levels established over the all-individual dataset
(not shown here) clearly indicated that FA exhibited by
the TI trait was the lowest. It remains dif®cult, however,
to relate the relatively important level of statistical2n
=60
(Egyp
t)E
GY
AP
I37
2.3
70.0
49
0.0
32
0.0
11
)0.0
50.5
71.2
10.7
40.3
90.6
10.7
62.7
00.3
5
TI
37
1.7
50.0
36
0.0
32
0.0
11
)0.2
40.4
0*
0.5
90.8
90.3
91.0
30.7
61.7
60.2
8
LM
134
2.5
60.0
22
0.1
24
0.0
49
0.0
41.0
94.0
40.1
10.4
0)
0.0
50.7
94.9
10.6
8
WM
134
1.8
80.0
19
0.0
10
0.0
34
0.3
90.6
31.3
30.1
20.4
0)
0.1
00.7
92.9
20.3
7
LM
235
2.2
00.0
11
0.0
84
0.0
81
0.4
70.8
12.3
2)
0.5
90.4
00.8
70.7
83.6
70.5
2
WM
234
2.0
60.0
22
0.0
57
0.0
42
1.6
30.8
22.2
7)
0.1
50.4
00.0
90.7
93.9
60.5
2
LM
328
2.1
90.0
17
)0.0
67
0.0
69
)0.3
71.0
83.2
6)
0.3
20.4
40.0
20.8
64.6
20.6
1
WM
328
1.8
70.0
21
0.0
08
0.0
41
)1.3
90.7
61.6
1)
0.2
70.4
4)
0.7
50.8
63.5
10.4
3
Rj
56
55
(a)
Sig
ni®
can
ceof
F-V
alu
e(R
egre
ssio
nof
|R)
L|on
(R+
L)/
2).
(b)
Sig
ni®
can
ceof
the
norm
ali
tyte
st(D
all
al
an
dW
ilkin
son
appro
xim
ati
on
toLil
liefo
rste
st).
(c)
Sig
ni®
can
ceof
Skew
ness
.
(d)
Sig
ni®
can
ceof
Ku
rtosi
s.)
no
test
ed
(sm
all
sam
ple
size
).*P
<0.0
5;
**P
<0.0
1.
Developmental stability and adaptive radiation 215
J . E V O L . B I O L . 1 2 ( 1 9 9 9 ) 2 0 7 ± 2 2 1 ã 1 9 9 9 B L A C K W E L L S C I E N C E L T D

rejection for normality, skewness and kurtosis exhibited
by this trait with its general lower level of FA.
Kendall's tests of concordance have revealed that the
rankings of populations based on FA1 were not inde-
pendent among traits (W � 0.22, v2 � 24.38, d.f. 14,
P � 0.041) but this pattern remained slightly nonsignif-
icant using FA4 (W � 0.21, v2 � 23.01, d.f. 14, P �0.060). However, when the TI trait, which exhibited the
lowest level of FA established over the all-individual data
set, was excluded from this analysis, the dependence
among the remaining traits strongly increased using both
FA1 (W � 0.27, v2 � 30.35, d.f. 14, P � 0.007) and
FA4 (W � 0.26, v2 � 27.53, d.f. 14, P � 0.016). The
global signi®cance of the Kendall test of concordance
conducted on the eight original traits allowed us to
consider the resulting sum of ranking per population as a
synthetic rank (Rj) of FA level obtained by each popu-
lation over the eight traits (Table 2). FA was assessed by
two indices, and thus two synthetic rankings were
obtained, respectively, based on FA1 and FA4. The rank
correlation between these two rankings was highly
signi®cant (Gamma test: G � 0.88; P � 0.001). Conse-
quently, only FA1 which presented a higher concordance
between traits was considered in further analyses.
Relationships between genetic diversityand environmental features
Nevo et al. (1994a), using a stepwise model of multiple
regression analysis, found that, among numerous envi-
ronmental features, the number of rainy days per year
(RD) correlated most closely with the indicators of
genetic diversity. This was established on 12 populations
from Israel. In our study, 14 populations from Israel and
one from Egypt were considered and the relationships
between environmental features and genetic diversity
had to be reassessed. None of the correlation statistics
obtained between all the genetic diversity indicators and
all the environmental features was found to be signi®-
cant (Table 4). Stepwise models of multiple regression
analysis (not reported here) showed that for most of the
genetic diversity indicators (P1%, P5%, H and HE), RD
Table 3 Nested ANOVAANOVAs on jRÿ Lj data sets per trait (Fisher Method: see text; Fs¢, d.f¢. see Sokal & Rohlf, 1995).
Species Locality
Traits d.f. num d.f.¢ Fs ¢ P d.f. num d.f. Fs P
API 4 3.8 10.55 0.02 10 283 0.62 0.79
TI 4 6.7 2.27 0.17 10 285 1.29 0.23
LM1 4 8.2 0.99 0.46 10 301 2.34 0.01
WM1 4 7.7 1.23 0.37 10 296 1.82 0.06
LM2 4 2.7 5.71 0.11 10 300 0.46 0.91
WM1 4 8.0 0.27 0.89 10 300 2.01 0.03
LM3 4 7.5 0.61 0.67 10 299 1.59 0.11
WM3 4 8.4 0.09 0.98 10 300 2.59 0.01
Fisher method: v2 = 20.12 v2 = 40.13
P = 0.21 P = 0.0007
Table 4 Pearson correlation between environmental and genetic variables.
Environmental variables
Genetic variables ALT TJ TA TM TD RN RD HU
Including EGY
A )0.07 0.12 0.06 0.17 )0.15 )0.21 )0.21 )0.15
P1% )0.01 0.12 )0.01 0.12 )0.24 )0.22 )0.30 )0.16
P5% 0.02 0.17 0.03 0.12 )0.28 )0.29 )0.40 )0.09
H 0.02 0.15 0.02 0.08 )0.26 )0.27 )0.35 )0.34
HE 0.00 0.16 0.03 0.11 )0.27 )0.24 )0.36 )0.19
Excluding EGY
A )0.25 0.42 0.21 0.35 )0.52 )0.41 )0.43 0.05
P1% )0.18 0.43 0.13 0.29 )0.64* )0.42 )0.53 0.04
P5% )0.06 0.32 0.10 0.20 )0.49 )0.39 )0.53 0.00
H )0.14 0.47 0.18 0.24 )0.67** )0.48 )0.60* )0.18
HE )0.15 0.46 0.17 0.26 )0.65* )0.42 )0.59* )0.02
*: P < 0.05; **: P < 0.01.
216 J.-C. AUFFRAY
J . E V O L . B I O L . 1 2 ( 1 9 9 9 ) 2 0 7 ± 2 2 1 ã 1 9 9 9 B L A C K W E L L S C I E N C E L T D

was the ®rst factor included in the model, but in all these
cases the multiple regression remained nonsigni®cant.
The addition of the Egyptian population could have been
responsible for the discrepancy between Nevo's results
(Nevo et al., 1994a) and ours. When the Egyptian
population was excluded from the data set, the
correlation statistics appeared to be signi®cant between
P1%, H and He indicators with RD and TD (Table 4). This
analysis supported the assumption of Nevo et al. (1994a)
that aridity and the genetic diversity were signi®cantly
correlated among Israeli localities. However, the inclu-
sion of the Egyptian locality (EGY), for which the level of
heterozygosity was lower than expected on the basis of
the Israeli pattern, altered the relationships between
aridity and genetic diversity.
Relationships of FA levels with environmentalfeatures
Gamma tests of rank correlation between environmental
variables and Rj (Table 5) indicated that FA was
positively correlated with altitude and seasonal temper-
ature differences (ALT and TD) and negatively with the
mean temperature in January (TJ) (Fig. 2). The discrep-
ancy between the signs of the correlation was expected
since ALT and TD were negatively correlated with TJ
(ALT±TJ: r � )0.90**; TD±TJ: r � )0.74**).
The survey of the relationship between FA levels for
each trait with all the environmental features showed
that API is correlated with seven of the eight environ-
mental features considered. Aditionally, Kruskall±Wallis
tests performed on FA traits indicated that the level of FA
displayed by the API trait and Rj were dependent on soil
induration: the harder the soil, the higher the level of FA
(Table 5). Although, the effects of environmental stresses
on FA levels were observed, their origin could not be
ascribed to climatic or soil features.
Table 5 (a) Pearson coef®cients of correlation of genetic and environmental variables with FA indices (except for Rj: Gamma rank
correlation); (b) Kruskall±Wallis H statistics for soil effect analyses on FA estimator.
Fluctuating asymmetry estimators
r G
API TI LM1 WM1 LM2 WM2 LM3 WM3 Rj
(a)
Genetic vairables
A )0.25 0.10 )0.27 )0.23 )0.14 )0.21 0.20 0.13 )0.21
P1% )0.28 0.01 )0.24 )0.22 )0.09 )0.06 0.12 0.18 )0.09
P5% )0.32 )0.28 0.04 )0.22 )0.11 0.19 0.26 0.24 0.07
H )0.30 )0.24 0.02 )0.16 )0.17 0.26 0.12 0.08 )0.08
HE )0.25 )0.16 0.01 )0.32 )0.14 0.15 0.11 0.15 )0.02
Environmental variables
ALT 0.71** 0.05 0.65** 0.48 0.06 0.46 )0.13 )0.20 0.43*
TJ )0.77*** )0.27 )0.40 )0.50 )0.20 )0.17 0.21 0.10 )0.47*
TA )0.64** )0.11 )0.50 )0.29 )0.22 )0.31 0.22 0.30 )0.31
TM )0.72** )0.07 )0.60* )0.33 )0.09 )0.36 0.26 0.41 )0.17
TD 0.62* 0.38 0.08 0.56* 0.08 )0.10 )0.10 0.22 0.39*
RN 0.68** 0.28 0.31 0.08 0.06 0.05 )0.20 )0.43 0.11
RD 0.61* 0.36 0.10 0.13 0.08 )0.13 )0.12 )0.44 0.15
HU 0.06 )0.05 0.17 )0.43 0.06 0.01 0.16 )0.32 0.02
(b)
Soil (1:Hard; 2:light) 7.34** 0.68 0.12 1.68 2.34 2.00 0.68 0.02 5.03*
*: P < 0.05; **: P < 0.01; ***P < 0.001
Fig. 2 Plots of synthetic levels of ¯uctuating asymmetry (Rj) for
populations against altitude (ALT) and seasonal difference of tem-
perature (TD). Closed circles: populations in hard soil; open circles:
populations in light soil.
Developmental stability and adaptive radiation 217
J . E V O L . B I O L . 1 2 ( 1 9 9 9 ) 2 0 7 ± 2 2 1 ã 1 9 9 9 B L A C K W E L L S C I E N C E L T D
Relationships between FA levels and heterozygosity
Testing the rank correlation between FA estimators and
each of the genetic diversity estimators revealed no
statistical signi®cance considering either each FA trait or
each Rj. Testing the relationships between each of the
eight FA estimators and locus by locus heterozygosity, for
the 25 polymorphic ones, led to 200 correlation coef®-
cients. Applying one-tailed tests for the expected nega-
tive correlation between FA and heterozygosity led to as
few as seven signi®cant statistics, which could de®ni-
tively be imputable to type 1 error. These results clearly
supported the lack of statistical relationships between
heterozygosity and FA levels in our case.
Discussion
Developmental stability and environmental features
Adaptive radiation within the chromosomal superspecies
of S. ehrenbergi in Israel has been suggested to involve
speciation in semiarid and arid climates by physiological
adaptation (metabolism, kidney conservation of water)
along with multiple morphological, ecological and be-
havioural adaptive syndromes to increasing aridity
(Yahav et al., 1988, 1989; Nevo, 1991; Ganem & Nevo,
1996). Developmental stability estimated by the synthet-
ic and relative level of FA, Rj, based on all tooth traits and
used as a measure of habitat suitability in the mole rat
populations, was not found to be related to the global
climatic pattern of increasing aridity southwards. While
aridity is considered as the major selective force acting on
populations (and species) of the mole rat southwards, the
lack of a relationship between developmental stability
and aridity suggested that adaptation to this peculiar
environmental trait is fairly achieved with no cost in
terms of developmental stability.
In contrast, developmental stability appeared to be
impaired by one or several covarying climatic features,
i.e. altitude, mean January temperature and seasonal
temperature difference and by soil induration. Although
a global relationship between environment and FA was
revealed among mole rat populations, it remained very
dif®cult to weight the respective effects of altitude,
temperature and soil on developmental stability, all
these features being potentially stressful.
In a study on body size variation among 44 Israeli
populations of S. ehrenbergi, altitude, rather than aridity,
has been found to be the major determinant of body
weight and length, verifying Bergmann's rule (Nevo
et al., 1988). The increase of size under cooler environ-
ments is usually considered as a physiological adaptation
limiting the loss of heat (Hoffmann & Parsons, 1991). The
fact that higher altitudes and lower temperatures impair
developmental stability in the mole rat could indicate a
certain maladaption to cooler environments despite
Bergmann's rule. It may also express the cost in high-
altitude populations of the global adaptation to xericity
for this Near-Eastern subterranean rodent: adaptation to
aridity, mostly related to high temperatures in this
region, might be physiologically costly in cooler envi-
ronments.
Besides, the soil induration could also be considered
as having a potential effect on developmental stability.
Flynn et al. (1987) have shown that the thickness of
incisor enamel, which differed among S. ehrenbergi
chromosomal species, increased with soil induration,
indicating that thickness could be advantageous for
digging. Additionally, molar morphology has been
shown to differ between populations according to soil
type (Butler et al., 1993). If these dental traits are
adaptive, soil induration may be considered as an
ef®cient selective pressure able to induce environmental
stresses.
We have noted that the morphological trait most
correlated with environmental features is the anterio-
posterior width of the incisor (API). Incisors in rodent are
hypsodont, which means that they grew during the
whole life of the animal. This contrasts with molars
which, as in the house mouse (Bader, 1965), developed
to their de®nitive size early in life. Further analyses
would be required to assess the variability of asymmetry
along the incisor, and its relationship with environmen-
tal changes during the life of the animal. This trait may
provide an interesting marker more related to the
environmental stresses undergone by animals during
their life-time. Additionally, this may also provide some
insight into the mechanisms which generate asymmetries
(see for review Mùller, 1996).
We should, however, point out that the cline of aridity
is matched with several other biotic or abiotic clines,
among which is the heterozygosity displayed by popula-
tions. An alternative hypothesis would be that aridity
remains a stressful factor on S. ehrenbergi populations, but
the related impairing effect on the stability of develop-
ment, which is expected to increase southwards, could be
complemented by increasing heterozygosity.
Developmental stability, genetic featuresand speciation events
The role of heterozygosity on FA has been the focus of
extensive studies, and a negative relationship between
these two features has been reported (Mitton & Grant,
1984; Clarke, 1993; Markow, 1995). Nevertheless, stud-
ies failing to show this relationship are not rare (Wooten
& Smith, 1986; Patterson & Patton, 1990; Clarke, 1993;
Yampolosky & Scheiner, 1994). The strongest evidence
for such a dependence was certainly provided by intra-
population studies showing that the most homozygous
individuals for several allozymic loci displayed the higher
levels of FA (Leary et al., 1983, 1984, 1992; BieÂmont,
1983). Mitton (1993) stressed that the association
between heterozygosity and developmental homeostasis
218 J.-C. AUFFRAY
J . E V O L . B I O L . 1 2 ( 1 9 9 9 ) 2 0 7 ± 2 2 1 ã 1 9 9 9 B L A C K W E L L S C I E N C E L T D

may be attributable to a limited number of genes rather
than to the entire genome and that the assessment of
heterozygosity based on several allozymic markers may
obscure the association between heterozygosity at a
speci®c locus and developmental stability. In S. ehren-
bergi, genetic indices have been established on subsam-
ples (Nevo et al., 1994a) of those used for the present FA
approach and were presumed to be reliable population
indicators of the genetic diversity. Yet, the developmental
stability in the mole rat was associated neither with the
overall heterozygosity based on the 36 allozyme loci nor
with the heterozygosity at each of the 25 polymorphic
ones.
If we postulate that the constant level of developmen-
tal stability along with the sharp gradient of aridity
supports the idea of an ef®ciency of adaptive strategies of
populations to their local conditions of aridity, an
increasing heterozygosity would then be expected to
increase the level of developmental stability southwards
despite the higher aridity stress. This absence of a
detectable in¯uence of heterozygosity on developmental
stability in S. ehrenbergi populations may be then di-
versely explained. First, there may be no visible effect of
heterozygosity on developmental stability as already
reported in various studies (see references above). Sec-
ond, the bene®cial effect of heterozygosity on develop-
ment could be counterbalanced by another effect
impairing developmental stability. The southward in-
crease in heterozygosity is accompanied by a number of
environmental and genetic changes. For instance, a
parasitological approach has shown that the number
and co-occurence of coccidian species found in
S. ehrenbergi increased in southern species (2n � 58
and 60) (Couch et al., 1993). Even though it may not be
generalized (Alibert et al., 1994), parasites have been
shown to decrease developmental stability (Mùller, 1992;
Parsons, 1992; Polak, 1993; Markow, 1995) and could be
a relevant applicant to balance the bene®t of heterozy-
gosity on developmental stability. By contrast, if we
postulate that aridity remains a stressful factor south-
wards, the alternative hypothesis for the lack of a
relationship between FA with aridity and heterozygosity
would simply express the complementing effects of these
two features on developmental stability.
The developmental stability is believed to depend on
both genomic coadaptation and heterozygosity (Clarke,
1993). It is thought that in a typical diploid organism,
coadaptation refers to a relational balance between
homologous chromosomes and an internal balance
among genes within and among chromosomes (Mather,
1973 in Clarke et al., 1992). Chromosomal differences
between mole rat species combine whole-arm Robert-
sonian changes (fusions but mainly ®ssions), pericentric
inversions (Wahrman et al., 1985) and a considerable
amount of chromosomal microchanges (Nevo, 1988).
Nevo (1991) suggested that, on the basis of available
molecular and organismal data, there was no evidence of
a genetic revolution or of a major gene reorganization at
each step of the radiation. However, each successively
emerging species exhibited a new chromosomal organi-
zation of the genome through an increase in chromo-
somal number, which could modify both the pattern and
the rate of recombination. Nevo et al. (1996) reported an
increasing rate of recombination from 2n � 52 species to
2n � 60. Increased recombination rates may disrupt
ancestral coadaptive gene complexes resulting in a
`recombinational load' (Charlesworth & Barton, 1996).
Such an increase in recombination rate has been report-
ed between the 2n � 52±54 and the 2n � 58±60 (Nevo
et al., 1996). It could be then hypothezised that, in the
S. ehrenbergi superspecies, the gradient in heterozygosity
from ancestral to derived parallels that of an increase in
recombination rates; their opposite effects would com-
pensate along the gradients and maintain an equivalent
level of developmental stability among the chromosomal
species.
Obviously, further studies are required to examine this
hypothesis. It implies that within each chromosomal
species of the mole rat, a relationship between hetero-
zygosity and developmental stability is expected. How-
ever, since trans-speci®c effects of environmental
stresses, e.g. altitude, have been demonstrated in the
present study, this approach has to be conducted at the
intrapopulation level by grouping individuals according
to their level of heterozygosity and thus implies that our
sample sizes need to be considerably enlarged.
Conclusions
In order to analyse and interpret the level of develop-
mental stability in natural populations, Clarke (1993)
stressed the need to know the exact genetic structure
and the evolutionary history of groups under examina-
tion. However, the more that is known, the higher is
the number of potentially inextricable factors acting on
developmental stability. Several authors, including Par-
sons (1988), Hoffman & Parsons (1991) and Clarke
(1993), emphasized the complex relationships that exist
between environmental and genetic stresses as well as
their potentially cumulative effects on developmental
stability. The assessment of natural habitat suitability
using developmental stability among mole rat popula-
tions would lead us to conclude that lower altitude,
lighter soil or hotter environments should not be
considered as stressful, despite the fact that they can
be drastically more arid. Aridity would then not appear
as a stressful factor, even though it has been considered
as the major selective pressure during the adaptive
radiation of this superspecies towards xeric environ-
ments. Instead, the inclusion of potential genetic
stresses in addition to environmental ones in this study
of the developmental stability of natural populations
of S. ehrenbergi clearly underlines the likelihood of
complex complementary effects which hampers the
Developmental stability and adaptive radiation 219
J . E V O L . B I O L . 1 2 ( 1 9 9 9 ) 2 0 7 ± 2 2 1 ã 1 9 9 9 B L A C K W E L L S C I E N C E L T D

interpretation of habitat suitability in terms of adaptive
strategies. Although hypotheses on such complementa-
ry effects may emerge from studies of natural popula-
tions, testing them de®nitely requires experimental
analyses.
Acknowledgments
We thank Janice Britton-Davidian for stimulating dis-
cussions. This work was supported (1) by MDRI du CNRS
to J.C.A., by the ACC. SV7-CNRS SysteÂmatique et
Biodiversite `Evolution chromosomique et speÂciation
chez les rongeurs: approche inteÂgreÂe' (coordinator Janice
Britton-Davidian), (2) by the Programme CNRS Pal-
eÂoenvironnement et Evolution des HominideÂs `Stress
geÂneÂtiques et environnementaux subis par les popula-
tions actuelles et fossiles sous l'effet de l'anthropisation'
(Coordinator Jean-Christophe Auffray) and (3) by the
Israel Discount Bank Chair of Evolutionary Biology, and
by the Ancell-Teicher Research Foundation for Genetics
and Molecular Evolution. This is publication ISEM
no.988±005.
References
Alibert, P., Fel-Clair, F., Manolakou, K., Britton-Davidian, J.
& Auffray, J.-C. 1997. Developmental stability, ®tness and
trait size in laboratory hybrids between European subspecies
of the house mouse. Evolution 51: 1284±1295.
Alibert, P., Renaud, S., Dod, B., Bonhomme, F. & Auffray, J.-C.
1994. Fluctuating asymmetry in the Mus musculus hybrid
zone: a heterotic effect in disrupted co-adapted genomes. Proc.
R. Soc. Lond., B 258: 53±59.
Auffray, J.-C., Alibert, P., Renaud, S., Orth, A., Bonhomme,
F. 1996. Fluctuating asymmetry in Mus musculus subspeci®c
hybridization ± Traditional and Procrustes comparative ap-
proach. In: Advances in Morphometrics (L. F.Marcus, et al. ed.),
pp. 275±283. Plenum Press, New York.
Bader, R.S. 1965. Fluctuating asymmetry in the dentition of the
house mouse. Growth 29: 219±300.
BieÂmont, C. 1983. Homeostasis, enzymatic heterozygosity and
inbreeding depression in natural populations of Drosophila
melanogaster. Genetica 61: 179±189.
Butler, P.M., Nevo, E., Beiles, A. & Simson, S. 1993. Variations
of molar morphology in the Spalax ehrenbergi superspecies:
adaptive and phylogenetic signi®cance. J. Zool. Lond. 229:
191±216.
Charlesworth, B. & Barton, N.H. 1996. Recombination load
associated with selection for increased recombination. Genet.
Res. Camb. 67: 27±41.
Clarke, G.M. 1993. The genetic basis of developmental stability.
I. Relationships between stability, heterozygosity and genomic
coadaptation. Genetica 89: 15±23.
Clarke, G.M., Oldroyd, B.P. & Hunt, P. 1992. The genetic basis of
developmental stability in Apis mellifera: heterozygosity versus
genic balance. Evolution 46: 753±762.
Couch, L., Duszynski, D.W. & Nevo, E. 1993. Coccidia (Apicom-
plexa), genetic diversity, and environmental unpredictability of
four chromosomal species of the subterranean superspecies
Spalax ehrenbergi (Mole-rat) in Israel. J. Parasitol. 79: 181±189.
Flynn, L.J., Nevo, E. & Heth, G. 1987. Incisor enamel micro-
structure in blind mole rats: adaptive and phylogenetic
signi®cance. J. Mamm. 68: 500±507.
Ganem, G. & Nevo, E. 1996. Ecophysiological constraints
associated with aggression, and evolution toward paci®sm in
Spalax ehrenbergi. Behav. Ecol. Sociobiol. 38: 245±252.
Graham, J.H. 1992. Genomic coadaptation and developmental
stability in hybrid zones. Acta Zool. Fennica 191: 121±131.
Graham, J.H., Freeman, D.C. & Emlen, J.M. 1993.
Developmental stability: a sensitive indicator of populations
under stress. In: Environmental Toxicology and Risk Assessment
(W. G. Landis, J. S. Hughes & A. L. Lewis, eds), pp. 136±158.
American Society for Testing and Materials, Philadelphia.
Grubbs, F.E. 1969. Procedures for detecting outlying observa-
tions in samples. Technometrics 11: 1±21.
Hoffmann, A.A. & Parsons, P.A. 1991. Evolutionary Genetics and
Environmental Stress. Oxford University Press, Oxford.
Kat, P.W. 1982. The relationship between heterozygosity for
enzyme loci and developmental homeostasis in peripheral
populations of aquatic bivalves (Unionidae). Am. Nat. 119:
824±832.
Leary, R.F., Allendorf, F.W. & Knudsen, L.K. 1983. Develop-
mental stability and enzyme heterozygosity in the rainbow
trout. Nature 301: 71±72.
Leary, R.F., Allendorf, F.W. & Knudsen, L.K. 1984. Superior
developmental stability of heterozygotes at enzyme loci in
salmonid ®shes. Am. Nat. 124: 540±551.
Leary, R.F., Allendorf, F.W. & Knudsen, L.K. 1992. Genetic,
environmental, and developmental causes of meristic varia-
tion in rainbow trout. Acta Zool. Fennica 191: 79±98.
Manly, B.F.J. 1985. The Statistics of Natural Selection. Chapman
and Hall, London.
Markow, T.A. 1995. Evolutionary ecology and developmental
stability. Ann. Rev. Entomol. 40: 105±120.
Mitton, J.B. 1993. Enzyme heterozygosity, metabolism and
developmental stability. Genetica 89: 47±66.
Mitton, J.B. & Grant, M.C. 1984. Associations among protein
heterozygosity, growth rate, and developmental homeostasis.
Ann. Rev. Ecol. Syst. 15: 479±499.
Mùller, A.P. 1992. Parasites differentially increase the degree of
¯uctuating asymmetry in secondary sexual characters. J. Evol.
Biol. 5: 691±700.
Mùller, A.P. 1996. Development of ¯uctuating asymmetry in tail
feathers of the barn swallow Hirundo rustica. J. Evol. Biol. 9:
677±694.
Nevo, E. 1988. Natural selection in action: the interface of
ecology and genetics in adaptation and speciation at the
molecular and organismal levels. In: Zoogeography of Israel (E.
Tchernov & Y. Yom-Tov, eds), pp. 411±438. Dr. Junk,
Dordrecht.
Nevo, E. 1991. Evolutionary theory and processes of active
speciation and adaptive radiation in subterranean mole rats,
Spalax ehrenbergi superspecies, in Israel. Evol. Biol. 25: 1±125.
Nevo, E. & Beiles, A. 1988. Genetic parallelism of protein
polymorphism in nature: ecological test of the neutral theory
of molecular evolution. Biol. J. Linn. Soc. (London) 35: 229±
245.
Nevo, E., Ben-Schlomo, R., Beiles, A., Ronin, Y., Blum, S.
& Hille, J. 1996. Genomic strategies: DNA ®ngerprinting
reveal ecogenetic parallelism to allozymes, RAPDs, mitochon-
drial DNA, and chiasma frequency in the actively speciating
mole rats in. In: Gene Familes: Structure, Function, Genetics and
220 J.-C. AUFFRAY
J . E V O L . B I O L . 1 2 ( 1 9 9 9 ) 2 0 7 ± 2 2 1 ã 1 9 9 9 B L A C K W E L L S C I E N C E L T D

Evolution (R. S. Holmes & H. A. Lim, eds), pp. 55±70. World
Scienti®c Publ., New Jersey.
Nevo, E. & Cleve, H. 1978. Genetic differenciation during
speciation. Nature 275: 125±126.
Nevo, E., Filippucci, M.G. & Beiles, A. 1994a. Genetic polymor-
phisms in subterranean mammals (Spalax ehrenbergi super-
species) in the near East revisited: patterns and theory.
Heredity 72: 465±487.
Nevo, E., Filippucci, M.G., Redi, C., Korol, A. & Beiles, A. 1994b.
Chromosomal speciation and adaptive radiation of mole rats
in Asia Minor correlated with increased ecological stress. Proc.
Nat. Acad. Sc. U.S.A. 91: 8160±8164.
Nevo, E., Filippucci, M.G., Redi, C., Simson, S., Heth, G. &
Beiles, A. 1995. Karyotype and genetic evolution in speciation
of subterranean mole rats of the genus Spalax in Turkey. Biol.
J. Linn. Soc. (London) 54: 203±229.
Nevo, E., Tchernov, E. & Beiles, A. 1988. Morphometrics of
speciating mole rats: adaptive differenciation in ecological
speciation. Z. Zool. Syst. Evolut.-Forsch. 26: 286±314.
Palmer, A.R. 1994. Fluctuating asymmetry analyses: a primer.
In: Developmental Instability: its Origins and Evolutionary Impli-
cations (T. A. Markow, ed.), pp. 335±364. Kluwer Academic
Publ., Amsterdam.
Palmer, A.R. & Strobeck, C. 1986. Fluctuating asymmetry:
measurement, analysis, patterns. Ann. Rev. Ecol. Syst. 17: 391±
421.
Parsons, P.A. 1988. Evolutionary rates: effects of stress upon
recombination. Biol. J. Linn. Soc., Lond. 35: 49±68.
Parsons, P.A. 1990a. Fluctuating asymmetry: an epigenetic
measure of stress. Biol. Rev. 65: 131±145.
Parsons, P.A. 1990b. The metabolic cost of multiple environ-
mental stresses: implications for climatic change and conser-
vation. Trends Ecol. Evol. 5: 315±317.
Parsons, P.A. 1992. Fluctuating asymmetry: a biological monitor
of environmental and genomic stress. Heredity 68: 361±364.
Patterson, B.D. & Patton, J.L. 1990. Fluctuating asymmetry and
allozymic heterozygosity among natural populations of
pocket gophers Thomomys bottae. Biol. J. Linn. Soc. (London)
40: 21±36.
Polak, M. 1993. Parasites increase ¯uctuating asymmetry of
male Drosophila nigrospiracula: implication for sexual selection.
Genetica 89: 255±265.
Rice, W.R. 1989. Analyzing tables of statistical tests. Evolution 43:
223±225.
Ross, K.G. & Robertson, J.L. 1990. Developmental stability,
heterozygosity, and ®tness in two introduced ®re ants
(Solenopsis invicta and S. richteri) and their hybrid. Heredity
64: 93±103.
Siegel, S. & Castellan, N.J. 1988. Nonparametric Statistics for the
Behavioral Sciences, 2nd edn. McGraw-Hill, New York.
Simmons, L.W., Tomkins, J.L. & Manning, J.T. 1995. Sam-
pling bias and ¯uctuating asymmetry. Anim. Behav. 49:
1697±1699.
Sokal, R.R. & Rohlf, F.J. 1995. Biometry, 3rd edn. Freeman,
New York.
Swaddle, J.P.M.K., Witter & Cuthill, I.C. 1994. The analysis of
¯uctuating asymmetry. Anim. Behav. 48: 986±989.
Swaddle, J.P.M.K., Witter & Cuthill, I.C. 1995. Museum studies
measure FA. Anim. Behav. 49: 1700±1701.
Vrijenhoek, R.C. & Lerman, S. 1982. Heterozygosity and
developmental stability under sexual and asexual breeding
systems. Evolution 36: 768±776.
Wahrman, J.R., Richler, C., Gamperl, R. & Nevo, E. 1985.
Revisiting Spalax: mitotic and meiotic chromosome variability.
Isr. J. Zool. 33: 15±38.
Wooten, M.C. & Smith, M.H. 1986. Fluctuating asymmetry and
genetic variability in a natural population of Mus musculus.
J. Mamm. 67: 725±732.
Yahav, S., Simson, S. & Nevo, E. 1988. Adaptive energy
metabolism in four chromosomal species of subterranean
mole rats. Oecologia 7: 533±536.
Yahav, S., Simson, S. & Nevo, E. 1989. Total body water and
adaptive water turnover rate in four chromosomal mole rat
species of the Spalax ehrenbergi superspecies in Israel. J. Zool.
(London) 218: 461±469.
Yampolosky, L.Y. & Scheiner, S.M. 1994. Developmental noise,
phenotypic plasticity and allozyme heterozygosity in Daphnia.
Evolution 48: 1715±1722.
Zakharov, V.M. 1989. Future prospects for population pheno-
genetics. Sov. Sci. Rev. F. Physiol. Gen. Biol. 4: 1±79.
Received 10 July 1997; revised 3 September 1997; accepted 30 September
1997
Developmental stability and adaptive radiation 221
J . E V O L . B I O L . 1 2 ( 1 9 9 9 ) 2 0 7 ± 2 2 1 ã 1 9 9 9 B L A C K W E L L S C I E N C E L T D