(1) Methyl-bis-(P-chloroethyl)amine hydrochloride (HN2). (2 ...
Upload
independentCategory
view
1download
0
1 23
ChromatographiaAn International Journal for RapidCommunication in Chromatography,Electrophoresis and AssociatedTechniques ISSN 0009-5893Volume 76Combined 5-6 Chromatographia (2013) 76:255-265DOI 10.1007/s10337-012-2339-9
Development of the HPLC Method forSimultaneous Determination of LidocaineHydrochloride and Tribenoside Along withTheir Impurities Supported by the QSRRApproachAlina Plenis, Lucyna Konieczna, NataliaMiękus & Tomasz Bączek

1 23
Your article is published under the Creative
Commons Attribution license which allows
users to read, copy, distribute and make
derivative works, as long as the author of
the original work is cited. You may self-
archive this article on your own website, an
institutional repository or funder’s repository
and make it publicly available immediately.

ORIGINAL
Development of the HPLC Method for SimultaneousDetermination of Lidocaine Hydrochloride and TribenosideAlong with Their Impurities Supported by the QSRR Approach
Alina Plenis • Lucyna Konieczna •
Natalia Miekus • Tomasz Baczek
Received: 24 June 2012 / Revised: 18 September 2012 / Accepted: 2 October 2012 / Published online: 1 November 2012
� The Author(s) 2012. This article is published with open access at Springerlink.com
Abstract A new liquid chromatographic (LC) method for
simultaneous determination of lidocaine hydrochloride
(LH) and tribenoside (TR) along with their related com-
pounds in pharmaceutical preparations is described. Satis-
factory LC separation of all analytes after the liquid–liquid
extraction (LLE) procedure with ethanol was performed on
a C18 column using a gradient elution of a mixture of
acetonitrile and 0.1 % orthophosphoric acid as the mobile
phase. The procedure was validated according to the ICH
guidelines. The limits of detection (LOD) and quantifica-
tion (LOQ) were 4.36 and 13.21 lg mL-1 for LH, 7.60 and
23.04 lg mL-1 for TR, and below 0.11 and 0.33 lg mL-1
for their impurities, respectively. Intra- and inter-day pre-
cision was below 1.97 %, whereas accuracy for all analytes
ranged from 98.17 to 101.94 %. The proposed method was
sensitive, robust, and specific allowing reliable simulta-
neous quantification of all mentioned compounds. More-
over, a comparative study of the RP-LC column
classification based on the quantitative structure-retention
relationships (QSRR) and column selectivity obtained in
real pharmaceutical analysis was innovatively applied
using factor analysis (FA). In the column performance test,
the analysis of LH and TR in the presence of their impu-
rities was carried out according to the developed method
with the use of 12 RP-LC stationary phases previously
tested under the QSRR conditions. The obtained results
confirmed that the classes of the stationary phases selected
in accordance with the QSRR models provided comparable
separation for LH, TR, and their impurities. Hence, it was
concluded that the proposed QSRR approach could be
considered a supportive tool in the selection of the suitable
column for the pharmaceutical analysis.
Keywords Column Liquid chromatography �Column classification � Quantitative structure-retention
relationships � Factor analysis � Lidocaine hydrochloride �Tribenoside � Impurities
Introduction
Tribenoside (TR), chemically a mixture of the a- and
b-anomers of ethyl 3,5,6-tri-O-benzyl-D-glucofuranoside
(TRa, TRb), demonstrates anti-inflammatory, mild anal-
gesic, antitoxic, wound-healing, fibrinolysis-promoting,
anti-arthrotic, amine-release-inhibitory, membrane-stabil-
ising, and venotropic properties. The mechanism of phar-
macological activity of lidocaine hydrochloride (LH),
chemically 2-(diethylamino)-N-(2,6-dimethylphenyl)acet-
amide hydrochloride, is different. This drug belongs to the
widest used local anaesthetic agents applied in regional
management of major pain, administered spinally and
epidurally or peripherally. Both substances are often
combined in pharmaceutical preparations to treat haemor-
rhoids because the lidocaine component helps to provide
rapid symptomatic relief.
Both TR and LH are official drugs in the European
Pharmacopeia (Ph. Eur.) [1] and British Pharmacopeia
(BP) [2]. Both monographs describe the LC procedures for
the determination of LH and its two impurities: 2,6-
dimethylaniline (DMA) and 2-chloro-20,60-acetoxylidide
(CAX), as well as TR along with its related compounds:
Published in the topical collection Chemometrics in Chromatographywith guest editors B. Jancic-Stojanovic and Y. Dotsikas.
A. Plenis � L. Konieczna � N. Miekus � T. Baczek (&)
Department of Pharmaceutical Chemistry,
Medical University of Gdansk, Hallera 107,
80-416 Gdansk, Poland
e-mail: [email protected]; [email protected]
123
Chromatographia (2013) 76:255–265
DOI 10.1007/s10337-012-2339-9

benzaldehyde (BA), dibenzyl ether (DBE), plus tribenoside
impurity A (TRA). Unfortunately, these methods are based
on different chromatographic conditions making simulta-
neous determination of LH and TR in a single LC run time
impossible. Although many HPLC procedures for the
analysis of LH in pharmaceutical preparations have been
published in literature [3–11], only few papers have
reported methods for quantification of the substance along
with its impurities [1, 2, 4, 5, 9–11]. As concerns TR,
publications concern only the HPLC [12], gas–liquid
chromatography (GLC) [13], and spectrophotometry [14]
and exclude any related compounds. Thus, to the best of
our knowledge no method has so far been reported for
simultaneous quantitative determination of LH and TR
along with their impurities in pharmaceutical products.
It is also common knowledge that analysts often face the
problem of appropriate column selection when the sta-
tionary phase used for the development of the method is
not available in the laboratory or anywhere in the market.
Furthermore, the properties of the required stationary phase
can also change over the storage time or upon usage. All
those factors may cause that the columns will not yield
satisfactory results. To overcome the problem many gen-
eral test methods have been extensively investigated
to characterise the RP-LC columns over the last two dec-
ades [15–28]. Among them, the QSRR based on two
mathematical models seems to be an interesting approach
[21–28]. The first QSRR model relates log kw as the
retention factor k of the analyte extrapolated to the virtual
mobile phase of pure water or pure buffer, to the theoret-
ically calculated logarithms of n-octanol/water partition
coefficients (clog P) [23].
log kw ¼ a1 þ a2c log P ð1Þ
where a1 and a4 are the regression coefficients
The second model relates log kw of the analyte to three
calculated structural descriptors of the molecular modelling
such as the total dipole moment l, the electron excess
charge of the most negatively charged atom dMin, and the
water-accessible molecular surface area AWAS.
log kw ¼ a01 þ a02lþ a03dMin þ a04AWAS ð2Þ
where a1
0to a4
0are the regression coefficients. Unfortu-
nately, only one paper has focused on the correlation of the
theoretical QSRR results and the column performance in
real biomedical analyse [28]. Thus, there is the need to
conduct comparative studies to investigate whether the use
of the QSRR increases the probability of appropriate col-
umn selection for the specific pharmaceutical separation.
Therefore, the aim of the study was to develop a simple,
sensitive and accurate HPLC method for simultaneous
determination of LH and TR along with their related
compounds in pharmaceutical preparations. Another
objective was to examine the reliability of the QSRR
results in facilitating column selection against column
performance in real pharmaceutical analysis. As a case
study, LH and TR and their impurities were quantified in
accordance with the developed method on 12 stationary
phases previously tested under the QSRR conditions. Next,
the retention parameters of the analysed substances such as
the retention time (tR), and the resolution of the peaks of
interest (Rs) were calculated for all stationary phases pro-
viding a detailed description of the column performance in
real analysis. Moreover, the values of the Ph. Eur. system
suitability test (SST) required for LH and TR were iden-
tified for all tested columns. Then, the systematic infor-
mation obtained from the set of the QSRR regression
parameters used in characteristics of the stationary phases
was correlated with the column performance in real phar-
maceutical separation in a factor analysis (FA). The assay
was conducted to check whether the column classes closely
related in terms of their QSRR characteristics demonstrated
similar separation for LH and TR.
Experimental
Reagents
The test analytes used to derive the QSRR model for the
tested stationary phases were as follows: anisole (99 %),
benzamide (98 %), benzonitrile (99.9 %), benzyl chloride
(99 %), 4-cyanophenol (98 %), indole (99 %), 1-naph-
thylacetonitrile (97 %), phenanthrene (97 %), and pyrene
(99 %), all obtained from Sigma-Aldrich (St. Louis, MO,
USA); biphenyl (99 %), 2,20-dinaphthyl ether (98 %),
indazole (98 %), naphthalene (99.5 %), and 2-naphthol
(99 %) supplied by Lancaster (Newgate, UK); and benzene
(99.5 %) purchased from POCH (Gliwice, Poland). The
degree of purity of the used chemicals is given in brackets.
The analytes applied to develop the LC assay of LH and
TR along with their impurities, to name e.g. DMA (99 %),
CAX (99 %), TR (98 %), and TRA (98 %), were obtained
from Sigma-Aldrich (St. Louis, MO, USA). LH (97 %)
was delivered by Moehs Catalana (Barcelona, Spain),
while BA (98 %) and DBE (98 %) were supplied by Fluka
Chemie AG (Buchs, Switzerland). Ethanol and 85 %
orthophosphoric acid, both of the analytical grade, were
delivered by POCH (Gliwice, Poland). Acetonitrile and
methanol of the HPLC grade were purchased from Merck
(Darmstadt, Germany). All solvents and reagents were used
as received without further purification. Water was purified
in the Milli-Q Water Purification System (Millipore Cor-
poration, Bedford, MA, USA). The Procto-Glyvenol�
cream (Novartis, Pardubice, Czech Republic) and Procto-
Hemolan cream (Aflofarm, Ksawerow, Poland), both
256 A. Plenis et al.
123
labelled to contain 2 % of LH and 5 % of TR, i.e. nomi-
nally 20 mg of LH and 50 mg of TR in 1 g, were both
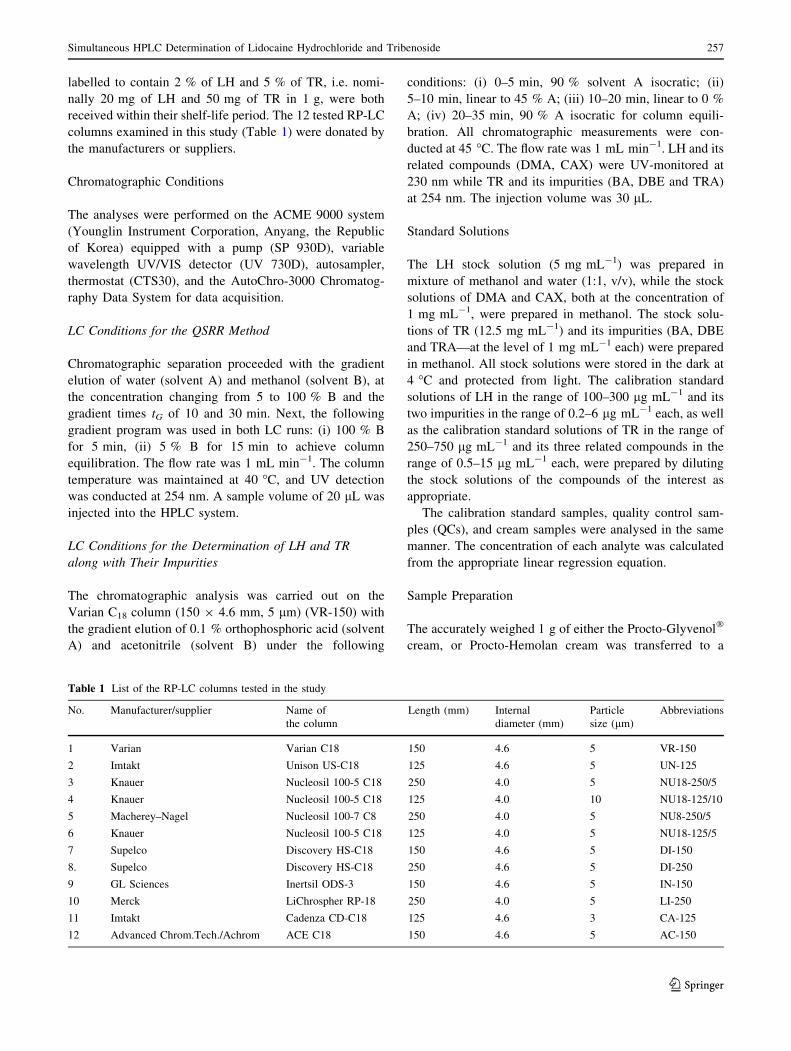
received within their shelf-life period. The 12 tested RP-LC
columns examined in this study (Table 1) were donated by
the manufacturers or suppliers.
Chromatographic Conditions
The analyses were performed on the ACME 9000 system
(Younglin Instrument Corporation, Anyang, the Republic
of Korea) equipped with a pump (SP 930D), variable
wavelength UV/VIS detector (UV 730D), autosampler,
thermostat (CTS30), and the AutoChro-3000 Chromatog-
raphy Data System for data acquisition.
LC Conditions for the QSRR Method
Chromatographic separation proceeded with the gradient
elution of water (solvent A) and methanol (solvent B), at
the concentration changing from 5 to 100 % B and the
gradient times tG of 10 and 30 min. Next, the following
gradient program was used in both LC runs: (i) 100 % B
for 5 min, (ii) 5 % B for 15 min to achieve column
equilibration. The flow rate was 1 mL min-1. The column
temperature was maintained at 40 �C, and UV detection
was conducted at 254 nm. A sample volume of 20 lL was
injected into the HPLC system.
LC Conditions for the Determination of LH and TR
along with Their Impurities
The chromatographic analysis was carried out on the
Varian C18 column (150 9 4.6 mm, 5 lm) (VR-150) with
the gradient elution of 0.1 % orthophosphoric acid (solvent
A) and acetonitrile (solvent B) under the following
conditions: (i) 0–5 min, 90 % solvent A isocratic; (ii)
5–10 min, linear to 45 % A; (iii) 10–20 min, linear to 0 %
A; (iv) 20–35 min, 90 % A isocratic for column equili-
bration. All chromatographic measurements were con-
ducted at 45 �C. The flow rate was 1 mL min-1. LH and its
related compounds (DMA, CAX) were UV-monitored at
230 nm while TR and its impurities (BA, DBE and TRA)
at 254 nm. The injection volume was 30 lL.
Standard Solutions
The LH stock solution (5 mg mL-1) was prepared in
mixture of methanol and water (1:1, v/v), while the stock
solutions of DMA and CAX, both at the concentration of
1 mg mL-1, were prepared in methanol. The stock solu-
tions of TR (12.5 mg mL-1) and its impurities (BA, DBE
and TRA—at the level of 1 mg mL-1 each) were prepared
in methanol. All stock solutions were stored in the dark at
4 �C and protected from light. The calibration standard
solutions of LH in the range of 100–300 lg mL-1 and its
two impurities in the range of 0.2–6 lg mL-1 each, as well
as the calibration standard solutions of TR in the range of
250–750 lg mL-1 and its three related compounds in the
range of 0.5–15 lg mL-1 each, were prepared by diluting
the stock solutions of the compounds of the interest as
appropriate.
The calibration standard samples, quality control sam-
ples (QCs), and cream samples were analysed in the same
manner. The concentration of each analyte was calculated
from the appropriate linear regression equation.
Sample Preparation
The accurately weighed 1 g of either the Procto-Glyvenol�
cream, or Procto-Hemolan cream was transferred to a
Table 1 List of the RP-LC columns tested in the study
No. Manufacturer/supplier Name of
the column
Length (mm) Internal
diameter (mm)
Particle
size (lm)
Abbreviations
1 Varian Varian C18 150 4.6 5 VR-150
2 Imtakt Unison US-C18 125 4.6 5 UN-125
3 Knauer Nucleosil 100-5 C18 250 4.0 5 NU18-250/5
4 Knauer Nucleosil 100-5 C18 125 4.0 10 NU18-125/10
5 Macherey–Nagel Nucleosil 100-7 C8 250 4.0 5 NU8-250/5
6 Knauer Nucleosil 100-5 C18 125 4.0 5 NU18-125/5
7 Supelco Discovery HS-C18 150 4.6 5 DI-150
8. Supelco Discovery HS-C18 250 4.6 5 DI-250
9 GL Sciences Inertsil ODS-3 150 4.6 5 IN-150
10 Merck LiChrospher RP-18 250 4.0 5 LI-250
11 Imtakt Cadenza CD-C18 125 4.6 3 CA-125
12 Advanced Chrom.Tech./Achrom ACE C18 150 4.6 5 AC-150
Simultaneous HPLC Determination of Lidocaine Hydrochloride and Tribenoside 257
123

25 mL volumetric flask, dissolved in about 24 mL of eth-
anol, and shaken mechanically for 15 min. Next, the vol-
ume in the flask was adjusted with ethanol and the resulting
mixture transported to an ultrasonic bath where the disso-
lution process was continued for 15 min. Then, the sample
was frozen for 1 h at -20 �C and the solution filtered using
an 0.45 lm syringe filtration disk (Whatman 25 mm GD/X
glass microfiber GMF) from Whatman, Middlesex, Great
Britain. After centrifugation for 8 min (7,000g) the
obtained mixture was transferred to a clean test tube and
diluted five times with ethanol. Finally, the whole solution
was centrifuged for 8 min (7,000g) and a 20 lL aliquot
was injected into the LC system.
Method Validation
The validation of the optimized method was performed in
accordance with the ICH guidelines Q2(R1) [29]. The
obtained validation data are reported in Fig. 1 and Table 2,
respectively.
Column Examination
Column Classification by QSRR
The calculation of the experimental log kw for 15 test
analytes used in the QSRR models was conducted on the
DryLab computer simulation software (Molnar-Institute,
Berlin, Germany). In the calculations, the tR of the test
analytes determined in two gradient LC runs, and the tR of
uracil were used, respectively to evaluate the column dead
time. The logarithms of clog P used were established by
employing the ALOGPS 2.1 program available online at
http://www.vcclab.org. Other structural descriptors of the
molecular modelling such as l, dMin, and AWAS were cal-
culated in the HyperChem program with the extension of
ChemPlus (HyperCube, Waterloo, Canada) [23]. The
multiple linear regression equations for 12 stationary pha-
ses were derived from Eqs. 1 and 2 on the Microsoft Excel
software (Microsoft, Redmond, WA, USA). The regression
coefficients (±standard deviations), multiple correlation
coefficients (r), standard errors of the equation estimates
(s), significance levels of each term and the whole equation
(p), and the values obtained in the Fisher’s F-test of sig-
nificance (Fisher’s F-test) are presented in Tables 3 and 4,
respectively.
Column Performance for the Determination of LH and TR
along with Their Impurities
The practical test of the QSRR classification system was
conducted on 12 RP-LC stationary phases during the sep-
aration of the QCs samples containing LH, TR, and their
impurities (100, 200, and 300 lg mL-1 for LH; 0.2, 1.0,
and 3.0 lg mL-1 for its two impurities; 250, 500, and
750 lg mL-1 for TR; and 0.5; 2.5, and 7.5 lg mL-1 for its
three impurities) in accordance with the developed method
described above. Next, the tR and Rs of the compounds of
interest were calculated for all RP-LC stationary phases.
Furthermore, the SST values for LH and TR (the Rs min-
imum 5.0 between the peaks for the DMA and COX
impurities, and the Rs minimum 3.0 between the peaks for
TRa and TRb, respectively) were calculated for all col-
umns examined. These data are reported in Table 5.
Data Analysis
The theoretical QSRR results for the 12 stationary phases
and their application in pharmaceutical practice for sepa-
ration of LH and TR along with their impurities were
subject to a comparative study to check whether the QSRR
approach could be considered a useful tool facilitating the
selection of the RP-LC column. An assay employing factor
analysis (FA) based on the varimax criterion was con-
ducted to visualise the relationships between the theoretical
and practical data sets. The analysis was performed on the
Statistica 9.0 software (StatSoft, Tulsa, USA). The FA was
first conducted based on the regression coefficients of the
QSRR models: a2 from Eq. 1(Table 3) and a2
0, a3
0, and a4
0
from Eq. 2 (Table 4) established for all columns. The
obtained FA plots picturing the variables and the objects
(columns) in three-dimensional space are shown on
Fig. 2a, b, respectively. Then, the retention parameters of
the tR and Rs for LH, TR and their impurities (Table 5),
calculated for all stationary phases during the column
performance test were evaluated by the FA. The three-
dimensional plots for the variables and columns resulting
from the FA are shown in Fig. 3a, b, respectively. In the
calculation, the numbers assigned to the tested columns
were the same as those reported in Tables 3, 4, 5.
Results and Discussion
As mentioned earlier on, a routine control of the pharma-
ceutical products containing both LH and TR requires two
different analytical methods. This is both labour intensive,
and cost and time consuming.
Therefore, the aim of this work was to develop a sensitive
LC method for simultaneous determination of LH and TR
along with their related compounds in pharmaceutical prod-
ucts that would be appropriate for pharmaceutical studies and
drug quality control. Therefore, a series of experiments was
performed to develop a simple and effective sample prepa-
ration procedure and determine the most optimal conditions
for the LC analysis of the analytes.
258 A. Plenis et al.
123

Fig. 1 Representative
chromatograms of the
laboratory prepared mixtures at
the concentrations of:
1.0 lg mL-1 for DMA (1),
200 lg mL-1 for LH (2);
2.5 lg mL-1 for BA (3);
1.0 lg mL-1 for CAX (4);
2.5 lg mL-1 for DBE (5);
500 lg mL-1 for TR [TRb (6),
TRa (7)] and 2.5 lg mL-1 for
TRA (8), monitored at 230 nm
(a) and 254 nm (b).
Representative chromatograms
of the Procto-Glyvenol�cream
sample containing LH
(200 lg mL-1) and TR
(500 lg mL-1) monitored at
230 nm (c) and 254 nm (d),
respectively
Simultaneous HPLC Determination of Lidocaine Hydrochloride and Tribenoside 259
123

Optimization of Sample Preparation
The tests held to develop the best sample preparation
procedure covered liquid–liquid extraction (LLE) using
different organic solvents such as ethyl acetate, ether die-
thyl, methanol, ethanol, and mixtures of both alcohols in
different proportions (from 10 to 90 % of ethanol). The
assay was based on an analysis of the QC samples spiked
with all compounds of interest. The obtained mean
recovery data (not presented) confirmed that the LLE
procedure using pure ethanol enabled the attainment of the
highest efficiency and the best elimination of the ballast
substances from the sample. Thus, the LLE procedure was
selected for further investigations.
Optimization of LC Separation
In the development of the presented LC method, several
factors influencing chromatographic separation, such as the
composition and flow rate of the mobile phase, the UV
detection wavelength, and the injection volume, were tes-
ted. The LC analysis was carried out using a VR-150
column, which offers separation of all analytes at the
Rs [ 1.50. The best separation results were achieved
with the gradient elution of 0.1 % orthophosphoric acid
(solvent A) and acetronitrile (solvent B). The flow rate of
1 mL min-1 and the column temperature of 40 �C offering
compromise between resolution and run time were found
optimal for the LC separation of the analytes. It was also
found that LH and its two impurities exhibited maximum
absorption at 230 nm, while TR and its related compounds
absorbed UV perfectly at a longer wavelength (254 nm).
Therefore, different UV detection parameters were chosen
as optimal for the quantification of LH and its two related
compounds (230 nm) versus TR and its impurities
(254 nm). Moreover, the injection volume of 30 lL was
selected for further investigations because it offered low
limits of detection (LOD) and good resolution of the peaks
of interest.
Validation of the Method
The chromatographic method was validated for selectivity,
linearity, precision and accuracy, and recovery. The
selectivity of the method was tested by analysing LH and
TR in laboratory prepared mixtures in the presence of their
impurities. Fig. 1a, b, respectively, show the representative
chromatograms of the laboratory prepared mixtures at the
concentrations of 200 lg mL-1 for LH and its related
compounds at the level of 1 lg mL-1 each, 500 lg mL-1
Table 2 Summary of the validation data (n = 6) and performance data (n = 7) obtained by LC for simultaneous determination of LH, TR, and
their impurities
Validation
parameters
LH DMA CAX TR BA DBE TRA
Linearity
(lg mL-1)
100–300 0.2–6 250–750 0.5–15
Equation parameter
Slope 27.603 ± 0.1872 7.704 ± 0.030 37.045 ± .176 1.5678 ± 0.0074 158.7 ± 0.61 2.5996 ± 0.0099 1.4005 ± 0.0428
Intercept 240.08 ± 36.46 1.2563 ± 0.1023 43.61± 62.022 ± 3.612 35.457 ± 5.213 1.5276 ± 0.0850 0.225 ± 0.005
Standard error 39.168 0.154 0.896 3.880 7.889 0.128 0.065
Correlation
coefficient (r)
0.9998 0.9999 0.9998 0.9998 0.9997 0.9999 0.9998
LOD (lg mL-1) 4.36 0.04 0.05 7.60 0.11 0.11 0.10
LOQ (lg mL-1) 13.21 0.13 0.16 23.04 0.33 0.33 0.30
Precision RSD (%)
Intra-day 0.28–1.78 0.40–1.97 0.29–1.69 0.34–1.86 0.29–1.80 0.27–1.93 0.28–1.88
Inter-day 0.35–1.84 0.38–1.96 0.25–1.83 0.36–1.89 0.25–1.82 0.33–1.96 0.36–1.94
Accuracy (%)
Intra-day 98.58–101.45 98.26–101.58 99.04–100.91 99.08–101.69 99.14–100.94 98.17–101.85 99.02–101.66
Inter-day 99.10–101.12 98.39–101.92 98.87–101.34 98.55–101.76 99.03–101.12 98.25–100.44 98.59–101.94
Drugs in dosage forms
Procto-Glyvenol�creama
Recoverya [%] 100.21 ± 0.84 n.d. n.d. 99.93 ± 0.71 n.d. n.d. n.d.
RSD % 0.84 0.71
Procto-Hemolan creama
Recoverya [%] 99.85 ± 0.89 100.52 ± 0.81
RSD % 0.89 0.81
a The percent of found to declared composition for seven replicate determination (mean ± SD); n.d. not detected (\LOD)
260 A. Plenis et al.
123

for TR and its impurities at the concentration of
2.5 lg mL-1 each, monitored at 230 and 254 nm, respec-
tively. Figure 1c, d, respectively, shows the representative
chromatograms of the Procto-Glyvenol�cream containing
LH (200 lg mL-1) and TR (500 lg mL-1), monitored at
230 and 254 nm, respectively. No interferences were
observed between the placebo component peaks and the
peaks of LH, TR, and their impurities. This proved that the
proposed method was selective. The calibration curves were
constructed by plotting the peak area of each analyte against
the known analyte concentrations, and by performing the
linear regression analysis according to the formula:
y = a ? bx, where y is the analyte peak area and x repre-
sents the concentration of the spiked analytes. The calibra-
tion curve equations established for all analyzed substances
are summarized in Table 2. The data confirmed excellent
linearity of the method for all analytes in the considered
concentration range of 100–300 lg mL-1 for LH,
0.2–6 lg mL-1 for its two impurities; 250–750 lg mL-1
for TR, and 0.5–15 lg mL-1 for its three related compounds
(r [ 0.9997). The LOD and LOQ were calculated from the
calibration curves using the slope (b) of the calibration graph
and the standard deviation (Sa) of the intercept (a). The intra-
and inter-day precision and accuracy were assessed by ana-
lysing the QC samples tested on the same day (n = 6) and on
six different days. Precision was expressed as relative stan-
dard deviation (RSD %), while accuracy was assessed by
calculating the estimated concentrations as the percent of the
nominal concentrations. These validation results are shown
in Table 2. Robustness, on the other hand, was determined
by analysing the same samples under various conditions and
method parameters. The impact of the mobile phase on
robustness was evaluated by varying the initial percentage of
the organic strength of the gradient elution between -2 and
2 %; the flow rate of the mobile phase varied in the range of
0.8–1.2 mL min-1, and the column temperature was chan-
ged from 33 to 43 �C. The obtained results confirmed no
significant impact on the chromatographic resolutions, i.e.
proved the LC method to be robust.
The proposed method was applied for the determination
of LH, TR and their related compounds in two pharma-
ceutical preparations: Procto-Glyvenol�cream (Novartis,
Pardubice, Czech Republic) and the Procto-Hemolan
cream (Aflofarm, Ksawerow, Poland) containing
20 mg g-1 of LH and 50 mg g-1of TR, respectively. Sat-
isfactory results were obtained for each drug (Table 2). The
concentrations of all tested impurities were below the
LOD.
Column Examination
Column Classification by QSRR
Earlier in this report, we mentioned the well known fact
that analysts often face the problem of appropriate column
selection. The literature reports many column classification
systems, including the QSRR, developed to solve the
analytical trouble [15–28]. In the QSRR approach, each
column is characterised using sets of the regression coef-
ficient values calculated in accordance with Eqs. 1 and 2,
respectively [23]. The QSRR equations obtained for the 12
stationary phases are presented in Tables 3 and 4, respec-
tively. It should be noted that all QSRR equations,
including the regression coefficients, were found statisti-
cally significant, which confirmed high quality of the
QSRR results. The high correlations between logkw and
Table 3 Coefficients a1 and a2 (±standard deviations) with their
significance levels, p (underneath in parenthesis), and statistical
parameters, r, s, Fisher’s F-test and p (see text for explanation), of the
regression equations of the forms: log kw ¼ a1 þ a2c log P, provided
by the QSRR for twelve tested columns
No. Analytical column a1 a2 r s Fisher’s F-test p
1 VA-150 0.445 (±0.112) 0.722 (±0.036) (p = 4E-11) 0.9842 0.190 401.0 4E-11
2 NU18-125/5 0.029 (±0.089) 0.949 (±0.028) (p = 6E-14) 0.9942 0.150 1105.9 6E-14
3 NU18-250/5 -0.719 (±0.091) 1.046 (±0.029) (p = 2E-14) 0.9949 0.155 1267.3 2E-14
4 NU8-250/5 0.002 (±0.105) 0.786 (±0.034) (p = 5E-12) 0.9883 0.177 546.8 5E-12
5 NU18-125/10 0.184 (±0.060) 0.912 (±0.019) (p = 6E-16) 0.9971 0.101 2247.5 6E-16
6 UN-125 0.670 (±0.118) 0.622 (±0.038) (p = 5E-10) 0.9765 0.201 266.9 5E-10
7 IN-150 0.640 (±0.096) 0.720 (±0.031) (p = 5E-12) 0.9883 0.163 544.1 5E-12
8 AC-150 0.746 (±0.084) 0.550 (±0.027) (p = 3E-11) 0.9847 0.142 415.2 3E-11
9 DI-150 0.514 (±0.095) 0.750 (±0.030) (p = 3E-12) 0.9895 0.160 607.2 3E-12
10 DI-250 0.687 (±0.108) 0.675 (±0.035) (p = 6E-11) 0.9831 0.183 376.2 6E-11
11 CA-125 0.795 (±0.143) 0.668 (±0.046) (p = 2 E-09) 0.9707 0.242 212.3 2E-09
12 LI-250 0.678 (±0.078) 0.588 (±0.025) (p = 5E-12) 0.9883 0.132 548.2 5E-12
Simultaneous HPLC Determination of Lidocaine Hydrochloride and Tribenoside 261
123

clogP were also observed what confirm similarity between
the slow-equilibrium octanol/water partition system and
the fast-equilibrium partition chromatographic process.
Thus, hydrophobicity of the stationary phases expressed in
the a2 coefficient (Table 3) was highest for NU18-250/5
and NU18-125/5, whereas its lowest values were recorded
for LI-250 and AC-150, respectively.
The a2
0coefficients characterising the specific, polar,
intermolecular interactions between the analytes and the
stationary phase components exert a negative impact on the
retention of the dipole–dipole (and dipole-induced dipole)
attractions. The same effect is recorded in the case of the
interactions between the analytes and the eluent compo-
nents, hence their negative values. On the basis of the
obtained a2
0values (Table 4), the RP-LC stationary phases
can be sequenced as follows by the decreasing polarity:
LI-250 [ NU8-250/5 [ AC-150 [ VR-150 [ DI-250 [UN-125 [ IN-150 [ NU18-125/5 [ CA-125 [ DI-150 [NU125/10 [ NU18-250/5.
Rules similar to those described above apply to the a3
0
coefficient, though the parameter has a positive value since
it is correlated to dMin negative in its value (electron defi-
ciencies). The results confirmed that the polarity of the
columns examined during the study increased from CA-
125 to VR-150. Coefficients a3
0can also be considered the
parameters suitable for the evaluation of the analyte ability
to take part in the hydrogen-bonding interactions with free
silanols of the stationary phase support material.
When relating the a4
0coefficients to the AWAS parameter
one can notice their positive values for all columns. This is
due to a positive impact of the non-specific analyte-sta-
tionary phase interactions on retention, and the phenome-
non is due to close contact between the interacting
molecules of the molecular fragments. Thus, the non-spe-
cific London retentivity caused by dispersion interactions
(London interactions) puts the stationary phases in the
following order according to the a4
0coefficient: NU18-250/
5 [ NU18-125/5 C NU-125/10 [ NU8-250/5 [ VR-150 C
DI-150[ IN-150 C DI-250[CA-125[UN-125[AC-150
[LI-250.
Column Performance for the Determination of LH and TR
along with Their Impurities
To perform the column performance test based on the
measurements of LH and TR in the presence of their
related compounds, the QC samples and real pharmaceu-
tical preparations were analysed in accordance with the
developed LC method involving all stationary phases. The
tR and Rs of the compounds of interest, established for all
tested columns are summarised in Table 5. Notably,
appropriate LC separation of all analytes according to
Rs [ 1.5, which is commonly accepted in LCTa
ble
4C
oef
fici
ents
a10–
a40
(±st
and
ard
dev
iati
on
s)w
ith
thei
rsi
gn
ifica
nce
lev
els,
p(u
nd
ern
eath
inp
aren
thes
is),
and
stat
isti
cal
par
amet
ers,
r,s,
Fis
her
’sF
-tes
tan
dp
(see
tex
tfo
rex
pla
nat
ion
),o
f
the
reg
ress
ion
equ
atio
ns
of
the
form
:lo
gk w¼
a0 1þ
a0 2lþ
a0 3d M
inþ
a0 4A
WA
S,
pro
vid
edb
yth
eQ
SR
Rfo
rtw
elv
ete
sted
colu
mn
s
No
.A
nal
yti
cal
colu
mn
a10
a20
a30
a40
rs
Fis
her
’sF
-
test
p
1V
R-1
50
-0
.60
6(±
0.2
27
)-
0.2
13
(±0
.03
3)
(p=
5E
-0
5)
3.1
55
(±0
.54
4)
(p=
0.0
00
1)
0.0
12
(±0
.00
06
)(p
=3
.1E
-1
0)
0.9
93
10
.13
62
64
.92
E-
10
2N
U1
8-1
25
/5-
1.7
42
(±0
.31
7)
-0
.29
5(±
0.0
47
)(p
=6
E-
05
)2
.89
8(±
0.7
61
)(p
=0
.00
29
)0
.01
6(±
0.0
00
8)
(p=
4E
-1
0)
0.9
92
10
.19
12
28
.53
E-
10
3N
U1
8-2
50
/5-
2.4
16
(±0
.49
8)
-0
.40
4(±
0.0
73
7)
(p=
0.0
00
2)
2.5
58
(±1
.19
4)
(p=
0.0
55
3)
0.0
17
(±0
.00
13
)(p
=3
E-
08
)0
.98
39
0.2
99
11
1.0
2E
-0
8
4N
U8
-25
0/5
-1
.72
4(±
0.2
56
)-
0.1
92
(±0
.03
8)
(p=
0.0
00
3)
2.5
39
(±0
.61
4)
(p=
0.0
01
6)
0.0
14
(±0
.00
06
)(p
=2
E-
10
)0
.99
26
0.1
54
24
4.3
2E
-1
0
5N
U1
8-1
25
/10
-1
.51
2(±
0.4
20
)-
0.3
08
(±0
.06
2)
(p=
0.0
00
4)
2.3
08
(±1
.00
6)
(p=
0.0
42
4)
0.0
16
(±0
.00
1)
(p=
1E
-0
8)
0.9
84
90
.25
21
18
.31
E-
08
6U
N-1
25
0.2
24
(±0
.26
5)
-0
.25
8(±
0.0
39
)(p
=4
E-
05
)2
.72
2(±
0.6
36
)(p
=0
.00
13
)0
.00
9(±
0.0
00
7)
(p=
2E
-0
8)
0.9
87
60
.15
91
44
.84
E-0
9
7IN
-15
0-
0.0
86
(±0
.27
0)
-0
.28
6(±
0.0
40
)(p
=2
E-
05
)2
.77
5(±
0.6
48
)(p
=0
.00
13
)0
.01
1(±
0.0
00
7)
(p=
5E
-0
9)
0.9
90
10
.16
21
83
.11
.E
-09
8A
C-1
50
0.2
71
(±0
.17
3)
-0
.21
0(±
0.0
25
)(p
=5
E-
06
)2
.46
0( ±
0.4
15
)(p
=0
.00
01
)0
.00
8(±
0.0
00
4)
(p=
8E
-1
0)
0.9
93
10
.10
42
62
.62
E-
10
9D
I-1
50
-0
.39
7(±
0.3
13
)-
0.3
02
(±0
.04
6)
(p=
4E
-0
5)
2.4
65
(±0
.75
1)
(p=
0.0
07
3)
0.0
12
(±0
.00
08
)(p
=1
E-
08
)0
.98
77
0.1
88
14
6.7
4E
-0
9
10
DI-
25
0-
0.0
39
(±0
.39
3)
-0
.22
0(±
0.0
58
)(p
=0
.00
30
)3
.04
2(±
0.9
43
)(p
=0
.00
81
)0
.01
1(±
0.0
01
0)
(p=
4E
-0
7)
0.9
76
30
.23
67
4.5
1E
-0
7
11
CA
-12
50
.16
5(±
0.4
17
)-
0.2
95
(±0
.06
1)
(p=
0.0
00
6)
2.2
65
(±0
.99
8)
(p=
0.0
44
)0
.01
0(±
0.0
01
)(p
=1
E-
06
)0
.97
35
0.2
50
66
.52
.E
-07
12
LI-
25
00
.67
9(±
0.1
74
)-
0.0
90
(±0
.02
6)
(p=
0.0
04
9)
2.3
42
(±0
.41
6)
(p=
0.0
00
1)
0.0
06
(±0
.00
04
)(p
=1
E-
08
)0
.98
70
0.1
04
13
8.3
5E
-0
9
262 A. Plenis et al.
123

determination, was observed for seven examined stationary
phases. The LC assay of LH and the related compounds
could yield proper results in accordance with the Ph.
Eur. SST requirement for ten tested columns, while the
SST for TR was met in the case of 11 columns. The
shortest tR of the last detected compound (TRA) versus
VR-150 was obtained for NU8-250/5 and NU18-125/5,
whereas LI-250 and DI-250 gave separations of the
longest tR values.
Data Analysis
The QSRR in the role of a useful tool for predicting the
appropriate stationary phases for the determination of LH
and TR along with their impurities was evaluated in a factor
analysis (FA). The FA plots of the variables and the objects
based on coefficients a2 and a2
0, a3
0, a4
0calculated for all
columns (Tables 3 and 4) are illustrated in Fig. 2a, b,
respectively. Here, the variance of the analysed data
involved in the variability of a2 and a4
0(located in the same
cluster—Fig. 2a) was accounted for mainly by the first pri-
mary factor (PF1: 65.11 %). The second PF2 (25.39 %) was
mainly related to the variability of a3
0, and the third one (PF3:
8.70 %) accounted primarily for the variance of the a2
0
coefficient. These variables were found to be outliers in the
plot. In the FA plot (Fig. 2b), the numbering of the columns
was the same as in Tables 3 and 4. Clearly, the stationary
phases positioned themselves within three subclusters
grouping columns 1, 2, 3, 5 (cluster I); 7, 9, 10 (cluster II);
and 6, 8, 11 (cluster III). In terms of the QSRR classification,
high a2 and a4
0values were observed for the columns found in
cluster I. In contrast, low values of both a2 and a4
0coefficients
were characteristic for the columns located in cluster III. In
the case of column Nos. 4 and 12, both found to be outliers,
the QSRR yielded low and significantly low values of a2.
Figure 3b, which illustrates the FA results for the col-
umn performance test during the LC determination of LH,
TR, and their impurities (Table 5), further reveals three
subclusters grouping column Nos. 1–3 and 5 (cluster I); 4,
7, and 9 (cluster II), and 6, 8, and 11 (cluster III). In this
plot, more than 75.23 % of the data variability was
explained by the first three PFs. The location of the tested
objects (columns) on the PF1 axis (41.67 %) was deter-
mined mainly by the differences in the tR of the three TR
impurities, the tR of TRb and the tR of CAX. These vari-
ables were found in the same cluster (Fig. 3a). When the
PF2 axis was taken into account, the positions of the col-
umns turned out to be related primarily to the variability of
the tR of LH and DMA (19.61 %). These variables were
placed close to each other, whereas the Rs of TRa and TRbwere found to be outliers on the FA plot. The variability of
these variables was mainly accounted for by the PF3
(13.95 %).Ta
ble
5S
um
mar
yo
fth
ere
ten
tio
np
aram
eter
so
ft R
and
Rs
for
LH
,T
R,
and
thei
rim
pu
riti
esin
ph
arm
aceu
tica
lp
rep
arat
ion
s,o
bta
ined
un
der
the
LC
-UV
met
ho
dfo
r1
2te
sted
colu
mn
s
Su
bst
ance
sD
MA
LH
CA
XB
AD
BE
TRb
TRa
TR
AS
ST
LH
SS
TT
R
No
.A
nal
yti
cal
colu
mn
t Rt R
Rs
t RR
st R
Rs
t RR
st R
Rs
t RR
st R
Rs
1V
R-1
50
6.3
31
1.7
75
.62
14
.76
1.9
81
4.1
74
.22
18
.83
9.8
61
9.7
54
.38
20
.27
3.0
52
1.0
54
.97
10
.74
3.0
5
2N
U1
8-1
25
/54
.00
6.9
52
.06
12
.53
4.2
71
1.4
02
.51
17
.45
18
.01
18
.56
6.6
71
9.2
05
.25
20
.05
4.6
12
0.1
85
.25
3N
U1
8-2
50
/55
.70
8.2
73
.32
14
.70
2.5
81
4.1
74
.34
19
.65
4.7
81
0.4
84
.83
21
.15
4.4
22
1.9
06
.81
8.0
04
.42
4N
U8
-25
0/5
12
.64
13
.13
.37
14
.96
4.9
31
4.1
30
.00
18
.95
17
.61
19
.78
6.9
20
.17
3.5
72
0.8
55
.50
3.6
33
.57
5N
U1
8-1
25
/10
4.6
17
.33
3.0
51
3.0
32
.51
11
.96
5.8
61
5.8
82
0.2
61
9.5
16
.53
20
.30
3.7
12
1.2
64
.77
14
.00
3.7
1
6U
N-1
25
5.6
89
.10
4.8
41
3.9
02
.95
13
.07
7.0
41
9.0
32
6.4
62
0.0
39
.02
20
.75
6.9
62
1.6
78
.95
17
.08
6.9
6
7IN
-15
05
.91
4.7
00
.00
14
.93
1.5
61
4.4
12
4.4
92
0.1
01
6.1
82
1.0
52
.29
21
.78
1.7
02
2.6
12
.13
26
.51
1.7
0
8A
C-1
50
6.6
51
0.6
74
.73
14
.35
2.6
21
3.7
35
.61
19
.58
19
.94
20
.80
5.6
42
1.5
04
.40
22
.28
4.9
51
0.6
14
.40
9D
I-1
50
7.9
51
0.9
12
.46
14
.70
1.3
71
4.1
86
.93
20
.15
17
.03
21
.30
4.3
82
2.0
33
.22
22
.90
5.3
18
.16
3.2
2
10
DI-
25
01
2.4
81
3.1
01
.18
16
.90
1.7
41
6.5
51
6.8
52
2.6
03
3.2
52
3.4
56
.78
24
.27
6.9
62
4.6
02
.06
16
.56
6.9
6
11
CA
-12
57
.55
10
.78
4.4
61
4.3
52
.42
13
.87
6.3
21
9.8
62
1.1
41
8.2
15
.21
18
.67
4.9
12
2.5
56
.04
16
.03
4.9
1
12
LI-
25
00
.00
0.0
00
.00
15
.61
1.6
51
5.3
00
.00
20
.90
19
.50
21
.70
3.4
32
2.4
76
.04
23
.30
6.3
90
.00
6.0
4
Mea
nin
go
fsy
mb
ols
isex
pla
ined
inth
ete
xt.
Th
eco
lum
ns
no
n-s
uit
able
for
the
LC
det
erm
inat
ion
of
the
anal
yte
sar
ein
dic
ated
inb
old
Simultaneous HPLC Determination of Lidocaine Hydrochloride and Tribenoside 263
123

The columns forming cluster I (Fig. 3b) were suitable
for the LC determination of LH and TR along with their
impurities. Contrary to them, the stationary phases inclu-
ded in cluster II gave separations with insufficient Rs for
LH (No. 7), CAX (No. 9), and BA (No. 4). The stationary
phases included in cluster III offered appropriate separation
of the analytes at the medium values of the tR and Rs of the
compounds of interest for column Nos. 8 and 11, however
lower tR and higher Rs analyte values for column No. 6.
Two stationary phases, Nos. 10 and 12, were found to be
outliers on the opposite sides of the graph. Both columns
were non-suitable for the LC separation of the analytes
because of the insufficient Rs of LH (No. 10), no detection
for the DMA and LH peaks, and the Rs of BA \1.5 for
column LI-250.
Thus, the QSRR classification can be considered a useful
tool in predicting realistic chromatographic separation of the
analysed substances considering that the same columns
grouped in clusters I and III were observed in Fig. 2b, and
3
2
5
4
1 9
710
12
11
6
83
2
5
4
1 9
710
12
11
6
8
I
IIIII
a2a'4
a'3
a'2
a2a'4
a'3
a'2a
b
Fig. 2 A three-dimensional FA plot for variables (a) and objects
(b) based on the regression coefficients of a2, a2
0, a3
0, and a4
0
determined in two QSRR models for 12 RP-LC columns tested
Fig. 3 A three-dimensional FA plot for variables (a) and objects
(b) based on the retention parameters (tR ad Rs) of the analytes during
the column performance test for the determination of LH and TR in
the presence of their impurities
264 A. Plenis et al.
123

Fig. 3b, respectively. Moreover, in both cases, column Nos. 7
and 9 were placed in cluster II, while LI-250 (No. 12) was
found to be an outlier. The only columns located in different
positions on the two FA plots were Nos. 4 and 10.
Conclusions
To summarise, a simple, precise, and accurate LC-UV
method was developed for simultaneous determination of
LH, TR, and their impurities in pharmaceutical prepara-
tions allowing to reduce imprecision related to sample
handling, shortening the time of the analysis, and reducing
its costs. Moreover, the column classification system based
on two QSRR models was checked against separation
selectivity of LH, TR and their related compounds. The
obtained results confirmed that the QSRR approach allows
for proper classification of the RP-LC columns at a rela-
tively good level of certainty. Moreover, the study resulted
in producing a list of the stationary phases for quantifica-
tion of LH, TR and their impurities, which can be of
interest to the pharmaceutical industry.
Acknowledgments The work was supported by the Polish State
Committee for Scientific Research Projects N N405 024340.
Open Access This article is distributed under the terms of the
Creative Commons Attribution License which permits any use, dis-
tribution, and reproduction in any medium, provided the original
author(s) and the source are credited.
References
1. (2011) European Pharmacopoeia, 7th edn. Council of Europe,
Strasbourg, France
2. (2011) Her majesty’s stationary office. In: British Pharmacopeia,
UK, London
3. Escuder-Gilabert L, Sagrado S, Villanueva-Camafias RM, Med-
ina-Hernandez MJ (1999) Chromatographia 49:85–90
4. Baczynski E, Piwonska A, Fijałek Z (2002) Acta Pol Pharm—
Drug Res 59:333–339
5. Fijałek Z, Baczynski E, Piwonska A, Warowna-Grzeskiewicz M
(2005) J Pharm Biomed Anal 37:913–918
6. Salas S, Talero B, Rabasco AM, Gonzalez-Rodrıguez ML (2008)
J Pharm Biomed Anal 47:501–507
7. Zivanovic L, Zecevic M, Markovic S, Petrovic S, Ivanovic I
(2005) J Chromatogr A 1088:182–186
8. Wiberg K, Jacobsson SP (2004) Anal Chim Acta 514:203–209
9. Abdul-Azim Mohammad M (2009) Chromatographia 70:563–
568
10. Smith DJ (1981) J Chromatogr Sci 19:253–258
11. Abdel-Rehim M, Bielenstein M, Askemark Y, Tyrefors N, Ar-
vidsson T (2000) J Chromatogr B 741:175–188
12. Song L, Zhang D (2005) Chin Pharmaceut J 40:1102–1104
13. Sioufi A, Pommier F (1980) J Pharm Sci 69:167–169
14. Vachek J (1985) Cesk Farm 34:420–421
15. Claessens HA, van Straten MA, Cramers CA, Jezierska M,
Buszewski B (1998) J Chromatogr A 826:135–156
16. Wilson NS, Nelson MD, Dolan JW, Snyder LR, Carr PW, Sander
LC (2002) J Chromatogr A 961:217–236
17. Cruz E, Euerby MR, Johnson CM, Hackett CA (1997) Chroma-
tographia 44:151–161
18. Andries JPM, Claessens HA, Vander Heyden Y, Buydens LMC
(2009) Anal Chim Acta 652:180–188
19. Heberger K (2010) Trends Anal Chem 29:101–109
20. Dragovic S, Haghedooren E, Nemeth T, Palabiyik IM, Hoog-
martens J, Adams E (2009) J Chromatogr A 1216:3210–3216
21. Szulfer J, Plenis A, Baczek T (2012) J Chromatogr A 1229:198–
207
22. Szulfer J, Plenis A, Baczek T (2012) Talanta 99:492–501
23. Baczek T, Kaliszan R (2003) J Chromatogr A 987:29–37
24. Baczek T, Bodzioch K, Michalska E, Kaliszan R (2008) Chro-
matographia 68:161–166
25. Baczek T, Kaliszan R, Novotna K, Jandera P (2005) J Chroma-
togr A 1075:109–115
26. Kaliszan R, van Straten MA, Markuszewski M, Cramers CA,
Claessens HA (1999) J Chromatogr A 855: 455–486
27. Baczek T, Kaliszan R (2002) J Chromatogr A 962:41–55
28. Plenis A, Balakowska E, Baczek T (2011) J Sep Sci
34:3310–3321
29. (1996) ICH note for guidelines on validation of analytical pro-
cedures: text and methodology (Q2R1), IFPMA, Switzerland
Simultaneous HPLC Determination of Lidocaine Hydrochloride and Tribenoside 265
123
Copyright © 2022 FDOKUMEN