Simultaneous determination of Antazoline hydrochloride and Tetrahydrozoline hydrochloride in...
11
ISSN: 0975-8585 October – December 2012 RJPBCS Volume 3 Issue 4 Page No. 1135 Research Journal of Pharmaceutical, Biological and Chemical Sciences Development of Spectrophotometric Method for Determination of Dopamine Hydrochloride in Bulk and Injectable Forms Riham Moa Idris*, Elrasheed A Gadkariem, Kamal Ee Ibrahim, and Magdi A Mohamed Department of Pharmaceutical Chemistry, Faculty of Pharmacy, University of Khartoum, Khartoum- Sudan ABSTRACT A precise, simple, cost-effective, specific and sensitive spectrophotometric method was developed for the assay of Dopamine HCl. The proposed method is based on generation of a colored complex through utilizing the known reaction of 2,6-dichloroquinone 4-chloroimide (DCQ) with phenols, primary and secondary amines. Dopamine HCl reacts with 2,6-dichloroquinone 4-chloroimide (0.12% solution in ethanol), in aqueous media at room temperature to produce a colored product that absorbs light at λmax 470 nm. All reaction conditions were optimized and standardized. The absorbance intensity of the colored product was linear with Dopamine HCl concentration in the range of (5 to 45 μg/ml). The correlation coefficient was found to be (r =0.999). The limit of detection was 2.5μg/ml. The stoichiometry of the reaction between Dopamine HCl and 2,6-dichloroquinone 4-chloroimide was studied, and revealed a 1:4 ratio of Dopamine HCl: DCQ respectively. The added recovery and standard addition approaches’ results were 99.67%±2.25 (n=6) and 99.09% for the former and later respectively, indicating the absence of interference. Keywords: Spectrophotometry, Dopamine HCl, DCQ, injectable form *Corresponding author
Transcript of Simultaneous determination of Antazoline hydrochloride and Tetrahydrozoline hydrochloride in...
ISSN: 0975-8585
October – December 2012 RJPBCS Volume 3 Issue 4 Page No. 1135
Research Journal of Pharmaceutical, Biological and Chemical
Sciences
Development of Spectrophotometric Method for Determination of Dopamine Hydrochloride in Bulk and Injectable Forms
Riham Moa Idris*, Elrasheed A Gadkariem, Kamal Ee Ibrahim, and Magdi A Mohamed
Department of Pharmaceutical Chemistry, Faculty of Pharmacy, University of Khartoum, Khartoum- Sudan
ABSTRACT A precise, simple, cost-effective, specific and sensitive spectrophotometric method was developed for
the assay of Dopamine HCl. The proposed method is based on generation of a colored complex through utilizing the known reaction of 2,6-dichloroquinone 4-chloroimide (DCQ) with phenols, primary and secondary amines. Dopamine HCl reacts with 2,6-dichloroquinone 4-chloroimide (0.12% solution in ethanol), in aqueous media at room temperature to produce a colored product that absorbs light at λmax 470 nm. All reaction conditions were optimized and standardized. The absorbance intensity of the colored product was linear with Dopamine HCl concentration in the range of (5 to 45 µg/ml). The correlation coefficient was found to be (r =0.999). The limit of detection was 2.5µg/ml. The stoichiometry of the reaction between Dopamine HCl and 2,6-dichloroquinone 4-chloroimide was studied, and revealed a 1:4 ratio of Dopamine HCl: DCQ respectively. The added recovery and standard addition approaches’ results were 99.67%±2.25 (n=6) and 99.09% for the former and later respectively, indicating the absence of interference. Keywords: Spectrophotometry, Dopamine HCl, DCQ, injectable form *Corresponding author

ISSN: 0975-8585
October – December 2012 RJPBCS Volume 3 Issue 4 Page No. 1136
INTRODUCTION
Dopamine HCl (DA HCl) structure is shown in figure 1. It is chemically named 4-(2-aminoethyl) benzene-1,2-diol hydrochloride. It is indicated for cardiogenic shock in infarction or cardiac surgery [1]. It is ineffective orally because it is a substrate for both monoamine oxidase (MAO) and Catechol O-methyl transferase (COMT). Thus, it is used intravenously. Methods used for analysis of Dopamine HCl injection include liquid Chromatography in official compendia B.P & USP [2-3], and flow injection analysis techniques [4-5-6]. Several other spectrophotometric methods were reported for determination of Dopamine HCl in dosage forms [7-8-9-10].Most of these methods are either sophisticated, material or time consuming.
NH2HO
HO
HCl
Figure 1 Dopamine HCl molecular structure [C8H11NO2, HCl, M.Wt. 189.6]
Gibbs reagents (2,6-dichloroquinone-4-chloroimide and 2,6-dibromoquinone-4-chlorimide) are extensively used in colorimetric determination by generation of colored products. They react with phenols to produce dichloroindophenols or dibromoindophenols[11]. DCQ has also been used for detection of antioxidants, including phenolic types and a few primary and secondary amines [12]. Applications of these reactions using DCQ include determination of; Prenalterol hydrochloride [13], Leflunomide in the presence of its degradates [14], Propofol in bulk, dosage forms, and biological fluids [15], Captopril [16], and Methyldopa [17].
In this study DCQ was used for the colorimetric determination of Dopamine HCl in bulk
and injectable form.
MATERIALS &METHODS Reagents Dopamine HCl working standard (assigned purity 99.83%), was supplied by the Central Medicines Supply (C.M.S-Sudan).
Distilled water is used all through, together with chemicals & reagents of analytical
grade. Phosphate buffers of pH 3 and 7, and borate buffer were prepared according to the B.P.2010 procedure.DCQ reagent was freshly prepared by dissolving appropriate amount in absolute ethanol to prepare 0.1, 0.12, 0.24 % w/v solutions.

ISSN: 0975-8585
October – December 2012 RJPBCS Volume 3 Issue 4 Page No. 1137
Pharmaceutical Formulation
Sterile Dopamine HCl concentrate BP [each ml contains Dopamine HCl BP 40 mg, water for injection BP q.s], manufactured by Claris Lifesciences Limited, Batch No. A080473, Mfg. date 07-2008, Exp. Date 06-2010, India. Preparation of Standard Solution:
A weight of 0.0125 g of Dopamine HCl RS were dissolved in distilled water, transferred
into 50 ml volumetric flasks, diluted to volume and mixed. Serial dilutions were made to obtain 0.18 mg/ml, 0.1 mg/ml and 0.09mg/ml working solutions. Experimental
All absorbance readings were measured using UV-1800 Shimadzu Spectrophotometer connected to hp Laserjet 1300 printer or Perkin Elmer UV/VIS Spectrometer lambda 2 connected to Perkin Elmer Ex-800 printer. Standard Calibration Curves
To 0.5, 1.0, 1.5, 2.0, and 2.5 ml of the Dopamine HCl (0.18 mg/ml working solution), 2.0, 1.5, 1.0, 0.5, 0.0 ml of distilled water was added respectively. One ml of DCQ (0.12 %) was added, mixed, and reaction mixture allowed standing for 60 minutes. The volume was then completed to 10 ml using distilled water. Absorbance was measured at 470 nm against reagent blank prepared similarly. Calibration curves were constructed by plotting the absorbance readings at 470 nm versus concentrations of Dopamine HCl. Pharmaceutical Preparation 4.5 ml (180 mg) from injection were pipetted and diluted to 50 ml with distilled water to obtain a solution of 3.6 mg/ml concentration (solution A). Solutions of concentrations of 1.8 mg/ml and 0.18 mg/ml were prepared from solution A through appropriate dilutions. Aliquots of the sample solutions were taken and prepared similarly as for standard calibration curves.
RESULTS AND DISCUSSION
The chromophoric system of the dopamine structure shows absorption maximum at 280 nm (Fig. 2). Sometimes it is useful to develop a colored species of the drug molecule containing reactive functional groups so as to produce a bathochromic shift. The bathochromic shift of the formed colored species will eliminate any irrelevant absorption exerted by pharmaceutical excipients. The selectivity of such a reaction could be a means of assaying the drug in presence of another non-reaction drug molecule or even a non-reacting structurally related substance (stability indicating property). Hence, in an attempt to increase the selectivity and prevent the interference effect, indirect spectrophotometric assay was proposed. Scanning of the colored

ISSN: 0975-8585
October – December 2012 RJPBCS Volume 3 Issue 4 Page No. 1138
product obtained from the reaction of Dopamine HCl with DCQ (chromogen) was done against reagent blank in the range of 350 nm- 650 nm. The spectra showed a maximum absorption at 470 nm for Dopamine HCl and DCQ product (Fig.3). The value of A1%
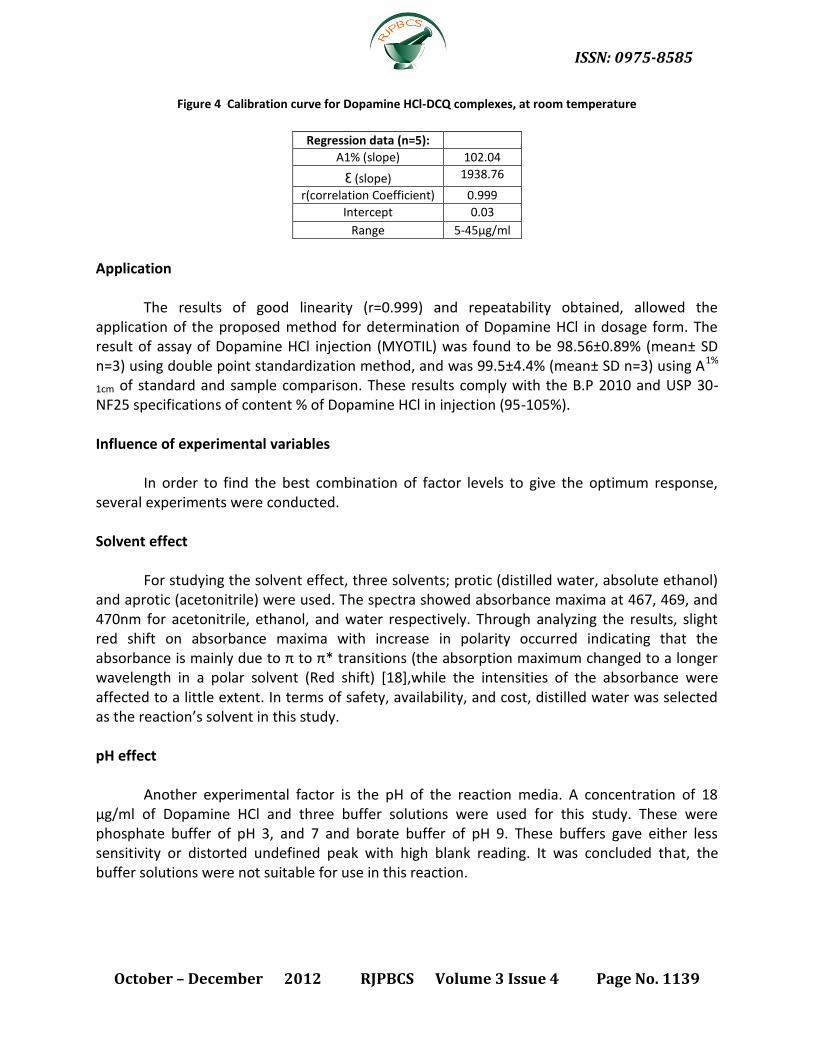
1cm calculated at 470 nm was found to be 104.36±4.15 (n=5). The absorbance intensity of the colored product was linear in the concentration range of 5 µg/ml to 45µg/ml (Fig.4). The correlation coefficient was found to be (r =0.999). The limit of detection was 2.5µg/ml.
Figure 2 UV spectrum of Dopamine HCl (36 µg/ml)
Figure 3 Visible spectrum of Dopamine HCl –DCQ colored product (45 µg/ml), showing the maximum absorbance at 470 nm
y = 10204x + 0.030 r= 0.999
0
0.1
0.2
0.3
0.4
0.5
0.6
0.0000% 0.0010% 0.0020% 0.0030% 0.0040% 0.0050%
Ab
sorb
ance
Final Conc. %
ISSN: 0975-8585
October – December 2012 RJPBCS Volume 3 Issue 4 Page No. 1139
Figure 4 Calibration curve for Dopamine HCl-DCQ complexes, at room temperature
Regression data (n=5):
A1% (slope) 102.04
Ɛ (slope) 1938.76
r(correlation Coefficient) 0.999
Intercept 0.03
Range 5-45µg/ml
Application
The results of good linearity (r=0.999) and repeatability obtained, allowed the application of the proposed method for determination of Dopamine HCl in dosage form. The result of assay of Dopamine HCl injection (MYOTIL) was found to be 98.56±0.89% (mean± SD n=3) using double point standardization method, and was 99.5±4.4% (mean± SD n=3) using A1%
1cm of standard and sample comparison. These results comply with the B.P 2010 and USP 30-NF25 specifications of content % of Dopamine HCl in injection (95-105%). Influence of experimental variables
In order to find the best combination of factor levels to give the optimum response, several experiments were conducted.
Solvent effect
For studying the solvent effect, three solvents; protic (distilled water, absolute ethanol) and aprotic (acetonitrile) were used. The spectra showed absorbance maxima at 467, 469, and 470nm for acetonitrile, ethanol, and water respectively. Through analyzing the results, slight red shift on absorbance maxima with increase in polarity occurred indicating that the absorbance is mainly due to π to π* transitions (the absorption maximum changed to a longer wavelength in a polar solvent (Red shift) [18],while the intensities of the absorbance were affected to a little extent. In terms of safety, availability, and cost, distilled water was selected as the reaction’s solvent in this study. pH effect
Another experimental factor is the pH of the reaction media. A concentration of 18 µg/ml of Dopamine HCl and three buffer solutions were used for this study. These were phosphate buffer of pH 3, and 7 and borate buffer of pH 9. These buffers gave either less sensitivity or distorted undefined peak with high blank reading. It was concluded that, the buffer solutions were not suitable for use in this reaction.

ISSN: 0975-8585
October – December 2012 RJPBCS Volume 3 Issue 4 Page No. 1140
Concentration effect
The optimal concentration of DCQ that can give maximum color development was studied. A concentration of Dopamine HCl (36 µg/ml) was kept constant while reacting with three different concentrations of DCQ, 1 ml each of 0.1%, 0.12 %, or 0.24% DCQ solutions. The results show that, no significant changes of intensity of the colored product (absorbance reading) were observed upon increase of the DCQ concentration from 0.12% to 0.24%.The lowest concentration (0.1%) gave the lowest reading. The DCQ concentration of 0.12% was selected as an optimum chromogen’s concentration during generation of the colored product. Temperature effect
Series of experiments were performed, in each of which the concentrations of the Dopamine HCl and the DCQ (at its optimum value I ml of 0.12%) were kept constant while the temperature was varied. In each case the absorbance readings were obtained for two concentrations of Dopamine HCl (18, and 36 µg/ml) at room temperature and at 90 ˚C. The results are shown in table 1.
Table 1: Effect of temperature on the absorbance of the complex using constant concentration of DCQ (1 ml of 0.12% solution)
Tube’s no. Concentraion of DA HCl
µg/ml
Temperature Absorbance mean (n=3)
SD
1 18 90 ˚C 0.4235 ± 0.074
2 36 90 ˚C 0.794 ±0.124
3 18 Room temperature 0.215 ±0.0028
4 36 Room temperature 0.395 ±0.0071
Despite the higher SD values obtained when applying heat at 90˚C for 5 min, compared
to those at room temperature, the results were considered encouraging for further investigation in order to increase the sensitivity, and speed up the reaction. Absorbance readings over the range of 4.5 to 22.5 µg/ml were studied. However, the results were not satisfactory, and imprecise (the absorbance of the lowest concentration 4.5 µg/ml showed an RSD of 20.14(n=4) compared to an RSD value of 2.69 (n=5) for 9 µg/ml. The correlation coefficient (r) at 90˚C were 0.979 and 0.974 for standard and sample’s curves respectively (Fig.5), compared to 0.999 and 0.998 for standard and sample curves obtained at room temperature (Fig. 4).
Stability of the complex
The stability of the colored product was monitored for 90 min time using Dopamine HCl concentration of 18 µg/ml. The reaction rate was fast during the first 15 min. At zero time the absorbance was 0.047 and at 15 min it was 0.176. Absorbance increased slowly up to 45 min, and the readings were then stable during 45, 60, and 90 min. There was no significant difference on absorbance readings between 45, and 60 min. At 45 min absorbance was 0.192,

ISSN: 0975-8585
October – December 2012 RJPBCS Volume 3 Issue 4 Page No. 1141
and at 60 min it was 0.215 (Fig. 6). The results at 60 min gave more reproducible results with RSD of about 1.32%. Therefore the time of 60 min was considered the optimal reaction time at room temperature.
Figure 5 Calibration curve for dopamine HCl –DCQ complexes, at 90˚C.
.
Figure 6 Profile of absorption Vs time at room temperature
Accuracy of the method
The accuracy of the method was evaluated through calculation of the Student-t-value at
95% confidence limit utilizing the formula [19]; t= (x-µ) √n /SD t= (98.9-100).√3 /0.83 = 2.295 Where; t= Student-t-value µ=known mean (considering injection content as 100%) x=mean content of the sample n= number of samples SD= standard deviation of the assay results
Results of evaluation of the accuracy of the method are presented in table 2. Table 2:
y = 219.96x + 0.0099 R² = 0.9825
y = 226.13x R² = 0.9815
0
0.1
0.2
0.3
0.4
0.5
0.6
0 0.0005 0.001 0.0015 0.002 0.0025
Abs. Mean
Final Conc.(%w/v)
Linear
Proportional
0
0.05
0.1
0.15
0.2
0.25
0 20 40 60 80 100
Ab
sorb
ance
Reaction time, min
ISSN: 0975-8585
October – December 2012 RJPBCS Volume 3 Issue 4 Page No. 1142
Comparing the calculated t value with that obtained from the table [20], indicates that the developed method is accurate. Precision (Repeatability)
The precision is given by the standard deviation of the repeatability of the method. It is determined from the results of 5 determinations of 3 different concentrations under the same analytical conditions. Results are listed in table 3.
Table 3: Precision of the developed method
Conc. Of DA HCl µg/ml Absorbance mean (n=5) Mean ± SD RSD %
9 0.1218 0.1218±0.0033 2.69
27 0.303 0.303±0.0029 0.96
36 0.3996 0.3996±0.0069 1.75
The minimal SD of the mean of the 3 concentrations indicates that the results obtained
by the present method are satisfactory. Interference
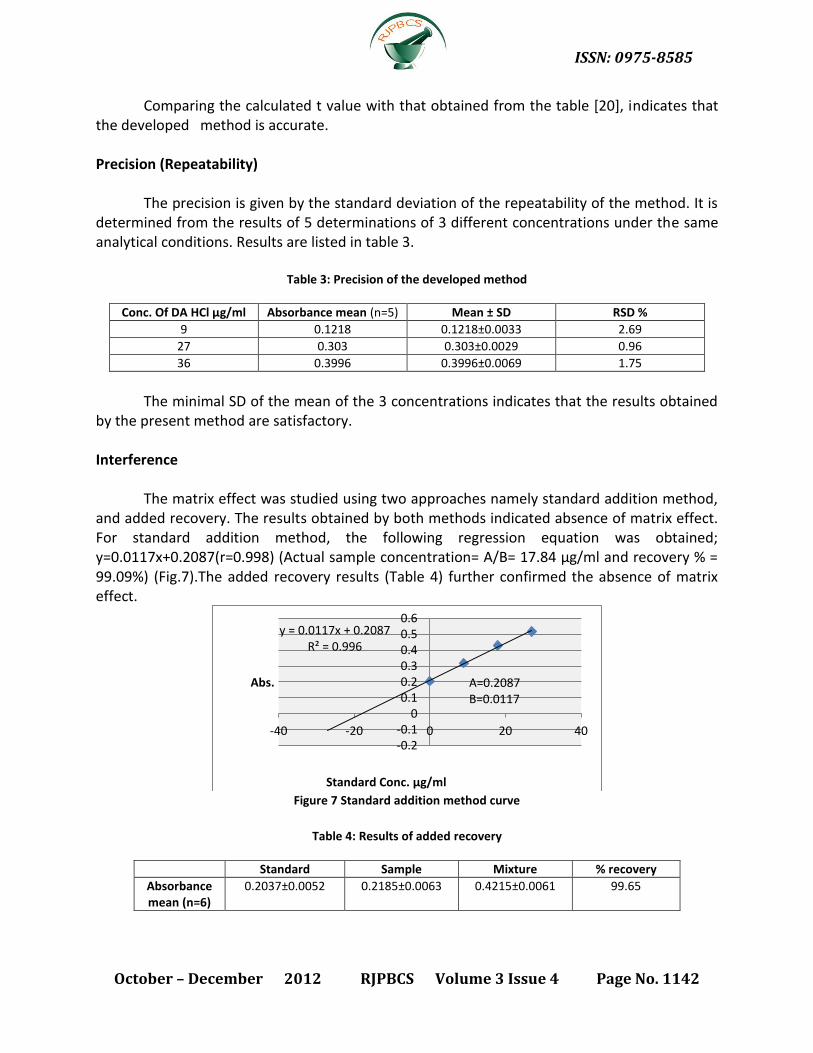
The matrix effect was studied using two approaches namely standard addition method, and added recovery. The results obtained by both methods indicated absence of matrix effect. For standard addition method, the following regression equation was obtained; y=0.0117x+0.2087(r=0.998) (Actual sample concentration= A/B= 17.84 µg/ml and recovery % = 99.09%) (Fig.7).The added recovery results (Table 4) further confirmed the absence of matrix effect.
Figure 7 Standard addition method curve
Table 4: Results of added recovery
Standard Sample Mixture % recovery
Absorbance mean (n=6)
0.2037±0.0052 0.2185±0.0063 0.4215±0.0061 99.65
y = 0.0117x + 0.2087 R² = 0.996
-0.2-0.1
00.10.20.30.40.50.6
-40 -20 0 20 40
Abs.
Standard Conc. µg/ml
A=0.2087 B=0.0117

ISSN: 0975-8585
October – December 2012 RJPBCS Volume 3 Issue 4 Page No. 1143
Molar Ratio Method In order to study the stoichiometry of the reaction and determine the number of moles of the reactants consumed for Dopamine-DCQ complex formation, molar ratio method was used. In this experiment a concentration of 20.131X10⁻⁵ (M), 0.998X10⁻³ (M) of Dopamine HCl and DCQ respectively, were used and the absorbance readings were plotted against the molar ratio of DA HCl/ DCQ. (Fig.8).The molar ratio was found to be 1/4.
Figure 8 Molar ratio curve (fixed DCQ concentration) showing 1 to 4 ratio (DA HCl / DCQ)
Based on this ratio, the following scheme is suggested for the possible pathway of the
reaction of Dopamine HCl with DCQ.
Figure 9 Proposed pathway for the reaction between Dopamine HCl and DCQ
y = 0.5623x + 0.0196 R² = 0.9676
0
0.05
0.1
0.15
0.2
0 0.1 0.2 0.3 0.4
Ab
s. r
ead
ing
Molar ratio (DA HCl/DCQ)
0.25
ISSN: 0975-8585
October – December 2012 RJPBCS Volume 3 Issue 4 Page No. 1144
CONCLUSION
A simple, sensitive, cost-effective, and accurate, spectrophotometric method is described for the assay of Dopamine HCl in bulk and injectable form. The method is based on the generation of a brownish-orange colored product that absorbs at λmax 470 nm through the reaction of Dopamine HCl with DCQ in aqueous media at room temperature. The simplicity and cost-effectiveness of the developed method make it suitable for routine quality control analysis of Dopamine HCl especially for colored coated tablets.
ACKNOWLEDGEMENT
The authors would like to convey their thanks to Dr. Salah Abd Elrazeig for his valuable assistance and appreciable help, and to senior technician Mr. Ibrahim Ismail for technical support. Thanks are also extended to the Central Medicine Supply-Sudan for supplying Dopamine HCl standard and MYOTIL injections.
REFERENCES
[1] British National Formulary 2011, 62, Electronic edition. [2] British Pharmacopoeia, 2010, volume III, 2634-2635 [3] United States Pharmacopoeia 30 NF 25 Edition, United States Pharmacopoeial
Convention, Rockville. [4] Montenegro MCBSM, M Goreti F Sales. J Pharm Sci 2000; 89(7): 876–884. [5] Yu C, Tang Y, Han X, Zheng X . Anal Sci 2006; 22(1): 25-8. [6] Berzas Nevado JJ, Lemus Gallego JM, Buitrago Laguna P. J Pharm and Biomedical Anal
1996; 14: 571-577. [7] Nagaralli BSS, Jaldappa M, Mahaveer BR, Kunabevu C, Keshavayya, Jathi. J AOAC
International 2002; 85(6): 1288-1292. [8] Nagaraja P, Srinivasa Murthy KC, Rangappa KS, Made Gowda NM. Talanta 1998 46(1):
39-44. [9] Chilukuri Suryaprakasa Sastry, Gurucharana Das V and Ekambareswara Rao K. Analyst
1985; 110: 395-398. [10] El-Kommos ME. J Pharm Belg .1987; 42(6): 371-6. [11] Pesez M and Bartos J. Colorimetric and Fluorimetric Analysis of Organic Compounds and
Drugs, M. Dekker, New York (1974).p. 97. [12] Joseph Hansbro Ross. Anal Chem 1968; 40 (14):2138–2143. [13] ALY FA, Belal F and Walash MI. J Pharm Biomedical Anal 1994; 12 (7): 955-958. [14] Abbas, Samah S, Bebawy, Lories I, Fattah, Laila A, Refaat, Heba H. J AOAC International
November 1, 2006. [15] EA Gad-Kariem & MA Abounassif. Anal Lett 2006; 33(12): 2515-2531. [16] Nahed El-Enany, Fathalla Belal, Mohamed Rizk. Int J Biomed Sci 2008; 4 (2). [17] EA Gadkariem, KEE Ibrahim, NAA Kamil, MEM Hagab, HA El-Obeid. Saudi Pharm J 2009;
17(4): 289-293.

ISSN: 0975-8585
October – December 2012 RJPBCS Volume 3 Issue 4 Page No. 1145
[18] Robinson JM. Undergraduate Instrumental Analysis, 5th Edition; Marcel Dekker: USA 1995, pp.(16,268-271).
[19] James N Miller & Jane C Miller, Statistics and Chemometrics of Analytical Chemistry, Fifth edition; Pearson Education: UK, 2005, pp. 40.
[20] James N Miller & Jane C Miller, Statistics and Chemometrics of Analytical Chemistry, Fifth edition; Pearson Education: UK, 2005, pp. 39-41.