SIMULTANEOUS QUANTIFICATION OF RELATED SUBSTANCES IN COMBINATION ANTIRETROVIRAL DRUG PRODUCT:...
23
This article was downloaded by: [Matrix Laboratories Ltd], [Subramanian Iyer] On: 08 April 2013, At: 20:14 Publisher: Taylor & Francis Informa Ltd Registered in England and Wales Registered Number: 1072954 Registered office: Mortimer House, 37-41 Mortimer Street, London W1T 3JH, UK Journal of Liquid Chromatography & Related Technologies Publication details, including instructions for authors and subscription information: http://www.tandfonline.com/loi/ljlc20 SIMULTANEOUS QUANTIFICATION OF RELATED SUBSTANCES IN COMBINATION ANTIRETROVIRAL DRUG PRODUCT: ABACAVIR SULFATE, LAMIVUDINE, AND ZIDOVUDINE TABLET USING HPLC AND MIGRATING THE METHOD TO ULTRA-PERFORMANCE LIQUID CHROMATOGRAPHY TM C. Balakrishnan a , G. Gnanadev a , Subramanian I. a , R. Gupta a & I. Bhushan a a Mylan Laboratories Limited, ANRICH Industrial Estate, Bollaram, Jinnaram (Mandal), Hyderabad, India Accepted author version posted online: 20 Jul 2012.Version of record first published: 04 Apr 2013. To cite this article: C. Balakrishnan , G. Gnanadev , Subramanian I. , R. Gupta & I. Bhushan (2013): SIMULTANEOUS QUANTIFICATION OF RELATED SUBSTANCES IN COMBINATION ANTIRETROVIRAL DRUG PRODUCT: ABACAVIR SULFATE, LAMIVUDINE, AND ZIDOVUDINE TABLET USING HPLC AND MIGRATING THE METHOD TO ULTRA-PERFORMANCE LIQUID CHROMATOGRAPHY TM , Journal of Liquid Chromatography & Related Technologies, 36:9, 1177-1197 To link to this article: http://dx.doi.org/10.1080/10826076.2012.685915 PLEASE SCROLL DOWN FOR ARTICLE Full terms and conditions of use: http://www.tandfonline.com/page/terms-and-conditions This article may be used for research, teaching, and private study purposes. Any substantial or systematic reproduction, redistribution, reselling, loan, sub-licensing, systematic supply, or distribution in any form to anyone is expressly forbidden. The publisher does not give any warranty express or implied or make any representation that the contents will be complete or accurate or up to date. The accuracy of any instructions, formulae, and drug doses should be independently verified with primary
-
Upload
independent -
Category
Documents
-
view
1 -
download
0
Transcript of SIMULTANEOUS QUANTIFICATION OF RELATED SUBSTANCES IN COMBINATION ANTIRETROVIRAL DRUG PRODUCT:...

This article was downloaded by: [Matrix Laboratories Ltd], [Subramanian Iyer]On: 08 April 2013, At: 20:14Publisher: Taylor & FrancisInforma Ltd Registered in England and Wales Registered Number: 1072954 Registeredoffice: Mortimer House, 37-41 Mortimer Street, London W1T 3JH, UK
Journal of Liquid Chromatography &Related TechnologiesPublication details, including instructions for authors andsubscription information:http://www.tandfonline.com/loi/ljlc20
SIMULTANEOUS QUANTIFICATION OFRELATED SUBSTANCES IN COMBINATIONANTIRETROVIRAL DRUG PRODUCT:ABACAVIR SULFATE, LAMIVUDINE,AND ZIDOVUDINE TABLET USINGHPLC AND MIGRATING THE METHODTO ULTRA-PERFORMANCE LIQUIDCHROMATOGRAPHYTM
C. Balakrishnan a , G. Gnanadev a , Subramanian I. a , R. Gupta a & I.Bhushan aa Mylan Laboratories Limited, ANRICH Industrial Estate, Bollaram,Jinnaram (Mandal), Hyderabad, IndiaAccepted author version posted online: 20 Jul 2012.Version ofrecord first published: 04 Apr 2013.
To cite this article: C. Balakrishnan , G. Gnanadev , Subramanian I. , R. Gupta & I. Bhushan (2013):SIMULTANEOUS QUANTIFICATION OF RELATED SUBSTANCES IN COMBINATION ANTIRETROVIRAL DRUGPRODUCT: ABACAVIR SULFATE, LAMIVUDINE, AND ZIDOVUDINE TABLET USING HPLC AND MIGRATING THEMETHOD TO ULTRA-PERFORMANCE LIQUID CHROMATOGRAPHYTM , Journal of Liquid Chromatography &Related Technologies, 36:9, 1177-1197
To link to this article: http://dx.doi.org/10.1080/10826076.2012.685915
PLEASE SCROLL DOWN FOR ARTICLE
Full terms and conditions of use: http://www.tandfonline.com/page/terms-and-conditions
This article may be used for research, teaching, and private study purposes. Anysubstantial or systematic reproduction, redistribution, reselling, loan, sub-licensing,systematic supply, or distribution in any form to anyone is expressly forbidden.
The publisher does not give any warranty express or implied or make any representationthat the contents will be complete or accurate or up to date. The accuracy of anyinstructions, formulae, and drug doses should be independently verified with primary

sources. The publisher shall not be liable for any loss, actions, claims, proceedings,demand, or costs or damages whatsoever or howsoever caused arising directly orindirectly in connection with or arising out of the use of this material.
Dow
nloa
ded
by [
Mat
rix
Lab
orat
orie
s L
td],
[Su
bram
ania
n Iy
er]
at 2
0:14
08
Apr
il 20
13

SIMULTANEOUS QUANTIFICATION OF RELATED SUBSTANCESIN COMBINATION ANTIRETROVIRAL DRUG PRODUCT: ABACAVIRSULFATE, LAMIVUDINE, AND ZIDOVUDINE TABLET USING HPLCAND MIGRATING THE METHOD TO ULTRA-PERFORMANCELIQUID CHROMATOGRAPHYTM
C. Balakrishnan, G. Gnanadev, Subramanian I., R. Gupta, and I. Bhushan
Mylan Laboratories Limited, ANRICH Industrial Estate, Bollaram, Jinnaram (Mandal),Hyderabad, India
& In the present study, simultaneous quantification of Abacavir, Lamivudine, and Zidovudinerelated substances in fixed dosed combination tablet is performed using a reversed-phase High-Per-formance Liquid Chromatography. The three drugs and its related substances were resolved using amobile phase containing acetate buffer of pH 3.0, methanol, and acetonitrile in ternary gradientelution mode. The separation was achieved by using a C18, 250� 4.6mm 5l HPLC column. Thethree main active constituents along with eleven related substances were resolved in this method.The novel method was validated to meet the requirements for global regulatory filing. The methodwas then successfully migrated to Ultra-Performance Liquid Chromatography (UPLCTM) to reducerun time and improve sample throughput. The results confirm that the method isstability-indicating, accurate, precise, and robust. Currently, the HPLC method is being used forthe on-going stability analysis of manufactured batches.
Keywords antiretroviral drug product, HPLC, method validation, related substances,reversed-phase chromatography, UPLCTM
INTRODUCTION
Highly Active Antiretroviral Therapy (HAART) consists of the use of atleast three antiretroviral (ARV) drugs to maximally suppress the HIV virusand stop the progression of HIV disease,[1] this is also known as Combi-nation Therapy. To inhibit the viral replication, three therapeutic classeshave been developed: (i) nucleoside reverse transcriptase inhibitors(NRTIs): Abacavir, didanosine, dideoxycytidine, Lamivudine, stavudine,
Address correspondence to Subramanian I., Mylan Laboratories Limited, FDF-R&D, Plot No. 34A,ANRICH Industrial Estate, Bollaram, Jinnaram (Mandal), Medak District, Hyderabad-502325, India.E-mail: [email protected]
Journal of Liquid Chromatography & Related Technologies, 36:1177–1197, 2013Copyright # 2013 Mylan Laboratories LimitedISSN: 1082-6076 print/1520-572X onlineDOI: 10.1080/10826076.2012.685915
Dow
nloa
ded
by [
Mat
rix
Lab
orat
orie
s L
td],
[Su
bram
ania
n Iy
er]
at 2
0:14
08
Apr
il 20
13

Zidovudine; (ii) non nucleoside reverse transcriptase inhibitors (NNRTIs):delavirdine, efavirenz, nevirapine; and (iii) protease inhibitors (PIs):amprenavir, indinavir, nelfinavir, ritonavir, and saquinavir.[2]
NRTIs remain the most commonly prescribed ARVs and are alwaysincluded in the initial treatment regimen.[3] Two NRTIs should be com-bined with either one or two PIs, an NNRTI or a third NRTI. The followingsix NRTIs are approved for use in HIV infection: Abacavir (ABC), didano-sine (ddl), Lamivudine (3TC), stavudine (d4T), zalcitabine (ddC), andZidovudine (AZT). Zalcitabine is rarely used since it is not recommendedby HIV treatment guidelines.[4]
While a plethora of literature has been published on the simultaneousdetermination of antiretroviral drug by HPLC, both in drug substances,products, and plasma samples,[5–10] and there are, to the best of our knowl-edge, no comprehensive published analytical procedure for a combinationdrug product to quantify related substances of all three actives in a drugproduct. However, Indian pharmacopeia[11] has a monograph on this pro-duct, the method recommended for related substances did not adequatelyresolve the impurities of interest; secondly, the method utilizes non volatilebuffers making it incompatible with mass detectors, hence there was a needto develop a specific HPLC method that would quantify all degradants aswell as in-house process impurities which can further be used to identifyimpurities using LC-MS. The present article aims to highlight the develop-ment and validation of antiretroviral drug product: Abacavir sulfate, Lami-vudine, and Zidovudine tablet (300mg=150mg=300mg) and the methodsextension to fast liquid chromatography.
EXPERIMENTAL
Instrumentation
For all chromatographic experiments, WATERS HPLC, 2695XE Separa-tions Module (Waters Corporation, Milford, MA, USA) equipped with aWaters 2487 dual wavelength UV-visible absorbance detector was used. Chro-matography for peakpurity datawasperformedona2695XEmodule connec-ted to a 2996 photodiode array detector (WATERS). Data acquisition andprocessing was performed using EMPOWER 2 automation system software.
Materials
Working standards of Abacavir, Lamivudine, and Zidovudine (of knownpurity) and their respective related substances were provided internallyfrom our active pharmaceutical ingredient manufacturing site (QualityControl=Analytical Development laboratory, Mylan Laboratories Limited).
1178 C. Balakrishnan et al.
Dow
nloa
ded
by [
Mat
rix
Lab
orat
orie
s L
td],
[Su
bram
ania
n Iy
er]
at 2
0:14
08
Apr
il 20
13

Structures and chemical names of related substances are proprietaryinformation, hence coded as alphanumeric characters. Finished productand placebo were also provided internally by the Formulation Developmentteam (Formulations R&D, Mylan Laboratories Limited). All solvents andchemicals used were of HPLC grade, from Rankem (RFCL Limited, NewDelhi, India). High pure water was obtained from in-house Milli-QTM waterpurification system (Millipore Corporation, Milford, MA, USA). Chemicalslike ammonium dihydrogen phosphate and orthophosphoric acid wereprocured from Qualigens (Qualigens Fine Chemicals, Mumbai, India)and trifluoroacetic acid was procured from Merck (Merck Limited,Mumbai, India). The purity of all the working standards used is above99% and related substances used are between 98 and 100%.
Method Development
The choice of detector wavelengths was made after studying the absorp-tion spectra of all the three molecules. UV spectra of the three NRTIsfamily molecules differ from each other as they are compound specific.Abacavir shows UV maxima at around 297nm while Lamivudine andZidovudine show maxima around the region 265–270nm. A common wave-length at 266 nm was chosen for the analysis, being the appropriate wave-length for all the three molecules considering the sample concentration.One of the related substances of abacavir, RS11 (refer to Table 1 for the listof impurities), a low polar compound, however, showed a different UVmaxima, hence a higher wavelength of 310 nm was used to quantify thisparticular related substance against Abacavir at 310 nm. UV spectra of eachimpurity and the main analytes are shown in Figure 1.
TABLE 1 List of Related Substances Separated and Validated
S. No. Name
Lamivudine Related Substances1 RS1 (Carboxylic acid impurity)2 RS2 (Lamivudine Diastereomer)
Zidovudine related substances3 RS3 (Zidovudine compound A or Stavudine)4 RS4 (Zidovudine compound B)5 RS5 (Zidovudine compound C or Thymine)6 RS6 (Thymidine)7 RS7 (Zidovudine Threo isomer)8 RS8 (Zidovudine Thymidine Adduct)
Abacavir related substances9 RS9 (Amino Impurity)
10 RS10 (Pyrimidine Impurity)11 RS11 (Chloro Impurity)
Quantification of Related Substances in Combination Antiretroviral Drug Product 1179
Dow
nloa
ded
by [
Mat
rix
Lab
orat
orie
s L
td],
[Su
bram
ania
n Iy
er]
at 2
0:14
08
Apr
il 20
13

The next primary aim was to separate all of the 11 related substancesand the three actives with acceptable resolution. As one method is targeted,diversity in the chromatographic properties between the three actives willrequire the use of gradient method. Development work was initiated usingan existing validated method used in the author’s laboratory for the separ-ation of Lamivudine, Nevirapine, and Zidovudine.[12] Considering that twocomponents were similar to the earlier product, we continued with anacidic pH buffer (pH 3.5) with methanol as organic modifier, moreoverabacavir having a pKa closer to acidic range, pH of 3.5 used was justified.Preliminary work on this pH showed insufficient resolution betweenrelated substances of Zidovudine and Abacavir. To offset this, pH wasslightly reduced to 3.0.
The altered pH had a good effect on the separation, resulting in someminor changes in elution pattern. Adding a third component, i.e., acetoni-trile was necessary to take advantage of the subtle selectivity differencesimparted by acetonitrile with methanol. This led to improved resolutionbetween close eluting peaks namely, RS2 and RS3, RS7, and RS8 respect-ively. Peak tracking of related substances was performed during the initialstages of development work by adding individual standard solutions ofrelated substances to the placebo and processed for chromatography.
The mobile phase composition finalized for validation was acetatebuffer pH 3.0, methanol, and acetonitrile, used in a ternary gradient mode.
FIGURE 1 Typical chromatogram of sample spiked with impurities at 266 nm along with UV spectrum.
1180 C. Balakrishnan et al.
Dow
nloa
ded
by [
Mat
rix
Lab
orat
orie
s L
td],
[Su
bram
ania
n Iy
er]
at 2
0:14
08
Apr
il 20
13

The developed method is mass detector compatible hence the samemethod can potentially be used to identify degradation impurities whichmay arise during the course of stability.
Preparation of Mobile Phase and Chromatographic Condition
Acetate buffer was prepared by dissolving 1,900mg of ammoniumacetate in 1,000mL high pure water and adjusting the pH to 3.0 with88% trifluoroacetic acid (2.3mL in 1 liter water). Buffer was filteredthrough 0.45 m membrane filter.
The mobile phase was delivered at 1mL=minute flow rate and thelinear incremental solvent programming was as given in Table 2.
The procedure utilized a C18 HPLC column, Prontosil C18 H, 5mparticle size, 250mm� 4.6mm (Bischoff Chromatography, Germany)maintained at 35�C. Two wavelengths were used to monitor the impurities,266 nm and 310nm, respectively. Abacavir, Lamivudine, Zidovudine, and itsimpurities were monitored at 266 nm. RS11, related substances fromAbacavir and Abacavir, was extracted from 310nm wavelength. Injectionvolume was 20mL and the sample tray was maintained at 5�C.
Preparation of Analytical Solutions
DiluentDilute Orthophosphoric acid solution was mixed with methanol in the
ratio of 70:30 and used as diluent.
Stock Solution A (Lamivudine and Abacavir Sulfate)About 45mg of Lamivudine working standard and about 70mg of
Abacavir sulfate working standard were transferred to a 100mL volumetricflask, 75mL of diluent was added, sonicated to dissolve, and diluted tovolume with the same. Furthermore, 10mL was diluted to 100mL withdiluent and mixed well.
TABLE 2 Gradient Elution Program
Time (min) % Acetate Buffer pH 3.0 (v=v) % Methanol (v=v) % Acetonitrile (v=v)
Initial 97 2.5 0.518 85 12 335 75 20 540 75 20 550 40 48 1255 97 2.5 0.565 97 2.5 0.5
Quantification of Related Substances in Combination Antiretroviral Drug Product 1181
Dow
nloa
ded
by [
Mat
rix
Lab
orat
orie
s L
td],
[Su
bram
ania
n Iy
er]
at 2
0:14
08
Apr
il 20
13

Stock Solution-B (Zidovudine)About 50mg of Zidovudine Working standard was transferred to a
50mL volumetric flask, 30mL of diluent was added, sonicated to dissolve,and diluted to volume with the same.
Standard Solution of Actives5mL of stock solution A and 3mL of stock solution B was transferred to
a 100mL volumetric flask and the volume made up with diluent and mixed.The solution was filtered through 0.45 m or finer porosity membrane filter.
The working standard solution contained 2.25 mg=mL of Lamivudine,3.5 mg=mL of Abacavir sulfate and, 3 mg=mL of Zidovudine, respectively.The prepared standard solution was kept at 5�C to avoid any degradation.
Preparation of Placebo SolutionsPlacebo powder (only excepients=additives) was weighed equivalent to
the concentration of actives in test preparation. This was then processedsimilar to the test preparation.
Preparation of Standard Related Substances SolutionsIn accordance with the limit accepted for each related compound (RS2,
RS3, RS9, RS10, and RS11 at 0.2%, RS6 at 0.15%, RS7 & RS8 at 0.5%, RS4 at1.0%, and RS5 at 2.0% with respect to corresponding sample concen-tration), appropriate concentrations of each set of related compounds weremade. Three sets of related substances solution, for the actives, were made.This was used as a spiking solution.
Preparation of Standard Related Substances Solutions in Drug ProductTablet blend was weighed and portions equivalent to about 75mg of
Lamivudine was transferred into a 100mL volumetric flask. Approximately70mL of diluent was added and sonicated for 15min to dissolve. Equal por-tions of the above standard related substances solutions were added andthe volume brought up to the mark with diluent. This was then filteredthrough 0.45 m or finer porosity membrane filter.
Note: The prepared solution was kept at 5�C to avoid any degradation.
Preparation of Test SolutionNot less than 20 tablets were weighed, finely powdered and portions
equivalent to about 75mg of Lamivudine was transfered into a 100mL volu-metric flask, about 70mL of diluent was added, sonicated for 15min anddiluted to volume with the same.
1182 C. Balakrishnan et al.
Dow
nloa
ded
by [
Mat
rix
Lab
orat
orie
s L
td],
[Su
bram
ania
n Iy
er]
at 2
0:14
08
Apr
il 20
13
The test solution contained equivalent to 750 mg=mL of Lamivudine,1500 mg=mL each of Zidovudine and Abacavir.
Filter the solution through 0.45m or finer porosity membrane filter. Theprepared placebo and test solutions were kept at 5�C to avoid anydegradation.
Method Validation
Procedure for HPLC AnalysisDuplicate injections of diluent were made into the chromatograph to
initiate the analysis process. Standard Solutionwas injected five times to ensuresystem suitability followed by placebo solutions and test solution. The chroma-tograms were recorded and peak responses measured at 266nm. Similarly,the chromatogram of standard solution and sample solution were processedat 310nm for calculating the related substance RS11 of Abacavir.
Peak(s) in the sample chromatogram due to placebo solution aredisregarded. The retention time of Lamivudine, Zidovudine, and Abacavirare about 14min, 32min, and 38min, respectively.
System Suitability Criteria and QuantificationThe RSD for the five replicate standard injections of Lamivudine peak,
Abacavir peak, and Zidovudine peak shall not be more than 5.0%. TheTailing factor for these three actives should not be more than 2.0.
The related substances (both known and unknown impurities) werecalculated for each drug individually. Other unknown impurities werecalculated against Lamivudine as this has the least strength. For Abacavir,molecular correction for conversion of salt to base form (Abacavir sulfateto Abacavir) was done.
RESULTS AND DISCUSSION OF VALIDATION PARAMETERS
The HPLC method used to analyze the related substances in Abacavirsulfate, Lamivudine, and Zidovudine tablet (300mg=150mg=300mg) wasvalidated according to current ICH guidelines. Typical method validationshall include the following given parameters (see Table 3), performednot necessarily in the same order.
SpecificitySelectivity of the method was established by analyzing the interference
due to excepients, related substances, and forced degradation, respectively.Placebo (only excepients) chromatogram showed no peaks in the region of
Quantification of Related Substances in Combination Antiretroviral Drug Product 1183
Dow
nloa
ded
by [
Mat
rix
Lab
orat
orie
s L
td],
[Su
bram
ania
n Iy
er]
at 2
0:14
08
Apr
il 20
13
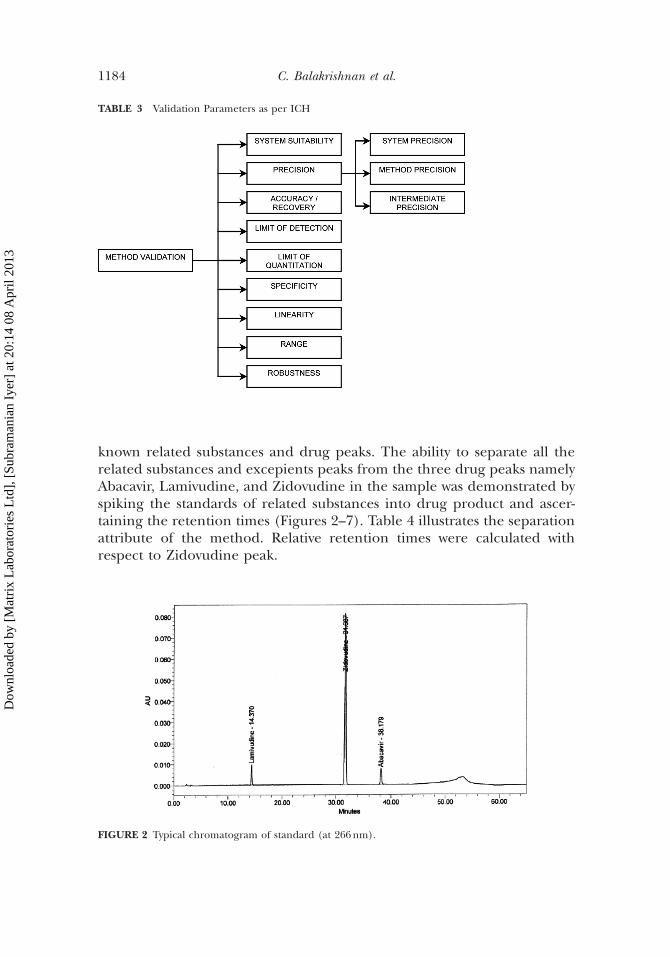
known related substances and drug peaks. The ability to separate all therelated substances and excepients peaks from the three drug peaks namelyAbacavir, Lamivudine, and Zidovudine in the sample was demonstrated byspiking the standards of related substances into drug product and ascer-taining the retention times (Figures 2–7). Table 4 illustrates the separationattribute of the method. Relative retention times were calculated withrespect to Zidovudine peak.
TABLE 3 Validation Parameters as per ICH
FIGURE 2 Typical chromatogram of standard (at 266nm).
1184 C. Balakrishnan et al.
Dow
nloa
ded
by [
Mat
rix
Lab
orat
orie
s L
td],
[Su
bram
ania
n Iy
er]
at 2
0:14
08
Apr
il 20
13

A study was conducted to demonstrate the effective separation ofdegradant from Abacavir, Lamivudine, and Zidovudine peak. To inducedegradation, drug product and placebo were exposed to the followingstress conditions, as given in Table 5.
Stressed samples were analysed using photo diode array detector.Degradant peaks were resolved from the drug peaks in all the chromato-grams. Peak purity data, the spectroscopic measure of any co-elution withthe analyte peak, of three drug peaks for spiked and unspiked samples indi-cate that there is spectral homogeneity across the peak. The peak purity was
FIGURE 3 Typical chromatogram of standard (at 310nm).
FIGURE 4 Chromatogram of unspiked sample at 266nm.
Quantification of Related Substances in Combination Antiretroviral Drug Product 1185
Dow
nloa
ded
by [
Mat
rix
Lab
orat
orie
s L
td],
[Su
bram
ania
n Iy
er]
at 2
0:14
08
Apr
il 20
13

observed for all the samples using Waters Empower software. It is observedthat the purity angle was less than purity threshold with the absence ofpurity flag. This indicates that the analyte peaks are homogeneous and freefrom any interference from degradant peaks. Thus, this method isconsidered to be specific and stability indicating.
The results are summarized in Table 5. Sample Chromatograms ofstress conditions are shown in Figures 8–10.
LinearityLinearity is established by injecting the impurity solution of concen-
tration ranging from near LOQ level to about 250% of the specificationconcentration. A graph was plotted between peak area and concentration.
FIGURE 6 Typical chromatogram of sample spiked with impurities at 266nm.
FIGURE 5 Chromatogram of unspiked sample at 310nm.
1186 C. Balakrishnan et al.
Dow
nloa
ded
by [
Mat
rix
Lab
orat
orie
s L
td],
[Su
bram
ania
n Iy
er]
at 2
0:14
08
Apr
il 20
13

The correlation coefficient was found to be 0.9999 indicating the methodto be linear from LOQ to 250% of the specification limit.
PrecisionMethod Precision. Six samples were prepared by spiking known related
substances (RS2, RS3, RS9, RS10, RS11 at 0.2%, RS6 at 0.15%, RS7 & RS8at 0.5%, RS4 at 1.0% and RS5 at 2.0% with respect to corresponding sampleconcentration) and analyzed to establish the repeatability of the method.
TABLE 4 HPLC Elution Pattern of Related Substances
S.No.Name of Related
SubstancesRetention Time (RT)of Related Substances
RT in SpikedSolution
Relative RT inSpiked Solution
1 RS1 7.263 7.709 0.252 RS2 8.331 8.351 0.273 RS3 12.869 12.871 0.414 RS4 13.301 13.364 0.435 RS5 18.031 18.060 0.586 RS6 26.186 26.183 0.847 RS7 29.545 29.656 0.958 RS8 30.477 30.537 0.979 RS9 33.185 33.276 1.06
10 RS10 50.180 50.247 1.6011 RS11 36.779 38.826 1.23
Active Ingredients
1 Lamivudine 14.32 Zidovudine 32.03 Abacavir 38.0
FIGURE 7 Typical chromatogram of sample spiked with impurities at 310nm.
Quantification of Related Substances in Combination Antiretroviral Drug Product 1187
Dow
nloa
ded
by [
Mat
rix
Lab
orat
orie
s L
td],
[Su
bram
ania
n Iy
er]
at 2
0:14
08
Apr
il 20
13
The % of individual known related substances and total relatedsubstances were calculated. RSD for individual and total related substanceswere found to be less than 15.0%.
Hence, the method is considered to be precise.
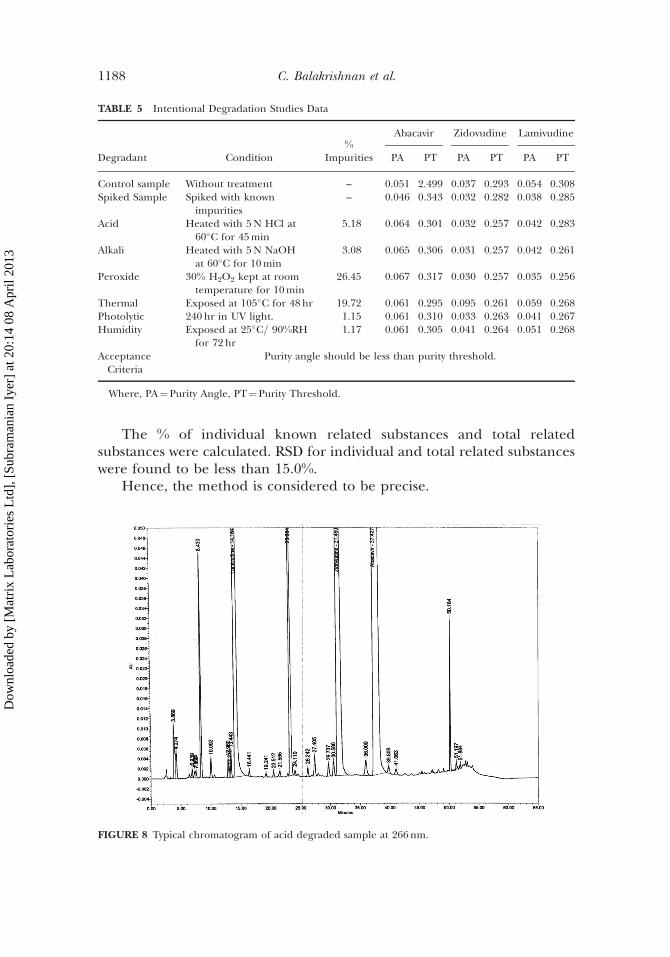
TABLE 5 Intentional Degradation Studies Data
Degradant Condition%
Impurities
Abacavir Zidovudine Lamivudine
PA PT PA PT PA PT
Control sample Without treatment – 0.051 2.499 0.037 0.293 0.054 0.308Spiked Sample Spiked with known
impurities– 0.046 0.343 0.032 0.282 0.038 0.285
Acid Heated with 5N HCl at60�C for 45min
5.18 0.064 0.301 0.032 0.257 0.042 0.283
Alkali Heated with 5N NaOHat 60�C for 10min
3.08 0.065 0.306 0.031 0.257 0.042 0.261
Peroxide 30% H2O2 kept at roomtemperature for 10min
26.45 0.067 0.317 0.030 0.257 0.035 0.256
Thermal Exposed at 105�C for 48hr 19.72 0.061 0.295 0.095 0.261 0.059 0.268Photolytic 240 hr in UV light. 1.15 0.061 0.310 0.033 0.263 0.041 0.267Humidity Exposed at 25�C= 90%RH
for 72 hr1.17 0.061 0.305 0.041 0.264 0.051 0.268
AcceptanceCriteria
Purity angle should be less than purity threshold.
Where, PA¼Purity Angle, PT¼Purity Threshold.
FIGURE 8 Typical chromatogram of acid degraded sample at 266 nm.
1188 C. Balakrishnan et al.
Dow
nloa
ded
by [
Mat
rix
Lab
orat
orie
s L
td],
[Su
bram
ania
n Iy
er]
at 2
0:14
08
Apr
il 20
13
Intermediate Precision=Ruggedness. To evaluate the reproducibility of themethod, six samples were prepared by different analyst, on different instru-ment, using different HPLC column and on different day. The system suit-ability parameters were evaluated as per the test method by both theanalysts and found to be within limits (Table 6).
Samples were prepared by spiking related substances at specificationlimit and analyzed. The % of individual known related substances and totalrelated substances were calculated. RSD for individual known relatedsubstances and total related substances were found to be less than 15.0%.
The overall RSD for both individual known related substances and totalrelated substances for method precision and intermediate precision werecalculated and found to be less than 15.0%.
Hence, the method is considered to be rugged. The results of precisiondata are summarized in Table 7.
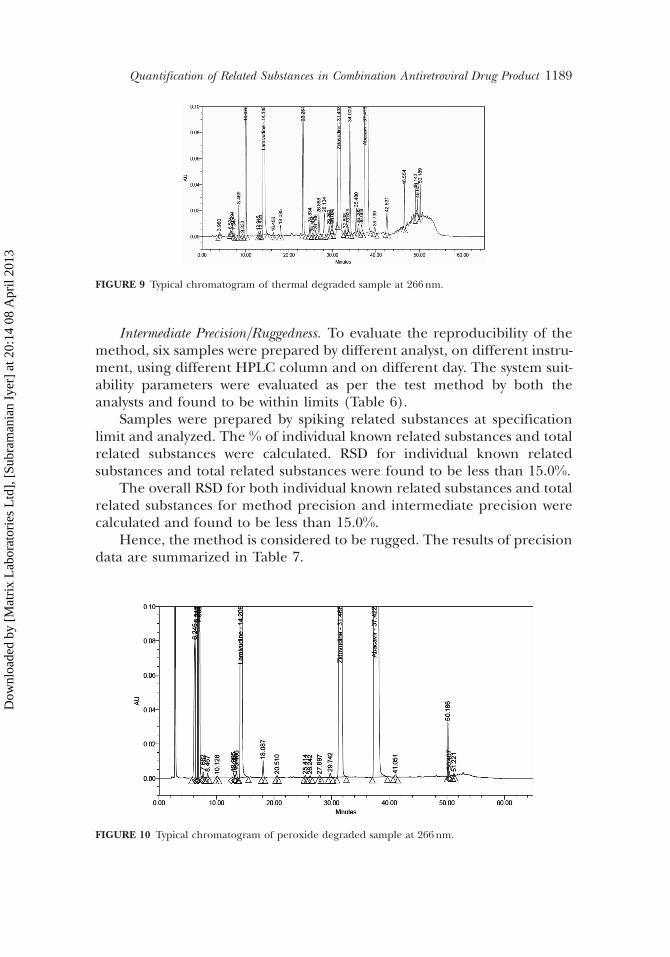
FIGURE 9 Typical chromatogram of thermal degraded sample at 266nm.
FIGURE 10 Typical chromatogram of peroxide degraded sample at 266nm.
Quantification of Related Substances in Combination Antiretroviral Drug Product 1189
Dow
nloa
ded
by [
Mat
rix
Lab
orat
orie
s L
td],
[Su
bram
ania
n Iy
er]
at 2
0:14
08
Apr
il 20
13
Accuracy (Recovery). Accuracy of the method is shown by performingrecovery studies for Abacavir, Lamivudine, and Zidovudine related sub-stances. All samples were prepared by spiking the test preparation atLOQ, 25%, 50%, 100%, 150%, and 250% of the specification concentrationof Abacavir, Lamivudine, and Zidovudine related substances in triplicate.
Recovery at LOQ level was performed by spiking impurity solutions atLOQ concentration in placebo solution in triplicate. The % Mean recoverycalculated for 25–250% was found to be near 100 and at LOQ level the low-est recovery observed was 91%. The highest RSD calculated at each level wasfound to be around 5%. Hence, the method is considered to be accuratefrom LOQ to 250% of the specification limit. The results are summarizedin Table 8.
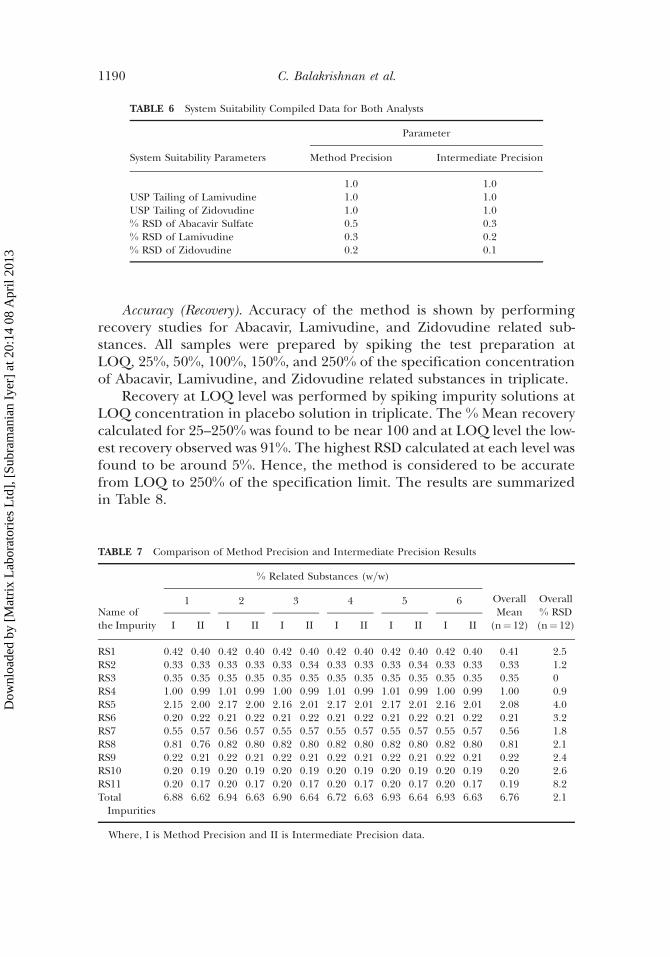
TABLE 6 System Suitability Compiled Data for Both Analysts
System Suitability Parameters
Parameter
Method Precision Intermediate Precision
1.0 1.0USP Tailing of Lamivudine 1.0 1.0USP Tailing of Zidovudine 1.0 1.0% RSD of Abacavir Sulfate 0.5 0.3% RSD of Lamivudine 0.3 0.2% RSD of Zidovudine 0.2 0.1
TABLE 7 Comparison of Method Precision and Intermediate Precision Results
Name ofthe Impurity
% Related Substances (w=w)
OverallMean
(n¼ 12)
Overall% RSD(n¼ 12)
1 2 3 4 5 6
I II I II I II I II I II I II
RS1 0.42 0.40 0.42 0.40 0.42 0.40 0.42 0.40 0.42 0.40 0.42 0.40 0.41 2.5RS2 0.33 0.33 0.33 0.33 0.33 0.34 0.33 0.33 0.33 0.34 0.33 0.33 0.33 1.2RS3 0.35 0.35 0.35 0.35 0.35 0.35 0.35 0.35 0.35 0.35 0.35 0.35 0.35 0RS4 1.00 0.99 1.01 0.99 1.00 0.99 1.01 0.99 1.01 0.99 1.00 0.99 1.00 0.9RS5 2.15 2.00 2.17 2.00 2.16 2.01 2.17 2.01 2.17 2.01 2.16 2.01 2.08 4.0RS6 0.20 0.22 0.21 0.22 0.21 0.22 0.21 0.22 0.21 0.22 0.21 0.22 0.21 3.2RS7 0.55 0.57 0.56 0.57 0.55 0.57 0.55 0.57 0.55 0.57 0.55 0.57 0.56 1.8RS8 0.81 0.76 0.82 0.80 0.82 0.80 0.82 0.80 0.82 0.80 0.82 0.80 0.81 2.1RS9 0.22 0.21 0.22 0.21 0.22 0.21 0.22 0.21 0.22 0.21 0.22 0.21 0.22 2.4RS10 0.20 0.19 0.20 0.19 0.20 0.19 0.20 0.19 0.20 0.19 0.20 0.19 0.20 2.6RS11 0.20 0.17 0.20 0.17 0.20 0.17 0.20 0.17 0.20 0.17 0.20 0.17 0.19 8.2TotalImpurities
6.88 6.62 6.94 6.63 6.90 6.64 6.72 6.63 6.93 6.64 6.93 6.63 6.76 2.1
Where, I is Method Precision and II is Intermediate Precision data.
1190 C. Balakrishnan et al.
Dow
nloa
ded
by [
Mat
rix
Lab
orat
orie
s L
td],
[Su
bram
ania
n Iy
er]
at 2
0:14
08
Apr
il 20
13

Range of the Test MethodBased on the above data on precision, linearity, and accuracy it can be
demonstrated that the range of the analytical procedure falls between LOQto 250% of related substances specification concentration.
Limit of Detection, Limit of Quantitation and Relative Response FactorLOD and LOQ were determined based on signal to noise ratio. LOD
was established by identifying the concentration which gives signal to noise(S=N) ratio of about 3 and LOQ that gives S=N ratio of about 10.
Limit of Quantitation (LOQ) for the related substances were found tobe in the region of 0.002 and 0.009% w=w. Limit of detection (LOD) wasdetermined in the range of 0.0006–0.0029% w=w. Precision of each impurityat LOQ level was conducted by replicate injections (n¼ 6) at that concen-tration. The RSD for % w=w of individual known related substances wascalculated and was found to be less than 15.0%.
The Relative Response factor (RRF) of known impurities was calculatedagainst their actives using the ratio of slope of impurities against slope ofActives. The established RRF values found between 0.8 and 1.2 was con-sidered 1.0 for calculating known impurities. The results are summarizedin Table 9.
RobustnessDeliberate changes to critical chromatographic parameters like flow
rate, column oven temperature, and pH of mobile phase, were made toascertain the robustness of the developed method. In all the experiments,standard solution and sample spiked with known impurities were processedfor chromatography to monitor the effect of these changes in chromato-graphic behavior of the peaks. System suitability criteria were used as thequantitative tool to note the effects.
TABLE 8 Accuracy Data for All Related Substances
% Mean Recovery (n¼ 3)
RecoveryLevel RS1 RS2 RS3 RS4 RS5 RS6 RS7 RS8 RS9 RS10 RS11
LOQ 107.0 109.5 108.1 95.7 98.9 98.9 91.3 94.4 102.1 91.4 95.925% 99.5 103.2 105.6 100.0 99.4 103.2 97.9 99.9 92.9 99.9 91.150% 101.9 97.0 102.9 100.1 99.4 102.9 97.9 100.4 93.3 98.0 92.2100% 102.6 99.3 101.7 99.1 99.5 103.0 97.6 98.7 98.6 98.2 95.7150% 104.0 101.9 101.2 100.4 100.6 104.0 98.5 100.3 99.9 98.4 95.4250% 102.5 97.7 100.2 99.2 99.4 102.7 97.2 98.9 99.5 97.7 96.2
Quantification of Related Substances in Combination Antiretroviral Drug Product 1191
Dow
nloa
ded
by [
Mat
rix
Lab
orat
orie
s L
td],
[Su
bram
ania
n Iy
er]
at 2
0:14
08
Apr
il 20
13

Effect of Variation in Flow Rate. The effect of flow rate was evaluated bymaking changes from the method flow of 1.0mL=min to 0.9mL=minand 1.1mL=min, respectively.
Data indicates that minor variation in the flow rate does not signifi-cantly affect the separation process.
Effect of Variation in Column Oven Temperature. The column oven tem-perature was altered from the method temperature of 35�C to 30�C and40�C, respectively.
On evaluation of the results, it can be concluded that the variation incolumn oven temperature does not affect the results significantly.
Effect of Variation in pH of Buffer in Mobile Phase. The effect of pH changewas evaluated by making deliberate changes to the pH of buffer. Mobilephases were prepared with pH 2.8, pH 3.0 (method pH), and pH 3.2 buffersolutions.
On evaluation of the results, it can be concluded that the variation inpH of buffer do not affect system suitability parameters significantly.
Solution Stability and Mobile Phase StabilityStability of Standard and Sample Solution at Refrigerated Temperature. During
initial method development, it was observed that Zidovudine impurity(RS 5) tends to degrade during storage at room temperature, hence sol-ution stability studies were carried out at refrigerated temperature (5�C).The standard and sample spiked with impurities at specification limit wasprepared and injected initially and at different time intervals up to 24hr.
TABLE 9 Limit of Detection (LOD), Limit of Quantitation (LOQ), and Relative Response Factor
Name ofthe Impurity
Concentration (% w=w) Signal to Noise (S=N) Ratio
Relative ResponseFactor (RRF)
Limit ofDetection
Limit ofQuantitation LOD LOQ
RS1 0.0022 0.0073 3 11 1.0RS2 0.0029 0.0096 4 10 0.7RS3 0.0013 0.0042 3 10 1.0RS4 0.0014 0.0048 3 11 1.0RS5 0.0006 0.0021 3 11 1.6RS6 0.0011 0.0036 3 10 1.0RS7 0.0020 0.0066 3 10 1.0RS8 0.0009 0.0029 3 11 1.0RS9 0.0024 0.0082 5 10 0.7RS10 0.0025 0.0084 5 11 1.0RS11 0.0024 0.0080 4 11 1.0
1192 C. Balakrishnan et al.
Dow
nloa
ded
by [
Mat
rix
Lab
orat
orie
s L
td],
[Su
bram
ania
n Iy
er]
at 2
0:14
08
Apr
il 20
13

Standard solution is found to be stable up to 24hr at refrigeratedtemperature. The % cumulative RSD of individual known impurities andtotal impurities were calculated for spiked sample up to 24hr. The Samplesolution is stable up to 24hr at refrigerated temperature.
Mobile Phase Stability. Mobile Phase stored in a well-closed container andkept at room temperature was evaluated. System suitability parameter wasmonitored on initial day and third day by injecting standard solution.
Sample solution spiked with related substances at specification limit wasinjected to monitor the RRT’s on initial day and third day. The system suit-ability parameter was found to be within the specified limit indicatingthe mobile phase to be stable for 3 days on bench top from the day ofpreparation.
Filter ValidationA study to establish the suitability of filters was conducted using filters
containing two different construction materials, namely 0.45 mm PVDF andNylon filter.
Standard solution and Sample solution spiked with all known impuri-ties at specification limit was prepared in duplicate and centrifuged, anda portion was filtered through the above two filters individually and ana-lyzed. The results were found to be with in the limit indicating that boththe filters were compatible for usage.
The % w=w of individual known impurities and total impurities werecalculated for centrifuged and filtered samples. The difference in % w=wof individual known impurities and total impurities of filtered samplesfrom centrifuge sample was found to be less than �0.04 and �0.1,respectively. Hence, it is concluded that the both PVDF and Nylon filtersare suitable.
HPLC METHOD MIGRATION TO ULTRA-PERFORMANCELIQUID CHROMATOGRAPHY - UPLCTM
A need was envisioned to develop faster method to reduce the runtime, the present method, although very precise and robust, was never-theless a time consuming exercise. An attempt was made to improve ana-lyst productivity by taking advantage of smaller particles column whichwould improve resolution speed and sensitivity without compromisingaccuracy.
Acquity UPLCTM System (Waters Corporation, Milford, MA, USA) wasused to migrate the method from conventional HPLC to UPLCTM. The sep-aration was scaled from a C18, 250� 4.6mm (5mm particles) HPLC column
Quantification of Related Substances in Combination Antiretroviral Drug Product 1193
Dow
nloa
ded
by [
Mat
rix
Lab
orat
orie
s L
td],
[Su
bram
ania
n Iy
er]
at 2
0:14
08
Apr
il 20
13

to a 2.1� 100mm ACQUITY UPLCTM BEH C18 column (1.7 mm particles).The separation was performed using acetate buffer (pH 3.0) the same asthat used for HPLC analysis, gradient profile was tweaked to suit theUPLCTM analysis. The mobile phase flow rate was kept at 0.35mL=min,the run time was reduced to 20min as compared to 65min in HPLC. Com-plete resolution was observed for all the relevant analytes as seen inchromatograms (Figures 11 and 12).
Mobile Phase for UPLCTM
Buffer: Acetate buffer was prepared by dissolving 475mg of ammoniumacetate in 250mL high pure water and adjusting the pH to 3.0 with 88%
FIGURE 12 Typical chromatogram of spiked sample on UPLC system at 310nm.
FIGURE 11 Typical chromatogram of spiked sample on UPLC at 266nm.
1194 C. Balakrishnan et al.
Dow
nloa
ded
by [
Mat
rix
Lab
orat
orie
s L
td],
[Su
bram
ania
n Iy
er]
at 2
0:14
08
Apr
il 20
13

trifluoroacetic acid (2.3mL in 1 liter water). Buffer was filtered through0.22 m membrane filter and degassed.
Organic Phase: Methanol : Acetonitrile (65: 35) v=v. 162.5mL of meth-anol was mixed well with 87.5mL of acetonitrile to make a total volume of250mL.
The final UPLCTM chromatographic condition is as given in Tables 10and 11 tabulates the elution pattern for all related substances usingUPLCTM.
TABLE 10 Chromatographic Condition UPLCTM
Column Acquity BEH column C18 (2.1mm� 100mm, 1.7 m)
Flow rate 0.35mL=minUV Wavelength 266nm and 310nmColumn temperature 30�CInjection volume 2.0mLRun time 20min
Gradient Program for Fast LC
Time in Minutes Buffer (%v=v) Organic Component (%v=v)
0 99.5 0.510 85.0 15.012 80.0 20.012.5 70.0 30.016.0 65.0 35.016.2 99.5 0.520.0 99.5 0.5
TABLE 11 Fast LC Elution Pattern of Related Substances
S.No. Name of Related Substances Retention Time in Minutes
1 RS1 2.5922 RS2 4.8153 RS3 6.5884 RS4 11.7215 RS5 2.7496 RS6 4.7007 RS7 10.7428 RS8 15.6109 RS9 9.652
10 RS10 10.91111 RS11 12.725
Active Analyte
1 Lamivudine 5.2452 Zidovudine 11.1003 Abacavir 13.267
Quantification of Related Substances in Combination Antiretroviral Drug Product 1195
Dow
nloa
ded
by [
Mat
rix
Lab
orat
orie
s L
td],
[Su
bram
ania
n Iy
er]
at 2
0:14
08
Apr
il 20
13

CONCLUSIONS
This article describes a robust validated stability indicating HPLCmethod for the simultaneous determination of Abacavir, Lamivudine,and Zidovudine related substances in tablets containing Abacavir sulfate,Lamivudine, and Zidovudine in tablets. The stress data reveals that themethod is selective and stability indicating. The proposed method achievesa limit of Quantitation in the region of 0.007% (median value) for therelated substances, several folds lower than the reporting threshold asper ICH guidelines. The method is sensitive, accurate, precise, and specificand has the capability of separating drug products from related substancesand excepients. The method can be applied to stability studies of drug pro-duct. Further, the same method was modified to use fast liquid chromato-graphy to reduce the analysis time. The method developed using sub 2mmshorter column on UPLCTM helped to reduce the chromatographic runtime by nearly one-third, from 65min to 20min, about 11 different impu-rities were successfully separated. The modified method appears to berobust, but needs to be validated for routine quality control use.
ACKNOWLEDGMENT
The authors thank Mylan Laboratories Limited for all their supportextended during the course of this work. The authors would sincerely liketo acknowledge the valuable contributions of Santosh Kumar Mohanty,Sivasankar Reddy, Sankar Sengamalai, and Srikanth Bommidi duringthis study.
REFERENCES
1. WHO. Antiretroviral Therapy for HIV Infection in Adults and Adolescents. Recommendations for aPublic Health Approach, 2006 revision.
2. Aymard, G.; Legrand, M.; Trichereau, N.; Diquet, B. Determination of Twelve Antiretroviral AgentsIn Human Plasma Sample using Reversed-Phase High-Performance Liquid Chromatography.Journal of Chromatogr. B 2000, 744, 227–240.
3. Chen, L. F.; Hoy, J.; Lewin, S. R. Ten Years of Highly Active Antiretroviral Therapy for HIV Infection.Med. J. Austral. 2007, 186 (3), 146–151.
4. Verweij-van Wissen, C. P. W. G. M.; Aarnoutse, R. E.; Burger, D. M. Simultaneous Determination ofthe HIV Nucleoside Analogue Reverse Transcriptase Inhibitors Lamivudine, Didanosine, Stavudine,Zidovudine and Abacavir in Human Plasma by Reversed Phase High Performance Liquid Chroma-tography. J. Chromatogr. B 2005, 816, 121–129.
5. Pereira, A. S.; Tidwell, R. R. Separation Methods for Nucleoside Analogues used for Treatment ofHIV-1 Infection. J. Chromatogr. B 2001, 764, 327–347.
6. Simon, V. A.; Thiam, M. D. Lipford, L. C. Determination of Serum Levels of Thirteen HumanImmunodeficiency Virus-Suppressing Drugs by High Performance Liquid Chromatography.J. Chromatogr. A 2001, 913, 447–453.
1196 C. Balakrishnan et al.
Dow
nloa
ded
by [
Mat
rix
Lab
orat
orie
s L
td],
[Su
bram
ania
n Iy
er]
at 2
0:14
08
Apr
il 20
13

7. Colombo, S.; Guignard, N.; Marzolini, C.; Telenti, A.; Biollaz, J.; Decosterd, L. A. Determination ofthe New HIV-Protease Inhibitor Atazanavir by Liquid Chromatography after Solid-Phase Extraction.J. Chromatogr. B 2004, 810, 25–34.
8. Dailly, E.; Raffi, F.; Jolliet, P. Determination of Atazanavir and Other Antiretroviral Drugs (Indinavir,Amprenavir, Nelfinavir and its Active Metabolite M8, Saquinavir, Ritonavir, Lopinavir, Nevirapineand Efavirenz) Plasma Levels by High Performance Liquid Chromatography with UV Detection.J. Chromatogr. B 2004, 813, 353–358.
9. Naser, L.; Rezk, R. R.; Tidwell, A.; Kashuba, D. M. High-Performance Liquid Chromatography Assayfor the Quantification of HIV Protease Inhibitors and Non-Nucleoside Reverse TranscriptaseInhibitors in Human Plasma. J. Chromatogr. B 2004, 805, 241–247.
10. Holland, D. T.; DiFrancesco, R.; Stone, J.; Hamzeh, F.; Connor, J. D.; Morse, G. D. Quality AssuranceProgram for Clinical Measurement of Antiretrovirals; AIDS Clinical Trials Group Proficiency TestingProgram for Pediatric and Adult Pharmacology Laboratories. Antimicrob. Agents Chemother. 2004, 48,824–831.
11. Indian Pharmacopeia 2010 Monograph on Abacavir, Lamivudine and Zidovudine Tablets, July 2007.12. Internal Communication: Analytical Method Validation Report For Related Substances of
Lamivudine, Nevirapine and Zidovudine in LamivudineþNevirapineþZidovudine Tablets byHPLC, Report Number: MVR-LNZT-RS-003=00.
Quantification of Related Substances in Combination Antiretroviral Drug Product 1197
Dow
nloa
ded
by [
Mat
rix
Lab
orat
orie
s L
td],
[Su
bram
ania
n Iy
er]
at 2
0:14
08
Apr
il 20
13