Development of the Environmental Assessment Tool (EAT) to Measure Organizational Physical and Social...
41
Development of the Environmental Assessment Tool (EAT) to Measure Organizational Physical and Social Support for Worksite Obesity Prevention Programs David M. DeJoy * , Department of Health Promotion & Behavior, College of Public Health, University of Georgia, Athens, GA 30602-6522, 706-542-4368, 706-542-4956 (fax), [email protected] Mark G. Wilson, Department of Health Promotion & Behavior, College of Public Health, University of Georgia Ron Z. Goetzel, Director, Institute for Health and Productivity Studies, Cornell University, Vice President, Consulting and Applied Research, Thomson Healthcare Ronald J. Ozminkowski, Associate Director, Institute for Health and Productivity Studies, Cornell University Shaohung Wang, Senior Statistician, Health and Productivity Research, Thomson Healthcare Kristin M. Baker, Department of Health Promotion & Behavior College of Public Health, University of Georgia; Research Analyst, Health and Productivity Research, Thomson Healthcare Heather M. Bowen, and Department of Health Promotion & Behavior, College of Public Health, University of Georgia Karen J. Tully Global Health Promotion Leader, Health Services Expertise Center, The Dow Chemical Company Abstract Objective—To describe the development, reliability, and validity of the Environmental Assessment Tool (EAT) for assessing worksite physical and social environmental support for obesity prevention. Methods—The EAT was developed using a multi-step process. Inter-rater reliability was estimated via Kappa and other measures. Concurrent and predictive validity were estimated using site-level correlations and person-level multiple regression analyses comparing EAT scores and employee absenteeism and healthcare expenditures. Results—Results show high inter-rater reliability and concurrent validity for many measures and predictive validity for absenteeism expenditures. Conclusions—The primary use of the EAT is as a physical and social environment assessment tool for worksite obesity prevention efforts. It can be used as a reliable and valid means to estimate relationships between environmental interventions and absenteeism and medical expenditures, provided those expenditures are for the same year that the EAT is administered. * Corresponding Author and Reprint Requests. NIH Public Access Author Manuscript J Occup Environ Med. Author manuscript; available in PMC 2010 August 8. Published in final edited form as: J Occup Environ Med. 2008 February ; 50(2): 126–137. doi:10.1097/JOM.0b013e318161b42a. NIH-PA Author Manuscript NIH-PA Author Manuscript NIH-PA Author Manuscript
-
Upload
johnshopkins -
Category
Documents
-
view
0 -
download
0
Transcript of Development of the Environmental Assessment Tool (EAT) to Measure Organizational Physical and Social...
Development of the Environmental Assessment Tool (EAT) toMeasure Organizational Physical and Social Support forWorksite Obesity Prevention Programs
David M. DeJoy*,Department of Health Promotion & Behavior, College of Public Health, University of Georgia,Athens, GA 30602-6522, 706-542-4368, 706-542-4956 (fax), [email protected]
Mark G. Wilson,Department of Health Promotion & Behavior, College of Public Health, University of Georgia
Ron Z. Goetzel,Director, Institute for Health and Productivity Studies, Cornell University, Vice President,Consulting and Applied Research, Thomson Healthcare
Ronald J. Ozminkowski,Associate Director, Institute for Health and Productivity Studies, Cornell University
Shaohung Wang,Senior Statistician, Health and Productivity Research, Thomson Healthcare
Kristin M. Baker,Department of Health Promotion & Behavior College of Public Health, University of Georgia;Research Analyst, Health and Productivity Research, Thomson Healthcare
Heather M. Bowen, andDepartment of Health Promotion & Behavior, College of Public Health, University of Georgia
Karen J. TullyGlobal Health Promotion Leader, Health Services Expertise Center, The Dow Chemical Company
AbstractObjective—To describe the development, reliability, and validity of the EnvironmentalAssessment Tool (EAT) for assessing worksite physical and social environmental support forobesity prevention.
Methods—The EAT was developed using a multi-step process. Inter-rater reliability wasestimated via Kappa and other measures. Concurrent and predictive validity were estimated usingsite-level correlations and person-level multiple regression analyses comparing EAT scores andemployee absenteeism and healthcare expenditures.
Results—Results show high inter-rater reliability and concurrent validity for many measures andpredictive validity for absenteeism expenditures.
Conclusions—The primary use of the EAT is as a physical and social environment assessmenttool for worksite obesity prevention efforts. It can be used as a reliable and valid means to estimaterelationships between environmental interventions and absenteeism and medical expenditures,provided those expenditures are for the same year that the EAT is administered.
*Corresponding Author and Reprint Requests.
NIH Public AccessAuthor ManuscriptJ Occup Environ Med. Author manuscript; available in PMC 2010 August 8.
Published in final edited form as:J Occup Environ Med. 2008 February ; 50(2): 126–137. doi:10.1097/JOM.0b013e318161b42a.
NIH
-PA Author Manuscript
NIH
-PA Author Manuscript
NIH
-PA Author Manuscript

INTRODUCTIONObesity is a major public health concern, with recent surveys showing about two thirds ofadults in the U.S. classified as overweight or obese1 and consequently at risk for health careproblems such as type-2 diabetes, cardiovascular disease, stroke, cancer, osteoarthritis,depression, gallbladder disease, and respiratory disorders.2, 3 The high incidence of obesityand its relationship to other major medical disorders makes it a costly condition, accountingfor an estimated 5.5% – 7.0% of U.S. health expenditures between 1986 and 1995.4 Inaddition, obese adults have approximately 36% higher medical expenditures than theirnormal weight counterparts5 and higher rates of absenteeism and presenteeism.6-8
To help control costs and improve the health of their workers, employers are introducing avariety of health promotion and risk reduction programs including those that address thegrowing problem of overweight and obese workers. Worksite health promotion programsaim to improve the health status of workers by offering individual risk reductioninterventions coupled with efforts to address environmental, social and ecological forces thatcontribute to unhealthy behaviors. Specifically, employers are taking steps to address the“obesogenic” environment at the workplace that promotes overeating and lack of exercise.9Changing the work environment to induce positive health improvements is supported bysocial-ecological theory, which emphasizes the multi-level interaction of individuals andtheir physical and social environment, and the effect of this interaction on individual healthbehaviors.10, 11
An obesogenic environment encourages excess intake of calories and discourages physicalactivity leading to weight gain.9 Recent social and environmental secular trends, includingproviding greater access to and increased marketing of high calorie and high fat foodproducts in combination with more sedentary leisure activities, contribute to the obesogenicenvironment.12 A large source of added sugars comes from soft drinks that are abundantlyavailable in worksite and school vending machines.12 Due to time pressures andconvenience, individuals and families are eating out at restaurants more than ever, and foodsaway from home tend to be more energy and fat dense.12 Additionally, psychologically,consumers aim to get more for less, thus “supersizing” has become a common marketingstrategy for fast food restaurants.13 To add to this, physical activity levels among adults havedeclined.12 With the convenience of the automobile, fewer people walk or bike12 and theyspend more of their leisure time sitting in front of televisions and computers.12 Finally,heavy manual labor occupations have declined over the past few decades being replaced bymore sedentary jobs.12
The U.S. Department of Health and Human Services (DHHS) Healthy People 2010 goalsemphasize the worksite is an important setting for introducing environmental and ecologicalchanges aimed at reducing the incidence of obesity among workers.14 Adults spend asignificant portion of their waking hours at work and opportunities abound for changing thework environment so that it promotes healthier lifestyles. Introducing low costenvironmental and ecological interventions at the worksite can support individual healthimprovement efforts by workers aimed at reducing overweight and obesity.
Current Tools to Evaluate Workplace Environments Supporting Health ImprovementEfforts
To measure the extent to which physical and social elements of an environment supporthealth improvement efforts, a number of assessment tools have been developed.Specifically, two kinds of environmental assessment instruments have been described in theliterature: those relying on perceptions and self-report and those relying on first-handobservation. The two types of instruments are intended for different kinds of uses.
DeJoy et al. Page 2
J Occup Environ Med. Author manuscript; available in PMC 2010 August 8.
NIH
-PA Author Manuscript
NIH
-PA Author Manuscript
NIH
-PA Author Manuscript
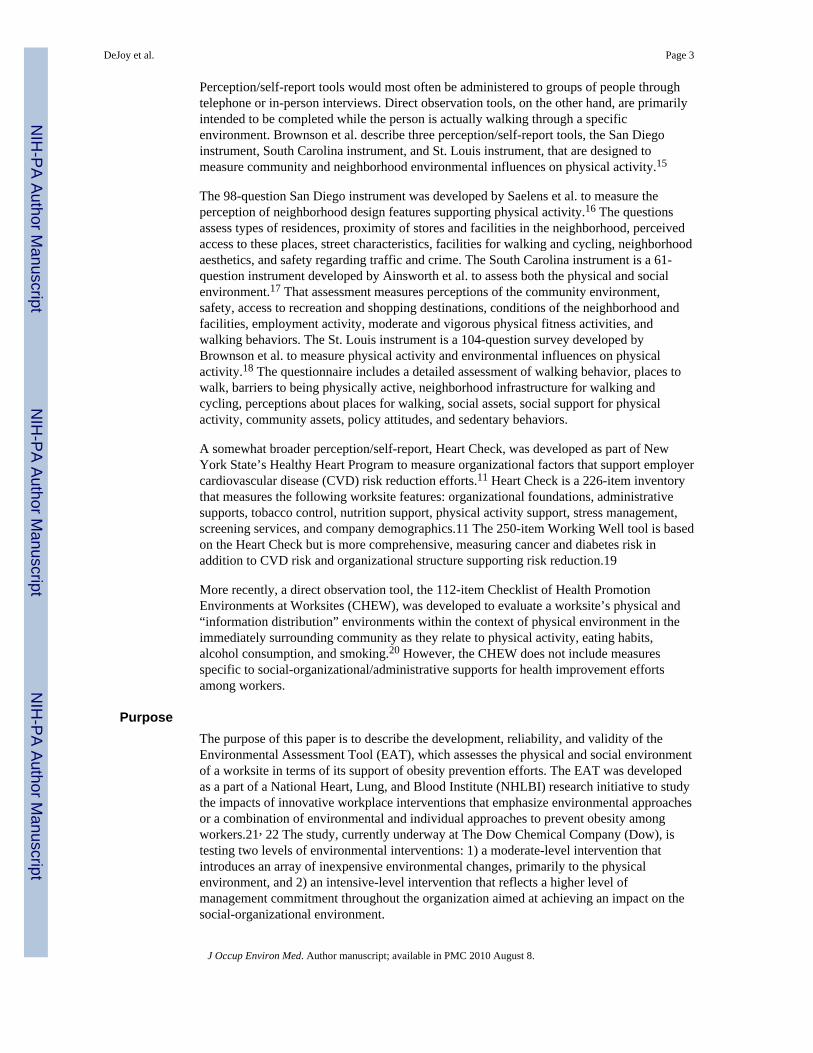
Perception/self-report tools would most often be administered to groups of people throughtelephone or in-person interviews. Direct observation tools, on the other hand, are primarilyintended to be completed while the person is actually walking through a specificenvironment. Brownson et al. describe three perception/self-report tools, the San Diegoinstrument, South Carolina instrument, and St. Louis instrument, that are designed tomeasure community and neighborhood environmental influences on physical activity.15
The 98-question San Diego instrument was developed by Saelens et al. to measure theperception of neighborhood design features supporting physical activity.16 The questionsassess types of residences, proximity of stores and facilities in the neighborhood, perceivedaccess to these places, street characteristics, facilities for walking and cycling, neighborhoodaesthetics, and safety regarding traffic and crime. The South Carolina instrument is a 61-question instrument developed by Ainsworth et al. to assess both the physical and socialenvironment.17 That assessment measures perceptions of the community environment,safety, access to recreation and shopping destinations, conditions of the neighborhood andfacilities, employment activity, moderate and vigorous physical fitness activities, andwalking behaviors. The St. Louis instrument is a 104-question survey developed byBrownson et al. to measure physical activity and environmental influences on physicalactivity.18 The questionnaire includes a detailed assessment of walking behavior, places towalk, barriers to being physically active, neighborhood infrastructure for walking andcycling, perceptions about places for walking, social assets, social support for physicalactivity, community assets, policy attitudes, and sedentary behaviors.
A somewhat broader perception/self-report, Heart Check, was developed as part of NewYork State’s Healthy Heart Program to measure organizational factors that support employercardiovascular disease (CVD) risk reduction efforts.11 Heart Check is a 226-item inventorythat measures the following worksite features: organizational foundations, administrativesupports, tobacco control, nutrition support, physical activity support, stress management,screening services, and company demographics.11 The 250-item Working Well tool is basedon the Heart Check but is more comprehensive, measuring cancer and diabetes risk inaddition to CVD risk and organizational structure supporting risk reduction.19
More recently, a direct observation tool, the 112-item Checklist of Health PromotionEnvironments at Worksites (CHEW), was developed to evaluate a worksite’s physical and“information distribution” environments within the context of physical environment in theimmediately surrounding community as they relate to physical activity, eating habits,alcohol consumption, and smoking.20 However, the CHEW does not include measuresspecific to social-organizational/administrative supports for health improvement effortsamong workers.
PurposeThe purpose of this paper is to describe the development, reliability, and validity of theEnvironmental Assessment Tool (EAT), which assesses the physical and social environmentof a worksite in terms of its support of obesity prevention efforts. The EAT was developedas a part of a National Heart, Lung, and Blood Institute (NHLBI) research initiative to studythe impacts of innovative workplace interventions that emphasize environmental approachesor a combination of environmental and individual approaches to prevent obesity amongworkers.21, 22 The study, currently underway at The Dow Chemical Company (Dow), istesting two levels of environmental interventions: 1) a moderate-level intervention thatintroduces an array of inexpensive environmental changes, primarily to the physicalenvironment, and 2) an intensive-level intervention that reflects a higher level ofmanagement commitment throughout the organization aimed at achieving an impact on thesocial-organizational environment.
DeJoy et al. Page 3
J Occup Environ Med. Author manuscript; available in PMC 2010 August 8.
NIH
-PA Author Manuscript
NIH
-PA Author Manuscript
NIH
-PA Author Manuscript
Our review of previous environmental assessment instruments found that they primarilyaddressed physical activity-related issues at the workplace and only touched uponenvironmental supports for obesity prevention and healthy eating. In addition, theinstruments reviewed supported data collection through observation of the physicalenvironment and non-evaluative description of findings. Since our studies called for thescoring and valuing of environmental supports for obesity prevention efforts, and anassessment of progress over time, we needed an instrument that would score ourobservations using more objective and quantifiable methods. Thus, the EAT was developedand based on previous knowledge and experience gained through the administration of theCHEW and Heart Check tools.
METHODSTwelve Dow sites began implementing individual and environmental interventions toaddress overweight and obesity in 2006. These interventions were preceded by a year offormative research and intervention design.22 The EAT was developed during that formativeresearch period in three stages: 1) contextual analysis and literature review, 2) prototypedevelopment, and 3) pilot testing. It was used to document aspects of physical and socialenvironments that may influence healthy eating and physical activity and was firstadministered before interventions began (in the spring and summer of 2005), and annuallythereafter.
Contextual Analysis and Literature ReviewThe contextual analysis involved working cooperatively with Dow corporate staff to becomefamiliar with the specific work and operational environments and the broader site andlocation characteristics of the facilities participating in the project. Site characteristics wereevaluated in terms of the number, types, sizes, and arrangement of buildings; parkingfacilities; roadways; green space areas; and safety and security requirements. Locationcharacteristics were assessed in terms of whether the facilities were located in urban,suburban, or rural areas; access and availability of stores, restaurants, and recreationalfacilities; typical commuting and transportation options; and climate and weather conditions.
Construction of the EAT was based on standards of best practices regarding worksite healthpromotion interventions reported in the literature.12, 23-50 As noted previously, the EATdevelopers adapted several concepts found in the CHEW and Heart Check instruments, aswell as best practices reported in the literature related to environmental and social-ecologicalworksite interventions. Using the CHEW and Heart Check instruments as a basis, EATdevelopers integrated the physical characteristics of the worksite, features of the informationenvironment, and characteristics of the immediate neighborhood around the workplace fromthe CHEW and the characteristics of employer and administrative support systems from theHeart Check. Questions for the EAT were based on these concepts as they applied toenvironmental and social supports for physical activity and obesity prevention. EAT itemsaddressed the job factors, physical and social-organizational work environment, and socio-cultural and economic/legal environment variables found in DeJoy and Southern’s social-ecological model for workplace environmental interventions, upon which the Dowenvironmental interventions are based.51
Prototype DevelopmentThe information sources described above were used to develop a series of prototypeinstruments that were reviewed and critiqued by the project team through conference callsand face-to-face meetings. The project team consisted of specialists in worksite healthpromotion, nutrition and dietetics, exercise science, communications, occupational safety
DeJoy et al. Page 4
J Occup Environ Med. Author manuscript; available in PMC 2010 August 8.
NIH
-PA Author Manuscript
NIH
-PA Author Manuscript
NIH
-PA Author Manuscript

and health, applied psychology, and statistics and research methods. Professional staffmembers from the partnering organization were also actively involved in this review andrevision process. As the full instrument took form, project team members were asked toindependently review the instrument for completeness and to rate the various items in termsof their relative importance to supporting healthy eating, weight management, and physicalactivity. This rating exercise was a precursor to developing a scoring system for the EAT.
The final EAT prototype consisted of 105 items broken into two sections, Section I wascompleted by site staff and Section II was completed by independent observers who touredthe site and recorded their observations. Section I consisted of questions that could best beanswered by those closely affiliated with the physical plant, and included such topics aswork rules and requirements, current health promotion programs and services, and formalpolicies that support or facilitate healthy eating and/or physical activity participation.
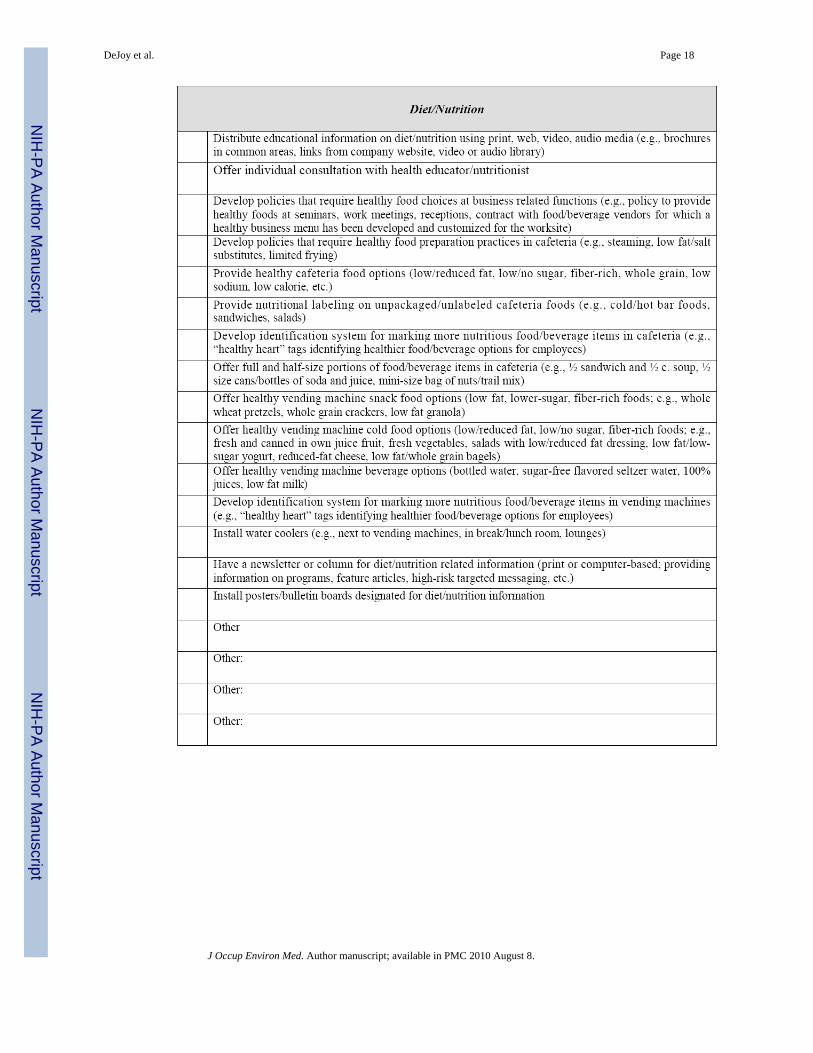
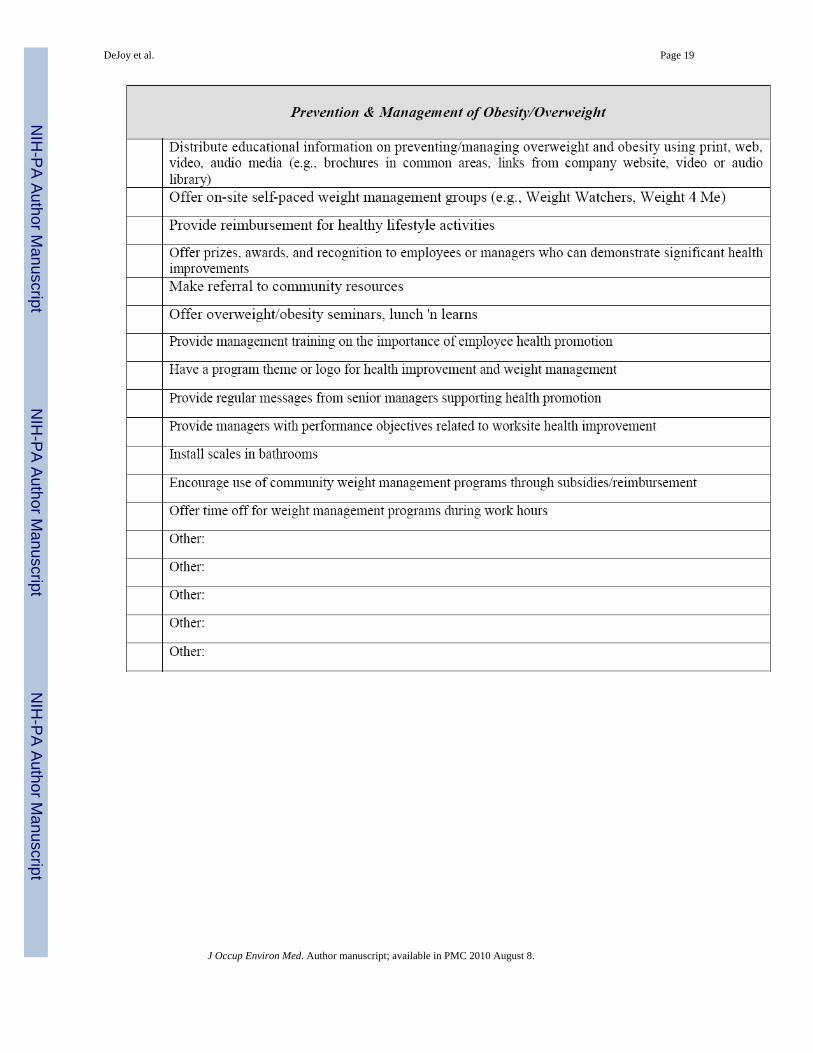
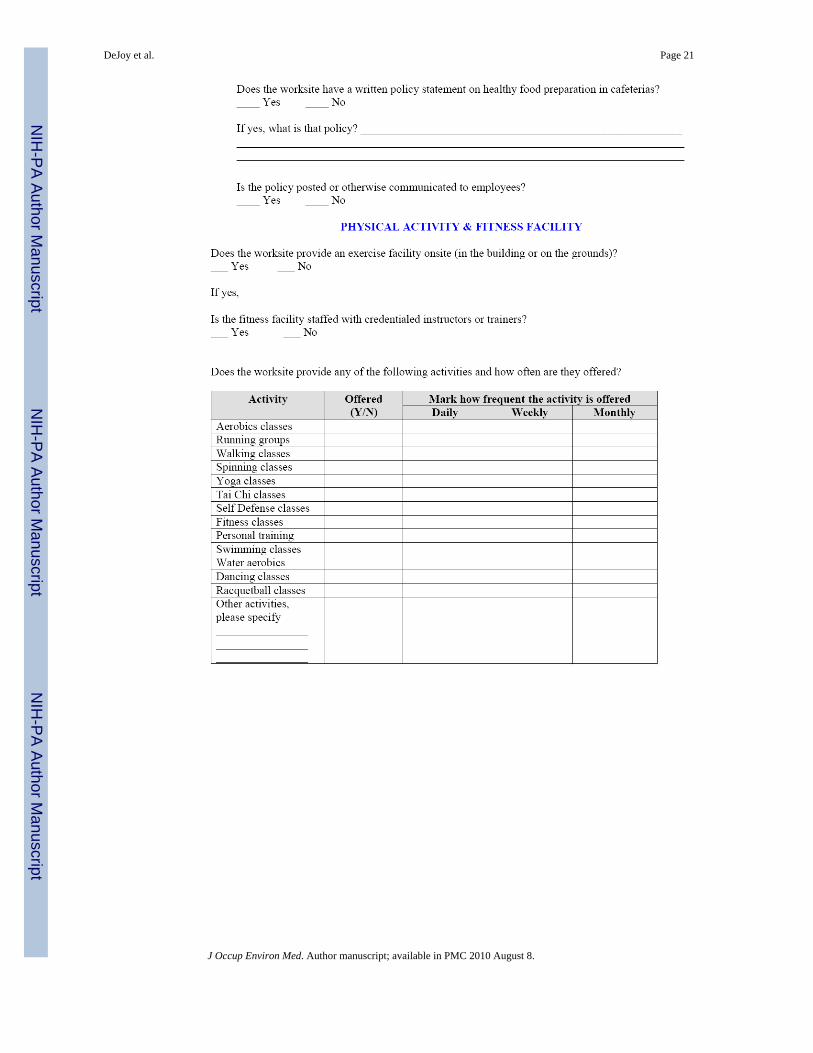
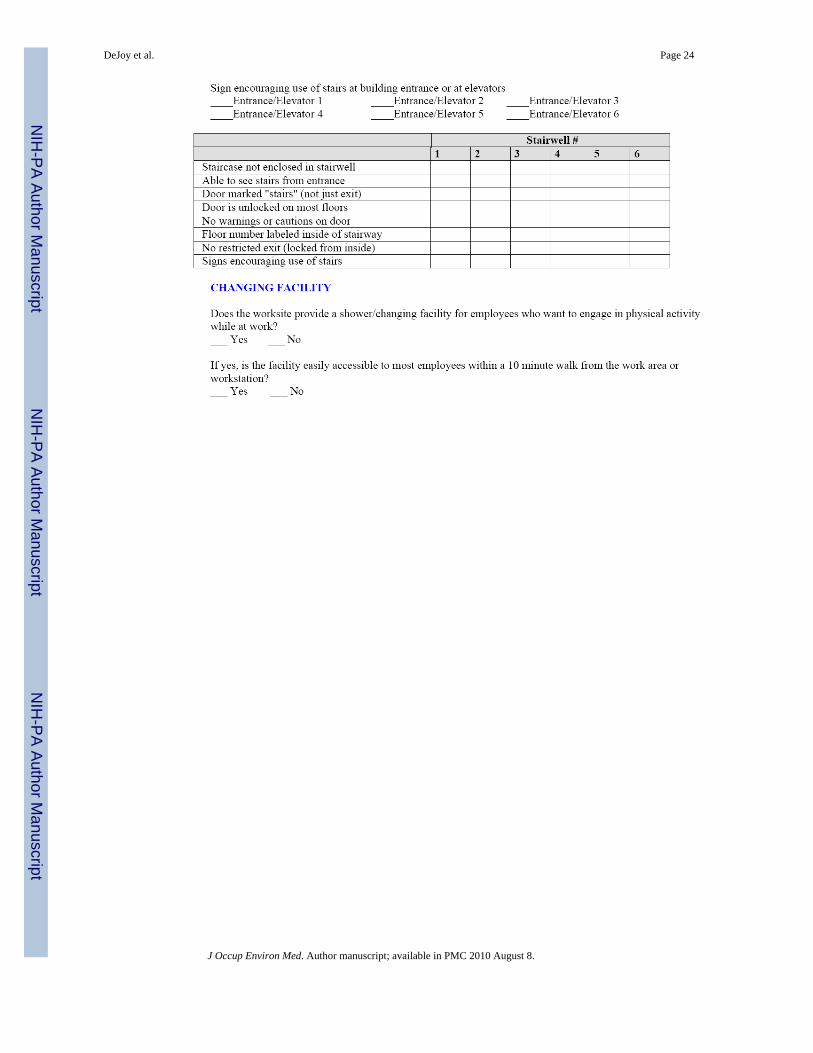
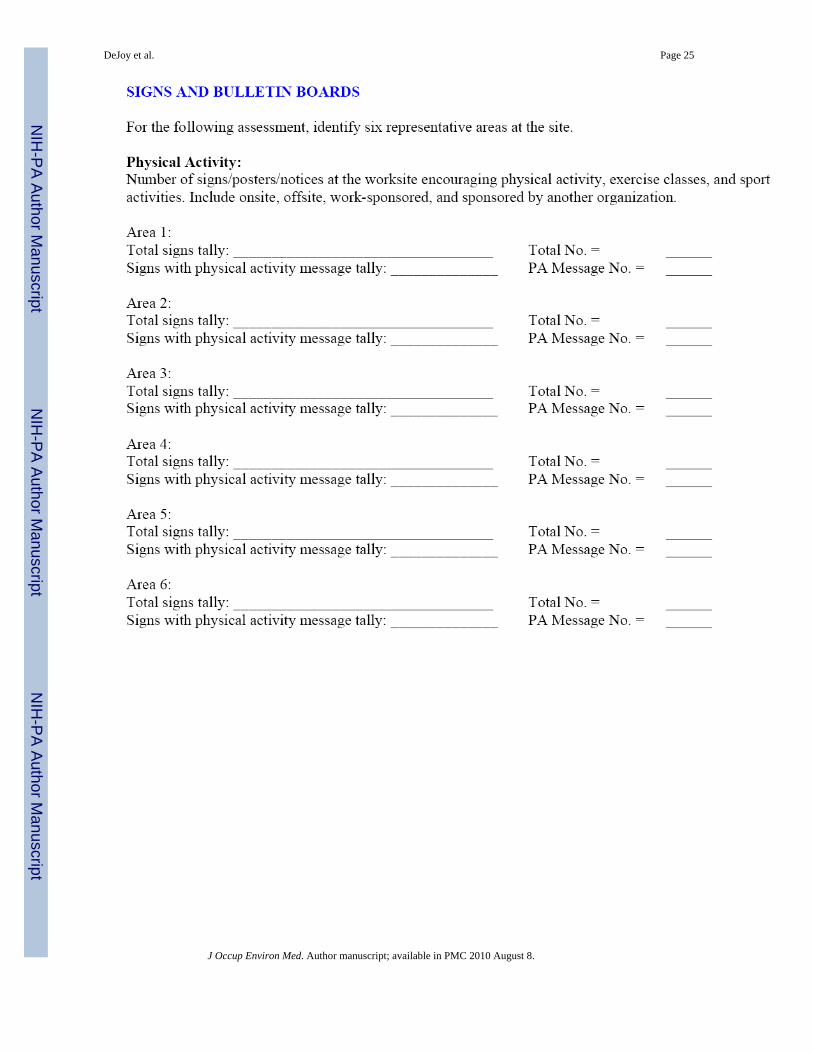
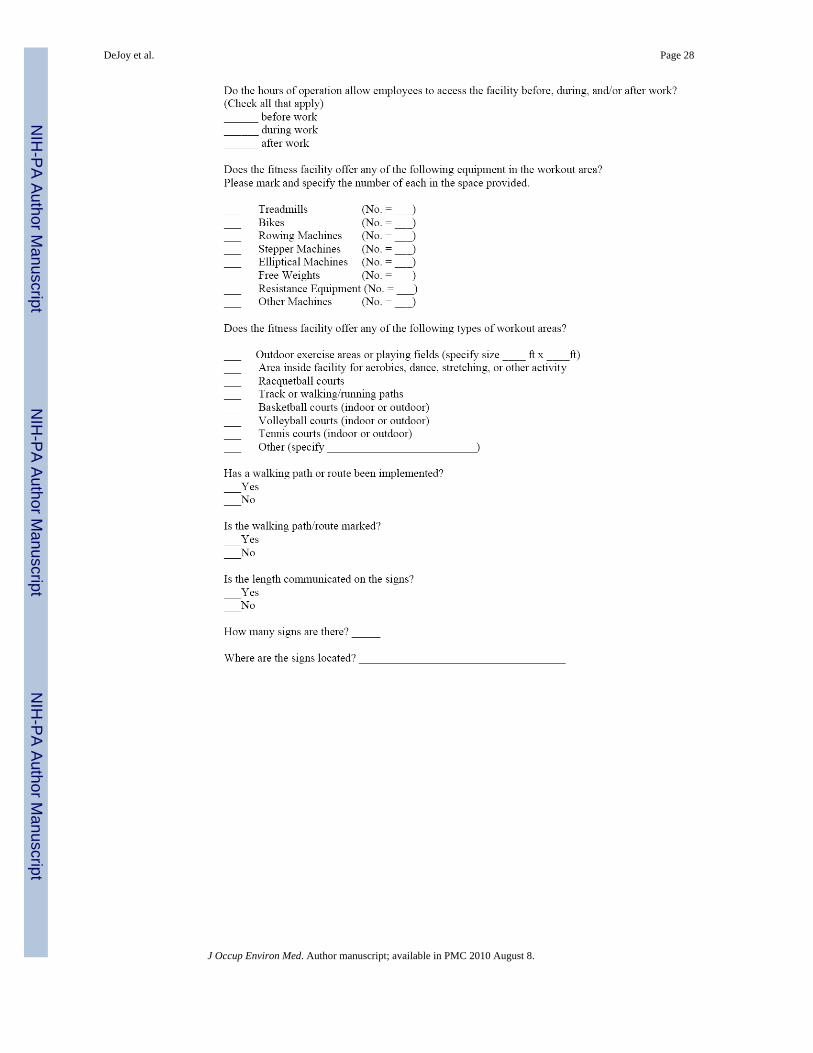
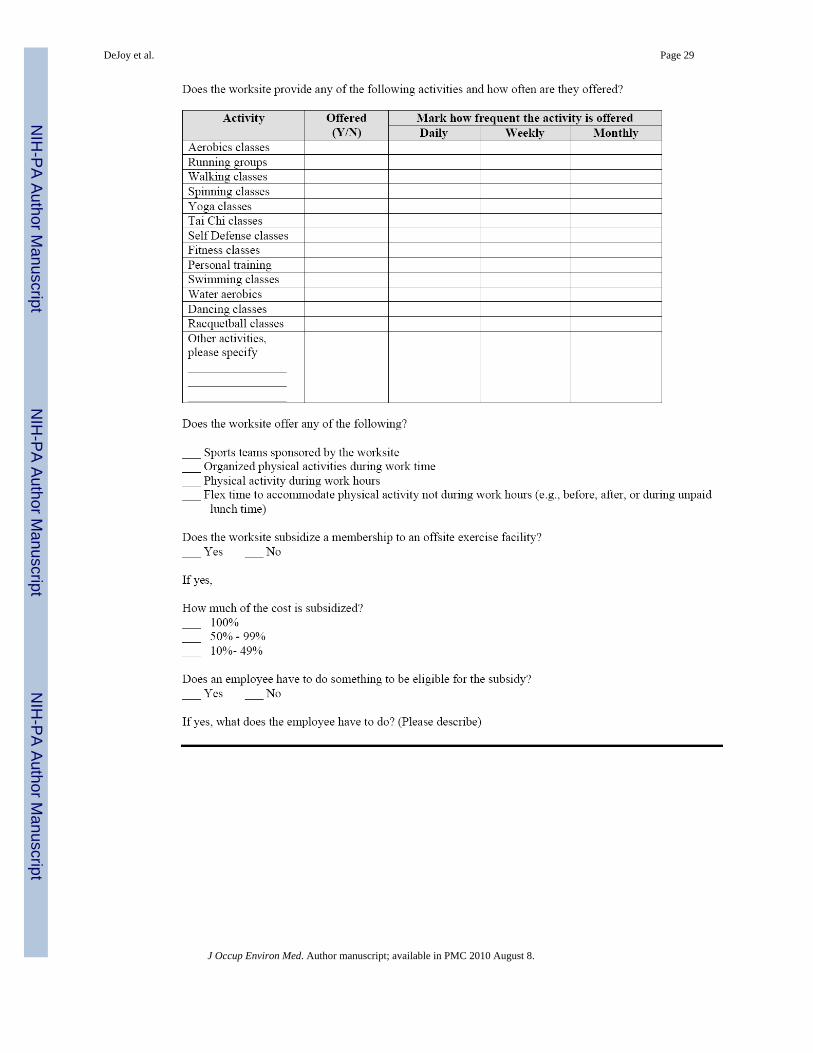
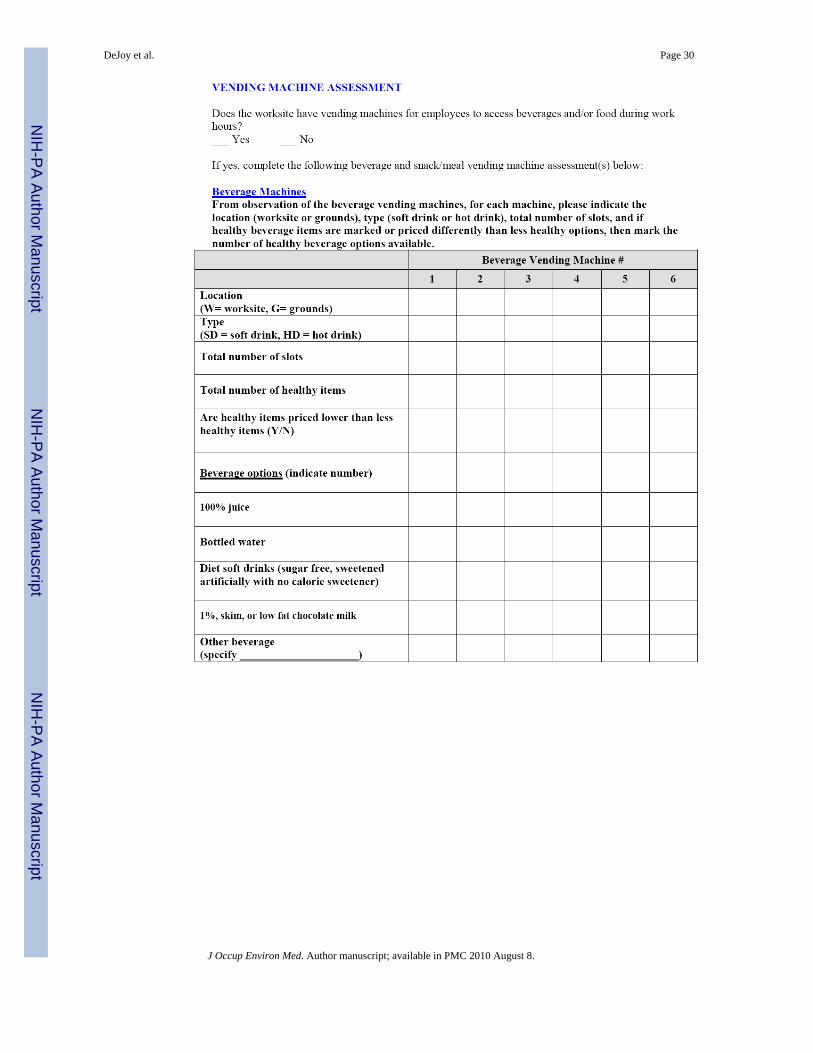
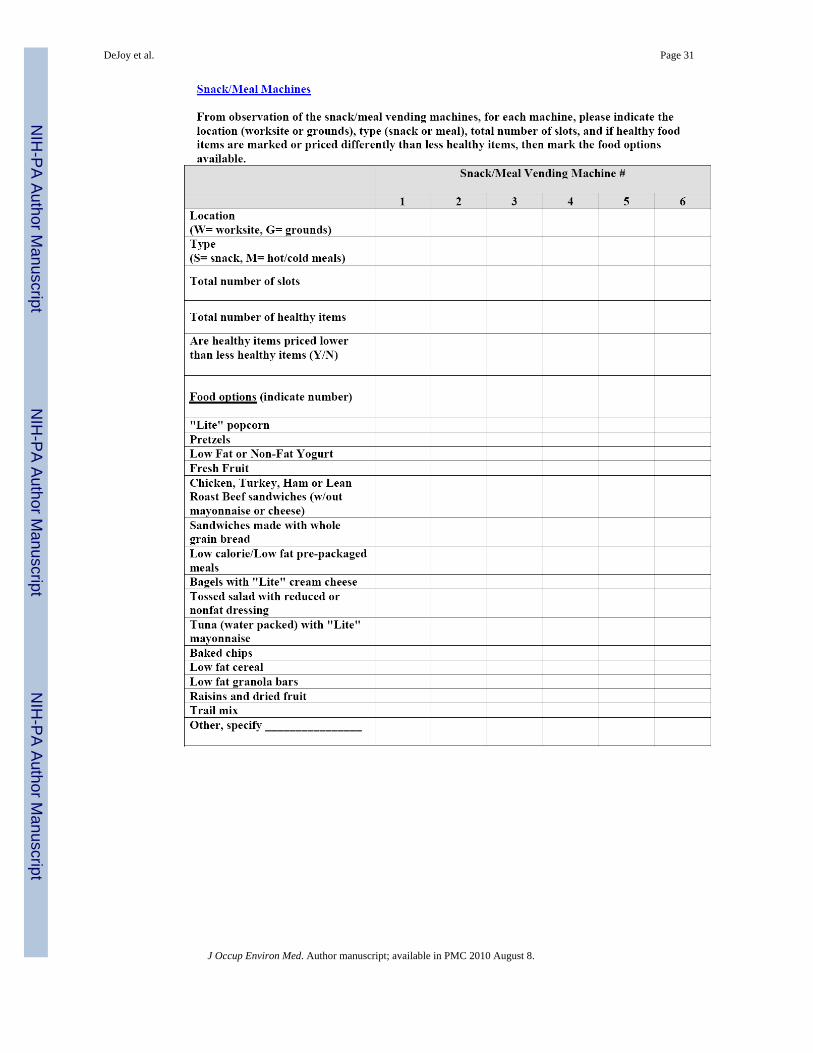
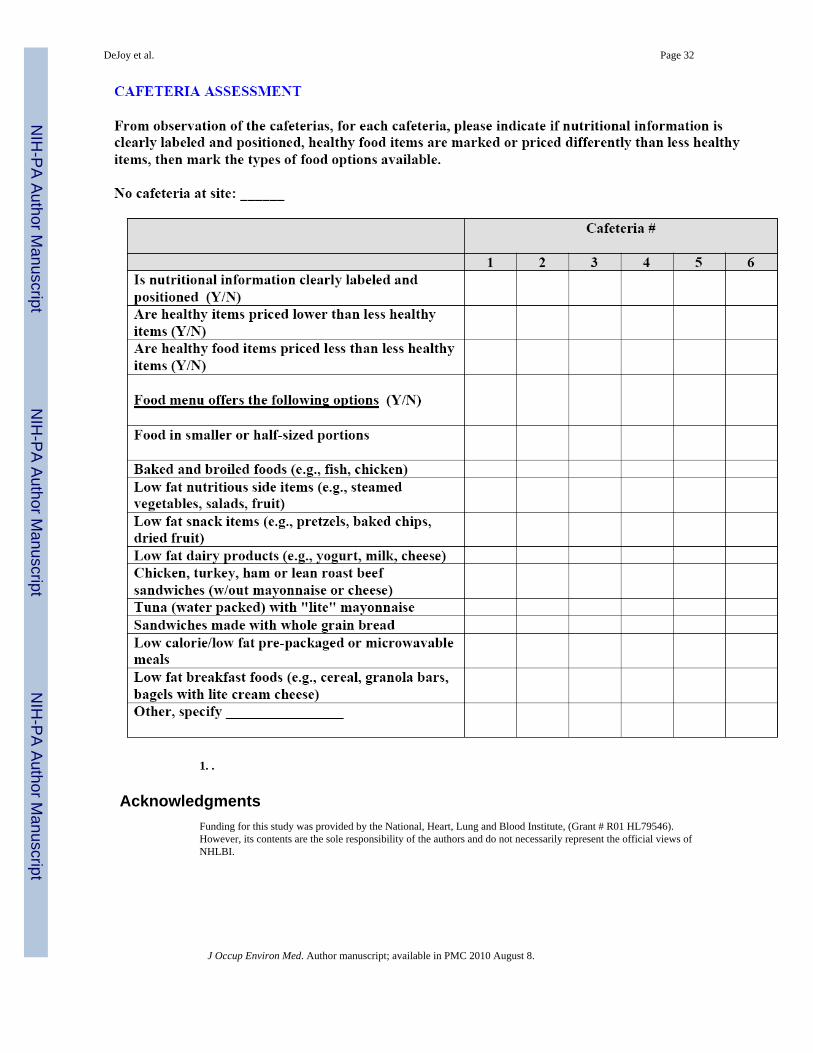
The items in the EAT, including those from Sections I and II, can be broken down into threesubscales pertaining to 1) Physical Activity, 2) Nutrition/Weight Management, and 3)Organizational Characteristics and Support. The Physical Activity scale assesses access toand availability of parking for motor vehicles and facilities for securing bicycles; stairs andelevators; showers and changing facilities; signage and bulletin boards containing messagespertinent to physical activity; and physical activity and fitness facilities. The Nutrition/Weight Management scale focuses on vending, cafeteria, and other food service options andfacilities, and signage and bulletin boards pertinent to diet and weight management. TheOrganizational Characteristics and Support scale assesses general site characteristics, workrules, written policies, and existing health promotion programming and services.
The EAT tool is comprised primarily of dichotomous (yes and no) items. The number of yesanswers in each section constitutes the score for that section on the EAT. If it is unclear as towhether an item should be scored at all, researchers label the item as N/AP, indicating that itis not applicable to the site, or as N/AV, indicating the feature is “not available” at the site.During initial use of the EAT, paper forms were completed by site staff (Section I) and theindependent observers (Section II). In subsequent applications, Section I was distributedelectronically to site staff, and Section II was completed using computer tablets by on-siteindependent project team observers. Using database software, a variety of checklists,windows, boxes, and drop-down menus were developed to facilitate data collection andanalysis. Data collection and scoring were accomplished at different times and by differentindividuals. The procedures for scoring the EAT are described below.
Pilot Test and Tool RefinementSection of early EAT prototypes were field tested for completeness and practicality incampus buildings and facilities at the University of Georgia. Once a final prototype wasdeveloped, the complete instrument was pilot tested at one of the Dow control sitesparticipating in the study. As described above, Section I was completed by company staffand Section II was completed by project team members during a scheduled site visit. Whilea single project team member was responsible for completing the Section II form during thepilot test, other team members and company representatives were present to observe theprocess and to take notes. At the end of the site tour, the project team and company staff metto review the use and performance of both parts of the EAT.
As a result of the pilot testing, several modifications were made to the assessment tool. First,the section describing food preparation facilities was expanded to reflect the reality thatmany Dow employees had access to full kitchen facilities while at work not just refrigeratorsand microwaves. Second, to facilitate quicker and more accurate assessment of vendingmachine options, every snack and beverage item contained in each vending machine was
DeJoy et al. Page 5
J Occup Environ Med. Author manuscript; available in PMC 2010 August 8.
NIH
-PA Author Manuscript
NIH
-PA Author Manuscript
NIH
-PA Author Manuscript
recorded instead of attempting to classify each item as healthy or unhealthy while collectingdata in the field. Third, some of the questions originally placed in Section II were moved toSection I because they could be more accurately answered by site staff. Fourth, the jobcategories included in Section I were modified to better reflect the specific terminology usedby site-level personnel. Finally, a small number of questions were deleted because they wereduplicative of similar information collected elsewhere in the instrument.
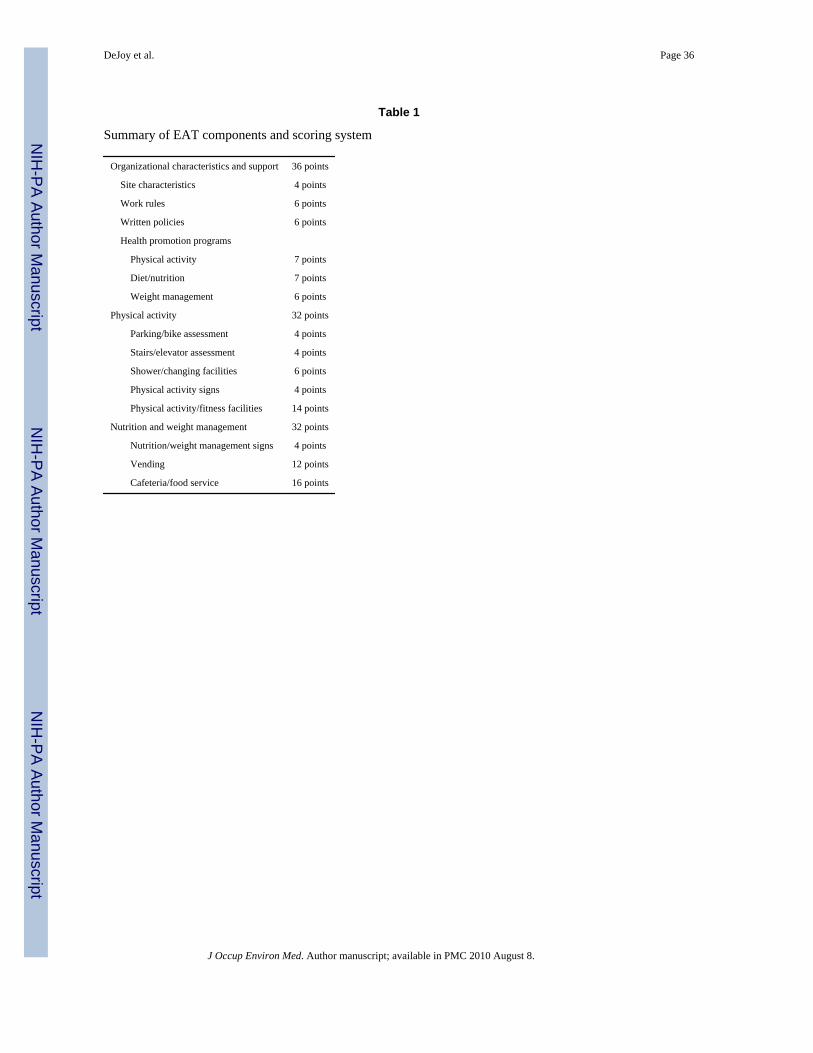
Scoring SystemA 100-point scoring system was developed to allow for quantitative comparisons ofenvironmental supports across control and treatment sites, and to monitor changes over time.Table 1 shows the major components of each of the three subscales, and the point valuesassigned to each. A weighting exercise was performed to assess the relative importance ofeach component in terms of supporting Nutrition/Weight Management and Physical Activityprograms in the workplace. This weighting was performed by three specialists in workplacehealth promotion who made independent judgments about the importance of each item onthe EAT based on their experience in worksite health promotion and knowledge of therelevant intervention effectiveness literatures. Equal total importance was assigned to thePhysical Activity and Nutrition/Weight Management subscales (i.e., 32 points each). Itemswith N/AP and N/AV responses are scored the same as a no response because theenvironmental component being measured is not in place; therefore, not available tofacilitate behavior change. However, the N/AP or N/AV responses are useful in interpretingthe results (e.g., the site did not have a healthy cafeteria policy because it does not have acafeteria onsite). The rating process resulted in a somewhat higher total point value for theOrganizational Characteristics and Support subscale based largely on the enabling potentialafforded by having supportive policies and programs in place at the work site.
Data Collection and AnalysisThe EAT was used to collect baseline data related to physical and social support for obesityprevention at each of the 12 sites participating in the study. Site staff provided self-reportresponses to the items in Section I of the EAT prior to the site visits, and responses toSection I items were reviewed for completeness by the observers during the site visit.Researchers visited the sites to complete Section II of the EAT survey, which took about 4hours per building. They completed Section II independently before comparing their resultsto achieve consensus on their responses. Due to safety and security concerns by thecompany, Dow employees always escorted the observers when EAT data were collected.However, the Dow employee escorts were only consulted when guidance was needed innavigating through the sites, and they had no impact on data collection activities. Tworesearch analysts who were not present during the site visits scored the EAT (Sections I andII). They used a scoring rubric to aggregate the EAT responses into overall and subscalescores, so that a higher scores reflected greater environmental support for healthy eating,access to physical activity, or weight management. The two research analysts independentlyscored the EAT and then their scores were compared for inter-rater reliability.
Since many of the sites were too large for observers to inspect every building or area (sitesranged in size from 50 to 5000 acres and 12 to 300 inhabited buildings), with the assistanceof local Dow staff, approximately six occupied buildings or areas that were representative ofthe site and its employees were selected for assessment. Scores for the areas observed werethen aggregated and an average rating was computed for each site with a higher scoresreflecting greater environmental and support for healthy eating, access to physical activity,and weight management. The scoring of the EAT occurred after the actual site visit had beencompleted, and it was performed by different members of the project team. For this initialapplication of the EAT, two independent scorers were used and their rating compared.
DeJoy et al. Page 6
J Occup Environ Med. Author manuscript; available in PMC 2010 August 8.
NIH
-PA Author Manuscript
NIH
-PA Author Manuscript
NIH
-PA Author Manuscript

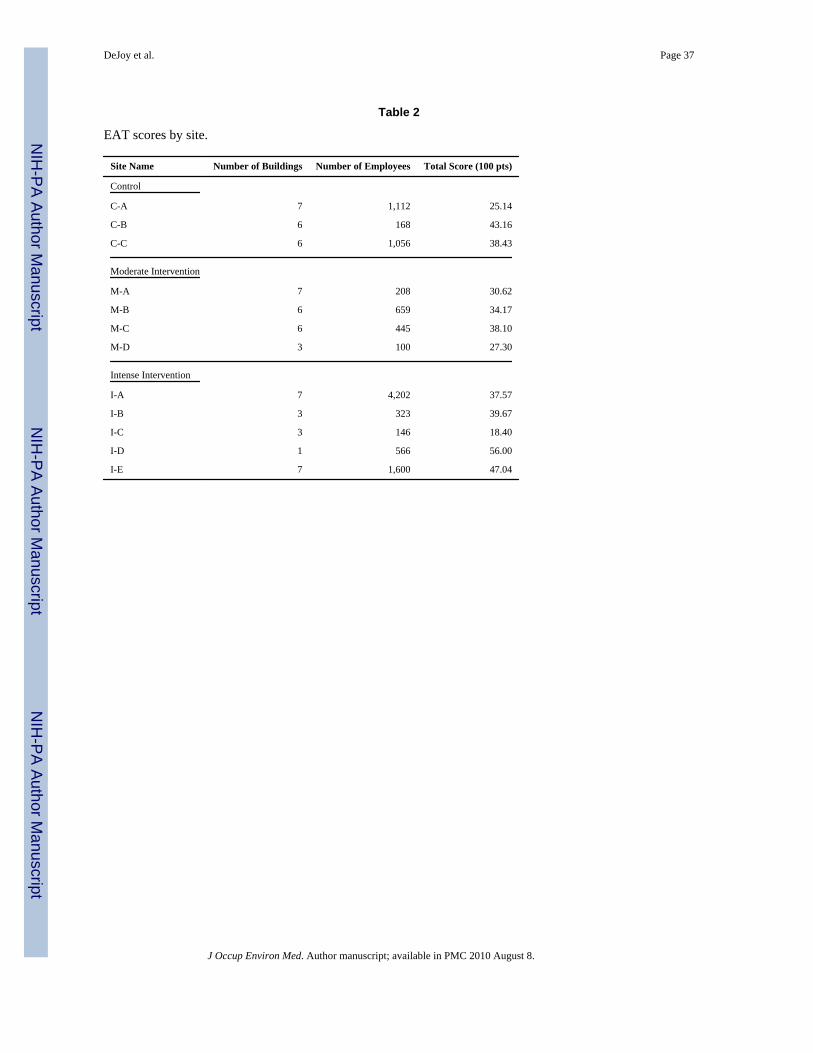
The analyses reported here are for data collected using the EAT during the 2005 baselineperiod (see Table 2).
Assessing the Validity and Reliability of the EATTo test the validity and reliability of the EAT, we demonstrate criterion-related validity andinter-rater reliability. Following Carmines and Zeller’s52 approach, we disaggregatedcriterion-related validity into predictive validity and concurrent validity, to determinewhether the relationships between EAT scores and other variables of interest were predictiveor concurrent in nature.
Inter-Rater Reliability—Instrument reliability was assessed by comparing the ratings ofthe two observers who were trained by the instrument’s developers. Percent agreementbetween the observers was calculated by combining the proportion of items in agreementdivided by the total number of items. Kappa statistics were calculated for individual EATitems, and Pearson correlations coefficients were derived for the EAT subscales and totalscore.
Concurrent Validity—Concurrent validity was addressed by first testing the hypothesisthat higher EAT scores would be associated with lower payments for health care servicesand lower rates of absenteeism in the same year that EAT scores and payments weremeasured. The expectation was that more supportive environments would be associated withhealthier employees and lower absenteeism from work during that year, so that payments forhealthcare services and absenteeism would be lower for sites with higher EAT scores. Suchassociations would support the concurrent validity of the EAT.
Concurrent validity analyses were conducted at the site- and person- levels. Site-level EATscale scores were correlated with the following site-level Dow payment figures, derivedfrom Dow’s insurance claims and administrative absenteeism data, for claims incurred in2005: average total medical payments; average inpatient, outpatient, emergency room, andpharmacy payments; and average absence payments. (Average absence payments werecalculated by multiplying days lost from work due to illness by a $30 average hourly wagefigure.1)
While the site-level analyses were informative, there were only 12 sites included in theanalysis, so there were only 12 observations available to estimate each correlationcoefficient. To avoid problems that may be related to low statistical power, we alsoconducted person-level analyses that used data from several thousands of employees whoworked at the 12 sites. One-part or two-part exponential regression models were used forthese person-level analyses. Two-part models were used for analyses of inpatient andemergency room payments, because substantial percentages of employees had zero-dollarexpenditures for these payment metrics. Detailed explanations of two-part regression modelscan be found in Mullahy.53
The person-level regression models controlled for demographics (age, gender), location(residence in a rural vs. urban area), and comorbidities (using the Charlson ComorbidityIndex (CCI) and the number of psychiatric problems found in the medical claims data). Thepredictive power of the regression models was then estimated, by comparing mean predictedexpenditures with actual average expenditures for claims incurred in 2005. Regressionmodels were then adjusted (usually by removing one or both comorbidity variables) to arrive
1The average hourly wage figure was based on the figure used in Ozminkowski et al., 2006, which is a compromise between the$24.15 value for all US companies according to the 2002 Bureau of Labor Statistics report and the $43.00 value reported in theliterature for large employers (Goetzel et al., 2001).
DeJoy et al. Page 7
J Occup Environ Med. Author manuscript; available in PMC 2010 August 8.
NIH
-PA Author Manuscript
NIH
-PA Author Manuscript
NIH
-PA Author Manuscript
at final models that maximized their predictive power. The exponential regression modelswere estimated within a general estimating equations (GEE) framework, to account for thefact that employees were nested within sites.
It should be noted that the EAT scores that were used for the person-level regressionanalyses were measured at the site-level (e.g., each employee at site A was linked with thatsite’s overall EAT score and subscale scores reflecting organizational support for physicalactivity, healthy food, and overall management support). The regression analysis allowed forthe reporting of increases or decreases in average health care or absenteeism paymentsresulting from one-unit increases in average site EAT scores, at the person-level.
To further test concurrent validity, correlation statistics were calculated between the EATOrganizational Characteristics and Support scale with another instrument, the Leading byExample (LBE) questionnaire. The LBE has been found to be a valid tool for diagnosingmanagement issues and challenges at Dow, and tracking management support for obesityprevention over time.54 It was adapted from the Partnership for Prevention’s version of theLBE.55 The LBE was independently administered to site staff and leaders, including theleadership team at the site, cross-disciplinary team members (i.e., individuals who work asproduction leaders, production engineers, operators, etc.) and health services staff. It asksrespondents to agree or disagree with certain statements regarding site leadership and itscommitment to health promotion as an important investment in human capital and whetherthe site provides support for employees to stay healthy, reduce their high-risk behaviors,and/or practice healthy life styles. A full description of the LBE and its psychometricproperties is described in Della, DeJoy, Goetzel, Ozminkowski, and Wilson, now in press.The expectation was that similar levels of environmental support would be captured in boththe LBE and the EAT Organizational Characteristics and Support scale. If observed, theseassociations would support the concurrent validity of the EAT.
Predictive validity—Predictive validity was examined in the same way as concurrentvalidity, with one exception. For predictive validity, EAT scores for 2005 were correlatedwith medical and absenteeism payments for claims incurred in 2006. The hypothesis testedwas that better work environments would lead to savings in future health care or absence-related expenditures. If this notion were true, and if the EAT had a high degree of predictivevalidity, one would expect to observe that that higher EAT scores in 2005 would beassociated with lower payments in 2006.
RESULTSInter-rater reliability
There were generally high levels of inter-rater reliability observed for the EAT. Thepercentage agreement scores between observers ranged from a low of 83.5% to a high of97.0%, with the majority of the instrument measures being above 90%. Specifically, theobservers were most consistent in the stair/elevator and fitness facility assessments (both at97.0 %). Table 3 presents the percentage agreement for each component of the EAT.
Kappa statistics, which indicate the level of non-random agreement between observers, werecalculated for 66 EAT items and were unable to be calculated for an additional 56 EATitems because the observers had 100% agreement. Of the 66 EAT items with Kappastatistics, 63 items demonstrated substantial or almost perfect agreement among raters, withKappa statistics ranging from a low of 0.615 (p = 0.035) to a high of 1.000 (p = 0.000). Onlythree EAT items did not have statistically significant Kappa statistics: fitness center costsubsidy (k = 0.412, p = 0.107), no stair safety warnings in stairwell 3 (k = 0.667, p = 0.083),and stairwell door unlocked in stairwell 3 (k = 0.667, p = 0.083). Kappa statistics could not
DeJoy et al. Page 8
J Occup Environ Med. Author manuscript; available in PMC 2010 August 8.
NIH
-PA Author Manuscript
NIH
-PA Author Manuscript
NIH
-PA Author Manuscript
be calculated for nine items because one of the observers did not record an observation forthose items that the other observer included; consequently, a symmetric table could not becreated.
Kappa statistics could not be calculated for summarized scale scores because they arecontinuous and not dichotomous (yes/no) variables, so Pearson correlation coefficientanalyses were conducted to determine the relationship between the two observers’ subscaleand total scores. Pearson correlation coefficients were calculated for the EAT subscales,components of these subscales, and the EAT total score. Pearson correlation coefficientswere not calculated for the third EAT subscale, Nutrition/Weight Management, because twoof the three components in this subscale, vending and cafeteria/food services, were scoredby a single observer. All but four of the relationships were strong, demonstrating Pearsoncorrelation coefficients ranging from a low of 0.757 (p=0.004) to a high of 1.000 (p=0.000).Three of the relationships among subscale components were not significantly correlated: sitecharacteristics (r = 0.541, p = 0.069), work rules (r = 0.184, p = 0.567), and overweight/obese (r = 0.071, p = 0.826). Organizational Characteristics and Support was the on lysubscale score that was not significant (r = 0.158, p = 0.624). All three of the non-significantsubscale component relationships were components of the single insignificant subscalerelationships, Organizational Characteristics and Support.
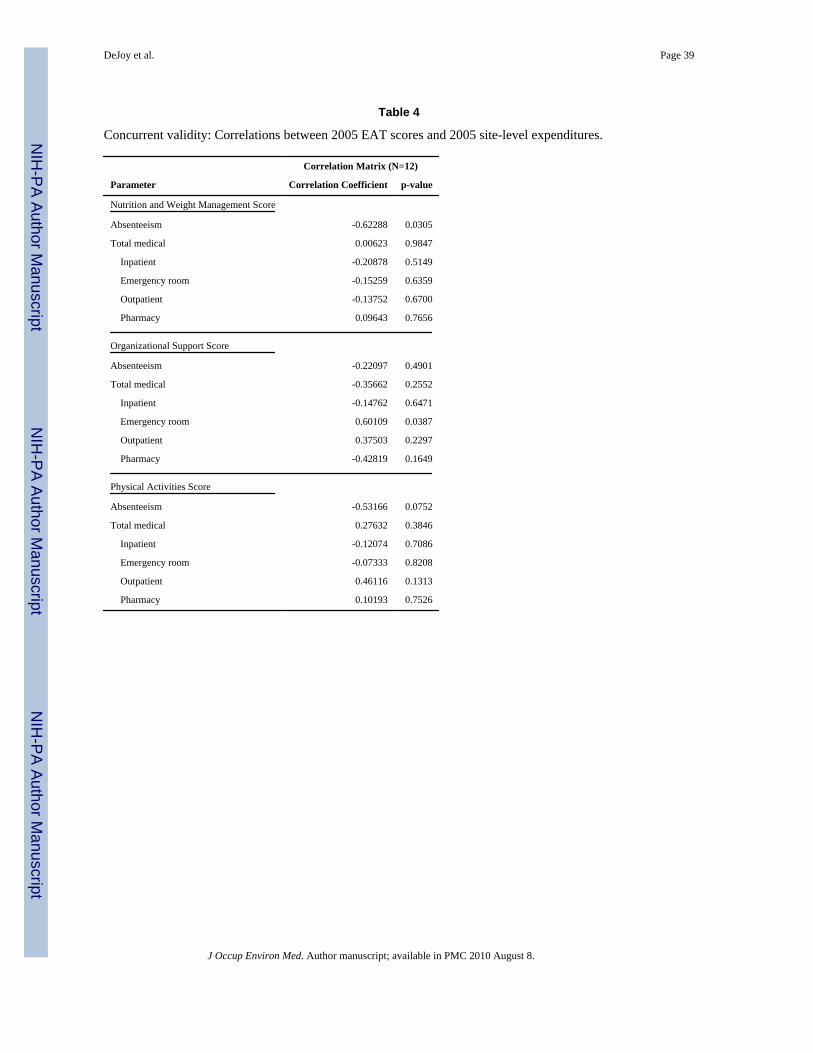
Concurrent validity—At the site-level, the relationship between higher EAT scores andlower payments for claims incurred in 2005 was as hypothesized for absenteeism, but notconsistently for medical care (see Table 4). There were statistically significant negativecorrelations between the EAT Nutrition and Weight Management subscale scores andabsenteeism payments (p = 0.0305) and the EAT Organizational Characteristics and Supportsubscale scores and emergency room payments (p = 0.0387). There was also a negativecorrelation between the EAT Physical Activity subscale scores and absenteeism payments,but this correlation fell short of statistical significance (p = 0.0752).
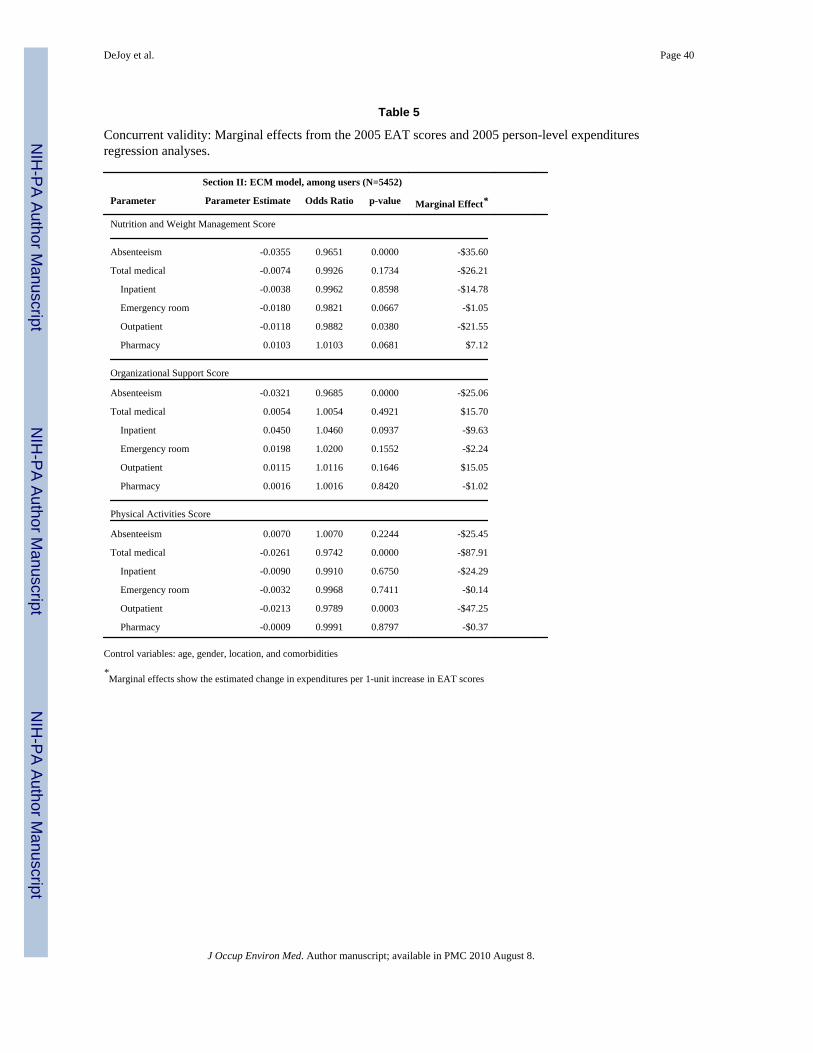
Generally speaking, the person-level analyses produced similar and slightly stronger supportfor the hypothesized relationship between higher EAT scores and lower payments for claimsincurred in 2005 for absenteeism, but not for medical care (see Table 5). A one-unit increasein the EAT Nutrition and Weight Management subscale scores, resulted in a $35.60 peremployee per year reduction in absenteeism payments (p = 0.0000) and a $21.55 peremployee per year reduction in outpatient medical payments (p = 0.0380). A one unitincrease in the EAT Organizational Characteristics and Support subscale scores, resulted ina $25.06 per employee per year reduction in absenteeism payments (p = 0.0000). Finally, aone unit increase in the EAT Physical Activity subscale scores resulted in an $87.91 peremployee per year reduction in total medical payments (p = 0.0000), and a $47.25 peremployee per year reduction in outpatient payments (p = 0.0003). The associations betweenincreases in EAT scores and changes in payments were generally in the expected directionfor non-significant relationships.
The EAT Organizational Characteristics and Support subscale was significantly related toseveral LBE items including those that ask whether employees are educated regarding thetrue cost of health care (p = 0.0286), whether the site offered incentives to stay healthy (p =0.0016), and whether the site promoted a culture of health and well being (p = 0.0051). Thecorrelation between the EAT Organizational Characteristics and Support subscale and theoverall LBE score fell just short of significance (p = 0.0503). The EAT OrganizationalCharacteristics and Support subscale was also strongly related to LBE items addressingwhether health programs were aligned with business goals (p = 0.0638) and whether healthbenefit programs support prevention (p = 0.0640).
DeJoy et al. Page 9
J Occup Environ Med. Author manuscript; available in PMC 2010 August 8.
NIH
-PA Author Manuscript
NIH
-PA Author Manuscript
NIH
-PA Author Manuscript
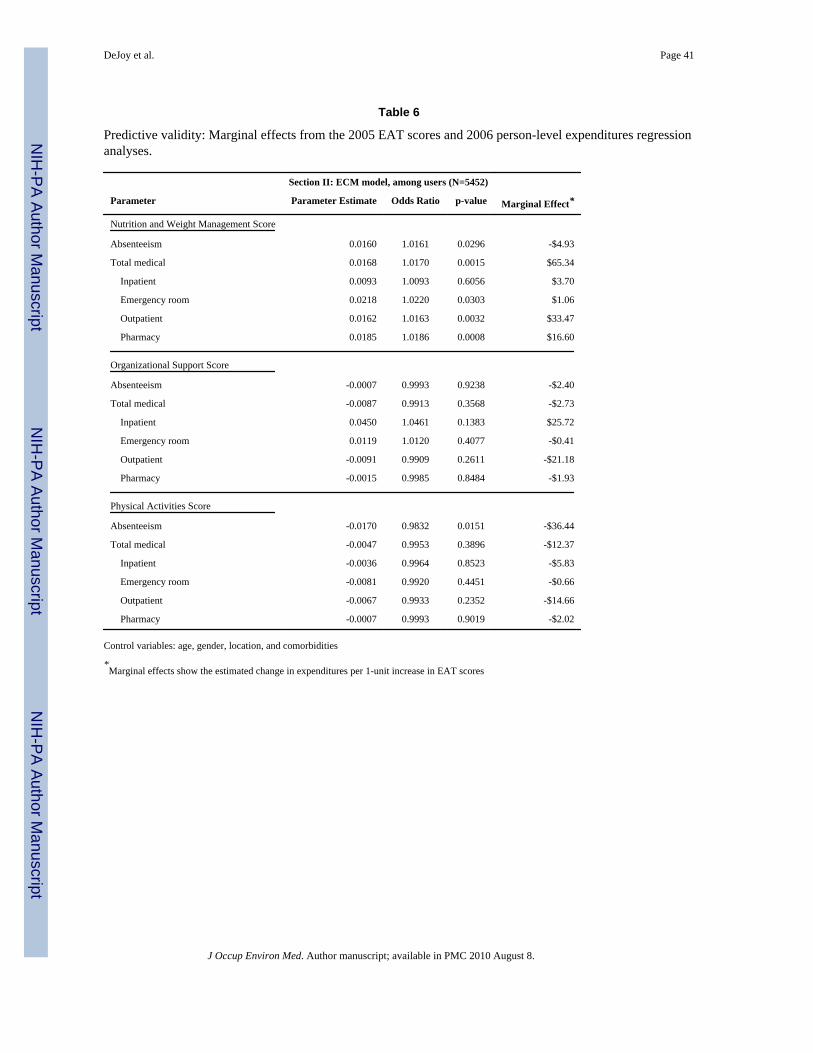
Predictive validity—Generally speaking, the predictive validity of the EAT, as measuredin terms of whether 2005 higher EAT scores were associated with 2006 financial measures,was supported for absenteeism, but not for medical payments (see Table 6). A one unitincrease in the EAT Nutrition and Weight Management subscale scores was associated witha $4.93 per employee per year reduction in absenteeism payments (p = 0.0296), but all otherrelationships were either not significant or resulted in increased costs. Similarly, a one unitincrease in the EAT Physical Activity subscale scores, resulted in a $36.44 per employee peryear reduction in absenteeism payments (p = 0.0151), but all other relationships were notsignificant.
DISCUSSIONSummary of findings
To assess organizational, environmental and social support for health promotion programs inthe workplace, and in particular those directed at overweight and obesity, the EAT wasdeveloped and tested at 12 Dow worksites in 2005 as part of a baseline assessment for alarger multi-year study. To evaluate the psychometric properties of the EAT, inter-raterreliability was assessed as well as the instrument’s ability to predict current and futurespending on healthcare and employee absenteeism.
Our preliminary analyses indicate that the EAT may be used reliably to measure the physicaland social environments at the worksite, specifically as they relate to physical activity, foodchoices and weight management, and general organizational characteristics that supporthealth promotion for workers. The high levels of inter-rater reliability buttress this finding.
Concurrent validity was demonstrated by associating EAT scores with company paymentsfor incurred health care services and employee absenteeism. Generally speaking, employeeswho worked in environments that promote healthier eating, more physical activity, andexhibit organizational characteristics and support for healthy behaviors have lower costs,especially regarding absenteeism payments. EAT scores were not as strongly associatedwith medical payment metrics, however. Concurrent validity was also demonstrated by thehigh, positive correlation between the results obtained from EAT OrganizationalCharacteristics and Support subscale and the LBE questionnaire.
Limitations and future directionsUsing the EAT to measure environmental support for healthy behavior has the followinglimitations:
First, the EAT is designed to assess environmental and organizational supports pertinent tohealthy eating and weight management. It is not intended to be used to assess overall orgeneral support for health promotion. The EAT builds upon previous efforts to developobservational assessments specific to physical activity, and adds content relevant to healthyeating and weight management. Fundamentally, the EAT adheres to an energy intake-energyexpenditure model of weight management. The EAT also seeks to assess the extent to whichthe social-organizational environment supports healthy eating, weight management, andphysical activity. A potential limitation of the EAT scoring rubric is that sites are penalizedif certain environmental supports that may not be feasible (e.g., cafeteria) are not present.An alternate scoring rubric could calculate EAT scores on the basis of a dominator that doesnot add to 100%, and re-scale as if it did. This would avoid penalizing sites that may nothave the resources to afford housing a cafeteria, workout facility, or other health promotionassets.
DeJoy et al. Page 10
J Occup Environ Med. Author manuscript; available in PMC 2010 August 8.
NIH
-PA Author Manuscript
NIH
-PA Author Manuscript
NIH
-PA Author Manuscript
The EAT is specific to a given workplace environments. Although there was a concertedeffort to construct an instrument that would be applicable to a variety of different types ofwork environments, our initial experience using the EAT suggests some pilot or preliminarywork should be done to fine tune the Tool prior to deploying it in a given work setting orindustry.
Part of the customization process involves selecting buildings at the worksite to be evaluatedby the EAT. Some may argue that all buildings, or if resources are limited a random sampleof buildings, should be evaluated. Others may argue that selection should be based on thenumber of employees in a building or its traffic patterns in terms of use by workers. The siteselection process may induce some bias into the evaluation if the selected buildings are notrepresentative of the site, and that should be noted by the evaluators. For the most part, theEAT is most applicable to traditional work situations in which employees spend all or mostof their work day within the physical boundaries of the workplace.
Second, those charged with using the EAT should receive specialized training on its usebeforehand. Several factors contribute to this recommendation. Perhaps most importantly,environmental features should be assessed from the general viewpoint of the employeesworking within the building or facility. For example, many work settings have multipleentrances and exits, but employees often use certain entrances and exits that are separate anddistinct from those used by the public and/or those that are most prominent from the outsideof the building. Although stairways and elevators were assessed using mostly “yes-no”categories, the right stairways and elevators needed to be assessed. Also, given the size andcomplexity of many work environments, it is usually not practical to assess all building orfacilities. In such cases, care should be taken in establishing the sampling parameters and indocumenting the specific locations that will be assessed. Documentation is crucial ifrepeated observations are planned. The level of detail involved in adequately assessingvending and food service facilities is another complicating factor. Our experience suggeststhat advance information from employers in the form of vending machine orders, cafeteriamenus, and price lists can speed up and increase the accuracy of data collectionconsiderably. A final consideration is that although the EAT is basically an observationaltool rather than an interview tool, situations do arise in which raters will need to seekclarification from site personnel and/or make additional observations about specificcharacteristics. Training sessions should review the EAT thoroughly and identify areaswhere additional information may be needed. As a case in point, it is relatively easy todocument fitness equipment and facilities, but a tour of the site may not provide clearinformation about hours of operation or the access enjoyed by various categories ofemployees. Both of these factors are important considerations in evaluating this feature ofthe environment.
Third, validity assessment will always be challenging. It is not possible to directly answerthe question of whether the EAT measures well what it is intended to measure. One willalways have to infer an answer to that question by relating EAT scores to other metrics,using some logical framework. That is what we intended to do here, but others may wish touse other metrics for validity analysis, or may be able to craft other logical frameworks to beused for validity testing. As a result, inferences about validity will always be tentative, butthe analyses conducted here suggests that the EAT may be a valuable tool for measuringenvironmental factors that are related to absenteeism in a current or future year, or formeasuring environmental factors that affect health care expenditures in the current year. Webelieve the EAT to be a valuable tool for the researcher’s or practitioner’s arsenal.
The methods used in this analysis of the EAT have the following limitations:
DeJoy et al. Page 11
J Occup Environ Med. Author manuscript; available in PMC 2010 August 8.
NIH
-PA Author Manuscript
NIH
-PA Author Manuscript
NIH
-PA Author Manuscript
First, since the program being evaluated was immature (only one year old), further researchis needed to examine a fully developed program and the predictive (e.g., year 1 EAT withyear 3 claims) and concurrent (e.g., year 3 EAT with year 3 claims) validity of the EAT.
Second, analysis of the EAT did not account for significant associations that are likely tooccur randomly. With 54 analyses, one would expect to find two or three statisticallysignificant associations purely by chance. We found 13 statistically significant associations,which suggest that chance alone does not explain the results.
Third, this analysis did not examine the ability of the EAT to predict future or showconcurrent relationships between environmental factors and health behaviors, health risks(e.g. BMI), or disease conditions related to obesity, lack of physical activity, and poornutrition. Further research is needed to examine these relationships.
Implications for Research and PracticeAs shown in this paper, the reliability of the EAT was found to be high, which suggests thatother researchers and practitioners can be confident that the EAT is clear in its datacollection procedures relating to assessing the physical and social environments of aworksite and that it can be used reliably in these settings. Users are advised to estimatereliability and validity of the EAT independently, because neither reliability nor validity areinherent properties of any instrument. Rather, reliability and validity describe howinstruments are used, and implementation may vary from site to site.
We also found evidence of concurrent and predictive validity, but primarily for relationshipsbetween environmental characteristics and absenteeism. Thus, researchers and practitionersmay confidently use the EAT to assess the relationships between these factors. Concurrentvalidity tests also showed relationships between EAT scores and health care payments forclaims incurred in the same year that the EAT was measured. However, we did not findsignificant relationships between EAT scores and future health care payments.
We conclude that the EAT is a useful instrument for auditing or assessing the characteristicsof work environments that have the potential to facilitate or thwart healthy eating andexercise behaviors among workers that, in turn, may influence their absenteeism andmedical expenditures.
DeJoy et al. Page 12
J Occup Environ Med. Author manuscript; available in PMC 2010 August 8.
NIH
-PA Author Manuscript
NIH
-PA Author Manuscript
NIH
-PA Author Manuscript

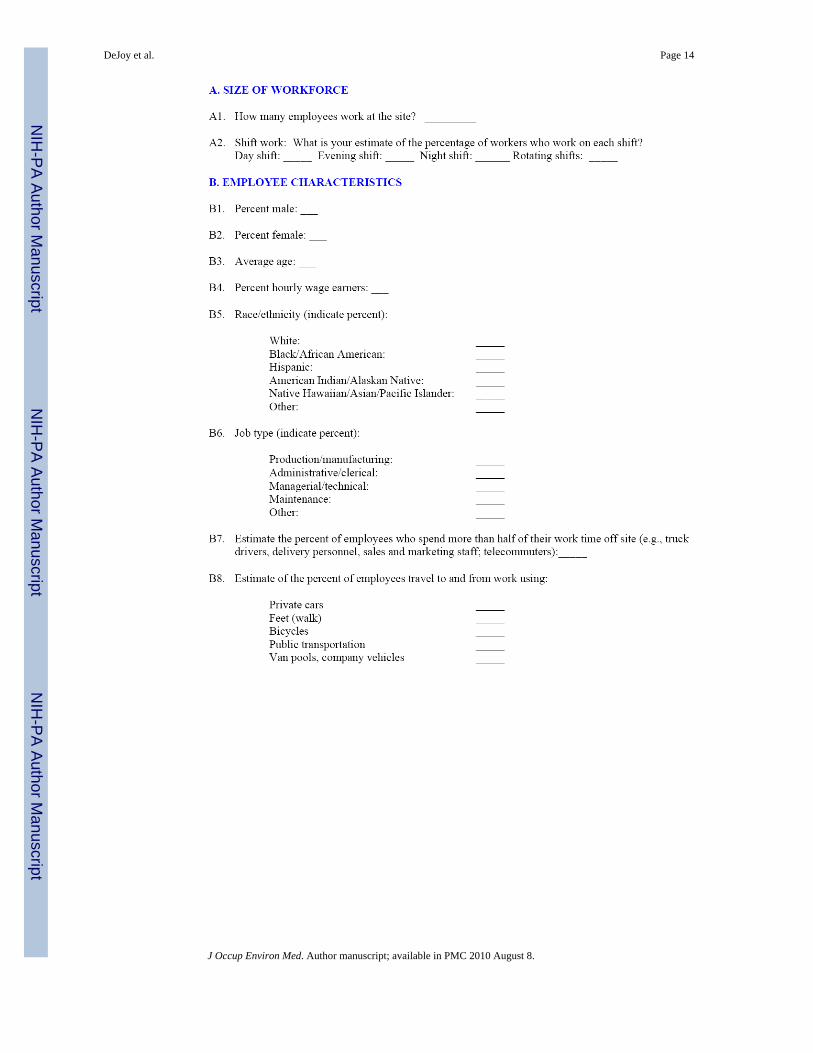
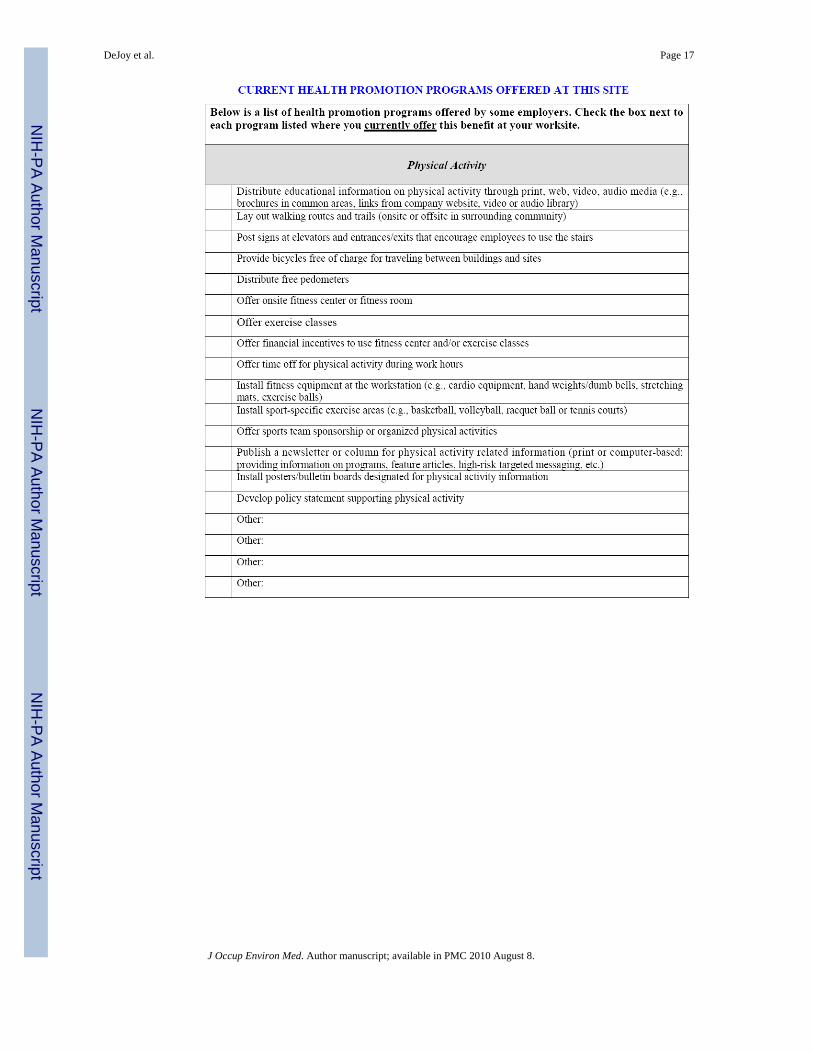
APPENDIX
WORKSITE HEALTH PROMOTION ENVIRONMENTAL ASSESSMENT TOOL
DeJoy et al. Page 13
J Occup Environ Med. Author manuscript; available in PMC 2010 August 8.
NIH
-PA Author Manuscript
NIH
-PA Author Manuscript
NIH
-PA Author Manuscript
DeJoy et al. Page 14
J Occup Environ Med. Author manuscript; available in PMC 2010 August 8.
NIH
-PA Author Manuscript
NIH
-PA Author Manuscript
NIH
-PA Author Manuscript

DeJoy et al. Page 15
J Occup Environ Med. Author manuscript; available in PMC 2010 August 8.
NIH
-PA Author Manuscript
NIH
-PA Author Manuscript
NIH
-PA Author Manuscript

DeJoy et al. Page 16
J Occup Environ Med. Author manuscript; available in PMC 2010 August 8.
NIH
-PA Author Manuscript
NIH
-PA Author Manuscript
NIH
-PA Author Manuscript
DeJoy et al. Page 17
J Occup Environ Med. Author manuscript; available in PMC 2010 August 8.
NIH
-PA Author Manuscript
NIH
-PA Author Manuscript
NIH
-PA Author Manuscript
DeJoy et al. Page 18
J Occup Environ Med. Author manuscript; available in PMC 2010 August 8.
NIH
-PA Author Manuscript
NIH
-PA Author Manuscript
NIH
-PA Author Manuscript
DeJoy et al. Page 19
J Occup Environ Med. Author manuscript; available in PMC 2010 August 8.
NIH
-PA Author Manuscript
NIH
-PA Author Manuscript
NIH
-PA Author Manuscript

DeJoy et al. Page 20
J Occup Environ Med. Author manuscript; available in PMC 2010 August 8.
NIH
-PA Author Manuscript
NIH
-PA Author Manuscript
NIH
-PA Author Manuscript
DeJoy et al. Page 21
J Occup Environ Med. Author manuscript; available in PMC 2010 August 8.
NIH
-PA Author Manuscript
NIH
-PA Author Manuscript
NIH
-PA Author Manuscript

DeJoy et al. Page 22
J Occup Environ Med. Author manuscript; available in PMC 2010 August 8.
NIH
-PA Author Manuscript
NIH
-PA Author Manuscript
NIH
-PA Author Manuscript

DeJoy et al. Page 23
J Occup Environ Med. Author manuscript; available in PMC 2010 August 8.
NIH
-PA Author Manuscript
NIH
-PA Author Manuscript
NIH
-PA Author Manuscript
DeJoy et al. Page 24
J Occup Environ Med. Author manuscript; available in PMC 2010 August 8.
NIH
-PA Author Manuscript
NIH
-PA Author Manuscript
NIH
-PA Author Manuscript
DeJoy et al. Page 25
J Occup Environ Med. Author manuscript; available in PMC 2010 August 8.
NIH
-PA Author Manuscript
NIH
-PA Author Manuscript
NIH
-PA Author Manuscript

DeJoy et al. Page 26
J Occup Environ Med. Author manuscript; available in PMC 2010 August 8.
NIH
-PA Author Manuscript
NIH
-PA Author Manuscript
NIH
-PA Author Manuscript

DeJoy et al. Page 27
J Occup Environ Med. Author manuscript; available in PMC 2010 August 8.
NIH
-PA Author Manuscript
NIH
-PA Author Manuscript
NIH
-PA Author Manuscript
DeJoy et al. Page 28
J Occup Environ Med. Author manuscript; available in PMC 2010 August 8.
NIH
-PA Author Manuscript
NIH
-PA Author Manuscript
NIH
-PA Author Manuscript
DeJoy et al. Page 29
J Occup Environ Med. Author manuscript; available in PMC 2010 August 8.
NIH
-PA Author Manuscript
NIH
-PA Author Manuscript
NIH
-PA Author Manuscript
DeJoy et al. Page 30
J Occup Environ Med. Author manuscript; available in PMC 2010 August 8.
NIH
-PA Author Manuscript
NIH
-PA Author Manuscript
NIH
-PA Author Manuscript
DeJoy et al. Page 31
J Occup Environ Med. Author manuscript; available in PMC 2010 August 8.
NIH
-PA Author Manuscript
NIH
-PA Author Manuscript
NIH
-PA Author Manuscript
1. .
AcknowledgmentsFunding for this study was provided by the National, Heart, Lung and Blood Institute, (Grant # R01 HL79546).However, its contents are the sole responsibility of the authors and do not necessarily represent the official views ofNHLBI.
DeJoy et al. Page 32
J Occup Environ Med. Author manuscript; available in PMC 2010 August 8.
NIH
-PA Author Manuscript
NIH
-PA Author Manuscript
NIH
-PA Author Manuscript
References1. Ogden CL, Carroll MD, Curtin LR, McDowell MA, Tabak CJ, Flegal KM. Prevalence of
overweight and obesity in the united states, 1999-2004. JAMA 2006;295:1549–1555. [PubMed:16595758]
2. Must A, Spadano J, Coakley EH, Field AE, Colditz G, Dietz WH. The disease burden associatedwith overweight and obesity. JAMA 1999;282:1523–1529. [PubMed: 10546691]
3. National Heart L, and Blood Institute [NHLBI]. Clinical guidelines on the identification, evaluation,and treatment of overweight and obesity in adults: the evidence report. 1998.
4. Thompson D, Wolf AM. The medical-care cost burden of obesity. Obes Rev 2001;2:189–197.[PubMed: 12120104]
5. Strum R. The effects of obesity, smoking and drinking on medical problems and costs. Health Aff2002;21:245–253.
6. Finkelstein E, Fiebelkorn C, Wang G. The costs of obesity among full-time employees. Am J HealthPromot 2005;20:45–51. [PubMed: 16171161]
7. Tunceli K, Li K, Williams LK. Long-term effects of obesity on employment and work limitationsamong U.S. Adults, 1986 to 1999. Obesity 2006;14:1637–1646. [PubMed: 17030975]
8. Klarenbach S, Padwal R, Chuck A, Jacobs P. Population-based analysis of obesity and workforceparticipation. Obesity 2006;14:920–927. [PubMed: 16855202]
9. Swinburn B, Egger G, Raza F. Dissecting obesogenic environments: the development andapplication of a framework for identifying and prioritizing environmental interventions for obesity.Prev Med 1999;29:563–570. [PubMed: 10600438]
10. Stokols D. Establishing and maintaining healthy environments: toward a social ecology of healthpromotion. Am Psychol 1992;47:6–22. [PubMed: 1539925]
11. Golaszewski T, Fisher B. Heart check: the development and evolution of an organizational hearthealth assessment. Am J Health Promot 2002;17:132–153. [PubMed: 12471865]
12. French SA, Story M, Jeffery RW. Environmental influences on eating and physical activity. AnnuRev Public Health 2001;22:309–335. [PubMed: 11274524]
13. Hill JO, Wyatt HR, Reed GW, Peters JC. Obesity and the environment: where do we go from here?Science 2003;299:853–855. [PubMed: 12574618]
14. U.S. Department of Health and Human Services. Healthy people 2010. 2nd ed. With understandingand improving health and objectives for improving health. Vol. 2. Washington, DC: U.S.Government Printing Office; 2000.
15. Brownson RC, Chang JJ, Eyler AA, Ainsworth BE, Kirtland KA, Saelens BE, Sallis JF. Measuringthe environment for friendliness toward physical activity: a comparison of the reliability of 3questionnaires. Am J Public Health 2004;94:473–483. [PubMed: 14998817]
16. Saelens BE, Sallis JF, Black JB, Chen D. Neighborhood-based differences in physical activity: anenvironment scale evaluation. Am J Public Health 2003;93:1552–1558. [PubMed: 12948979]
17. Ainsworth B, Bassett D, Strath S, et al. Comparison of three methods of measuring time spent inphysical activity. Med Sci Sports Exerc 2000;32:S457–S464. [PubMed: 10993415]
18. Brownson RC, Baker EA, Housemann RA, Brennan LK, Bacak SJ. Environmental and policydeterminants of physical activity in the united states. Am J Public Health 2001;91:1995–2003.[PubMed: 11726382]
19. Golaszewski T, Barr D, Pronk N. Development of assessment tools to measure organizationalsupport for employee health. Am J Health Promot 2003;27:43–54.
20. Oldenburg B, Sallis J, Harris D, Owen N. Checklist of health promotion environments at worksites(CHEW): development and measurement characteristics. Am J Health Promot 2002;16:288–299.[PubMed: 12053440]
21. Pratt CA, Lemon SC, Fernandez ID, et al. Design characteristics of worksite environmentalinterventions for weight control and obesity prevention. in press.
22. Wilson MG, Goetzel RZ, Ozminkowski RJ, et al. Introducing environmental and ecologicalinterventions to address overweight and obesity: recommendations to employers on how to designan effective program. Obesity. in press.
DeJoy et al. Page 33
J Occup Environ Med. Author manuscript; available in PMC 2010 August 8.
NIH
-PA Author Manuscript
NIH
-PA Author Manuscript
NIH
-PA Author Manuscript
23. Integrated Benefits Institute. The power of IBI benchmarking programs with EMPAQSM inside.Available at http://www.benefitsintelligence.org/benchmarking/
24. Zaza, S.; Briss, PA.; Harris, KW. The guide to community preventive services: what works topromote health?. New York, NY: Oxford University Press; 2005.
25. Goetzel RZ. Essential building blocks for successful worksite health promotion programs.Managing Employee Health Benefits 1997;6:1.
26. O’Donnell, M. Subject matter expert, American productivity and quality center, corporate healthpromotion and demand management consortium benchmarking study, final report. 1996. Availableat www.apqc.org
27. O’Donnell M, Bishop C, Kaplan K. Benchmarking best practices in workplace health promotion.The Art of Health Promotion 1997 March/April;:12.
28. Goetzel, RZ.; Guindon, A.; Humphries, L.; Newton, P.; Turshen, J.; Webb, R. Health andproductivity management: consortium benchmarking study best practice report. 1998. Available atwww.apqc.org
29. Wellness Councils of America. Seven benchmarks of success. Available athttp://welcoa.org/wellworkplace/index.php?category=2
30. Matson Koffman DM, Goetzel RZ, Anwuri VV, Shore KK, Orenstein D, LaPier T. Heart healthyand stroke free: successful business strategies to prevent cardiovascular disease. Am J Prev Med2005;29:113–121. [PubMed: 16389136]
31. Andersen RE, Fransckowiak SC, Snyder J, Bartlett SJ, Fontaine SKR. Can inexpensive signsencourage the use of stairs? Ann Intern Med 1998;129:363–369. [PubMed: 9735063]
32. Blamey A, Mutrie N, Aitchison T. Health promotion encouraged by stairs. B r Med J1995;311:289–290.
33. Brownell KD, Stunkard AJ, Albaum JM. Evaluation and modification of exercise patterns in thenatural environment. Am J Psychiatry 1980;137:1540–1545. [PubMed: 7435710]
34. Erfurt J, Foote A, Heirich M. Worksite wellness programs: incremental comparisons of screeningand referral alone, health education, follow-up counseling, and plant organization. Am J HealthPromot 1991;5:438–448. [PubMed: 10148672]
35. Eriksen MP, Gottlieb NH. A review of the health impact of smoking control at the workplace. AmJ Health Promot 1998;13:83–104. [PubMed: 10346662]
36. French RW, Story M, Jeffery RW, Synder P, Eisenberg M. Pricing strategy to promote vegetablepurchase in high school cafeterias. J Am Diet Assoc 1997;97:1008–1010. [PubMed: 9284880]
37. Glanz K, Sorensen G, Farmer A. The health impact of worksite nutrition and cholesterolintervention programs. Am J Health Promot 1996;10:453–470. [PubMed: 10163311]
38. Golaszewski T, Barr D. An organization-based intervention to improve social support foremployee heart health. Am J Health Promot 1998;13:26–35. [PubMed: 10186932]
39. Hennrikus DJ, Jeffery RW. Worksite intervention for weight control: a review of literature. Am JHealth Promot 1996;10:471–498. [PubMed: 10163312]
40. Holdsworth M, Haslam C. A review of point-of-choice nutrition labeling schemes in theworkplace, public eating places and universities. J Hum Nutr Diet 1998;11:423–445.
41. Jeffery RW, French SA, Raether C, Baxter JE. An environmental intervention to increase fruit andsalad purchases in a cafeteria. Prev Med 1994;23:788–792. [PubMed: 7855111]
42. Pescatello LS, Murphy D, Vollono J, Lynch E, Berne J, Costanzo D. The cardiovascular healthimpact of an incentive worksite health promotion program. Am J Health Promot 2001;16:16–20.[PubMed: 11575051]
43. Poole K, Kumpfer K, Pett M. The impact of an incentive-based worksite health promotion programon modifiable health risk factors. Am J Health Promot 2001;16:21–26. [PubMed: 11575052]
44. Russell WD, Dzewaltowski DA, Ryan GJ. The effectiveness of a point-of-decision prompt indeterring sedentary behavior. Am J Health Promot 1999;13:257–229. [PubMed: 10538638]
45. Sorensen G, Hunt MK, Cohen N, Stoddard A, Stein E, Phillips J, Baker F, Combe C, Hebert J,Palambo R. Worksite and family education for a dietary change: the Treatwell 5-a-day program.Health Education Research 1998:577–591.
DeJoy et al. Page 34
J Occup Environ Med. Author manuscript; available in PMC 2010 August 8.
NIH
-PA Author Manuscript
NIH
-PA Author Manuscript
NIH
-PA Author Manuscript

46. Sorensen G, Morris DM, Hunt MK, Herbert JR, Harris DR, Stoddard A, Ocklene JK. Worksitenutrition intervention and employees’ dietary habits: the Treatwell program. Am J Public Health1992;19:31–54.
47. Zifferblatt SM, Wilbur CS, Pinsky JL. Changing cafeteria eating habits. J Am Diet Assoc1980;76:15–20. [PubMed: 7391441]
48. U.S. Department of Health and Human Services. The surgeon general’s call to action to preventand decrease overweight and obesity. 2001
49. Goetzel RZ, Guindon AM, Turshen IJ, Ozminkowski RJ. Health and productivity management:establishing key performance measures, benchmarks, and best practices. J Occup Environ Med2001;43:10–17. [PubMed: 11201763]
50. Biener L, Glanz K, McLerran D, Sorensen G, Thompson G, Basen-Equist K, Linnan L, Varnes J.Impact of the working well trial on the worksite smoking and nutrition environment. Health EduBehav 1999;26:478–494.
51. DeJoy DM, Southern DJ. An integrative perspective on worksite health promotion. J Occup Med1993;35:1221–1230. [PubMed: 8113926]
52. Carmines, EG.; Zeller, RA. Reliability and validity assessment. Newbury Park: Sage Publications;1979.
53. Mullahy J. Heterogeneity, excess zeros, and the structure of count data models. J ApplEconometrics 1997;12:337–350.
54. Della L, DeJoy DM, Goetzel RZ, Ozminkowski RJ, Wilson M. Assessing management support forworksite health promotion: psychometric analysis of the leading by example instrument. Am JHealth Promot. in press.
55. Partnership for Prevention. Leading by example: improving the bottom line through a highperformance, less costly workforce. Washington, D.C: Partnership for Prevention; 2004.
DeJoy et al. Page 35
J Occup Environ Med. Author manuscript; available in PMC 2010 August 8.
NIH
-PA Author Manuscript
NIH
-PA Author Manuscript
NIH
-PA Author Manuscript
NIH
-PA Author Manuscript
NIH
-PA Author Manuscript
NIH
-PA Author Manuscript
DeJoy et al. Page 36
Table 1
Summary of EAT components and scoring system
Organizational characteristics and support 36 points
Site characteristics 4 points
Work rules 6 points
Written policies 6 points
Health promotion programs
Physical activity 7 points
Diet/nutrition 7 points
Weight management 6 points
Physical activity 32 points
Parking/bike assessment 4 points
Stairs/elevator assessment 4 points
Shower/changing facilities 6 points
Physical activity signs 4 points
Physical activity/fitness facilities 14 points
Nutrition and weight management 32 points
Nutrition/weight management signs 4 points
Vending 12 points
Cafeteria/food service 16 points
J Occup Environ Med. Author manuscript; available in PMC 2010 August 8.
NIH
-PA Author Manuscript
NIH
-PA Author Manuscript
NIH
-PA Author Manuscript
DeJoy et al. Page 37
Table 2
EAT scores by site.
Site Name Number of Buildings Number of Employees Total Score (100 pts)
Control
C-A 7 1,112 25.14
C-B 6 168 43.16
C-C 6 1,056 38.43
Moderate Intervention
M-A 7 208 30.62
M-B 6 659 34.17
M-C 6 445 38.10
M-D 3 100 27.30
Intense Intervention
I-A 7 4,202 37.57
I-B 3 323 39.67
I-C 3 146 18.40
I-D 1 566 56.00
I-E 7 1,600 47.04
J Occup Environ Med. Author manuscript; available in PMC 2010 August 8.

NIH
-PA Author Manuscript
NIH
-PA Author Manuscript
NIH
-PA Author Manuscript
DeJoy et al. Page 38
Table 3
Inter-rater reliability of the EAT administered in 2005.
Number Agree Total Opportunities % Agreement
Stairs/elevator Assessment
Stair/Elevator/Entrance Count 152 162 93.8%
Stairwell #1 199 200 99.5%
Stairwell #2 116 120 96.7%
Stairwell #3 46 48 95.8%
Stairwell #4 32 32 100.0%
Stairwell #5 1 1 100.0%
Stairwell #6 1 1 100.0%
Total 547 564 97.0%
Physical Activity & Nutrition/Weight Management Signs
PA messages 250 306 81.7%
DN messages 261 306 85.3%
Total 511 612 83.5%
Shower/Changing & Fitness Facilities
Changing facilities 108 112 96.4%
Fitness facility/hours 54 57 94.7%
Fitness equipment 151 160 94.4%
Fitness classes/activities 258 260 99.2%
Sports opportunities 69 70 98.6%
Path intervention 46 49 93.9%
Total 686 708 96.9%
Written Policies
Worksite policies 60 60 100.0%
Corporate support for fitness 44 50 88.0%
Total 104 110 94.6%
Key: “PA” represents physical activity; “DN” represents diet and nutrition
J Occup Environ Med. Author manuscript; available in PMC 2010 August 8.
NIH
-PA Author Manuscript
NIH
-PA Author Manuscript
NIH
-PA Author Manuscript
DeJoy et al. Page 39
Table 4
Concurrent validity: Correlations between 2005 EAT scores and 2005 site-level expenditures.
Correlation Matrix (N=12)
Parameter Correlation Coefficient p-value
Nutrition and Weight Management Score
Absenteeism -0.62288 0.0305
Total medical 0.00623 0.9847
Inpatient -0.20878 0.5149
Emergency room -0.15259 0.6359
Outpatient -0.13752 0.6700
Pharmacy 0.09643 0.7656
Organizational Support Score
Absenteeism -0.22097 0.4901
Total medical -0.35662 0.2552
Inpatient -0.14762 0.6471
Emergency room 0.60109 0.0387
Outpatient 0.37503 0.2297
Pharmacy -0.42819 0.1649
Physical Activities Score
Absenteeism -0.53166 0.0752
Total medical 0.27632 0.3846
Inpatient -0.12074 0.7086
Emergency room -0.07333 0.8208
Outpatient 0.46116 0.1313
Pharmacy 0.10193 0.7526
J Occup Environ Med. Author manuscript; available in PMC 2010 August 8.
NIH
-PA Author Manuscript
NIH
-PA Author Manuscript
NIH
-PA Author Manuscript
DeJoy et al. Page 40
Table 5
Concurrent validity: Marginal effects from the 2005 EAT scores and 2005 person-level expendituresregression analyses.
Section II: ECM model, among users (N=5452)
Parameter Parameter Estimate Odds Ratio p-value Marginal Effect*
Nutrition and Weight Management Score
Absenteeism -0.0355 0.9651 0.0000 -$35.60
Total medical -0.0074 0.9926 0.1734 -$26.21
Inpatient -0.0038 0.9962 0.8598 -$14.78
Emergency room -0.0180 0.9821 0.0667 -$1.05
Outpatient -0.0118 0.9882 0.0380 -$21.55
Pharmacy 0.0103 1.0103 0.0681 $7.12
Organizational Support Score
Absenteeism -0.0321 0.9685 0.0000 -$25.06
Total medical 0.0054 1.0054 0.4921 $15.70
Inpatient 0.0450 1.0460 0.0937 -$9.63
Emergency room 0.0198 1.0200 0.1552 -$2.24
Outpatient 0.0115 1.0116 0.1646 $15.05
Pharmacy 0.0016 1.0016 0.8420 -$1.02
Physical Activities Score
Absenteeism 0.0070 1.0070 0.2244 -$25.45
Total medical -0.0261 0.9742 0.0000 -$87.91
Inpatient -0.0090 0.9910 0.6750 -$24.29
Emergency room -0.0032 0.9968 0.7411 -$0.14
Outpatient -0.0213 0.9789 0.0003 -$47.25
Pharmacy -0.0009 0.9991 0.8797 -$0.37
Control variables: age, gender, location, and comorbidities
*Marginal effects show the estimated change in expenditures per 1-unit increase in EAT scores
J Occup Environ Med. Author manuscript; available in PMC 2010 August 8.
NIH
-PA Author Manuscript
NIH
-PA Author Manuscript
NIH
-PA Author Manuscript
DeJoy et al. Page 41
Table 6
Predictive validity: Marginal effects from the 2005 EAT scores and 2006 person-level expenditures regressionanalyses.
Section II: ECM model, among users (N=5452)
Parameter Parameter Estimate Odds Ratio p-value Marginal Effect*
Nutrition and Weight Management Score
Absenteeism 0.0160 1.0161 0.0296 -$4.93
Total medical 0.0168 1.0170 0.0015 $65.34
Inpatient 0.0093 1.0093 0.6056 $3.70
Emergency room 0.0218 1.0220 0.0303 $1.06
Outpatient 0.0162 1.0163 0.0032 $33.47
Pharmacy 0.0185 1.0186 0.0008 $16.60
Organizational Support Score
Absenteeism -0.0007 0.9993 0.9238 -$2.40
Total medical -0.0087 0.9913 0.3568 -$2.73
Inpatient 0.0450 1.0461 0.1383 $25.72
Emergency room 0.0119 1.0120 0.4077 -$0.41
Outpatient -0.0091 0.9909 0.2611 -$21.18
Pharmacy -0.0015 0.9985 0.8484 -$1.93
Physical Activities Score
Absenteeism -0.0170 0.9832 0.0151 -$36.44
Total medical -0.0047 0.9953 0.3896 -$12.37
Inpatient -0.0036 0.9964 0.8523 -$5.83
Emergency room -0.0081 0.9920 0.4451 -$0.66
Outpatient -0.0067 0.9933 0.2352 -$14.66
Pharmacy -0.0007 0.9993 0.9019 -$2.02
Control variables: age, gender, location, and comorbidities
*Marginal effects show the estimated change in expenditures per 1-unit increase in EAT scores
J Occup Environ Med. Author manuscript; available in PMC 2010 August 8.