Results of the TeachWell worksite wellness program
8
Results of the TeachWell Worksite Wellness Program Ken Resnicow, PhD, Marsha Davis, PhD, Matt Smith, MS, Tom Baranowski, PhD, Lillian S. Lin, PhD, Janice Baranowski, MPH, RD, LD, Colleen Doyle, MS, RD, and Dongqing Terry Wang Introduction Methods Increasing fruit and vegetable intake is a national health priority for children and adults. One strategy to increase fruit and vegetable intake is school-based nutrition education. While several effective programs have been developed, the impact of these programs is often attenuated by inadequate teacher implementation.59 Numerous fac- tors contribute to low implementation, including insufficient time, inadequate training, competing job demands, and the low priority of health in schools,'0'2 as well as teacher health practices and values. Teachers who place greater value on health promotion and practice more health '-.8,,. enhancing behaviors may be more likely to implement health curricula,l3"4 and they may serve as more effective student role models.' 5-18 Enhancing teachers' personal health attitudes and behaviors represents a potentially effective means to increase the implementation and impact of health cumic- "''' ua15-19 Numerous teacher health promotion programs have been evaluated in relation to teacher wellness, job satisfaction, and staff morale, yet little is known about their impact on curriculum implementation rates and stu- dent health outcomes.'517'20-24 The Teach- Well study was a randomized trial designed to address two questions: (1) To what extent does providing a teacher wellness program enhance the impact of a classroom health cumculum on student outcomes? and (2) To what extent does a teacher wellness program improve cognitive, behavioral, and physio- logic risk factors among participating teach- ers? It was hypothesized that enhanced stu- dent outcomes would be related to increased implementation of the classroom health cur- riculum. Design Project schools were recruited at a meeting of all 82 elementary school princi- pals from a district in the Atlanta metropoli- tan area. Twenty-two schools did not express interest in participating. The 60 schools initially expressing interest in par- ticipating were contacted and offered a pre- sentation about the project for their faculty. Recruitment ceased when the target number of schools, 33, was reached. One school dropped out after baseline data collection, leaving 32. Schools were pair matched on 3 characteristics number of students, per- centage of free lunches, and student tumover rate and then randomly assigned to either the experimental (n = 16) or com- parison (n= 16) group. Two comparison schools dropped out of the study during the final year. Data from these schools were included in the full sample analyses but not the cohort analyses. Baseline data were collected from third-, fourth- and fifth-grade teachers and At the time this article was written, the authors were all with the Rollins School of Public Health, Emory University, Atlanta, Ga. Marsha Davis is now at the Department of Nutritional Sciences, Col- lege of Health Sciences, Georgia State University, Atlanta. Tom Baranowski and Janice Baranowski are now with the Department of Behavioral Science, M. D. Anderson Cancer Center, University of Texas, Houston. Lillian Lin is now with the Division of HIV Surveillance and Epidemiology, Centers for Disease Control and Prevention, Atlanta. Requests for reprints should be sent to Ken Resnicow, PhD, Rollins School of Public Health, Emory University, 1518 Clifton Rd NE, Atlanta, GA 30322. This paper was accepted May 6, 1997. February 1998, Vol. 88, No. 2
Transcript of Results of the TeachWell worksite wellness program

Results of the TeachWell WorksiteWellness Program
Ken Resnicow, PhD, Marsha Davis, PhD, Matt Smith, MS, Tom Baranowski, PhD,Lillian S. Lin, PhD, Janice Baranowski, MPH, RD, LD, Colleen Doyle, MS, RD,and Dongqing Terry Wang
Introduction Methods
Increasing fruit and vegetable intake isa national health priority for children andadults. One strategy to increase fruit andvegetable intake is school-based nutritioneducation. While several effective programshave been developed, the impact of theseprograms is often attenuated by inadequateteacher implementation.59 Numerous fac-tors contribute to low implementation,including insufficient time, inadequatetraining, competing job demands, and thelow priority of health in schools,'0'2 aswell as teacher health practices and values.Teachers who place greater value on healthpromotion and practice more health
'-.8,,. enhancing behaviors may be more likely toimplement health curricula,l3"4 and theymay serve as more effective student rolemodels.' 5-18 Enhancing teachers' personalhealth attitudes and behaviors represents apotentially effective means to increase theimplementation and impact of health cumic-
"'''ua15-19Numerous teacher health promotion
programs have been evaluated in relation toteacher wellness, job satisfaction, and staffmorale, yet little is known about their impacton curriculum implementation rates and stu-dent health outcomes.'517'20-24 The Teach-Well study was a randomized trial designedto address two questions: (1) To what extentdoes providing a teacher wellness programenhance the impact of a classroom healthcumculum on student outcomes? and (2) Towhat extent does a teacher wellness programimprove cognitive, behavioral, and physio-logic risk factors among participating teach-ers? It was hypothesized that enhanced stu-dent outcomes would be related to increasedimplementation of the classroom health cur-riculum.
Design
Project schools were recruited at ameeting of all 82 elementary school princi-pals from a district in the Atlanta metropoli-tan area. Twenty-two schools did notexpress interest in participating. The 60schools initially expressing interest in par-ticipating were contacted and offered a pre-sentation about the project for their faculty.Recruitment ceased when the target numberof schools, 33, was reached. One schooldropped out after baseline data collection,leaving 32. Schools were pair matched on 3characteristics number of students, per-centage of free lunches, and studenttumover rate and then randomly assignedto either the experimental (n = 16) or com-parison (n= 16) group. Two comparisonschools dropped out of the study during thefinal year. Data from these schools wereincluded in the full sample analyses but notthe cohort analyses.
Baseline data were collected fromthird-, fourth- and fifth-grade teachers and
At the time this article was written, the authorswere all with the Rollins School of Public Health,Emory University, Atlanta, Ga. Marsha Davis isnow at the Department of Nutritional Sciences, Col-lege of Health Sciences, Georgia State University,Atlanta. Tom Baranowski and Janice Baranowskiare now with the Department of Behavioral Science,M. D. Anderson Cancer Center, University of Texas,Houston. Lillian Lin is now with the Division ofHIV Surveillance and Epidemiology, Centers forDisease Control and Prevention, Atlanta.
Requests for reprints should be sent to KenResnicow, PhD, Rollins School of Public Health,Emory University, 1518 Clifton Rd NE, Atlanta,GA 30322.
This paper was accepted May 6, 1997.
February 1998, Vol. 88, No. 2

TeachWell Results
third-grade students during the winter of1993. Follow-up data were obtained in thewinters of 1994 and 1995, when the stu-dents were in the fourth and fifth grades,respectively. All teachers teaching grade 3,4, or 5 in the same school were assessed insubsequent follow-ups. The Gimme-5 cur-riculum was offered in the winter session in2 consecutive school years, 1993/94 and1994/95. Active parental consent wasrequired for students to participate in theevaluation protocol.
Intervention
Comparison group schools receivedthe Gimme-5 program, a health educationcurriculum based on social cognitive theorydesigned to increase students' consumptionof fruits and vegetables.2'25 The curriculumcontains 12 sessions in both grade 4 andgrade 5, with approximately 3 activities persession. The 12 sessions are designed to bedelivered twice a week over 6 weeks. Com-parison and intervention group teacherstogether attended a 6-hour training sessionin use of the curriculum each year. Approx-imately 90% of fourth- and fifth-gradeteachers in the 2 groups participated in theteacher training. Teachers unable to attendthe group training received 2-hour one-to-one training at their school. Results fromthe Gimme-5 pilot indicated significantfavorable changes in fruit intake, fruit andvegetable knowledge, and fruit preferencesamong intervention participants.25
Intervention group schools receivedthe Gimme-5 curriculum and the teacherwellness program. TeachWell was based onthe Johnson and Johnson Live for Life®program, which includes promotional mate-rials, printed educational materials, and aseries of interactive health workshops.22'26In year 1, teachers were offered 36 healthworkshops (about 1 per week), addressingtopics such as weight loss, blood pressurecontrol, and stress management, eachapproximately 30 minutes in length. In year2, 18 workshops were offered.
An exercise program was also offeredat each school. In most schools, teachersrequested walking or low impact aerobicsprograms after school. Exercise activitieswere generally held 2 to 3 times per weekafter school. Two schools declined to par-ticipate in any of the activity programs,while participation at the other schoolsvaried.
In addition, during year 2, in weekswhen participation in classes was expectedto be low (e.g., between Thanksgiving andwinter break), wellness counselors con-ducted schoolwide campaigns instead of
workshops; for example, they offeredhealth risk appraisals at a centrally locatedstation or conducted highly visible healthactivities during which health educationmaterials were distributed. Workshops,which were generally offered after school,were delivered by wellness counselorstrained by Johnson and Johnson staff. Par-ticipants also received personalized feed-back incorporating their baseline physio-logic results, and they were offeredincentives (e.g., T-shirts) for attendingTeachWell classes and increasing exerciseas well.
Teacher Measures
Physiologic Measures. Blood pressurewas assessed with the Critikon Dynamapautomated monitor, by means of standard-ized procedures.27 Following 5 minutes ofrest, 5 readings were taken at 1-minuteintervals, with participants seated and theirright arm resting at heart level. The averageof the last 4 readings was used in analyses.Intraclass correlations (i.e., within-rater reli-abilities) for the last 4 systolic blood pres-sure measures ranged from .94 to .96 acrossthe 3 years of assessment, while correla-tions for diastolic blood pressure rangedfrom .95 to .96. Three circumference meas-ures (intraclass correlations: .92 to .99) ateach of 2 sites, waist and buttocks, wereobtained with a standard anthropometrictape, and the average of the 3 values wasused to compute a waist-to-hip ratio. Threeskinfold measurements (intraclass correla-tion: .99) were obtained at each of 3 sites:triceps, supraillium, and thighs for womenand chest, abdomen, and thighs for men.Average values from each site were used tocompute a sum of skinfolds. Staff partici-pated in 5 consecutive half days of trainingand were required to pass a certificationprotocol prior to commencing assessmentin the field.
Dietary intake. Dietary intake wasassessed with self-administered 7-day (cov-ering 5 weekdays and 2 weekend days)food records. Recording forms assessedday, time, meal, location, number of serv-ings, and food preparation procedures.Respondents rated each food in terms of 3characteristics: "low-fat practice" (e.g., fattrimmed from meat), "added fat" (e.g., mar-garine on bread), and "high-fat cookingmethod" (e.g., fried). In addition to theprinted instructions, teachers received a 20-minute training session on form comple-tion. Project staff returned approximately 8days after form distribution to answer ques-tions, clarify missing or incomplete diarydata, and distribute an incentive. Trained
dietitians abstracted the number of fruitand vegetable servings, as well as low-fatpractices and high-fat practices.28
Exercise habits. Teachers maintained a7-day exercise diary for the same days asthe diet diary. For each day of recording,the teacher was asked to record the day ofthe week, level of effort, and duration inminutes for 6 listed activities (e.g., walking,running, or jogging) and 2 "other" cate-gories. Metabolic equivalent values werecomputed with a published compendium.29Exercise diaries were used to generate 3outcome variables for the week: total min-utes of physical activity, metabolic equiva-lents of activity, and kilocalories of energyexpenditure.
Food and vegetable preferences. Thesepreferences were assessed by askingrespondents to indicate how much theyliked 10 frequently consumed vegetables(e.g., carrots, celery) and 10 frequently con-sumed fruits (e.g., bananas, apples) using 3response categories ranging from "I do notlike this" to "I like this a lot." 30 Internalconsistency (a) values for the 20-item scaleacross the three administrations rangedfrom .69 to .76.
Outcome expectations. Negative out-come expectations (ac: .80 to .84) wereassessed with 11 items that tapped poten-tially undesirable consequences of exerciseand fruit and vegetable consumption (forexample, if I ate 5 servings a day of fruitand vegetables, I would have to give up allmy favorite foods). Positive outcomeexpectations (ax: .90 to .92) were assessedwith 19 items that measured anticipatedpositive consequences of exercise and fruitand vegetable consumption.
Self-efficacy. Self-efficacy wasassessed with 4 scales: Low-Fat FoodRelapse Efficacy, Exercise Efficacy, Low-Fat Food Preparation Skills, and Fruit andVegetable Selection Efficacy. The first 3scales were based on instruments developedby Sallis et al.3' and the fourth was devel-oped by the investigators. All items wereanswered along a 5-point continuum rang-ing from "very sure I can" to "very sure Icannot." The Low-Fat Food Relapse Effi-cacy scale (a =.94) comprised 13 items(e.g., How sure are you that you can stick tolow-fat foods when you feel depressed,bored, or tense?), the Exercise Efficacyscale (ao: .92 to .94) comprised 11 items(e.g., How sure are you that you can stick toyour exercise program when undergoingstressful life events?), the Low-Fat FoodPreparation Skills scale (a: .85 to .87) com-prised 13 items (e.g., How sure are you thatyou can bake, broil, barbeque, or steamfoods instead of frying?), and the Fruit and
American Journal of Public Health 251February 1998, Vol. 88, No. 2

Resnicow et al.
Vegetable Selection Efficacy scale (a: .73to .80) comprised 9 items (e.g., How sureare you that you can eat fruit at breakfast?).
Student behavior Motivation to changestudent behavior (a: .87 to .94) was meas-ured with a 15-item scale (e.g., I want tohelp my students eat 5 servings of fruits andvegetables every day). Efficacy to help stu-dents change their behavior (a: .95 to .96)was measured with a 15-item scale (e.g., Ibelieve I can help my students to eat 5 serv-ings of fruits and vegetables every day).
Job satisfaction. Job satisfaction (at:.89 to .91) was assessed with an 18-itemscale developed by Brayfield and Roth32(e.g., My job is usually interesting enoughto keep me from getting bored). Items areanswered along a 5-point continuum rang-ing from strongly agree to strongly dis-agree.
Perceived organizational climate. Thiswas assessed with a 42-item scale devel-oped by Hoy et al.33 The instrument yieldsscores on 6 scales: Supportive Behavior,Directive Behavior, Restrictive Behavior,Collegial Behavior, Intimate Behavior, andDisengaged Behavior (a: .71 to .93).
Student Measures
Physiologic measures. The identicalprotocol used to measure blood pressure inteachers was used with students, with theappropriate pediatric cuffs. Intraclass corre-lations for the 4 systolic blood pressuremeasures ranged from .87 to .92 across the 3years of assessment, while correlations fordiastolic blood pressure ranged from .79 to.89. Three circumference measures (intra-class correlations: .88 to .98) at each of 2sites, waist and buttocks, were obtained, andthe average of the 3 values was used to com-pute a waist-to-hip ratio. Three skinfoldmeasures (intraclass correlation: .98) wereobtained at each of 3 sites-subscapula, calf,and triceps-and the sum of the averagevalue at each site was used to compute atotal sum of skinfolds.
Dietary intake. Students completed a 7-day food diary according to a standardizedprotocol.34 Children were instructed torecord all foods and beverages consumed for7 days. For each food, boxes were providedto check numbers of servings consumed. Aserving was defined as the amount usuallyput on the student's plate at home or school.Each class received a 45-minute trainingsession in form completion, during whichthe first day's diary was initiated. Trainedproject staff visited classrooms each schoolday to facilitate diary completion and verifyentries. Incomplete or illogical responseswere probed, and data were corrected. Pro-
ject staff received 5 half-day training ses-sions in the diary completion protocol.
Fruit and vegetable knowledge. Fruitand vegetable knowledge (a: .63 to .72)was measured with a 16-item scale thatassessed awareness of the recommendednumber of fruit and vegetable servings,understanding of goal setting related to fruitand vegetable choices, and strategies foradding fruits and vegetables to one's diet.
Fruit and vegetable preferences. Fruitand vegetable preferences (a: .77 to .80)were assessed with the same 20-item scaleused for teachers. In addition, snack prefer-ences (i.e., fruit or vegetables vs a higherfat/sugar snack option) were assessed withan 8-item scale (a: .72 to .76).3°
Outcome expectations. Three types ofoutcome expectations were assessed:appearance, social, and physical.35 Appear-ance expectations (a =.89) comprised 10items (e.g., If I eat fruits every day, I willhave a prettier smile), social outcomeexpectations (a: .81 to .84) comprised 10items (e.g., If I eat vegetables every day, myfriends will like me more), and physicaloutcome expectations (a: .81 to .86) com-prised 12 items (e.g., If I eat fruits everyday, I will be healthier).
Self-efficacy. Three types of self-effi-cacy regarding fruit and vegetable consump-tion were assessed in students: selection effi-cacy at breakfast and lunch, selectionefficacy at snack, and shopping efficacy.36All items were answered along a 3-pointcontinuum ranging from "I strongly agree"to "I do not agree." Selection efficacy atbreakfast and lunch (a: .82 to .85) wasassessed with 16 items (e.g., I think I can addmy favorite fruit to my favorite cereal),selection efficacy at snack (a: .83 to .86) wasassessed with 10 items (e.g., After school, Ithink I can choose my favorite raw vegetableinstead ofmy favorite candy bar), and shop-ping efficacy (a: .68 to .72) was assessedwith 5 items (e.g., I think I can ask my par-ent or guardian to buy my favorite fruit thenext time she or he goes food shopping).
Teacher Participation in the WellnessProgram
At each of the wellness classes offered,program staff maintained attendancerecords. From these records, teachers wereassigned a "participation score" represent-ing the percentage of sessions they attendedacross the 2 years of intervention.
Curriculum Implementation
Two methods were used to assessimplementation of the Gimme-5 curricu-
lum. First, approximately half of all fourth-and fifth-grade teachers were scheduledto be observed once during the 2 yearsof intervention. Budget limitations pre-cluded observing the entire sample. Ratersrecorded whether teachers implemented(scored as yes or no) each of the recom-mended procedures contained in theobserved lesson. Each session containedbetween 30 and 55 procedures. All proce-dures within a given activity were catego-rized into the following conceptualdomains: activity based (e.g., distributedworksheets), didactic, teacher behavior/teacher modeling, food preparation, askingskills, goal setting, rewards, incentivebased, social reinforcing, and family ori-ented. Teachers received a domain score(range: 0 to 1) averaging the total proce-dures implemented within each domain,along with a total score. Raters participatedin a daylong training and certificationprocess conducted by senior project staffprior to commencing field observations.37Observations were scheduled ahead of timewith teachers. In year 1, 48 of 104 (46%)fourth-grade teachers were observed, and,in year 2, 32 of 106 (30%) fifth-gradeteachers were observed.
The second measure was self-reportedimplementation. After each of the 12 ses-sions, teachers were asked to indicate on astandardized reporting form whether theytaught each Gimme-5 activity. Since virtu-ally all teachers indicated teaching everylesson in its entirety, an indication of poorvalidity, this measure was not used in sub-sequent analyses.
Statistical Analyses
Teacher and student outcomes wereexamined with 2 approaches. The first, acohort approach, included only subjectswith complete data at all 3 time points forthe outcome of interest. The second, whichcombined analytic features of both cohortand cross-sectional designs, included allsubjects with data at any time point. Sub-jects contributing data at more than 1 timepoint were linked to adjust for within-indi-vidual correlation. This method, also called"randomly overlapping samples," isreferred to here as the full sample analysis.38
For both approaches, student andteacher outcomes were analyzed with amixed-model repeated measures analysis ofvariance program, SAS PROC MIXED,that adjusted for the effects of the clusteringof measurements within schools.39 Themultivariate model included fixed-effectterms for experimental condition, ethnicity,and gender (student analyses only, since
252 American Joumal of Public Health February 1998, Vol. 88, No. 2
TeachWell Results
TABLE 1 -Participation in Teacher Wellness Activities: TeachWell Study, 1993through 1995
Attendance at Teacher Wellness Classes
Cohort Full Sample% (No.) % (No.)
Year 1 (36 lectures)No lectures 16.0 (8) 30.4 (58)1%-25% 44.0 (22) 53.9 (103)26%-75% 40.0 (20) 15.7 (30)>75% 0 (0) 0 (0)
Year 2 (18 lectures)No lectures 44.0 (22) 65.2 (146)1%-25% 28.0 (14) 19.6 (44)26%-75% 24.0 (12) 12.1 (27)>75% 4.0 (2) 3.1 (7)
Both years (54 lectures)No lectures 12.0 (6) 33.3 (83)1%-25% 60.0 (30) 53.0 (132)26%-75% 24.0 (13) 12.1 (30)>75% 2.0 (1) 1.6 (4)Mean 21 11
TABLE 2-Teacher Outcomes: TeachWell Study, 1993 through 1995
Cohort (n = 96), Full Sample (n = 439),Group X Time F Group X Time F
Physiologic variablesSystolic blood pressure 0.09 0.28Diastolic blood pressure 0.02 0.26Waist-hip ratio 0.21 0.38Sum of skinfolds 1.1 1.89
Dietary variables (7-Day Food Diary)Total F & V intake 1.0 3.19*Total fruit intake 0.96 3.43*Total vegetable intake 0.42 0.35Low-fat practices 0.24 0.95High-fat practices 1.2 1.99
Exercise habitsTotal minutes per week 0.15 0.09Metabolic equivalents per week 0.70 0.01KCAL expended per week 0.65 0.00
Psychosocial variablesF & V preferences 0.76 1.18Negative outcome expectations 0.03 0.54Positive outcome expectations 1.0 3.14*F & V selection efficacy 0.53 1.91Low-fat food relapse efficacy 0.17 0.23Exercise efficacy 0.01 0.41Behavioral skills 0.29 0.44Social support for exercise 0.23 0.41Social support for low-fat eating 0.03 0.09Negative support for low-fat eating 0.09 0.04Job satisfaction 0.47 0.09
Note. F & V = fruit and vegetable.*Pc.05 (Treatment Group X Time interaction).
2 groups using the median split of percent-age of health classes attended (median =13%), thereby creating "low" and "high"participation groups. The teacher year 3values for each outcome variable were thencompared between the low and high groupsafter adjustment for baseline values. As aresult of the large number of comparisonsbeing performed, the critical P value wasset at .01 for all analyses. Results with Pvalues between .01 and .05 are reported,although they were considered "borderline"significant.
Results
Teacher Participation in Assessment
Of the 316 eligible third- through fifth-grade teachers, 233 (74%) completed base-line data collection. Eighty-two percent ofthese teachers (268 of the eligible 329) par-ticipated in the evaluation in year 2, and79% (257 of 325) participated in year 3.Follow-up data in years 2 and 3 wereobtained from 96 (41%) of the 233 teacherswith baseline data. The 96 cohort teacherscomprised 36% and 37% of the assessmentparticipants in years 2 and 3, respectively.Approximately 23% of the teachers com-pleting baseline data did not return to studyschools in year 2, and an additional 20% ofthis group had migrated out of the schoolby the third year. Thus, while the cohort of96 teachers represented only 41% of thetotal baseline sample, the upper limit of thecohort constituted 57% of the initial samplebecause of the substantial turnover rate. The96 teachers in the cohort represented 72%of the teachers from the baseline samplewho remained in the study schools for 3years.
Sample Description
At baseline, the teacher cohort was98% female, 74% White, 26% Black, and67% married; 68% were certified healtheducation teachers, and the mean age wasapproximately 41 years. The full samplewas 98% female, 72% White, 28% Black,and 60% married; 58% were certified healtheducation teachers, and the mean age wasapproximately 38 years.
Wellness Program Participation
more than 98% of teachers were female), aswell as random-effect terms for school(nested in treatment condition) and individ-ual (nested within school).
The primary test of intervention effectsis the Group X Time interaction. For thecohort, dose-response analyses were con-
ducted by dividing the teacher sample into
As shown in Table 1, overall, cohortteachers attended an average of 21% of thehealth classes, while average attendance inthe full sample was 11%. In the cohort,across the 2 years of intervention, 72%
American Journal of Public Health 253February 1998, Vol. 88, No. 2
Resnicow et al.
attended one fourth or less of the lectures,while this proportion reached 86% in thefull sample.
Experimental group comparability. Inboth the cohort and full samples, there wereno significant differences in age, race, orany of the physiologic, behavioral, or cog-nitive outcome variables shown in Table 2between treatment and comparison groupteachers at baseline. The percentage ofteachers certified in health education alsodid not differ between conditions.
Selective attrition. The 137 teachersnot in the cohort (i.e., those who were miss-ing data at 1 or 2 follow-up points) did notdiffer from those retained in the cohort withregard to race, or any of the outcome vari-ables listed in Table 2. Noncohort teacherswere significantly (F = 2.5 1, P = .002)younger than cohort teachers (36 vs 41years). Thus, there was little evidence ofselective attrition in the teacher sample.
Differential attrition. Among the 137(62 treatment and 75 comparison) teachersnot in the cohort, no differences betweentreatment and comparison groups wereobserved for age, race, or any of the out-come variables listed in Table 2.
Student Sample
Baseline data were obtained from 1780of the 2708 (66%) third graders. Of thesestudents, follow-up data were obtained for966 (54%). Between baseline and the endof year 1 (fourth grade), 29% of the originalcohort of 1780 left their respective schools.Another 16% of the cohort migrated outbetween fourth and fifth grade. Thus, the966 students retained from the original1780 represented 95% of those studentswho were in the school all 3 years.
The student cohort at baseline was53% female, 75% Black, and 25% White,and their mean age was 8.7 years. The fullsample at baseline was similar: 52%female, 76% Black, 24% White, and amean age of 8.7 years.
Experimental group comparability. Inboth the cohort sample and the full sample,there were no significant differences in age,race, or any of the physiologic, behavioral,or cognitive outcome variables between thetreatment and comparison groups at base-line.
Selective attrition. The 814 (46%) stu-dents not in the cohort (i.e., those who weremissing data at 1 or 2 follow-up points) didnot differ from tiose retained in the cohortwith regard to age, race, or any of the out-come variables listed in Table 3. Thus, therewas no evidence of selective attrition in thestudent sample.
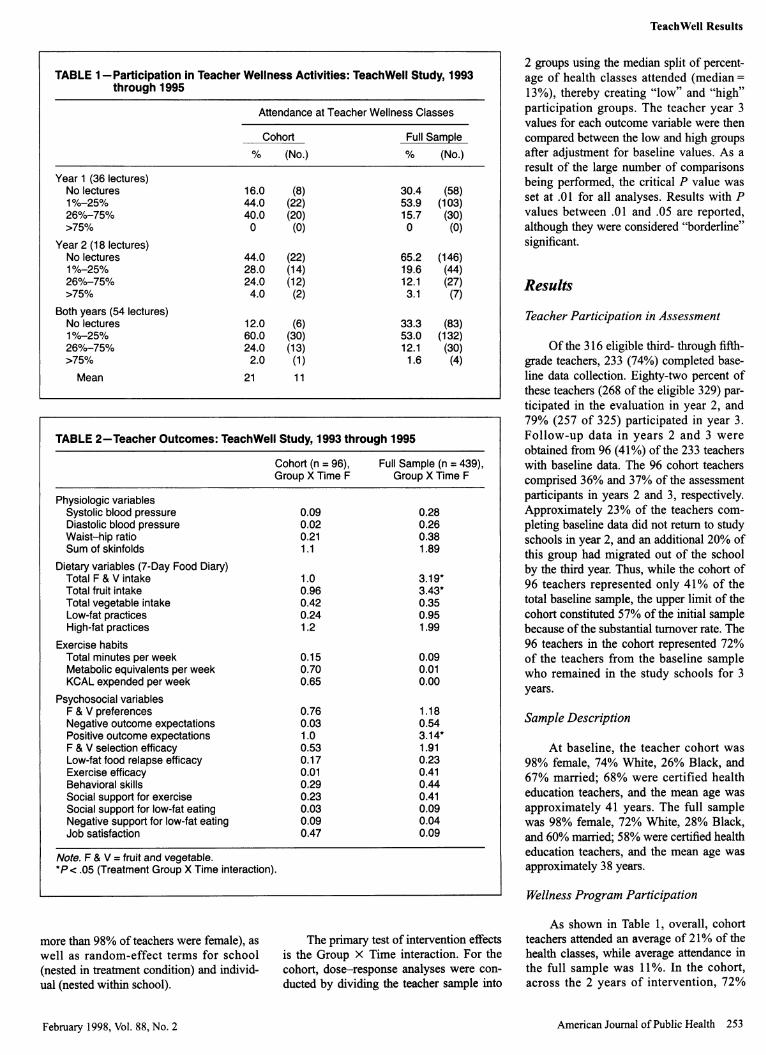
TABLE 3-Student Outcomes: TeachWell Study, 1993 through 1995
Cohort (n = 966),Group X Time F
Physiologic variablesSystolic blood pressureDiastolic blood pressureWaist-hip ratioSum of skinfolds
Dietary variables (7-day food diary)Total F & V intakeTotal fruit intakeTotal vegetable intake
Psychosocial variablesKnowledgeF & V preferencesSnack F & V preferencesAppearance outcome expectationsSocial outcome expectationsPhysical outcome expectationsSelection efficacy breakfast and lunchSelection efficacy snackShopping efficacy
0.690.550.142.9
0.390.031.11
0.523.41 *3.12*0.390.222.93*1.20.052.33
Full Sample (n = 3052),Group X Time F
0.410.290.332.92*
0.450.070.33
0.248.03**1.190.020.022.581.690.564.18*
Note. F & V = fruit and vegetable.*P < .05 (Treatment Group X Time Interaction).**P < .01 (Treatment Group X Time Interaction).
Differential attrition. Among the 814(434 comparison and 380 intervention) stu-dents not in the cohort, no differencesbetween treatment and comparison groupswere observed for age or any of the out-come variables listed in Table 3. Noncohortstudents from the experimental group weresignificantly more likely to have a parentwith greater than a high school educationthan noncohort students in the comparisongroup (x2= 12.9, P=.001), and they wereless likely to be African American(X2= 11.3, P=.001).
Teacher Outcomes
As shown in Table 2, there was no evi-dence that the intervention favorably modi-fied any of the risk factor, behavioral, orcognitive endpoints in either the cohort orfull sample analyses. Although not shownin the table, no significant differences wereobserved for motivation to change studentbehavior, for efficacy to help studentschange their behavior, for job satisfaction,or for any of the six perceived organiza-tional climate scales.
In the full sample, 3 variables weresignificant at the .05 level: total fruit andvegetable intake, fruit intake, and positiveoutcome expectations. Examination of leastsquare means, however, indicated that theseeffects favored the comparison group.
When teacher outcomes were exam-ined by level of attendance at the health lec-
tures, there were no group differencesbetween high (above the median) and low(below the median) participants at the .01level. However, high participating teachershad significantly lower (less favorable)motivation to change student behaviorscores (F = 4.29, P= .046) than low partici-pating teachers.
Student Outcomes
As shown in Table 3, there was littleevidence that the intervention favorablymodified student risk factor, behavioral, orcognitive endpoints in either the cohort orfull sample analyses. There was a signifi-cant (P<.001) group difference for fruitand vegetable preferences in the fullsample, but in the direction favoring thecomparison group.
Curriculum Implementation
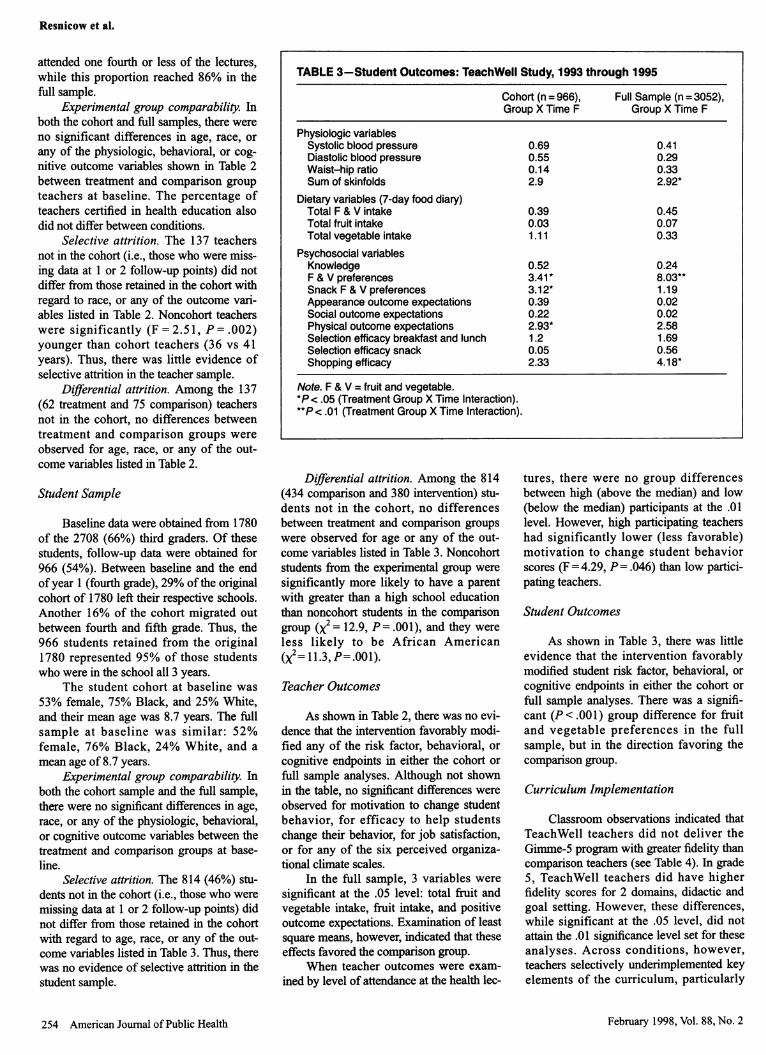
Classroom observations indicated thatTeachWell teachers did not deliver theGimme-5 program with greater fidelity thancomparison teachers (see Table 4). In grade5, TeachWell teachers did have higherfidelity scores for 2 domains, didactic andgoal setting. However, these differences,while significant at the .05 level, did notattain the .01 significance level set for theseanalyses. Across conditions, however,teachers selectively underimplemented keyelements of the curriculum, particularly
254 American Journal of Public Health February 1998, Vol. 88, No. 2
TeachWell Results
activities that included goal setting andrewards.
Discussion
The TeachWell intervention did notappreciably affect any of the student or
teacher end points. Confidence in the resultsis bolstered by the randomized design,baseline sample equivalence, appropriatemixed-model analyses, and absence ofselective or differential attrition. Severalexplanations for the null results can be prof-fered, including inadequate statisticalpower, inadequate implementation of theGimme-5 curriculum, and inadequate par-
ticipation in the teacher wellness program.
With regard to statistical power, theteacher cohort was smaller than originallyprojected. However, based on an alphavalue of .01 and power of .80, our teachercohort was sufficient to detect a differenceof 0.7 servings of fruits and vegetablesbetween the treatment and comparisongroups, while the student cohort was suffi-cient to detect a difference of 0.3 servings.Given the size and direction of the overalleffects, it is unlikely that conclusionsregarding the efficacy and public healthvalue of the intervention would have beenaltered if a larger sample were used and sig-nificance attained.
That the teacher cohort representedonly 30% (96 of 316) of the baselineteacher sample is a weakness of the study.One factor contributing to the smaller thanexpected teacher cohort was the high rate ofstaff turnover in participating schools. Thehigh turnover rate was probably related to
the availability of higher-paying positionsin nearby districts. While this limits thegeneralizability of the cohort findings, thelack of selective or differential attrition,along with the fact that findings from thefull sample analyses (which are lessaffected by attrition) were consistent withthe cohort findings, bolsters confidence inthe cohort analyses.
In regard to insufficient curriculumimplementation, it was hypothesized thatparticipation in the TeachWell program
would increase the quality and quantity ofcurriculum implementation and therebyenhance student outcomes. Quality ofimplementation was assessed by teacherobservations, which indicated that Teach-Well teachers did not deliver the Gimme-5program with greater fidelity than compari-son teachers. Consequently, absence of stu-dent effects is not surprising. The fact thatteacher observations were scheduled ratherthan unannounced may have minimized our
ability to detect group differences in imple-mentation quality. Teachers may havereacted to the observation and deliveredtheir lessons with greater fidelity whenobservers were present than they mighthave otherwise. Consequently, this fidelitymeasure may not have been representativeof their usual implementation. Nonetheless,while this may have minimized differencesin fidelity outcomes between conditions,such a limitation cannot be invoked toexplain the lack of treatment effects for theprimary teacher and student outcomes. Theoverall implementation rate of 45% across
conditions is comparable to the ratereported for some school health educationprograms8'9,40"4 but is lower than others.44'45
Consider, finally, inadequate teacherparticipation in the wellness program. Onaverage, cohort teachers attended only 21%(12 of 54) of the classes offered each year,
with only 26% attending more than one
fourth of the lectures. In the full sample, theaverage participation rate was lower,around 11%. Thus, this study can be con-
sidered a case of type III error in that inter-vention failure may have been due to inade-quate intervention delivery/exposure ratherthan intervention content.7 Nonetheless,although the rates achieved may have beeninsufficient to produce the projected inter-vention effects, these rates are comparablewith participation rates reported in otherwork and school site programs.4650
Whether significant treatment effects wouldhave been achieved with greater teacherparticipation in the wellness activities can-
not be ascertained from this study, althoughthe lack of effects even among frequentattenders suggests otherwise.
On one hand, these discouragingresults, along with the null results of a
recently published work-site trial, call intoquestion the utility of school site teacherwellness programs.51 On the other hand,other school-based wellness programs havenonetheless reported higher participationrates than those achieved in this study,as well as significant changes in physio-logic, behavioral, and cognitive out-comes 15,17-21,23,47,48 Successful work-sitewellness programs have included elementssuch as personalized counseling, lipidassessment, and on-site exercise facilities, as
well as modification of the school food ser-
vice, none of which were offered in our
intervention. In addition, some successful
American Journal of Public Health 255
TABLE 4-Teacher Implementation of the Gimme-5 Classroom Curriculum: TeachWell Study, 1993 through 1995
Task No. Proportion Completed Proportion Completed Proportion CompletedProcedures 4th Grade 5th Grade 4th and 5th Combined
4th 5th Treatment Control Treatment Control Treatment ControlGrade Grade (n=22) (n=26) (n=20) (n=12) (n=42) (n=38)
Activity based 86 152 .56 .57 .60 .50 .58 .55Didactic 62 83 .51 .53 .64 .32* .57 .47Teacher modeling 8 43 .44 .50 .60 .33 .55 .40Food preparation skills 14 14 .63 .51 .26 .27 .46 .42Affect 88 148 .46 .59 .60 .61 .53 .59Asking skills 6 32 .20 .46 .24 .32 .23 .39Goal setting 26 84 .33 .43 .60 .26* .50 .32Rewards 23 34 .24 .32 .37 .34 .30 .32Social reinforcements 44 37 .19 .28 .27 .29 .23 .28Family activity 19 44 .44 .57 .53 .28 .49 .47
Total 376 671 .42 .47 .49 .40 .45 .45
Note. Values shown are untransformed. Statistical significance was examined with transformed values.*P < .05 (treatment vs comparison group arcsine-transformed proportions; no pairs significant at .01).
February 1998, Vol. 88, No. 2

Resnicow et al.
work-site health programs used more inten-sive social marketing campaigns and incen-tive strategies than we used in our pro-gram. 19,46,49,50 Inclusion of these componentsmight have potentiated the intervention'simpact. This study, however, was designedas an effectiveness rather than an efficacytrial.52 Therefore, even though options wereavailable to increase participation (e.g., sub-stantially increasing incentives or paying forhealth club memberships), such changeswere seen as a departure from the effective-ness model and a threat to the generalizabil-ity of our findings.52
In addition, although during our for-mative evaluation teachers indicated a pref-erence that wellness activities be conductedafter school, requiring teachers to staybeyond their workday probably discouragedparticipation. Some companies allowemployees to attend wellness activities dur-ing the workday or have flex-time options,which are often not possible in the schoolsetting.46'50 Another factor that may havereduced the impact of our intervention wasthat the evaluation included all teachers ineach school, whereas, in several prior stud-ies, only teachers volunteering to partici-pate in the wellness program were includedin analyses.4653 Despite these discouragingresults, efforts to improve and test schoolsite wellness programs, as well as strategiesto enhance teacher participation in suchprograms, may be warranted. Ol
AcknowledgmentsThis study was supported with funding from theNational Heart, Lung and Blood Institute (grantHL-65 13 1).
References1. Domel SB, Baranowski T, Leonard SB, et al.
Defining the year 2000 fruit and vegetablegoal. JAm Coll Nutr. 1993;12:669-675.
2. Havas S, Heimendinger J, Damron D, et al. 5a day for better health-nine communityresearch projects to increase fruit and veg-etable consumption. Public Health Rep.1995;1 10:68-79.
3. National Research Council. Diet and Health:Implications for Reducing Chronic DiseaseRisk. Washington, DC: National AcademyPress; 1989.
4. Healthy People 2000: National Health Pro-motion and Disease Prevention Objectives.Washington, DC: US Dept. of Health andHuman Services; 1991.
5. Rohrbach LA, Graham JW, Hansen WB. Dif-fusion of a school-based substance abuse pre-vention program: predictors of programimplementation. PreyvMed. 1993;22:237-260.
6. Parcel GS, Ross JG, Lavin AT, et al. Enhanc-ing implementation of the-teenage healthteaching modules. J Sch Health. 1991;61:35-38.
7. Basch CE, Sliepcevich EM, Gold RS, et al.Avoiding type III errors in health educationprogram evaluations: a case study. HealthEduc Q. 1985;12:315-331.
8. Taggart V, Bush P, Zuckerman A, Theiss P. Aprocess of evaluation of the District ofColumbia "Know Your Body" project. J SchHealth. 1990;60:60-66.
9. Resnicow K, Cohn L, Reinhardt J, et al. Athree-year evaluation of the Know Your Bodyprogram in minority schoolchildren. HealthEduc Q. 1992;19:463-480.
10. Resnicow K, Orlandi MA, Wynder EL.Toward an effective health education policy.Prev Med. 1989;18:147-155.
11. Oetter D. Comprehensive school health edu-cation: overcoming barriers. Health Educ.October/November 1987:11-12.
12. Anderson DM, Porter P. Diffusion of cancereducation into schools. JSch Health. 1989;59:214-217.
13. Parcel GS, Simons-Morton BG, O'Hara NM,Baranowski T, Kolbe LJ, Bee DE. Schoolpromotion of healthful diet and exercisebehavior: an integration of organizationalchange and social learning theory interven-tions. J Sch Health. 1987;57:150-156.
14. Baranowski T, Heam M, Baranowski J, SmithM, Doyle C. TEACHWELL: the relationshipof teacher wellness to elementary studenthealth and behavior outcomes: baseline sub-group comparisons. J Health Educ. 1995;26(suppl 2): 1-1 1.
15. Blair SN, Tritsch L, Kutsch S. Worksitehealth promotion for school faculty and staff.JSch Health. 1987;57:469-473.
16. Dosch P, Paxton C. Recharging profession-ally: the Oregon Seaside Conferences. HealthEduc. 1981;12(6):34-35.
17. Drolet JC, Davis LG. 'Seaside'-a model forschool health education inservice. HealthEduc. 1984;15(3):25-32.
18. Girvan JT, Cottrell R. The impact of the Sea-side health education conference on middleschool health programs in Oregon. HealthEduc. 1987;18:77-82.
19. Maysey DL, Gimarc JD, Kronenfeld JJ.School worksite wellness programs: a strategyfor achieving the 1990 goals for a healthierAmerica. Health Educ Q. 1988;15:53-62.
20. Allegrante JP, Michela JL. Impact of aschool-based workplace health promotionprogram on morale of inner-city teachers. JSch Health. 1990;60:25-28.
21. Blair SN, Collingwood TR, Reynolds R,Smith M, Hagan RD, Sterling CL. Health pro-motion for health educators: impact on healthbehaviors, satisfaction, and general well-being. Am JPublic Health. 1984;74:147-149.
22. Blair SN, Piserchai PV, Wilbur CS, CrowderJH. A public health intervention model forwork-site health promotion. JAMA. 1986;255:921-926.
23. Blair SN, Smith M, Collingwood TR,Reynolds R, Prentice MC, Sterling CL.Health promotion for educators: impact onabsenteeism. Prev Med. 1986; 15:166-175.
24. Smith DW, Steckler A, Leroy KRM, BennettJ, Frye R. Promoting comprehensive schoolhealth programs through summer health pro-motion conferences. J Sch Health. 1991;61:69-74.
25. Domel SB, Baranowski T, Davis H, et al.Development and evaluation of a school inter-vention to increase fruit and vegetable con-sumption among 4th and 5th grade students. JNutr Educ. 1993;25:345-349.
26. Breslow L, Fielding J, Hernman AA, WilburCS. Worksite health promotion: its evolutionand the Johnson and Johnson experience.Prev Med. 1990;19:13-21.
27. Perloff D, Grimm C, Flack J, et al. Humanblood pressure determined by sphygmo-manometry. Circulation. 1993;88:2460-2470.
28. Baranowski T, Baranowski J, Doyle C, et al.Toward reliable estimation of servings of fruitand vegetables and fat practices from adults'seven day food records. J Nutr Educ. 1997;29:321-326.
29. Ainsworth BE, Haskell WL, Leon AS, et al.Compendium of physical activities: classifica-tion of energy costs of human physical activi-ties. Med Sci Sports Exerc. 1993;25:71-80.
30. Domel SB, Baranowski T, Davis H, LeonardSB, Riley P, Baranowski J. Measuring fruitand vegetable preferences among 4th- and5th-grade students. Prev Med. 1993;22:866-879.
31. Sallis JF, Pinski RB, Grossman RM, et al. Thedevelopment of self-efficacy scales for health-related diet and exercise behaviors. HealthEduc Res. 1988;3:283-292.
32. Brayfield AH, Roth HF. An index ofjob satis-faction. JAppl Psychol. 195 1;35:307-311.
33. Hoy WK, Tarter CJ, Kottkamp R. OpenSchools/Healthy Schools: Measuring Organi-zational Climate. Beverly Hills, Calif: SagePublications; 1991.
34. Domel SB, Baranowski T, Leonard SB, et al.Accuracy of fourth- and fifth-grade students'food records compared with school-lunchobservations. Am J Clin Nutr. 1994;59(suppl1):218S-220S.
35. Domel SB, Baranowski T, Davis H, Thomp-son WO, Leonard SB, Baranowski J. A mea-sure of outcome expectations for fruit andvegetable consumption among fourth and fifthgrade children: reliability and validity. HealthEduc Res: Theory Pract. 1995; 10:65-72.
36. Domel SB, Thompson WO, Davis H, et al.Psychosocial predictors of fruit and vegetableconsumption among elementary school chil-dren. Health Educ Res: Theory Pract. 1996;11:299-308.
37. Davis-Hearn M, Baranowski T, Resnicow K.Doing what comes naturally: teacher fidelityto a behavior change curriculum. Paper pre-sented at: Annual Meeting of the Society forNutritional Education; July 1996; St. Louis,Mo.
38. Feldman HA, McKinlay SM. Cohort versuscross-section design in large field trials: preci-sion, sample size, and a unifying model. StatMed. 1994;13:61-78.
39. Murray DM, Wolfinger RD. Analysis issuesin the evaluation of community trials:progress toward solutions in SAS/STATMIXED. J Community Psychol. 1994;22:140-145.
40. McCormick LK, Steckler AB, McLery KR.Diffusion of innovations in schools: a study ofadoption and implementation of school-basedtobacco prevention curricula. Am J HealthPromotion. 1995;9:210-219.
256 American Journal of Public Health February 1998, Vol. 88, No. 2

41. Rohrbach L, Graham J, Hansen W. Diffusionof a school-based substance abuse preventionprogram: predictors of program implementa-tion. Prev Med. 1993;22:237-260.
42. Nelson GD, Poehler D, Johnson L. Implemen-tation of the teenage health teaching modules:a case study. Health Educ. 1988;19:14-18.
43. Smith DW, McCormick LK, Steckler AB,McLeroy KR. Teachers' use of health curric-ula: implementation of growing healthy, pro-ject SMART, and the teenage health teachingmodules. JSch Health. 1993;63:349-354.
44. Luepker RV, Perry CL, McKinlay SM, et al.Outcomes of a field trial to improve children'sdietary patterns and physical activity. JAMA.1996;275:768-776.
45. Basen-Engquist K, Tompkins N, Lovato C, etal. The effect of two types of teacher trainingon implementation of Smart Choices: a
tobacco prevention curriculum. J Sch Health.1994;64:334-339.
46. Glasgow RE, McCaul KD, Fisher KJ. Partici-pation in worksite health promotion: a critiqueof the literature and recommendations forfuture practice. Health Educ Q. 1993;20:391-408.
47. Erfurt J, Foote A, Heirich M, Gregg W.Improving participation in worksite wellnessprograms: comparing health educationclasses, a menu approach, and follow-upcounseling. Am JHealth Promotion. 1990;4:270-278.
48. Steinhardt MA, Carrier KM. Early and contin-ued participation in a work-site health and fit-ness program. Res Q Exerc Sport. 1989;60:117-126.
49. Wong Y, Bauman KE, Koch GG. Increasinglow income employee participation in a work-
TeachWell Results
site health promotion program: a comparisonof three common strategies. Health Educ Res.1996;1 1:71-76.
50. Lovato CY, Green LW. Maintaining employeeparticipation in workplace health promotionprograms. Health Educ Q. 1990;17:73-88.
51. Glasgow RE, Terborg JR, Hollis JF, SeversonHH, Boles SM. Take heart: results from theinitial phase of a work-site wellness program.Am JPublic Health. 1995;85:209-216.
52. Flay BD. Efficacy and effectiveness trials inthe development of health promotion pro-grams. Prev Med. 1986; 15:451-474.
53. Pelletier K. A review and analysis of thehealth and cost-effective outcome studies ofcomprehensive health promotion and diseaseprevention programs at the worksite:1991-1993 update. Am J Health Promotion.1993;8:50-62.
APHA Reprint Series # 1The APHA: 125 Years Old |
Theand Approaching the Millenniu APHA:125 Years Old-
Edited by Elizabeth Fee and Theodore M. Brown t -and-Approachingthe Millennium
The first of a series of reprinted articles TAxn Im"M31*;vebrsc
published by the APHA in the American Journal of E I M. IPublic Health ! Contains selections of "Public Health A-lM hbl^*iAifThen and Now" articles from the last 30 years of Fthe American Journal of Public Health. A spiral-bound collection of historic medical journalism, on public healthinstitutions, social context of public health, dangerous substances, AIDS,and other infectious diseases.
* $30 for nonmembers * $25 for APHA members(add shipping and handling costs to all prices.)
* Stock No. 801 * ©1997 * 200 pages * SoftcoverTo order: 301/893-1894 * To fax: 301/843-0159
, American Public Health Association, Publications Sales, P.O. Box 753 Waldorf, MD 20604-0753
February 1998, Vol. 88, No. 2 American Journal of Public Health 257