Phylogeographic Structure of White Oaks Throughout the European Continent
Upload
scionresearchCategory
view
4download
0
Development of models to predict Pinus radiataproductivity throughout New Zealand
Michael S. Watt, David J. Palmer, Mark O. Kimberley, Barbara K. Hock,Tim W. Payn, and David J. Lowe
Abstract: Development of spatial surfaces describing variation in productivity across broad landscapes at a fine resolutionwould be of considerable use to forest managers as decision support tools to optimize productivity. In New Zealand, thetwo most widely used indices to quantify productivity of Pinus radiata D. Don are Site Index and 300 Index. Using an ex-tensive national data set comprising a comprehensive set of national extent maps, multiple regression models and spatialsurfaces of these indices for P. radiata were constructed. The final models accounted for 64% and 53%, respectively, ofthe variance in Site Index and 300 Index. For Site Index, variables included in the final model in order of importancewere mean annual air temperature, fractional mean annual available root-zone water storage, mean annual windspeed,length and slope factor, categories describing Land Environments of New Zealand (LENZ), and major soil parent material.The variables included in the final model of 300 Index in order of importance included the degree of ground frost duringautumn, fractional mean annual available root-zone water storage, categories describing LENZ, vegetation classification,foliar nitrogen, taxonomic soil order, and major soil parent material. These results highlight the utility of thematic spatiallayers as driving variables in the development of productivity models.
Resume : La mise au point de couches spatiales decrivant la variation de la productivite de grands territoires a une resolu-tion fine serait d’une grande utilite pour les amenagistes forestiers comme outil de support a la decision pour optimiser laproductivite. En Nouvelle-Zelande, les deux indices les plus utilises pour quantifier la productivite de Pinus radiata D.Don sont l’indice de qualite de station (« Site Index ») et l’indice 300 (« 300 Index »). A l’aide d’un important fichier dedonnees a l’echelle nationale comprenant un ensemble complet de cartes nationales d’etendue, nous avons construit desmodeles de regression multiple et des couches spatiales de ces indices pour P. radiata. Les modeles finaux expliquaientrespectivement 64 % et 53 % de la variance du Site Index et du 300 Index. Pour le Site Index, les variables incluses dansle modele final etaient, par ordre d’importance, la temperature annuelle moyenne de l’air, la moyenne annuelle de la frac-tion disponible de l’eau dans la rhizosphere, la vitesse annuelle moyenne du vent, la longueur et le facteur de pente, desvariables categoriques decrivant les environnements topographiques de la Nouvelle-Zelande (ETNZ) et le principal mate-riau d’origine du sol. Dans le cas du 300 Index, les variables incluses dans modele final etaient, par ordre d’importance,l’intensite du gel au sol pendant l’automne, la moyenne annuelle de la fraction disponible de l’eau dans la rhizosphere, lescategories decrivant de l’ETNZ, la classification de vegetation, l’azote foliaire, l’ordre taxonomique du sol et le principalmateriau d’origine du sol. Ces resultats mettent en evidence l’utilite des couches spatiales thematiques comme variablesexplicatives importantes dans la mise au point de modeles de productivite.
[Traduit par la Redaction]
Introduction
The influence of climatic variables on tree growth and de-velopment has been well documented throughout both thegrowth modelling and the physiological literature (Lands-berg and Waring 1997; Whitehead et al. 2001). Over recentdecades, many process-based models have been developedto provide a framework for these relationships. Such modelsrange in complexity from the simple light use efficiency ap-proach (Monteith and Moss 1977) through to more complexgrowth models that link carbon, water, and nitrogen flows inthe trees and soil (Kirschbaum 1999; Battaglia et al. 2004).
However, these models are seldom used as practical tools inforest management because they include too many uncer-tainties and often require values for a large number of pa-rameters that are difficult to obtain (Makela et al. 2000).
One means of reducing this level of parameterization,while still retaining the link with physiological processes, isto use process-based components such as water balance inempirical models. Rapid increases in the capability of geo-graphic information systems (GIS) over recent years haveseen the development of spatial surfaces covering a diverserange of environmental variables (e.g., Leathwick et al.
Received 28 May 2009. Accepted 21 December 2009. Published on the NRC Research Press Web site at cjfr.nrc.ca on 2 March 2010.
M.S. Watt.1 Scion, P.O. Box 29237, Christchurch 8540, New Zealand.D.J. Palmer, M.O. Kimberley, B.K. Hock, and T.W. Payn. Scion, Private Bag 3020, Rotorua 3046, New Zealand.D.J. Lowe. Department of Earth and Ocean Sciences, University of Waikato, Private Bag 3105, Hamilton 3240, New Zealand.
1Corresponding author (e-mail: [email protected]).
488
Can. J. For. Res. 40: 488–499 (2010) doi:10.1139/X09-207 Published by NRC Research Press

2002, 2003; Tait et al. 2006), including root-zone water stor-age estimated from a spatial water balance model (Palmer etal. 2009b). However, to date, little research has fully utilizedthe diverse array of GIS-derived environmental variables asindependent variables in models of tree productivity.
There are numerous advantages to using these GIS surfa-ces in growth models. Their use largely eliminates the needfor costly data collection and provides a more comprehen-sive range of predictive environmental variables than wouldtypically be collected from meteorological stations. As sur-faces usually completely cover the landscape, the resultingmodel can be used to develop spatial representations of pro-ductivity across broad landscape scales at a reasonably highspatial resolution.
A common limitation in the development of growth mod-els is the representation of site fertility. Although there is agood understanding of the nutrients that play a key role intree growth (Watt et al. 2005, 2008), development of inputdata that can be used operationally to predict site fertility re-mains a major challenge (Schoenholtz et al. 2000). One pos-sible method of simplifying this process is the use ofcategorical variables in models that stratify areas based onsimilarity in edaphic properties. Within New Zealand, thereare GIS surfaces describing potentially useful variables in-cluding major soil parent material and soil order. However,perhaps the most valuable of these layers for modelling isLand Environments of New Zealand (LENZ), which at thehighest level (LENZ level 1) subdivides New Zealand into20 categories on the basis of similarity between 15 key cli-matic, edaphic, and landform properties (Leathwick et al.2003). Although these categorical variables could be used assurrogates for climate and soil fertility, little research has in-vestigated the utility of these variables in growth models.
In New Zealand, Pinus radiata D. Don is the most widelyplanted commercial forestry crop covering an estimated 1.6million hectares comprising 91% of the entire national planta-tion estate (New Zealand Forest Owners Association 2005).There are two indices commonly used to quantify productivityof P. radiata within New Zealand. These are the 300 Index,defined as the stem volume mean annual increment (MAI) atage 30 years with a reference regime of 300 stems�ha–1 (Kim-berley et al. 2005), and Site Index, defined as the mean topheight (average height of the 100 largest diameter stemswithin a hectare) at age 20 years (Goulding 2005).
An extensive set of Site Index and 300 Index measure-ments (1764 independent records), covering the completeclimatic and edaphic range over which plantations are grownwithin New Zealand, were used in this study. From locationinformation, these records were matched with a comprehen-sive set of variables derived from GIS surfaces. Using thesedata sets, the primary objective of this study was to developmodels that describe the influence of climate, landform, andedaphic properties on 300 Index and Site Index for P. radi-ata. Additional objectives that were addressed in this studyincluded (i) quantifying the importance of root-zone waterstorage as a determinant of productivity and (ii) determiningthe utility of categorical variables that subdivide the countrybased on similarity in climatic, landform, and edaphic varia-bles as predictors of productivity.
Methods
Permanent sampling plot data and preliminary screeningStand-level data were extracted from the New Zealand
Forest Research Institute Ltd. permanent sample plot (PSP)system (Pilaar and Dunlop 1990). These data were examinedfor sites that could adversely influence the integrity of thedata set. Exclusions included Nelder (spacing), oversowing,disturbance (forest floor removal), and fertilizer (phos-phorus, nitrogen, and potassium) trials. For these exclusions,trial control plots were identified and retained. Other exclu-sions included data from stands planted prior to 1975 andstands less than 7 years in age. These latter two groupswere excluded, as data from young trees are inherently unre-liable and a preliminary screening of the PSP data foundthat stands established after 1975 have 300 Index values~25% higher than stands established during the 1930s. Thisinteresting result was also noted by Kimberley et al. (2005)who attributed the increase in the 300 Index in more re-cently planted stands to improvements in genetics and man-agement.
Following Kimberley et al. (2005), 300 Index and Site In-dex values were calculated from these data using the proce-dure briefly summarized below. To calculate Site Index, anational height–age model (an equation for predicting heightfor any age and Site Index) was used. This model uses aChapman–Richards (Richards 1959) model form using SiteIndex as a local parameter and with both slope and shapeparameters expressed as functions of this local parameter.By inverting the equation, it is possible to obtain Site Indexas a function of age and mean top height. In our study, themean top height measurement closest to age 20 years wasused for each PSP. This means that for plots with measure-ments made at precisely 20 years of age, the Site Index issimply the measured mean top height, while for plots notmeasured at precisely 20 years of age, the height–age modelextrapolates backwards or forwards in time to 20 years fromthe nearest height measurement.
Estimation of the 300 Index, which is a measure of stemvolume productivity, is more complex because, unlikeheight, stem volume is strongly influenced by stocking and,to a lesser extent, thinning and pruning history. To calculatethe 300 Index, a plot measurement consisting of the basalarea, mean top height, and stocking at a known age alongwith stand history information (initial stocking, timing andextent of thinnings, and timing and height of prunings) is re-quired. The 300 Index estimation procedure utilizes the 300Index model, an empirical stand-level basal area growthmodel that expresses basal area as a function of age, stock-ing, Site Index, and the 300 Index, effectively a local siteproductivity parameter (Kimberley et al. 2005). The modelaccounts for the effects of pruning and thinning using age-shift adjustments. For example, field trials have demon-strated that the effect of a typical pruning regime is to loseabout 1.4 years of basal area growth compared with a simi-lar unpruned regime, and this effect is incorporated into the300 Index growth model. The model is structured so that forstands using the standard 300 Index regime (pruned to 6 mheight and thinned at the time of final pruning so that stock-ing density at age 30 years is 300 stems�ha–1), the stem vol-ume MAI equals the 300 Index parameter. Therefore, the
Watt et al. 489
Published by NRC Research Press

300 Index is an index of stem volume productivity, definedas the volume MAI at age 30 years for this standard regime.Because the model is sensitive to departures from this stand-ard regime (e.g., different stocking levels and different in-tensities and timing of thinning and pruning regimes) andcan also adjust for the stand age, it can be used to predictthe index for any plot measurement. To do this, an iterativeprocedure is used to determine the 300 Index parametervalue compatible with the plot measurement and manage-ment history associated with the plot.
Data extraction and preprocessingA 100 m grid was overlaid on the plot locations, and
where more than one plot estimate of Site Index and 300 In-dex occurred within any one grid cell, the estimates wereaveraged so that they aligned with the independent variablesused in the modelling of forest productivity. Following ex-clusions, and this averaging, there were 1764 independentmeasurements of Site Index and 300 Index available formodelling.
From the coordinates of each of these measurements, datawere extracted from biophysical GIS surfaces that includedprimary and secondary terrain attributes (Palmer et al.2009a), monthly and annual climate variables (Mitchell1991; Leathwick et al. 2002), fundamental soil layers andland resource information (Newsome et al. 2000), vegetativecover (Newsome 1987), nitrogen and phosphorus foliar nu-trition (Hunter et al. 1991), and biophysical surfaces (Leath-wick et al. 2003) for New Zealand. A spatial soil waterbalance model (Palmer et al. 2009b) was used to determinemean annual and seasonal root-zone water storage (W) forall PSP locations. Fractional available root-zone water stor-age, Wf, was then determined from these data and the maxi-mum available root-zone water storage, Wmax, as W/Wmax.
The data set was randomly split into fitting (n = 1176)and validation (n = 588) data sets (Fig. 1). The validationdata set was used to validate the models of 300 Index andSite Index developed using the fitting data set.
Site variationVariation in tree productivity and climate was very simi-
lar between the fitting and validation data sets. Tree produc-tivity substantially varied across sites, ranging threefold and10-fold, respectively, for Site Index and 300 Index (Table 1).Climatic variation between sites was also considerable. Airtemperature ranged twofold and fourfold for mean (Ta) andminimum (Tm) annual air temperature, respectively (Table 1).Mean annual windspeed exhibited a sixfold range (Table 1)that was right skewed (skewness = 0.94) with the 50th, 75th,and 100th percentiles equalling 10.6, 13.0, and 26.6 km�h–1,respectively. Similarly, mean annual rainfall ranged sixfoldand was right skewed (skewness = 1.20) with respectivemean and maximum values of 1283 and 3372 mm. In con-trast, the threefold and fourfold respective range (Table 1)in mean annual Wf was left skewed when averaged duringthe year (skewness = –0.84) and summer (skewness = –0.48).These left skewnesses reflected the relatively low number offorested areas in dryland regions within New Zealand whererainfall is less than 1000 mm�year–1.
Data analysisAll analyses were undertaken using the SAS (SAS Insti-
tute Inc. 2000) general linear model procedure. Bivariatecorrelations between the response and independent variableswere examined within the fitting data set to identify thestrongest determinants of both Site Index and 300 Index.Comparisons of relationship strength between independentvariables were undertaken using the coefficient of determi-nation (R2).
Multiple regression models for 300 Index and Site Indexwere constructed using the fitting data set. Variables wereintroduced sequentially into each model starting with thevariable that exhibited the strongest correlation until furtheradditions were not significant or did not improve the overallmodel R2 by at least 2%. Variable significance was deter-mined manually using an F test, with the significance testedfor each variable addition against the residual sum ofsquares from the previous model. Variable selection wasundertaken manually one variable at a time to ensure thatnonlinear relationships and relationships with categoricalvariables were identified from residual plots and correctlyincorporated into the model.
Models were initially developed using climatic variables.Once these were finalized, the utility of categorical variablesin accounting for additional variance in site fertility werecompared by determining the gain in precision that singleadditions of each of these variables made to the model.These variables were singly added one at a time to the basemodels of the 300 Index and Site Index that included all sig-nificant climatic variables. For all of the independent cate-gorical variables included in the Site Index and 300 Indexmodels, values of productivity between classes within thevariable were assessed through examination of least squaremeans. This procedure effectively levels the effect of cli-mate, throughout the data set, so that the real effect of othervegetative, landform, or edaphic properties can be discerned.Multiple range testing was undertaken on these least squaremeans using Tukey’s test. Final multiple regression modelswere constructed by adding significant categorical variablesto the model with climatic variables.
For the final models, residuals were plotted against pre-dicted values and independent variables to determine modelbias and to ascertain that independent variables were in-cluded in the model using an unbiased functional form.Model precision was assessed through examination of theR2 and root mean square error (RMSE).
An independent validation was undertaken to check biasand precision of both final models by comparing model pre-dictions with observed values from the validation data set.Model precision and bias were ascertained for the validationusing the previously described tests.
Results
Bivariate relationships between environment andproductivity
The LENZ categories were the strongest determinant ofboth Site Index and 300 Index, accounting, respectively, for36% and 30% of the variance in these variables (Table 2).The major soil parent material and Ta were important deter-minants of Site Index (R2 = 0.31 for both). For 300 Index,
490 Can. J. For. Res. Vol. 40, 2010
Published by NRC Research Press

Fig. 1. Distribution of the permanent sample plot data in relation to 14 of the 20 most general classes (level 1) of Land Environments ofNew Zealand (LENZ) (Leathwick et al. 2003) used to delineate and group biophysical and environmental variables. These were the classesused in the modelling of the 300 Index and Site Index. Land areas shown in grey include the six other level 1 classifications on whichpermanent sample plots were not located.
Watt et al. 491
Published by NRC Research Press

foliar phosphorus and nitrogen were key categorical driversof productivity, while the most strongly related continuousvariables were mean annual Wf and the degree of groundfrost during autumn (Fa) (Table 2).
Multiple regression model of Site IndexWhen included in combination, the two main environmen-
tal determinants of Site Index were mean annual Ta and Wf,which accounted for a total of 49% of the variance in thedata (Table 3). Both mean annual Ta and Wf were includedin the model as downward-opening parabolas, with maximareached at mean annual values of 13.2 8C and 88% (ofWmax), respectively (Figs. 2a and 2b). Addition of mean an-nual windspeed as a negative linear term (Fig. 2c) andlength and slope factor as a downward opening parabola(Fig. 2d) with an asymptote at 17 accounted, respectively,for a further 4% and 2% of the variance in Site Index(Table 3).
Inclusion of categorical variables one at a time into theSite Index model with only the climatic terms showed thatLENZ accounted for most of the variance (partial R2 =0.057, F = 6.4, P < 0.001) followed by major soil parent
material (partial R2 = 0.05, F = 5.2, P < 0.001) and then pre-vious vegetation classification (partial R2 = 0.007, F = 2.8,P = 0.038). Soil order (highest taxonomic category forgrouping soils) did not significantly (P > 0.05) improve theclimatic model, with only continuous variables. As LENZand major soil parent material were the strongest categoricalvariables, these were added to the Site Index multiple re-gression model (see Table 3 for final statistics). After addi-tion of these two variables, no other categorical variableswere significant at P = 0.05.
Examination of least square means showed that southernlowlands and southeastern hill country/mountains had siteindices that were significantly higher than many of the otherclasses including the least productive classes of northern re-cent soils and central well-drained recent soils (Table 4). Forthe major soil parent material classes, plots located on soilsderived from loess, young sedimentary rock, and extremelyweak to weak volcanic/pyroclastic materials were most pro-ductive for Site Index and had values of Site Index signifi-cantly higher than those of all other classes (Table 5). Theplots with the lowest Site Index were those found on dunesands (Table 5).
Addition of LENZ and major soil parent materials to the fi-nal model, as class-level terms, contributed an additional 5%and 4% to the final model, respectively (Table 3). The finalmodel accounted for 64% of the variance in Site Index andthe RMSE was 3.03 m. All terms were significant (Table 3),and the residual values exhibited little apparent bias againsteither predicted values or independent variables (data notshown). Parameter values are shown in Appendix A).
Multiple regression model of 300 IndexThe Fa and average annual Wf were the two continuous
variables most strongly correlated with the 300 Index and incombination accounted for 31% of the variance (Table 3).For Fa and average annual Wf, downward-opening parabolas,with respective maxima at 3.0 frosts�month–1 (Fig. 2e) and89% (Fig. 2f), were used to characterize the relationship be-tween these variables and the 300 Index.
Inclusion of categorical variables one at a time into theclimate adjusted model showed that LENZ accounted formost of the variance (partial R2 = 0.093, F = 12.4, P <0.001) followed by major soil parent material (partial R2 =
Table 1. Site-level variation in stand structural and climatic variables for the fitting and vali-dation data sets.
Variable Fitting data set Validation data set
Structural (mean (range))Site Index (m) 29.9 (13.5–46.6) 30.1 (15.9–45.9)300 Index (m3�ha–1�year–1) 26.4 (5.0–50.0) 26.5 (9.9–48.7)
Climatic (mean (range))Mean annual Ta (8C) 11.7 (7.7–16.0) 11.7 (7.8–15.9)Mean annual Tm (8C) 6.8 (3.2–12.5) 6.8 (3.2–12.4)Mean annual daily radiation (MJ�m–2�day–1) 14.5 (12.1–15.3) 14.5 (12.1–15.3)Total mean annual rainfall (mm�year–1) 1283.(600–3372) 1282.(600–2892)Mean annual windspeed (km�h–1) 11.0 (4.7–26.6) 10.9 (4.7–25.5)Mean annual W (mm) 114.(7–293) 113.(18–293)Mean annual Wf (%) 81.(39–98) 82.(39–98)Mean summer Wf (%) 68.(24–96) 68.(24–96)
Table 2. Strength of bivariate correlations between productivityindices and continuous and categorical independent variables.
Variable Site Index R2 300 Index R2
ContinuousMean annual Ta 0.31 0.11Mean annual daily radiation 0.20 0.02Mean total annual rainfall 0.25 0.12Mean annual windspeed 0.19 0.01Mean annual Wf 0.21 0.15Fa 0.08 0.14
CategoricalLENZ 21 0.36 0.30Major soil parent material 0.31 0.14Soil order 0.24 0.11Foliar nitrogen 0.21 0.18Foliar phosphorus 0.23 0.22
Note: Variables shown have an R2 that exceeds 0.14 for either of thedependant variables. All variables shown were significantly related toeither Site Index or 300 Index at P < 0.001.
492 Can. J. For. Res. Vol. 40, 2010
Published by NRC Research Press

0.092, F = 17.7, P < 0.001), previous vegetation classifica-tion (partial R2 = 0.087, F = 50.4, P < 0.001), and finallysoil order (partial R2 = 0.042, F = 8.4, P < 0.001).
After levelling out the effect of climate, LENZ categoriesthat had the highest values of 300 Index included southernlowlands and northern hill country, which significantly ex-ceeded the lowest values found on the eastern South Islandplains, western South Island foothills, and northern recentsoils (Table 4). Climate-levelled predictions of 300 Indexvalues were highest on the major soil parent materials of lo-
ess and very weak or weak volcanic or pyroclastic depositsand lowest on dune sands (Table 5). After adjustment hadbeen made for climate, there was considerable variation in300 Index between soil orders that ranged from 24.5 to30.5 m3�ha–1�year–1. Climate-levelled predictions of 300 In-dex values showed that the highest productivity soil orders(Hewitt 1998) were Allophanic (30.5 m3�ha–1�year–1) fol-lowed by Melanic (27.8 m3�ha–1�year–1), Pumice(27.7 m3�ha–1�year–1), Gley (27.7 m3�ha–1�year–1), Pallic(27.6 m3�ha–1�year–1), Recent (26.9 m3�ha–1�year–1), Brown
Fig. 2. Partial response curves showing the influence of (a) mean annual air temperature, (b) mean annual Wf, (c) mean annual windspeed,and (d) length and slope factor on Site Index. Also shown are the influence of (e) degree ground frost in autumn and (f) mean annual Wf on300 Index. For each partial response curve, the response is shown as a black line and the lower and upper 95% confidence limits are shownas grey lines.
Watt et al. 493
Published by NRC Research Press

(26.3 m3�ha–1�year–1), and Ultic (24.6 m3�ha–1�year–1). Thelowest productivity soil order was Podzol, which had a 300Index significantly lower than that of all other soil orders(24.5 m3�ha–1�year–1).
Climate-adjusted predictions of 300 Index values in-creased relatively linearly across the four foliar nitrogen cat-egories from the least (23.4 m3�ha–1�year–1) to most fertile(28.4 m3�ha–1�year–1) classes. Significant differences werenoted between all four foliar nitrogen categories, apart fromthe two least fertile. Climate-adjusted 300 Index values forland classed as ex-pasture (29.5 m3�ha–1�year–1) were signifi-cantly higher than for the other two classes that includedexotic forest (25.8 m3�ha–1�year–1) and scrubland/revertingnative forest/native forest (25.9 m3�ha–1�year–1).
Addition of LENZ categories and previous vegetation clas-sification to the model accounted for an additional 9% and5%, respectively, of the variance in 300 Index (Table 3). In-clusion of foliar nitrogen as a categorical variable with fourcategories, ranging from low to high foliar nitrogen, ac-counted for an additional 4% of the variance in 300 Index.Model coefficients show that the 300 Index increased withhigher levels of foliar nitrogen. Both soil order and major soilparent material added 2% to the model. The final model ac-counted for 53% of the variance in 300 Index, all terms werehighly significant, and the RMSE was 4.07 m3�ha–1�year–1.Residual values exhibited little apparent bias against eitherpredicted values or independent variables (data not shown).Parameter values are shown in Appendix A.
Model validationFor Site Index, application of the developed model to the
validation data set showed the model to be relatively precise(R2 = 0.61, RMSE = 3.05 m) and unbiased with little appa-rent trend visible in plots of residual values against eitherpredicted values (Fig. 3a) or any of the independent variables(data not shown). The model developed for the 300 Indexwas found to be somewhat less precise when applied to thevalidation data set (R2 = 0.46, RMSE = 4.12 m3�ha–1�year–1).However, residuals for this model were relatively unbiasedwhen plotted against predicted values (Fig. 3b) or any of theindependent variables used in the model (data not shown).
DiscussionIn this study, two different P. radiata site productivity in-
Fig. 3. Relationship between (a) predicted and residual Site Indexand (b) predicted and residual 300 Index for the validation data set.
Table 3. Model statistics for the two final models developed for Site Index and 300 Index.
Dependant variable Independent variable F R2 RMSESite Index Mean annual Ta 259 0.31 (0.31) 4.11
Mean annual Wf 213 0.18 (0.49) 3.56Mean annual windspeed 99 0.04 (0.53) 3.42Length and slope factor 23 0.02 (0.55) 3.36LENZ (level 1) 12 0.05 (0.60) 3.16Major soil parent material 11 0.04 (0.64) 3.03
300 Index Fa 90 0.14 (0.14) 5.44Mean annual Wf 137 0.17 (0.31) 4.87LENZ (level 1) 13 0.09 (0.40) 4.56Vegetation classification 34 0.05 (0.45) 4.36Foliar nitrogen 25 0.04 (0.49) 4.21Soil order 5 0.02 (0.51) 4.14Major soil parent material 5 0.02 (0.53) 4.07
Note: For each variable introduced into the model, the partial and cumulative (in parentheses) R2
and RMSE are shown following addition of the variable to the model, with all previous terms in-cluded. The RMSE has units of m for Site Index and m3�ha–1�year–1 for 300 Index. The F values froman F test are shown for each variable addition. All F values are significant at P < 0.001.
494 Can. J. For. Res. Vol. 40, 2010
Published by NRC Research Press

dices, namely Site Index and 300 Index, were shown to belinked to site factors. However, the link between site pro-ductivity and site factors relies on the fact that these indicesare themselves good indicators of site productivity. Logi-cally, the most direct measure of productivity would be thequantity of wood grown within a given period or, as a closesurrogate, stem volume growth. However, because this isstrongly influenced by stocking, thinning history, mortality,and stand age, direct measurement of volume MAI does notnecessarily provide a reliable indicator of site quality. Acommonly used approach to overcome the effect of stockingis to use the mean height of dominant trees because heightgrowth is little affected by stocking or thinning. As dis-cussed by Assman (1970), this concept originated with F.von Bauer in 19th century Germany and has since becomewidely used internationally. Site Index, defined for P. radi-ata in New Zealand as the mean top height at age 20 years,provides such an index and has been used in a number ofprevious studies relating P. radiata productivity to site fac-tors (Truman et al. 1983; Hunter and Gibson 1984; Grey1989; Louw 1991).
The recent standardization of volume in the form of the300 Index (Kimberley et al. 2005) provides a superior andmore accurate means of ascertaining site productivity for P.
radiata than Site Index (Kimberley et al. 2005). Importantly,recent research has clearly shown that accurate and unbiasedvalues for 300 Index can be obtained using measurementstaken from stands differing in age or stocking from those ofthe 300 Index standard regime (30 years and 300 stems�ha–1
stocking; Kimberley et al. 2005).Air temperature and Wf were found to be key determi-
nants of productivity for both Site Index and 300 Index. Re-sults show that the use of categorical variables thataggregated regions were able to substantially improve thesemodels. Of the categorical variables considered, LENZ pro-vided the largest increase in predictive power, both as a solepredictor and when added to the models with climatic varia-bles. For Site Index and 300 Index, major soil parent mate-rial was found to provide similar gains to LENZ that weresubstantially greater than increases attributable to additionof soil order.
The inclusion of variables related to air temperature inboth models is sound from a physiological point of view.Although the quantity of radiation intercepted controls themaximum growth attainable, temperature is a primary deter-minant of the amount of intercepted radiation that can beutilized by the plant (Monteith and Moss 1977). The posi-tive relationship often found between tree growth and Ta
Table 4. Variation in least square means for 300 Index and Site Index between LENZ classes.
LENZ category Site Index (m) 300 Index (m3�ha–1�year–1)Southern lowlands 34.3a 31.8aNorthern hill country 31.0b 30.0abCentral sandy recent soils 30.6bc 28.8abWestern/southern North Island lowlands 30.4bcd 28.0abcSoutheast hill country/mountains 32.0ab 26.1cdCentral hill country 30.3bc 27.3cCentral dry lowlands 28.2d 28.0cNorthern lowlands 29.9bc 26.0cdCentral dry foothills 29.0cd 26.0cdCentral mountains 30.5bc 24.5dCentral well-drained recent soils 27.3d 27.6bcEastern South Island plains 28.8cd 24.0deWestern South Island foothills 28.3cd 21.5deNorthern recent soils 27.3d 22.1de
Note: Categories have been sorted in descending order using values averaged across Site Index and 300Index. Values followed by the same letter are not significantly different at P = 0.05.
Table 5. Variation in least square means for 300 Index and Site Index between the major soil parent material classes (after Leath-wick et al. 2003).
Major soil parent material Site Index (m) 300 Index (m3�ha–1�year–1)Volcanic or pyroclastic rocks/deposits: extremely weak to weak 28.3a 30.8abSedimentary rocks and deposits: Tertiary and younger 28.0a 30.8abVolcanic or pyroclastic rocks/deposits: loose basaltic/ultramafic materials 26.4b 31.9aLoess 28.2a 29.8abcOther sedimentary rocks plus schist: pre-Tertiary sedimentary rocks and schist 24.8c 29.1cSedimentary and metamorphic rocks (carbonates): limestone and marble 23.3c 29.5abcAlluvium, till, colluvium, soft sediments 24.1c 28.4cVolcanic or pyroclastic rocks/deposits: weak to extremely strong 23.9bc 27.6bcIntrusive rocks, including gneiss 23.0cd 27.6bcDune sands 19.7d 25.9cd
Note: Categories have been sorted in descending order using values averaged across Site Index and 300 Index. Values followed by the same letterare not significantly different at P = 0.05.
Watt et al. 495
Published by NRC Research Press

(Watt et al. 2005, 2008) is thought to be principally drivenby the lengthening of the growing season (Lieth 1973). Theimportance of such lengthening of the growing season wasdemonstrated recently by Kerkhoff et al. (2005) who showedthat net primary production expressed as net primary pro-duction per month of growing season was virtually invariantwith temperature.
The decline in the 300 Index with increasing frost fre-quency found in this study is consistent with this theory. Asthe growth pattern of P. radiata is strongly temperatureregulated over the year (Whitehead et al. 1994; Kimberleyand Richardson 2004; Watt et al. 2004), Fa is likely to con-trol the duration over which trees can grow during autumnand therefore the length of the growing season. The relation-ship between Site Index and Ta is also likely to be partiallymediated through the relationship between Ta and growingseason length. However, the decline in Site Index with in-creases in Ta above the optimum temperature suggests thatair temperature also has a more direct effect on the heightgrowth rate during the growing season.
Soil water balance has long been recognized as a majordeterminant of P. radiata growth at specific locations exhib-iting seasonal water deficits (McMurtrie et al. 1990; Ri-chardson et al. 2002; Watt et al. 2003). Consequently root-zone water storage, expressed as a fraction of the maximumavailable, has often been utilized as a growth modifier inboth process-based (Landsberg and Waring 1997) and hy-brid growth models (Watt et al. 2009a). Despite this, veryfew national or regional management models use this varia-ble in a predictive capacity in operational settings. Our re-search clearly demonstrates the utility of average annual Wfas a key determinant of productivity. The finding also en-dorses the use of national scale water balance models, suchas SWatBal (Palmer et al. 2009b), in providing estimates ofWf at a fine scale that can be used as input into managementmodels, such as those developed in this paper.
Results described in this study provide an insight intohow P. radiata responds to water balance and air tempera-ture. Optimum Site Index was found to occur at a mean an-nual Ta of 13.2 8C. This temperature – Site Index relationshipis broadly consistent with findings from previous research(Hunter and Gibson 1984) that indicate that maximum SiteIndex occurs within the Ta range of 7.7–16.0 8C foundwithin New Zealand. For both Site Index and 300 Index,productivity increased rapidly from a mean annual Wf of39% to a maximum at ~88% (Fig. 2). Gains over this rangewere substantial, ranging from 65% (19.7–32.6 m) for SiteIndex to 148% (11.9–29.5 m3�ha–1�year–1) for 300 Index.After this optimum value, there was a slight reduction inproductivity as mean annual Wf further increased from 88%to 98%. These reductions were very low for both Site Index(2% or 0.60 m) and 300 Index (2% or 0.54 m3�ha–1�year–1)and were relatively similar to the difference between themean and lower 95% confidence limit for both productivitymeasures at Wf = 98% (Fig. 2). It is likely that the decline inproductivity over this range is attributable to the reducedaeration that occurs in soils that are saturated for prolongedperiods (Schoenholtz et al. 2000).
The fitted functional form for mean annual Wf found inthis study is very similar to that described in the widelyused process-based model 3-PG (Landsberg and Waring
1997). In 3-PG, the soil moisture modifier and growth arenot reduced until Wf declines below a threshold. The thresh-old and the rate of decline in the modifier are dependent onsoil type (a taxonomic category below soil series, typicallyexpressed using a soil texture class), with the Wf thresholdranging from ~60% for sand to 100% for clay. Because wedo not currently have a spatial layer describing soil type,variation in this functional form by soil type could not beassessed. However, further research should be undertakeninto this aspect of the growth model, as it may provide auseful means of more accurately modelling the effects ofWf on growth at broad scales.
Despite the relatively coarse nature of categorical varia-bles, these provided a reasonable improvement in model ex-planatory power for both Site Index and 300 Index. Thesignificance of LENZ categories, after adjustment had beenmade for climate, highlights the sensitivity of this classifica-tion to landform and edaphic properties and also provided aninsight into fertility between the categories. Results clearlyshow major soil parent material to provide a greater gainthan soil order when variables were introduced one at atime into the climatic models. This outcome may reflect acloser linkage between major soil parent material and soilfertility than soil order. The patterns of 300 Index and SiteIndex values essentially mimic each other with regard tothe major soil parent material classes depicted as leastsquare means (Table 5) as follows: the highest values forboth indices are associated with loess, two of the volcanic/pyroclastic parent material classes, and the Tertiary andyounger sedimentary deposits; intermediate values are re-lated to a third, more indurated volcanic/pyroclastic parentmaterial class, a range of alluvial, glacial and colluvial sedi-ments, limestones and marbles, pre-Tertiary sedimentaryrocks and schist, and intrusive rocks; and the lowest valuesare associated with dune sands. These relationships arebroadly in keeping with the general fertility of soils associ-ated with these amalgamated parent material groups (e.g.,see Cornforth 1998; Leathwick et al. 2003) but it is empha-sized that fertility relates to a wide range of attributes in-cluding soil physical, chemical, and biological properties aswell as lithological composition and texture.
Soil orders on which plantation forests are grown withinNew Zealand have been shown to be predominantly differen-tiated on the basis of soil phosphorus retention, carbon con-tent, and air capacity (Ross et al. 2009). These three soilproperties have been found to have little effect on growth ofP. radiata compared with other edaphic properties such as to-tal phosphorus and carbon to nitrogen ratio (Watt et al. 2005,2008). For 300 Index, addition of soil order made a relativelymodest improvement to the model, through highlighting thehigh productivity of the Allophanic, Melanic, and Pumicesoils and the low productivity of the strongly leached and in-fertile Ultic and Podzol soil orders. These rankings accordwell with expert knowledge and previous research (Ross etal. 2009). For example, Allophanic soils are typically deepwith low bulk densities, large rooting volumes, and veryhigh water storage, Melanic soils are fertile and with stablestructure, and Pumice Soils, although weakly weathered anddeficient in many elements, are typically deep rooting, havehigh water storage because of fine pumice vesicularity, andhave a special ‘‘phosphorus-releasing’’ capacity (Hewitt
496 Can. J. For. Res. Vol. 40, 2010
Published by NRC Research Press
1998; Lowe and Palmer 2005; Palmer et al. 2005). Findingspresented here also show a substantial increase in productiv-ity for stands established on ex-pasture sites that are morelikely to have had a history of fertilization than ex-forest/mixed scrubland sites. This relationship between land-usehistory and productivity is consistent with results from pre-vious research for both P. radiata (Maclaren and West 2005)and Cupressus lusitanica Mill. (Watt et al. 2009b).
Gains in predictive power through inclusion of categoricalvariables that predominantly represented edaphic variableswere greater for 300 Index than for Site Index (R2 gain =0.17 versus 0.09). This disparity is likely to reflect the factthat diameter and volume are commonly found to be moresensitive to site fertility than tree height. Previous researchhas shown that P. radiata volume productivity within NewZealand is most strongly related to soil total phosphorus, ni-trogen, and carbon to nitrogen ratio (Watt et al. 2008). De-velopment of surfaces describing soil-based variables suchas these that represent the extensive range in site fertilitythroughout New Zealand (Watt et al. 2008) are likely to fur-ther improve the models described in this paper.
Although the technique used to determine 300 Index andSite Index could introduce errors, these are unlikely to be ofmajor consequence, as the projection intervals used are rela-tively short. For plots measured at age 20 years, the Site In-dex is simply the mean top height and no model is requiredfor its estimation, while for plots measured at close to age20 years (most of our plots), the height–age model is onlyused to extrapolate a little from the measurement age to age20. The 300 Index estimates are more model dependent,although for plots close to 300 stems�ha–1, the model is ef-fectively only adjusting the measurement to a standardizedage (30 years). As the productivity estimates are generatedusing a single measurement for each plot, they may some-times be slightly biased. Similarly, the indices are just aslikely to have extreme values as the measurements they areestimated from. It is also worth noting that although bothproductivity indices use models to adjust for the effects pri-marily of age (Site Index) or age and stocking (300 Index),these adjustment models are not themselves influenced bythe independent variables used for developing the 300 Indexand Site Index productivity models.
In conclusion, these results highlight the utility of the-matic spatial layers as driving variables in the developmentof productivity models. The consistency of key driving vari-ables with those previously reported, for P. radiata, stronglysupports the use of spatial layers to develop productivitymodels. Models developed from these layers are likely toimprove in the future as more variables, such as soil chemi-cal properties, become available. This approach greatly re-duces model development cost. The development ofdetailed maps of 300 Index and Site Index from these mod-els will provide invaluable decision support for determiningoptimal sites for species such as P. radiata.
AcknowledgementsWe gratefully thank Carolyn Andersen and Mark Dean
for their assistance in obtaining permission to use and ex-tract PSP data. We are also indebted to the numerous for-estry companies and private owners for supporting thisresearch. David Palmer acknowledges the Foundation for
Research Science and Technology and the University ofWaikato (Doctoral Scholarship) for funding. Barbara Hockacknowledges Foundation for Research Science and Tech-nology funding (protecting and enhancing the environmentthrough forestry CO4X0304). We are also grateful for usefulcomments made by two anonymous referees.
ReferencesAssman, E. 1970. The principles of forest yield study. Pergamon
Press, Oxford, U.K.Battaglia, M., Sands, P., White, D., and Mummery, D. 2004. CA-
BALA: a linked carbon, water and nitrogen model of forestgrowth for silvicultural decision support. For. Ecol. Manag.193(1–2): 251–282. doi:10.1016/j.foreco.2004.01.033.
Cornforth, I. 1998. Practical soil management. Lincoln UniversityPress with Whitireia Publishing and Daphne Brasell Associates,Lincoln/Wellington, New Zealand.
Goulding, C.J. 2005. Measurement of trees. Section 6.5 of theNZIF Forestry Handbook. 4th ed. Edited by M. Colley. NewZealand Institute of Forestry, Christchurch, New Zealand.
Grey, D.C. 1989. A site-growth study of Pinus radiata in theSouthern Cape. S. Afr. For. J. 150: 32–39.
Hewitt, A.E. 1998. New Zealand soil classification. 2nd ed. Land-care Research Science Series 1. Manaaki Whenua Press, Lin-coln, New Zealand.
Hunter, I.R., and Gibson, A.R. 1984. Predicting Pinus radiata siteindex from environmental variables. N.Z. J. For. Sci. 14: 53–64.
Hunter, I.R., Rodgers, B.E., Dunningham, A., Prince, J.M., andThorn, A.J. 1991. An atlas of radiata pine nutrition in New Zeal-and. For. Res. Bull. No. 165. Forest Research Institute, Rotorua,New Zealand.
Kerkhoff, A.J., Enquist, B.J., Elser, J.J., and Fagan, W.F. 2005.Plant allometry, stoichiometry and the temperature-dependenceof primary productivity. Glob. Ecol. Biogeogr. 14(6): 585–598.doi:10.1111/j.1466-822X.2005.00187.x.
Kimberley, M.O., and Richardson, B. 2004. Importance of seasonalgrowth patterns in modelling interactions between radiata pineand some common weed species. Can. J. For. Res. 34(1): 184–194. doi:10.1139/X03-201.
Kimberley, M., West, G., Dean, M., and Knowles, L. 2005. Siteproductivity: The 300 Index — a volume productivity index forradiata pine. N.Z. J. For. 50: 13–18.
Kirschbaum, M.U.F. 1999. CenW, a forest growth model withlinked carbon, energy, nutrient and water cycles. Ecol. Model.118(1): 17–59. doi:10.1016/S0304-3800(99)00020-4.
Landsberg, J.J., and Waring, R.H. 1997. A generalised model offorest productivity using simplified concepts of radiation-use ef-ficiency, carbon balance and partitioning. For. Ecol. Manag.95(3): 209–228. doi:10.1016/S0378-1127(97)00026-1.
Leathwick, J.R., Wilson, G., and Stephens, R.T.T. 2002. Climatesurfaces for New Zealand. Landcare Research contract report:LC9798/126. Landcare Research, Hamilton, New Zealand.
Leathwick, J., Wilson, G., Rutledge, D., Wardle, P., Morgan, F.,Johnston, K., McLeod, M., and Kirkpatrick, R. 2003. Land en-vironments of New Zealand. Ministry for the Environment,Wellington, and Manaaki Whenua Landcare Research, Hamilton.
Lieth, H. 1973. Primary production: terrestrial ecosystems. Hum.Ecol. 1(4): 303–332. doi:10.1007/BF01536729.
Louw, J.H. 1991. The relationship between site characteristics andPinus radiata growth on the Tsitsikamma plateau, South Africa.S. Afr. For. J. 158: 37–45.
Lowe, D.J., and Palmer, D.J. 2005. Andisols of New Zealand andAustralia. J. Integrated Field Sci. 2: 39–65.
Watt et al. 497
Published by NRC Research Press
Maclaren, J.P., and West, G.G. 2005. Farm site effect. In NZIFForestry Handbook. Edited by M. Colley.New Zealand Instituteof Forestry, Christchurch, New Zealand. pp. 76–78.
Makela, A., Landsberg, J., Ek, A.R., Burk, T.E., Ter-Mikaelian,M., Agren, G.I., Oliver, C.D., and Puttonen, P. 2000. Process-based models for forest ecosystem management: current state ofthe art and challenges for practical implementation. Tree Phy-siol. 20(5–6): 289–298. PMID:12651445.
McMurtrie, R.E., Rook, D.A., and Kelliher, F.M. 1990. Modellingthe yield of Pinus radiata on a site limited by water and nitro-gen. For. Ecol. Manag. 30(1–4): 381–413. doi:10.1016/0378-1127(90)90150-A.
Mitchell, N.D. 1991. The derivation of climate surfaces for NewZealand, and their application to the bioclimatic analysis of thedistribution of kauri (Agathis australis). J. R. Soc. N.Z. 21: 13–24.
Monteith, J.L., and Moss, C.J. 1977. Climate and the efficiency ofcrop production in Britain. Philos. Trans. R. Soc. Lond. B Biol.Sci. 281(980): 277–294. doi:10.1098/rstb.1977.0140.
Newsome, P.F.J. 1987. The vegetative cover of New Zealand.Water Soil Misc Publ No. 112. Soil Conservation Centre, Ao-kautere, Ministry of Works and Development, Wellington, NewZealand.
Newsome, P.F.J., Wilde, R.H., and Willoughby, E.J. 2000. Landresource information system spatial data layers. Landcare Re-search, Palmerston North, New Zealand.
New Zealand Forest Owners Association. 2005. New Zealand For-est Industry facts and figures 2004/2005. New Zealand ForestOwners Association, P.O. Box 1208, Wellington, New Zealand.
Palmer, D.J., Lowe, D.J., Payn, T.W., Hock, B.K., McLay, C.D.A.,and Kimberley, M.O. 2005. Soil and foliar phosphorus as indi-cators of sustainability for Pinus radiata plantation forestry inNew Zealand. For. Ecol. Manag. 220(1–3): 140–154. doi:10.1016/j.foreco.2005.08.029.
Palmer, D.J., Hock, B.K., Dunningham, A.G., Lowe, D.J., andPayn, T.W. 2009a. Developing national-scale terrain attributesfor New Zealand (TANZ). For. Res. Bull. No. 232. Forest Re-search Institute, Rotorua, New Zealand.
Palmer, D.J., Watt, M.S., Hock, B.K., Lowe, D.J., and Payn, T.W.2009b. A dynamic framework for spatial modelling Pinus ra-diata soil water balance (SWatBal) across New Zealand. For.Res. Bull. No. 234. Forest Research Institute, Rotorua, NewZealand.
Pilaar, C.H., and Dunlop, J.D. 1990. The permanent sample plotsystem of the New Zealand Ministry of Forestry. In Forestgrowth data: retrieval and dissemination. Edited by P. Adlardand J. Rondeux. Proceedings of Joint IUFRO WorkshopS4.02.03 and S4.02.04, 3–5 April 1989, Gembloux, Belgium.Bulletin des Recherches Agronomiques de Gembloux. Falcultedes sciences agronomiques, Gembloux, Belgium.
Richards, F.J. 1959. A flexible growth function for empirical use. J.Exp. Bot. 10(2): 290–301. doi:10.1093/jxb/10.2.290.
Richardson, B., Whitehead, D., and McCracken, I.J. 2002. Root-zone water storage and growth of Pinus radiata in the presenceof a broom understorey. N.Z. J. For. Sci. 32: 208–220.
Ross, C.W., Watt, M.S., Parfitt, R.L., Simcock, R., Dando, J., Coker,G., Clinton, P.W., and Davis, M.R. 2009. Soil quality relationshipswith tree growth in exotic forests in New Zealand. For. Ecol.Manag. 258(10): 2326–2334. doi:10.1016/j.foreco.2009.05.026.
SAS Institute Inc. 2000. SAS/STAT user’s guide: version 8. Vols.1, 2, and 3. SAS Institute Inc., Cary, N.C.
Schoenholtz, S.H., Van Miegroet, H., and Burger, J.A. 2000. A re-view of chemical and physical properties as indicators of forestsoil quality: challenges and opportunities. For. Ecol. Manag.138(1–3): 335–356. doi:10.1016/S0378-1127(00)00423-0.
Tait, A., Henderson, R., Turner, R., and Zheng, X. 2006. Thin platesmoothing spline interpolation of daily rainfall for New Zealandusing a climatological rainfall surface. Int. J. Climatol. 26(14):2097–2115. doi:10.1002/joc.1350.
Truman, R., Humphreys, F.R., and Lambert, M.J. 1983. Predictionof site index for Pinus radiata at Mullions Range State Forest,New South Wales. Aust. For. Res. 13: 207–215.
Watt, M.S., Whitehead, D., Richardson, B., Mason, E.G., andLeckie, A.L. 2003. Modelling the influence of weed competitionon the growth of young Pinus radiata at a dryland site. For.Ecol. Manag. 178: 271–286.
Watt, M.S., Kimberley, M.O., Richardson, B., Whitehead, D., andMason, E.G. 2004. Testing a juvenile tree growth model sensi-tive to competition from weeds using Pinus radiata at two con-trasting sites in New Zealand. Can. J. For. Res. 34(10): 1985–1992. doi:10.1139/X04-072.
Watt, M.S., Coker, G., Clinton, P.W., Davis, M., Parfitt, R.,Simcock, R., Garrett, L., Payn, T., Richardson, B., and Dunning-ham, A. 2005. Defining sustainability of plantation foreststhrough identification of site quality indicators influencing pro-ductivity — a national view for New Zealand. For. Ecol.Manag. 216(1–3): 51–63. doi:10.1016/j.foreco.2005.05.064.
Watt, M.S., Davis, M.R., Clinton, P.W., Coker, G., Ross, C., Dando,J., Parfitt, R.L., and Simcock, R. 2008. Identification of key soilindicators influencing plantation productivity and sustainabilityacross a national trial series in New Zealand. For. Ecol. Manag.256(1–2): 180–190. doi:10.1016/j.foreco.2008.04.024.
Watt, M.S., Kimberley, M.O., Richardson, B., Schou, W., andGous, S.F. 2009a. Vegetation manager-a decision support sys-tem developed to optimise forest vegetation management acrossan environmental gradient. Proceedings of the IUFRO Interna-tional Forest Biosecurity Conference, 16–20 March 2009, Ro-torua, New Zealand. New Zealand Forest Research InstituteLimited, Rotorua, New Zealand. pp. 110–113.
Watt, M.S., Palmer, D.J., Dungey, H., and Kimberley, M.O. 2009b.Predicting the spatial distribution of Cupressus lusitanica pro-ductivity in New Zealand. For. Ecol. Manag. 258(3): 217–223.doi:10.1016/j.foreco.2009.04.003.
Whitehead, D., Kelliher, F.M., Frampton, C.M., and Godfrey,M.J.S. 1994. Seasonal development of leaf area in a young,widely spaced Pinus radiata D. Don stand. Tree Physiol. 14(7–9): 1019–1038. PMID:14967667.
Whitehead, D., Leathwick, J.R., and Walcroft, A.S. 2001. Model-ing annual carbon uptake for the indigenous forests of NewZealand. For. Sci. 47(1): 9–19.
Appendix AAppendix continued on following page.
498 Can. J. For. Res. Vol. 40, 2010
Published by NRC Research Press
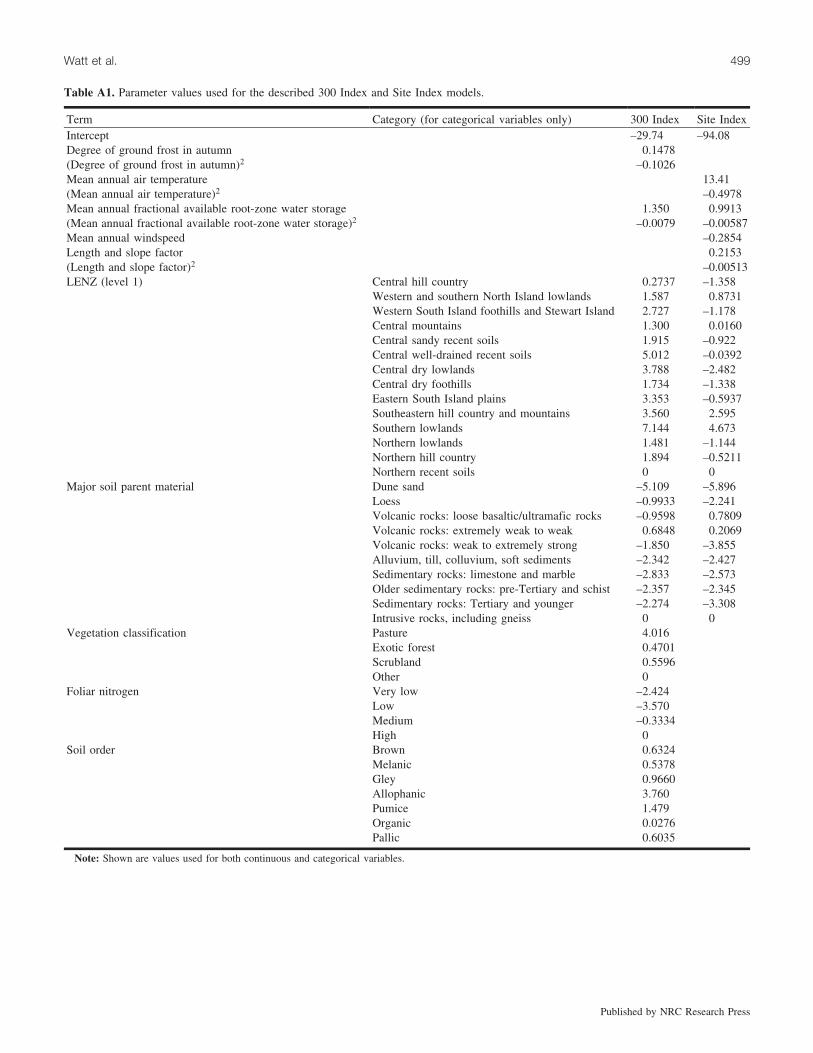
Table A1. Parameter values used for the described 300 Index and Site Index models.
Term Category (for categorical variables only) 300 Index Site IndexIntercept –29.74 –94.08Degree of ground frost in autumn 0.1478(Degree of ground frost in autumn)2 –0.1026Mean annual air temperature 13.41(Mean annual air temperature)2 –0.4978Mean annual fractional available root-zone water storage 1.350 0.9913(Mean annual fractional available root-zone water storage)2 –0.0079 –0.00587Mean annual windspeed –0.2854Length and slope factor 0.2153(Length and slope factor)2 –0.00513LENZ (level 1) Central hill country 0.2737 –1.358
Western and southern North Island lowlands 1.587 0.8731Western South Island foothills and Stewart Island 2.727 –1.178Central mountains 1.300 0.0160Central sandy recent soils 1.915 –0.922Central well-drained recent soils 5.012 –0.0392Central dry lowlands 3.788 –2.482Central dry foothills 1.734 –1.338Eastern South Island plains 3.353 –0.5937Southeastern hill country and mountains 3.560 2.595Southern lowlands 7.144 4.673Northern lowlands 1.481 –1.144Northern hill country 1.894 –0.5211Northern recent soils 0 0
Major soil parent material Dune sand –5.109 –5.896Loess –0.9933 –2.241Volcanic rocks: loose basaltic/ultramafic rocks –0.9598 0.7809Volcanic rocks: extremely weak to weak 0.6848 0.2069Volcanic rocks: weak to extremely strong –1.850 –3.855Alluvium, till, colluvium, soft sediments –2.342 –2.427Sedimentary rocks: limestone and marble –2.833 –2.573Older sedimentary rocks: pre-Tertiary and schist –2.357 –2.345Sedimentary rocks: Tertiary and younger –2.274 –3.308Intrusive rocks, including gneiss 0 0
Vegetation classification Pasture 4.016Exotic forest 0.4701Scrubland 0.5596Other 0
Foliar nitrogen Very low –2.424Low –3.570Medium –0.3334High 0
Soil order Brown 0.6324Melanic 0.5378Gley 0.9660Allophanic 3.760Pumice 1.479Organic 0.0276Pallic 0.6035 .
Note: Shown are values used for both continuous and categorical variables.
Watt et al. 499
Published by NRC Research Press
Copyright © 2022 FDOKUMEN