Development of Methods for Quantitative Comparison of Pooled shRNAs by Mass Sequencing
9
http://jbx.sagepub.com/ Journal of Biomolecular Screening http://jbx.sagepub.com/content/17/2/258 The online version of this article can be found at: DOI: 10.1177/1087057111423101 2012 17: 258 originally published online 28 September 2011 J Biomol Screen Woodring E. Wright Hirotoshi Hoshiyama, Jun Tang, Kimberly Batten, Guanghua Xiao, Jean-Marie Rouillard, Jerry W. Shay, Yang Xie and Development of Methods for Quantitative Comparison of Pooled shRNAs by Mass Sequencing Published by: http://www.sagepublications.com On behalf of: Journal of Biomolecular Screening can be found at: Journal of Biomolecular Screening Additional services and information for http://jbx.sagepub.com/cgi/alerts Email Alerts: http://jbx.sagepub.com/subscriptions Subscriptions: http://www.sagepub.com/journalsReprints.nav Reprints: http://www.sagepub.com/journalsPermissions.nav Permissions: What is This? - Sep 28, 2011 OnlineFirst Version of Record - Jan 25, 2012 Version of Record >> by guest on October 11, 2013 jbx.sagepub.com Downloaded from by guest on October 11, 2013 jbx.sagepub.com Downloaded from by guest on October 11, 2013 jbx.sagepub.com Downloaded from by guest on October 11, 2013 jbx.sagepub.com Downloaded from by guest on October 11, 2013 jbx.sagepub.com Downloaded from by guest on October 11, 2013 jbx.sagepub.com Downloaded from by guest on October 11, 2013 jbx.sagepub.com Downloaded from by guest on October 11, 2013 jbx.sagepub.com Downloaded from by guest on October 11, 2013 jbx.sagepub.com Downloaded from
Transcript of Development of Methods for Quantitative Comparison of Pooled shRNAs by Mass Sequencing

http://jbx.sagepub.com/Journal of Biomolecular Screening
http://jbx.sagepub.com/content/17/2/258The online version of this article can be found at:
DOI: 10.1177/1087057111423101
2012 17: 258 originally published online 28 September 2011J Biomol ScreenWoodring E. Wright
Hirotoshi Hoshiyama, Jun Tang, Kimberly Batten, Guanghua Xiao, Jean-Marie Rouillard, Jerry W. Shay, Yang Xie andDevelopment of Methods for Quantitative Comparison of Pooled shRNAs by Mass Sequencing
Published by:
http://www.sagepublications.com
On behalf of:
Journal of Biomolecular Screening
can be found at:Journal of Biomolecular ScreeningAdditional services and information for
http://jbx.sagepub.com/cgi/alertsEmail Alerts:
http://jbx.sagepub.com/subscriptionsSubscriptions:
http://www.sagepub.com/journalsReprints.navReprints:
http://www.sagepub.com/journalsPermissions.navPermissions:
What is This?
- Sep 28, 2011 OnlineFirst Version of Record
- Jan 25, 2012Version of Record >>
by guest on October 11, 2013jbx.sagepub.comDownloaded from by guest on October 11, 2013jbx.sagepub.comDownloaded from by guest on October 11, 2013jbx.sagepub.comDownloaded from by guest on October 11, 2013jbx.sagepub.comDownloaded from by guest on October 11, 2013jbx.sagepub.comDownloaded from by guest on October 11, 2013jbx.sagepub.comDownloaded from by guest on October 11, 2013jbx.sagepub.comDownloaded from by guest on October 11, 2013jbx.sagepub.comDownloaded from by guest on October 11, 2013jbx.sagepub.comDownloaded from

Journal of Biomolecular Screening17(2) 258 –265© 2012 Society for Laboratory Automation and ScreeningDOI: 10.1177/1087057111423101http://jbx.sagepub.com
Introduction
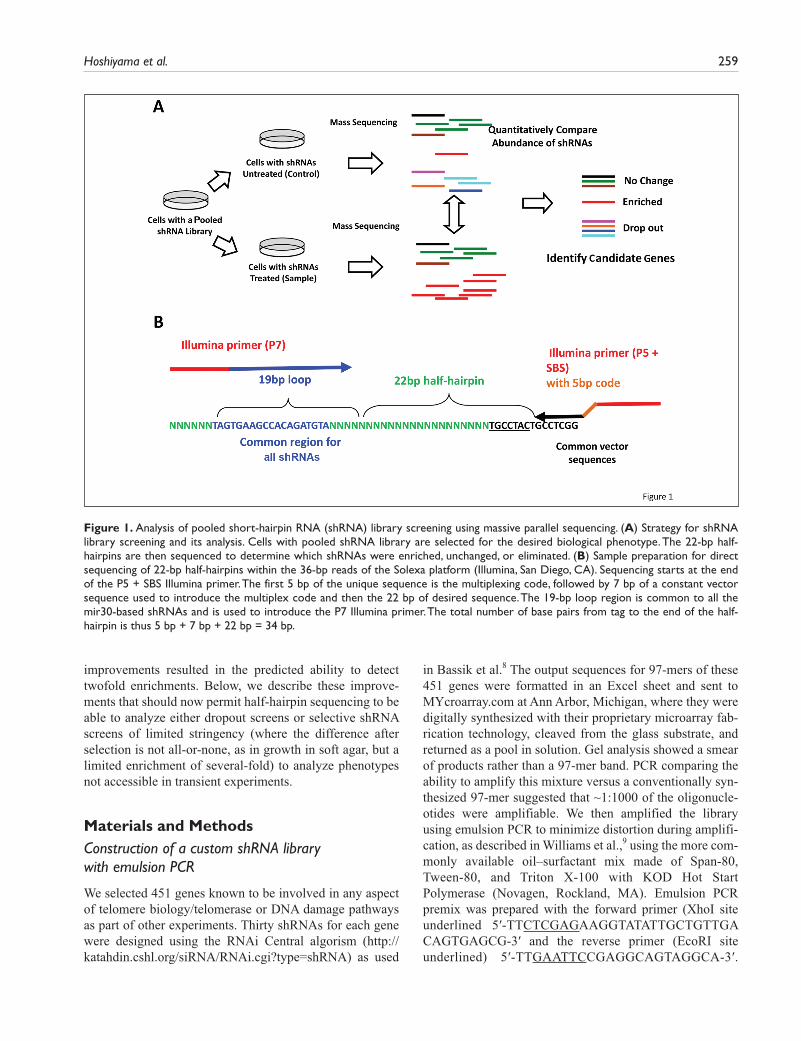
Short-hairpin RNAi (shRNA) libraries and the ability to perform large-scale gain or loss-of-function screening are powerful tools for identifying new sets of genes involved in biological pathways.1,2 High-throughput one-well/one-tar-get screening using transient small interfering RNA (siRNA) oligonucleotides or shRNAs have been widely used for phenotypes that produce rapid effects (e.g., Cerone et al.3 and Lamarcq et al.4). However, it is impractical to perform one-by-one assays for phenotypes that require a longer time to be expressed. Stable shRNA integration of pooled shRNAs provides a unique advantage for these long-term phenotypes, which cannot be assayed in the few days of a high-throughput assay. Pooled shRNAs can be identified by first recovering the integrated sequences from cells with and without selection and then determining whether their abundance has changed with respect to total shRNAs by either half-hairpin/barcode microarray5-7 or massive parallel sequencing of half-hairpins to transform the biological screening result into quantitative and compa-rable data (Fig. 1A).
We initially developed a method for amplifying half-hairpins from a 62 000–member mir30-based pGIPZ shRNA library (Open Biosystems, Huntsville, AL) that
could be analyzed by deep sequencing (Fig. 1B). By intro-ducing a multiplexing code, we could decompose the vari-ability introduced by PCR reactions and determine the minimum number of samples and reads needed to obtain statistically meaningful results for different fold-enrich-ments following selection. These initial results suggested there would be significant difficulties in reliably detecting fourfold enrichments. We thus made a smaller custom 13 530–member shRNA library using oligonucleotides syn-thesized using microarray printing technology, refined the PCR amplification scheme, and repeated the analysis. These
423101 JBXXXX10.1177/1087057111423101Hoshiyama et al.Quantitative Mass Sequencing of Pooled shRNAs
1Cell Biology, UT Southwestern Medical Center, Dallas, TX, USA.2Clinical Sciences, UT Southwestern Medical Center, Dallas, TX, USA3Biodiscovery, LLC, Ann Arbor, MI, USA.*These authors contributed equally to this work.
Received Jun 14, 2011, and in revised form Aug 2, 2011. Accepted for publica-tion Aug 19, 2011.
Supplementary material for this article is available on the Journal of Biomolecular Screening Web site at http://jbx.sagepub.com/supplemental.
Corresponding Author:Woodring E. Wright, Department of Cell Biology, UT Southwestern Medical Center, 5323 Harry Hines Blvd, Dallas, TX 75390-9039 Email: [email protected]
Development of Methods for Quantitative Comparison of Pooled shRNAs by Mass Sequencing
Hirotoshi Hoshiyama1, *, Jun Tang1, *, Kimberly Batten1, Guanghua Xiao2, Jean-Marie Rouillard3, Jerry W. Shay1, Yang Xie2, *, Woodring E. Wright1, *
Abstract
Pooled short-hairpin RNA (shRNA) library screening is a powerful tool for identifying a set of genes in biological pathways that require stable expression to produce a desired phenotype. Massive parallel sequencing of half-hairpins has proven highly variable and has not given satisfactory results concerning the relative abundance of different shRNAs before and after selection. Here, the authors describe a method for quantitative comparison of half-hairpins from pooled shRNAs in the mir30-based pGIPZ vector that is analyzed by massive parallel sequencing. Introducing a multiplexing code and refining the sample preparation scheme resulted in the predicted ability to detect twofold enrichments. These improvements should permit half-hairpin sequencing to analyze either dropout screens or selective pooled shRNA screens of limited stringency to analyze phenotypes not accessible in transient experiments.
Keywords
in vivo screening, multiplex assays, RNA interference, emulsion PCR, half-hairpins, shRNA libraries, parallel sequencing
Hoshiyama et al. 259
improvements resulted in the predicted ability to detect twofold enrichments. Below, we describe these improve-ments that should now permit half-hairpin sequencing to be able to analyze either dropout screens or selective shRNA screens of limited stringency (where the difference after selection is not all-or-none, as in growth in soft agar, but a limited enrichment of several-fold) to analyze phenotypes not accessible in transient experiments.
Materials and MethodsConstruction of a custom shRNA library with emulsion PCR
We selected 451 genes known to be involved in any aspect of telomere biology/telomerase or DNA damage pathways as part of other experiments. Thirty shRNAs for each gene were designed using the RNAi Central algorism (http://katahdin.cshl.org/siRNA/RNAi.cgi?type=shRNA) as used
in Bassik et al.8 The output sequences for 97-mers of these 451 genes were formatted in an Excel sheet and sent to MYcroarray.com at Ann Arbor, Michigan, where they were digitally synthesized with their proprietary microarray fab-rication technology, cleaved from the glass substrate, and returned as a pool in solution. Gel analysis showed a smear of products rather than a 97-mer band. PCR comparing the ability to amplify this mixture versus a conventionally syn-thesized 97-mer suggested that ~1:1000 of the oligonucle-otides were amplifiable. We then amplified the library using emulsion PCR to minimize distortion during amplifi-cation, as described in Williams et al.,9 using the more com-monly available oil–surfactant mix made of Span-80, Tween-80, and Triton X-100 with KOD Hot Start Polymerase (Novagen, Rockland, MA). Emulsion PCR premix was prepared with the forward primer (XhoI site underlined 5′-TTCTCGAGAAGGTATATTGCTGTTGA CAGTGAGCG-3′ and the reverse primer (EcoRI site underlined) 5′-TTGAATTCCGAGGCAGTAGGCA-3′.
Figure 1. Analysis of pooled short-hairpin RNA (shRNA) library screening using massive parallel sequencing. (A) Strategy for shRNA library screening and its analysis. Cells with pooled shRNA library are selected for the desired biological phenotype. The 22-bp half-hairpins are then sequenced to determine which shRNAs were enriched, unchanged, or eliminated. (B) Sample preparation for direct sequencing of 22-bp half-hairpins within the 36-bp reads of the Solexa platform (Illumina, San Diego, CA). Sequencing starts at the end of the P5 + SBS Illumina primer. The first 5 bp of the unique sequence is the multiplexing code, followed by 7 bp of a constant vector sequence used to introduce the multiplex code and then the 22 bp of desired sequence. The 19-bp loop region is common to all the mir30-based shRNAs and is used to introduce the P7 Illumina primer. The total number of base pairs from tag to the end of the half-hairpin is thus 5 bp + 7 bp + 22 bp = 34 bp.

260 Journal of Biomolecular Screening 17(2)
Each primer was used at a final concentration 0.3 µM and with 0.05 U/µL KOD Hot Start polymerase and with a tem-plate input of 1 pmol of the oligo library. Then, 260 µL of the aqueous premix was added dropwise into 400 µL of the mineral oil/detergent mixture while stirring at room tem-perature at 1000 rpm for 10 min, then divided into eight microfuge tubes. PCR was performed at 25 cycles of 95 °C for 30 s, 65 °C for 30 s, and 72 °C for 45 s. Emulsion PCR reactions were recovered by breaking the emulsion by cen-trifugation at maximum speed for 10 min and organic extrac-tion with diethyl ether. The emulsion PCR products were combined at this step and digested with EcoRI and XhoI for cloning into the lentiviral shRNAmir pGIPZ vector.
Sequencing primers were added to the PCR products prior to cloning and the distribution of different shRNAs determined by deep sequencing, comparing the efficiency of normal versus emulsion PCR in minimizing variability within the library. Emulsion PCR yielded a lower coeffi-cient of variation than normal PCR (Suppl. Fig. S1).
However, emulsion PCR appeared to be more variable for analyzing the shRNA sequences recovered from cells than the method that is described in this article. Examination of the bubble size in our emulsions indicated a large variability in size (Suppl. Fig. S2). We interpret these results to mean that emulsion PCR minimizes variability if the number of molecules for each shRNA is very large, so that each is dis-tributed among a very large number of bubble sizes. In the case of shRNAs recovered from a few million cells, the number of molecules of each shRNA is sufficiently small that emulsion PCR actually increased variability.
The pGIPZ shRNAmir vector has two EcoRI sites. We first destroyed the site not used for shRNA cloning by par-tial digestion with EcoRI and self-ligation. After successful removal of one EcoRI site, the pGIPZ vector was digested with EcoRI and XhoI, and the appropriate plasmid band was gel purified.
Ligation was performed with 500 ng of the vector and 30 ng of the Xho1–EcoR1 digested/gel-purified emulsion PCR
Figure 2. Optimization of half-hairpin sample preparation. Step 1: Retrieval of the low-abundance pooled short-hairpin RNAs (shRNAs) allows targets from 100 µg of genomic DNA to be used as input in one tube at the next PCR step. Step 2: Uniform conversion of full-hairpins to half-hairpins is a critical step to conserve the original distribution of the pooled shRNAs. Linear amplification is first performed to minimize conversion bias, which is then followed by normal PCR. Step 3: Lambda exonuclease degrades one strand but is unable to degrade 5′-thiophosphate-modified DNA. This prevents reannealing, which then allows the long low-temperature incubations needed for annealing of the multiplexing primer and extension by Klenow. Step 4: Minimize number of PCR cycles. Test PCR is performed to determine the minimal number of cycles needed to see a product. After amplification, multiplexed samples are combined prior to gel purification. See Materials and Methods for a detailed description of each step. LNA, locked nucleic acid; Tm, temperature.

Hoshiyama et al. 261
product using 500 U of T4 ligase in a total volume of 25 µL at 16 °C overnight. Then, 4 µL of the ligation reaction was transformed in 40 µL of SURE electroporation competent cells (Stratagene, Santa Clara, CA) at 25 µF capacitance, 200 Ω resistance, and 17 kV/cm field strength voltage with the Bio-Rad Gene-Pulsar (Bio-Rad, Hercules, CA). After electroporation, competent cells were suspended in 1 mL of LB media and incubated for 1 h at 37 °C, and the entire transformation was plated on a predried 150-cm ampicillin bacterial plate. The number of colonies recovered from each transformation was at least 30 000. The transformation was repeated 45 times to generate approximately 1.4 mil-lion clones (100-fold representation of each of ~13 530 shRNAs). Colonies on plates were harvested by scraping and directly used for DNA purification (Maxi-prep; Qiagen, Valencia, CA) without further amplification. We obtained ~1 mg of this cloned pGIPZ shRNA library.
Sample preparation of mir30 shRNAs for sequencing (Fig. 2)
Step 1: Enrichment of samples by biotin-streptavidin bead pull-down. 107 polyploidy cells contain ~100 µg of genomic DNA. If infected at a low multiplicity of infection (MOI), so that the majority of cells received only one shRNA, there would be only 107 molecules of shRNA (= 16.6 × 10⁻¹⁸ mol = 16.6 attomol) in 100 µg of genomic DNA. An shRNA with an abundance of 4 per million would thus be present in only 40 copies per 100 µg. To recover this low abundance of these pooled shRNAs, isolated genomic DNA (100 µg or more) was fragmented using a Misonix 3000 cup horn soni-cator and digested with XhoI and ApaLI overnight. The DNA was melted in 2× saline-sodium citrate (SSC) and then annealed in solution to 100 nM of a biotinylated locked nucleic acid (LNA) pull-down primer designed to a com-mon region of the pGIPZ vector, ~400 bp downstream of the shRNA region internal to the ApaL1 site (5′-BioTEG-CTATTGCTTCCCGTATGGCT-3′, where the underlined bases are LNA). The solution was heated at 95 °C for 3 min and then cooled to 20 °C with a ramp of 0.1 °C/s. Then, 20-µL MyOne C1 beads (Dynal, Carlsbad, CA) were washed with 80 µL binding solution from the Dynal Kilo-baseBINDER Kit and then resuspended with 50 µL binding solution and 10 µL dH
2O. The annealed DNA was mixed
with the beads and rotated at room temperature (RT) for 2.5 h at 6.5 rpm. After washing once with 100 µL washing solu-tion, the beads were resuspended in 50 µL Tris-EDTA (TE) and heated at 85 °C for 10 min to release the bound DNA and quickly placed on ice for 1 min. The eluted hairpins were collected in a separate tube.
Step 2: Conversion of hairpins to half-hairpins with LNA loop primer. To limit PCR bias during the full- to half-hairpin conversion and to increase the amount of each template before separating into four independent PCR reactions for
multiplexed replicates, the eluted enriched shRNAs were linearly (rather than exponentially) amplified with the for-ward LNA loop primer, targeting the 19-bp common region of the shRNA hairpin. Ten cycles of 95 °C for 30 s, 63 °C for 30 s, and 72 °C for 45 s were performed using the KOD Hot Start Polymerase Kit (Novagen) with only the forward LNA primer (5′-TAGTGAAGCCACAGATGTA-3′, where the first four bases have phosphorothioate linkages and where the underlined bases are modified as LNA [Bio-Syn-thesis, Lewisville, TX]) using the shRNAs eluted from the pull-down. We found that amplification was inhibited if any binding/washing solution was present from the previous pull-down. This can be avoided by careful removal of binding and washing solution before eluting the shRNAs and by simply diluting the elution with 1× TE and separating it into at least four tubes for the linear PCR amplification. The 10-cycle lin-early amplified products can then be recombined and divided into four replicate tubes for the next step of exponential PCR that includes the reverse primer. Ten cycles of 95 °C for 30 s, 63 °C for 30 s, and 72 °C for 45 s were performed after add-ing 0.3 µM of the reverse primer (5′-GAGTAATGGCCG-GCCGCATTAGT-3′). The primers were then removed by the MiniElute PCR purification kit (Qiagen). At the end of this step, the pooled molecules would be at most 1.0 × 107 × 10 (linear) × 210 (exponential) = 1.0 × 10>11 molecules (0.166 picomol), which is still too low to be able to see on a gel.
Step 3: Strand-specific degradation and Klenow addition of 5-bp multiplexing codes. The 5′ LNA primers contained thio-phosphate linkages to make them resistant to lambda exo-nuclease. The bottom strand of each PCR product was degraded using 5 U lambda exonuclease (NEB, Ipswich, MA) in 1× KOD buffer at 37 °C for 1 h followed by heat inactivation at 75 °C for 10 min, leaving the top strand intact. A P5–SBS–half-primer with a 5-bp unique code (Suppl. Table S1) was then added to a final concentration of 20 nM to anneal with the single-stranded template imme-diately adjacent to the half-hairpin (94 °C for 1 min and cooled down to 25 °C with a ramp of 0.1 °C/s). After replen-ishing the dNTP, 5 U Klenow (exo-) (NEB) was added to start the primer extension at 37 °C for 45 min and finished by heat inactivation at 75 °C for 20 min.
Step 4: Linker PCR with Illumina primers. The P7-loop and P5-SBS-Universal primers (Suppl. Table S1) were then added to a final concentration of 0.2 µM, as well as 1.0 µL KOD polymerase. After denaturing the templates at 94 ºC for 2 min, 10 to 20 test cycles (94 ºC for 20 s, 55 °C for 20 s, and 72 ºC for 60 s with a final 5-min extension at 72 °C) were performed using 0.5 µL of the Klenow reaction. This allowed the determination of the minimum number of cycles of PCR that were sufficient to produce a faint detect-able product. This was used to back-calculate the number of cycles needed for the remaining 20 µL of the input. After an appropriate number of cycles of PCR, a 1/10th volume of the PCR products was run on 1.5% agarose gel to quantify

262 Journal of Biomolecular Screening 17(2)
the intensity of the 125-bp desired product with GelRed (Phenix, Candler, NC). Equal amounts of the different mul-tiplexed products were then combined. If the volume of the combined product was large, they were concentrated by column purification. The combined PCR product was then gel purified followed by an additional column purification (Qiagen). Samples used directly from gel extraction showed inefficient cluster formation on the sequencer, so we recom-mend doing this extra purification.
Acquisition of dataWe usually obtained at least 20 million raw sequences. They were first sorted according to the 5-bp multiplex code, and then the half-hairpin reads were matched to our reference shRNA sequence file using the E-land aligner. In this script, we allowed two mismatches within the 22-bp half-hairpin region, but no mismatch was allowed in the 5-bp multiplex code region. The acquired sequencing data were first normalized by upper quartile normalization and then transformed into a Log2(X + 1) scale.
Virus packaging and transductionA DNA pool of the 13 530 lentiviral custom shRNA library or the 62 000 shRNA library (Open Biosystems) was co-transfected with packaging plasmids PAX2 and pMD2 in 293FT cells using Lipofectamine 2000 (Invitrogen, Carlsbad, CA). The filtered viral supernatant was then transduced into VA13-derived cells with Polybrene.
Results and DiscussionSample preparation is the major source of variability in sequencing data
We initially encountered large variability in the abundance of individual shRNA sequences even when using identical starting DNA. To identify the source of this variability, we independently prepared six sequencing samples (experi-mental replicates) from a single genomic DNA sample from cells transduced with a pooled 62 000 shRNA library (Open Biosystems). One of the six samples was analyzed in one entire lane of an Illumina (San Diego, CA) GAIIX (single lane), and the other five samples were multiplexed and combined in a second lane with many fewer reads per sample (multiplexed) (Suppl. Fig. S3A). Twelve million reads from “single-lane” data were binned into 12 groups of one million each as they came out of the sequencer, and we measured the variance of each shRNA between the 12 groups (Suppl. Fig. S3B). This assumes that any variability shown in single-lane data comes from something other than independent sample preparation. Data from the multiplexed samples were segregated according to their unique 5-bp
codes. The measured variance of each shRNA between these five groups reflects both the variability identified above and differences from independent amplifications of the same sample. Comparing the two data sets, we found that variability of sequencing data was large and stochastic. Decomposition of the variability found that it came largely from sample preparation, most likely from the many cycles of PCR (Suppl. Fig. S3B,C). Statistical analysis indicated that one would need a million reads from each of eight dif-ferent PCR reactions for each sample to reduce the coeffi-cient of variation sufficiently to be able to detect a sixfold difference in the most abundant 75% of the library (to achieve 80% statistical power and control type I error at 5%, eight samples would have been needed to detect a six-fold difference when the coefficient of variance was 0.83, which was the 75th percentile of the coefficient of variance [25% of shRNAs had a larger coefficient of variance]10). This low sensitivity indicated the need to further refine the method for preparing half-hairpins.
Optimization of half-hairpin sample preparation. We have optimized four critical steps in sample preparation that have collectively dramatically reduced the variation between samples (Fig. 2). Tens to hundreds of micrograms of DNA are required to maintain the complexity of the ini-tial input, but more than 1 to 2 µg of total DNA is inhibitory to the initial PCR reactions. The first step is thus to elimi-nate the bulk of total DNA by selectively retrieving the integrated shRNA regions by first hybridizing the dena-tured DNA to a biotin-containing oligonucleotide comple-mentary to the lentiviral sequences common to all the shRNAs and then recovering them using streptavidin-coated magnet beads (Fig. 2, step 1). Supplemental Figure S4 dem-onstrates that a large fraction of the target sequences could be recovered. As a result, 100 µg of genomic DNA input could be eluted from the beads and used in a single PCR at the next step without limiting the complexity of the input.
Step 2 is designed to convert the full-hairpin shRNAs into half-hairpins while minimizing any sequence-specific bias between different hairpins (Fig. 2, step 2). Two modifi-cations were introduced to accomplish this. Half-hairpins are produced using a primer (to the common 19-bp loop region containing three LNA substitutions) that increases the temperature (Tm) from 48 °C to 63 °C. The increased Tm allows higher annealing temperatures and thus decreases the stability of snap-back hairpin formation from those sequences that might inhibit the production of half-hairpins. Bias in conversion to half-hairpins was also reduced by ini-tially performing linear PCR. Bias then increases in only a linear fashion, so that after 10 cycles, a hairpin with only 10% conversion efficiency has nonetheless been converted to 10% of the half-hairpins rather than perhaps the 1/1000 that could occur during exponential amplification. After 10

Hoshiyama et al. 263
cycles of linear PCR with just the 19-bp loop-primer, the reverse primer is added for the initial exponential amplifi-cation of the minimally biased input of half-hairpins.
The third step adds both a multiplex code and the PCR sequences needed for Solexa sequencing (Fig. 2, step 3). These sequences needed to be introduced within the 36-bp read length of relatively accurate sequencing, and thus we limited the overlap of sequences needed to introduce these changes to the seven vector nucleotides immediately adja-cent to the half-hairpins. Preliminary experiments demon-strated that reannealing of upper and lower strands inhibited the efficiency of this step under the long annealing/exten-sion conditions that otherwise maximized its efficiency. We thus introduced a second modification into the loop-primer that allowed us to produce a single-stranded template for this
step. The 5′ to 3′ lambda exonuclease is unable to digest ends containing several 5′-thiophosphate linkages. The initial PCR was thus performed with a 19-bp loop primer that contained both 5-thiophosphates and LNA substitutions. Treatment of the PCR product with lambda exonuclease then selectively degraded the bottom strand, leaving a single-stranded upper strand template for the introduction of the multiplex codes and sequencing primers using Klenow (Suppl. Fig. S5). We have tested 40 different 5-bp codes for efficient sample prep-aration and found many sequences did not show efficient PCR. Twenty-four of them showed good efficiency of sample production (Suppl. Table S1) after step 4.
The last step is to perform PCR with modified Illumina primers that add the remaining nucleotides needed for sequenc-ing and determining the lowest number of PCR cycles needed
Figure 3. Refined method decreases experimental variability and increases the detection of small fold changes. (A) Four independent samples were prepared from common genomic DNA transduced with the custom short-hairpin RNA (shRNA) library and multiplexed. (B) The normalized abundance of each shRNA is plotted against its abundance in the other three replicates. The data are relatively consistent with some outliers. (C) The coefficient of variance (CoV) for individual shRNAs plotted for the 13 530 different shRNAs; ~90% had a coefficient of variance below 0.3. (D) Variation in detectable fold change for the 90% quantile of the coefficient of variation (90% less variable, 10% more variable) of the custom shRNA library with increasing multiplexed replicates. The choice of four replicates represents a reasonable balance between practicality and accuracy. (E) The number of shRNAs from this 13 530–member shRNA library exhibiting different coefficients of variance and the corresponding detectable fold change for different numbers of replicates.

264 Journal of Biomolecular Screening 17(2)
to faintly visualize the product to minimize general PCR bias. Equal amounts of DNA from different multiplexed samples are then combined, gel purified, and sequenced.
Refined method decreased experimental variability and increased sensitivityTo test if these modifications in sample preparation could reduce the variability among experimental replicates, we independently prepared four sequencing samples from a single sample of genomic DNA from cells transduced with a pooled 13 530–member custom library of mir30-based pGIPZ shRNAs (Fig. 3A; see Materials and Methods for construction of the custom shRNA library). The enriched pull-down elution was amplified by 10 cycles of linear amplification with the thiophosphate–LNA primer to mini-mize both half-hairpin conversion bias and input variation prior to separating into four samples to avoid sampling problems. The four samples were prepared as described above, multiplexed, and sequenced together in a single lane along with other multiplexed samples. Sequencing data generated ~1 million reads per sample, and each set of data was normalized and transformed to a Log2(X + 1) scale.
The number of sequencing reads (abundance) per individ-ual shRNA in each sample was plotted against its abun-dance in each of the other three samples (Fig. 3B). These data showed good consistency among replicates, although there are some outliers in each comparison. The modified method dramatically decreased the overall coefficients of variance across replicates (Fig. 3C). Using these modifica-tions, about 90% of 13 530 shRNAs have a coefficient of variance below 0.3, and about 80% of shRNAs have a coef-ficient of variance below 0.2. The low coefficient of vari-ance enables the experiment to detect subtle changes in shRNA abundance. Figure 3D shows how the detectable fold change for 90% of the custom shRNAs varies with dif-ferent numbers of replicates based on our data. It is derived by assuming experimental conditions and quality are fixed, with only the number of replicates changing. Figure 3E summarizes how the coefficients of variance and number of replicates determine the detectable fold changes, as well as the correspondence between the coefficient of variance and the number of shRNAs that fall within these limits in our experiments. On the basis of these results, we selected four replicates as representing a reasonable balance between practicality and increased accuracy.
Figure 4. Validation using spiked-in short-hairpin RNAs (shRNAs). Twenty-five reference shRNAs that do not exist in our custom shRNA library were diluted to 20 molecules/µL. Inaccuracies in determining the initial concentration and during serial dilutions will produce some variation. Combinations of these diluted pGIPZ plasmids were mixed with genomic DNA transduced with the custom shRNA library as shown prior to the pull-down step. Four multiplexed replicates were made for each of the four experiments. Experiments 1 and 3 are duplicates of what could be considered the abundance prior to selection and experiments 2 and 4 the abundance following selection. The x-axis is the designed ratio (fold change) between samples (mean reads of experiments 1 and 3/mean reads of experiments 2 and 4). The y-axis is the observed fold change based on sequencing data. The figure confirms that the measured fold change between samples in most cases accurately reflects the designed ratio for shRNAs with sufficient abundance.

Hoshiyama et al. 265
Analysis of the refined method by means of spiked-in shRNAs
We further validated the refined sample preparation by spiking the genomic DNA with defined amounts of 25 reference pGIPZ shRNA plasmids that were not present in the custom shRNA library. Each spiked shRNA was care-fully diluted to 20 molecules/µL and mixed with the genomic DNA transduced with the custom shRNA library before pull-down to see if the small amount of reference shRNA plasmids were represented at the appropriate abundance among repeated experiments (biological repli-cates). Sequencing results showed that measured shRNA ratios were accurate compared with the designed ratios, and the results were consistent among the experiments (Fig. 4). This method is thus reliably recovering even low-abundance reference shRNAs and accurately detect-ing fold changes between samples.
The refined method of sample preparation described here demonstrates significant improvements for sequencing shRNA screens in both data quality and the resulting ability to detect small fold changes in abundance (Suppl. Fig. S6). Multiplexing samples and having experimental replicates allows one to know the statistical reliability of the sequenc-ing data and eliminate false positives by removing outliers as well as minimizing the cost of sequencing. Minimizing the total number of PCR cycles is also key for reducing gen-eral PCR bias because one only needs 10 nmol of the final product for sequencing.
Microarray analysis is currently the favored method for the analysis of large-scale pooled shRNA library screening. Microarray analysis using long barcodes is only suitable for commercial libraries and is not readily adapted to custom libraries. Microarray probe preparation requires large amounts of PCR product for competitive hybridiza-tion of fluorescence-labeled probes (half-hairpins or bar-code sequences), which could contribute PCR bias. For half-hairpin microarrays, there will be complications due to weak and selective hybridization of the short ~22-bp variable-sequence probes. Furthermore, it is questionable whether detecting twofold change by the relative signal intensity of the two fluorescent probes is valid for anything but the more abundant shRNAs.
We have developed a method for a successful construc-tion of high-complexity custom shRNA libraries targeting a pathway of interest and a method for the quantitative com-parison of the pooled shRNA library by successfully recov-ering the half-hairpins and analyzing them using mass parallel sequencing. This allows one to design a pooled shRNA library targeting particular pathways that can be analyzed by deep sequencing of half-hairpins without rely-ing on custom barcode microarrays, which are not available for custom libraries.
AcknowledgmentsThis work was supported by the National Institutes of Health (5R01CA152301 to Y.X., 1R21DA027592 to G.X.), the National Science Foundation (DMS-0907562 to G.X.), the Simmons Comprehensive Cancer Center, and the Texas Advanced Research Program (010019-0084-2007 to W.E.W.).
Declaration of Conflicting InterestsJ.M.R. is co-founder and employed by Biodiscovery, LLC (DBA MYcroarray).
References
1. Moffat, J.; Grueneberg, D. A.; Yang, X.; Kim, S. Y.; Kloep-fer, A. M.; Hinkle, G.; Piqani, B.; Eisenhaure, T. M.; Luo, B.; Grenier, J. K.; et al. A Lentiviral RNAi Library for Human and Mouse Genes Applied to an Arrayed Viral High-Content Screen. Cell 2006, 124, 1283–1298.
2. Paddison, P. J.; Silva, J. M.; Conklin, D. S.; Schlabach, M.; Li, M.; Aruleba, S.; Balija, V.; O’Shaughnessy, A.; Gnoj, L.; Sco-bie, K.; et al. A Resource for Large-Scale RNA-Interference-Based Screens in Mammals. Nature 2004, 428, 427–431.
3. Cerone, M. A.; Burgess, D. J.; Naceur-Lombardelli, C.; Lord, C. J.; Ashworth, A. High-Throughput RNAi Screening Reveals Novel Regulators of Telomerase. Cancer Res. 2011, 71, 3328–3340.
4. Lamarcq, L. H.; Scherer, B. J.; Phelan, M. L.; Kalnine, N. N.; Nguyen, Y. H.; Kabakova, T.; Chen, X.; Tan, M.; Chang, C.; Berlon, C.; et al. Large-Scale, High-Throughput Validation of Short Hairpin RNA Sequences for RNA Interference. J. Bio-mol. Screen. 2006, 11, 236–246.
5. Luo, B.; Cheung, H. W.; Subramanian, A.; Sharifnia, T.; Oka-moto, M.; Yang, X.; Hinkle, G.; Boehm, J. S.; Beroukhim, R.; Weir, B. A.; et al. Highly Parallel Identification of Essential Genes in Cancer Cells. Proc. Natl. Acad. Sci. U. S. A. 2008, 105, 20380–20385.
6. Schlabach, M. R.; Luo, J.; Solimini, N. L.; Hu, G.; Xu, Q.; Li, M. Z.; Zhao, Z.; Smogorzewska, A.; Sowa, M. E.; Ang, X. L.; et al. Cancer Proliferation Gene Discovery through Functional Genomics. Science 2008, 319, 620–624.
7. Silva, J. M.; Marran, K.; Parker, J. S.; Silva, J.; Golding, M.; Schlabach, M. R.; Elledge, S. J.; Hannon, G. J.; Chang, K. Profiling Essential Genes in Human Mammary Cells by Mul-tiplex RNAi Screening. Science 2008, 319, 617–620.
8. Bassik, M. C.; Lebbink, R. J.; Churchman, L. S.; Ingolia, N. T.; Patena, W.; LeProust, E. M.; Schuldiner, M.; Weiss-man, J. S.; McManus, M. T. Rapid Creation and Quantitative Monitoring of High Coverage shRNA Libraries. Nat. Methods 2009, 6, 443–445.
9. Williams, R.; Peisajovich, S. G.; Miller, O. J.; Magdassi, S.; Tawfik, D. S.; Griffiths, A. D. Amplification of Complex Gene Libraries by Emulsion PCR. Nat. Methods 2006, 3, 545–550.
10. Van Belle, G.; Martin, D. C. Sample Size as a Function of Coefficient of Variation and Ratio of Means. Am. Statistician 1993, 47, 165–167.