Sequencing Analysis Viewer v2.4 - Software Guide - Illumina
21
Sequencing Analysis Viewer v2.4 Software Guide Introduction 3 Set Up Sequencing Analysis Viewer 3 Metric Definitions 5 Load Data 6 Analysis Tab 6 Imaging Tab 8 Summary Tab 9 Indexing Tab 10 InterOp Files 11 Revision History 19 Technical Assistance 20 Document # 15066069 v04 March 2019 ILLUMINA PROPRIETARY For Research Use Only. Not for use in diagnostic procedures.
-
Upload
khangminh22 -
Category
Documents
-
view
0 -
download
0
Transcript of Sequencing Analysis Viewer v2.4 - Software Guide - Illumina
Sequencing Analysis Viewer v2.4Software Guide
Introduction 3
Set Up Sequencing Analysis Viewer 3
Metric Definitions 5
Load Data 6
Analysis Tab 6
Imaging Tab 8
Summary Tab 9
Indexing Tab 10
InterOp Files 11
Revision History 19
Technical Assistance 20
Document # 15066069 v04
March 2019
ILLUMINA PROPRIETARY
For Research Use Only. Not for use in diagnostic procedures.
This document and its contents are proprietary to Illumina, Inc. and its affiliates ("Illumina"), and are intended solely forthe contractual use of its customer in connection with the use of the product(s) described herein and for no otherpurpose. This document and its contents shall not be used or distributed for any other purpose and/or otherwisecommunicated, disclosed, or reproduced in any way whatsoever without the prior written consent of Illumina. Illuminadoes not convey any license under its patent, trademark, copyright, or common-law rights nor similar rights of any thirdparties by this document.
The instructions in this document must be strictly and explicitly followed by qualified and properly trained personnel inorder to ensure the proper and safe use of the product(s) described herein. All of the contents of this document must befully read and understood prior to using such product(s).
FAILURE TO COMPLETELY READ AND EXPLICITLY FOLLOW ALL OF THE INSTRUCTIONS CONTAINED HEREIN MAYRESULT IN DAMAGE TO THE PRODUCT(S), INJURY TO PERSONS, INCLUDING TO USERS OR OTHERS, AND DAMAGETO OTHER PROPERTY, AND WILL VOID ANY WARRANTY APPLICABLE TO THE PRODUCT(S).
ILLUMINA DOES NOT ASSUME ANY LIABILITY ARISING OUT OF THE IMPROPER USE OF THE PRODUCT(S)DESCRIBED HEREIN (INCLUDING PARTS THEREOF OR SOFTWARE).
© 2019 Illumina, Inc. All rights reserved.
All trademarks are the property of Illumina, Inc. or their respective owners. For specific trademark information, seewww.illumina.com/company/legal.html.
Document # 15066069 v04
For Research Use Only. Not for use in diagnostic procedures.2
Sequencing Analysis Viewer v2.4 Guide
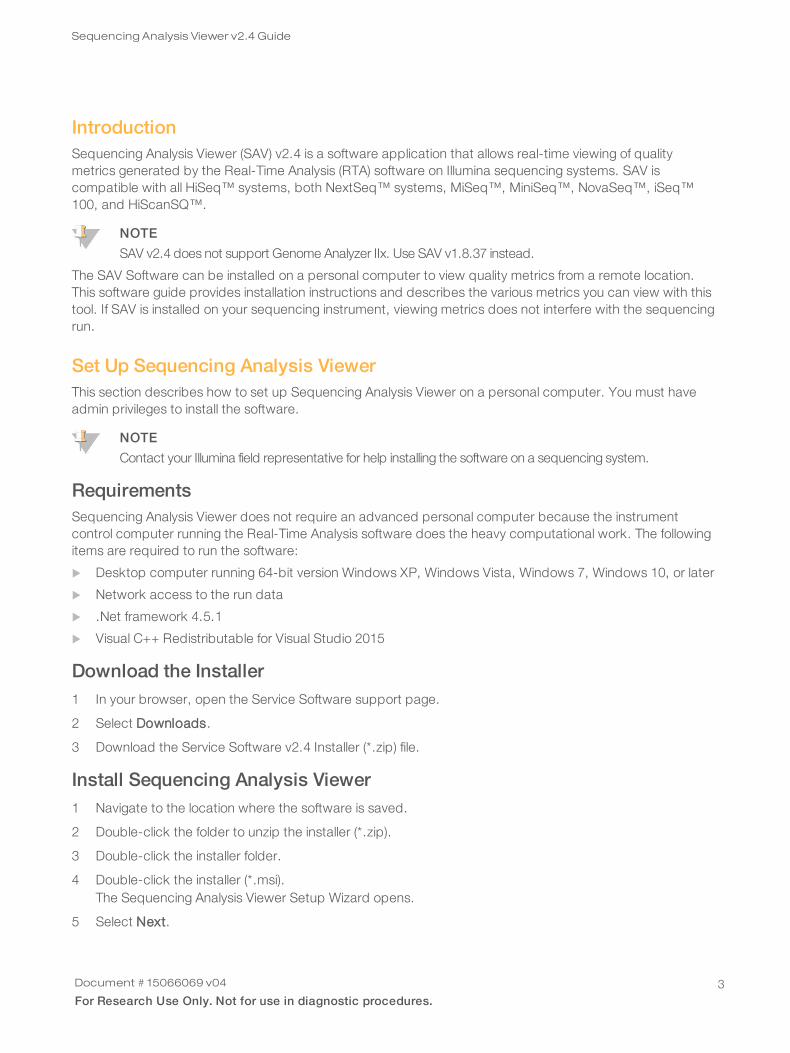
IntroductionSequencing Analysis Viewer (SAV) v2.4 is a software application that allows real-time viewing of qualitymetrics generated by the Real-Time Analysis (RTA) software on Illumina sequencing systems. SAV iscompatible with all HiSeq™ systems, both NextSeq™ systems, MiSeq™, MiniSeq™, NovaSeq™, iSeq™100, and HiScanSQ™.
NOTE
SAV v2.4 does not support Genome Analyzer IIx. Use SAV v1.8.37 instead.
The SAV Software can be installed on a personal computer to view quality metrics from a remote location.This software guide provides installation instructions and describes the various metrics you can view with thistool. If SAV is installed on your sequencing instrument, viewing metrics does not interfere with the sequencingrun.
Set Up Sequencing Analysis ViewerThis section describes how to set up Sequencing Analysis Viewer on a personal computer. You must haveadmin privileges to install the software.
NOTE
Contact your Illumina field representative for help installing the software on a sequencing system.
RequirementsSequencing Analysis Viewer does not require an advanced personal computer because the instrumentcontrol computer running the Real-Time Analysis software does the heavy computational work. The followingitems are required to run the software:
u Desktop computer running 64-bit version Windows XP, Windows Vista, Windows 7, Windows 10, or later
u Network access to the run data
u .Net framework 4.5.1
u Visual C++ Redistributable for Visual Studio 2015
Download the Installer1 In your browser, open the Service Software support page.
2 Select Downloads.
3 Download the Service Software v2.4 Installer (*.zip) file.
Install Sequencing Analysis Viewer1 Navigate to the location where the software is saved.
2 Double-click the folder to unzip the installer (*.zip).
3 Double-click the installer folder.
4 Double-click the installer (*.msi).The Sequencing Analysis Viewer Setup Wizard opens.
5 Select Next.
Document # 15066069 v04
For Research Use Only. Not for use in diagnostic procedures.3
Sequencing Analysis Viewer v2.4 Guide
The installation starts, and the progress screen opens. When the installation is finished, a desktopshortcut is created and the setup complete screen appears.
6 Select Finish.
Test the InstallationWhen you have installed the SAV software, use the following instructions to make sure that the applicationwas installed properly and that you have the proper permissions.
1 Double-click the Il lumina Sequencing Analysis Viewer desktop shortcut, or go to C:\Illumina\IlluminaSequencing Analysis Viewer and double-click Sequencing Analysis Viewer.exe.
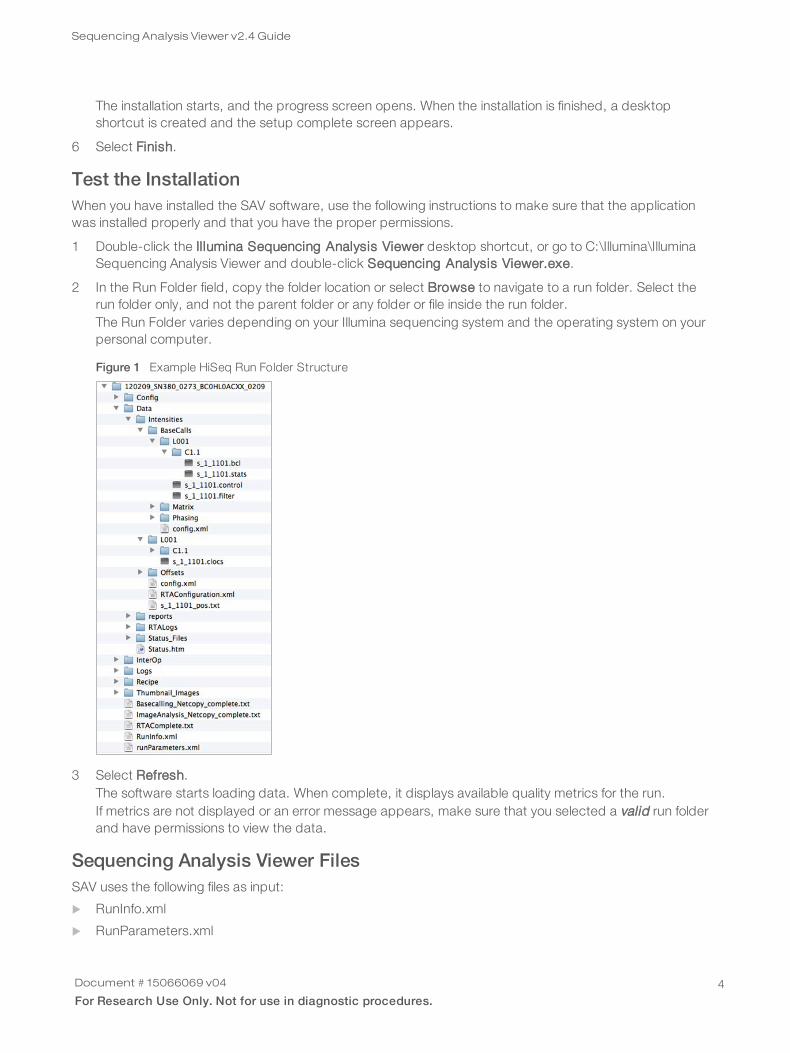
2 In the Run Folder field, copy the folder location or select Browse to navigate to a run folder. Select therun folder only, and not the parent folder or any folder or file inside the run folder.The Run Folder varies depending on your Illumina sequencing system and the operating system on yourpersonal computer.
Figure 1 Example HiSeq Run Folder Structure
3 Select Refresh.The software starts loading data. When complete, it displays available quality metrics for the run.If metrics are not displayed or an error message appears, make sure that you selected a valid run folderand have permissions to view the data.
Sequencing Analysis Viewer FilesSAV uses the following files as input:
u RunInfo.xml
u RunParameters.xml
Document # 15066069 v04
For Research Use Only. Not for use in diagnostic procedures.4
Sequencing Analysis Viewer v2.4 Guide
u The InterOp folder is in the directory: <run directory>\InterOp. The InterOp files provide the followinginformation:u Extraction metricsu Quality metricsu Error metricsu Tile metricsu Extended tile metricsu Corrected intensity metricsu Image metricsu Index metricsu Empirical phasing metricsFor more information, see InterOp Files on page 11.
u Thumbnails (optional)
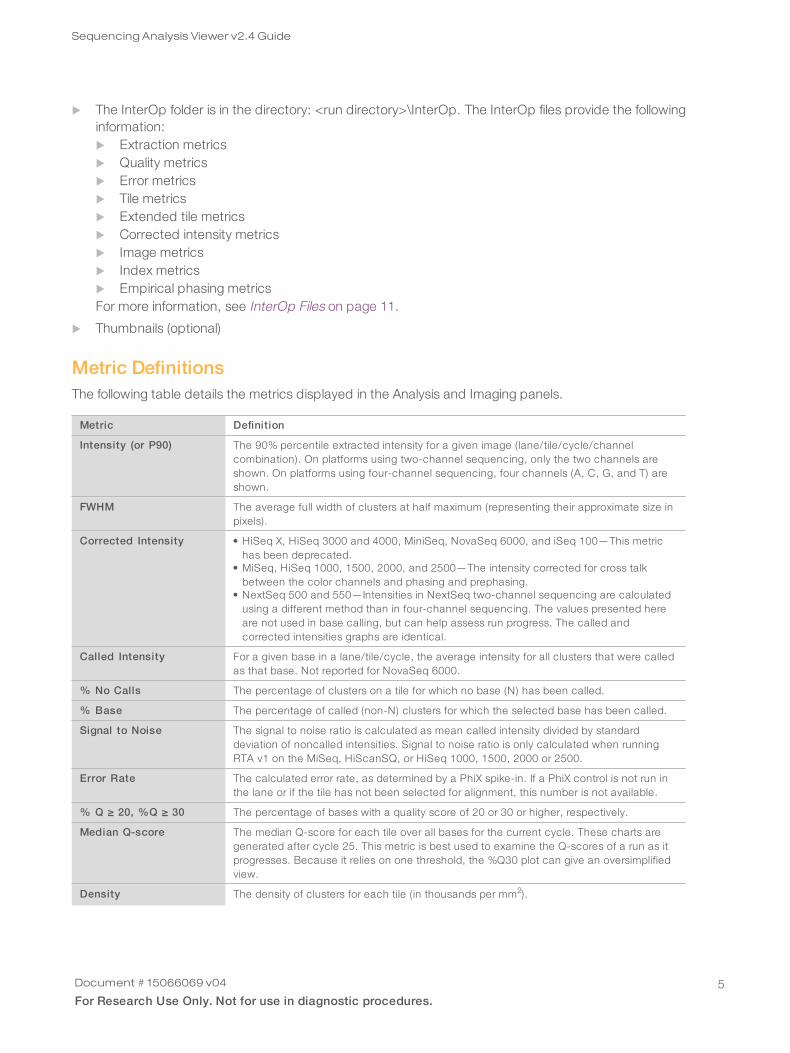
Metric DefinitionsThe following table details the metrics displayed in the Analysis and Imaging panels.
Metric Definition
Intensity (or P90) The 90% percentile extracted intensity for a given image (lane/tile/cycle/channelcombination). On platforms using two-channel sequencing, only the two channels areshown. On platforms using four-channel sequencing, four channels (A, C, G, and T) areshown.
FWHM The average full width of clusters at half maximum (representing their approximate size inpixels).
Corrected Intensity • HiSeq X, HiSeq 3000 and 4000, MiniSeq, NovaSeq 6000, and iSeq 100—This metrichas been deprecated.
• MiSeq, HiSeq 1000, 1500, 2000, and 2500—The intensity corrected for cross talkbetween the color channels and phasing and prephasing.
• NextSeq 500 and 550—Intensities in NextSeq two-channel sequencing are calculatedusing a different method than in four-channel sequencing. The values presented hereare not used in base calling, but can help assess run progress. The called andcorrected intensities graphs are identical.
Called Intensity For a given base in a lane/tile/cycle, the average intensity for all clusters that were calledas that base. Not reported for NovaSeq 6000.
% No Calls The percentage of clusters on a tile for which no base (N) has been called.
% Base The percentage of called (non-N) clusters for which the selected base has been called.
Signal to Noise The signal to noise ratio is calculated as mean called intensity divided by standarddeviation of noncalled intensities. Signal to noise ratio is only calculated when runningRTA v1 on the MiSeq, HiScanSQ, or HiSeq 1000, 1500, 2000 or 2500.
Error Rate The calculated error rate, as determined by a PhiX spike-in. If a PhiX control is not run inthe lane or if the tile has not been selected for alignment, this number is not available.
% Q ≥ 20, %Q ≥ 30 The percentage of bases with a quality score of 20 or 30 or higher, respectively.
Median Q-score The median Q-score for each tile over all bases for the current cycle. These charts aregenerated after cycle 25. This metric is best used to examine the Q-scores of a run as itprogresses. Because it relies on one threshold, the %Q30 plot can give an oversimplifiedview.
Density The density of clusters for each tile (in thousands per mm2).
Document # 15066069 v04
For Research Use Only. Not for use in diagnostic procedures.5
Sequencing Analysis Viewer v2.4 Guide
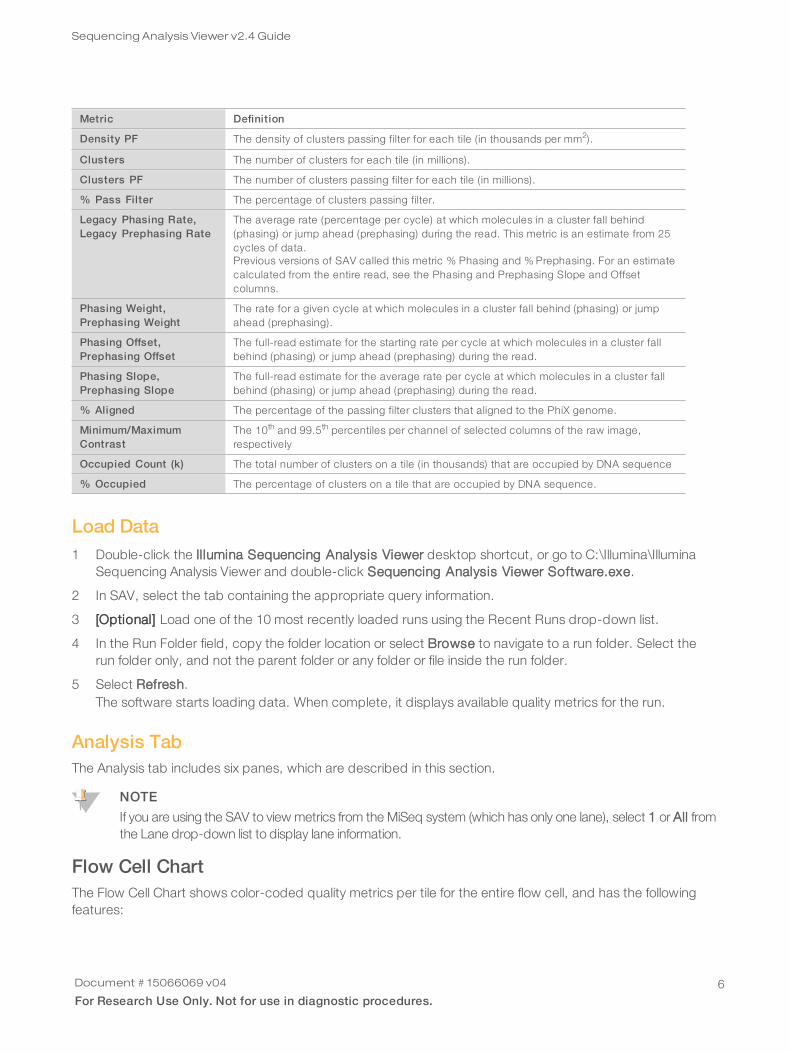
Metric Definition
Density PF The density of clusters passing filter for each tile (in thousands per mm2).
Clusters The number of clusters for each tile (in millions).
Clusters PF The number of clusters passing filter for each tile (in millions).
% Pass Filter The percentage of clusters passing filter.
Legacy Phasing Rate,Legacy Prephasing Rate
The average rate (percentage per cycle) at which molecules in a cluster fall behind(phasing) or jump ahead (prephasing) during the read. This metric is an estimate from 25cycles of data.Previous versions of SAV called this metric % Phasing and % Prephasing. For an estimatecalculated from the entire read, see the Phasing and Prephasing Slope and Offsetcolumns.
Phasing Weight,Prephasing Weight
The rate for a given cycle at which molecules in a cluster fall behind (phasing) or jumpahead (prephasing).
Phasing Offset,Prephasing Offset
The full-read estimate for the starting rate per cycle at which molecules in a cluster fallbehind (phasing) or jump ahead (prephasing) during the read.
Phasing Slope,Prephasing Slope
The full-read estimate for the average rate per cycle at which molecules in a cluster fallbehind (phasing) or jump ahead (prephasing) during the read.
% Aligned The percentage of the passing filter clusters that aligned to the PhiX genome.
Minimum/MaximumContrast
The 10th and 99.5th percentiles per channel of selected columns of the raw image,respectively
Occupied Count (k) The total number of clusters on a tile (in thousands) that are occupied by DNA sequence
% Occupied The percentage of clusters on a tile that are occupied by DNA sequence.
Load Data1 Double-click the Il lumina Sequencing Analysis Viewer desktop shortcut, or go to C:\Illumina\Illumina
Sequencing Analysis Viewer and double-click Sequencing Analysis Viewer Software.exe.
2 In SAV, select the tab containing the appropriate query information.
3 [Optional] Load one of the 10 most recently loaded runs using the Recent Runs drop-down list.
4 In the Run Folder field, copy the folder location or select Browse to navigate to a run folder. Select therun folder only, and not the parent folder or any folder or file inside the run folder.
5 Select Refresh.The software starts loading data. When complete, it displays available quality metrics for the run.
Analysis TabThe Analysis tab includes six panes, which are described in this section.
NOTE
If you are using the SAV to view metrics from the MiSeq system (which has only one lane), select 1 or All fromthe Lane drop-down list to display lane information.
Flow Cell ChartThe Flow Cell Chart shows color-coded quality metrics per tile for the entire flow cell, and has the followingfeatures:
Document # 15066069 v04
For Research Use Only. Not for use in diagnostic procedures.6
Sequencing Analysis Viewer v2.4 Guide
u You can select the displayed metric, surface (if your system scans multiple surfaces), cycle, and baseusing the drop-down lists.
u The color bar to the right of the chart indicates the values that each color represents.u The color bar is also a slider: right-click to adjust the scale values or use the mouse wheel to change
the contrast.u The chart is displayed with auto scaling by default or can be fixed by checking the Fix Scale
checkbox.u For some metrics (% ≥ Q20 and % ≥ Q30), you can monitor the metrics for a single cycle by default.
Alternatively, you can monitor the metrics for the entire run (up to that cycle) by selecting the Accumcheckbox.
u Tiles that have not been measured or are not monitored appear gray.
u Interactive tooltips provide the lane, tile, and value of each data point.
u Clicking a tile opens the Imaging tab with more detailed information for that tile. See Imaging Tab on page8.
u By right-clicking an image, you can copy it to the clipboard.
u The chevron displayed in the top-right corner switches the plot between pane view and full-screen view.
Data by Cycle PlotThe Data by Cycle pane shows plots that allow you to follow the progress of quality metrics during a run.These plots have the following features:
u You can select the displayed metric, lane, surface, and base using the drop-down lists.
u The plots are displayed with auto-scaling by default, or they can be fixed by selecting the Fix Scalecheckbox.u For some metrics (% ≥ Q20 and % ≥ Q30), you can monitor the metrics for a single cycle by default.u Alternatively, you can monitor the metrics for the entire run (up to that cycle) by selecting the Accum
checkbox.
u The chevron displayed in the top-right corner switches the plot between pane view and full-screen view.
u Pan the graph by dragging. Zoom in using the mouse wheel, or zoom in on a specific axis by hoveringover the axis and spinning the mouse wheel.
u By right-clicking an image, you can copy it to the clipboard.
Data by Lane PlotThe Data by Lane pane shows plots for viewing quality metrics per lane. These plots have the followingfeatures:
u You can select the displayed metric, surface, and read (when applicable) using the drop-down lists.
u The chevron displayed in the top-right corner switches the plot between pane view and full-screen view.
u Zoom in and out, and pan the plots.
u By right-clicking an image, you can copy it to the clipboard.
u For some metrics (Density and Clusters), each lane has two box plots.u Blue boxes—Represent the raw cluster metric.u Green boxes—Represent the equivalent PF cluster metric.
The plots share various characteristics:
u The red line indicates the median tile value.
Document # 15066069 v04
For Research Use Only. Not for use in diagnostic procedures.7
Sequencing Analysis Viewer v2.4 Guide
u The box outlines the interquartile range (the middle 50% of the data) for the tiles analyzed for the datapoint.
u The error bars delineate the minimum and maximum without outliers.
u The outliers are values that exceed 1.5 times the interquartile range below the 25th percentile, or exceed1.5 times the interquartile range above the 75th percentile. Outliers are indicated as dots.
u The numbers above the X-axis indicate the number of analyzed tiles used for the data point.
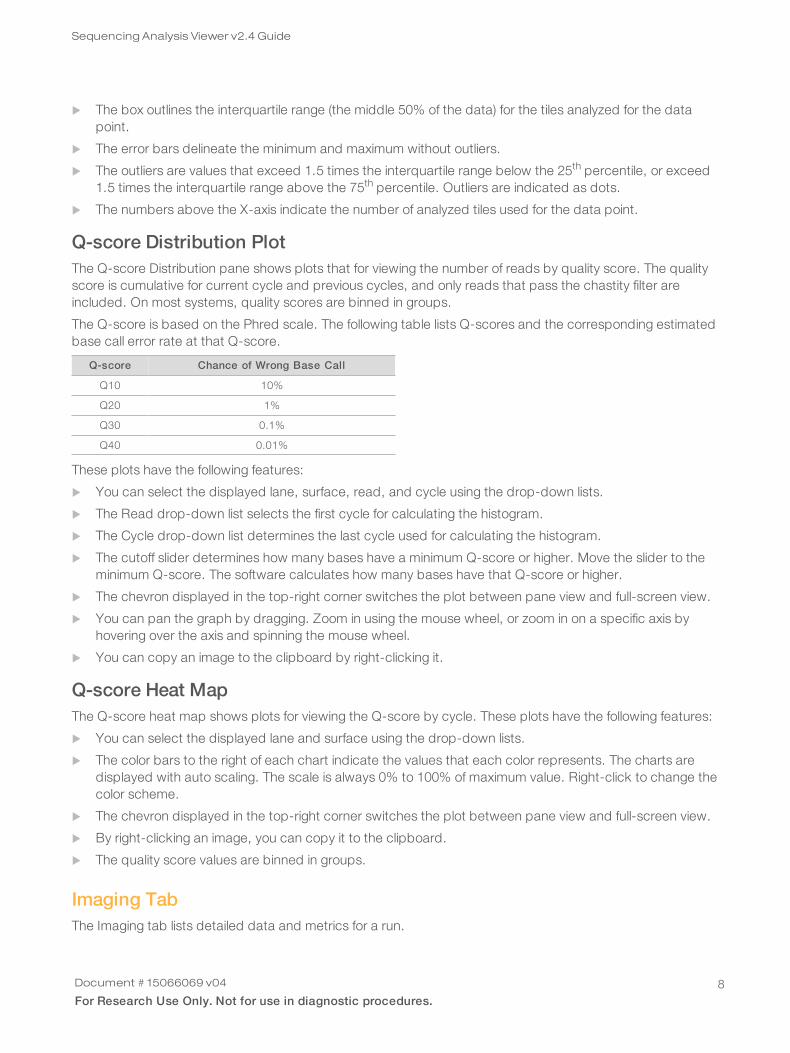
Q-score Distribution PlotThe Q-score Distribution pane shows plots that for viewing the number of reads by quality score. The qualityscore is cumulative for current cycle and previous cycles, and only reads that pass the chastity filter areincluded. On most systems, quality scores are binned in groups.
The Q-score is based on the Phred scale. The following table lists Q-scores and the corresponding estimatedbase call error rate at that Q-score.
Q-score Chance of Wrong Base Call
Q10 10%
Q20 1%
Q30 0.1%
Q40 0.01%
These plots have the following features:
u You can select the displayed lane, surface, read, and cycle using the drop-down lists.
u The Read drop-down list selects the first cycle for calculating the histogram.
u The Cycle drop-down list determines the last cycle used for calculating the histogram.
u The cutoff slider determines how many bases have a minimum Q-score or higher. Move the slider to theminimum Q-score. The software calculates how many bases have that Q-score or higher.
u The chevron displayed in the top-right corner switches the plot between pane view and full-screen view.
u You can pan the graph by dragging. Zoom in using the mouse wheel, or zoom in on a specific axis byhovering over the axis and spinning the mouse wheel.
u You can copy an image to the clipboard by right-clicking it.
Q-score Heat MapThe Q-score heat map shows plots for viewing the Q-score by cycle. These plots have the following features:
u You can select the displayed lane and surface using the drop-down lists.
u The color bars to the right of each chart indicate the values that each color represents. The charts aredisplayed with auto scaling. The scale is always 0% to 100% of maximum value. Right-click to change thecolor scheme.
u The chevron displayed in the top-right corner switches the plot between pane view and full-screen view.
u By right-clicking an image, you can copy it to the clipboard.
u The quality score values are binned in groups.
Imaging TabThe Imaging tab lists detailed data and metrics for a run.
Document # 15066069 v04
For Research Use Only. Not for use in diagnostic procedures.8
Sequencing Analysis Viewer v2.4 Guide
u You can select the displayed cycle, lane, surface, swath, read, tile number, and section using the drop-down lists.
u Use the checkboxes to select the displayed bases.
u The imaging tab includes the available thumbnails for the selected tile, highlighted in blue.
u You can also use a mouse wheel or the keyboard arrow keys to scroll through images.
u Right-clicking the top of a column provides more information.
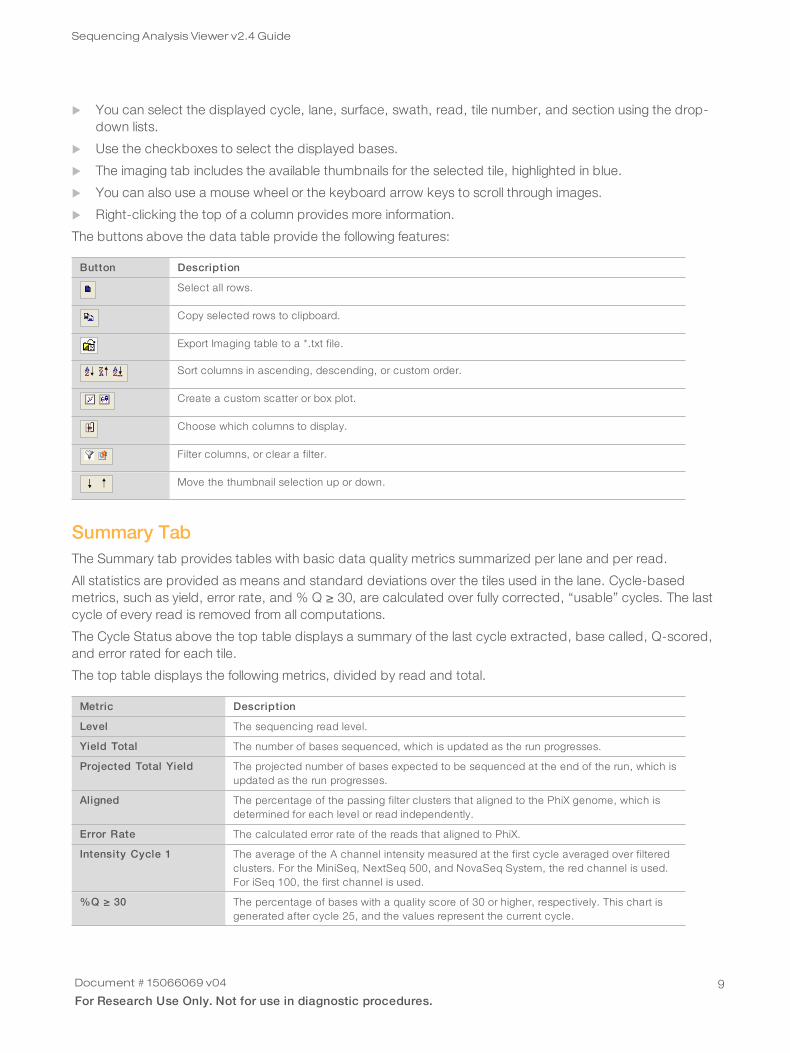
The buttons above the data table provide the following features:
Button Description
Select all rows.
Copy selected rows to clipboard.
Export Imaging table to a *.txt file.
Sort columns in ascending, descending, or custom order.
Create a custom scatter or box plot.
Choose which columns to display.
Filter columns, or clear a filter.
Move the thumbnail selection up or down.
Summary TabThe Summary tab provides tables with basic data quality metrics summarized per lane and per read.
All statistics are provided as means and standard deviations over the tiles used in the lane. Cycle-basedmetrics, such as yield, error rate, and % Q ≥ 30, are calculated over fully corrected, “usable” cycles. The lastcycle of every read is removed from all computations.
The Cycle Status above the top table displays a summary of the last cycle extracted, base called, Q-scored,and error rated for each tile.
The top table displays the following metrics, divided by read and total.
Metric Description
Level The sequencing read level.
Yield Total The number of bases sequenced, which is updated as the run progresses.
Projected Total Yield The projected number of bases expected to be sequenced at the end of the run, which isupdated as the run progresses.
Aligned The percentage of the passing filter clusters that aligned to the PhiX genome, which isdetermined for each level or read independently.
Error Rate The calculated error rate of the reads that aligned to PhiX.
Intensity Cycle 1 The average of the A channel intensity measured at the first cycle averaged over filteredclusters. For the MiniSeq, NextSeq 500, and NovaSeq System, the red channel is used.For iSeq 100, the first channel is used.
%Q ≥ 30 The percentage of bases with a quality score of 30 or higher, respectively. This chart isgenerated after cycle 25, and the values represent the current cycle.
Document # 15066069 v04
For Research Use Only. Not for use in diagnostic procedures.9
Sequencing Analysis Viewer v2.4 Guide
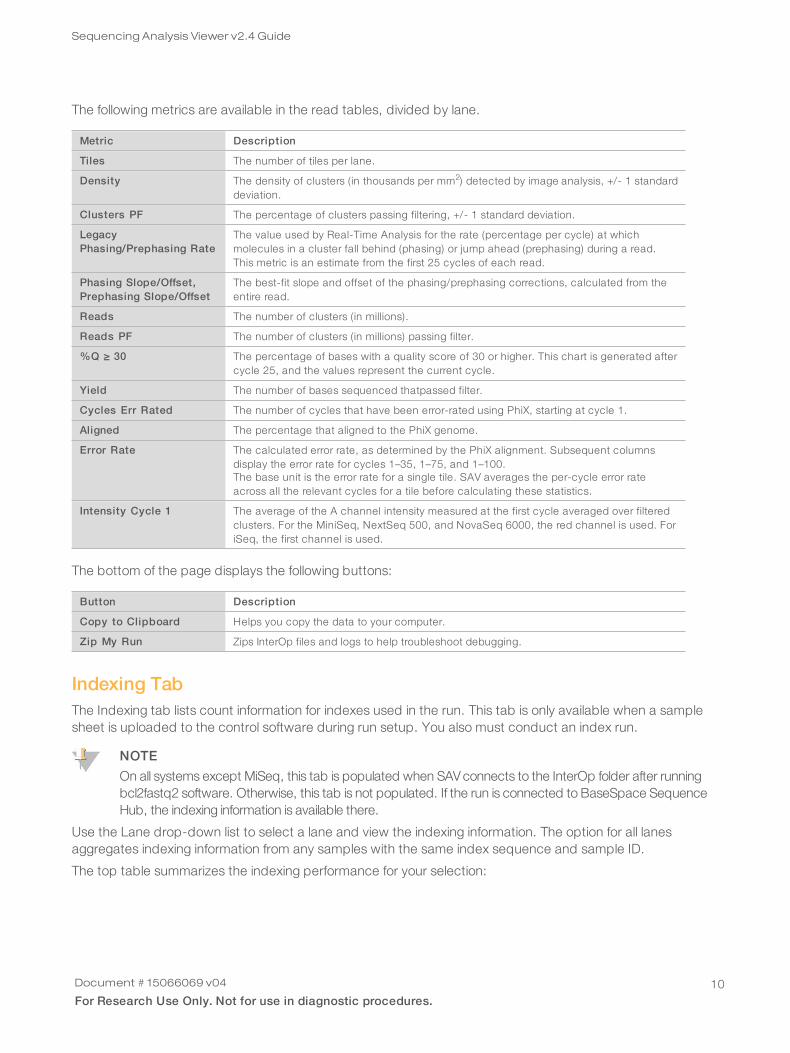
The following metrics are available in the read tables, divided by lane.
Metric Description
Tiles The number of tiles per lane.
Density The density of clusters (in thousands per mm2) detected by image analysis, +/- 1 standarddeviation.
Clusters PF The percentage of clusters passing filtering, +/- 1 standard deviation.
LegacyPhasing/Prephasing Rate
The value used by Real-Time Analysis for the rate (percentage per cycle) at whichmolecules in a cluster fall behind (phasing) or jump ahead (prephasing) during a read.This metric is an estimate from the first 25 cycles of each read.
Phasing Slope/Offset,Prephasing Slope/Offset
The best-fit slope and offset of the phasing/prephasing corrections, calculated from theentire read.
Reads The number of clusters (in millions).
Reads PF The number of clusters (in millions) passing filter.
%Q ≥ 30 The percentage of bases with a quality score of 30 or higher. This chart is generated aftercycle 25, and the values represent the current cycle.
Yield The number of bases sequenced thatpassed filter.
Cycles Err Rated The number of cycles that have been error-rated using PhiX, starting at cycle 1.
Aligned The percentage that aligned to the PhiX genome.
Error Rate The calculated error rate, as determined by the PhiX alignment. Subsequent columnsdisplay the error rate for cycles 1–35, 1–75, and 1–100.The base unit is the error rate for a single tile. SAV averages the per-cycle error rateacross all the relevant cycles for a tile before calculating these statistics.
Intensity Cycle 1 The average of the A channel intensity measured at the first cycle averaged over filteredclusters. For the MiniSeq, NextSeq 500, and NovaSeq 6000, the red channel is used. ForiSeq, the first channel is used.
The bottom of the page displays the following buttons:
Button Description
Copy to Clipboard Helps you copy the data to your computer.
Zip My Run Zips InterOp files and logs to help troubleshoot debugging.
Indexing TabThe Indexing tab lists count information for indexes used in the run. This tab is only available when a samplesheet is uploaded to the control software during run setup. You also must conduct an index run.
NOTE
On all systems except MiSeq, this tab is populated when SAV connects to the InterOp folder after runningbcl2fastq2 software. Otherwise, this tab is not populated. If the run is connected to BaseSpace SequenceHub, the indexing information is available there.
Use the Lane drop-down list to select a lane and view the indexing information. The option for all lanesaggregates indexing information from any samples with the same index sequence and sample ID.
The top table summarizes the indexing performance for your selection:
Document # 15066069 v04
For Research Use Only. Not for use in diagnostic procedures.10
Sequencing Analysis Viewer v2.4 Guide
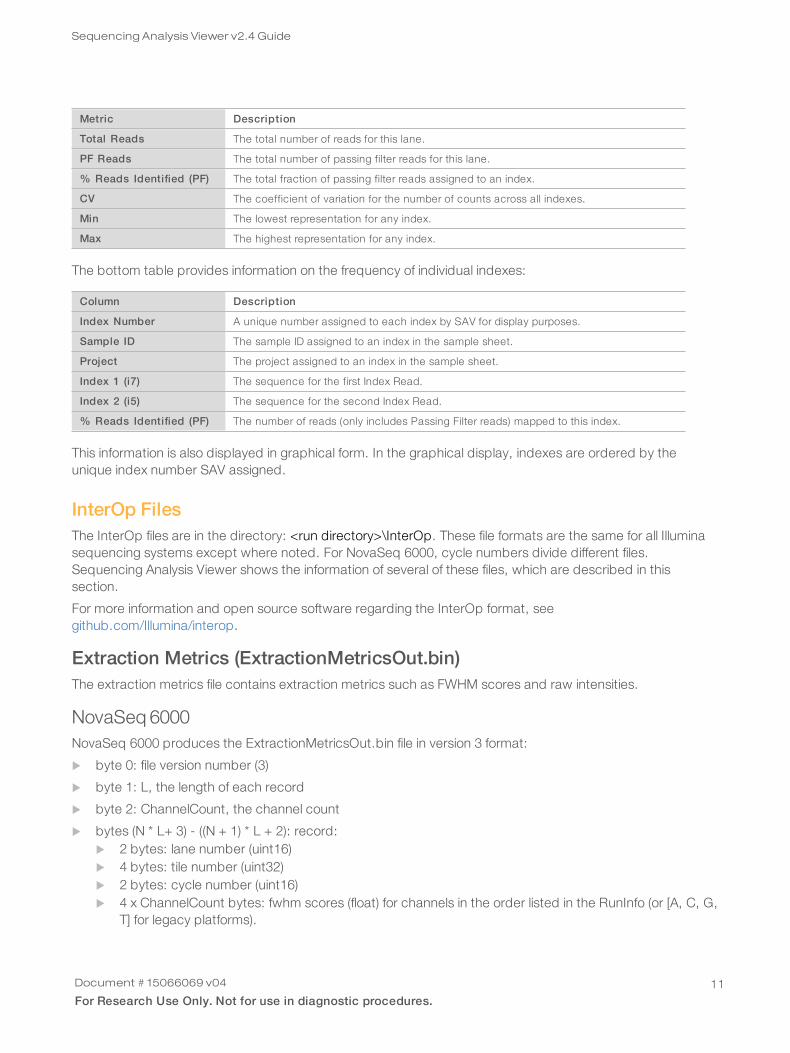
Metric Description
Total Reads The total number of reads for this lane.
PF Reads The total number of passing filter reads for this lane.
% Reads Identified (PF) The total fraction of passing filter reads assigned to an index.
CV The coefficient of variation for the number of counts across all indexes.
Min The lowest representation for any index.
Max The highest representation for any index.
The bottom table provides information on the frequency of individual indexes:
Column Description
Index Number A unique number assigned to each index by SAV for display purposes.
Sample ID The sample ID assigned to an index in the sample sheet.
Project The project assigned to an index in the sample sheet.
Index 1 (i7) The sequence for the first Index Read.
Index 2 (i5) The sequence for the second Index Read.
% Reads Identified (PF) The number of reads (only includes Passing Filter reads) mapped to this index.
This information is also displayed in graphical form. In the graphical display, indexes are ordered by theunique index number SAV assigned.
InterOp FilesThe InterOp files are in the directory: <run directory>\InterOp. These file formats are the same for all Illuminasequencing systems except where noted. For NovaSeq 6000, cycle numbers divide different files.Sequencing Analysis Viewer shows the information of several of these files, which are described in thissection.
For more information and open source software regarding the InterOp format, seegithub.com/Illumina/interop.
Extraction Metrics (ExtractionMetricsOut.bin)The extraction metrics file contains extraction metrics such as FWHM scores and raw intensities.
NovaSeq 6000NovaSeq 6000 produces the ExtractionMetricsOut.bin file in version 3 format:
u byte 0: file version number (3)
u byte 1: L, the length of each record
u byte 2: ChannelCount, the channel count
u bytes (N * L+ 3) - ((N + 1) * L + 2): record:u 2 bytes: lane number (uint16)u 4 bytes: tile number (uint32)u 2 bytes: cycle number (uint16)u 4 x ChannelCount bytes: fwhm scores (float) for channels in the order listed in the RunInfo (or [A, C, G,
T] for legacy platforms).
Document # 15066069 v04
For Research Use Only. Not for use in diagnostic procedures.11
Sequencing Analysis Viewer v2.4 Guide
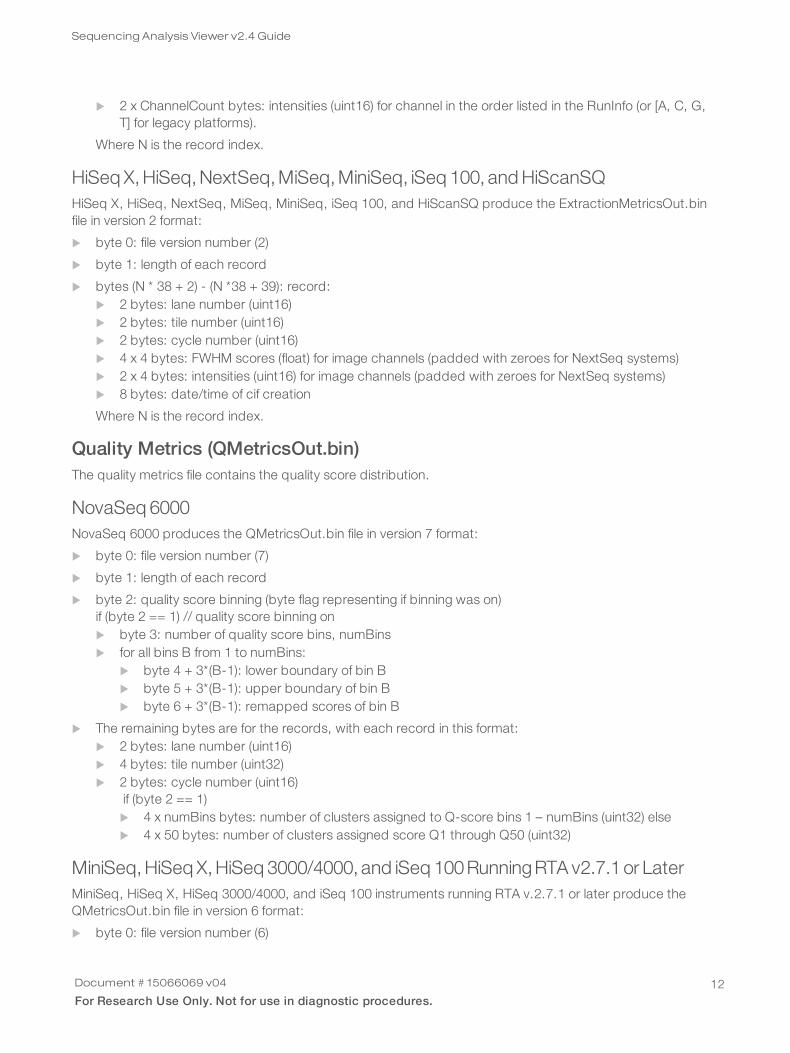
u 2 x ChannelCount bytes: intensities (uint16) for channel in the order listed in the RunInfo (or [A, C, G,T] for legacy platforms).
Where N is the record index.
HiSeq X,HiSeq,NextSeq,MiSeq,MiniSeq, iSeq 100, andHiScanSQHiSeq X, HiSeq, NextSeq, MiSeq, MiniSeq, iSeq 100, and HiScanSQ produce the ExtractionMetricsOut.binfile in version 2 format:
u byte 0: file version number (2)
u byte 1: length of each record
u bytes (N * 38 + 2) - (N *38 + 39): record:u 2 bytes: lane number (uint16)u 2 bytes: tile number (uint16)u 2 bytes: cycle number (uint16)u 4 x 4 bytes: FWHM scores (float) for image channels (padded with zeroes for NextSeq systems)u 2 x 4 bytes: intensities (uint16) for image channels (padded with zeroes for NextSeq systems)u 8 bytes: date/time of cif creation
Where N is the record index.
Quality Metrics (QMetricsOut.bin)The quality metrics file contains the quality score distribution.
NovaSeq 6000NovaSeq 6000 produces the QMetricsOut.bin file in version 7 format:
u byte 0: file version number (7)
u byte 1: length of each record
u byte 2: quality score binning (byte flag representing if binning was on)if (byte 2 == 1) // quality score binning onu byte 3: number of quality score bins, numBinsu for all bins B from 1 to numBins:
u byte 4 + 3*(B-1): lower boundary of bin Bu byte 5 + 3*(B-1): upper boundary of bin Bu byte 6 + 3*(B-1): remapped scores of bin B
u The remaining bytes are for the records, with each record in this format:u 2 bytes: lane number (uint16)u 4 bytes: tile number (uint32)u 2 bytes: cycle number (uint16)
if (byte 2 == 1)u 4 x numBins bytes: number of clusters assigned to Q-score bins 1 – numBins (uint32) elseu 4 x 50 bytes: number of clusters assigned score Q1 through Q50 (uint32)
MiniSeq,HiSeq X,HiSeq 3000/4000, and iSeq 100RunningRTA v2.7.1or LaterMiniSeq, HiSeq X, HiSeq 3000/4000, and iSeq 100 instruments running RTA v.2.7.1 or later produce theQMetricsOut.bin file in version 6 format:
u byte 0: file version number (6)
Document # 15066069 v04
For Research Use Only. Not for use in diagnostic procedures.12
Sequencing Analysis Viewer v2.4 Guide
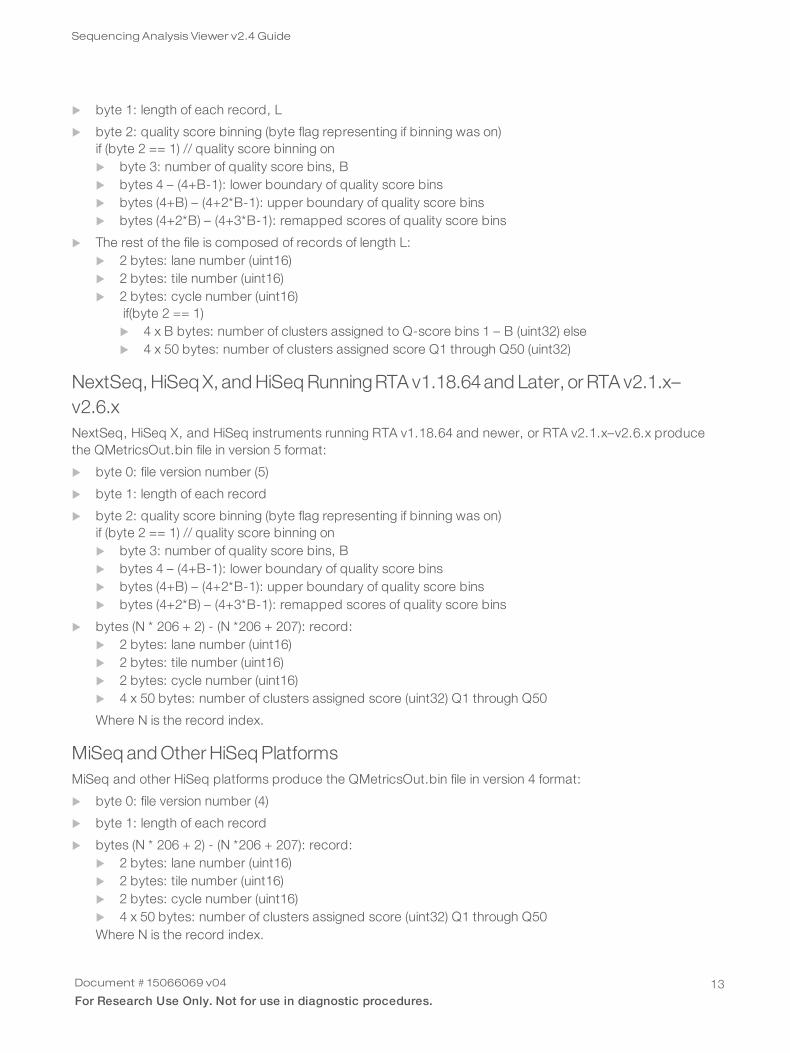
u byte 1: length of each record, L
u byte 2: quality score binning (byte flag representing if binning was on)if (byte 2 == 1) // quality score binning onu byte 3: number of quality score bins, Bu bytes 4 – (4+B-1): lower boundary of quality score binsu bytes (4+B) – (4+2*B-1): upper boundary of quality score binsu bytes (4+2*B) – (4+3*B-1): remapped scores of quality score bins
u The rest of the file is composed of records of length L:u 2 bytes: lane number (uint16)u 2 bytes: tile number (uint16)u 2 bytes: cycle number (uint16)
if(byte 2 == 1)u 4 x B bytes: number of clusters assigned to Q-score bins 1 – B (uint32) elseu 4 x 50 bytes: number of clusters assigned score Q1 through Q50 (uint32)
NextSeq,HiSeq X, andHiSeqRunningRTA v1.18.64and Later, or RTA v2.1.x–v2.6.xNextSeq, HiSeq X, and HiSeq instruments running RTA v1.18.64 and newer, or RTA v2.1.x–v2.6.x producethe QMetricsOut.bin file in version 5 format:
u byte 0: file version number (5)
u byte 1: length of each record
u byte 2: quality score binning (byte flag representing if binning was on)if (byte 2 == 1) // quality score binning onu byte 3: number of quality score bins, Bu bytes 4 – (4+B-1): lower boundary of quality score binsu bytes (4+B) – (4+2*B-1): upper boundary of quality score binsu bytes (4+2*B) – (4+3*B-1): remapped scores of quality score bins
u bytes (N * 206 + 2) - (N *206 + 207): record:u 2 bytes: lane number (uint16)u 2 bytes: tile number (uint16)u 2 bytes: cycle number (uint16)u 4 x 50 bytes: number of clusters assigned score (uint32) Q1 through Q50
Where N is the record index.
MiSeq andOtherHiSeqPlatformsMiSeq and other HiSeq platforms produce the QMetricsOut.bin file in version 4 format:
u byte 0: file version number (4)
u byte 1: length of each record
u bytes (N * 206 + 2) - (N *206 + 207): record:u 2 bytes: lane number (uint16)u 2 bytes: tile number (uint16)u 2 bytes: cycle number (uint16)u 4 x 50 bytes: number of clusters assigned score (uint32) Q1 through Q50Where N is the record index.
Document # 15066069 v04
For Research Use Only. Not for use in diagnostic procedures.13
Sequencing Analysis Viewer v2.4 Guide
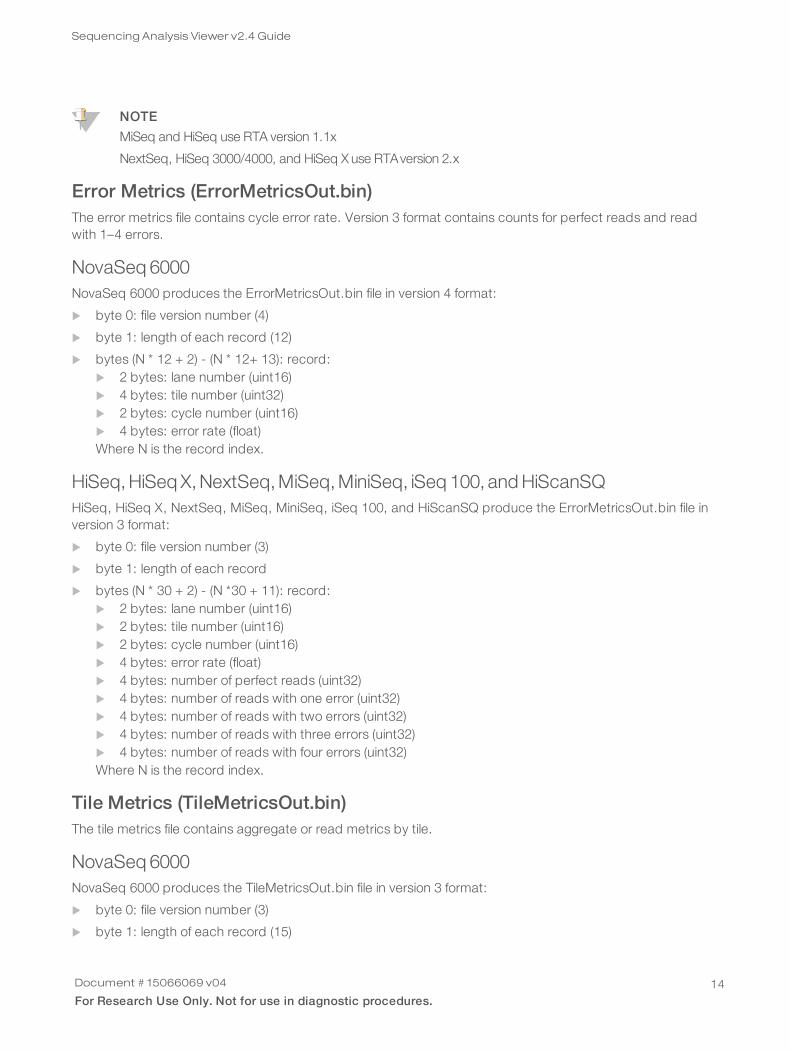
NOTE
MiSeq and HiSeq use RTA version 1.1x
NextSeq, HiSeq 3000/4000, and HiSeq X use RTA version 2.x
Error Metrics (ErrorMetricsOut.bin)The error metrics file contains cycle error rate. Version 3 format contains counts for perfect reads and readwith 1–4 errors.
NovaSeq 6000NovaSeq 6000 produces the ErrorMetricsOut.bin file in version 4 format:
u byte 0: file version number (4)
u byte 1: length of each record (12)
u bytes (N * 12 + 2) - (N * 12+ 13): record:u 2 bytes: lane number (uint16)u 4 bytes: tile number (uint32)u 2 bytes: cycle number (uint16)u 4 bytes: error rate (float)Where N is the record index.
HiSeq,HiSeq X,NextSeq,MiSeq,MiniSeq, iSeq 100, andHiScanSQHiSeq, HiSeq X, NextSeq, MiSeq, MiniSeq, iSeq 100, and HiScanSQ produce the ErrorMetricsOut.bin file inversion 3 format:
u byte 0: file version number (3)
u byte 1: length of each record
u bytes (N * 30 + 2) - (N *30 + 11): record:u 2 bytes: lane number (uint16)u 2 bytes: tile number (uint16)u 2 bytes: cycle number (uint16)u 4 bytes: error rate (float)u 4 bytes: number of perfect reads (uint32)u 4 bytes: number of reads with one error (uint32)u 4 bytes: number of reads with two errors (uint32)u 4 bytes: number of reads with three errors (uint32)u 4 bytes: number of reads with four errors (uint32)Where N is the record index.
Tile Metrics (TileMetricsOut.bin)The tile metrics file contains aggregate or read metrics by tile.
NovaSeq 6000NovaSeq 6000 produces the TileMetricsOut.bin file in version 3 format:
u byte 0: file version number (3)
u byte 1: length of each record (15)
Document # 15066069 v04
For Research Use Only. Not for use in diagnostic procedures.14
Sequencing Analysis Viewer v2.4 Guide
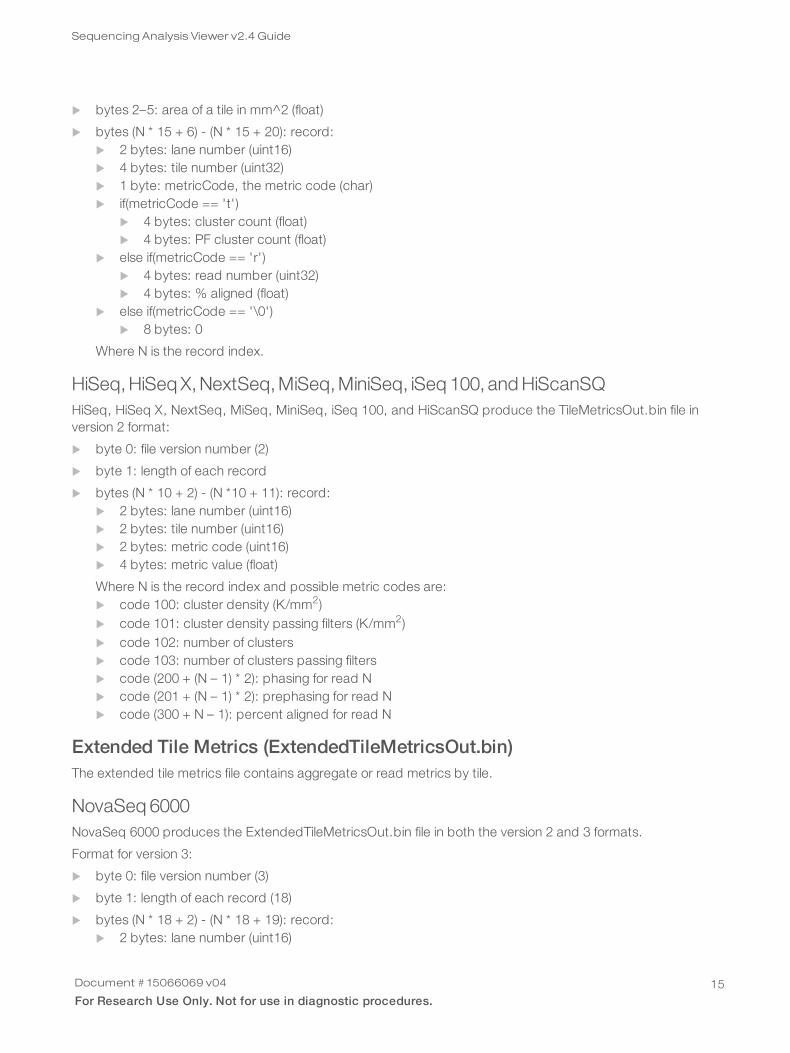
u bytes 2–5: area of a tile in mm^2 (float)
u bytes (N * 15 + 6) - (N * 15 + 20): record:u 2 bytes: lane number (uint16)u 4 bytes: tile number (uint32)u 1 byte: metricCode, the metric code (char)u if(metricCode == 't')
u 4 bytes: cluster count (float)u 4 bytes: PF cluster count (float)
u else if(metricCode == 'r')u 4 bytes: read number (uint32)u 4 bytes: % aligned (float)
u else if(metricCode == '\0')u 8 bytes: 0
Where N is the record index.
HiSeq,HiSeq X,NextSeq,MiSeq,MiniSeq, iSeq 100, andHiScanSQHiSeq, HiSeq X, NextSeq, MiSeq, MiniSeq, iSeq 100, and HiScanSQ produce the TileMetricsOut.bin file inversion 2 format:
u byte 0: file version number (2)
u byte 1: length of each record
u bytes (N * 10 + 2) - (N *10 + 11): record:u 2 bytes: lane number (uint16)u 2 bytes: tile number (uint16)u 2 bytes: metric code (uint16)u 4 bytes: metric value (float)
Where N is the record index and possible metric codes are:u code 100: cluster density (K/mm2)u code 101: cluster density passing filters (K/mm2)u code 102: number of clustersu code 103: number of clusters passing filtersu code (200 + (N – 1) * 2): phasing for read Nu code (201 + (N – 1) * 2): prephasing for read Nu code (300 + N – 1): percent aligned for read N
Extended Tile Metrics (ExtendedTileMetricsOut.bin)The extended tile metrics file contains aggregate or read metrics by tile.
NovaSeq 6000NovaSeq 6000 produces the ExtendedTileMetricsOut.bin file in both the version 2 and 3 formats.
Format for version 3:
u byte 0: file version number (3)
u byte 1: length of each record (18)
u bytes (N * 18 + 2) - (N * 18 + 19): record:u 2 bytes: lane number (uint16)
Document # 15066069 v04
For Research Use Only. Not for use in diagnostic procedures.15
Sequencing Analysis Viewer v2.4 Guide
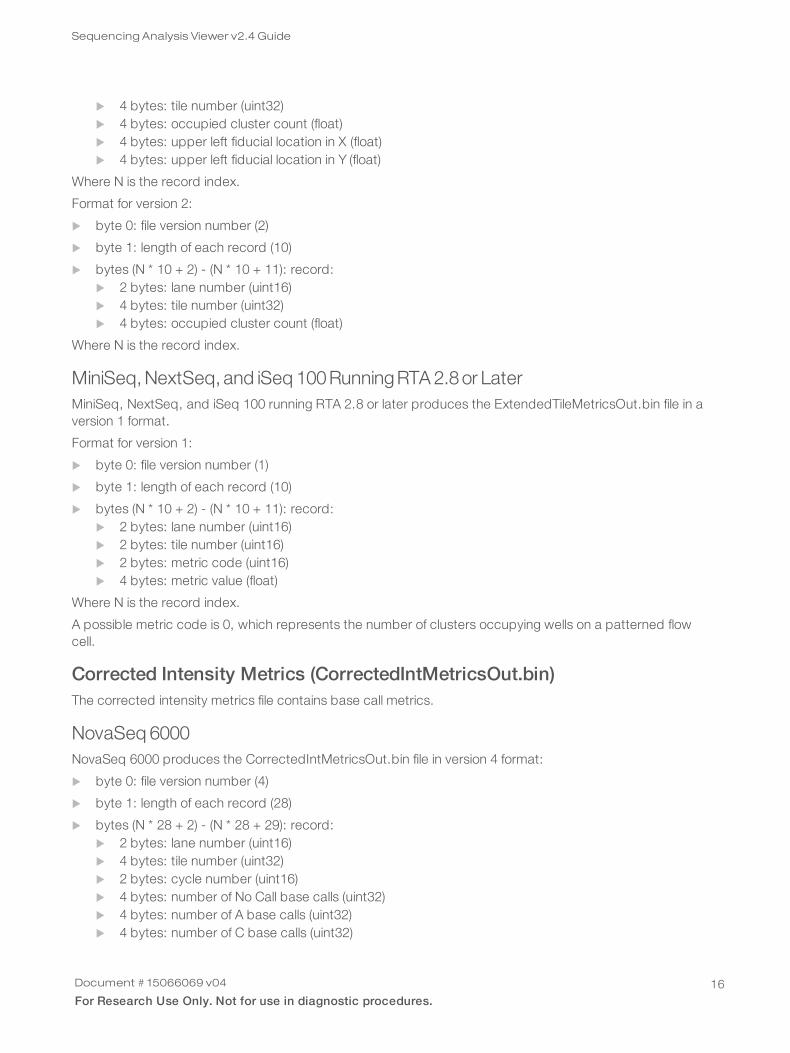
u 4 bytes: tile number (uint32)u 4 bytes: occupied cluster count (float)u 4 bytes: upper left fiducial location in X (float)u 4 bytes: upper left fiducial location in Y (float)
Where N is the record index.
Format for version 2:
u byte 0: file version number (2)
u byte 1: length of each record (10)
u bytes (N * 10 + 2) - (N * 10 + 11): record:u 2 bytes: lane number (uint16)u 4 bytes: tile number (uint32)u 4 bytes: occupied cluster count (float)
Where N is the record index.
MiniSeq,NextSeq, and iSeq 100RunningRTA2.8or LaterMiniSeq, NextSeq, and iSeq 100 running RTA 2.8 or later produces the ExtendedTileMetricsOut.bin file in aversion 1 format.
Format for version 1:
u byte 0: file version number (1)
u byte 1: length of each record (10)
u bytes (N * 10 + 2) - (N * 10 + 11): record:u 2 bytes: lane number (uint16)u 2 bytes: tile number (uint16)u 2 bytes: metric code (uint16)u 4 bytes: metric value (float)
Where N is the record index.
A possible metric code is 0, which represents the number of clusters occupying wells on a patterned flowcell.
Corrected Intensity Metrics (CorrectedIntMetricsOut.bin)The corrected intensity metrics file contains base call metrics.
NovaSeq 6000NovaSeq 6000 produces the CorrectedIntMetricsOut.bin file in version 4 format:
u byte 0: file version number (4)
u byte 1: length of each record (28)
u bytes (N * 28 + 2) - (N * 28 + 29): record:u 2 bytes: lane number (uint16)u 4 bytes: tile number (uint32)u 2 bytes: cycle number (uint16)u 4 bytes: number of No Call base calls (uint32)u 4 bytes: number of A base calls (uint32)u 4 bytes: number of C base calls (uint32)
Document # 15066069 v04
For Research Use Only. Not for use in diagnostic procedures.16
Sequencing Analysis Viewer v2.4 Guide
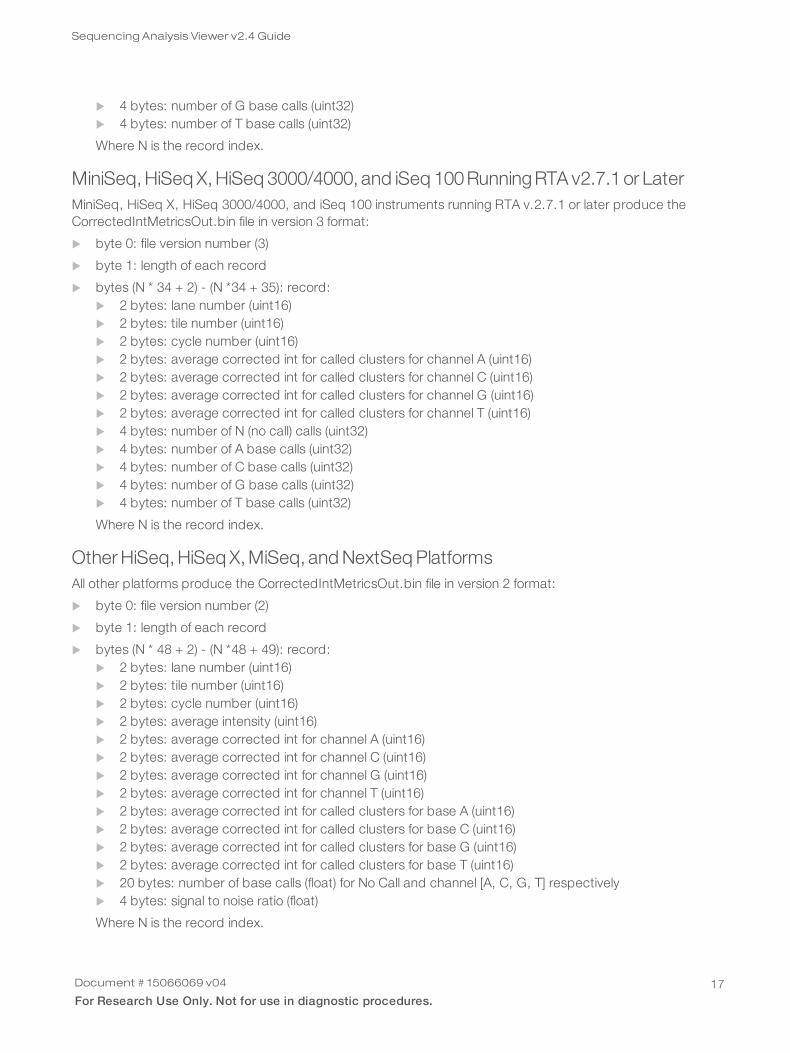
u 4 bytes: number of G base calls (uint32)u 4 bytes: number of T base calls (uint32)
Where N is the record index.
MiniSeq,HiSeq X,HiSeq 3000/4000, and iSeq 100RunningRTA v2.7.1or LaterMiniSeq, HiSeq X, HiSeq 3000/4000, and iSeq 100 instruments running RTA v.2.7.1 or later produce theCorrectedIntMetricsOut.bin file in version 3 format:
u byte 0: file version number (3)
u byte 1: length of each record
u bytes (N * 34 + 2) - (N *34 + 35): record:u 2 bytes: lane number (uint16)u 2 bytes: tile number (uint16)u 2 bytes: cycle number (uint16)u 2 bytes: average corrected int for called clusters for channel A (uint16)u 2 bytes: average corrected int for called clusters for channel C (uint16)u 2 bytes: average corrected int for called clusters for channel G (uint16)u 2 bytes: average corrected int for called clusters for channel T (uint16)u 4 bytes: number of N (no call) calls (uint32)u 4 bytes: number of A base calls (uint32)u 4 bytes: number of C base calls (uint32)u 4 bytes: number of G base calls (uint32)u 4 bytes: number of T base calls (uint32)
Where N is the record index.
OtherHiSeq,HiSeq X,MiSeq, andNextSeqPlatformsAll other platforms produce the CorrectedIntMetricsOut.bin file in version 2 format:
u byte 0: file version number (2)
u byte 1: length of each record
u bytes (N * 48 + 2) - (N *48 + 49): record:u 2 bytes: lane number (uint16)u 2 bytes: tile number (uint16)u 2 bytes: cycle number (uint16)u 2 bytes: average intensity (uint16)u 2 bytes: average corrected int for channel A (uint16)u 2 bytes: average corrected int for channel C (uint16)u 2 bytes: average corrected int for channel G (uint16)u 2 bytes: average corrected int for channel T (uint16)u 2 bytes: average corrected int for called clusters for base A (uint16)u 2 bytes: average corrected int for called clusters for base C (uint16)u 2 bytes: average corrected int for called clusters for base G (uint16)u 2 bytes: average corrected int for called clusters for base T (uint16)u 20 bytes: number of base calls (float) for No Call and channel [A, C, G, T] respectivelyu 4 bytes: signal to noise ratio (float)
Where N is the record index.
Document # 15066069 v04
For Research Use Only. Not for use in diagnostic procedures.17
Sequencing Analysis Viewer v2.4 Guide
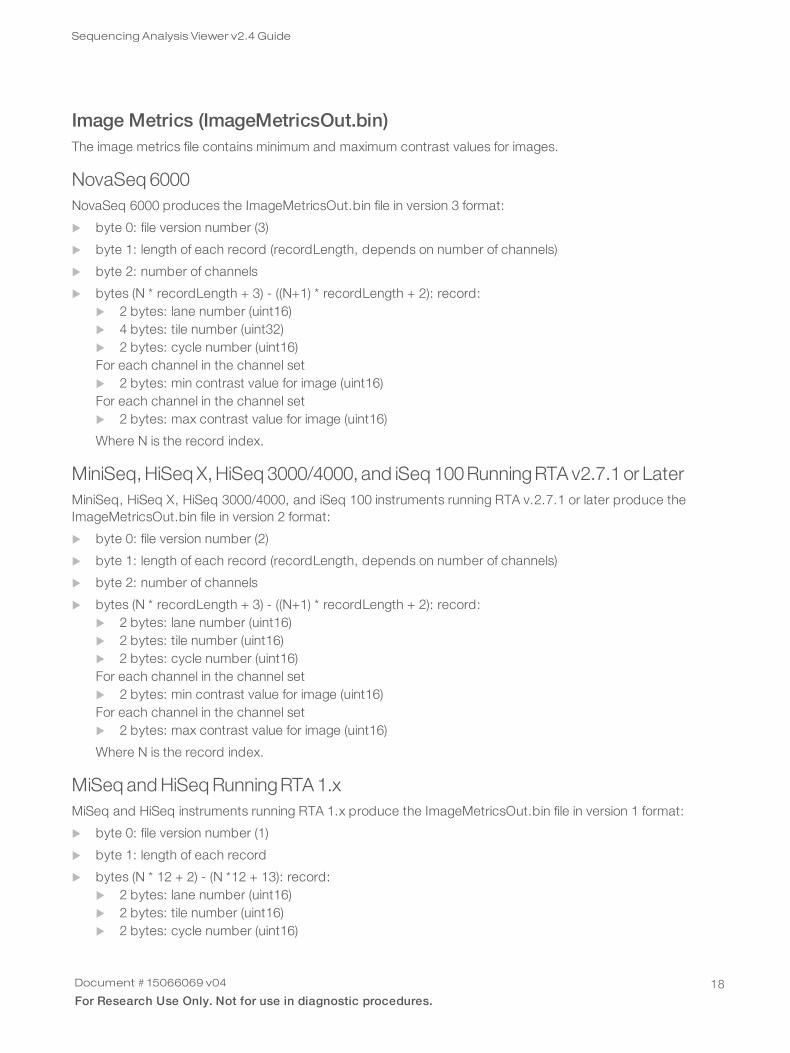
Image Metrics (ImageMetricsOut.bin)The image metrics file contains minimum and maximum contrast values for images.
NovaSeq 6000NovaSeq 6000 produces the ImageMetricsOut.bin file in version 3 format:
u byte 0: file version number (3)
u byte 1: length of each record (recordLength, depends on number of channels)
u byte 2: number of channels
u bytes (N * recordLength + 3) - ((N+1) * recordLength + 2): record:u 2 bytes: lane number (uint16)u 4 bytes: tile number (uint32)u 2 bytes: cycle number (uint16)For each channel in the channel setu 2 bytes: min contrast value for image (uint16)For each channel in the channel setu 2 bytes: max contrast value for image (uint16)
Where N is the record index.
MiniSeq,HiSeq X,HiSeq 3000/4000, and iSeq 100RunningRTA v2.7.1or LaterMiniSeq, HiSeq X, HiSeq 3000/4000, and iSeq 100 instruments running RTA v.2.7.1 or later produce theImageMetricsOut.bin file in version 2 format:
u byte 0: file version number (2)
u byte 1: length of each record (recordLength, depends on number of channels)
u byte 2: number of channels
u bytes (N * recordLength + 3) - ((N+1) * recordLength + 2): record:u 2 bytes: lane number (uint16)u 2 bytes: tile number (uint16)u 2 bytes: cycle number (uint16)For each channel in the channel setu 2 bytes: min contrast value for image (uint16)For each channel in the channel setu 2 bytes: max contrast value for image (uint16)
Where N is the record index.
MiSeq andHiSeqRunningRTA1.xMiSeq and HiSeq instruments running RTA 1.x produce the ImageMetricsOut.bin file in version 1 format:
u byte 0: file version number (1)
u byte 1: length of each record
u bytes (N * 12 + 2) - (N *12 + 13): record:u 2 bytes: lane number (uint16)u 2 bytes: tile number (uint16)u 2 bytes: cycle number (uint16)
Document # 15066069 v04
For Research Use Only. Not for use in diagnostic procedures.18
Sequencing Analysis Viewer v2.4 Guide
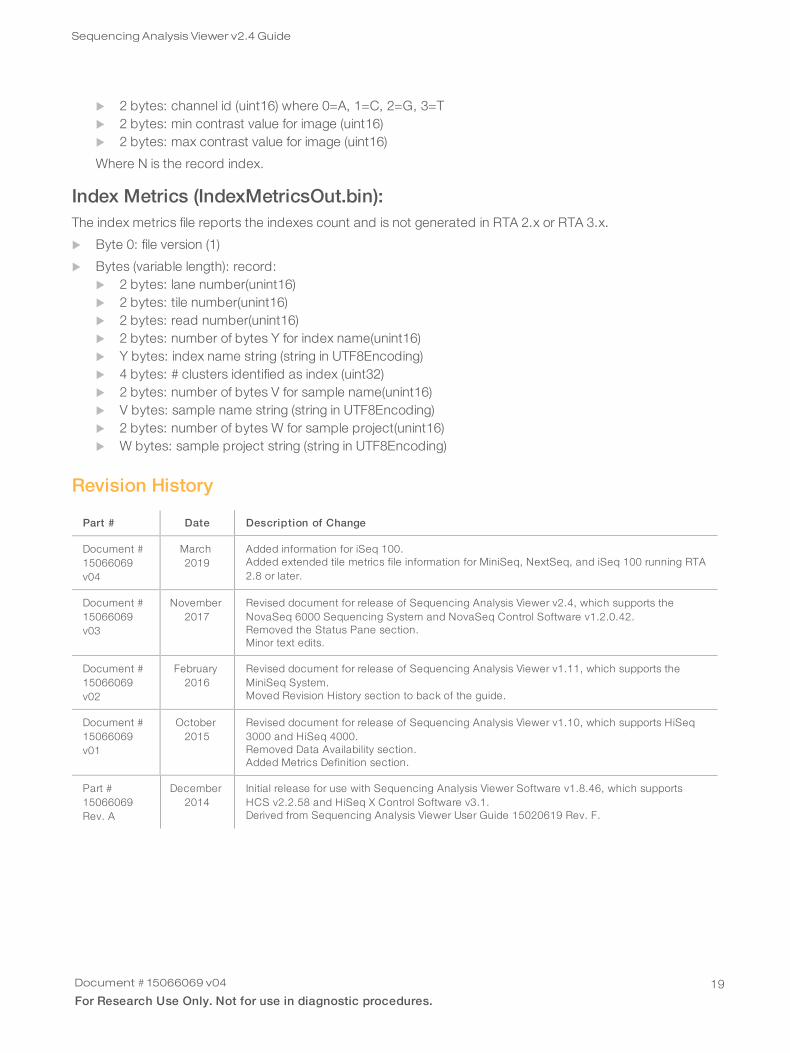
u 2 bytes: channel id (uint16) where 0=A, 1=C, 2=G, 3=Tu 2 bytes: min contrast value for image (uint16)u 2 bytes: max contrast value for image (uint16)
Where N is the record index.
Index Metrics (IndexMetricsOut.bin):The index metrics file reports the indexes count and is not generated in RTA 2.x or RTA 3.x.
u Byte 0: file version (1)
u Bytes (variable length): record:u 2 bytes: lane number(unint16)u 2 bytes: tile number(unint16)u 2 bytes: read number(unint16)u 2 bytes: number of bytes Y for index name(unint16)u Y bytes: index name string (string in UTF8Encoding)u 4 bytes: # clusters identified as index (uint32)u 2 bytes: number of bytes V for sample name(unint16)u V bytes: sample name string (string in UTF8Encoding)u 2 bytes: number of bytes W for sample project(unint16)u W bytes: sample project string (string in UTF8Encoding)
Revision History
Part # Date Description of Change
Document #15066069v04
March2019
Added information for iSeq 100.Added extended tile metrics file information for MiniSeq, NextSeq, and iSeq 100 running RTA2.8 or later.
Document #15066069v03
November2017
Revised document for release of Sequencing Analysis Viewer v2.4, which supports theNovaSeq 6000 Sequencing System and NovaSeq Control Software v1.2.0.42.Removed the Status Pane section.Minor text edits.
Document #15066069v02
February2016
Revised document for release of Sequencing Analysis Viewer v1.11, which supports theMiniSeq System.Moved Revision History section to back of the guide.
Document #15066069v01
October2015
Revised document for release of Sequencing Analysis Viewer v1.10, which supports HiSeq3000 and HiSeq 4000.Removed Data Availability section.Added Metrics Definition section.
Part #15066069Rev. A
December2014
Initial release for use with Sequencing Analysis Viewer Software v1.8.46, which supportsHCS v2.2.58 and HiSeq X Control Software v3.1.Derived from Sequencing Analysis Viewer User Guide 15020619 Rev. F.
Document # 15066069 v04
For Research Use Only. Not for use in diagnostic procedures.19
Sequencing Analysis Viewer v2.4 Guide
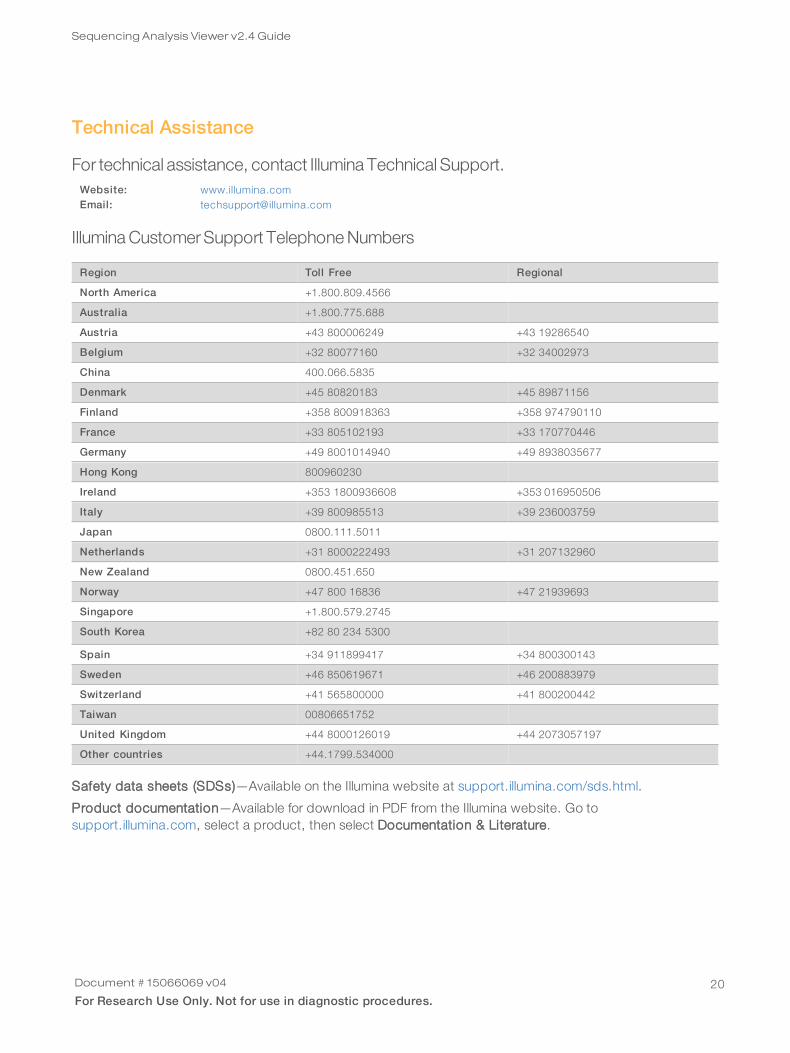
Technical Assistance
For technical assistance, contact Illumina Technical Support.Website: www.illumina.comEmail: [email protected]
IlluminaCustomerSupport TelephoneNumbers
Region Toll Free Regional
North America +1.800.809.4566
Australia +1.800.775.688
Austria +43 800006249 +43 19286540
Belgium +32 80077160 +32 34002973
China 400.066.5835
Denmark +45 80820183 +45 89871156
Finland +358 800918363 +358 974790110
France +33 805102193 +33 170770446
Germany +49 8001014940 +49 8938035677
Hong Kong 800960230
Ireland +353 1800936608 +353 016950506
Italy +39 800985513 +39 236003759
Japan 0800.111.5011
Netherlands +31 8000222493 +31 207132960
New Zealand 0800.451.650
Norway +47 800 16836 +47 21939693
Singapore +1.800.579.2745
South Korea +82 80 234 5300
Spain +34 911899417 +34 800300143
Sweden +46 850619671 +46 200883979
Switzerland +41 565800000 +41 800200442
Taiwan 00806651752
United Kingdom +44 8000126019 +44 2073057197
Other countries +44.1799.534000
Safety data sheets (SDSs)—Available on the Illumina website at support.illumina.com/sds.html.
Product documentation—Available for download in PDF from the Illumina website. Go tosupport.illumina.com, select a product, then select Documentation & Literature.
Document # 15066069 v04
For Research Use Only. Not for use in diagnostic procedures.20
Sequencing Analysis Viewer v2.4 Guide

Il lumina
5200 Illumina Way
San Diego, California 92122 U.S.A.
+1.800.809.ILMN (4566)
+1.858.202.4566 (outside North America)
www.illumina.com
For Research Use Only. Not for use in diagnostic procedures.
© 2019 Illumina, Inc. All rights reserved.
Document # 15066069 v04