Development of Internally Cured Concrete for Increased ...
289
JOINT TRANSPORTATION RESEARCH PROGRAM FHWA/IN/JTRP-2010/10 Final Report DEVELOPMENT OF INTERNALLY CURED CONCRETE FOR INCREASED SERVICE LIFE J. Schlitter R. Henkensiefken J. Castro K. Raoufi J. Weiss October 2010
-
Upload
khangminh22 -
Category
Documents
-
view
3 -
download
0
Transcript of Development of Internally Cured Concrete for Increased ...

JOINT TRANSPORTATION RESEARCH PROGRAM
FHWA/IN/JTRP-2010/10
Final Report
DEVELOPMENT OF INTERNALLY CURED
CONCRETE FOR INCREASED SERVICE LIFE
J. Schlitter
R. Henkensiefken
J. Castro
K. Raoufi
J. Weiss
October 2010

10/10 JTRP-2010/10 INDOT Division of Research West Lafayette, IN 47906
INDOT Research
TECHNICAL Summary Technology Transfer and Project Implementation Information
TRB Subject Code: October 2010
Publication No.: FHWA/IN/JTRP-2010/10, SPR-3211 Final Report
Development of Internally Cured Concrete for
Increased Service Life
Introduction
The main objective of this study was to
develop internally cured concrete for use in the
state of Indiana.
The scope of the research included
characterization of locally available lightweight
aggregate for use in internal curing.
Experimental measurements were performed on
these mixtures to assess autogenous shrinkage,
drying shrinkage, plastic shrinkage cracking,
drying shrinkage cracking, autogenous shrinkage
cracking, water absorption, compressive strength,
elastic modulus, tensile strength, thermal
cracking and freeze-thaw resistance.
Highlights of the testing program included
the use of new methods to measure autogenous
shrinkage from the time of set (This has since
become known as ASTM C-1698). In addition a
new testing device was developed that allowed a
mixtures susceptibility to be tested.
Findings
The following conclusions can be drawn
based on the results from this study:
It is important the lightweight aggregate
(LWA): 1) be able to provide a sufficient
volume of water (e.g., 24 hr absorption), has
a structure that allows the water to be
released to the paste as needed (i.e., enables
a large volume 90%+ to be desorbed by 92%
RH), and is small enough so that they can be
appropriately spaced in the matrix (i.e., fine
aggregate is preferred).
A reduction or elimination of autogenous
shrinkage is observed for internally cured
mixtures. This reduces or eliminates the
potential for early age cracking.
Plastic shrinkage cracking is reduced in
internally cured concrete.
Internally cured concrete has a higher degree
of hydration resulting in reduced water
absorption.
Internally cured concrete mixtures are less
susceptible to early age thermal cracking.
Large scale testing showed a reduction in the
cracking potential when internal curing was
used.
Implementation
The results of this investigation indicate that
internally cured concrete has great potential for
use in transportation structures. This occurs
specifically due to the reduced potential for
shrinkage and thermal cracking, the reduced fluid
transport, and the increased densification of the
matrix.
It is recommended that field trials be
performed with instrumentation, documentation
and monitoring to enable Indiana to quantify the
benefits of this material and to enable it to be
more commonly used.
It is recommended that a performance based
specification be developed that would enable

10/10 JTRP-2010/10 INDOT Division of Research West Lafayette, IN 47906
these materials to be used and specified more
widely in Indiana. It is recommended that a
training video be developed that highlights the
benefits of this material, describes its use, and
discusses important features associated with
placement and testing
Contact
For more information:
Prof. Jason Weiss
Principal Investigator
School of Civil Engineering
Purdue University
West Lafayette, IN 47907
Phone: (765) 494-2215
Indiana Department of Transportation
Division of Research
1205 Montgomery Street
P.O. Box 2279
West Lafayette, IN 47906
Phone: (765) 463-1521
Fax: (765) 497-1665
Purdue University
Joint Transportation Research Program
School of Civil Engineering
West Lafayette, IN 47907-1284
Phone: (765) 494-9310
Fax: (765) 496-1105

Final Report
JTRP SPR-3211
Development of Internally Cured Concrete for Increased Service Life
John Schlitter, P.E., S.E. Graduate Research Assistant
Ryan Henkensiefken
Graduate Research Assistant
Javier Castro Graduate Research Assistant
Kambiz Raoufi
Graduate Research Assistant
Dr. Jason Weiss Professor of Civil Engineering
School of Civil Engineering
Purdue University West Lafayette, IN 47907
And
Tommy Nantung, Ph.D., P.E.
Section Manager Indiana Department of Transportation
Joint Transportation Research Program Project No. C-36-37PP
File No. 05-08-42 SPR-3211
The contents of this paper reflect the views of the authors, who are responsible for the facts and the accuracy of the data presented herin, and do not necessarily reflect the official views or policies of the Indiana Department of Transportation, nor do the contents constitute a standard, specification, or regulation.
October 2010

TECHNICAL REPORT STANDARD TITLE PAGE 1. Report No.
2. Government Accession No.
3. Recipient's Catalog No.
FHWA/IN/JTRP-2010/10
4. Title and Subtitle Development of Internally Cured Concrete for Increased Service Life
5. Report Date
October 2010
6. Performing Organization Code
7. Author(s)
Schlitter, J., Henkensiefken, R., Castro, J., Raoufi, K., and Weiss, J
8. Performing Organization Report No.
FHWA/IN/JTRP-2010/10
9. Performing Organization Name and Address
Joint Transportation Research Program
Purdue University
550 Stadium Mall Drive
West Lafayette, IN 47907-2051
10. Work Unit No.
11. Contract or Grant No.
SPR-3211 12. Sponsoring Agency Name and Address
Indiana Department of Transportation
State Office Building
100 North Senate Avenue
Indianapolis, IN 46204
13. Type of Report and Period Covered
Final Report
14. Sponsoring Agency Code
15. Supplementary Notes
Prepared in cooperation with the Indiana Department of Transportation and Federal Highway Administration. 16. Abstract
Higher strength, lower water to cement ratio (w/c) concrete has been advocated over the last two decades due to its
increased strength and reduced permeability. The lower w/c of these concretes makes them susceptible to autogenous
shrinkage. This autogenous shrinkage can be significant and can be a contributing factor to early age cracking. Internal
curing was investigated as a potential method to improve the durability of concrete pavements and bridge decks. Prewetted
lightweight aggregate was used to supply water to the hydrating cement paste. This additional water can counteract the
hindered strength development, suspended hydration, autogenous shrinkage, and early age cracking.
An overview of the concepts behind internal curing was presented. It is important the internal curing agent
(lightweight aggregate (LWA) in this case): be able to provide a sufficient volume of water, has a structure that allows the
water to be released to the paste as needed, and is small enough so that they can be appropriately spaced in the matrix.
Local materials were used. Before concrete could be prepared the locally produced LWA was characterized to determine
absorption and desorption properties. Concrete mixtures were prepared for concrete with and without internal curing. A
constant aggregate volume was maintained. Tests performed on these mixtures were designed to measure: autogenous
shrinkage, drying shrinkage, plastic shrinkage cracking, drying shrinkage cracking, autogenous shrinkage cracking, water
absorption, compressive strength, elastic modulus, tensile strength, thermal cracking and freeze-thaw resistance. Internally
cured mixtures showed less autogenous shrinkage. In addition they were less likely to crack due to plastic, autogenous, and
drying effects. Internal curing reduced the water absorption and potential for freeze-thaw damage. Further, internal curing
allowed a greater temperature swing in the concrete before cracking would occur.
Internally cured concrete mixtures could enable INDOT to produce more durable concrete pavements and structures
that are less susceptible to cracking and have improved transport properties thereby providing great potential for more
sustainable, cost-effective construction.
17. Key Words
Hydraulic cement concrete, durability, strength,
absorption, sorptivity, shrinkage, cracking, internal curing
18. Distribution Statement
No restrictions. This document is available to the public through the
National Technical Information Service, Springfield, VA 22161
19. Security Classif. (of this report)
Unclassified
20. Security Classif. (of this page)
Unclassified
21. No. of Pages
285
22. Price
Form DOT F 1700.7 (8-69)

ii
ACKNOWLEDGEMENTS
The authors gratefully acknowledge the guidance provided by Dr. Dale P. Bentz
from the Building and Fire Research Laboratory, National Institute of Standards
and Technology.
This work was conducted in the Charles Pankow Concrete Materials Laboratory
at Purdue University. As such, the authors gratefully acknowledge the support
which has made this laboratory and its operation possible.

iii
TABLE OF CONTENTS
Page
ACKNOWLEDGEMENTS ..................................................................................... ii
TABLE OF CONTENTS ....................................................................................... iii
LIST OF TABLES ............................................................................................... xiii
LIST OF FIGURES ..............................................................................................xv
LIST OF ABBREVIATIONS AND VARIABLES ................................................. xxiv
CHAPTER 1. INTRODUCTION, OBJECTIVES, AND APPROACH ..................... 1
1.1. Introduction ................................................................................................. 1
1.2. Research Objectives .................................................................................. 3
1.3. Research Approach .................................................................................... 4
1.3.1. Task 1: Literature Review .................................................................... 4
1.3.2. Task 2: Characterization of Local Materials ......................................... 5
1.3.3. Task 3: Evaluating Self-Curing Concrete Made with Local Materials .. 5
1.3.4. Tasks 4 and 5: Full Scale Trial Batch and Testing ............................... 8
CHAPTER 2. CHARACTERIZATION OF LOCAL MATERIALS ........................... 9
2.1. Introduction ................................................................................................. 9
2.2. Techniques for Determining the Absorption of LWA ................................. 10
2.2.1. ASTM C128 ........................................................................................ 12
2.2.2. Cobalt(II) Chloride Method .................................................................. 14
2.2.3. Absorption Rate Method ..................................................................... 16
2.2.4. Pycnometer Method ........................................................................... 19

iv
2.2.5. Comments and Recommendations .................................................... 20
2.3. Techniques for Determining the Pore Size Distribution ............................ 20
2.3.1. Mercury Intrusion Porosimetry ............................................................ 21
2.3.2. Desorption Isotherm ........................................................................... 23
2.4. Implications of These Properties on Shrinkage ........................................ 24
2.4.1. Materials and Testing Procedures ...................................................... 24
2.4.2. Results and Discussion ...................................................................... 25
2.5. Conclusions .............................................................................................. 26
CHAPTER 3. MECHANISMS OF INTERNAL CURING ..................................... 28
3.1. Volume of Water Needed for IC ................................................................ 28
3.2. Ability of Water to Leave the LWA ............................................................ 31
3.3. LWA Spacing ............................................................................................ 36
3.4. The Drying Mechanisms in Sealed and Unsealed Systems ..................... 39
3.4.1. Sealed System ................................................................................... 39
3.4.2. Unsealed System ............................................................................... 40
CHAPTER 4. MONITORING WATER MOVEMENT FROM PREWETTED LIGHTWEIGHT AGGREGATE USING X-RAY ABSORPTION .......................... 42
4.1. Introduction ............................................................................................... 42
4.2. Background on Internal Curing ................................................................. 43
4.3. Background on the Detection of Water Movement Using X-ray Absorption45
4.4. Previous Studies Using X-ray Absorption ................................................. 46
4.5. Improvement to Measuring Techniques ................................................... 47
4.6. Materials and Equipment .......................................................................... 52
4.6.1. Materials and Mixture Proportions ...................................................... 52

v
4.6.2. Description of the X-ray Absorption Equipment .................................. 52
4.7. Experimental Methods .............................................................................. 53
4.7.1. Low Resolution Measurement ............................................................ 54
4.7.2. High Resolution Measurement ........................................................... 55
4.8. Experimental Results ................................................................................ 56
4.8.1. Low Resolution Measurement ............................................................ 56
4.8.2. High Resolution Measurement ........................................................... 59
4.9. Conclusions .............................................................................................. 61
CHAPTER 5. DISCUSSION ON THE SHRINKAGE OF THE PASTE IN MORTAR CONTAINING PREWETTED LIGHTWEIGHT AGGREGATE ............ 63
5.1. Introduction ............................................................................................... 63
5.2. Constituent Materials ................................................................................ 63
5.3. Mixture Proportioning ............................................................................... 64
5.4. Mixing Procedure ...................................................................................... 64
5.5. Experimental Results of Mortar Mixtures .................................................. 65
5.6. Modeling Concrete Shrinkage from Pickett’s Equation ............................. 67
5.6.1. General Considerations ...................................................................... 67
5.6.2. Equivalent Paste Shrinkage ................................................................ 68
5.7. Describing Shrinkage Using Modified Mackenzie’s Equation ................... 69
5.8. Conclusions .............................................................................................. 72
CHAPTER 6. MEASURING VOLUME CHANGE AND CRACKING UNDER SEALED AND DRYING CONDITIONS .............................................................. 74
6.1. Introduction ............................................................................................... 74
6.2. Materials ................................................................................................... 75
6.3. Mixture Proportioning ............................................................................... 76

vi
6.3.1. Mixing Procedure ................................................................................ 78
6.4. Experimental Methods .............................................................................. 79
6.4.1. Unrestrained Volumetric Change during the First 24 h ....................... 79
6.4.2. Unrestrained Volumetric Change & Mass Loss after 24 h .................. 79
6.4.3. Measurements of Restrained Shrinkage ............................................. 80
6.4.4. Internal Relative Humidity of Sealed Specimens ................................ 80
6.5. Experimental Results and Discussion of Internal Curing Mixtures ............ 81
6.5.1. Different LWA Volume Replacements on Free Shrinkage .................. 81
6.5.1.1. Sealed Curing Conditions ............................................................. 81
6.5.1.2. Unsealed Curing Conditions ......................................................... 86
6.5.2. Different LWA Volume Replacements on Restrained Shrinkage ........ 89
6.5.2.1. Sealed Curing Conditions ............................................................. 89
6.5.2.2. Unsealed Curing Conditions ......................................................... 91
6.5.3. Different Volume Replacements on Internal Relative Humidity .......... 93
6.5.4. Effect of Particle Spacing on Internal Curing Effectiveness ................ 95
6.6. Conclusions .............................................................................................. 98
Sealed Specimens .............................................................................................. 98
Unsealed Specimens .......................................................................................... 99
CHAPTER 7. PLASTIC SHRINKAGE CRACKING IN MIXTURES MADE WITH PREWETTED LIGHTWEIGHT AGGREGATE .................................................. 100
7.1. Introduction ............................................................................................. 100
7.2. Mechanisms of Plastic Shrinkage ........................................................... 100
7.3. Constituent Materials .............................................................................. 102
7.4. Mixture Proportioning ............................................................................. 103
7.4.1. Mortar Mixture .................................................................................. 103

vii
7.4.2. Concrete Mixture .............................................................................. 104
7.5. Experimental Methods ............................................................................ 105
7.5.1. Settlement ........................................................................................ 105
7.5.2. Plastic Shrinkage .............................................................................. 107
7.6. Experimental Results and Discussion .................................................... 108
7.6.1. Settlement ........................................................................................ 108
7.6.2. Plastic Shrinkage .............................................................................. 109
7.7. Conclusions ............................................................................................ 111
CHAPTER 8. MONITORING WATER ABSORPTION IN CEMENTITIOUS SYSTEMS MADE WITH PREWETTED LIGHTWEIGHT AGGREGATE .......... 113
8.1. Introduction ............................................................................................. 113
8.1.1. Background in Sorptivity ................................................................... 114
8.1.2. Background on the Effects of Internal Curing on Sorptivity............... 115
8.2. Materials ................................................................................................. 120
8.2.1. Mixture Proportioning ....................................................................... 121
8.2.2. Mixing Procedure .............................................................................. 122
8.3. Experimental Methods ............................................................................ 122
8.3.1. Degree of Hydration ......................................................................... 122
8.3.2. Sorptivity ........................................................................................... 123
8.3.3. Electrical Impedance Spectroscopy .................................................. 123
8.4. Experimental Results and Discussion .................................................... 124
8.4.1. Effects of Internal Curing on the Degree of Hydration ...................... 124
8.4.2. Effects of Internal Curing on Initial and Secondary Sorptivity ........... 125

viii
8.4.3. Effects of Internal Curing on the Amount of Absorbed Water During the
Sorption Test .................................................................................... 128
8.4.4. Effects of Available Space on Both Sorptivity and Total Amount of
Absorbed Water ............................................................................... 131
8.5. Conclusions ............................................................................................ 133
CHAPTER 9. Mechanical Properties of IC Systems Made with Prewetted Lightweight Aggregate ...................................................................................... 135
9.1. Introduction ............................................................................................. 135
9.2. Constituent Materials .............................................................................. 135
9.3. Mixture Proportions ................................................................................ 136
9.4. Mixing Procedure .................................................................................... 137
9.5. Mechanical Property Testing .................................................................. 137
9.6. Results and Discussion .......................................................................... 138
9.6.1. Compressive Strength ...................................................................... 138
9.6.2. Split Tensile Strength ....................................................................... 139
9.6.3. Modulus of Elasticity ......................................................................... 140
9.7. Mechanical Properties Conclusions ........................................................ 141
CHAPTER 10. The Effect of Temperature Change on IC Systems Made with Prewetted Lightweight Aggregate ..................................................................... 142
10.1. Introduction ........................................................................................... 142
10.2. Experimental Equipment ....................................................................... 144
10.2.1. Dual Restraining Rings Geometry and Construction ...................... 144
10.2.2. Dual Ring Instrumentation and Data Acquisition ............................ 147
10.2.3. Strain Gauge Temperature Calibration ........................................... 148
10.2.4. Temperature Control System .......................................................... 149

ix
10.3. Experimental Procedures ..................................................................... 150
10.3.1. Mixture Proportions......................................................................... 150
10.3.2. Materials ......................................................................................... 151
10.3.3. Dual Ring Specimen Mixing, Casting, and Testing Procedure ....... 152
10.4. Results and Discussion ........................................................................ 154
10.5. Thermal Study Summary ...................................................................... 157
CHAPTER 11. Evaluating internally cured mixtures with a temperature drop approach .......................................................................................................... 158
11.1. Introduction ........................................................................................... 158
11.2. Experimental Approach ........................................................................ 158
11.3. Experimental Program .......................................................................... 160
11.3.1. Mixture Proportions......................................................................... 160
11.3.2. Materials ......................................................................................... 160
11.3.3. Dual Ring Testing Protocol ............................................................. 161
11.3.4. Split Tensile, Compressive Strength, and Elastic Modulus Tests ... 162
11.4. Experimental Results ............................................................................ 162
11.5. Discussion ............................................................................................ 164
11.6. Summary of Temperature Drop Approach ............................................ 168
CHAPTER 12. Freeze thaw resistance of mixtures containing prewetted lightweight aggregate ....................................................................................... 170
12.1. Introduction ........................................................................................... 170
12.2. Materials ............................................................................................... 170
12.3. Mixture Proportions .............................................................................. 171
12.4. Mixing and Freeze Thaw Testing Procedure ........................................ 172
12.5. Results and Discussion ........................................................................ 172

x
12.6. Conclusions .......................................................................................... 174
CHAPTER 13. Full scale batching and testing of internally cured mixtures using prewetted lightweight aggregate ....................................................................... 175
13.1. Introduction ........................................................................................... 175
13.2. Large Scale Testing Approach ............................................................. 176
13.3. Design of the Large Scale Restrained Slab Test .................................. 177
13.3.1. Modeling Approach ......................................................................... 177
13.3.2. Model Properties ............................................................................ 178
13.3.3. Modeled Concrete Properties Used to Design Large Scale Test
Geometry .......................................................................................... 179
13.3.4. Results of Modeling and Selected Geometry .................................. 181
13.3.4.1. Influence of Restraining Slab Base Thickness .......................... 182
13.3.4.2. Influence of Test Slab Length ................................................... 185
13.3.4.3. Influence of Restraining Base Elastic Modulus ......................... 186
13.3.5. Summary of Large Scale Test Design ............................................ 188
13.4. Large Scale Testing of Internally Cured Proportions ............................ 188
13.4.1. Restraining Base Slab Construction ............................................... 188
13.4.2. Mixture Proportioning for Test Slabs .............................................. 189
13.4.3. Materials ......................................................................................... 191
13.4.4. Mixing Procedure ............................................................................ 192
13.4.5. Large Scale Casting Procedure ...................................................... 192
13.4.6. Experimental Results and Discussion ............................................ 194
13.5. Large Scale Testing Conclusions ......................................................... 197
CHAPTER 14. SUMMARY AND CONCLUSIONS ........................................... 199
14.1. Summary .............................................................................................. 199

xi
14.2. Conclusions .......................................................................................... 203
LIST OF REFERENCES .................................................................................. 204
Appendix A. Calculation of LWA needed from Equation 2-1 ......................... 218
Appendix B. Unrestrained Shrinkage Measurements .................................... 220
Figure B-1 – All unrestrained, sealed shrinkage measurements ...................... 221
Figure B-2 – Unrestrained, sealed shrinkage for 0.0% mixture ........................ 221
Figure B-3 – Unrestrained, sealed shrinkage for 7.3%k mixture....................... 222
Figure B-4 – Unrestrained, sealed shrinkage for 11.0%k mixture ..................... 222
Figure B-5 – Unrestrained, sealed shrinkage 14.3%k mixture .......................... 223
Figure B-6 – Unrestrained, sealed shrinkage for 18.3%k mixture ..................... 223
Figure B-7 – Unrestrained, sealed shrinkage 25.3%k mixture .......................... 224
Figure B-8 – Unrestrained, sealed shrinkage for 29.3%k mixture ..................... 224
Figure B-9 – Unrestrained, sealed shrinkage for 33.0%k mixture ..................... 225
Figure B-10 – All unrestrained, unsealed shrinkage measurements ................ 227
Figure B-11 – Unrestrained, unsealed shrinkage for 0.0% mixture .................. 227
Figure B-12 – Unrestrained, unsealed shrinkage for 7.3%k mixture ................. 228
Figure B-13 – Unrestrained, unsealed shrinkage for 11.0%k mixture ............... 228
Figure B-14 – Unrestrained, unsealed shrinkage for 14.3%k mixture ............... 229
Figure B-15 – Unrestrained, unsealed shrinkage for 18.3%k mixture ............... 229
Figure B-16 – Unrestrained, unsealed shrinkage for 25.3%k mixture ............... 230
Figure B-17 – Unrestrained, unsealed shrinkage for 29.3%k mixture ............... 230
Figure B-18 – Unrestrained, unsealed shrinkage for 33.0%k mixture ............... 231
Appendix C. Restrained Shrinkage Measurements ....................................... 232
Figure C-1 – All restrained, sealed shrinkage measurements .......................... 238
Figure C-2 – Restrained, sealed shrinkage for 0.0% mixture ........................... 238
Figure C-3 – Restrained, sealed shrinkage for 3.8%k mixture ......................... 239
Figure C-4 – Restrained, sealed shrinkage for 7.3%k mixture ......................... 239
Figure C-5 – Restrained, sealed shrinkage for 11.0%k mixture........................ 240
Figure C-6 – Restrained, sealed shrinkage for 14.3%k mixture........................ 240
Figure C-7 – Restrained, sealed shrinkage for 25.3%k mixture........................ 241

xii
Figure C-8 – All restrained, unsealed shrinkage measurements ...................... 247
Figure C-9 – Restrained, unsealed shrinkage for 0.0% mixture ....................... 247
Figure C-10 – Restrained, unsealed shrinkage for 7.3%k mixture .................... 248
Figure C-11 – Restrained, unsealed shrinkage for 11.0%k mixture .................. 248
Figure C-12 – Restrained, unsealed shrinkage for 14.3%k mixture .................. 249
Figure C-13 – Restrained, unsealed shrinkage for 25.3%k mixture .................. 249
Figure C-14 – Restrained, unsealed shrinkage for 29.3%k mixture .................. 250
Figure C-15 – Restrained, unsealed shrinkage for 33.0%k mixture .................. 250
Appendix D. MECHANICAL PROPERTIES DATA ........................................... 251
Table D-1 – Mixture M-0 Mechanical Properties ............................................... 251
Table D-2 – Mixture M-11 Mechanical Properties ............................................. 251
Table D-3 – Mixture M-24 Mechanical Properties ............................................. 251
Appendix E. DUAL RING DATA ....................................................................... 252
Table E-1 – Mixture M-0 7-Day Mechanical Properties .................................... 252
Table E-2 – Mixture M-11 7-Day Mechanical Properties .................................. 252
Table E-3 – Mixture M-24 7-Day Mechanical Properties .................................. 252
Table E-4 – Mixture M-0 Dual Ring Data .......................................................... 253
Table E-5 – Mixture M-11 Dual Ring Data ........................................................ 253
Table E-6 – Mixture M-24 Dual Ring Data ........................................................ 253
Appendix F. FREEZE THAW DATA ................................................................. 254
Table F-1 – Mixture M-0 Freeze Thaw Data ..................................................... 254
Table F-2 – Mixture M-11 Sealed Cure Freeze Thaw Data .............................. 255
Table F-3 – Mixture M-24 Sealed Cure Freeze Thaw Data .............................. 256
Appendix G. LARGE SCALE UNRESTRAINED SHRINKAGE MEASUREMENTS
......................................................................................................................... 257
Table G-1 – Large Scale Restraining Slab 1 Unrestrained Shrinkage .............. 257
Table G-2 – Large Scale Restraining Slab 4 Unrestrained Shrinkage .............. 257
Table G-3 – Large Scale Mixture C-0 Unrestrained Shrinkage......................... 257
Table G-4 – Large Scale Mixture C-21 Unrestrained Shrinkage....................... 258

xiii
LIST OF TABLES
Table Page
Table 2-1 – Absorptions of different LWA using different methods ..................... 14
Table 2-2 – Mixture proportions for LWA variability study .................................. 25
Table 5-1 – Mixture proportions for modeling study ............................................ 64
Table 5-2 – Kelvin Radius from internal RH and pore size distribution ............... 72
Table 6-1 – Mixture proportions for volume change and cracking study ............. 77
Table 7-1 – Mixture proportions of mortar for settlement study ........................ 103
Table 7-2 – Mixture proportions of concrete for plastic shrinkage study ........... 104
Table 7-3 – Crack reducing ratios for each LWA replacement ......................... 111
Table 8-1 – Mixture proportions for water absorption study .............................. 118
Table 9-1 – Mixture proportions for mechanical properties study ..................... 136
Table 10-1 – Mixture Proportions for Temperature Study ................................. 151
Table 11-1 –Mixture Proportions for Temperature Drop Approach ................... 160
Table 12-1 – Mixture Proportions for Freeze Thaw Study ................................ 171
Table 13-1 – Mixture Proportions for Restraining Base Slab ............................ 189
Table 13-2 –Mixture Proportions for Large Scale Testing ................................ 191
Table 13-3 – Coarse Aggregate Gradation for Large Scale Testing (Indiana #9)
................................................................................................................... 191
Appendix B Tables

xiv
Table B-1 – All unrestrained shrinkage measurements in sealed conditions .... 220
Table B-2 – All unrestrained shrinkage measurements in unsealed conditions 226
Appendix C Tables
Table C-1 – Restrained, sealed measurements for 0.0% mixture .................... 232
Table C-2 – Restrained, sealed measurements for 3.8%k mixture ................... 233
Table C-3 – Restrained, sealed measurements for 7.3%k mixture ................... 234
Table C-4 – Restrained, sealed measurements for 11.0%k mixture ................. 235
Table C-5 – Restrained, sealed measurements for 14.3%k mixture ................ 236
Table C-6 – Restrained, sealed measurements for 25.3%k mixture ................. 237
Table C-7 – Restrained, unsealed measurements for 0.0% mixture ................ 242
Table C-8 – Restrained, unsealed measurements for 7.3%k mixture ............... 242
Table C-9 – Restrained, unsealed measurements for 11.0%k mixture ............. 243
Table C-10 – Restrained, unsealed measurements for 14.3%k mixture ........... 243
Table C-11 – Restrained, unsealed measurements for 25.3%k mixture ........... 244
Table C-12 – Restrained, unsealed measurements for 29.3%k mixture ........... 245
Table C-13 – Restrained, unsealed measurements for 33.0%k mixture ........... 246

xv
LIST OF FIGURES
Figure Page
Figure 2-1 – Gradation of LWA-K and LWA-H .................................................... 12
Figure 2-2 – Slight slumping of LWA using the standard cone test in ASTM C128.
The slight slumping indicates no surface moisture on the LWA ................... 14
Figure 2-3 – Average hue of blue at different moisture contents for LWA-K using
the Cobalt(II) Chloride method ...................................................................... 16
Figure 2-4 – Experimental Setup for the absorption rate method ....................... 17
Figure 2-5 – (a) the absorption of different grain sizes of LWA-K along with a
graded sample, (b) the absorption of the graded sample along with a graded
sample reconstructed for the individual grain size absorption, (c) absorption
divided by the particle diameter as a function of time (d) the absorption of
LWA-K as a function of the square root of time ............................................ 18
Figure 2-6 – Pycnometer used to determine absorption of LWA ........................ 20
Figure 2-7 – Pore size distribution from mercury intrusion porosimetry for (a)
LWA-K, LWA-H, and a 24 h old cement paste with a w/c of 0.30 and (b) two
different LWA-K samples showing the variation in pores of LWA particles ... 22
Figure 2-8 – (a) desorption isotherm of different aggregate, and (b) the pore size
distribution of the LWA determined from the desorption isotherm ................ 24
Figure 2-9 – Unrestrained shrinkage measurements for mortar made with
different LWA during the first 96 h ................................................................ 26

xvi
Figure 3-1 – Chemical shrinkage and autogenous shrinkage volumes during
hydration of a paste with a w/c of 0.30 (Henkensiefken et al. 2008f) ............ 29
Figure 3-2 – Pore size distribution for cement paste with a w/c of 0.30 at three
different ages and for two different LWA measured using mercury intrusion
porosimetry ................................................................................................... 33
Figure 3-3 – Desorption isotherm of two different LWA ...................................... 33
Figure 3-4 – Conceptual illustration of the menisci formation in sealed and
unsealed specimens made of plain and SLWA concrete (Henkensiefken et al.
2008e) .......................................................................................................... 36
Figure 3-5 – Volume fraction of paste within a specified distance of a SLWA.
This plot does not show whether water can reach the paste. Volume and
travel distance of water need to be considered to determine this ................. 38
Figure 3-6 – Illustrations showing the protected paste volume concept of two
mixtures with similar LWA replacements volumes, but one replacement is of
(a) coarse aggregate, and the other of (b) fine aggregate (Henkensiefken
2008a) .......................................................................................................... 39
Figure 3-7 – Illustration of drying mechanisms in sealed and unsealed systems:
(a) Sealed – only internal drying, (b) Only external drying, (c) Unsealed –
internal plus external drying (Radlinska et al. 2008b) ................................... 41
Figure 4-1 – Chemical shrinkage and autogenous shrinkage volumes during
hydration of a paste with a w/c of 0.30 ......................................................... 44
Figure 4-2 – Samples (used for determining travel distance of water) mounted on
rotating table inside x-ray chamber ............................................................... 47
Figure 4-3 – Schematic (used for detecting travel distance of water) of (a)
misaligned sample and (b) a properly oriented sample ................................ 48

xvii
Figure 4-4 – X-ray image (used for detecting travel distance of water) of samples
rotated to orientations of (a) -10.0 degrees, (b) -5.0 degrees, (c) -2.5 degrees
and (d) 0.0 degrees ...................................................................................... 49
Figure 4-5 – Thickness of the LWA/paste interface as sample is rotated ........... 50
Figure 4-6 – Thickness of LWA/paste interface for different angles of orientation
..................................................................................................................... 50
Figure 4-7 – (a) A schematic illustration of the geometry of the experimental
setup (not to scale) and (b) influence of the angle of orientation on the
fraction of the x-ray beam that contains LWA ............................................... 51
Figure 4-8 – (a) A schematic illustration of the geometry of the experimental
setup (not to scale) and (b) schematic of sample holder with precut LWA and
paste (used to detect water movement near the time of set) ........................ 55
Figure 4-9 – (a) X-ray measurements showing water movement from the LWA
during the first day, and (b) X-ray measurements during first 6.5 h for
determining when water leaves the LWA ..................................................... 58
Figure 4-10 – Difference in counts normalized to initial counts averaged from 2.0
mm to 2.4 mm in the LWA as a function of age ............................................ 58
Figure 4-11 – Moisture movement from LWA into the cement paste .................. 60
Figure 4-12 – Protected paste volume at different particle replacement sizes ... 61
Figure 5-1 – Autogenous shrinkage measurements for mortar specimens ........ 65
Figure 5-2 – Chemical shrinkage and autogenous shrinkage measurements
showing when water depletes from LWA ...................................................... 66
Figure 5-3 – Plain paste measurement and modeling results of plain and LWA
pastes using Pickett’s Model ........................................................................ 69
Figure 5-4 – Pore size distribution of plain mortar mixture at 7 d ........................ 70
Figure 5-5 – Affected pore size distribution of plain mortar mixture .................... 71

xviii
Figure 6-1 – Mixture proportions on a volumetric basis ...................................... 78
Figure 6-2 – Free shrinkage results of plain and LWA-K mortar mixtures in sealed
curing conditions during the first 7 d ............................................................. 82
Figure 6-3 – Free shrinkage results of plain and LWA-K mortar mixtures in sealed
curing conditions ........................................................................................... 82
Figure 6-4 – Void creation in cement paste and the time when water depletes
from the LWA-K as volume replacements increase. The 18.3%k, 25.3%k,
29.3%k and 33.0%k mixtures don’t deplete of water before 7 d ................... 84
Figure 6-5 – Time of water depletion from the SLWA versus the time when the
mixtures begin to shrink as measured by the corrugated tubes and sealed
prisms ........................................................................................................... 85
Figure 6-6 – 7 d free shrinkage measurements plotted as a function of the
replacement volume of LWA-K (3 samples are shown for each mixture) ..... 86
Figure 6-7 – Free shrinkage results of plain and LWA-K mortar mixtures in
unsealed curing conditions ........................................................................... 87
Figure 6-8 – Mass loss of LWA-K free shrinkage samples in unsealed curing
conditions ..................................................................................................... 88
Figure 6-9 – 28 d mass loss measurements for unsealed free shrinkage
measurements plotted as a function of the replacement volume of LWA-K . 89
Figure 6-10 – Restrained shrinkage results of plain and LWA-K mortar mixtures
in sealed curing conditions (In each case, a typical response is shown from
the three samples tested). Sharp vertical rise in strain curve indicates
occurrence of cracking in the specimen ....................................................... 90
Figure 6-11 – Time of cracking in LWA-K mixtures plotted as a function of
replacement volume (3 samples are shown for each mixture)...................... 91
Figure 6-12 – Restrained shrinkage results of plain and LWA-K mortar mixtures
in unsealed curing conditions (In each case, a typical response is shown from

xix
the three samples tested). Sharp vertical rise in strain curve indicates
occurrence of cracking in the specimen ....................................................... 92
Figure 6-13 – Strain at cracking in LWA-K mixtures plotted as a function of
replacement volume (3 samples are shown for each mixture)...................... 93
Figure 6-14 – Internal relative humidity measurements for the sealed LWA-K
mixtures ........................................................................................................ 94
Figure 6-15 – Kelvin Radius and capillary stress as determined from RH
measurements as a function of replacement volume of LWA-K at 7 d ......... 95
Figure 6-16 – Free shrinkage results of a comparison between LWA-K and LWA-
H LWA in sealed curing conditions ............................................................... 96
Figure 6-17 – Restrained shrinkage results of a comparison between LWA-K and
LWA-H LWA in unsealed curing conditions .................................................. 97
Figure 6-18 – Internal relative humidity results of a comparison between LWA-K
and LWA-H SLWA ........................................................................................ 97
Figure 7-1 – Laser setup for settlement test (Qi et al. 2005) ............................ 106
Figure 7-2 – Geometry of the specimens used for plastic shrinkage investigation
(Qi et al. 2003b) .......................................................................................... 108
Figure 7-3 – Settlement results for mortar samples .......................................... 109
Figure 7-4 – Cumulative distribution of crack width occurrences in concrete with
different replacement volumes of LWA ....................................................... 110
Figure 7-5 – Probability of cracks widths being smaller than 0.0 mm and 0.2 mm
at different LWA replacement volumes ....................................................... 111
Figure 8-1 – Powers model showing the phase distribution for (a) 55/0.30, (b)
11.0%k and (c) 25.3%k mixtures, and (d) the maximum theoretical degree of
hydration as a function of LWA volume ...................................................... 119
Figure 8-2 – ITZ percolation as a function of replacement volume of LWA ...... 120

xx
Figure 8-3 – Degree of hydration ...................................................................... 125
Figure 8-4 – Sorption test on samples cured for (a) 1d, (b) 7 d, (c) 28 d, and (d)
90 d ............................................................................................................ 127
Figure 8-5 – (a) Initial rate of absorption, and (b) secondary rate of absorption for
samples cured for different periods ............................................................ 128
Figure 8-6 – Cumulated absorbed water for samples at 8 d ............................. 129
Figure 8-7 – The equivalent w/c determined from (a) cumulated absorbed water
at 8 d on samples cured for 28 d and (b) conductivity. Porosity as a function
of the (c) cumulated absorbed water at 8 d on samples cured for 28 d and (d)
conductivity ................................................................................................. 130
Figure 8-8 – Relationship between open porosity and (a) initial sorptivity and (b)
total absorbed water after 8 days of sorption test ....................................... 132
Figure 8-9 – (a) Long term sorption of samples cured for 28 d and (b) the total
absorption for the samples after vacuum saturation ................................... 133
Figure 9-1 – Compressive Strength .................................................................. 139
Figure 9-2 – Split Tensile Strength ................................................................... 140
Figure 9-3 – Modulus Of Elasticity .................................................................... 141
Figure 10-1 – Geometry of the Dual Ring Test ................................................. 145
Figure 10-2 - Ring in Insulation Chamber with Top Insulation Removed .......... 145
Figure 10-3 - Effect of Invar Ring Thickness on DOR ....................................... 147
Figure 10-4 – Inner Ring Thermal Correction ................................................... 149
Figure 10-5 – Outer ring Thermal Correction .................................................... 149
Figure 10-6 – Applied Temperature in Dual Ring Testing ................................. 153
Figure 10-7 – Inner Ring ................................................................................... 155
Figure 10-8 – Outer Ring .................................................................................. 155

xxi
Figure 10-9 – Specimen Stress History ............................................................ 155
Figure 11-1 – Example Temperature Reduction ............................................... 159
Figure 11-2 - M-0 Residual Stress .................................................................... 163
Figure 11-3 - M-11 Residual Stress .................................................................. 163
Figure 11-4 - M-24 Residual Stress .................................................................. 163
Figure 11-5 – Split Tensile Capacity, f’t ............................................................ 164
Figure 11-6 - Modulus of Elasticity, E ............................................................... 164
Figure 11-7 - Compressive Strength, f’c ............................................................ 164
Figure 11-8 – Required Temperature Change to Induce Cracking ................... 166
Figure 11-9 – Cracking Stress History .............................................................. 167
Figure 11-10 - Reserve Stress Capacity ........................................................... 167
Figure 11-11 - Factor of Safety To Cracking .................................................... 168
Figure 12-1 – Relative Dynamic Modulus ......................................................... 173
Figure 12-2 – Relative Weight Gain .................................................................. 173
Figure 13-1 - Basic Test Geometry (a) Longitudinal Cross Section View ......... 179
Figure 13-2 – Elastic Modulus and Tensile Strength Used in Model ................ 180
Figure 13-3 –Autogenous Shrinkage Used in Model ........................................ 180
Figure 13-4 – Longitudinal Section at End of Slabs Depicting Shrinkage and
Restraining Forces ..................................................................................... 181
Figure 13-5 – Exaggerated Longitudinal Section View of Slab Curvature During
Test Specimen Shrinkage .......................................................................... 181
Figure 13-6 – Restraining Base Thickness Influence on (a) Deflection (b)
Average Stress (c) Stress Uniformity .......................................................... 184
Figure 13-7 - Effect of Restraining Base Thickness on Degree of Restraint ..... 185

xxii
Figure 13-8 – Test Slab Length influence on (a) Vertical Deflection (b) Average
Stress (c) Stress Uniformity ........................................................................ 187
Figure 13-9 - Effect of Restraining Slab Modulus on Vertical Deflection at End of
Slab ............................................................................................................ 188
Figure 13-10 – Photo of Formwork Prepared for Large Scale Test Slab .......... 193
Figure 13-11 – Photo of Finished Test Slab ..................................................... 193
Figure 13-12 – Mixture C-0 Test Slab Crack at 12 Day .................................... 196
Figure 13-13 – Mixture C-21 Test Slab Crack at 42 day ................................... 197
Figure 13-14 – C-0 Crack Width History ........................................................... 197
Figure 13-15 – C-0 Free Shrinkage History ...................................................... 197
Figure 13-16 – C-21 Free Shrinkage History .................................................... 197
Appendix B Figures
Figure B-1 – All unrestrained, sealed shrinkage measurements ...................... 221
Figure B-2 – Unrestrained, sealed shrinkage for 0.0% mixture ........................ 221
Figure B-3 – Unrestrained, sealed shrinkage for 7.3%k mixture....................... 222
Figure B-4 – Unrestrained, sealed shrinkage for 11.0%k mixture ..................... 222
Figure B-5 – Unrestrained, sealed shrinkage 14.3%k mixture .......................... 223
Figure B-6 – Unrestrained, sealed shrinkage for 18.3%k mixture ..................... 223
Figure B-7 – Unrestrained, sealed shrinkage 25.3%k mixture .......................... 224
Figure B-8 – Unrestrained, sealed shrinkage for 29.3%k mixture ..................... 224
Figure B-9 – Unrestrained, sealed shrinkage for 33.0%k mixture ..................... 225
Figure B-10 – All unrestrained, unsealed shrinkage measurements ................ 227
Figure B-11 – Unrestrained, unsealed shrinkage for 0.0% mixture .................. 227
Figure B-12 – Unrestrained, unsealed shrinkage for 7.3%k mixture ................. 228

xxiii
Figure B-13 – Unrestrained, unsealed shrinkage for 11.0%k mixture ............... 228
Figure B-14 – Unrestrained, unsealed shrinkage for 14.3%k mixture ............... 229
Figure B-15 – Unrestrained, unsealed shrinkage for 18.3%k mixture ............... 229
Figure B-16 – Unrestrained, unsealed shrinkage for 25.3%k mixture ............... 230
Figure B-17 – Unrestrained, unsealed shrinkage for 29.3%k mixture ............... 230
Figure B-18 – Unrestrained, unsealed shrinkage for 33.0%k mixture ............... 231
Appendix C Figures
Figure C-1 – All restrained, sealed shrinkage measurements .......................... 238
Figure C-2 – Restrained, sealed shrinkage for 0.0% mixture ........................... 238
Figure C-3 – Restrained, sealed shrinkage for 3.8%k mixture ......................... 239
Figure C-4 – Restrained, sealed shrinkage for 7.3%k mixture ......................... 239
Figure C-5 – Restrained, sealed shrinkage for 11.0%k mixture........................ 240
Figure C-6 – Restrained, sealed shrinkage for 14.3%k mixture........................ 240
Figure C-7 – Restrained, sealed shrinkage for 25.3%k mixture........................ 241
Figure C-8 – All restrained, unsealed shrinkage measurements ...................... 247
Figure C-9 – Restrained, unsealed shrinkage for 0.0% mixture ....................... 247
Figure C-10 – Restrained, unsealed shrinkage for 7.3%k mixture .................... 248
Figure C-11 – Restrained, unsealed shrinkage for 11.0%k mixture .................. 248
Figure C-12 – Restrained, unsealed shrinkage for 14.3%k mixture .................. 249
Figure C-13 – Restrained, unsealed shrinkage for 25.3%k mixture .................. 249
Figure C-14 – Restrained, unsealed shrinkage for 29.3%k mixture .................. 250
Figure C-15 – Restrained, unsealed shrinkage for 33.0%k mixture .................. 250

xxiv
LIST OF ABBREVIATIONS AND VARIABLES
Al2O3 Aluminum oxide (chemical)
αmax Expected maximum degree of hydration (ratio)
ASTM American society for testing and materials (Organization)
C2S Dicalcium silicate (chemical)
C3A Tricalcium aluminate (chemical)
C3S Tricalcium silicate (chemical)
C4AF Tetracalcium Aluminoferrite (chemical)
CaO Calcium oxide (chemical)
CCD Charged coupled device (equipment)
CCR Crack reducing ratio (ratio)
Cf Cement content (kg/m3 )
CoCL2 Cobalt(II) chloride (chemical)
CRCA Crushed returned concrete aggregate (material)
CS Chemical shrinkage (g/gcement )
d Pore diameter (m)
εp Shrinkage strain of concrete (μm/m)
εp Shrinkage strain of cement paste (μm/m)
Ea Elastic modulus of the aggregate (MPa)
Ec Elastic modulus of the concrete (MPa)

xxv
FDD Focus to detector distance (mm)
Fe2O3 Iron oxide (chemical)
surface tension (N/m)
HDPE High density polyethylene (material)
HPC high performance concrete (material)
HRWRA High range water reducing admixture (material)
IC Internal curing (method)
Imeasured Transmitted x-ray intensity (counts/second)
Io Incident x-ray intensity (counts/second)
K Paste of mortar bulk modulus (Pa)
keV kiloelectron volt (keV)
Ks Solid skeleton bulk modulus (Pa)
LVDT Linear variable differential transformer (equipment)
LWA Lightweight aggregate (material)
LWA-H Haydite lightweight aggregate (material)
LWA-K Kenlite lightweight aggregate (material)
MgO Magnesium oxide (chemical)
MIP Mercury intrusion porosimetry (equipment)
MLWA Mass of dry lightweight aggregate (kg/m3)
n Aggregate stiffness term (unitless)
nFA Aggregate stiffness term for fine aggregate (unitless)
nFA Aggregate stiffness term for fine lightweight aggregate (unitless)
Na2O Sodium oxide (chemical)

xxvi
NIST National institute of standards and technology (Organization)
ODD Object to detector distance (mm)
OPC Ordinary portland cement (material)
P Pressure (Pa)
ϕLWA Absorption capacity of lightweight aggregate (%)
μA Microampere (μA)
μLWA Linear attenuation coefficient of lightweight aggregate (cm-1)
μm Micrometer (μm)
μPaste Linear attenuation coefficient of cement paste (cm-1)
μV Linear attenuation coefficient of vapor voids (cm-1)
μW Linear attenuation coefficient of water (cm-1)
r radius of curvature of the menisci (m)
R Universal gas constant (J/mol•K)
RH Relative humidity (%)
S Degree of saturation (unitless)
σcap Capillary pressure (Pa)
SiO2 Silicon dioxide (chemical)
SLWA Prewetted lightweight aggregate (material)
SO3 Sulfur trioxide (chemical)
t thickness of the sample (cm)
T Thermodynamic temperature (K)
Θ Liquid-solid contact angle (radians)
νc Poisson’s ratio of concrete (unitless)

xxvii
νa Poisson’s ratio of aggregate (unitless)
VFA Volume fraction of fine aggregate (%)
VLWA volume proportions of lightweight aggregate (%)
Vm Molar volume of the pore solution (m3/mol)
VPaste volume proportions of cement paste (%)
VV volume proportions of vapor voids (%)
VW volume proportions of water (%)
w/c Water-to-cement ratio (mass fraction)

1
CHAPTER 1. INTRODUCTION, OBJECTIVES, AND APPROACH
1.1. Introduction
Water is a necessary component of the cement hydration reaction. The
hydration reaction is responsible for the conversion of the gray cement powder
into the binding cement paste which gives concrete its strength. It is well known
in concrete construction that a 'proper curing period' is essential at early ages to
enable the concrete to gain strength, to reduce shrinkage, and to develop a
structure that will make the concrete sufficiently durable.
While water curing supplies additional water that the concrete can absorb at early
ages when it undergoes the largest part of the hydration reaction, practical
considerations frequently do not allow structures to be ponded with water for the
first two weeks or month after construction. As a compromise many pavements
and bridge components are coated with a 'curing compound' after casting which
slows or eliminates the loss of water from the concrete, however it does not
provide any additional water. The application of this curing compound can be
problematic for two reasons. First, it is difficult to determine whether it has been
applied correctly or with sufficient attention until it is too late. Second, and more
importantly in higher performance concretes (HPC), the lack of water addition
leads to concretes that are 'water-starved' causing them to undergo self-
desiccation (RILEM Report 41 2007).

2
This self-desiccation results in concrete that 'dries out internally' resulting in
hindered strength development, reduced durability, and the potential for
autogenous shrinkage and cracking. Self-desiccation occurs even in concretes
where the curing compound has been applied correctly. The concept of self-
desiccation has been a topic of recent interest in the concrete community and
has even led to a series of workshops specifically devoted to this topic (1997,
1999, 2002, 2005).
Weber and Reinhardt (Weber et al. 1995) showed that additives could be used to
store internal water in concrete which can be used to 'self-cure' the concrete.
Since that time it has been shown that certain cellulose fibers (Mohr et al. June
2005), lightweight aggregates (Zhutovsky 2002; Lura 2003; Holm et al. August
2000), and absorbent polymers (Bentz et al. 2004) can be used as these
additives. While these technologies are rapidly being proposed in literature, they
are not rapidly added to concrete specifications. In addition, these materials are
not always designed from a scientific perspective; consequently these materials
are not always designed in the most efficient fashion.
Lightweight aggregate has been used in concrete for over a century as a method
to reduce the self-weight (ESCSI 1971), however its use as an internal curing
(IC) agent is a more recent development (Philleo 1991; Jensen et al. 2001b;
Bentz et al. 2008b). Research for the last decade has focused on the laboratory
measurements of autogenous deformation of these mixtures (Jensen 2005).
State Departments of Transportations (DOTs) are beginning to consider the
beneficial effects of using internal curing (Delatte et al. 2007; Weiss et al. 2007).
However more needs to be understood about these materials to take them from
laboratory concepts to field realities.

3
In 2007 RILEM released a comprehensive State-of-the-Art Report (STAR) on
internal curing which primarily focused on unrestrained autogenous deformation
(RILEM 2007). The STAR report is one of the first documents to compile the
major research effort that has taken place in this area. Although this report is
extremely useful, it focuses primarily on fundamental concepts and unrestrained
shrinkage in sealed conditions. The STAR report suggested that more research
is needed in several areas. For example, page 139 stated that “…drying
shrinkage is not the central focus of the report and this problem needs to be
given proper treatment and solved in the future.” On page 140, it is stated that
more information is needed about “…relation of early age concrete behavior and
the durability of mature concrete.” Although not explicitly stated in the RILEM
report, another area where more research is needed is in the potential for using
internal curing to delay or prevent the formation of plastic shrinkage cracks as
this has been alluded to by Holm et al. (2003) but not shown. This research can
be used to help determine the proportions of LWA used as an internal curing
agent needed to reduce shrinkage in sealed and unsealed curing conditions.
This research is not intended to be a repeat of previous work, but rather it is
intended to show the influence of internal curing in areas were more research is
needed. The desire to move internal curing from the laboratory to the field and
the need for more research in these areas is the impetus for this work.
1.2. Research Objectives
The main objectives of this project are to provide information on development,
manufacture, and performance of self-curing concrete made using local
materials. Local materials are characterized to demonstrate which materials
show the greatest potential for use in the production of self-curing concrete. High

4
performance concrete mixtures are developed with self-curing capabilities using
typical local materials. The benefits of self-curing are evaluated using both small
and large scale laboratory testing. Finally, technology transfer has been
performed to enable these materials to be developed, specified, and
implemented in Indiana.
1.3. Research Approach
The goal of this project was to provide the Indiana Department of Transportation
(INDOT) with information on the development, manufacture, and performance of
self-curing concrete made using local materials. Specific tasks considered in
this project are outlined as follows:
1.3.1. Task 1: Literature Review
The first task of this study was to perform a review of literature pertaining to the
development, testing, and use of self-curing concrete. The main objective of this
review was to:
Assemble papers related to the development of self-curing concrete. This
included information about previous scientific developments, mixture
proportioning procedures, materials that have been used successfully,
and applications of self-curing concrete. This study was expedited with
information from the RILEM state of the art report on self-curing concrete.
Assemble a complete listing of test procedures to evaluate self-curing
concrete. The procedures were reviewed both based on their ability to
determine theoretically fundamental properties as well as the ability to be
used for performing practical field tests.

5
Assemble information on the locally available constituent materials and
concrete mixture proportions that would be available for the production of
self-curing concrete.
1.3.2. Task 2: Characterization of Local Materials
Task 2 details important physical properties of the LWA that are needed so that
the LWA can be used as an effective internal curing agent. The two main
physical properties of the LWA are that the LWA must be able to absorb a large
volume of water and be able to desorb (i.e., give back) that water to the concrete
as self-desiccation occurs. The testing procedures used to determine these
properties of lightweight aggregate; most specifically focusing on absorption
procedures is presented. Highlighted in this task are the inadequacies of these
testing procedures, the variability which can result, and the influence of these
properties on the shrinkage performance. The results of Task 2 are presented in
CHAPTER 2 of this report.
1.3.3. Task 3: Evaluating Self-Curing Concrete Made with Local Materials
Numerous laboratory methods were utilized to evaluate self curing concrete
made with local materials. This task is divided into the following sections which
each consist of a separate chapter within this report as indicated below.
CHAPTER 3 - Mechanisms of Internal Curing: The mechanism which
drives internal curing, specifically the creation of vapor filled voids due to
self-desiccation is discussed. The process of using LWA as an agent to
supply water to fill the voids is described. As such, the IC water can be
described in three main ways: (1) the volume of water available for IC, (2)
the ability of the water to leave the prewetted lightweight aggregate
(SLWA) when needed for IC, and (3) the distribution of the SLWA so that it

6
is well-dispersed and its water can readily travel to all of the sections in
the paste where it is needed. The difference between the behavior of
sealed and unsealed systems is discussed.
CHAPTER 4 - Monitoring Water Movement From Prewetted Lightweight
Aggregate Using X-Ray Absorption: This section examines the timing of
the release of water from prewetted lightweight aggregate and the
distance that water can travel using x-ray absorption. Experimental details
associated with the x-ray technique are provided to describe the
importance of specimen alignment. The importance of water movement is
discussed in terms of mixture proportioning and its influence on shrinkage
and stress development.
CHAPTER 5 - Shrinkage of Cementitious Systems Containing Prewetted
Lightweight Aggregate: The shrinkage behavior of IC in mixtures using
composite models such as Pickett’s equation and Mackenzie’s equation is
discussed. The results indicate that while the inclusion of prewetted LWA
reduces the stiffness of the mortar, the reduction in shrinkage of the paste
due to the supply of additional water is more crucial in reducing the overall
shrinkage of the mortar. The size of the pores emptied due to self-
desiccation is calculated and used to describe the shrinkage of mortar
using Mackenzie’s equation.
CHAPTER 6 - Measuring Volume Change and Cracking Under Sealed
and Unsealed Conditions: This section provides measures of
unrestrained shrinkage for mortars made with different volume
replacements of LWA under sealed and unsealed curing conditions. In
addition, this section assesses the cracking potential of mixtures that are
restrained from shrinking freely. This section presents data for the
mixtures made with different volume replacements of SLWA. The results
indicate the inclusion of a sufficient volume of SLWA can significantly

7
reduce self-desiccation, reduce autogenous shrinkage, and delay the time
to cracking.
CHAPTER 7 - Plastic Shrinkage Cracking in Mixtures Containing
Prewetted Lightweight Aggregate: IC mixtures are measured for its effect
on plastic shrinkage properties. Settlement and plastic shrinkage cracking
are investigated. The results indicate that when LWA is added to
concrete, the formation of plastic shrinkage cracks are reduced. The
crack widths of mixtures with LWA were reduced and if sufficient volume
of LWA was used, the cracks could be eliminated.
CHAPTER 8 - Monitoring Water Absorption in Cementitious Systems
Made With Prewetted Lightweight Aggregate: This section provides
measures of the performance of IC mixtures under different curing
conditions in fluid absorption tests. The results indicate that the
absorption is reduced with increasing replacement volume of LWA. It is
indicated that several possible explanations exists for this. Mixtures with
IC show an increased degree of hydration which will reduce the
interconnectivity of the pore structure. The dense interfacial transition
zone between LWA and cement paste may prohibit water from being
absorbed back into LWA.
CHAPTER 9 - Mechanical Properties of IC Systems Made with Prewetted
Lightweight Aggregate: This section provides measures of the
compressive strength, split tensile strength, and elastic modulus of IC
mixtures under differing replacement volumes of LWA. The results
indicate that increasing the replacement volume of LWA decreases the
stiffness and strength of mixture.
CHAPTER 10 - The Effect of Temperature Change on IC Systems Made
with Prewetted Lightweight Aggregate: The majority of testing in this
report was performed in isothermal conditions. Shrinkage induced by

8
temperature change is important because it is additive to the other volume
changing mechanisms such as autogenous and drying shrinkage.
Thermal shrinkage may cause the overall shrinkage behavior of the
concrete to crack when restrained. The sensitivity of thermal cracking in
IC mixtures was studied using a newly developed dual restraining ring
testing device. Mixtures with IC show a decreased propensity to early age
thermal cracking due to the combined effects of reduced residual stress
from autogenous shrinkage and lower modulus of elasticity.
CHAPTER 11 – Evaluating Internally Cured Mixtures With a Temperature
Drop Approach: This section presents a temperature reduction technique
using the dual ring device presented in CHAPTER 10 to quantify the
reserve cracking strength of a fresh mixture over the first of several days
after casting. Data is presented that show using lightweight aggregate
reduces early age cracking propensity.
CHAPTER 12 – Freeze Thaw Resistance of Mixtures Containing
Prewetted Lightweight Aggregate: This section outlines testing performed
to quantify the freeze thaw performance of high performance mixtures
containing prewetted lightweight aggregate. Experimental results are
presented that show freeze thaw performance of the given low w/c
mixtures is neither enhanced nor reduced by the addition of lightweight
aggregate.
1.3.4. Tasks 4 and 5: Full Scale Trial Batch and Testing
The results of the tests performed in Task 3 were analyzed and used for the
development of a full scale batch of IC concrete that was used in a newly
developed large scale slab cracking device. The details of this testing device are
discussed in CHAPTER 13. Results of testing indicate that IC improved the
cracking propensity of the concrete mixture.

9
CHAPTER 2. CHARACTERIZATION OF LOCAL MATERIALS
2.1. Introduction
Many of the advancements in concrete technology have come from a better
understanding of cement chemistry and the introduction of supplementary
cementitious materials or chemical admixtures. These materials however, only
typically occupy a minor part of the volume of concrete. The majority of the
volume of concrete is occupied by aggregate. In conventional concrete mixtures,
the aggregate is relatively inert and intended to be stable. New methods are
being developed where the aggregate plays an integral role in the development
of the paste microstructure. This method, known as internal curing, uses
prewetted lightweight aggregate as a shrinkage mitigation strategy to reduce the
effects of self-desiccation (RILEM 2007; Henkensiefken et al. 2008b).
The benefits of internal curing as a shrinkage mitigation strategy is well
documented in laboratory studies (Jensen et al. 2001a; Zhutovsky et al. 2002;
Lura 2003a; Cusson et al. 2006; Lopez et al. 2008; Henkensiefken et al. 2008b;
Radlinska et al. 2008b). Several departments of transportations are now
considering internal curing (Weiss et al. 2007; Bentz et al. 2008b).
In internal curing (IC), the aggregates are not considered to be inert; rather they
play an integral role in hydration. To properly proportion mixtures to obtain the
benefits of internal curing, it is essential that the properties of LWA be well
understood. The absorption and desorption properties of LWA are two of the

10
properties that are important in determining the effectiveness of LWA as an
internal curing agent (Kim et al. 2008; Radlinska et al. 2008b). However, the
current techniques for determining these properties are not clear and can lead to
significant variability (Kleiger et al. 1994). This chapter will discuss different
measurement techniques to determine the absorption and pore size distribution
of LWA. The implications on the variability of these measurements on the
shrinkage performance will be presented. This paper will also present
information on selecting LWA which has properties which will be beneficial in
internal curing.
2.2. Techniques for Determining the Absorption of LWA
Low water-to-cement ratio mixtures tend to self-desiccate. Traditional curing
techniques have proven to be ineffective to provide extra water because the low
permeability of these mixtures does not allow significant penetration of external
water (Sant et al. 2008a). Prewetted inclusions, typically LWA, have been
introduced into the mixture to uniformly distribute the water internally. Bentz and
coauthors (Bentz et al. 1999b; Bentz et al. 2005) presented an equation to
determine the amount of LWA needed to counteract the effects of self-
desiccation.
LWA
fLWA S
CSCM
max Equation 2-1
where: MLWA (kg/m3 or lbs/yd3) is the mass of LWA (in a dry state) that needs to
be prewetted to provide water to fill in the voids created by chemical shrinkage,
Cf (kg/m3 or lbs/yd3) is the cement content of the mixture, CS (g of water per g of
cement or lb of water per lb of cement) is the chemical shrinkage of the cement,
αmax (unitless) is the expected maximum degree of hydration (0 to 1), S (unitless)
is the expected degree of saturation of the LWA (0 to 1), and ΦLWA (kg of
water/kg of dry LWA or lb/lb) is the absorption capacity of the LWA. One critical

11
aspect of this equation is to be able to properly determine the absorption capacity
of the LWA. If the absorption is not determined correctly, an incorrect volume of
LWA would be added to the mixture which could prove to be too little or too much
LWA. The correct absorption must be determined to optimize the mixture.
However, determining the absorption of the LWA is difficult using current
techniques. The following section will discuss the most common techniques. It
should be noted that in these techniques, 24 h absorption is often taken to be
saturated1. This however is not entirely accurate since the pore structure of LWA
allows the LWA to absorb water for an extended period of time (Holm et al.
2006). Depending on the aggregate, this time could be several weeks or
months. The term “prewetted” in this report refers to the 24 h absorption of the
LWA.
Four different aggregates were used in this study. Two of the aggregates were
manufactured rotary kiln expanded shale LWA, designated as LWA-K and LWA-
H. They had an apparent specific gravity of 1.56. The approximate chemical
composition of the expanded shale is 57.6 % SiO2, 9.6 % Fe2O3, 19.4 % Al2O3,
3.4 % CaO, 2.6 % MgO, 0.6 % SO3 and 5.6 % Na2O by mass fraction (HPB
2004). The third aggregate was a crushed returned concrete aggregate (CRCA)
and it had a specific gravity of 2.04 (Kim et al. 2008). The key difference
between these aggregates is how the pore volume is created. During the
manufacturing of the LWA the gases expand in the shale which creates an
interconnected pore network (ESCSI 1971). Crushed returned concrete
aggregate on the other hand has a pore structure similar to that of cement paste
1 The term saturated is used to describe the degree of saturation in the LWA. It
does not necessarily indicate all pores in the LWA are filled with water.

12
since paste provides the primary pore-containing component in the crushed
paste/aggregate product. The fourth aggregate is a conventional aggregate that
is natural river sand with an apparent specific gravity of 2.58. The gradation of
the two LWA used can be seen in Figure 2-1.
5 4 3 2 1 0Sieve Opening (mm)
0
20
40
60
80
100
Per
cen
t P
assi
ng
(%
)
LWA-KLWA-H
Figure 2-1 – Gradation of LWA-K and LWA-H
2.2.1. ASTM C128
One of the most commonly used methods to determine the absorption of
aggregate is ASTM C128. It should be noted that this standard is not intended to
be used for determining the absorption of LWA as stated in section 1.3 and 5.5 of
the standard (2007), however in lieu of a more appropriate method for LWA, it is
commonly used. The sample is immersed in water for 24 h after which time the
water is decanted and the surface of the aggregate is dried. The difficulty that
arises is determining when there is no more surface moisture on the aggregate.
Three different procedures are suggested in the standard to determine this
condition; the standard cone test, the provisional cone test and the paper towel
test. The cone tests are similar to each other; however the compaction method

13
is slightly different. In the standard cone test, aggregate is placed in a cone (like
a slump cone for concrete, but smaller) and tamped 25 times. The provisional
cone test still involves tamping the aggregate 25 times, however aggregate is
added at intermediate times and tamped. Both cone tests rely on the principle of
surface tension for determining when the surface moisture disappears. When
moisture is still on the surface of the aggregate, surface tension of the water will
hold the particles in the form of the cone after the cone is removed. When no
moisture is present on the surface, slight slumping of the aggregate will occur.
An example of slight slumping is shown in Figure 2-2. The paper towel method
involves touching a paper towel to the aggregate and when it appears the paper
towels is no longer picking up moisture from the aggregate, a surface dry
condition has been reached.
At least two potential issues arise from these cone tests. The first is that LWA is
typically manufactured and crushed, resulting in angular aggregate. The
angularity of the aggregate could lock the particles together such that when the
cone is lifted the shape is retained after surface moisture is gone. The larger
issue is that slight slumping is a subjective term and the variation of absorption
for person to person could be rather large. The 24 h absorption for LWA-K using
the standard cone test was determined to be 10.5 % with a standard deviation of
0.15 %. The vacuum absorption for LWA-K using the standard cone test was
determined to be 15.0 % with a standard deviation of 0.15 %. A full list of the
absorption values for different testing methods can be found in Table 2-1.

14
Figure 2-2 – Slight slumping of LWA using the standard cone test in ASTM C128. The slight slumping indicates no surface moisture on the LWA
Table 2-1 – Absorptions of different LWA using different methods
LWA-H CRCA Sand24 h Vacuum 24 h 24 h 24 h
-
1.0%
1.8%
1.7%
1.9%
0.8%
-
3.1%
9.8%
8.8%
17.5%
1.1%
-
Pycometer Method
7.9% N/A 5.7%
5.8%
4.6%
15.7%
1.0%
24.9%
11.0% -
C128 Provisional Cone MethodC128 Paper
Towel MethodAbsorption Rate
MethodCobalt Chloride
Method
MethodLWA-K
5.0% N/A
10.5% 15.0%
14.3%9.4%
20.8%
C128 Cone Method
2.2.2. Cobalt(II) Chloride Method
Cobalt(II) chloride (CoCl2) can be used to indicate the state of moisture in
aggregate (O'Neil et al. 2001). Cobalt(II) chloride changes color in the presence
of moisture from blue in the anhydrous (i.e., dry) form to pink when it reacts with

15
water. This test was performed with LWA used in conjunction with the ASTM
C128 test. Portions of LWA-K were removed and cobalt(II) chloride in powder
form was scattered on the surface of the aggregate. An image was captured
after 1 min of placing the cobalt(II) chloride on the surface of the aggregate.
After the photo was taken, the cobalt(II) chloride was removed from the surface
of the aggregate and the aggregate was placed in the oven to determine the
moisture content. When there is a higher moisture content, more water is on the
surface of the aggregate and therefore more water can react with the cobalt(II)
chloride, resulting in a deeper red color. As the aggregate dries and the moisture
content decreases a lower extent of reaction occurs resulting in the cobalt(II)
chloride appearing more blue.
The images of cobalt(II) chloride on the surface of the aggregate were analyzed
in ImageJ© image processing software. The original RGB images were split into
three separate images according to the red, green and blue color. The area of
the cobalt(II) chloride on the surface of the aggregate of the blue image was
selected and the average hue of the cobalt(II) chloride was determined. Figure
2-3 shows the average hue of blue obtained from the image analysis as a
function of the moisture content in the aggregate. The average hue will increase
since unreacted (i.e., dry) cobalt(II) chloride is blue and only the blue image was
processed. An image was also captured of cobalt(II) chloride in the unreacted
(i.e, dry) state as to determine the upper bound of the hue of blue. The upper
bound represents the theoretical maximum hue that could be reached. The
aggregate begins to reach this value at low moisture contents. This is because
no water is on the surface of the aggregate to react with the cobalt(II) chloride. A
lower bound was also determined by combining cobalt(II) chloride with water and
letting a complete reaction take place. The towel method and standard cone
method are also shown on Figure 2-3. The color change does not appear to
begin to stabilize (which would indicate no water is on the surface) until

16
approximately 11 %. This is close to the 10.5 % indicated by the standard cone
method.
30 25 20 15 10 5 0Moisture Content (%)
0
20
40
60
80
100
120
140
160
180
Ave
rag
e H
ue
of
Blu
e
LWA-K (Graded)
ASTM C128Towel Method
ASTM C128Standard Cone
Method
Upper Bound
Lower Bound
Figure 2-3 – Average hue of blue at different moisture contents for LWA-K using the Cobalt(II) Chloride method
2.2.3. Absorption Rate Method
The previous two methods rely on the disappearance of surface moisture for
determining the absorption capacity of the LWA. Other methods that exist
involve immersing the aggregate in water and monitoring the mass of water
absorbed. One method explored was immersing aggregate in a water bath and
monitoring the change in mass as water was absorbed. Using this method, the
absorption rate of the LWA was determined. The schematic of the setup for this
experiment can be seen in Figure 2-4. The LWA was oven-dried and immersed
in water maintained at 23.0 ºC ± 0.1 ºC and the weight was recorded using a
balance with a sensitivity of 0.0001 g in 1 min intervals. The absorption for
different particle sizes of LWA-K and a graded sample can be found in Figure
2-5(a). The larger the particle size, the higher the absorption, however particle

17
sizes smaller than 0.60 mm appear to have similar absorption rates. The
absorption of the graded sample at 24 h is approximately 5.0 %.
Figure 2-5(b) shows the absorption of the graded sample along with the
theoretical absorption of a sample if the individual grain size absorptions were
combined. The theoretical absorption was calculated by combining the
absorption of each of the different grain sizes and the gradation of the LWA. The
absorption of the two methods are similar. Figure 2-5(c) shows the absorption of
the particles divided by the particle diameter. The absorption rate plotted as a
function of the square root of time is shown in Figure 2-5(d). This plot shows a
linear relationship between the absorption and the square root of time.
One drawback to this test method is that measurements cannot start immediately
when the LWA starts to absorb water. This is because the water needs to be
added slowly to the sample so no particles are lost. If the water is added too
quickly, the particles will be flushed out of the dish because of the sudden rush of
water. This results in the first 15 s of absorption not being captured. This
missing data could explain why this method yields a lower absorption at 24 h
than other methods.
Water Sample
Balance
Figure 2-4 – Experimental Setup for the absorption rate method

18
0 24 48 72 96 120 144 168Elapsed Time (h)
0
5
10
15
20
25
Per
cen
t A
bso
rpti
on
(%
)
2.36 mm1.18 mm0.60 mmGraded
0 24 48 72 96 120 144 168Elapsed Time (h)
0
5
10
15
20
25
Per
cen
t A
bso
rpti
on
(%
)
Graded (From Particle Sizes)Graded
(a) (b)
0 24 48 72 96 120 144 168Elapsed Time (h)
0
5
10
15
20
25
Per
cen
t A
bso
rpti
on
Div
ided
b
y P
arti
cle
Dia
met
er(%
/mm
) 2.36 mm1.18 mm0.60 mm
0 2 4 6 8 10 12 14Square Root of Elapsed Time (h0.5)
0
5
10
15
20
25
Per
cen
t A
bso
rpti
on
(%
)
2.36 mm1.18 mm0.60 mmGraded
(c) (d)
Figure 2-5 – (a) the absorption of different grain sizes of LWA-K along with a graded sample, (b) the absorption of the graded sample along with a graded sample reconstructed for the individual grain size absorption, (c) absorption
divided by the particle diameter as a function of time (d) the absorption of LWA-K as a function of the square root of time

19
2.2.4. Pycnometer Method
Another method which does not involve drying the aggregate until surface
moisture is gone is the pycnometer method. The pycnometer used is shown in
Figure 2-6, and had a volume of 50 mL. When the stopper is put in, any water in
excess of 50 mL is forced out through the small capillary opening in the stopper,
resulting in a constant volume of 50 mL. A known mass of oven-dried aggregate
was placed in the pycnometer to which deionized water was added. The
pycnometer was quickly shaken to remove the air bubbles, and the stopper was
inserted resulting in a volume in the pycnometer of exactly 50 mL. As the LWA
absorbs water, the volume in the pycnometer falls below 50 mL. After 24 h,
water was added to the pycnometer to fill in the space of the water absorbed by
the LWA. The 24 h absorption of LWA-K was determined to be 7.9 % with a
standard deviation between measurements of 0.15 %.
The drawback to this method is that there was approximately 15 s between the
time water was added the time the stopper was inserted, so again the initial
absorption was not captured. Black (Black 1986) and Saxer (Saxer 1956)
suggested that attempts to measure aggregate absorptions by immersion
techniques will not succeed unless it is possible to begin measuring milliseconds
after the aggregate comes in contact with water. This could explain the lower
absorptions measured by these methods.

20
Pycnometer
StopperCapillaryTube
Figure 2-6 – Pycnometer used to determine absorption of LWA
2.2.5. Comments and Recommendations
From Table 2-1, it can be seen that the results between these techniques can
vary substantially. The immersion techniques yield a lower absorption than the
drying techniques. This is because the initial absorption cannot be captured, and
these techniques should not be used unless this period can be accurately
captured. The drying techniques seem to produce similar results, however it
cannot be substantiated that this is the true absorption value. Further efforts are
needed to determine the actual absorptions of LWA since they can have an
effect on the shrinkage performance. This effect will be discussed in 2.4.
2.3. Techniques for Determining the Pore Size Distribution
Not only is it important that the LWA absorb a significant portion of water to be
effective, it must be able to release that water to the cement paste. One key
feature that is needed for a LWA to be an effective internal curing agent is that it

21
must have pores that are larger than the pores of the cement paste. This
enables the LWA to release its water at high relative humidities as the cement
paste self-desiccates. Two methods are commonly used to determine if a LWA
posses these properties. These two methods will be discussed in the following
sections.
2.3.1. Mercury Intrusion Porosimetry
Mercury intrusion porosimetry (MIP) was used to estimate the pore size
distribution of LWA-K and LWA-H. Mercury intrusion porosimetry is based on the
principle that a non-wetting liquid will only intrude capillaries under pressure. The
relationship between the pressure and capillary diameter is described by the
Washburn equation (Washburn 1921) (Equation 2-2).
dP
cos4 Equation 2-2
where: P (Pa) is the pressure, γ (N/m) is the surface tension of mercury, θ
(radians) is the contact angle (assumed to be 117 degrees), and d (m) is the
diameter of the pore being intruded with mercury. Using the Washburn equation
the pore size distribution was determined for LWA-K and LWA-H. Figure 2-7(a)
shows the results of MIP for the LWA along with a 7 d old w/c 0.30 cement paste.
From this it can be seen that the pores of the LWA are larger than the pores of
the cement paste. The major advantage of using MIP for determining the pore
size distribution is that it is a simple and quick technique.
There are several drawbacks of using mercury intrusion porosimetry for
determining the pore size distribution (Diamond 2000). The first is that the
Washburn equation assumes cylindrical interconnected pores. As a result, MIP
provides a coarse determination of the pore size distribution for LWA. Mercury
intrusion porosimetry does not measure the true distribution of pore size

22
geometries. If large internal pores are accessible by very narrow openings, MIP
misrepresents the size of these pores as having the diameter of the openings,
this is known as the ink bottle effect (Diamond 1970; Lura 2003a).
There can also be significant particle-to-particle variation when using MIP to
determine the pore size distribution of LWA. Figure 2-7(b) shows the pore size
distribution of two single particles of LWA-K. Due to the firing and crushing
process during manufacturing, some particles will have lower and more closed
porosity (Spaulding 2007). In order to reduce the variability of the
measurements, multiple particles are placed in a single penetrometer, as to
determine the average of all particles. This method does introduce new
variability. As mercury is introduced into the penetrometer, the interparticle
spaces could be confused with pores of the LWA.
1 10 100 1000 10000 100000Pore Diameter (nm)
0.00
0.05
0.10
0.15
0.20
0.25
0.30
0.35
0.40
Cu
mu
lati
ve V
olu
me
(mL
/g) LWA-K
LWA-H24 h Paste
1 10 100 1000 10000 100000
Pore Diameter (nm)
0.00
0.05
0.10
0.15
0.20
0.25
0.30
0.35
0.40
Cu
mu
lati
ve V
olu
me
(mL
/g) Sample 1
Sample 2
(a) (b)
Figure 2-7 – Pore size distribution from mercury intrusion porosimetry for (a) LWA-K, LWA-H, and a 24 h old cement paste with a w/c of 0.30 and (b) two
different LWA-K samples showing the variation in pores of LWA particles

23
2.3.2. Desorption Isotherm
Figure 2-8(a) shows the desorption isotherm of LWA-K, LWA-H and CRCA. A
majority of water is lost at a high relative humidity (RH>96 %) for the LWA-K and
the LWA-H, implying the pores in the LWA are large (>25 nm) and the water is
available to be lost from the aggregate to the cement paste at high relative
humidities, which is preferred for internal curing. It is also important to note that
the samples release over 96 % of their moisture when a relative of humidity of
92 % is reached, which implies that the water will leave the pores of the LWA if a
large enough suction pressure (i.e., a low enough internal relative humidity)
exists. Less than half of the water in the CRCA is available at high relative
humidities, making it less suitable as an aggregate for internal curing (Kim et al.
2008). The pore size distribution can be back-calculated from the desorption
isotherm using the Kelvin-Young-Laplace equation. Figure 2-8(b) shows the
pore size distribution of LWA-K and LWA-H from MIP and the desorption
isotherm. It should be noted that each pore size distribution is normalized to its
own maximum cumulative volume. Figure 2-8(b) shows that MIP and desorption
isotherms yield similar pore size distributions for LWA. Additional recent studies
have utilized an automated machine called the Q5000 to determine the
desorption isotherm (Castro et al. 2010).

24
80 82 84 86 88 90 92 94 96 98 100Relative Humidity (%)
0
10
20
30
40
50
60
70
80
90
100
Per
cen
t o
f A
bs
orb
edW
ater
Re
mai
ng
(%
)
LWA-HLWA-K
CRCA
1 10 100 1000 10000 100000Pore Diameter (nm)
0.00
0.10
0.20
0.30
0.40
0.50
0.60
0.70
0.80
0.90
1.00
No
rmal
ized
Cu
mu
lati
veV
olu
me
(mL
/g)
LWA-K (Desorption)LWA-H (Desorption)LWA-K (MIP)LWA-H (MIP)
(a) (b)
Figure 2-8 – (a) desorption isotherm of different aggregate, and (b) the pore size distribution of the LWA determined from the desorption isotherm
2.4. Implications of These Properties on Shrinkage
2.4.1. Materials and Testing Procedures
Four mortar mixtures were made using different aggregate (LWA-K, LWA-H,
CRCA and normal weight sand) and the unrestrained shrinkage was measured
using the corrugated tube protocol (Sant et al. 2006). The mixture proportions
can be found in Table 2-2. The mixtures had a consistent volume of paste and a
portion of the normal weight fine aggregate was replaced with LWA. The 25.3%k
and 25.3%h mixtures had similar replacement volumes of LWA, but because the
LWA-H absorbs less water, it provides less additional water for internal curing.
The 25.3%k and 19.4%CRCA mixtures provided a similar volume of water but
because of the different absorption and specific gravities of the aggregates, the
amount of LWA used is slightly different. From a volumetric perspective, the
mixtures were the same. It should be noted that the 25.3%k and 19.4%CRCA
volume replacements correspond to the amount of LWA necessary to eliminate

25
self-desiccation from Equation 2-1 (Bentz et al. 1999b; Bentz et al. 2005) using
the absorption as determined from ASTM C128. Though there is a similar
absorption between the LWA-K and the CRCA, the difference in density requires
a different volume replacement between the LWA-K mixture and the CRCA
mixture.
Table 2-2 – Mixture proportions for LWA variability study
Material 25.3%k 25.3%h 19.4%CRCA
Cement (kg/m3) 728 728 728
Water (kg/m3) 218 218 218
Fine Aggregate (kg/m3) 808 808 917
Dry LWA (kg/m3) 369 369 396
Additional Water Provided
by LWA (kg/m3)
39 22 39
2.4.2. Results and Discussion
Figure 2-9 shows the unrestrained shrinkage measurements for the first 96 h.
The implication of the variability of the absorption can be shown by observing the
25.3%k and 25.3%h mixtures. While LWA-K and LWA-H have similar desorption
responses, LWA-H consistently absorbs less water than LWA-K using different
testing methods. The 25.3%k and 25.3%h mixtures show a similar expansion
during the first 12 h. However the 25.3%k mixture continues to expand while the
25.3%h mixture stabilizes. At this point the LWA-H has likely released a majority
of its water, while the LWA-K still retains water in its pores (Henkensiefken et al.
2008d).
The 19.4%CRCA has a vastly different shrinkage response from the other two
mixtures. This mixture has considerable shrinkage strain even though a large

26
amount of water is supplied. This is due to the different desorption response of
the CRCA. This aggregate releases 55 % of its water at high relative humidities
(> 92 %) as opposed to the other LWA that release 96 % of their moisture. Thus
it is important not only to select an aggregate that absorbs a large amount of
water, but is able to release that water at early ages.
0 24 48 72 96Age of Specimen (h)
-400
-300
-200
-100
0
100
200
300
Str
ain
(
)
25.3%k25.3%h19.4%CRCA
Figure 2-9 – Unrestrained shrinkage measurements for mortar made with different LWA during the first 96 h
2.5. Conclusions
This chapter has presented different techniques for determining the absorption
and pore size distribution of different LWA. The variability of the absorption
capacity obtained using different techniques was presented. Different methods
were presented, surface drying methods and submersion methods. Because of
the difficulty to capture the first seconds of absorption from submersion methods,
the submersion methods should not be used. The cobalt(II) chloride method and
the standard cone method provide similar results. The standard cone method is

27
a simple method and should be used in lieu of a more appropriate method. Two
different techniques for measuring the pore size distribution were presented. The
importance of the absorption capacity on the shrinkage performance was
presented. If the aggregate selected does not have the necessary properties,
the shrinkage performance can be adversely affected. Criteria for selecting
aggregates that will release water and thus be effective internal curing agents
were presented.

28
CHAPTER 3. MECHANISMS OF INTERNAL CURING
Water is released from water-filled prewetted lightweight aggregate (SLWA)
when it is used for internal curing. As such, the IC water needs to be described
in three main ways: (1) the volume of water available for IC, (2) the ability of the
water to leave the SLWA when needed for IC, and (3) the distribution of the
SLWA so that it is well-dispersed and its water can readily travel to all of the
sections in the paste where it is needed. This section provides a brief overview
of each of these topics.
3.1. Volume of Water Needed for IC
In order to determine the total volume of water that is needed for IC, two terms
must be defined, chemical shrinkage and autogenous shrinkage.
Chemical shrinkage, the primary cause of autogenous shrinkage and self-
desiccation, is a naturally occurring process that has been known for over 100
years (La Chatelier 1900; Powers 1935; L'Hermite 1960; Geiker 1983). Chemical
shrinkage describes the total volume reduction of the cement system occurring
during hydration of cement (Sant et al. 2006), since the volume of the hydration
products is less than the volume of the reactants. It has been reported that this
reduction can be as much as 8 % to 10 % by volume in a mature paste (Jensen
et al. 2001a; Jensen et al. 2001b). Chemical shrinkage describes the total
volume reduction of the system and is typically measured by placing cement
paste in water and measuring the volume change of the cement-water system

29
(Knudsen et al. 1982). When water is able to permeate the paste, it enables the
total volume change to be measured (it is important to note that in low w/c
systems the depercolation of the paste’s capillary porosity may occur and water
cannot travel through the paste) (Knudsen et al. 1982). Work by Sant has shown
that the depercolation occurs for a 3 mm cement paste sample with a w/c of 0.30
at approximately 24 h (Sant 2007). A typical chemical shrinkage result is shown
in Figure 3-1 for a paste with w/c of 0.30 by mass fraction (made with the same
cement as used in this study). While the buoyancy measurement technique was
used to obtain the data in Figure 3-1 (Sant et al. 2006), other procedures could
be used such as the ASTM C1608 standard test method for the measurement of
chemical shrinkage (2005).
0 1 2 3 4 5 6 7Age of Specimen (d)
0
0.01
0.02
0.03
0.04
0.05
Sh
rin
kag
e V
olu
me
(m
l/g
cem
en
t)
Chemical S hrinkageAutogenous Shrinkage
Created Void Space
Approxim ate Time of Set
Fin
al S
et
Fro
m V
icat
Figure 3-1 – Chemical shrinkage and autogenous shrinkage volumes during hydration of a paste with a w/c of 0.30 (Henkensiefken et al. 2008f)
Autogenous shrinkage can be described as the external volume reduction of a
cement paste as it hydrates (Jensen 2005). Before set, the volumes of chemical
shrinkage and autogenous shrinkage are the same. This occurs since the

30
system is fluid and collapses on itself as it shrinks (Barcelo et al. 2000;
Bjøntegaard et al. 2004; Sant et al. 2006). At the time of set, however, the
volumes of chemical shrinkage and autogenous shrinkage diverge, as shown in
Figure 3-1 (Henkensiefken et al. 2008f). The solidification of the matrix prevents
the bulk system from shrinking as chemical shrinkage occurs. This results in an
underpressure in the fluid that eventually cavitates vapor-filled space in the pore
system (Couch et al. 2006). As hydration proceeds, these voids grow and
penetrate smaller and smaller pores. The internal relative humidity can be
measured in these concretes to assess the pressure that develops in the fluid.
The concept in using SLWA for IC is that the SLWA can be used as internal
reservoirs that can reduce the pressure in the pore fluid by ‘replenishing the
vapor-filled voids,’ effectively eliminating their creation within the hydrating
cement paste. While strictly speaking, the volume of water that is needed is only
the difference between these curves, accounting for the behavior prior to set will
generally be only a minor correction and may be unnecessary for field
applications. Therefore, the volume of chemical shrinkage may be approximated
as the volume of water that needs to be supplied by the IC agent.
Bentz and Snyder (Bentz et al. 1999b) used this principle to develop a method to
estimate the volume of IC water that is needed and the mass of lightweight
aggregate (LWA) that is needed to hold the IC water (Bentz et al. 1999b; Bentz
et al. 2005).
LWA
fLWA S
CSCM
max Equation 3-1
where: MLWA (kg/m3 or lbs/yd3) is the mass of LWA (in a dry state) that needs to
be prewetted to provide water to fill in the voids created by chemical shrinkage,
Cf (kg/m3 or lbs/yd3) is the cement content of the mixture, CS (g of water per g of

31
cement or lb of water per lb of cement) is the chemical shrinkage of the cement,
αmax (unitless) is the expected maximum degree of hydration (0 to 1), S (unitless)
is the expected degree of saturation of the LWA (0 to 1) and was taken to be 1 in
this study when the LWA was soaked for 24 h, and ΦLWA (kg of water/kg of dry
LWA or lb/lb) is the absorption capacity of the LWA (taken here as the 24 h
absorption). An absorption period of 24 h was chosen to represent “saturated”
conditions in this study. Care must be taken when using the term “saturated”
when describing LWA. Because of the pore structure of LWA, it is likely that the
LWA is not in a truly saturated state. The pores of the LWA could continually
absorb water for several weeks or months if left submerged. When the term
“saturated” is used here, it is not intended to mean all the pores of the LWA are
filled with water, but rather to a specific degree of saturation (Henkensiefken et
al. 2008c). Further details can be found in chapter 2 of this thesis. A more
correct approach to determining ΦLWA would be to use the measured desorption
capacity of the LWA from saturation down to 92 % RH for example, as in an
actual concrete, since the LWA is initially “saturated” and undergoes desorption
during IC (Bentz et al. 2005).
3.2. Ability of Water to Leave the LWA
Water leaves the SLWA due to the suction (underpressure) that develops in the
pore fluid within the hydrating cement paste due to its chemical shrinkage and
self-desiccation. The consequence of this water movement from SLWA to
surrounding paste is frequently quantified in mortar as an increase in internal
relative humidity and an increase in the critical pore size that remains prewetted
(Lura 2003a; Henkensiefken et al. 2008f). The basic principle for internal curing
is that the largest pores will lose water first as the capillary stress that develops
will be minimized when pores are emptied in this order. The LWA pores are
generally larger than the pores of the surrounding cement paste. The pore size
distributions of hydrated cement paste at three different ages and of two different

32
LWA were determined using mercury intrusion porosimetry (MIP), the results of
which can be seen in Figure 3-2. Figure 3-2 demonstrates that the pores of both
the LWAs used in this study are larger than the pores of the cement paste, even
at early hydration ages. It should be noted that the maximum standard deviation
of the MIP results for the LWA and the cement paste (based on the total
absorption) was 0.03 mL per gram of sample and 0.01 mL per gram of cement,
respectively. Another important feature from the MIP pore size distribution is that
the pores of the paste decrease in size as the specimen ages (or as hydration
continues). As the pores in the paste decrease in size, the capillary pressure
that would develop upon their emptying increases, effectively increasing the
driving force that pulls water out of the LWA. This implies that as the specimen
ages, the hydrating paste can pull water out of successively smaller pores of the
LWA. Figure 3-3 illustrates desorption isotherms of two LWA (LWA-K and LWA-
H). The standard deviation between duplicate samples was 0.3 %. A majority of
water is lost at a high relative humidity (RH>96 %) implying the pores in the LWA
are large (>25 nm) and the water is available to be lost at high relative humidities,
which is preferred for internal curing. It is also important to note that the samples
release almost all (96 %) of their moisture when a relative of humidity of 92 % is
reached, which implies that the water will leave the pores of the LWA if a large
enough suction pressure (or a low enough internal relative humidity) exists. It
should be noted that this favorable desorption behavior is not characteristic of all
LWA (Lura 2003a).

33
1 10 100 1000 10000 100000Pore Diameter (nm)
0.00
0.05
0.10
0.15
0.20
0.25
0.30
0.35
0.40
Cu
mu
lati
ve V
olu
me
(mL
/g) LWA-K
LWA-H8 h Paste24 h Paste7 d Paste
Figure 3-2 – Pore size distribution for cement paste with a w/c of 0.30 at three different ages and for two different LWA measured using mercury intrusion
porosimetry
80 82 84 86 88 90 92 94 96 98 100Relative Humidity (%)
0
10
20
30
40
50
60
70
80
90
100
Per
cen
t o
f A
bso
rbed
Wa
ter
Re
mai
ng
(%
)
LWA-HLWA-K
Figure 3-3 – Desorption isotherm of two different LWA
The formation of the liquid-vapor menisci in the paste pores can ultimately lead to
shrinkage of the three-dimensional microstructure. These menisci represent a

34
suction pressure that developed in the fluid and is higher than the pressure in the
vapor. As a result, the radius of curvature of the meniscus (critical Kelvin radius)
that develops can be approximated as the size of the largest pore that is still
prewetted. The Young-Laplace equation can be used to relate the size of the
menisci to the capillary pressure (Equation 3-2):
rcap
)cos(2 Equation 3-2
where: σcap (Pa) is the capillary pressure, γ (N/m) is the surface tension of pore
fluid, θ (radians) is the liquid-solid contact angle (assumed to be 0 radians), and r
(m) is the radius of curvature of the meniscus or the pore size. It can be argued
that the smaller meniscus radius in the low w/c mixtures corresponds to a higher
capillary pressure, resulting in higher shrinkage. The capillary pressure can also
be related to the internal equilibrium relative humidity as represented by Kelvin’s
equation (Equation 3-3):
mcap V
RHRT )ln( Equation 3-3
where: R is the universal gas constant (8.314 J/mol·K), T (K) is the
thermodynamic temperature, RH (%) is the internal relative humidity, and Vm (≈
18×10-6 m3/mol) is the molar volume of pore solution. The capillary pressure that
develops can be related to material behavior such as the shrinkage strain, εp,
using a modified version of Mackenzie’s equation which is described in Equation
3-4 (Bentz et al. 1998):
scapp KK
S 11
3 Equation 3-4
where: S (unitless) is the degree of saturation of the cement paste, K (Pa) is the
paste’s or mortar’s bulk modulus, and Ks (Pa) is the modulus of the solid skeleton
of the cement paste or mortar. Mackenzie’s equation is not the only model that

35
can describe the shrinkage of cement paste. Recently another model has been
developed to describe the shrinkage of cement paste due to capillary stresses
(Vlahinic et al. 2008). Though Equation 3-4 describes the shrinkage of the paste,
the shrinkage of concrete can be described using Pickett’s Equation
(Henkensiefken et al. 2008f). The continued consumption of water due to
hydration results in the volume of vapor filled voids progressively increasing and
extending into smaller voids, corresponding to smaller radii of curvature. This
results in a continuous increase in the capillary pressure, a reduction in the
equilibrium relative humidity, and an increase in autogenous shrinkage.
As previously mentioned, the largest pores will empty first so that the LWA acts
as a sacrificial water reservoir that can be used to replenish the pores of the
paste. This concept is illustrated in Figure 3-4 (Radlinska et al. 2008b;
Henkensiefken et al. 2008e). In a sealed system without LWA, pores smaller
than a specific size (r1) will remain saturated. In a LWA system, the emptying
pores can be replenished from water in the LWA, provided the water is stored in
a larger pore (r2). It should be noted that this is for conceptual purposes and that
the pores of the LWA may eventually empty, depending on the extent of self-
desiccation/hydration. However, in that case, the size of the pores that are still
saturated will be larger in the LWA system than in the system without LWA.

36
Figure 3-4 – Conceptual illustration of the menisci formation in sealed and unsealed specimens made of plain and SLWA concrete (Henkensiefken et al.
2008e)
3.3. LWA Spacing
Knowing how much water is needed for IC (Section 3.1) and knowing how much
of that water will likely leave the aggregate (Section 3.2), the last issue that
needs to be understood is the distribution of the SLWA throughout the
microstructure. Even if a sufficient volume of water is supplied to a system, as
determined from Equation 3-1, if the distribution of the water (i.e., SLWA) is
insufficient, the system will likely exhibit poor shrinkage performance. This has
been shown by comparing the effectiveness of coarse SLWA and fine SLWA
when the same volume of water is considered (van Breugel et al. 2000;
Zhutovsky et al. 2002). Though the volume of water may be the same, the
distribution of the SLWA particles will be much different, resulting in a different
volume of protected paste (i.e., the volume fraction of the paste within a given
distance from a SLWA particle). The coarse SLWA proved to be less effective

37
than the fine SLWA even though they had the same volume of water because of
the increased spacing between the aggregate.
The concept of protected paste volume can also be applied when different
volumes of fine SLWA are considered. For a constant LWA particle size
distribution, when the volume of SLWA is increased, not only is the volume of
water increased, but the distribution of water is also improved, which results in a
larger fraction of protected paste. The effect of different volume replacements on
the protected paste volume was simulated using the hard core/soft shell model
developed at the National Institute of Standards and Technology (NIST) (Lu et al.
1992; Maekawa et al. 1999; Bentz et al. 1999a). The results of simulations for
the mortars investigated in this study are shown in Figure 3-5. Figure 3-5
describes the volume fraction of cement paste that is within a given distance from
the surface of a SLWA particle. It is not intended to show that the paste is
protected by internal water stored in the SLWA, since properties like absorption
and desorption of the aggregate as well as paste permeability would have to be
known to determine whether the water in the SLWA could reach the paste. As
the volume replacements are increased, the fraction of paste within a specified
proximity of a SLWA also increases. When lower replacements are incorporated
in a mixture, there is a rapid increase in the fraction of paste within 1.0 mm of a
SLWA particle. At low replacement volumes, if the water in the SLWA can travel
up to 1.0 mm, a majority of the paste will be protected. When higher replacement
volumes are used, a larger fraction of paste is within 0.20 mm, which may be
important at later ages (RILEM 2007). This is because water cannot travel as far
in a mature paste, and the distribution of the SLWA becomes important. This
implies that if water is able to travel a large distance, a low replacement volume
can protect a majority of the paste (assuming the SLWA can provide enough
water). However, if the water cannot travel large distances, a higher replacement
volume is needed to protect a majority of the paste.

38
0 5 10 15 20 25 30 35Volume Percent
Lightweight Aggregate
0
0.2
0.4
0.6
0.8
1
Fra
ctio
n o
f P
rote
cted
Pas
te
0.05 mm0.10 mm0.20 mm0.50 mm1.00 mm
Figure 3-5 – Volume fraction of paste within a specified distance of a SLWA. This plot does not show whether water can reach the paste. Volume and travel
distance of water need to be considered to determine this
Figure 3-6 shows the protected paste concept when the same volume
replacement of LWA is presented. Figure 3-6(a) indicates the protected paste
volume when coarse aggregate is used. Figure 3-6(b) has the same
replacement volume of aggregate; however the aggregate replaced is the fine
aggregate. A clear distinction can be made in the protected paste volume in
these two figures. Because of the better particle distribution, the fine aggregate
has more potential to protect the surrounding cement paste than coarse
aggregate. Using fine aggregate instead of coarse aggregate could have
implications on the strength of the mixture. Replacing the coarse normal weight
aggregate with coarse LWA could have detrimental effects on the strength of the
concrete. When dealing with higher strength concretes, the aggregate particles
will likely be the region of failure, and introducing large weak particles into the
system could reduce the strength. By replacing the fine normal weight aggregate

39
with fine LWA, the effects if including a weaker aggregate could be reduced since
the fine aggregate does not affect the strength of the concrete as much as the
coarse aggregate.
(a) (b)
Figure 3-6 – Illustrations showing the protected paste volume concept of two mixtures with similar LWA replacements volumes, but one replacement is of (a) coarse aggregate, and the other of (b) fine aggregate (Henkensiefken 2008a)
3.4. The Drying Mechanisms in Sealed and Unsealed Systems
3.4.1. Sealed System
As previously discussed, vapor-filled spaces are created in the paste due to
chemical shrinkage, as shown in Figure 3-7(a). The creation of vapor-filled
spaces results in the reduction of the internal relative humidity of a sealed
sample, called self-desiccation, and could be considered similar to ‘internal
drying’. In low w/c mixtures, the radius of curvature of these vapor-filled voids
would be smaller than in higher w/c mixtures due to the decreased interparticle
spacing, resulting in a significant shrinkage-inducing capillary tension (σcap) from
Equation 3-2.

40
3.4.2. Unsealed System
For an unsealed specimen that loses moisture externally, liquid-vapor menisci
also form (Radlinska et al. 2008b). However, in this case, they form at the
surface of the concrete. This is schematically shown in Figure 3-7b and Figure
3-7(c). Figure 3-7(b) shows a hypothetical case in which only external drying
occurs and self-desiccation is not included. Figure 3-7(c) shows a more realistic
picture of a cement paste that is unsealed at one surface. In this case, while
external drying occurs at the exposed surface, self-desiccation develops
throughout the interior of the material. This suggests that while a sealed
specimen only experiences internal drying (Figure 3-7(a)), an unsealed system
would simultaneously undergo both internal and external drying (Figure 3-7(c)).
The formation of a liquid-vapor menisci corresponds with a reduction in the
internal relative humidity of cement paste. In an unsealed specimen, as moisture
evaporates from the surface, the radius of the menisci continues to decrease.
This causes the drying front to penetrate into smaller openings and to gradually
grow from the surface towards the interior of the material. The internal relative
humidity is proportional to the menisci radius and thus decreases continuously as
drying progresses until the internal relative humidity of the cement paste reaches
equilibrium with the ambient relative humidity. Since any system will ultimately
come to equilibrium with the ambient relative humidity, this will occur at an equal
pore radius (r3), as illustrated in Figure 3-4. In an IC concrete however, the water
must leave the LWA first, which could result in a reduction in the rate of
shrinkage.

41
Figure 3-7 – Illustration of drying mechanisms in sealed and unsealed systems: (a) Sealed – only internal drying, (b) Only external drying, (c) Unsealed – internal
plus external drying (Radlinska et al. 2008b)

42
CHAPTER 4. MONITORING WATER MOVEMENT FROM PREWETTED LIGHTWEIGHT AGGREGATE USING X-RAY ABSORPTION
4.1. Introduction
Internal curing (IC), as described in this chapter, uses prewetted (water-filled)
lightweight aggregates (SLWA) to supply additional water to the cement paste as
it hydrates (Philleo 1991; ACI 2004). Internal curing can be used to produce a
dense crack-free microstructure, which is the desire of using a low w/c, by
supplying additional water to avoid the detrimental effects of autogenous
shrinkage (Jensen 2005). Significant research has been performed on the topic
of internal curing (Al-Khaiat et al. 1998; Jensen et al. 2001a; Lura et al. 2004;
RILEM 2007; Radlinska et al. 2008b; Henkensiefken et al. 2008e). Benefits of
internal curing have been shown to include reduced shrinkage of sealed concrete
(Lura et al. 2004; Henkensiefken et al. 2008e), increased compressive or flexural
strength (especially at later ages) (Al-Khaiat et al. 1998), reduced potential for
cracking (Radlinska et al. 2008b; Henkensiefken et al. 2008e) and increased
durability (RILEM 2007). Far fewer studies have been conducted to examine
other aspects of internal curing, including the timing of water release from the
lightweight aggregate and the distance the water travels through the surrounding
cement paste.
The goal of this study is to build on earlier studies (Bentz et al. 2006a; Lura et al.
2006a; Bentz et al. 2006b) and provide information that can lead to an improved
understanding of the timing and distance of water movement from prewetted
lightweight aggregates to the paste in concrete mixtures with internal curing.
Specifically, the objectives of this chapter are:

43
to use x-ray absorption measurements to trace changes in sample density
associated with moisture movement from prewetted lightweight aggregate
into the surrounding paste,
to demonstrate the importance of sample alignment in x-ray absorption
measurement and data interpretation,
to relate moisture transport with the time of paste solidification and chemical
shrinkage measurements,
to provide experimental measures of moisture transport distance from LWA
to the surrounding cement paste that can indicate how far water can travel in
a hydrating system, and
to show how particle spacing influences gradation selection, mixture
proportioning, and mixture design for IC concrete.
4.2. Background on Internal Curing
The volume of cementitious systems typically reduces as the cement reacts with
water (hydration). This process is called chemical shrinkage (La Chatelier 1900;
L'Hermite 1960; Sant et al. 2006). Before the paste hardens (sets), chemical
shrinkage causes the paste to collapse upon itself resulting in an external
reduction in volume (autogenous shrinkage) that is equal to the chemical
shrinkage. After the paste has set however, the system can no longer collapse
upon itself due to the resistance provided by the hardening paste structure.
Since hydration still occurs after set, in the absence of an additional supply of
“curing” water, the volume reduction due to chemical shrinkage results in the
creation of vapor-filled void spaces in the pore structure of the paste (Couch et
al. 2006), as shown in Figure 4-1 (Henkensiefken et al. 2008b). The volume of
the vapor-filled space increases over time. As the vapor invades smaller and
smaller pores, an increased pressure develops in the remaining fluid. This

44
pressure can be substantial in low w/c mixtures. Lightweight aggregate can be
used to supply water to fill the vapor-filled space during hydration to mitigate the
effects of self-desiccation (i.e., reduce the pressure) in low w/c concrete
mixtures.
0 1 2 3 4 5 6 7Age of Specimen (d)
0
0.01
0.02
0.03
0.04
0.05
Sh
rin
kag
e V
olu
me
(m
l/g
cem
en
t)
Chemical S hrinkageAutogenous Shrinkage
Created Void Space
Approxim ate Time of Set
Fin
al S
et
Fro
m V
icat
Figure 4-1 – Chemical shrinkage and autogenous shrinkage volumes during hydration of a paste with a w/c of 0.30
The foremost process only focuses on the volume of water needed to fill the
voids created by chemical shrinkage. However, as cement paste hydrates, it
becomes significantly less permeable and water may only be able to travel
distances of a few millimeters. Because of this, the LWA volume fraction and
LWA particle size distribution need to be carefully considered during mixture
proportioning to ensure that a majority of the paste is within this travel distance of
the SLWA (water). For this reason, finer and better dispersed SLWA particles
may provide more effective internal curing (van Breugel et al. 2000).

45
4.3. Background on the Detection of Water Movement Using X-ray Absorption
X-ray absorption can be used to detect a change in density that occurs as water
enters or leaves the pores in a material (Lura et al. 2006a). In general, a less
dense material absorbs less x-ray radiation so that more radiation is transmitted
through the sample. Therefore, as water is removed from the LWA, the density
of the composite material would decrease and less x-ray radiation would be
absorbed. X-ray absorption will be used in this work to track moisture movement
from LWA to the surrounding cement paste.
Equation 4-1 describes the relationship between the incident intensity x-ray
radiation (I0) and the intensity of the radiation that is transmitted (passes) through
a sample which contains LWA and cement paste (IMeasured) (Sant et al. 2008a;
Sant et al. 2008c).
tVVVVII VVWWPastePasteLWALWAMeasured exp0 Equation 4-1
where: LWA and VLWA are the linear attenuation coefficient (cm-1) and the volume
proportion (fraction) of the LWA, Paste and VPaste are the linear attenuation
coefficient (cm-1) and the volume proportion (fraction) of the cement pasteW
and VW are the linear attenuation coefficient (cm-1) and volume proportion
(fraction) of water contained in the pores in the LWA, V and VV are the linear
attenuation coefficient (cm-1) and volume proportion (fraction) of vapor filled
pores of the paste or LWA specimen, and t is the thickness of the sample. As
water is removed from the lightweight aggregate, the density (and overall x-ray
attenuation) of the LWA decreases and the transmitted intensity of x-ray radiation
measured at the camera (detector) increases. Consequently, the level of
saturation at any time can be measured and quantified using this technique.

46
4.4. Previous Studies Using X-ray Absorption
Bentz et al. (Bentz et al. 2006a) used x-ray microtomography to monitor water
movement from SLWA particles to the surrounding hydrating cement paste in a
w/c of 0.35 mortar containing a mixture of SLWA and normal weight sand. X-ray
microtomography enabled water movement from the SLWA particles to be
detected within a 3D system. Results indicated that much of the water in the
SLWA was drawn out during the first 24 h of curing. In fact, the water detected
as leaving the SLWA was in direct proportion to the measured chemical
shrinkage of the hydrating cement paste. However, the distance of water
movement into the cement paste could not be determined using this technique,
only the rate at which water was being drawn out of the SLWA.
Another recent study (Lura et al. 2006a) addressed the distance water could
travel. In this study, a paste (w/c of 0.30) was cast next to a single prismatic
LWA particle. The sample was subsequently sealed and water movement was
monitored over a 10 d period. It was observed that a majority of the water
emptied from the pores of the LWA during the first few days of hydration and was
able to travel at least 4 mm into the surrounding cement paste. A large ‘interface’
existed between the SLWA particle and the cement paste, which was proposed
to be due to (1) the LWA not being perfectly prismatic, (2) the imperfect
alignment between the LWA/paste interface and the x-ray beam, and (3) the
resolution of the equipment used (approximately 160 μm).
This investigation builds on the previous studies. This chapter investigates the
time at which water begins to leave the LWA and how far that water can travel
into the surrounding cement paste. Special techniques will be used to address
issues raised by the other studies, which include rotating the sample for proper
alignment and employing an x-ray system with a finer resolution.

47
4.5. Improvement to Measuring Techniques
In this work, the LWA particle to be tested was cut from a larger LWA particle
using a small diamond saw. To align the LWA/paste interface with the x-ray
beam, the composite sample was placed on a rotating table, as shown in Figure
4-2. The rotation is an important feature of this procedure and is illustrated in
Figure 4-3. The sample in Figure 4-3(a) shows a misaligned sample, where the
transmitted x-rays pass through both paste and LWA. In this case both the
attenuation of the paste and LWA must be considered in the composite theory
model (Equation 4-1). If the sample is properly oriented, as in Figure 4-3(b), and
the interface is perfectly planar, the transmitted x-rays pass through either the
paste or LWA.
Rotating Table
Reference Sample
Samples with LWA
Sealing Slab
Figure 4-2 – Samples (used for determining travel distance of water) mounted on rotating table inside x-ray chamber

48
X-ray Source
Detector
Cement Paste
LWA
Detector
X-ray Source
Cement Paste
LWA
(a) (b)
Figure 4-3 – Schematic (used for detecting travel distance of water) of (a) misaligned sample and (b) a properly oriented sample
The importance of the concept can be seen in Figure 4-4(a) through Figure
4-4(d). If the sample is not properly oriented, a blurry edge exists between the
paste and LWA, which has been called the ‘interface’ in previous studies (Lura et
al. 2006a). The effect of this on the x-ray measurements can be seen in Figure
4-5. As the sample is rotated to the correct angle of orientation, the region that
reflects beam passing through both the paste and LWA is reduced. When the
sample is properly oriented, a sharp edge is noticed where the decrease in the
counts occurs. It should be noted that a small interface still exists even when the
sample is properly aligned using this technique. An interface of approximately
0.20 mm exists in this experimental setup, as shown in Figure 4-6, for several
reasons. Each pixel in the captured images has a resolution of approximately
0.02 mm. Even if the sample were perfectly aligned, an interface of 0.02 mm

49
would exist because at least one pixel would exhibit both the properties of the
paste and the properties of the LWA. Though a rotating table was used to align
the samples, the rotation was only uniaxial. Slight misalignment of the sample in
the vertical direction and a “jagged edge” could result in a larger interface when
all the vertical pixels are averaged together. It should be noted the edge of the
LWA tested was also very porous. Paste could penetrate these large pores at
the interface resulting in a region of mixed properties. The edge of the LWA may
not be straight, resulting in a larger interface.
Paste Paste
LWA LWA
Interface Interface
0.0 mm 0.5 mm0.0 mm 0.5 mm 0.0 mm 0.5 mm0.0 mm 0.5 mm
(a) (b)
Paste Paste
LWA LWA
Interface Interface
0.0 mm 0.5 mm0.0 mm 0.5 mm 0.0 mm 0.5 mm0.0 mm 0.5 mm
(c) (d)
Figure 4-4 – X-ray image (used for detecting travel distance of water) of samples rotated to orientations of (a) -10.0 degrees, (b) -5.0 degrees, (c) -2.5 degrees and
(d) 0.0 degrees

50
1.0 1.2 1.4 1.6 1.8 2.0 2.2 2.4 2.6 2.8 3.0Position (mm)
0
5000
10000
15000
20000
25000
30000
35000
40000
Co
un
ts (
\sec
)
Angle of Orientation0.0 Degrees-2.5 Degrees-5.0 Degrees-10.0 Degrees
Paste LWAInterface
Figure 4-5 – Thickness of the LWA/paste interface as sample is rotated
-10.0 -8.0 -6.0 -4.0 -2.0 0.0 2.0 4.0 6.0 8.0 10.0Angle of Orientation (Degrees)
0
0.1
0.2
0.3
0.4
0.5
0.6
0.7
0.8
0.9
1
Th
ickn
ess
of
Reg
ion
th
at
Ref
lect
s M
ixed
Pro
per
ties
(m
m)
MeasuredPredicted
Figure 4-6 – Thickness of LWA/paste interface for different angles of orientation
The effect of rotating the samples from a fundamental perspective can be seen in
Figure 4-7(a) that shows a schematic of a sample containing LWA and cement

51
paste. Initially, the incident x-ray only comes in contact with LWA. If the sample
were rotated about point A (while the incident x-ray beam stayed fixed), LWA
would leave the path of the beam and would be replaced by paste. This region
then would exhibit mixed properties. As the sample is rotated, more LWA is
replaced by paste, with the most significant effect occurring during the first 0.30
degrees of rotation, as shown in Figure 4-7(b).
Incident X-ray
Paste/LWA Interface
A
LWA
Paste
0.0 0.4 0.8 1.2 1.6Angle of Orientation (Degrees)
0.0
0.1
0.2
0.3
0.4
0.5
0.6
0.7
0.8
0.9
1.0
Fra
cti
on
of
bea
m
area
co
nta
inin
g L
WA
(a) (b)
Figure 4-7 – (a) A schematic illustration of the geometry of the experimental setup (not to scale) and (b) influence of the angle of orientation on the fraction of
the x-ray beam that contains LWA
In one of the previous studies mentioned (Lura et al. 2006a), a detector was used
to monitor the x-ray absorption in the specimen. In the current study, a charged-
couple device (CCD) camera was used. Several differences exist between the
detector and the camera, the first being the dimensions of the images captured.
The dimensions of the detector are 3.0 mm × 3.0 mm. The dimensions of the
camera are 25.0 mm × 25.0 mm. Because of the larger dimensions, the camera
is able to capture a larger area of the sample. Often when a larger area is

52
considered, resolution is lost. However because of the differences with the way
the images are processed, the spatial resolution of the camera is better. This is
because the detector averages the photon counts over the 3.0 mm × 3.0 mm
area. The camera however breaks the 25.0 mm × 25.0 mm area into a grid of
252 × 256 pixels. Though the camera captures a 25.0 mm × 25.0 mm area, this
is not necessarily the size of the beam when it interacts with the sample, as seen
in Figure 4-8(a). If the sample is placed closer to the x-ray beam source, the size
of the beam that interacts with the sample will be smaller, thus resulting in a
more precise measurement.
4.6. Materials and Equipment
4.6.1. Materials and Mixture Proportions
ASTM C150 Type I ordinary portland cement (OPC) was used with a Blaine
fineness of 370 m2/kg and an estimated Bogue phase composition of 56 % C3S,
16 % C2S, 12 % C3A, 7 % C4AF and a Na2O equivalent of 0.68 %. A plain paste
was prepared with a w/c of 0.30. A high-range water-reducing admixture
(HRWRA) was added at a rate of 0.44 g per 100 g of cement. The lightweight
aggregate used was a rotary kiln expanded shale with an absorption of 10.5 %
per unit dry mass at 24 h and an apparent specific gravity of 1.56.
4.6.2. Description of the X-ray Absorption Equipment
The equipment used is a GNI x-ray absorption system. The tests were performed
in an environmentally controlled (temperature and humidity) chamber (Nielsen
2007). The x-ray intensity that passed through the samples was measured using
a charge-coupled device (CCD) (i.e., x-ray camera). The 16-bit CCD camera
records the cumulative x-ray intensity at each pixel, for a total surface of 252

53
pixels x 256 pixels (Nielsen 2007). The x-ray source and camera can be moved
simultaneously using an X-Y positioning table with a precision of 0.001 mm.
The Focus to Detector Distance (FDD) of the equipment can be adjusted from 10
mm to 500 mm.
4.7. Experimental Methods
Two different experimental setups were used in the x-ray measurement system.
The first (named the low resolution measurement) consisted of using the x-ray
equipment to determine when water movement from the SLWA to the hydrating
cement paste occurs under sealed curing conditions. This investigation
consisted of placing a SLWA particle in a sample holder with cement paste and
fixing the sample holder to a stationary mount. The other investigation (named
the high resolution measurement), which has been partially described in Section
4.5, was performed to assess the travel distance of water from the LWA to the
surrounding paste.
The key differences between these measurements are that the low resolution
measurements were taken with an object to detector distance (ODD) of 100 mm.
These measurements can be described as “big picture” measurements. The
samples had a fixed position and with the geometry used in this investigation, the
single pixel size and spatial resolution was 0.08 mm. These measurements were
taken to observe bulk water movement from the LWA to the cement paste. The
high resolution measurements can be described as the “close up”
measurements. The ODD for these measurements was 400 mm. Because of
the close proximity of the sample to the x-ray source, the single pixel size and
spatial resolution was 0.02 mm. The samples in this high resolution test were
fixed in two directions; however they were rotated to align the interface of the
paste and the LWA with the beam. The primary purpose of these measurements

54
was to observe the water movement in much finer detail at the interface level. It
should be noted that the x-ray techniques used in these studies have a mass-
based moisture content resolution of 0.26 % (g of water/g of sample) (Sant et al.
2008a); this would be consistent with approximately 5 % of the total chemical
shrinkage.
4.7.1. Low Resolution Measurement
Figure 4-8(b) shows a schematic illustration of the sample holder used in this
investigation. The holder was formed from a 5 mm thick HDPE (high density
polyethylene) sheet. The sample holder was 50 mm x 37 mm with two 12 mm
openings cut out from the center. Two thin clear acetate sheets, approximately
0.5 mm thick, were attached to the front and back surface of the holder using
epoxy to seal the sample holder. A prismatic LWA sample (2 mm x 5 mm x
12 mm) cut from a larger specimen was then inserted into a notch in the holder.
Before performing the experiments, the LWA was oven-dried at 110 ºC for 24 h
to ensure a uniform moisture condition. The aggregate was then cooled until it
reached room temperature and immersed in water for 24 h.
The cement paste was mixed in accordance with the procedure detailed in ASTM
C305-06 (2006). To minimize the moisture loss from the LWA, the paste was
mixed first and the LWA was removed from the water just prior to placement in
the sample holder. The LWA was patted dry using a cotton swab, and then fixed
in position in the holder using epoxy. The paste was placed into both openings in
the sample holder. One opening contained the test specimen, which included
the prewetted aggregate sample and the cement paste, while the other opening
contained just the plain cement paste to be used as a reference to account for
beam energy variations that may occur during the course of the experiment (Sant
et al. 2008c). The design of the sample holder permitted simultaneous testing of

55
the test specimen and the reference specimen. After the cement paste was
placed, the sample holder was sealed on top with clear tape and the entire
sample holder then sealed with aluminum tape to minimize drying. The top
surface was sealed with the clear tape first to prevent chemical reactions
between the cement paste and the aluminum tape. At this point, the sample
holder was placed in the x-ray chamber, which was maintained at 23.0 ºC ±
0.5 °C. The incident x-rays were produced with a conical spread (Nielsen 2007)
using a current of 100 A and a voltage of 50 keV.
X-Ray BeamSource
Detector
Sample
FOD
FDD
UsefulBeam
X-Ray BeamSource
Detector
Sample
FOD
FDD
UsefulBeam
ODD
X-Ray BeamSource
Detector
Sample
FOD
FDD
UsefulBeam
X-Ray BeamSource
Detector
Sample
X-Ray BeamSource
Detector
Sample
FOD
FDD
UsefulBeam
X-Ray BeamSource
Detector
Sample
FOD
FDD
UsefulBeam
ODD
Mounting Screw Hole
LWA Paste
5 mm
Aluminum Tape
25 mm
25 mm
2.5 mm
(a) (b)
Figure 4-8 – (a) A schematic illustration of the geometry of the experimental setup (not to scale) and (b) schematic of sample holder with precut LWA and
paste (used to detect water movement near the time of set)
4.7.2. High Resolution Measurement
The LWA particle, described in Section 4.5, was oven-dried at a temperature of
110 ºC for 24 h. After the aggregate was dried, it was attached inside the sample
holder with epoxy glue. Two identical samples with LWA were made along with
one reference sample. The absorption of water into the LWA was monitored
using x-ray absorption. X-ray measurements began approximately 45 s after
water was added to the empty space in the sample holder. The absorption of

56
water into the LWA was monitored for the first 8 h in 15 min intervals. The LWA
was allowed to absorb water for 24 h before paste was added. The cement
paste was mixed in accordance with the procedure detailed in ASTM C305-06.
After the paste was mixed, the water was removed from the sample holder and
excess water was removed with a cotton swab. During the process, the sample
remained in the x-ray chamber so as not to change the position of the sample
holder. X-ray measurements began approximately 10 min after the paste was
added. The samples were sealed with putty and a piece of invar. The incident x-
rays were produced with a current of 100 A and a voltage of 45 keV.
4.8. Experimental Results
4.8.1. Low Resolution Measurement
While three samples were tested and showed similar trends, Figure 4-9(a) shows
a typical result for water movement from the LWA during the first 24 h. The x-
axis shows the horizontal position of the specimen, while the y-axis shows the
difference in counts (transmitted intensities) normalized to the counts at 3.5 h
(transmitted intensity at 3.5 h). The zone between the aggregate and the paste
has been labeled as the ‘interface’ as was done by Lura et al. (Lura et al. 2006a;
Henkensiefken et al. 2008g). It is observed Figure 4-9(b) that as the specimen
ages, the difference in counts in the LWA becomes more negative, which relates
to the removal of water from the prewetted aggregate. Upon further inspection of
the information from the first hours when the measurements were taken (i.e.,
prior to set), the number of counts is observed to remain relatively constant, as
seen in Figure 4-9(b). This is expected, as at early ages, the system is saturated
(the paste system collapses on itself and does not create vapor-filled space). As
a solid skeleton forms in the cement paste, vapor-filled spaces begin to form
(cavitate) in the paste system (Couch et al. 2006). This causes a suction

57
pressure to develop in the pore fluid which causes water to be drawn out of the
aggregate into the paste causing an increase in the measured x-ray intensity in
the LWA and a decrease in the measured x-ray intensity in the paste.
1.4 1.6 1.8 2.0 2.2 2.4 2.6 2.8 3.0 3.2 3.4 3.6Position (mm)
-5000
-4000
-3000
-2000
-1000
0
1000
2000
3000
Dif
fere
nce
in C
ou
nts
fr
om
In
itia
l Co
un
ts a
t 3.
5 h
6.0 h11 h26.5 h
LWA
Interface
Paste
Likely Edge
(a)
1.4 1.6 1.8 2.0 2.2 2.4 2.6 2.8 3.0 3.2 3.4 3.6Position (mm)
-5000
-4000
-3000
-2000
-1000
0
1000
2000
3000
Dif
fere
nce
in C
ou
nts
fr
om
In
itia
l Co
un
ts a
t 3.
5 h
4.5 h5.0 h5.5 h6.5 h
LWA
Interface
Paste
(b)

58
Figure 4-9 – (a) X-ray measurements showing water movement from the LWA during the first day, and (b) X-ray measurements during first 6.5 h for determining
when water leaves the LWA
The average of the difference in counts from a position of 2.0 mm to 2.4 mm on
the specimen is shown as a function of specimen age in Figure 4-10. The
measured chemical shrinkage, equivalent to the water demand of the hydrating
cement paste, is also shown in Figure 4-10. The counts remain constant until an
age of 6 h, indicating that water is not being drawn out of the aggregate until this
time. However, after 6 h, the transmitted x-ray intensity is observed to
progressively increase in the LWA. This would indicate a loss of water from the
pores of the aggregate into the cement paste. The time of first water movement
detected by the x-ray measurements (6 h) is similar to the time shown by the
initial set as determined with the Vicat needle (6 h) (Henkensiefken et al. 2008g).
This is an important observation as it verifies that in a sealed system, a
prewetted LWA does not lose significant water until a solid skeleton forms and
vapor spaces begin to cavitate, which occurs near the time of set.
0 4 8 12 16 20 24 28Age of Specimen (h)
-5000
-4000
-3000
-2000
-1000
0
Dif
fere
nce
in
Co
un
ts
fro
m In
itia
l Co
un
ts a
t 3.
5 h
-0.030
-0.025
-0.020
-0.015
-0.010
-0.005
0.000
Vo
id V
olu
me
(mL
/gc
em)
X-Ray MeasurementsChemical Shrinkage
Init
ial S
et
Fin
al S
et
Figure 4-10 – Difference in counts normalized to initial counts averaged from 2.0 mm to 2.4 mm in the LWA as a function of age

59
4.8.2. High Resolution Measurement
Two samples in this investigation were used to detect the distance of water
movement, but the results for a typical sample are shown in Figure 4-11. The
‘interface’ is located at 0.0 mm and the increasing negative distance is the
distance into the hydrating cement paste while a positive distance corresponds to
movement into the LWA. Two distinct features can be seen from Figure 4-11.
First, as time elapses, the normalized intensity in the paste becomes increasingly
positive. This shows that the paste is becoming more dense as water is moving
from the LWA to the paste. The second feature that can be seen is a wetting
front. It is hard to determine exactly where the wetting front is during the first 9.0
h, as it appears that the high permeability of the fresh cement paste allows fluid
movement of more than several mm at this time. A definite measurement cannot
be provided during this time for two reasons. First, it was out of the selected 3
mm field of view. Second, the changes in intensity are quite low. However, a
clearer water front can be seen from 12.0 h to 75.0 h. The front is shown as a
sharp increase in the normalized intensity. This increase indicates the point
where the paste goes from being more dense (due to more water) to less dense
(due to lack of water). When measurements were taken at 75.0 h, the water was
able to move approximately 1.8 mm into the paste. This distance has
implications on the effectiveness of internal curing in systems made with SLWA.

60
-2.0 -1.8 -1.6 -1.4 -1.2 -1.0 -0.8 -0.6 -0.4 -0.2 0.0Distance from Interface (mm)
-20
-10
0
10
20
30
40
50
60
70
80
Dif
fere
nc
e in
Co
un
ts f
rom
In
itia
l C
ou
nts
(4.
0 h
)
7.25 h8.00 h9.00 h12.00 h24.00 h75.00 h
LW
A
Figure 4-11 – Moisture movement from LWA into the cement paste
The distance water can travel becomes important in selecting the gradation of
LWA and the proportions for the mixtures with internal curing. When SLWA is
added to concrete, the water that is stored in it must be able to reach the paste
which it is meant to protect. If the water stored in the SLWA is unable to
penetrate more than 2 mm into the paste, all the paste in the concrete must be
within 2 mm in order for effective internal curing to take place. The effect of
different particle size replacements on the protected paste volume was simulated
using the hard core/soft shell model developed at the National Institute of
Standards and Technology (NIST) (Lu et al. 1992; Maekawa et al. 1999; Bentz et
al. 1999a). Figure 4-12 shows a plot of the volume fraction of cement paste that
is within a given distance from the surface of a SLWA particle. For the same
volume of LWA, it should be noted that when large particles (4.76 mm and 2.36
mm) are used, not all of the paste is within 2 mm of a LWA. As smaller LWA
particles (<2.36 mm) are used, all of the paste is with 2 mm of a LWA particle.
As smaller particles are used, the volume of paste within even smaller distances
of a LWA particle surfaces also increases. If a small enough particle is replaced,

61
a majority of the paste will be within 0.20 mm, which could be important at later
ages (RILEM 2007).
2 1.5 1 0.5 0Distance from LWA Surface (mm)
0
0.2
0.4
0.6
0.8
1
Fra
ctio
n o
f P
rote
cted
Pas
te
4.76 mm2.36 mm1.18 mm0.60 mm0.30 mm
Figure 4-12 – Protected paste volume at different particle replacement sizes
4.9. Conclusions
This chapter describes investigations to demonstrate how moisture moves from
LWA to the cement paste in an internally cured mixture. The general results of
the investigation are:
the error associated with samples that are not properly oriented was
demonstrated using a misaligned interface. These results suggest that
sample misalignment would cause incorrect or imprecise determination of
travel distance of water,
x-ray absorption was used to detect that water does not leave the LWA until
set has occurred in a sealed system. This is consistent with previous
investigations (Bentz et al. 2006a; Henkensiefken et al. 2008g),

62
x-ray absorption was also used to measure the distance that the water
moved from the LWA to the surrounding cement paste. In this study, water
was determined to move approximately 1.8 mm into the paste for ages
between 24.0 h and 75.0 h, and
the practical importance of these investigations was also shown by the
importance of particle spacing effects. When better particle spacing exists,
shrinkage, stress development, and early-age cracking should be reduced.

63
CHAPTER 5. DISCUSSION ON THE SHRINKAGE OF THE PASTE IN MORTAR CONTAINING PREWETTED LIGHTWEIGHT AGGREGATE
5.1. Introduction
Shrinkage in mortar and concrete is a function of the shrinkage of the paste and
the restraint provided by non-shrinking aggregate particles. Attempts have been
made to model the shrinkage of concrete using two phase or multi-phase models
(Pickett 1956; Hobbs 1969). These models have been used in the past to
describe shrinkage in normal weight concrete mixtures (Lura 2003a). In this
paper, the autogenous shrinkage of cement paste is calculated based on the
autogenous shrinkage of internally cured mortar specimens that contain
prewetted LWA using a model developed by Pickett. The overarching goal is to
develop tools to describe the shrinkage of the paste when additional water is
supplied by the LWA.
5.2. Constituent Materials
ASTM C150 Type I ordinary portland cement (OPC) was used, with a Blaine
fineness of 370 m2/kg and an estimated Bogue phase composition of 56% C3S,
16% C2S, 12% C3A, 7% C4AF and a Na2O equivalent of 0.68%.
The sand used was natural river sand with a fineness modulus of 2.71. The sand
had a modulus of elasticity of approximately 70 MPa and a Poisson’s ratio of
0.25 (Bisschop et al. 2001). Portions of the sand were replaced with
manufactured rotary kilned expanded shale with a fineness modulus of 3.10.

64
The 24 h absorption of the LWA was determined to be 10.5% according to ASTM
C128-07. The LWA was assumed to have a modulus of elasticity of
approximately 30 MPa and a Poisson’s ratio of 0.22 (Nilsen et al. 1995).
5.3. Mixture Proportioning
Four different mixtures were prepared: one plain mortar mixture and three mortar
mixtures where a portion of the sand was replaced with prewetted LWA. The
mixtures with prewetted LWA replacement were designated as 7.3%k, 14.3%k
and 25.3%k, representing the percent of the total volume of the mixture
composed of LWA Table 5-1.
Table 5-1 – Mixture proportions for modeling study
Material 0.0% 7.3%k 14.3%k 25.3%k
Cement (kg/m3) 728 728 728 728
Water (kg/m3) 218 218 218 218
Fine Aggregate (kg/m3) 1418 1229 1050 806
LWA (kg/m3) 0 114 223 370HRWRA (g/gcem) 0.44 0.44 0.50 0.66
w/c (without additional water) 0.30 0.30 0.30 0.30
0.053Additional Water Provided by
LWA (mL/gcem)0 0.016 0.032
5.4. Mixing Procedure
Mixing was performed in accordance with ASTM C192-06. The LWA was oven
dried, air cooled, and then submerged in water for 24 h ± 1 h before mixing. The
volume of water used to submerge the LWA included both mixing water and the
water the LWA would absorb in 24 h. The mixing water (i.e., the extra water not
absorbed in 24 h) was then decanted and used in the mixing process. The sand

65
was oven-dried and subsequently cooled to room temperature before it was
added to the mixture.
5.5. Experimental Results of Mortar Mixtures
Autogenous shrinkage measurements for the mortars are shown in Figure 5-1.
These results are similar to those obtained by other researchers (RILEM 2007).
It can be seen that the volume fraction of LWA contained in the mixture has a
significant effect on autogenous shrinkage. The plain mixture begins shrinking
from the time of set, however the mixture containing 7.3%k LWA expands slightly
after set before shrinking after approximately 14 h. The 14.3%k mixture shows a
much more dramatic expansion for the first day before it begins to shrink after 1
d. The 25.3%k mixture expands during the first day and continues to expand
(but at a lower rate) for the 7 d it was measured.
0 1 2 3 4 5 6 7Time (d)
-300
-200
-100
0
100
200
300
Str
ain
(
)
25.3%k14.3%k7.3%k0.0%
Figure 5-1 – Autogenous shrinkage measurements for mortar specimens
The shrinkage behavior of these mixtures can be explained by considering the
water that is provided by the LWA. We can begin by examining the chemical
shrinkage of the paste with a w/c of 0.30 as shown in Figure 5-2. As hydration

66
occurs, the volume of the specimen is reduced. The chemical shrinkage denotes
the entire volume reduction due to the hydration reaction while autogenous
shrinkage denotes just the external volume change. The difference between the
curves denotes the volume that would be attributed to the cavitation of vapor
filled space.
0 1 2 3 4 5 6 7Time (d)
0
0.01
0.02
0.03
0.04
0.05
Po
re V
olu
me
(ml/
gce
m)
Chemical ShrinkageAutogenous Shrinkage
Water from
7.3%k Depleted
Water from
14.3%k Depleted
Figure 5-2 – Chemical shrinkage and autogenous shrinkage measurements showing when water depletes from LWA
When prewetted LWA is added to the mixture, the cavitation of vapor filled space
will cause a pressure difference resulting in water leaving the LWA and filling the
voids created by chemical shrinkage. After the water in the LWA is depleted,
shrinkage will occur due to the continued creation of void space. For the 7.3%k
mixture, water in the LWA is depleted at approximately 14 h, which is when
shrinkage begins to occur from Figure 5-1. The 14.3%k mixture shows that the
water will deplete after the first day, which is approximately the time when
shrinkage began. From the chemical shrinkage data, it would be expected that
the water from the 25.3%k mixture does not deplete over the 7 d time period.

67
5.6. Modeling Concrete Shrinkage from Pickett’s Equation
5.6.1. General Considerations
Pickett (Pickett 1956) derived an expression to describe the shrinkage of mortar
or concrete as a function of aggregate stiffness and volume as shown in
Equation 5-1:
nFApc V 1 Equation 5-1
where εc (m/m) is the shrinkage of the concrete/mortar, εp (m/m) is the shrinkage
of the paste, FAV (m3/m3) is the volume fraction of the aggregate and n is a
parameter that describes the aggregate stiffness. The aggregate stiffness term
is defined as:
Acac
c
EEvv
vn
/2121
13
Equation 5-2
where νc and νA are the Poisson’s ratio of the concrete/mortar and the aggregate,
respectively, and Ec and EA are the elastic modulus of the concrete/mortar and
the aggregate, respectively. Equation 5-2 applies to concrete consisting of one
type of aggregate. To account for the replacement of sand with LWA, Equation
5-1 was modified to the following expression:
LWAFA nLWA
nFApc VV 11 Equation 5-3
where VFA and VLWA are the volume fractions of sand and LWA, respectively. The
aggregate stiffness for the fine aggregate and LWA are nFA and nLWA,
respectively. Several assumptions had to be made in order to use the
expression derived from Pickett (Lura 2003a):
The concrete consists of homogenous materials; paste, fine aggregate
and lightweight aggregate.
The aggregates and paste behave elastically.

68
Microcracking of the paste does not reduce the stiffness.
The mortar is a two-phase composite consisting of aggregates (normal
weight or LWA) and paste with no separate contribution due to
interfacial transition zones.
Because shrinkage (or expansion) is a paste property, the resulting shrinkage of
the paste could be determined by solving Equation 5-3 for εp in terms of the
shrinkage of the mortar, the volume fraction of the aggregate and the aggregate
stiffness.
LWAFA nLWA
nFA
cp
VV
11
Equation 5-4
5.6.2. Equivalent Paste Shrinkage
Figure 5-3 shows the equivalent paste shrinkage which was determined using
results from the mortar specimens Equation 5-4. By comparing the experimental
and modeling results for the plain mortar and plain paste, it can be noticed that
the trend is similar however the experimental value is approximately 80 με higher
at 7 d. This difference may be due to the slight difference in set time. In
addition, this difference may be due to the fact that Pickett’s model does not
account for the interfacial transition zone (Neubauer et al. 1996), changes in
bleed water or microcracking (Sant et al. 2008b). The model also shows large
expansion of the 14.3%k and 25.3%k pastes.

69
0 1 2 3 4 5 6 7Time (d)
-1000
-800
-600
-400
-200
0
200
400
600
800
Str
ain
(
)
Plain Paste (Measured)Plain Paste (Pickett)7.3%k (Pickett)14.3%k (Pickett)25.3%k (Pickett)
Figure 5-3 – Plain paste measurement and modeling results of plain and LWA pastes using Pickett’s Model
5.7. Describing Shrinkage Using Modified Mackenzie’s Equation
The strain developed in paste can be described using Mackenzie’s equation
which was modified by Bentz to account for the degree of saturation (Bentz et al.
1998):
spp KKr
S 112
3
Equation 5-5
where S (unit less) is the degree of saturation of cement paste, Kp (Pa) is the
bulk modulus of the porous body, Ks (Pa) is the bulk modulus of the solid
skeleton, γ (N/m) is the surface tension of the pore fluid and r (m) is the critical
Kelvin pore radius. On drawback to this equation is that it is not able to capture
expansion that occurs in these mixtures at early ages.

70
Figure 5-4 shows the pore size distribution obtained using mercury intrusion
porosimetry (MIP) of the plain mortar mixture at 7 d. The pore size of the plain
mixture that remains saturated after 7 d is approximately 7.0 nm (as determined
from internal relative humidity measurements). The volume of water provided by
the LWA (Table 5-1) would add water to the system causing the critical (i.e.,
emptied pore) size to increase to 9.6 nm, 11.0 nm and 19.0 nm for the mixtures
containing 7.3%k, 14.3%k and 25.3%k, respectively. This is shown in Figure 5-5.
As expected, the effective pore size depleted due to self-desiccation is larger in a
LWA system than in a plain system.
1 10 100 1000 10000 100000 1000000Pore Radius (nm)
0.00
0.05
0.10
0.15
0.20
0.25
0.30
Po
re V
olu
me
(ml/
gce
m)
Affected Pore Region Unaffected Pores
Figure 5-4 – Pore size distribution of plain mortar mixture at 7 d

71
1 10 100Pore Radius (nm)
0.00
0.05
0.10
0.15
0.20
0.25
0.30
Po
re V
olu
me
(ml/
gcem
) Pore SolutionWater From 7.3%k (0.016 mL/gcem)
Water From 14.3%k (0.032 mL/gcem)
Water From 25.3%k(0.053 mL/gcem)
Empty Pores
Figure 5-5 – Affected pore size distribution of plain mortar mixture
The critical pore radius (i.e., the depleted pore size) can also be obtained from
the internal relative humidity measurements using the Kelvin-Laplace equation
(Radlinska et al. 2007):
RT
V
RHr m
ln
2 Equation 5-6
where RH (unit less fraction) is the internal relative humidity, Vm (m3/mol) is the
molar volume of the pore solution, R (J/mol·K) is the universal gas constant and
T (K) is the absolute temperature. The measured RH is a function of the
consumption of water due to hydration (Kelvin effect) and the change induced in
the activity of the pore solution due to the dissolution of salts (Raoult effect).
Raoult’s law can then be used to account for the influence of salts in the pore
solution to determine the internal RH purely as a function of water consumption
(Kelvin RH), which is slightly higher than the measured RH (Lura 2003a).
The corrected critical pore size determined from the Kelvin-Laplace equation
using the Kelvin RH at 7 d was 7.0 nm, 8.4 nm, 9.7 nm and 16.5 nm for the 0.0%,

72
7.3%k, 14.3%k and 25.3%k mixtures, respectively. The experimental results
yield a similar albeit slightly smaller pore radius than those obtained from
calculations with the MIP data. A comparison between the measurements from
the pore size distribution and the RH measurements (corrected and uncorrected)
are detailed in Table 5-2.
Table 5-2 – Kelvin Radius from internal RH and pore size distribution
MixtureFrom Pore Size
DistributionFrom RH
MeasurementsFrom RH Measurements
(corrected)
% Reduction of Shrinkage Predicted using Equation 5-4
0.0% 7.0 5.3 7.0 0%7.3%k 9.6 6.5 8.4 27%14.3%k 11.0 7.4 9.7 36%25.3%k 19.0 10.8 16.5 63%
It is evident that if all the other parameters in Equation 5-6 are held constant,
while decreasing the radius of the pore size being depleted, the shrinkage
increases. Alternatively, if LWA replenishes the pore, the depletion radius will
increase resulting in decreased shrinkage. Table 5-2 shows the shrinkage for
each the LWA mixtures as a percent reduction of the shrinkage of the plain paste
mixture.
5.8. Conclusions
This chapter discussed the shrinkage of LWA systems. A summary of the
observations are:
Pickett’s model can be used to obtain the shrinkage of a paste given the
shrinkage of the mortar.

73
The inclusion of a sufficient volume of prewetted LWA can significantly
reduce autogenous shrinkage. Though the inclusion of LWA alters the
stiffness of the mortars, this effect is less significant than the impact of
the release of water from the LWA.
The inclusion of prewetted LWA will supply water to the paste to
increase the effective pore radius that is emptied by self-desiccation,
resulting in reduced shrinkage.
While Mackenzie’s modified equation describes the trend in shrinkage, it
does not describe the expansion that is observed in the mortars.

74
CHAPTER 6. MEASURING VOLUME CHANGE AND CRACKING UNDER SEALED AND DRYING CONDITIONS
6.1. Introduction
High performance concrete (HPC) mixtures have been increasingly promoted for
use due to potential long-term benefits in performance (FHWA 2006). HPC
mixtures generally have a low water-to-cement ratio (w/c) and may contain finely
ground supplementary cementitious materials, (e.g., silica fume). While the fine
pore system is beneficial for increased strength (Shah et al. 1994) and reduced
fluid transport (El-Dieb et al. 1995; Khan et al. 2002), the finer pore network can
lead to increased volumetric changes in sealed systems due to self-desiccation.
This volume change is problematic as it can result in cracking if the concrete is
restrained from shrinking freely.
Several strategies exist to mitigate autogenous shrinkage such as the use of
expansive cements (Saito et al. 1991; ACI 1998), the addition of shrinkage
reducing admixtures (Folliard et al. 1997; Bentz et al. 2001b; Weiss et al. 2002;
Pease et al. 2005), or the incorporation of water saturated inclusions (Bentz et al.
1999b; Lura 2003a; Lura et al. 2006a; Lura et al. 2007a; Henkensiefken et al.
2008e). The use of prewetted lightweight aggregate (SLWA, known as internal
curing), enables water from the SLWA to be supplied to the paste after setting
(Henkensiefken et al. 2008g), thereby reducing the effects of self-desiccation.
The behavior of SLWA systems is the primary focus of this chapter.

75
While several studies have shown the beneficial effects of IC on the shrinkage
reduction of high-performance mixtures, few studies have investigated the role of
SLWA volume fraction thoroughly (Cusson et al. 2006; Henkensiefken et al.
2008e). While many studies have focused on systems with sealed curing, a
recent state-of-the-art report (RILEM 2007) describes how more research is
needed to understand the performance when the specimens are exposed to
drying. This study provides a substantial data set based on the measured
performance of SLWA systems under sealed and drying curing conditions. The
performance of SLWA systems is related to fundamental aspects of the pore
structure of the paste, the pore structure of the SLWA, and the spacing of the
SLWA.
6.2. Materials
ASTM C150 Type I ordinary portland cement (OPC) was used, with a Blaine
fineness of 370 m2/kg and an estimated Bogue composition of 56 % C3S, 16 %
C2S, 12 % C3A, 7 % C4AF and a Na2O equivalent of 0.68 %, all by mass fraction.
A high-range water-reducing admixture (HRWRA) was added in varying rates
depending on the volume fraction of LWA replacing normal weight sand. For
LWA replacement volume fractions up to 7.3 %, the HRWRA was added at a
dosage of 0.44 g per 100 g of cement. For replacement volume fractions of
7.3 % to 18.3 %, the HRWRA was added at a dosage of 0.50 g per 100 g of
cement. For replacement volume fractions larger than 25.3 %, 0.66 g per 100 g
of cement was used. Different rates of HRWRA were used to keep similar
consistencies of these mixtures.
The normal weight sand used was natural river sand with a fineness modulus of
2.71 and an apparent specific gravity of 2.58. Portions of the normal weight sand

76
were replaced with two manufactured rotary kilned expanded shales (LWA-K and
LWA-H), with a fineness modulus of 3.10 and an apparent specific gravity of
1.56. The 24 h absorption of the normal weight sand, LWA-K and LWA-H were
determined to be 1.8 %, 10.5 % and 5.8 % by mass, respectively, according to
ASTM C128-07 (2007). The normal weight sand used was natural river sand
with a fineness modulus of 2.71 and an apparent specific gravity of 2.58.
Portions of the normal weight sand were replaced with two manufactured rotary
kilned expanded shales (LWA-K and LWA-H), with a fineness modulus of 3.10
and an apparent specific gravity of 1.56. The 24 h absorption of the normal
weight sand, LWA-K and LWA-H were determined to be 1.8 %, 10.5 % and
5.8 % by mass, respectively, according to ASTM C128-07 (2005). The
desorption isotherms for the LWA can be found in Figure 3-3.
6.3. Mixture Proportioning
Eleven different mixtures were prepared with an effective w/c of 0.30: this
included a plain mortar mixture designated as 0.0 % and 10 mortar mixtures with
varying amounts of sand replaced by prewetted LWA, as shown in Table 6-1.
Two types of LWA were used (LWA-K and LWA-H). The LWA-K expanded shale
was used for eight of these mixtures which were designated as 3.8%k, 7.3%k,
11.0%k, 14.3%k, 18.3%k, 25.3%k, 29.3%k and 33%k. The LWA-H expanded
shale was used for the remaining two mixtures designated as 25.3%h and 43%h.
It is important to note that the designations are on a total volume basis. The
volume of aggregate (LWA and sand) was maintained constant at 55 % since
only the sand was replaced with LWA. The number in the designation represents
the total volume of the mixture occupied by the LWA (in percent). The mixture
proportions for each mixture are illustrated in Figure 6-1.

77
It should be noted that the 25.3%k and 43%h volume replacements correspond
to the amount of LWA necessary to eliminate self-desiccation proposed by Bentz
et al., (Bentz et al. 1999b; Bentz et al. 2005). The different volumes required for
the two aggregates arise from the fact that the LWA-K (10.5 %) can absorb more
water in a similar time period as compared to the LWA-H (5.8 %). For this
reason, a lower volume of LWA-K was needed to provide the same volume of IC
water. This can be noticed by observing the last line in Table 6-1, where the
additional water provided for the 25.3%k and 43%h mixtures are the same. It is
also important to note that one mixture was prepared so that the replacement
volume of LWA-K and LWA-H were the same (25.3%k and 25.3%h). However
LWA-K absorbs more water in 24 h (10.5 %) than LWA-H (5.8 %), the volume of
IC water for the 25.3%k was more than that for the 25.3%h. Because of the
absorption difference between LWA-K and LWA-H, the volume of IC water for the
25.3%h was similar to the 14.3%k mixture, though a smaller volume of aggregate
was used.
Table 6-1 – Mixture proportions for volume change and cracking study
Material 0% 3.8%k 7.3%k 11%k 14.3%ka
Cement (kg/m3) 728 728 728 728 728
Water (kg/m3) 218 218 218 218 218
Fine Aggregate (kg/m3) 1418 1319 1230 1135 1050
Dry LWA (kg/m3) 0 60 114 172 223
12 18Additional Water
Provided by LWA (kg/m3)0 6 23
Material 18.3%k 25.3%kb29.3%k 33%k 25.3%ha 43%hb
Cement (kg/m3) 728 728 728 728 728 728
Water (kg/m3) 218 218 218 218 218 218
Fine Aggregate (kg/m3) 950 808 667 567 808 310
Dry LWA (kg/m3) 283 369 455 525 369 670
5430 4839Additional Water
Provided by LWA (kg/m3)3922

78
a Denotes an equal volume of water supplied by the 14.3%k and 25.3%h mixtures
b Denotes an equal volume of water supplied by the 25.3%k and 43%h mixtures
0
20
40
60
80
100
Vo
lum
e P
erce
nt
of
Mat
eria
l
0 10 20 30 40 50Percent Lightweight Aggregate of Total Mixture (%)
Cement
Water
NormalWeightSand
LWA
FineAgg.
Paste
Figure 6-1 – Mixture proportions on a volumetric basis
6.3.1. Mixing Procedure
The mixing procedure used was in accordance with ASTM C192-06. The LWA
was oven dried, air cooled, and then submerged in water for 24 h ± 1 h prior to
mixing. The volume of water used to submerge the LWA included both mixing
water and the water the LWA would absorb in 24 h. The excess water (water not
absorbed in 24 h) was then decanted and used as the mixing water. The sand
was oven dried and cooled for 24 h before mixing.

79
6.4. Experimental Methods
6.4.1. Unrestrained Volumetric Change during the First 24 h
The autogenous deformation of the mortar specimens during the first 24 h was
measured using the corrugated tube protocol (Jensen et al. 1995; Sant et al.
2006). This procedure consists of placing fresh mortar (approximately 15 min
after water is added to the mixture) in a corrugated polyethylene tube. The
length and diameter of the tube was 400 mm and 30 mm, respectively. The
shrinkage strain is measured using two LVDTs. The typical standard deviation
after set between two duplicate specimens was 4 με (microstrain). For each
mixture tested, two corresponding corrugated tubes were measured. The
specimens were placed in a dilatometer that was maintained at 23 ºC ± 1 ºC.
The transducers were connected to a PC for automated length measurements
every 5 min for the first 7 d.
6.4.2. Unrestrained Volumetric Change & Mass Loss after 24 h
Free shrinkage was measured using 75 mm × 75 mm × 285 mm prisms
according to ASTM C157-06 (2006). Three samples for the sealed condition and
three samples for the unsealed condition were prepared. The sealed samples
were encased in aluminum tape on all sides. The unsealed samples were sealed
on two opposite faces so that they could be directly compared to the restrained
shrinkage measurements described in the next section. The length was
measured using a comparator beginning 24 h after casting. The unrestrained
volumetric change from the tube protocol for the first 24 h was added to the prism
measurements. The typical standard deviation for unrestrained shrinkage
between triplicate specimens was 20 με. The mass loss was recorded for both
sealed and unsealed conditions. The mass loss for the sealed samples was
measured to ensure a sealed state was maintained during testing. The mass

80
loss measurements for the unsealed samples can be used to monitor the extent
of drying (water loss) that has occurred. The typical standard deviation for mass
loss between triplicate specimens was 0.80 g.
6.4.3. Measurements of Restrained Shrinkage
The restrained shrinkage cracking potential was measured using the restrained
ring test, in accordance with ASTM C1581-04 (Shah et al. 1998; 2004). Three
samples of each mixture were measured. Before casting, molds were
conditioned in an environmental chamber at a temperature of 23.0 °C ± 0.1 °C.
Each ring was cast in two layers with each layer being vibrated for 15 s. After
casting, all samples were kept sealed for 24 h in an environmental chamber at a
constant ambient temperature of 23.0 °C ± 0.1 °C before they were demolded.
After demolding the rings, the sealed ring specimens were sealed with aluminum
tape. The unsealed ring specimens were exposed to 50 % ± 0.1 % relative
humidity at 24 h and were sealed on the top surface with aluminum tape to limit
moisture loss to the outer circumference only (the bottom surface was sealed by
the ring’s base support). Restrained shrinkage data was measured and collected
at 5 min intervals. The typical standard deviation for restrained shrinkage
between triplicate specimens was 4 με (Radlinska et al. 2008a).
6.4.4. Internal Relative Humidity of Sealed Specimens
To measure changes in the internal relative humidity of a sealed sample over
time, specimens without normal weight sand were cast in plastic containers
which were demolded at an age of 12 h. Approximately 10 g of the sample was
crushed and placed in a glass container with a diameter of 25 mm and a length
of 50 mm and sealed to prevent loss of moisture. The sealed glass container
was kept in an environmental chamber at a constant temperature of 23.0 °C
± 0.1 °C. A temperature and relative humidity meter was used to record relative

81
humidity and temperature data inside the sealed container at 2 h intervals for 7 d.
The standard deviation for relative humidity measurements was 1.1 %. The
sensor was calibrated using saturated salt solutions with known relative
humidities in the range of 75 % to 100 % (ASTM E104-02) (2002).
6.5. Experimental Results and Discussion of Internal Curing Mixtures
6.5.1. Different LWA Volume Replacements on Free Shrinkage
6.5.1.1. Sealed Curing Conditions
The results of free shrinkage tests performed on the plain mixture along with the
mixtures containing LWA-K during the first 7 d and first 28 d are shown in Figure
6-2 and Figure 6-3, respectively. When a lower replacement volume of LWA is
used (7.3%k, 11.0%k), the performance is similar to that of a plain mixture
(Cusson et al. 2006). When higher volume replacements are used (14.3%k,
18.3%k, 25.3%k, 29.3%k, 33.0%k), after the initial expansion, the mixtures
remain nearly volumetrically stable. The expansion in these materials during the
first hours could be due to osmotic pressure or the formation of ettringite or after,
however no experimental data exits to confirm this. Other researchers have
seen similar expansions at early ages (Jensen et al. 2001a; Bjøntegaard et al.
2004; Lura et al. 2004).

82
0 1 2 3 4 5 6 7Age of Specimen (d)
-400
-300
-200
-100
0
100
200
300
400
Str
ain (
)
Sealed33.0%k
29.3%k
25.3%k
18.3%k
14.3%k
11.0%k
7.3%k
0.0%
Figure 6-2 – Free shrinkage results of plain and LWA-K mortar mixtures in sealed curing conditions during the first 7 d
0 7 14 21 28Age of Specimen (d)
-400
-300
-200
-100
0
100
200
300
400
Str
ain
(
)
Se aled33.0%k29.3%k
25.3%k18.3%k
14.3%k11.0%k
7.3%k0.0%
Figure 6-3 – Free shrinkage results of plain and LWA-K mortar mixtures in sealed curing conditions

83
The shrinkage can be more thoroughly explained if the volume of void creation is
considered as shown in Figure 6-4. The volume of chemical shrinkage minus the
volume of autogenous shrinkage is the approximate volume of voids created in
the cement paste. The volume of water supplied in the LWA can only fill in voids
until all the water in the LWA is depleted. Even if voids are created, the water
may not leave the LWA. This could be because the internal relative humidity is
not low enough to pull the water from the LWA. When water no longer leaves the
LWA, the pores of the paste will begin to empty and significant shrinkage is
induced. An explanation for the similar performances of lower replacement
volumes could also be explained by their having lower protected paste volume
fractions (Figure 3-5). This is not to say that lower replacement volumes of LWA
are not beneficial. The 11.0%k mixture has a substantially lower rate of
shrinkage during the first 7 d. The lower rate of shrinkage could provide enough
time for sufficient strength to develop to resist cracking. Indeed, it will be
demonstrated later that lower replacement volumes have beneficial effects in
restrained shrinkage.

84
0 1 2 3 4 5 6 7Age of Specimen (d)
0
0.01
0.02
0.03
0.04
0.05
Vo
id V
olu
me
(m
l/g
ce
me
nt)
0
2
4
6
8
10
12
14
16
18
20
22
Pe
rce
nt
LW
A-K
(%
)
Voids Created
7.3%k
11.0%k
14.3%k
3.8%k
Figure 6-4 – Void creation in cement paste and the time when water depletes from the LWA-K as volume replacements increase. The 18.3%k, 25.3%k,
29.3%k and 33.0%k mixtures don’t deplete of water before 7 d
Figure 6-5 can be used to provide a better explanation for the shrinkage that
occurs in the mixtures with replacement volumes lower than 18.3%k. This plot
shows when the water is expected to deplete from the LWA based on Figure 6-4
along with when the mixtures ‘begin to shrink’ as measured by the corrugated
tubes and sealed prismatic specimens. What is meant by ‘begin to shrink’ is
when the mixture first begins to shrink after its initial expansion, not when the
mixture actually shows a negative (<0) value of strain in Figure 6-2 and Figure
6-3. From Figure 6-5, the times at which the water depletes (from Figure 6-4)
and when shrinkage occurs in these lower replacement volume mixtures are
similar, though not exactly the same. It is expected that the time at which
shrinkage would begin would actually occur at a slightly earlier time since all the
IC water may not be available in the actual measurements though it is assumed
to completely be so in Figure 6-4. The time at which water depletes (from
chemical shrinkage) and the time to the beginning of shrinkage is very similar for

85
low replacement volumes (<14.3%), however, when the volume replacement is
larger, the curves diverge.
0 5 10 15 20 25 30 35Percent LWA-K (%)
0
1
2
3
4
5
6
7
Ag
e o
f S
pec
imen
(d
)
Time to water depletion(From Figure 6-4)Time to onset of shrinkageTime to water depletion (Considering only chemical shrinkage)
Mixtures do notshrink
Figure 6-5 – Time of water depletion from the SLWA versus the time when the mixtures begin to shrink as measured by the corrugated tubes and sealed prisms
Another important feature to note is that there is not a significant benefit of using
replacement volumes larger than that needed to eliminate self-desiccation
(25.3%k) in the sealed case; however, in the drying case to be presented
subsequently, some additional benefits can be observed. The volume and
distribution of water in the 25.3%k mixture is sufficient to eliminate self-
desiccation. The additional water provided by the 29.3%k and 33.0%k mixtures
would have no voids to fill in the paste and some IC water would simply remain
stored in the LWA.

86
To better understand the effectiveness of these systems, the 7 d free shrinkage
was plotted against the replacement volume of LWA-K, as shown in Figure 6-6.
When a lower replacement volume (7.3%k) is used, the shrinkage is very similar
to that of the plain mixture. When larger replacement volumes are used, the
system becomes more effective in decreasing the shrinkage.
0 5 10 15 20 25 30 35Percent LWA-K (%)
-500
-400
-300
-200
-100
0
100
200
300
400
500
Str
ain
(
)
7 d free shrinkage (sealed)7 d free shrinkage (unsealed)
Figure 6-6 – 7 d free shrinkage measurements plotted as a function of the replacement volume of LWA-K (3 samples are shown for each mixture)
6.5.1.2. Unsealed Curing Conditions
Figure 6-7 shows the average unrestrained length change from three replicate
samples of each mixture exposed to drying. The first 24 h of the unsealed
specimens are the same as the sealed specimens (Figure 6-3). After 24 h, the
specimens were exposed to drying. As expected, the plain mixture shows the
most shrinkage during the first 28 d. The 7.3%k mixture performed similar to the
plain mixture. The 11.0%k mixture has a large expansion during the first day,

87
however when the sample was exposed at 24 h, it shrinks rapidly. After 28 d of
testing, the 11.0%k mixture has a similar shrinkage performance as the plain
mixture. As the LWA replacement volume is increased, the shrinkage
performance improves.
0 7 14 21 28Age of Specimen (d)
-800
-600
-400
-200
0
200
400
Str
ain
(
)
Unsealed33.0%k
29.3%k
25.3%k18.3%k
14.3%k
11.0%k
7.3%k
0.0%
Figure 6-7 – Free shrinkage results of plain and LWA-K mortar mixtures in unsealed curing conditions
Figure 6-6 shows the 7 d free shrinkage of the unsealed samples. Low
replacement volumes proved to be ineffective in mitigating shrinkage caused by
the combined effects of external and internal drying. However, when the
replacement volume is increased beyond a critical level, the shrinkage is
decreased. When high replacement volumes are used, the benefits are similar in
Figure 6-6.
The mass loss of the LWA-K samples during testing can be seen in Figure 6-8.
The larger the replacement volume the more mass loss occurred. The larger the

88
replacement volume the more mass loss occurred. This general trend can be
seen in Figure 6-9. This is what would be expected since there is more total
(mixture and IC) water which can be lost as drying progresses.
0 7 14 21 28Age of Specimen (d)
-40
-35
-30
-25
-20
-15
-10
-5
0
Mass
Loss
(g)
33.0%k29.3%k25.3%k18.3%k14.3%k11.0%k7.3%k0.0%
Figure 6-8 – Mass loss of LWA-K free shrinkage samples in unsealed curing conditions

89
0 5 10 15 20 25 30 35Percent Lightweight Aggregate (%)
-40
-35
-30
-25
-20
-15
-10
-5
0
Mas
s C
han
ge
(g)
28 d mass loss
Figure 6-9 – 28 d mass loss measurements for unsealed free shrinkage measurements plotted as a function of the replacement volume of LWA-K
6.5.2. Different LWA Volume Replacements on Restrained Shrinkage
6.5.2.1. Sealed Curing Conditions
The results of the restrained shrinkage tests performed in the plain mixture along
with the mixtures containing LWA-K expanded shale are shown in Figure 6-10 for
the sealed samples. When small volume replacements of LWA are incorporated,
only a small beneficial effect can be observed. For example, the 0.0 % mixture
cracked on the sixth day while the mixture containing 3.8%k LWA cracked at 7.5
d and the 7.3%k mixture cracked at 12 d. The LWA mixtures show a decreasing
residual strain at the time of cracking. This may be due to a reduced strength or
elastic modulus. When larger replacement volumes are used, it can be seen that
cracking can be substantially reduced. Testing of the 14.3%k mixture was
stopped after 19 d (with only a residual strain of -13 με). Testing of the 25.3%k
mixture was stopped after 13 d and had not developed any residual strain (likely

90
due to a slight expansion). It should be noted that the strain measured us the
strain in the steel ring, however this can be approximated as the strain in the
mortar (Radlinska et al. 2008a).
The performance of the mixtures as a function of SLWA replacement volume
fraction is presented in Figure 6-11 for both sealed and unsealed samples. It can
be seen that low SLWA volume fractions crack at an early age, however as the
replacement volumes are increased to a sufficient percentage, the time to
cracking is greatly extended.
0 2 4 6 8 10 12 14 16 18 20Age of Specimen (d)
-60
-50
-40
-30
-20
-10
0
10
Str
ain
()
Sea led25.3%k
14.3%k11.0%k7.3%k3.8%k
0.0%
Figure 6-10 – Restrained shrinkage results of plain and LWA-K mortar mixtures in sealed curing conditions (In each case, a typical response is shown from the
three samples tested). Sharp vertical rise in strain curve indicates occurrence of cracking in the specimen

91
0 5 10 15 20 25 30 35Percent LWA-K (%)
0
5
10
15
20
25
30
Ag
e o
f S
pec
imen
(d
)
Time of cracking (sealed)Time of cracking (unsealed)
Mixtures did not crack
Figure 6-11 – Time of cracking in LWA-K mixtures plotted as a function of replacement volume (3 samples are shown for each mixture)
6.5.2.2. Unsealed Curing Conditions
Figure 6-12 shows the strain measured from the inner surface of the restrained
ring. The plain mixture cracks after approximately 2 d. The times to cracking for
the mixture with replacement volumes less than 14.3 % were similar to that of the
plain mixture, though some cracked at a lower strain. This is likely due to water
depleted during the first days due to self-desiccation combined with rapid water
loss due to evaporation. When a larger replacement volume was used (25.3%k),
the time to cracking was prolonged to approximately 8 d. With a further increase
in the replacement volume (29.3%k), cracking was delayed to 14 d. During the
14 d of testing, the 33.0% mixture did not crack and showed little shrinkage strain
under these testing conditions.

92
0 2 4 6 8 10 12 14Age of Specimen (d)
-60
-50
-40
-30
-20
-10
0
10
Str
ain
()
Unsealed33.0%k
29.3%k25.3%k14.3%k11.0%k7.3%k
0.0%
Figure 6-12 – Restrained shrinkage results of plain and LWA-K mortar mixtures in unsealed curing conditions (In each case, a typical response is shown from the three samples tested). Sharp vertical rise in strain curve indicates occurrence of
cracking in the specimen
The performance of the mixtures as a function of SLWA volume fraction is
presented in Figure 6-11. It can be seen that low SLWA volume fractions crack
at an early age; however as the replacement volumes are increased to a
sufficient percentage, the time to cracking is greatly extended or cracking is
eliminated. Figure 6-13 shows the strain at cracking for both the unsealed and
sealed curing conditions. The strain at cracking for each mixture at low
replacement volumes is the same regardless of the curing condition
(Henkensiefken et al. 2008h) (i.e., strain at cracking for the 11.0%k mixture is the
same in both sealed and unsealed curing conditions). The mixtures for which the
strains do not match are the mixtures that did not crack in sealed curing
conditions. It is expected that if the strain for the sealed samples that did not
crack (14.3%k and 25.3%k) were to approach the strain experienced by the

93
unsealed samples, they would crack. It can be said that the curing condition
does not have an effect on the strain at a cracking event.
0 5 10 15 20 25 30 35Percent LWA-K (%)
-70
-60
-50
-40
-30
-20
-10
0
10
Str
ain
(
)
Strain at cracking (sealed)Strain at cracking (unsealed)
Mixtures did not crack
Figure 6-13 – Strain at cracking in LWA-K mixtures plotted as a function of replacement volume (3 samples are shown for each mixture)
6.5.3. Different Volume Replacements on Internal Relative Humidity
Figure 6-14 shows the internal relative humidity measurements for the LWA-K
mixtures. While the specimens employed for measurement of internal relative
humidity contained no normal weight aggregates, the cement paste to SLWA
proportion was adjusted to be the same as in the corresponding mortar mixtures.
As expected, when higher replacement volumes are used, the internal relative
humidity remains higher. Again, this is related to the pore size that remains
saturated according to Equation 3-3. Because the internal relative humidity is
higher (thus the pore size that is still saturated is larger), it would be expected
that the shrinkage for higher replacements volumes in sealed curing conditions
would be less. The radius of the meniscus for the pore (approximately the pore

94
size still saturated) and the capillary stress are plotted as a function of the
replacement volume in Figure 6-15. It can be seen that a critical value exists for
the replacement volume of SLWA. When high replacement volumes (29.3%k
and 33.0%k) are used the pore size which remains saturated becomes larger.
This can be used to explain why these mixtures perform significantly better under
restrained shrinkage. The capillary stress is reduced with increasing
replacement volume.
0 1 2 3 4 5 6 7Age of Specimen (d)
80
82
84
86
88
90
92
94
96
98
100
Rela
tive
Hum
idity (%
)
33.0%k
29.3%k
25.3%k
18.3%k
14.3%k
11.0%k
7.3%k
0.0%
Figure 6-14 – Internal relative humidity measurements for the sealed LWA-K mixtures

95
0 5 10 15 20 25 30 35Percent LWA-K (%)
0
5
10
15
20
25
30
Me
nis
cus
Rad
ius
(n
m)
0
5
10
15
20
25
Cap
illa
ry S
tres
s (M
Pa)
Kelvin Radius at 7 dCapillary Stress at 7 d
Figure 6-15 – Kelvin Radius and capillary stress as determined from RH measurements as a function of replacement volume of LWA-K at 7 d
6.5.4. Effect of Particle Spacing on Internal Curing Effectiveness
To show the importance of LWA particle size and spacing on the shrinkage
performance of internal curing, a second LWA was tested. The aggregates had
similar desorption properties, as seen in Figure 3-3, but different absorption
volume. This would imply that they would give up water in a similar manner;
however the volume of water they could give up would not be the same. The
LWA-K had a 24 h absorption of 10.5 % while the LWA-H was much lower at
approximately 5.8 %. Two sets of mixtures were selected for this comparison.
The first comparison provided enough water to fill in the voids created by
chemical shrinkage. The LWA-K mixture was designated as 25.3%k, and the
LWA-H mixture was designated as 43%h. Because the LWA-H absorbed less
water, more aggregate was needed. The second comparison would have the
same replacement volume of LWA. This mixture was designated as 25.3%h, to
be compared against 25.3%k. It should be noted that the 25.3%h mixture
provided a similar volume of water as the 14.3%k mixture.

96
Figure 6-16 shows the free shrinkage results for the LWA-K and LWA-H mixtures
in sealed curing conditions. It can be seen that when a similar volume of water is
supplied (two data sets depicted with diamonds), and when that water is better
distributed in the 43%h mixture, the shrinkage performance is better. Figure 6-17
shows the restrained shrinkage results for the LWA-K and LWA-H mixtures in
unsealed curing conditions. When a similar replacement volume is used (25.3%k
and 25.3%h), the strain develops in a similar manner, however the mixture with
less water (25.3%h) cracks at an earlier age. This is what would be expected
since the mixtures have similar mechanical properties; however the mixture
containing LWA-H depletes of water earlier, resulting in earlier cracking. When
similar volumes of water (25.3%k and 43%h) are used, the mixture with more
particles and thus a better particle distribution (43%h) performs better. The
internal relative humidity tests for these mixtures can be found in Figure 6-18.
This shows that when similar volumes of water are used, the internal relative
humidity is approximately equal, which would imply a similar pore radius that is
still saturated.
0 7 14 21 28Age of Specimen (d)
-400
-200
0
200
400
600
800
Str
ain
(
)
Sealed43%h25.3%k25.3%h14.3%k0.0%
Figure 6-16 – Free shrinkage results of a comparison between LWA-K and LWA-H LWA in sealed curing conditions

97
0 2 4 6 8 10Age of Specimen (d)
-60
-50
-40
-30
-20
-10
0
10
Str
ain
(
)
Unsealed43%h25.3%k25.3%h14.3%k0.0%
Figure 6-17 – Restrained shrinkage results of a comparison between LWA-K and LWA-H LWA in unsealed curing conditions
0 1 2 3 4 5 6 7Age of Specimen (d)
80
82
84
86
88
90
92
94
96
98
100
Rel
ativ
e H
um
idit
y (%
)
43%h25.3%k25.3%h14.3%k0.0%
Figure 6-18 – Internal relative humidity results of a comparison between LWA-K and LWA-H SLWA

98
6.6. Conclusions
This chapter has presented a comprehensive data set that describes the
behavior of sealed and unsealed mortars made with SLWA. The chapter
provides an understanding of what is occurring in the mixtures with different
volume replacements of SLWA. The influence of boundary conditions (sealed or
unsealed) on the performance of self-curing concrete is described. The
inclusion of a sufficient volume of SLWA can significantly reduce self-desiccation,
reduce autogenous shrinkage and delay the time of cracking. A summary of the
general conclusions from the data presented in this chapter are:
Sealed Specimens
Specimens with larger volume fractions of SLWA showed a greater
reduction in both the rate of shrinkage and the autogenous shrinkage.
This can be attributed to the ability of the SLWA to supply water to the
hydrating paste, which acts to reduce the effects of self-desiccation
and maintains the internal relative humidity at a higher level.
Similar free shrinkage and cracking behavior was observed between a
plain mixture and mixtures with low volumes of SLWA replacement.
This may be due to the fact that the SLWA particles are spaced too far
apart to effectively supply water to all the paste or that the IC water
supply is depleted too early in the hydration process. The time to
cracking can be prolonged if a sufficiently high replacement volume of
SLWA is incorporated.
Self-desiccation results in a reduction in the internal relative humidity of
a low water to cement ratio paste. Specimens with a larger
replacement volume of SLWA maintained a higher internal humidity as
expected.

99
Unsealed Specimens
The addition of SLWA showed a reduction in the total shrinkage during
the first 28 d. This may be due to the initial reduction in self-
desiccation and the additional water that can complete hydration and
temporarily replace the water that is lost to the environment.
A larger mass of water was lost for samples with an increasing volume
of SLWA. This is consistent with these mixtures having a larger
volume of total (mixture and IC) water.
The time to cracking is prolonged for mixtures with an increasing
volume of SLWA. As illustrated in this study, this is likely due to the
reduced shrinkage; in addition, although not specifically examined in
this study, reduced elastic modulus, increased relaxation, and
increased fracture toughness of the mixtures with SLWA could also
contribute to this increase in time to cracking.

100
CHAPTER 7. PLASTIC SHRINKAGE CRACKING IN MIXTURES MADE WITH PREWETTED LIGHTWEIGHT AGGREGATE
7.1. Introduction
Concrete can be susceptible to plastic shrinkage cracks if weather conditions
between the time of placement to the time of set are too harsh (Powers 1968;
Powers et al. 2003a; Powers et al. 2003b). Though these cracks may be
unsightly, a larger problem exists as they may lead to the ingress of harmful
materials (Qi 2003a). Lightweight aggregate for use in concrete has been
increasingly promoted for its benefits of reducing shrinkage cracking caused by
self-desiccation. While several studies have shown the beneficial effects of IC on
autogenous shrinkage and shrinkage cracking in hardened concrete (Jensen et
al. 2001a; Lura 2003a; Henkensiefken et al. 2008b), few, if any, studies have
investigated the influence of internal curing on the formation of plastic shrinkage
cracking.
This chapter provides measurements of plastic shrinkage cracking with different
volume replacements of LWA. The results indicate that if a sufficient volume of
LWA is added to concrete, plastic shrinkage cracking can be reduced or
eliminated.
7.2. Mechanisms of Plastic Shrinkage
The formation of plastic shrinkage cracks can be described by the three drying
phases which the concrete undergoes (Lura et al. 2006b). During the first drying

101
phase the cement and aggregate particles consolidate exuding water to the
surface. This water is known as bleed water. This bleed water covers the
surface of the concrete and this layer of water is then free to evaporate. The
initial evaporation rate from a free surface is from the layer of bleed water that
forms and is similar to the evaporation of bulk water (Lura et al. 2006b). This
region of evaporation is generally referred to as the first drying region (i.e., phase
(I)).
Once the layer of bleed water evaporates, liquid-vapor menisci form at the
surface of the concrete (Wittmann 1976). The formation of the liquid-vapor
menisci results in capillary pressure. This is commonly referred to as the second
drying phase (phase(II)). The Young-Laplace equation can be used to relate the
radius of the menisci to the capillary pressure (Equation 7-1):
rcap
)cos(2 Equation 7-1
where: σcap (Pa) is the capillary pressure, γ (N/m) is the surface tension of pore
fluid, θ (radians) is the liquid-solid contact angle (assumed in this work to be 0
radians), and r (m) is the radius of curvature of the meniscus. The capillary
pressure that develops further compresses the particles more resulting in particle
rearrangement and even more pore solution being expelled from the system and
being forced to the top surface of the concrete.
With greater capillary pressure, more pore solution (water) will be exuded to the
surface and water can be drawn out of the LWA. During this phase, it would be
expected that a reduction on the evaporation rate would occur. When the
capillary pressure is no longer able to compress the system and the drying front
recedes from the surface towards the interior of the concrete, the concrete is
susceptible to cracking. The transition that occurs at this point is referred to as

102
the critical point (Lura et al. 2006b). The critical point represents the point in time
when the concrete is most susceptible to cracking (Cohen et al. 1990).
In the final drying phase, the evaporation and settlement slow down as the drying
front penetrates into the interior of the pore system. This final phase of drying is
referred to as phase (III).
7.3. Constituent Materials
The coarse aggregate used was pea gravel with an apparent specific gravity of
2.58 and a 3/8 inch maximum size aggregate. The normal weight fine aggregate
used was natural river sand with a fineness modulus of 2.71 and an apparent
specific gravity of 2.58. Portions of the normal weight sand were replaced with a
manufactured rotary kilned expanded shale with a fineness modulus of 3.10 and
a specific gravity of 1.56. The 24 h absorption of the coarse aggregate was
determined to be 2.3% according to ASTM C127-04 (2004). The 24 h absorption
of the normal weight sand and LWA were determined to be 1.8 % and 10.5 %,
respectively, according to ASTM C128-07 (2007).
For the mortar mixtures, ASTM C150 Type I ordinary portland cement (OPC) was
used, with a Blaine fineness of 370 m2/kg and an estimated Bogue composition
of 56 % C3S, 16 % C2S, 12 % C3A, 7 % C4AF and a Na2O equivalent of 0.68 %.
It should be noted that for the concrete mixtures, a different cement was used
that also satisfies ASTM C150 (Type I OPC) with a Blaine fineness of 370 m2/kg
and an estimated Bogue phase composition of 50% C3S, 16% C2S, 12% C3A,
7% C4AF and 0.68% of Na2O.

103
A polycarboxylate-based high-range water-reducing admixture (HRWRA) was
added to the mortar mixtures in varying rates depending on the volume
replacement level of the LWA. For LWA replacement volumes up to 18.3 %, the
HRWRA was added at a rate of 0.50 g per 100 g of cement. For replacement
volumes larger than 25.3 %, 0.66 g of HRWRA per 100 g of cement was used.
Different rates of HRWRA were used to keep similar consistencies of these
mixtures. No HRWRA was used for the concrete mixtures.
7.4. Mixture Proportioning
7.4.1. Mortar Mixture
Five different mixtures were prepared with a w/c of 0.30. This included a plain
mortar mixture designated as 0.0 % and four mortar mixtures with varying
amounts of sand replaced by prewetted LWA, as shown in Table 7-1. The LWA
expanded shale was used for the mixtures designated as 11.0%k, 18.3%k,
25.3%k, and 33.0%k. It is important to note that the designations are on a total
volume basis. The volume of aggregate (LWA and natural sand) was maintained
constant at 55% since only the sand was replaced with LWA. The number in the
designation represents the total volume of the mixture occupied by the LWA (in
percent). It should be noted that the 25.3%k volume replacement corresponds to
the amount of LWA necessary to eliminate self-desiccation (Bentz et al. 1999b;
Bentz et al. 2005).
Table 7-1 – Mixture proportions of mortar for settlement study

104
Material 0% 11%k 18.3%k 25.3%k 33.0%k
Cement (kg/m3) 728 728 728 728 728
Water (kg/m3) 218 218 218 218 218
Fine Aggregate (kg/m3) 1418 1135 950 808 567
Dry LWA (kg/m3) 0 172 283 369 525
Additional Water
Provided by LWA (kg/m3)
0 30 39 5418
7.4.2. Concrete Mixture
Four different concrete mixtures were prepared with an effective water to cement
ratio (w/c) of 0.55: this included a plain concrete mixture designated as 0.0 %
and three mortar mixtures with varying amounts of sand replaced by prewetted
LWA, as shown in Table 7-2. The LWA expanded shale was used for these
mixtures designated as 6.0%k, 10.0%k, and 18.0%k. It is important to note that
the designations are on a total volume basis. The volume of fine aggregate
(LWA and sand) was maintained constant at 30% since only the sand was
replaced with LWA. The total aggregate content (coarse aggregate, LWA and
sand) for these mixtures was maintained constant at 60 %. The number in the
designation represents the total volume of the mixture occupied by the LWA (in
percent). It should be noted that the 18.0%k volume replacement corresponds to
the amount of LWA necessary to eliminate self-desiccation (Bentz et al. 1999b;
Bentz et al. 2005).
Table 7-2 – Mixture proportions of concrete for plastic shrinkage study

105
Material 0% 6.0%k 10.0%k 18.0%k
Cement (kg/m3) 461 461 461 461
Water (kg/m3) 254 254 254 254
Fine Aggregate (kg/m3) 774 619 518 309
Coarse Aggregate (kg/m3) 825 825 825 825
Dry LWA (kg/m3) 0 94 154 281
29.5Additional Water Provided
by LWA (kg/m3)
0 9.8 16.2
7.5. Experimental Methods
7.5.1. Settlement
The LWA was oven dried, air cooled, and then submerged in water for 24 ± 1 h
prior to mixing. The volume of water used to submerge the LWA included both
mixing water and the water the LWA would absorb in 24 h when it is immersed in
water. The excess water (water not absorbed in 24 h) was then decanted and
used as the mixing water. The mixing of the mortar was done in accordance with
ASTM C305 (2006), with a modification in the order in which the materials were
added. The LWA was added to the pre-wetted bowl, to which the normal weight
fine aggregate was added. The aggregate mixture was mixed for 30 s. The
cement was added and the mixture was mixed for another 30 s. The water (with
HWRWA) was added. The mixture was mixed at slow speed (~140 rpm) for 30 s
and then on medium speed (~285 rpm) for an additional 30 s. Mixing was
stopped for 90 s, after which mixing resumed on medium speed for 60 s.
Duplicate samples were cast in 75 mm × 100 mm (depth × diameter) cylinders in
two layers, each of which was vibrated for 15 s. The samples were placed in an

106
environmental chamber at 23.0 ± 0.1 ˚C and a relative humidity of 50 ± 0.1 % 10
m after addition was water.
Settlement was measured with a non-contact laser (Kayir et al. 2002; Qi et al.
2005), with an accuracy of 0.001 mm, at an interval of 1 m for the first 6 h. The
lasers were situated above the specimens and the laser beam was shot at the
surface of the specimen. The shift of laser beam reflected from specimen’s
surface (while laser projects a laser beam toward the specimen at a small angle)
can be used to indicate the consolidation of the sample. This concept can be
seen in Figure 7-1. The experimental setup was similar to previous work by Lura
et al., (Lura et al. 2006b).
Figure 7-1 – Laser setup for settlement test (Qi et al. 2005)

107
7.5.2. Plastic Shrinkage
The plastic shrinkage tests were performed in accordance with ASTM C1579-06
(2006). The LWA was prepared exactly like the LWA for the settlement test. The
coarse aggregate and normal weight sand were oven dried and cooled for 24 h
before mixing. The coarse aggregate, normal weight sand and lightweight
aggregate were placed into the pre-wetted mixing bowl and mixed for 30 s. After
this period, cement was added and the decanted water was slowly poured into
the dry mixture. The concrete was mixed for 3 min followed by a 2 min rest and
finished by 3 min of mixing.
The concrete was cast into plastic shrinkage molds, shown in Figure 7-2,
screeded and finished with a trowel. The samples were put into an
environmental chamber 25 min after the addition of water where they were
exposed to the following ambient conditions: temperature of 36 ± 3 ˚C, relative
humidity of 30 ± 10 % and wind velocity of 24 ± 2 km/h. The fans were turned off
after 6 h and for the remaining 18 h the specimens were exposed to the
environment without significant air circulation.
The specimens were taken out of the environmental chamber after 24 h ± 2 h,
and pictures were taken of their surfaces. The pictures were always taken from
the same height of 184 mm. Subsequently, pictures were analyzed for cracks
and crack widths using image software which enables approximately 300
measurements for each specimen, thereby provide statistically valid information
about cracks widths and their variability (Qi et al. 2003b).

108
Figure 7-2 – Geometry of the specimens used for plastic shrinkage investigation (Qi et al. 2003b)
7.6. Experimental Results and Discussion
7.6.1. Settlement
Figure 7-3 shows the settlement results for the mortar samples over a 6 h period.
The plain mixture shows more consolidation than the mixtures with LWA. It is
also interesting to note that as the volume replacement of LWA is increased, the
lower the consolidation. This is likely because as capillary stresses increase
during phase(II), water is released by the LWA to reduce the capillary stress.
The reduction in the capillary stress due to the release of water from the LWA
results in less consolidation.

109
0 1 2 3 4 5 6Age of Specimen (Hours)
0.0
0.1
0.2
0.3
0.4
0.5
0.6
0.7
0.8
0.9
1.0
Set
tlem
ent
(mm
)
0.0%11.0%k18.3%k25.3%k33.0%k
Figure 7-3 – Settlement results for mortar samples
7.6.2. Plastic Shrinkage
Figure 7-4 shows the cumulative probability distribution of crack widths occurring
in concrete mixtures made with different volume replacements of LWA. The
curves shown in Figure 7-4 are the average crack measurement of three panels.
The 0.0 % mixture shows the largest crack width. The probability of plastic
shrinkage cracks forming decreases as the LWA replacement volume increases.
When a sufficient volume of LWA is used (18.0%), plastic shrinkage cracking
was eliminated. Figure 7-5 shows the probability of cracks widths being smaller
than 0.0 mm and 0.2 mm as the volume replacement of LWA is increased. By
observing the 0.0 mm curve, it can be seen that cracking can be eliminated if a
high enough replacement volume is used. The probability of this critical crack
width opening occurring can be significantly reduced or eliminated if a high
enough replacement volume of LWA is used. Plastic shrinkage cracking can be
reduced or eliminated because the LWA provides additional water that can
replace the water that is being evaporated from the surface of the concrete. It
should be noted however, that if this water is used to eliminate plastic shrinkage

110
cracking, it will not be available to reduce the shrinkage cracking caused by self-
desiccation and drying.
0.0 0.2 0.4 0.6 0.8 1.0Crack Width (mm)
0
10
20
30
40
50
60
70
80
90
100
Cu
mu
lati
ve P
rob
abil
ity
(%) 0.0%
6.0%10.0%18.0%
Figure 7-4 – Cumulative distribution of crack width occurrences in concrete with different replacement volumes of LWA
0 5 10 15 20Percent Lightweight Aggregate (%)
0
10
20
30
40
50
60
70
80
90
100
Pro
bab
ilit
y (%
)
0.2 mm crack0.0 mm crack

111
Figure 7-5 – Probability of cracks widths being smaller than 0.0 mm and 0.2 mm at different LWA replacement volumes
The crack reducing ratio (CRR) can be calculated according to Equation 7-2.
%100
Concrete Reference of
hCrack Widt Average
Concrete Modified of
hCrack Widt Average
1
CRR Equation 7-2
Table 7-3 shows the average crack width and the CCR for the three LWA
mixtures tested. The average crack width is reduced as the LWA replacement
volume is increased. The plastic shrinkage cracking is reduced as shown by the
increase in the crack reducing ratio.
Table 7-3 – Crack reducing ratios for each LWA replacement
0.0% 0.55 0.487 0.006.0% 0.55 0.199 64.7710.0% 0.55 0.054 88.8918.0% 0.55 0 100.00
CRR (%)Volume of
LWAw/c ratio
Avg. Cr. W. (mm)
7.7. Conclusions
This chapter has presented data that describes the behavior of concrete made
with prewetted lightweight aggregate. The chapter provides an understanding of
what is occurring in these systems during the plastic state and how concrete
made with prewetted lightweight aggregate can help eliminate plastic shrinkage
cracking. This chapter has shown that if a sufficient volume of prewetted

112
lightweight aggregate is provided plastic shrinkage cracking can be reduced or
eliminated. It should be noted that the water to reduce plastic shrinkage cracking
is unavailable to alleviate the problems associated with self-desiccation and
drying.

113
CHAPTER 8. MONITORING WATER ABSORPTION IN CEMENTITIOUS SYSTEMS MADE WITH PREWETTED LIGHTWEIGHT AGGREGATE
8.1. Introduction
High performance concrete (HPC) mixtures have been increasingly promoted
due to potential long-term benefits in performance (FHWA 2006). HPC mixtures
generally have a low water-to-cement ratio (w/c) and may contain finely ground
supplementary cementitious materials, (e.g., silica fume). While the fine pore
system is beneficial for increased strength (Shah et al. 1994) and reduced fluid
transport (El-Dieb et al. 1995; Khan et al. 2002), the finer pore network can lead
to increased volumetric changes in sealed systems as a result of self-desiccation
(Shah et al. 2000). This volume change (autogenous shrinkage) is problematic
as it can result in cracking if the concrete is restrained from shrinking freely.
One strategy to mitigate autogenous shrinkage is the incorporation of water filled
inclusions (Jensen et al. 2001a; Lura 2003a; Mohr 2005). The use of prewetted
lightweight aggregate (SLWA), enables water (from the SLWA) to be supplied to
the paste after setting (Henkensiefken et al. 2008g), thereby reducing the effects
of self-desiccation. This strategy has proven to be quite effective in reducing
autogenous shrinkage and cracking (Henkensiefken et al. 2008b; Henkensiefken
et al. 2008e).
The influence of SLWA inclusions on the fluid transport and water absorption
properties of concrete is much less understood. This study provides
experimental results to quantify the performance of plain and SLWA systems in

114
absorption tests and electrical conductivity measurements. The performance of
the SLWA systems is related to aspects of the pore structure of the paste, the
pore structure of the SLWA, and the pore structure of the interfacial transition
zone.
8.1.1. Background in Sorptivity
The durability of concrete subjected to aggressive environments depends largely
on the penetrability of the pore system (Sabir et al. 1998; 2004). Three
mechanisms can be used to describe transport of water in cementitious systems:
(1) permeability, (2) diffusion and (3) absorption. Permeability is the measure of
the flow of water under a pressure gradient while diffusion is the movement of
ions due to a concentration gradient. Absorption can be described as the
materials ability to take in water by means of capillary suction. Water absorption
is an important factor for quantifying the durability of cementitious systems (Sabir
et al. 1998; Yang 2004; Neithalath 2006) and is the primary focus in this study.
The test method that is most commonly used to determine the absorption and
rate of absorption (sorptivity) of water in unsaturated hydraulic cement concretes
is ASTM C1585 (2004). This test consists of exposing the bottom surface of a
sample to water and measuring the increase in mass resulting from absorption.
Before the test is conducted, samples are conditioned for 18 days. The samples
are placed in a 50 ˚C and 80 % RH environment. After three days of conditioning,
the samples are removed from the oven and placed in individually sealed
containers where the samples are retained for 15 days to allow internal moisture
equilibrium before the test begins. The absorption test involves recording
incremental mass change measurements during the first six hours after the
sample came in contact with water and taking one measurement ever day for the

115
next eight days. The amount of absorbed water is normalized by the cross-
section area of the specimen exposed to the fluid using Equation 8-1.
d)(a
m I t
Equation 8-1
where: I (mm3/mm2) is the normalized absorbed water, mt (g) is the change in
specimen mass at time t; a (mm2) is the exposed area of the specimen (i.e., the
size of the bottom face), and d (g/mm3) is the density of the water (taken to be
0.001 g/mm3 at 23 °C).
These absorption measurements are then plotted as a function of the square root
of time. The initial sorptivity is determined for the slope of the curve during the
first six hours, while secondary sorptivity is determined using the slope of the
same measurements between one to eight days as outlined in ASTM C1585
(2004).
The initial and secondary sorptivity can be used to evaluate the connectivity of
the pore network. Additionally, the secondary sorptivity, combined with exposure
conditions, has been used for performing service life predictions (Bentz et al.
2001b).
8.1.2. Background on the Effects of Internal Curing on Sorptivity
Low w/c mixtures undergo self-desiccation, even in sealed curing conditions.
Self-desiccation occurs as a result of chemical shrinkage. During hydration, the
hydration products occupy a volume that is approximately 10 % smaller than the
initial reactants (La Chatelier 1900; L'Hermite 1960; Sant et al. 2006). This
results in the creation of vapor filled voids inside the concrete (Couch et al.
2006). These vapor-filled voids grow with increased hydration and penetrate

116
smaller and smaller pores. Lightweight aggregate can be used as a water
reservoir to supply water to replenish the water demanded by the hydrating
cement paste thereby reducing the vapor-filled voids and therefore mitigating the
effects of self-desiccation in low w/c concrete mixtures. A more thorough
description of this process can be found elsewhere (Henkensiefken et al. 2008b;
Radlinska et al. 2008b).
The inclusion of SLWA is thought to influence the absorption of water, the
explanations can provide expectation for both an increase and/or a decrease in
the water absorption. The following section will discuss these explanations.
At first glance, one would think the incorporation of porous inclusions (i.e., LWA)
would result in an overall increase in the porosity of the system. The pores in the
LWA are large and in the size range of or slightly larger than large capillary
pores. As a result, the addition of larger pores into the system could result in
higher water absorption.
However, alternate reasons exist to explain why a reduction in the water
absorption could also occur. When water leaves the LWA, the paste continues to
hydrate resulting in a more dense microstructure in the paste. This can be
attributed to additional water being provided to hydrate the paste. This is similar
to the supply of extra water from external curing. This concept is shown using
Power’s Model in Figure 8-1(a) for cement paste with a w/c of 0.30. As the paste
hydrates, hydration products are formed. When the water supply is exhausted,
hydration ceases. In the case of a paste with a w/c of 0.30, hydration stops at a
degree of hydration of 0.73 for hydration under sealed conditions.

117
If the system were not sealed and additional water is supplied, hydration can
continue as water can fill in the voids caused by chemical shrinkage. Figure
8-1(b) shows Power’s Model for the 11.0%k mixture, which provides an extra 3.2
% volume of water (by total volume) to the system. The mixture proportions,
which will be covered in a later section can be found in Table 8-1. Note that this
water is not included in the total volume used to calculate the porosity (shown as
being greater than 1) since it is not part of the paste pore structure at the time of
setting when the pore structure has formed. After approximately 32 % hydration,
the water in the LWA has been drawn out of the LWA by the underpressure in
the fluid to “fill the voids created by chemical shrinkage.” During this process, the
water from the LWA has resulted in further hydration. The theoretical maximum
degree of hydration for the 11.0%k mixture would occur when the system runs
out of water at approximately 0.77. The 25.3%k mixture provides more water for
the cement to hydrate and hydration for the 25.3%k mixture is complete at 0.83.
This is shown in Figure 8-1(d). The maximum theoretical degree of hydration
increases as the volume replacement increases but comes to a limiting value at
25.3%k. This is because at that degree of hydration, no pore space remains
within the hydrating specimen. It is believed that the water provided does not
leave the LWA before set (Henkensiefken et al. 2008g), which explains why the
initial porosity would be expected to be the same for the paste in these mixtures.
The continued hydration that occurs due to the additional water from the LWA
results in a denser microstructure which slows the ingress of water into the
system (Bentz et al. 1999b).

118
Table 8-1 – Mixture proportions for water absorption study
Material 55/0.25 55/0.30 55/0.35 11.0%k 25.3%k
Cement (kg/m3) 793 728 674 728 728
Water (kg/m3) 198 218 236 218 218
Fine Aggregate (kg/m3) 1418 1418 1418 1135 808
Dry LWA (kg/m3) 0 0 0 172 369HRWRA (g / 100 g cement) 0.75 0.5 0.60 0.50 0.66
0 39Additional Water Provided
by LWA (kg/m3)0 0 18
0 0.2 0.4 0.6 0.8 1Degree of Hydration
0
0.1
0.2
0.3
0.4
0.5
0.6
0.7
0.8
0.9
1
Vo
lum
e R
atio
Cement
Gel Solid
Gel Water
Capillary Water
Chemical Shrinkage
0.73
0 0.2 0.4 0.6 0.8 1
Degree of Hydration
0
0.1
0.2
0.3
0.4
0.5
0.6
0.7
0.8
0.9
1
Vo
lum
e R
atio
Cement
Gel Solid
Gel WaterCapillary Water
Chemical ShrinkageLWA Water
0.77
(a) (b)

119
0.0 0.2 0.4 0.6 0.8 1.0Degree of Hydration
0.0
0.1
0.2
0.3
0.4
0.5
0.6
0.7
0.8
0.9
1.0
Vo
lum
e R
atio
Cement
Gel Solid
Gel Water
Capillary Water
LWA Water
0.83
0 5 10 15 20 25 30 35
Percent LWA-K (%)
0.7
0.72
0.74
0.76
0.78
0.8
0.82
0.84
De
gre
e o
f H
ydra
tio
n (
%)
Maximum theoretical degree of hydration (w/c = 0.30)
(c) (d)
Figure 8-1 – Powers model showing the phase distribution for (a) 55/0.30, (b) 11.0%k and (c) 25.3%k mixtures, and (d) the maximum theoretical degree of
hydration as a function of LWA volume
The last aspect to consider for a reduction in the water absorption is that the ITZ
of the normal weight aggregate (NWA) could be percolated across the 3D
microstructure, and the inclusion of the LWA could depercolate the ITZ due to its
continued hydration (Winslow et al. 1994; Bentz 2008a). If LWA, with its more
dense ITZ (Zhang et al. 1990; Lo et al. 2004), were added to the system, the ITZ
may not be percolated as much resulting in a lower absorption. The effect of
different volume replacements of LWA on ITZ percolation was simulated using
the hard core/soft shell model developed at the National Institute of Standards
and Technology (NIST) (Lu et al. 1992; Maekawa et al. 1999; Bentz et al.
1999a). This was similar to the method used by Bentz (Bentz 2008a) to
determine the ingress of chloride in mortars. The aggregate particles (both LWA
and NWA) are represented as circular ‘hard cores’ and the ITZ around the
normal weight aggregates only is represented as a surrounding ring or ‘soft
shell’. The results of simulations for the mortars investigated in this study are
shown in Figure 8-2. As the replacement volume of LWA increases, the volume

120
of ITZ around the NWA decreases (Elsharief et al. 2005). This implies that as
more LWA is used, the less porous ITZ around the LWA results in a reduction in
absorption. As more LWA is used, the potential for percolation of the NWA ITZ
decreases. If enough LWA is used, the ITZ of the NWA would depercolate. For
these two reasons, it is expected that the absorption of mortars with LWA could
be less.
0 5 10 15 20 25 30 35Volume Percent of
Lightweight Aggregate
0.00
0.01
0.02
0.03
0.04
0.05
0.06
0.07
0.08
0.09
0.10V
olu
me
Fra
ctio
n
(To
tal V
olu
me
Bas
is)
Total NWA ITZ PastePercolated NWA ITZ Paste
Figure 8-2 – ITZ percolation as a function of replacement volume of LWA
8.2. Materials
ASTM C150 Type I ordinary portland cement (OPC) was used in this study, with
a Blaine fineness of 370 m2/kg and an estimated Bogue composition of 56 %
C3S, 16 % C2S, 12 % C3A, 7 % C4AF and a Na2O equivalent of 0.68 %.
A polycarboxylate-based high-range water-reducing admixture (HRWRA) was
added in varying rates depending on the mixture. For the mixture with a w/c of
0.25, the HRWRA was added at a rate of 0.75 g per 100 g of cement. For the
mixture with a w/c of 0.30, the HRWRA was added at a rate of 0.70 g per 100 g

121
of cement. For the mixture with a w/c of 0.35, the HRWRA was added at a rate
of 0.60 g per 100 g of cement. For LWA mixtures the HRWRA was added at a
rate of 0.50 g per 100 g of cement. Different rates of HRWRA were used to keep
similar consistencies (i.e., workability) of these mixtures.
The normal weight sand used was natural river sand with a fineness modulus of
2.71 and an apparent specific gravity of 2.58. Portions of the normal weight sand
were replaced with rotary kilned expanded shale with a fineness modulus of 3.10
and a specific gravity of 1.56 (LWA). The 24-hour absorption of the LWA was
determined to be 10.5 % according to ASTM C128-07 (2007).
8.2.1. Mixture Proportioning
Five different mixtures were prepared which consisted of three plain mortar with
different w/c and a constant volume fraction of fine aggregate (designated as
55/0.25, 55/0.30, and 55/0.35) with the number on the left representing the
volume fraction of fine aggregate and the number on the right representing w/c.
Two mortar mixtures were prepared with different volumes of sand replaced by
prewetted LWA and a w/c of 0.30. These mixtures were designated as 11.0 %
and 25.3%. It is important to note that though the designations are on a total
volume basis, the volume of aggregate (LWA and sand) remained constant at
55% since only the sand was replaced with LWA. The numbers in the
designations for the LWA mixtures represents the total volume of the mixture
occupied by the LWA (in percent). It should be noted that the 25.3%
corresponds to the amount of LWA necessary to eliminate self-desiccation. A
list of the mixture proportions can be found in Table 8-1.

122
8.2.2. Mixing Procedure
The mixing procedure used for the mortar was in accordance with ASTM C192-
06 (2006) while the procedure for the paste was in accordance with ASTM C305-
06 (2006). The LWA was oven dried, air cooled, and then submerged in water
for 24±1 h prior to mixing. The volume of water used to submerge the LWA
included both mixing water and the water the LWA would absorb in 24 h. The
excess water (water not absorbed in 24 h) was then decanted and used as the
mixing water. The normal weight sand was oven dried and cooled for 24 h
before mixing. For the plain mortar mixtures and the paste, the water and
cement was conditioned for 24 h at room temperature.
8.3. Experimental Methods
8.3.1. Degree of Hydration
To measure the degree of hydration, fresh cement paste (in the case of LWA
mixtures, paste with LWA) was cast that was identical to the mortar without NWA
in air-tight plastic vials. At an age of 1 d, 7 d, 28 d, and 56 d, approximately 10 g
of cement paste was crushed and placed in ceramic crucibles. The samples
were placed in an oven at 105 ºC for 24 h. The sample was weighed and then
placed in a furnace at 1050 ºC for 3 h. The weights were recorded to monitor the
evaporable and non-evaporable water contents. The measurements were
corrected to account for loss on ignition of the cement. There is no measured
loss-on-ignition for the LWA since it goes through a furnace during
manufacturing.

123
8.3.2. Sorptivity
Five 100 mm × 200 mm cylinders were cast for each mixture. After one day of
curing, the samples were demolded and three 50 mm ± 2 mm samples were cut
from the central portion of each cylinder with a wet saw. The samples were
sealed in double plastic bags until they reached ages of 4 d, 7 d, 28 d, and 90 d.
After curing in the plastic bags was complete, samples were conditioned by
placing them in a desiccator over a potassium bromide (KBr) salt solution which
provided an 80% relative humidity at 50°C (Greenspan 1977). The desiccator
was placed in an oven at 50°C for three days. The samples were removed then
stored in sealed containers for 15 days to allow the moisture to equilibrate within
the samples. It should be noted that the 1 d samples were not stored in plastic
bags but were placed directly in the desiccator after cutting. Once the samples
were removed from the sealed containers, the side surface was sealed with
aluminum tape and the top surface was covered with plastic to avoid evaporation
from the sample during testing. After the samples were prepared, testing
occurred in accordance with ASTM C1585-04 (2004).
8.3.3. Electrical Impedance Spectroscopy
After the sorptivity measurements were completed (120 d), the conductivity of the
samples was measured using electrical impedance spectroscopy (EIS). The
samples were vacuum saturated using tap water and weighed. After EIS testing,
the samples were oven dried at 105 ºC until mass equilibrium was reached (until
the difference between two successive 24 h measurements was less than 0.1
%). This was done to determine the total volume of water that was in the system
after vacuum saturation.
Electrodes were placed on the top and bottom surface of the samples; however
contact issues with the samples and electrode existed (Ford et al. 1998; Weiss et

124
al. 2008). For this reason, wet sponges were placed between the samples and
the electrodes. Two other methods were compared with the wet sponges. The
first involved placing conductive silver paint and copper electrodes on the
surfaces of the samples before the EIS measurements were taken. The second
method involved placing conductive gel (Conductor transmission gel 4238)
(Thomas 2008) on the top and bottom surfaces to which the electrodes were
attached. The methods were applied on 3 different samples and similar results
were achieved. The wet sponge method was selected instead of the conductive
gel and conductive silver paint because of its simplicity. After a reliable method
was determined all the samples were tested. The impedance measurements
were made over a frequency range of 10 MHz to 10 Hz using a 500 mV AC
signal.
8.4. Experimental Results and Discussion
8.4.1. Effects of Internal Curing on the Degree of Hydration
Figure 8-3 shows the degree of hydration (DOH) for five of the mixtures tested.
As the w/c increases, the DOH also increases. The 11.0%k mixture has slightly
higher DOH than the 55/0.30. This is likely due to the fact that a small volume of
additional water in the LWA is added in the 11.0%k mixture. The 25.3%k mixture
has a higher DOH than the 55/0.30 mixture and it is approaching the DOH of the
55/0.35 mixture. Again this is due to the extra water provided by the LWA
hydrating more cement.

125
0 25 50 75 100 125 150 175 200 225Age of Specimen (d)
30
40
50
60
70
80
Deg
ree
of
Hyd
rati
on
(%
)25.3%k11.0%k55/0.3555/0.3055/0.25
Figure 8-3 – Degree of hydration
8.4.2. Effects of Internal Curing on Initial and Secondary Sorptivity
Figure 8-4(a) through Figure 8-4(d) shows the initial and secondary rate of water
absorption results for samples cured for 1, 7, 28 and 90 d. The absorbed water
is expressed as grams of water per volume of paste. The volume of cement
paste in the mortar samples was approximately 45%.
Comparing the mixtures with a similar w/c (55/0.30, 11.0%k, 25.3%k), it can be
seen the absorption for the 55/0.30 was the highest with the absorption
decreasing with increasing LWA replacement volume. It can also be seen that
the 25.3%k mixture has a lower absorption than the 55/0.25 mixture. This
behavior was observed on all sorption tests performed on samples cured for
different periods. The lower absorptions seen are likely due to the increased
hydration, the fact the LWA is not re-saturating due to an improved interfacial
transition zone and the depercolation of the interfacial transition zone.

126
Figure 8-5(a) shows the initial rate of absorption for samples cured for different
periods. The addition of LWA reduces the initial rate of absorption. Comparing
the mixtures with a similar w/c (55/0.30, 11.0%k, 25.3%k), the 55/0.30 mixture
exhibits the highest initial sorptivity with lower sorptivity being observed with
increasing volume replacement of LWA. The 25.3%k mixture has an even lower
initial sorptivity than the 55/0.25 mixture. Mixture 11.0%k has an average
reduction of 4% on initial sorptivity and 1% on secondary sorptivity. Mixture
25.3%k has an average reduction of 46% on initial sorptivity and 28% on
secondary sorptivity.
Longer curing times reduce the initial sorptivity. However the main portion of the
reduction of initial sorptivity in samples containing LWA is reached during the first
week of curing. The 11.0%k mixtures reach a sorptivity that is similar to the
55/0.25 mixture when samples are cured for 90 d. All the 25.3%k mixtures reach
lower initial sorptivity values than 55/0.25 mixtures.
When samples without LWA are analyzed a considerable difference is observed
when the w/c changes. Mixture with higher w/c (55/0.35) have an important
reduction of the rate of absorption when longer curing times are allowed.
Mixtures with w/c 0.3 show a reduction in the absorption for the first day. The
mixture with w/c 0.25 does not show a statistically significant difference on
sorptivity with the change of curing time.

127
0 10 20 30 40 50 60 70 80 90 100 110 120
Time (min1/2)
0
5
10
15
20
25
30
35
40
45
Ab
sorb
ed w
ate
r(1
0-3 g
ram
of
wat
er /
cm
3 o
f p
aste
)
55/0.35 - 1 d55/0.30 - 1 d55/0.25 - 1 d11.0%k - 1 d25.3%k - 1 d
0 10 20 30 40 50 60 70 80 90 100 110 120
Time (min1/2)
0
5
10
15
20
25
30
35
40
45
Ab
sorb
ed w
ate
r(1
0-3 g
ram
of
wat
er /
cm
3 o
f p
aste
)
55/0.35 - 7 d55/0.30 - 7 d55/0.25 - 7 d11.0%k - 7 d25.3%k - 7 d
(a) (b)
0 10 20 30 40 50 60 70 80 90 100 110 120
Time (min1/2)
0
5
10
15
20
25
30
35
40
45
Ab
sorb
ed w
ate
r(1
0-3 g
ram
of
wat
er /
cm
3 o
f p
aste
)
55/0.35 - 28 d55/0.30 - 28 d55/0.25 - 28 d11.0%k - 28 d25.3%k - 28 d
0 10 20 30 40 50 60 70 80 90 100 110 120
Time (min1/2)
0
5
10
15
20
25
30
35
40
45
Ab
sorb
ed w
ate
r(1
0-3 g
ram
of
wat
er /
cm
3 o
f p
aste
)
55/0.30 - 90 d11.0%k - 90 d25.3%k - 90 d
(c) (d)
Figure 8-4 – Sorption test on samples cured for (a) 1d, (b) 7 d, (c) 28 d, and (d) 90 d
Figure 8-5(b) shows the secondary rate of absorption. Similar to the initial
sorptivity, the 25.3%k mixture produces a reduction of the secondary rate of
absorption. This reduction is comparable with the one obtained using a plain
mixture with w/c of 0.25. Results from 11.0%k mixture can not be clearly
distinguished from 55/0.30 mixture, likely because of variability of the results.

128
0 7 14 21 28 35 42 49 56 63 70 77 84 91
Length of curing period (d)
0
5
10
15
20
25
30
Init
ial
So
rpti
vity
(1
0-4 m
m3/m
m2 /
s1/2 )
55/0.3555/0.3055/0.2511.0%k25.3%k
0 7 14 21 28 35 42 49 56 63 70 77 84 91
Length of curing period (d)
0.0
1.0
2.0
3.0
4.0
5.0
6.0
7.0
Sec
on
dar
y S
orp
tivi
ty
(10-4
mm
3 /m
m2/s
1/2)
55/0.3555/0.3055/0.2511.0%k25.3%k
(a) (b)
Figure 8-5 – (a) Initial rate of absorption, and (b) secondary rate of absorption for samples cured for different periods
8.4.3. Effects of Internal Curing on the Amount of Absorbed Water During the
Sorption Test
Figure 8-6 shows the cumulative absorbed water after 8 d of testing for samples
cured for different periods. All the mixtures exhibit a decrease in the total amount
of absorbed water when a longer curing period is used. A longer curing period
will provide more time to develop a more dense internal structure reducing the
size and connectivity of the pore network.
It can be observed that the mixture with a lower replacement volume (11.0%k)
has a lower absorption than 55/0.30 mixture. The 25.3%k mixture has a lower
total absorption than the 55/0.25 mixture. Mixture 11.0%k has an average
reduction of 8% on absorbed water after 8 d of test. Mixture 25.3%k has an
average reduction of 38% on absorbed water after 8 d of test.

129
0 7 14 21 28 35 42 49 56 63 70 77 84 91
Length of curing period (d)
0
5
10
15
20
25
30
35
40
45
Ab
so
rbed
wat
er a
t 8
day
s (1
0-3 g
ram
of
wat
er /
cm
3 o
f p
aste
)
55/0.3555/0.3055/0.2511.0%k 25.3%k
Figure 8-6 – Cumulated absorbed water for samples at 8 d
Figure 8-7(a) shows the relationship between the amount of absorbed water at 8
d and the w/c for samples cured for 28 d. Because of the continued hydration of
the LWA mixtures, they exhibit behavior of a lower w/c mixture. An “equivalent
w/c” (i.e., the w/c that would exhibit a similar absorption to the absorption in the
LWA mixtures) is shown in Figure 8-7(a). The 11.0%k has performance similar
to that of a w/c of 0.28, while the 25.3%k mixture has a performance equivalent
to a w/c of 0.23. A similar relationship for the conductivity measurements is
shown in Figure 8-7(b). The ‘equivalent w/c” for the 11.0%k mixture and 25.3%k
mixture are 0.29 and 0.23, which are similar to the results from Figure 8-7(a).
Due to the continued hydration, the porosity of the LWA mixtures will be reduced
as compared to the 0.0 % mixture. Figure 8-7(c) shows porosity (excluding the
gel porosity) of the mixtures as a function of the amount of absorbed water at 8 d
for the samples cured for 28 d. The porosity is also plotted as a function of the
conductivity in Figure 8-7(d), and a similar result is seen. Mixture 11.0%k and
25.3% have an average reduction of 13% and 53% on conductivity respectively.

130
0.20 0.25 0.30 0.35 0.40
water - cement ratio
0
5
10
15
20
25
30
35
40
45A
bso
rbe
d w
ate
r at
8 d
ays
(10-3
gra
m o
f w
ate
r / c
m3 o
f p
aste
)P lain - 28 d
11.0%k - 28 d
25.3%k - 28 d
Past e w /c = 0.30 - 28 d
0.23 0.28
0.20 0.25 0.30 0.35 0.40
water - cement ratio
0
2
4
6
8
10
12
14
16
18
20
Co
nd
uct
ivit
y,
(10
-3 S
/m) Plain - 28 d
11.0%k - 28 d25.3%k - 28 d
0.23 0.29
(a) (b)
0.10 0.12 0.14 0.16 0.18 0.20
Total porosity excluding gel porosity
0
5
10
15
20
25
30
35
40
45
Ab
so
rbed
wa
ter
at 8
day
s(1
0-3 g
ram
of
wa
ter
/ cm
3 o
f p
aste
)
55/0.25 - 28 d55/0.30 - 28 d55/0.35 - 28 d11.0%k - 28 d25.3%k - 28 d
0.10 0.12 0.14 0.16 0.18 0.20
Total porosity excluding gel porosity
0
2
4
6
8
10
12
14
16
18
20C
on
du
ctiv
ity,
(
10-3 S
/m) 55/0.25 - 28 d
55/0.30 - 28 d55/0.35 - 28 d11.0%k - 28 d25.3%k - 28 d
(c) (d)
Figure 8-7 – The equivalent w/c determined from (a) cumulated absorbed water at 8 d on samples cured for 28 d and (b) conductivity. Porosity as a function of
the (c) cumulated absorbed water at 8 d on samples cured for 28 d and (d) conductivity

131
8.4.4. Effects of Available Space on Both Sorptivity and Total Amount of Absorbed Water
From a fundamental point of view, sorptivity and absorbed water are directly
related to the interconnected porosity of the system as this describes the space
that is available to be filled with water during the sorption test.
Figure 8-8(a) shows the relationship between the open porosity and the initial
sorptivity. The open porosity (i.e., the porosity which can be filled with water
during the sorption test) was determined by subtracting the initial water content
from the total porosity. The initial water content can be considered the water that
is initially contained in the total porosity at the start of the sorption test. The initial
water content was determined by subtracting the oven dry weight at the end of
the sorption test from the weight at the beginning of the sorption test, resulting in
the volume of water initially in the sample. The total porosity was determined by
subtracting the oven dry weight after the sorption test from the vacuum saturated
weight, resulting in the total volume of water (i.e. the total porosity) in the sample.
From Figure 8-8(a), it can be seen that the initial sorptivity is a function of the
open porosity of the system. Figure 8-8(b) show the relationship between the
open porosity and the total absorbed water after the sorption test. A similar trend
can be seen and it can be said that the amount of water absorbed is also a
function of the open porosity.
To observe the long term absorption, mixtures cured for 28 d were monitored
past the eight days suggested by ASTM C1585 and were measured for 120
days, which is shown in Figure 8-9(a). This plot indicates that the mixtures will
continue to absorb water for an extended period of time. Because the LWA
mixtures (11.0%k and 25.3%k) continually show lower absorption than the plain
mixture (55/0.30), it can also be said that during the testing period, it does not
appear that the LWA re-saturates. It is shown that it is not until the samples are

132
vacuum saturated that the LWA appears to re-saturate. This can be seen in
Figure 8-9(b) since the LWA mixtures (11.0%k and 25.3%k) have a higher total
vacuum absorption. The LWA likely does not re-saturate during standard testing
because of the improved ITZ however it does re-saturate with a large pressure
from the vacuum forcing water through the ITZ.
0 5 10 15 20 25
Open porosity (cm3)
0
5
10
15
20
25
30
Init
ial S
orp
tivi
ty(1
0-4 m
m3 /
mm
2 /s
1/2)
1 d4 d7 d14 d28 d90 d
0 5 10 15 20 25
Open porosity (cm3)
0
2
4
6
8
10
Ab
so
rbed
wat
er
at 8
da
ys(1
0-3 g
of
wat
er /
cm
3 o
f p
aste
) 1 d4 d7 d14 d28 d90 d
(a) (b)
Figure 8-8 – Relationship between open porosity and (a) initial sorptivity and (b) total absorbed water after 8 days of sorption test

133
0 50 100 150 200 250 300 350 400 450
Time (min1/2)
0
10
20
30
40
50
60
70
80
Ab
sorb
ed w
ater
(10-3
gra
m o
f w
ate
r / c
m3 o
f p
aste
)
55/0.35 - 28 d55/0.30 - 28 d55/0.25 - 28 d11.0%k - 28 d25.3%k - 28 d
0 7 14 21 28 35 42 49 56 63 70 77 84 91
Length of curing (d)
40
50
60
70
80
To
tal a
bso
rbed
wat
er
aft
er
vacc
um
(g
)
55/0.2555/0.3055/0.3511.0%k25.3%k
(a) (b)
Figure 8-9 – (a) Long term sorption of samples cured for 28 d and (b) the total absorption for the samples after vacuum saturation
8.5. Conclusions
This chapter has described the absorption behavior of mortars made with SLWA.
The inclusion of a sufficient volume of SLWA can significantly reduce water
absorption. A summary of the general conclusions from the data presented in
this chapter are:
The addition of LWA as an internal curing agent increases the degree of
hydration which results in a more dense microstructure. The more dense
microstructure results in less water absorption, less sorptivity and a
decrease in the electrical conductivity of the samples,

134
The addition of LWA as an internal curing agent, which has its more dense
ITZ due to continued hydration, results in a system with less percolated
normal weight aggregate ITZ,
From a sorptivity and conductivity perspective, the behavior of the mixture
with 25.3% LWA performs better than a mixture with a w/c = 0.25. The
average reduction using this mixture was 46% on initial sorptivity, 28% on
secondary sorptivity, 38% on absorbed water after 8 d of test; and 53% on
electrical conductivity

135
CHAPTER 9. MECHANICAL PROPERTIES OF IC SYSTEMS MADE WITH PREWETTED LIGHTWEIGHT AGGREGATE
9.1. Introduction
The mechanical properties of concrete can play an important role in early age
durability performance. Tensile strength can describe how easily a mixture will
crack when residual tensile stress develops. Stiffness can describe how quickly
a mixture will develop tensile stress if its shrinkage is restrained. Since concrete
is a heterogeneous material, mechanical properties are affected by the
independent properties of the concrete paste and aggregate. Therefore,
substituting lightweight aggregate that is weaker and softer for normal weight
aggregate may affect the overall mechanical properties of concrete. In this
chapter, the compressive strength, tensile strength, and the modulus of elasticity
(E) of internally cured (IC) mixtures using prewetted lightweight aggregate are
investigated.
9.2. Constituent Materials
Type I ordinary portland cement was used (ASTM C 150-05) with a Blaine
fineness of 370 m2/kg, and an estimated Bogue composition of a 56 % C3S, 16 %
C2S, 12 % C3A and 7 % C4AF. Normal weight river sand was used with a
fineness modulus of 2.71 and an oven dry specific gravity of 2.58. The
lightweight aggregate used was a manufactured rotary kiln expanded shale with
a fineness modulus of 4.3, an oven dry specific gravity of 1.56, and a 24 hour
absorption value of 10.5 % by mass. A high-range water-reducing admixture

136
(HRWRA) was added at a rate of 1 g mass per 100 g of cement. Mix water
consisted of tap water conditioned to 23 ˚C ± 1˚C.
9.3. Mixture Proportions
Three mortar mixtures with varying lightweight aggregate replacement volumes
were chosen to study their mechanical properties. They are designated M-0, M-
11, and M-24 with their proportions provided in Table 9-1. M-0 was a plain
mortar while M-11 and M-24 utilized internal curing with pre-wetted fine
lightweight aggregate (LWA) at different replacement volumes. All mixtures had
a water-to-cement ratio of 0.30 by mass (w/c = 0.30) and a paste volume of 45
%. The internally cured mixtures M-11 and M-24 had 11 % and 23.7 % of the
total mixture volume comprised of LWA, respectively. It should be noted the
23.7 % replacement value corresponds to the theoretical value of internal curing
water that is required to match the chemical shrinkage calculated with Equation
2-1.
Table 9-1 – Mixture proportions for mechanical properties study
M-0 Plain
Mortar
M-11 LWA
M-24 LWA
Material (kg/m3) (kg/m3) (kg/m3)
Cement (Type I) 728 728 728
Water 218 218 218
Fine Aggregate 1444 1133 821
LWA (SSD) 0 204 409

137
9.4. Mixing Procedure
Aggregate for each mixture was batched in the oven dry state. LWA was then
presoaked for 24 h ± 0.5 h in the mix water (including the water for prewetting)
while sealed in a container. Mixing was performed in accordance with ASTM C
192-07. First, aggregate was loaded into the slightly dampened mixer. Where
applicable, the mixing water was decanted from the LWA. The mixer was started
and 50% of the total water was added. The cement and remaining mix water
containing the HRWRA were then added. The mortar was mixed for 3 min, then
rested for 3 min while the sides of the mixer were scraped, then mixed for a final
2 min.
9.5. Mechanical Property Testing
A set of 100mm x 200mm (4” diameter x 6” tall) cylinders were cast for each of
the three mortar mixtures in order to measure the development of split tensile
capacity, compressive strength, and elastic modulus. The cylinders were cast in
three lifts, rodded 25 times and vibrated after each lift. The cylinders were then
sealed in containers and cured at constant 23 ˚C ± 1˚C. Testing was performed
at ages 1, 3, 7, 28, and 90 days after mixing. Split tensile capacity was
measured in accordance with ASTM C 496/C 496M-04 where three cylinders
were loaded perpendicular to their length with a load distribution bar until splitting
was observed. Compressive strength was measured in accordance with ASTM
C 39. Neoprene end caps were utilized when testing the cylinders.
The elastic modulus was measured in accordance with ASTM C 469-02 where a
compressometer was affixed to the test cylinder which was loaded to 40% of the
ultimate load. The compressometer utilized a displacement transducer to
measure the change in length of the cylinder due to the applied compression and

138
provided continuous measurement during the loading procedure. Two cylinders
were tested for elastic modulus for each mixture at each age. No cylinder was
tested for elastic modulus at more than one age.
9.6. Results and Discussion
9.6.1. Compressive Strength
The compressive strength testing results are presented in Figure 9-1. The
internally cured mixtures M-24 and M-11 exhibited slightly lower strengths than
the plain control mixture M-0 throughout the duration of the testing. Compared to
the control M-0 mixture, M-24 showed a 2% reduction in strength until 28 day
and an 8% reduction in strength at 90 day. Mixture M-11 showed a 6% reduction
in strength until 28 day and a 2% reduction at 90 day. The reduced strength of
the IC mixtures was anticipated, and it can be explained by the replacement of
stronger sand with weaker lightweight aggregate. The observed strength of the
mixture is a result of the composite behavior of the individual strengths of the
paste and aggregate. Although the internal curing water may strengthen the
paste by providing additional hydration, the weakening effect by the presence of
weaker aggregate dominates the overall behavior.

139
9.6.2. Split Tensile Strength
Figure 9-2 shows the results of split tensile testing. Generally, the plain mixture
was slightly stronger than the IC mixtures, although a trend was difficult to
distinguish. The tensile strength of the control M-0 and M-11 mixtures were
nearly identical throughout the duration of the test. Mixture M-24 was generally
weaker than M-0 and M-11 except at 28 day when it was 10% stronger. It should
be noted that each plotted data point is the average of three split cylinder
specimens. Split tensile testing is not precise as the other testing because is
highly affected by the ability to visually identify the exact moment splitting occurs.
The minimum and maximum splitting capacity for each set of three specimens is
indicated by the error bars in the plot. It is likely that trends for split tensile
strength are similar to compressive strength where M-24 is the weakest and M-0
is the strongest.
M-0M-11M-24
0
40
80
Co
mp
ress
ive
Str
en
gth
(M
Pa)
0 10 20 30 40 50 60 70 80 90 100
Time (day)
Figure 9-1 – Compressive Strength

140
M-0M-11M-24
2
4
6
8
Sp
lit
Ten
sile
Str
eng
th (
MP
a)
0 10 20 30 40 50 60 70 80 90 100Time (day)
Figure 9-2 – Split Tensile Strength
9.6.3. Modulus of Elasticity
Figure 9-3 presents the modulus of elasticity results for the three mortar mixtures
M-0, M-11, and M-24. M-0 was the stiffest mixture and measured 31.0 GPa
(4490ksi) at 28 day. Mixture M-11 was about 4% softer than the control mixture
by measuring 29.9 GPa (4332ksi) at 28 day. Mixture M-24 was the softest
mixture and measured 26.9 GPa (3608ksi) at 28 day which was 13% less than
the control mixture. Similar behavior in all three mixtures occurred at the long
term 90 day measurement.
Increasing the lightweight aggregate replacement volume reduces the modulus
of elasticity of the mixture at early ages and long term. The observed reduction
follows the same trends observed with compressive strength and split tensile
strength. This can be explained by the replacement of sand with a relatively
softer lightweight material. The effects of modulus reduction on the restrained
cracking behavior of the mixture will be discussed later in this report.

141
M-0M-11M-24
10
20
30
40
Ela
stic
Mo
du
lus
(GP
a)
0 10 20 30 40 50 60 70 80 90 100Time (day)
Figure 9-3 – Modulus Of Elasticity
9.7. Mechanical Properties Conclusions
This chapter discussed the mechanical properties of mixtures internally cured
with prewetted lightweight aggregate. A summary of the observations are:
The compressive strength of internally cured mixtures with LWA was
reduced in the range of 2% to 8% as compared to plain mixtures without
LWA.
The split tensile capacity of internally cured mixtures using lightweight
aggregate was slightly less than the control mixture but no general trend
could be distinguished.
Internally cured mixtures with LWA were up to 13% softer than the plain
mixture without LWA.

142
CHAPTER 10. THE EFFECT OF TEMPERATURE CHANGE ON IC SYSTEMS MADE WITH PREWETTED LIGHTWEIGHT AGGREGATE
10.1. Introduction
Cementitious materials undergo volume change at early ages due to chemical
reactions, self desiccation, external drying, and thermal changes (Le Chatelier
1900; Neville et al. 1929; Lynam 1934; Powers 1947; RILEM Commission 42-
CEA 1981; Wiegrink et al. 1996; Aitcin et al. 1997; Shah et al. 1998; See et al.
2004). Residual stress develops in the cementitious material when this volume
change is restrained (Igarashi et al. 2000; Altoubat et al. 2001; See et al. 2004;
Radlinska et al. 2008). If the residual tensile stress becomes too large, cracking
may occur. This cracking is significant as it inhibits otherwise durable concrete
from reaching its potential service life by allowing deleterious materials to enter
the cracks, thereby accelerating degradation (Wang et al. 1997; Weiss 1999).
The concerns associated with early-age cracking have spurred the development
of many tests to assess a material’s cracking potential. Tests based on uniaxial
restraint such as cracking frames and temperature-stress testing machines have
been implemented by Kovler (Kovler 1994), Springenschmid (Springenschmid et
al. 1994), Lange (Altoubat et al. 2001), Marchand (Pigeon et al. 2000), and van
Breugel (van Breugel et al. 1998). Another common method that has been used
to quantify a mixture’s performance is the restrained ring method (Bentz et al.
2008). This approach has been used for nearly a century, and recently the
restrained ring test (ASTM C 1581-04) (2004) has been standardized as a
procedure to assess the shrinkage cracking potential of cementitious mixtures.
This test is performed by casting an annulus of a cementitious mixture (paste,

143
mortar, or concrete) around a steel ring. Residual tensile stress is generated in
the sample when it attempts to shrink but is restrained by the inner steel ring. A
crack results if the residual stress exceeds the developing tensile strength. This
is observed to correspond with a sudden drop in the measured strain. Stresses
and cracking time in the sample are determined by instrumenting the ring with
strain gauges.
The conventional restrained ring test has been widely used to evaluate the
restrained shrinkage cracking potential of concrete mixtures but is limited in two
significant ways. First, the test can only measure net shrinkage due to its
configuration where expanding samples come out of contact with the restraining
ring. This limitation becomes significant when studying expansive cements (Sant
et al. 2007), shrinkage reducing admixtures (Sant et al. 2006), and internal curing
(Henkensiefken et al. 2009) as these technologies may result in early age
expansion. The second limitation of the restrained ring test is that it must
operate at a constant temperature since the ASTM A53 Grade B steel pipe that is
typically used for the restraining rings will expand or contract if the temperature
changes. As a result, a temperature change would alter the level of restraint
experienced by the cementitious annulus.
This chapter discusses a test method that can evaluate the expansion of
internally cured mortars and the effects of varying temperature on restrained
cracking propensity. This test, called the dual concentric ring test, uses two
concentric restraining rings; one on the outside of the sample and one on the
inside of the sample. This enables restraint in both expansion and contraction
and measurement of the strain in the restraining elements as samples shrink and
expand. The rings are constructed from Invar, a metal with an extremely low
coefficient of thermal expansion that allows the temperature to be varied without
dramatically altering the degree of restraint. This enables the study of thermally

144
induced volume changes in addition to volume change from autogenous
shrinkage. A wide variety of temperature profiles can be selected to simulate
most field conditions. The ability of the test to induce thermal residual stresses
has the potential to quantify the restrained cracking capacity of a mixture at any
desired time. This can lead to an approach where a mixture could be tested
multiple times in the dual ring and purposely cracked at various ages with
temperature reduction to develop a cracking curve.
10.2. Experimental Equipment
10.2.1. Dual Restraining Rings Geometry and Construction
The restraining rings were fabricated from an Invar Steel alloy instead of
conventional ASTM A53 Grade B steel (used for the standard ASTM C 1581-09
single ring test) in order to minimize the effects of temperature variation on the
degree of restraint. Invar is a steel nickel alloy with a coefficient of thermal
expansion (CTE) at or less than 1.3x10⁻⁶ ε/°C (Guillaume 1904; Jacobs 1996;
Lement et al. 1996), compared to 12.0x10⁻⁶ ε/°C for conventional steel
(Nakamura 1976). For reference, the coefficient of thermal expansion of early
age mortar varies (Wittman et al. 1974; Bjontegaard et al. 1998; Sellevold et al.
2006), but is typically within the range of 8x10⁻⁶ ε/°C to 10x10-6 ε/°C.
The thermal deformation of the restraining ring directly affects the degree of
restraint of the sample during a temperature change. If a material is used for the
restraining ring with larger restraining ring CTE values it will produce a greater
reduction in the degree of restraint which results in less residual stress
development in the sample. This effect is significant because studying the
restrained thermal behavior of the sample relies on developing residual stress in
the sample during a temperature change. As a result, the more consistent the

145
geometry of the restraining element, the easier it becomes to assess the material
performance during a temperature change. The lower CTE of an Invar
restraining ring stabilizes the degree of restraint during a temperature change
and allows residual stress to be induced and measured.
The dual ring geometry is presented in Figure 10-1 where ROC and RIC are the
outer face and inner face radii of the sample respectively, ROO is the outer face of
the outer restraining ring radius, RII is the inner face of the inner restraining ring
radius, and t is the thickness of each restraining ring. The dimensions are as
follows: ROC = 203 mm ± 3 mm (8.0” ± 0.12”), RIC = 165 mm ± 3 mm (6.5” ±
0.12”), ROO = 222 mm ± 3 mm (8.75” ± 0.12”), RII = 146 mm ± 3 mm (5.75” ±
0.12”), t = 19 mm ± 3 mm (0.75” ± 0.12”), and 76.2 mm ± 3 mm (3” ± 0.12”) tall.
The measured weight of the inner ring is 11.5 kg (25.4 lb) and that of the outer
ring is 16.0 kg (35.2 lb).
Figure 10-1 – Geometry of the Dual Ring Test
Figure 10-2 - Ring in Insulation Chamber with Top Insulation Removed
It should be noted that the thickness of the restraining ring is slightly different
than the current ASTM standard. This difference is intentional since the elastic

146
modulus of Invar© EINVAR=141 GPa (20450 ksi) (Lement et al. 1996) is less than
that of the conventional steel, ESTEEL=200 GPa (29000 ksi). As a result, an Invar
ring of the same size as the standard steel ring would provide less restraint to
shrinkage. The goal of the design of the ring for this study was to match the
degree of restraint of the dual ring to that of the conventional ASTM C 1581-09
restrained ring test. The degree of restraint of a restraining ring can be
calculated by Equation 1 (Moon et al. 2006):
1Ec
Es
1
Ec
Es
1RII
RIC
2
1ROC
RIC
2
1 c ROC
RIC
2
1 c
1 s RII
RIC
2
1 s
Equation 10-1
where Ec represents the elastic modulus of the cementitious mixture, Es
represents the elastic modulus of the ring metal, νc represents Poisson’s ratio for
concrete, νs represents Poisson’s ratio for the ring metal, and Ψ is the degree of
restraint. In order to compare ring geometries, the modulus of elasticity and
Poisson’s ratio for the sample were assumed as constant values of Ec = 32 GPa
(4641ksi), and νc = 0.18. Poisson’s ratio for both the steel and Invar were
selected as νs = 0.3.
Figure 10-3 shows the relationship between the Invar ring thickness and the
degree of restraint calculated with Equation 10-1 and the above mentioned
specimen values. The degree of restraint increases as the restraining ring is
thickened. The Invar ring thickness that corresponds to a degree of restraint
equal to that of the ASTM C 1581-09 (72%) was found to be 19 mm.

147
60
70
80
90
De
gre
e o
f R
est
rain
t %
5 10 15 20 25 30 35
Ring Thickness (mm)
INVARSTEEL
Figure 10-3 - Effect of Invar Ring Thickness on DOR
10.2.2. Dual Ring Instrumentation and Data Acquisition
The stress that develops within the cementitious sample is determined by
measuring the strain in the Invar rings. Both of the Invar rings were instrumented
with four opposing CEA-00 series strain gauges (Vishay Measurements Group
2007) that were mounted at mid height. Figure 10-1 illustrates gauge locations.
The inner ring gauges were installed at mid height on the inner face of the inner
ring while outer ring gauges were installed at mid height on the outer face of the
outer ring. All gauges are operated as shunt calibrated quarter bridge circuits.
The gauges have a grid resistance equal to 120 % ± 0.3% Ω, Gage Factor 2.05
% ± 0.5 % at 24 ˚C, temperature correction of Gage Factor +1.2 ± 0.2, and an
operating temperature range of -75 ˚C to +175 ˚C (Vishay Measurements Group
2007).
The gauges were installed with a Vishay© installation kit (Vishay Measurements
Group 2005; Vishay Measurements Group 2008). Each mounting area was
sanded smooth and cleaned with an acidic solution. After neutralizing the area

148
treated with acid, the gauges were installed with M-Bond-200 modified alkyl
cyanoacrylate adhesive. The gauges were covered with Teflon tape, butyl rubber
sealant, neoprene rubber, and sealed with aluminum tape. Strain relief folds
were applied to the gauge lead wires.
A Vishay© system 5000 data scanner paired with Strain Smart© software was
used to automatically record strain gauge data at five minute intervals. Data
recording initiates immediately after the sample is sealed in the insulation
chamber which typically occurs about 30 min after water contacts cement during
mixing.
10.2.3. Strain Gauge Temperature Calibration
General practice shows that output from bonded strain gauges can change
significantly when exposed solely to a temperature change (Hannah et al. 1992;
Vishay Measurements Group 2007). This is caused by the concurrent effects of
changes in the gauge’s grid resistivity and the mismatch in thermal expansion
coefficients between the strain gage and substrate (in this case the ring).
Therefore, even though the Invar ring dimensions are nominally stable
throughout the test’s temperature range, the gauges still require thermal
correction. It should be noted that the gauges used in this test are specifically
designed for use on substrates with low thermal coefficients to minimize error
caused by temperature change. Several methods are available to correct
thermal output with varying degrees of confidence and accuracy. First hand
corrective measurement was chosen to correct the dual rings because it is the
most accurate method of thermal correction as it accounts for many gauge
specific issues (Hannah et al. 1992; Vishay Measurements Group 2007). This
involved generating a correction curve for each gauge by varying the
temperature of the rings in the unstressed state and recording the resulting

149
output. Figure 3a and Figure 3b illustrate the strain correction curves for gauges
on the inner and outer rings, respectively. It should be noted that the curved
shape of the plot is expected and is typical (Vishay Measurements Group 2007).
Strain Smart© has a function that corrects the strain output based on these
curves from temperature readings taken on the ring surface. This is
accomplished by taping a type T twisted pair thermocouple to the surface of the
ring. Since the thermal uniformity of the rings is high, as discussed later in this
paper, it is not necessary to measure temperature at every strain gauge. The
correction curves were verified by subjecting the rings to a temperature change
without a sample. Figure 3c illustrates the corrected output, and it can be seen
that once the correction is applied the gauge output varied less than 4 με when
subjected to a 45 ˚C temperature change.
10.2.4. Temperature Control System
Temperature control is provided via a programmable 28 L water bath system
pumping an ethylene glycol water mixture at 24 L/min through a looped copper
-20 -10 0 10 20 30 40 50 60 70 80
Temperature (oC)
-250
-200
-150
-100
-50
0
Co
rrec
tio
n S
trai
n (
)
Gage 1Gage 2Gage 3Gage 4
-20 -10 0 10 20 30 40 50 60 70 80
Temperature (oC)
-250
-200
-150
-100
-50
0
Co
rrec
tio
n S
trai
n (
)
Gage 5Gage 6Gage 7Gage 8
Figure 10-4 – Inner Ring Thermal Correction
Figure 10-5 – Outer ring Thermal Correction

150
coil inside the chamber. The ethylene glycol mixture enables the bath
temperature to be lowered below freezing to approximately -20 °C. Figure 4b
shows the placement of this coil on top of the restraining rings. A circular 3.2 mm
(1/8”) thick sheet of aluminum is placed on top of the rings to provide a rigid
platform for the coil. The water bath continuously monitors the temperature
delivered to the chamber by using an external probe mounted on the inlet of the
coil. This enables the system to automatically compensate for heat loss or gain
through the tubing connecting the bath to the chamber. In-line valves are
installed on the external tubing to allow the user to turn the coil flow on or off.
The system’s heating and cooling capabilities were determined by placing four
type T thermocouples on an aged mortar sample at room temperature and
varying the bath temperature as quickly as possible. The heating test targeted
an end temperature of 50 ˚C and it can be seen in Figure 5a that the maximum
temperature change the system can generate is about 1.8 ˚C per hour at a 20
degree differential between the bath and sample. The cooling test targeted an
end temperature of 13 ˚C as shown in Figure 5a. It can be seen the temperature
change rate decreases as the difference between bath and sample temperature
decreases. The maximum thermal differential recorded in the sample during
forced heating and cooling between two points spaced vertically or horizontally
on the ring was 0.3 ˚C. This indicates that forced heating and cooling produces
uniform temperatures in the sample.
10.3. Experimental Procedures
10.3.1. Mixture Proportions
Three mortar mixtures with varying shrinkage performance were chosen to study
several capabilities of the dual ring test. They are designated M-0, M-11, and M-

151
24 with their proportions provided in Table 10-1. M-0 was a plain mortar while
M-11 and M-24 utilized internal curing with pre-wetted fine lightweight aggregate
(LWA). All mixtures had a water-to-cement ratio of 0.30 by mass (w/c = 0.30)
and a paste volume of 45 %. The internally cured mixtures M-11 and M-24 had
11 % and 23.7 % of the total mixture volume comprised of LWA, respectively. It
should be noted the 23.7 % replacement value corresponds to the theoretical
value of internal curing water that is required to match the chemical shrinkage
(Bentz et al. 1999).
Table 10-1 – Mixture Proportions for Temperature Study
M-0 Plain
Mortar
M-11 LWA
M-24 LWA
Material (kg/m3) (kg/m3) (kg/m3)
Cement (Type I) 728 728 728
Water 218 218 218
Fine Aggregate 1444 1133 821
LWA (SSD) 0 204 409
10.3.2. Materials
Type I ordinary portland cement was used (ASTM C 150-05) with a Blaine
fineness of 370 m2/kg, and an estimated Bogue composition of a 56 % C3S, 16 %
C2S, 12 % C3A and 7 % C4AF. Normal weight river sand was used with a
fineness modulus of 2.71 and an oven dry specific gravity of 2.58. The
lightweight aggregate used in M-11 and M-24 was a manufactured rotary kiln
expanded shale with a fineness modulus of 4.3, an oven dry specific gravity of
1.56, and a 24 hour absorption value of 10.5 % by mass. A high-range water-
reducing admixture (HRWRA) was added at a rate of 1 g mass per 100 g of
cement. Mix water consisted of tap water conditioned to 23 ˚C ± 1˚C.

152
10.3.3. Dual Ring Specimen Mixing, Casting, and Testing Procedure
Aggregate for each mixture was batched in the oven dry state. LWA was
presoaked for 24 h ± 0.5 h in the mix water (including the water for prewetting)
while sealed in a container. Mixing was performed in accordance with ASTM C
192-07. First aggregate was loaded into the “buttered” mixer. Where applicable,
the mixing water was decanted from the LWA. The mixer was started and 50%
of the total water was added. The cement and remaining mix water containing
the HRWRA were then added. The mortar was mixed for 3 min, then rested for 3
min while the sides of the mixer were scraped, then mixed for a final 2 min.
The instrumented rings were prepared by coating the surfaces that would make
contact with the sample with form release and a layer of acetate sheet in order to
minimize friction on the sample. The fresh mortar was then cast between the two
rings in two layers. A handheld vibrator was used to consolidate each layer. The
top of the sample was struck level with the top of the ring and then capped with
the separator plate and temperature control coil. The top layers of insulation and
chamber cap were then installed to effectively seal the sample in the chamber to
control its temperature and to prevent drying shrinkage.
The temperature control system was operated at 23 ˚C ± 0.2 ˚C for a minimum of
8 h prior to casting, to bring the rings and chamber to a consistent temperature.
After casting the temperature history follows the plot in Figure 10-6. It operated at
23 ˚C ± 0.2 ˚C until 8 d when the temperature was reduced at a rate of 1˚C/h.
The temperature reduction attempted to induce a crack in the sample by utilizing
thermal shrinkage to produce additional tensile stress. The minimum
temperature applied to the sample in this study is -5 ˚C ± 0.2 ˚C.

153
-10
0
10
20
30
40
Sp
ecim
en T
emp
era
ture
(oC
)
0 2 4 6 8 10
Time (day)
Figure 10-6 – Applied Temperature in Dual Ring Testing
The strain measured on the inner ring (εIN) and outer ring (εOUT) is reported as
the average output of the four gauges on each ring. The precision of the average
strains from subsequent tests of the same mixture deviated less than 6 με.
These strains can be used to determine the time of cracking by observing a
sudden drop in readings. In addition, they can be used to calculate the residual
stress that develops in the sample (Sant et al. 2007; Henkensiefken et al. 2009).
First the pressure exerted by the sample on the inner ring PIN can be calculated
using Equation 10-2 (Moon et al. 2006):
PIN IN EINVARRIC
2RII
2
2 RIC2
Equation 10-2
The pressure exerted by the sample on the outer ring POUT is calculated by
Equation 10-3 (Moon et al. 2006):
POUT OUT EINVARROO
2ROC
2
2 ROC2
Equation 10-3

154
The two pressures obtained from ring strains are then used to calculate the
circumferential “residual” stress in the sample at RIC (σs (RIC)) by Equation 10-4:
RIC PIN
ROC2
RIC2
ROC2
RIC2
POUT
2 ROC2
ROC2
RIC2
Equation 10-4
Substituting Equation 10-2 and Equation 10-3 into Equation 10-4 yields Equation
10-5 for the ring geometry employed in this study. The residual stress (σϴ) is
output in units of MPa or PSI when units of MPa or PSI are used in the EINVAR
terms. The values for εIN and εOUT are input as actual strain.
Equation 10-5
10.4. Results and Discussion
The inner and outer ring strain history is illustrated in Figure 10-7 and Figure
10-8, respectively. Residual stress development is shown in Figure 10-9. It can
be seen the plain mortar M-0 only develops strain in the inner ring, indicating that
it only shrinks. This was anticipated as the free shrinkage as discussed
previously in this report only exhibit shrinkage. M-0 continues shrinking until it
develops a stress of 3.6 MPa (tension) at approximately 4 d, at which time it
cracks.

155
M-0M-11M-24
-40
-20
0
20
Str
ain
(
)
0 24 48 72 96 120 144 168 192 216 240
Time (h)
M-0M-11M-24
-40
-20
0
20
Str
ain
(me
)
0 24 48 72 96 120 144 168 192 216 240Time (h)
Figure 10-7 – Inner Ring
Strain History
Figure 10-8 – Outer Ring
Strain History
M-0M-11M-24
-2
0
2
4
Res
idu
al S
tre
ss
(MP
a)
0 24 48 72 96 120 144 168 192 216 240Time (h)
Figure 10-9 – Specimen Stress History
Mixture M-11 develops no expansive stress and develops a residual tensile tress
of 1.4 MPa at 8 d while operating at constant 23 ˚C ± 0.2 ˚C. The temperature
was then decreased at a rate of 1˚C/h and the resulting increase in residual
stress can be seen until the sample cracks at 3.6 MPa at 8.2 d (14.3 ˚C). This

156
indicates that the samples restrained shrinkage only developed 39 % of the
stress required to induce cracking. Also, approximately 6 με of ring strain or 0.2
MPa residual stress in the sample is generated per 1˚C of temperature change.
It can be seen that mixture M-24 develops a slight expansive strain in the outer
ring shortly after the measured time of set of 6 h. The expansion peaks at 4 με or
0.15 MPa at 11.8 h and then decreases over a period of 7 h, without producing
an opposing reaction on the inner ring. It is likely that this reduction in stress is
due to stress relaxation while the modulus of elasticity is low and the creep is
high in the sample at early age. Neither shrinkage nor expansion is observed for
the remainder of the test while temperature is held at a constant 23 ˚C ± 0.5 ˚C.
The free shrinkage history during this time shows a subtle expansion which may
not be large enough to overcome the rate of creep under restrained conditions.
After approximately 8 d, the temperature in the sample is decreased at a rate of
1˚C/h and an increase in shrinkage strain and residual tensile stress is observed.
It can be seen that the rate of ring strain and residual stress development is the
same in both the M-11 and M-24 samples. The M-24 sample does not generate
a crack by the time it reaches the minimum temperature limit of -5 ˚C.
Relative cracking potentials of M-11 and M-24 can be determined by comparing
the amount of additional residual stress required to crack the sample by
decreasing temperature. The M-11 sample required an additional 2.2 MPa of
tensile stress to induce cracking, while M-24 requires at least 3.0 MPa since it did
not crack. Therefore it can be concluded that M-11 would have a greater
potential to crack due thermal shrinkage than M-24. This can be attributed to the
amount of tensile stress in the sample immediately before the temperature
begins to decrease. Since the M-11 sample begins the cooling period with
approximately 1.5 MPa of tensile stress more than that of M-24, it is closer to its
cracking capacity. While the slight early age expansion is generally more desired

157
than shrinkage as seen in the M-24 sample, it can be seen that the volume
stability of the sample after 12 h has a greater contribution to reducing cracking
potential.
10.5. Thermal Study Summary
This chapter has described the development of a ‘Dual Concentric Ring Testing
Device’ that enables the residual stress that develops in concrete rings to be
quantified as concrete expands and contracts due to chemical reaction, hygral
shrinkage, or thermal movements. The ring used here is designed to provide a
similar degree of restraint when compared with the ASTM C 1581-09 standard
test geometry; however conceptually any geometry can be used.
The results of cooling specimens in the dual ring indicate that the internally cured
samples are more resistant to thermal cracking than plain mixtures. Larger
replacement volumes of prewetted lightweight aggregate provided more
resistance. This increased resistance of IC mixtures can be attributed to the
reduced residual stress development due to non thermal shrinkage and reduced
modulus of elasticity.

158
CHAPTER 11. EVALUATING INTERNALLY CURED MIXTURES WITH A TEMPERATURE DROP APPROACH
11.1. Introduction
This chapter will focus on the development of a temperature reduction technique
using the dual ring device presented in CHAPTER 10 to quantify the reserve
cracking strength of a fresh mixture over the first of several days after casting.
This technique is significant because it provides a more complete understanding
of the cracking propensity of a mixture as compared to the standardized
restrained ring test. This technique allows crack sensitive periods of time to be
identified and the effects of sustained stress on cracking strength to be
quantified. This chapter will show and discuss the results of the temperature
drop technique used on one plain mortar mixture and two internally cured mortar
mixtures using prewetted lightweight aggregate.
11.2. Experimental Approach
By using the temperature control system to quickly lower the temperature of the
device, additional residual stress can be generated to crack the specimen at any
time. The temperature drop approach involves casting successive specimens of
the same mixture design and forcing cracking to occur at different early ages. A
cracking stress curve for the mixture design is then generated by plotting the
cracking stress at each age. The difference in the cracking stress curve and the
residual stress history of the specimen tested at constant temperature produces
a reserve stress capacity curve.

159
Figure 11-1 illustrates how temperature reduction of the dual ring specimen may
be used to induce cracking. In this example, the temperature control system was
operated at 23 °C until 30.5 hr when the temperature was reduced. It can be
noted that the heat of hydration is not completely eliminated. Tensile residual
stress in the specimen increases as the temperature decreases. Cracking is
observed at 43.9 hr which is indicated by the sudden drop in residual stress. The
magnitude of temperature reduction required to induce cracking was 14.6 °C.
The reserve stress may be calculated by subtracting the residual stress while
operating at constant temperature (σS) from the cracking stress (σC). In this
example, the reserve stress at 43.9 hr is 3.1 MPa.
σr
0
10
20
30
Tem
per
atu
re (
oC
)
-2
0
2
4
6
Re
sid
ual
Str
ess
(M
Pa)
0 24 48 72
Time (h)
Figure 11-1 – Example Temperature Reduction

160
11.3. Experimental Program
11.3.1. Mixture Proportions
Three low w/c mortar mixtures were used in this study to evaluate internal curing
with the temperature drop approach. Mixture proportions are designated as M-0,
M-11, and M-24 are presented in Table 11-1.
M-0 Plain Mortar
M-11 SLWA
M-24 SLWA
Cement (Type I) 729 (1228) 728 (1228) 728 (1228)Water 218 (368) 218 (368) 218 (368)IC Water* 0 19.46 (32.82) 38.82 (65.49)Fine Aggregate 1444 (2435) 1126 (1900) 810 (1366)FLWA 0 189 (318) 376 (635)* Water absorbed in FLWA at set
Material
Amount
kg/m3 (lbs/yd3)
Amount
kg/m3 (lbs/yd3)
Amount
kg/m3 (lbs/yd3)
Table 11-1 –Mixture Proportions for Temperature Drop Approach
Mixture M-0 was a plain mortar while mixtures M-11 and M-24 utilize internal
curing using pre-wetted lightweight sand aggregate (LWA). All mixtures had a
water-to-cement ratio of 0.30 by mass (w/c = 0.30) and a paste volume of 45 %.
The internally cured mixtures M-11 and M-24 had 11 % and 23.7 % of the total
mixture volume comprised of LWA, respectively. It should be noted the 23.7 %
LWA replacement value corresponds to the theoretical value of internal curing
water that is required to match the chemical shrinkage (Bentz et al. 1999).
11.3.2. Materials
Type I ordinary portland cement was used (ASTM C 150-05) with a Blaine
fineness of 370 m2/kg (1809 ft2/lb), and an estimated Bogue composition of a 56

161
% C3S, 16 % C2S, 12 % C3A and 7 % C4AF. Normal weight river sand was used
with a fineness modulus of 2.71 and an oven dry specific gravity of 2.58. The
lightweight aggregate used in M-11 and M-24 was a manufactured rotary kiln
expanded shale with a fineness modulus of 4.3, an oven dry specific gravity of
1.56, and a 24 hour absorption value of 10.5 % by mass. A high-range water-
reducing admixture (HRWRA) was added at a rate of 1 g (0.0022lb) mass per
100 g (0.22lb) of cement. Mix water consisted of tap water conditioned to 23 ˚C
± 1˚C (73.4 ˚F ± 1.8˚F).
11.3.3. Dual Ring Testing Protocol
The restraining rings were prepared by coating the surfaces that would make
contact with the sample with form release and a layer of acetate sheet in order to
minimize friction on the sample. The fresh mortar was then cast between the two
rings in two layers. A handheld vibrator was used to consolidate each layer. The
top of the sample was struck level with the top of the rings and then capped with
the separator plate and temperature control coil. The top layers of insulation
were then installed. Strain gauge data is automatically recorded at five minute
intervals beginning immediately after the sample is sealed in the insulation
chamber which typically occurs about 30 min after water contacts cement during
mixing.
The temperature control system was operated at 23 ˚C ± 0.2 ˚C for a minimum of
8 h prior to casting to bring the rings and chamber to a consistent temperature.
After casting, the system operated at 23 ˚C ± 0.2 ˚C until the test ended due to
the sample cracking or when a temperature reduction was desired. The
temperature was reduced at a rate of 1˚C/h to a minimum temperature of -5 ˚C ±
0.2 ˚C.

162
11.3.4. Split Tensile, Compressive Strength, and Elastic Modulus Tests
A series of 100mm x 200mm cylinders were cast for each of the three mortar
mixtures to determine the early age split tensile strength, compressive strength,
and elastic modulus. The cylinders were cast according to ASTM C192. Testing
was performed at ages 1, 3, 5, and 7 days after mixing on three samples at each
age. Split tensile capacity was measured in accordance with ASTM C 496/C
496M-04. Compressive strength was measured in accordance with ASTM C 39.
The elastic modulus was measured in accordance with ASTM C 469-02.
11.4. Experimental Results
The temperature drop approach was applied to the four mixture designs in this
study. Eight M-0 specimens were tested and their residual stress histories are
presented in Figure 11-2. The temperature was reduced to produce cracking at 33
hr, 38 hr, 43 hr, 48 hr, 72 hr, and 79 hr. One M-0 specimen was allowed to crack
without reducing temperature at 120 hr.
Six M-11 specimens were tested and their residual stress histories are presented
in Figure 11-3. All M-11 specimens underwent temperature reductions and were
forced to crack at 42 hr, 50 hr, 72 hr, 89 hr, 108 hr, and 120 hr.
Five M-24 specimens were tested and their residual stress histories are
presented in Figure 11-4. All M-24 specimens underwent temperature reductions
but cracking was only produced at 127 hr and 197 hr. The three earliest aged
specimens reached the lower temperature limit of the control system before
cracking occurred.

163
-2
0
2
4
6
8
Res
idu
al S
tre
ss
(MP
a)
0 24 48 72 96 120 144 168 192 216
Time (h)
-2
0
2
4
6
8
Res
idu
al S
tre
ss
(MP
a)
0 24 48 72 96 120 144 168 192 216
Time (h)
Figure 11-2 - M-0 Residual Stress Figure 11-3 - M-11 Residual Stress
The split tensile, modulus of elasticity, and compressive strength results for the
four mixtures are presented in Figure 11-5, Figure 11-6 and Figure 11-7.
-2
0
2
4
6
8
Res
idu
al S
tre
ss
(MP
a)
0 24 48 72 96 120 144 168 192 216
Time (h)
Figure 11-4 - M-24 Residual Stress

164
0 24 48 72 96 120 144 168 192 216
Time (Hours)
0
2
4
6
8
Sp
lit
Ten
sile
Str
ess
(MP
a)
M-0M-11M-24
0 24 48 72 96 120 144 168 192 216
Time (h)
3000
3500
4000
4500
5000
Mo
du
lus
of
Ela
sti
city
(ks
i)
M-0M-11M-24
1 DAY3 DAY
5 DAY
7 DAY
0 24 48 72 96 120 144 168 192 216
Time (h)
4
6
8
10
12
Co
mp
res
sive
Str
eng
th (
ksi
) M-0M-11M-24
1 DAY3 DAY
5 DAY
7 DAY
Figure 11-7 - Compressive Strength, f’c
11.5. Discussion
Internal curing reduces or eliminates the amount of shrinkage that results in
tensile stress when it is restrained. Previous work has shown that the amount
and dispersion of the internal curing water affects its ability to mitigate shrinkage
(Jensen et al. 2001; Lura et al. 2007; Henkensiefken et al. 2009). Therefore,
mixture M-24 will reduce more shrinkage than the other internally cured mixture
M-11. Adding internal curing agents can lower the tensile and compressive
Figure 11-5 – Split Tensile Capacity, f’t Figure 11-6 - Modulus of Elasticity, E

165
capacity of the concrete. Figure 11-5 and Figure 11-7 shows the tensile and
compressive strength reduction. Although these two properties are reduced,
internal curing also reduces modulus of elasticity and autogenous shrinkage
which reduces the cracking propensity of the concrete. The following discussion
will outline how the temperature drop approach in dual ring can be used to show
this potential benefit.
The temperature reduction required to induce cracking can provide an idea of
how much thermal change a concrete in the field may be able to sustain. Figure
11-8 summarizes the temperature reduction histories of the four mixture designs
from the temperature drop approach. The allowable thermal change is not
constant and changes as the mixtures age. Each mixture achieved its largest
thermal reduction prior to about 96 hr and then decreased. This indicates that all
four mixtures are more susceptible to thermal cracking after 96 hr. Mixture M-24
requires the greatest amount of temperature change to induce cracking and is
approximately 3x greater than the plain M-0 mixture. This behavior indicates the
M-24 mixture design can sustain larger thermal swings than the M-0 mixture.
The lower level of internal curing provided by mixture M-11 is most beneficial
prior to 96hr.

166
0 24 48 72 96 120 144 168 192 216
Time (h)
0
5
10
15
20
25
30
35
Te
mp
era
ture
Ch
an
ge
(o
C) M-0
M-11M-24
Figure 11-8 – Required Temperature Change to Induce Cracking
The behavior of the cracking stress as a mixture ages in the dual ring can show
the effects of sustained residual stress. The cracking stress histories of the four
mixture designs by using the temperature drop approach are presented in Figure
11-9. It shows the cracking stress decreased for all mixtures as they aged. All
three mixtures produced a similar rate of declining cracking stress. Mixtures M-0
and M-11 produced similar cracking stress profiles where their maximum
cracking capacities occurred prior to 96 hr and then began to decline.
Figure 11-5 presents the split tensile capacity histories which indicated an
opposite trend of cracking strength development. The split tensile capacity
increased as the samples aged instead of decreasing as seen in the dual ring.
This difference indicates that microstructural damage (microcracking) occurred in
the dual ring samples as result of sustained residual stress. Since split tensile
samples are cured in the unstressed state they are not subjected to this damage.
This discrepancy indicates that the split tensile cracking stresses may not provide
a clear representation of field performance of concrete which is typically in the
stressed state.

167
The cracking stress histories can also show the effect of internal curing. Mixture
M-24 (which had the largest amount of internal curing) cracked at later ages than
M-0 and M-11 but it cracked at lower stresses. This reduced stress capacity can
be attributed to a combination of the relatively lower split tensile cracking
stresses and the longer duration the specimen was stressed. This behavior
indicates that the performance of internal curing may be limited to earlier ages if
it is not used in a great enough quantity to maintain a low residual stress state.
0 24 48 72 96 120 144 168 192 216
Time (h)
0
2
4
6
8
Cra
ck
ing
Str
es
s (
MP
a)
M-0M-11M-24
0 24 48 72 96 120 144 168 192 216
Time (Hours)
0
2
4
6
Re
serv
e S
tre
ss
(M
Pa)
M-0M-11M-24
Figure 11-9 – Cracking Stress History
Figure 11-10 - Reserve Stress Capacity
The temperature drop approach can also be used to determine the reserve
stress capacity of a mixture. Reserve stress represents the difference between
the cracking capacity and the residual stress due to autogenous shrinkage.
Therefore it can describe the concurrent effects of a mixture’s tensile capacity
and autogenous shrinkage. Figure 11-10 presents the reserve stress for the four
mixtures. Mixture M-24 produces greater reserve stresses at later ages which
indicate a greater ability to prevent cracking. Mixture M-11 show slight
improvement in cracking performance than the plain mixture M-0.

168
A factor of safety to cracking (FSC) can be calculated by dividing reserve stress
capacity by the cracking stress. This can be used to provide a better
representation of how close a mixture is to cracking than either the cracking
stress or reserve stress separately. The FSC accounts for the reduced cracking
capacity that occurs at later ages and due to internal curing.
0 24 48 72 96 120 144 168 192 216
Time (Hours)
0
0.5
1
Fa
cto
r o
f S
afe
ty t
o C
rac
kin
g
M-0M-11M-24
11.6. Summary of Temperature Drop Approach
The temperature drop approach used with the dual ring device provides several
new ways to observe the cracking propensity of concretes and how internal
curing may improve their performance in the following ways:
The dual ring can describe the ability of a concrete to sustain temperature
swings. The internally cured mixtures sustained up to 3x the amount of
temperature swings than plain mixtures any given age.
The dual ring can show the effect of sustained residual stress on cracking
capacity. Mixtures that are loaded in tension longer exhibit reduced
tensile strength.
Figure 11-11 - Factor of Safety To Cracking

169
It can be used to calculate the reserve stress providing a more clear idea
of how restrained specimens perform during early ages. Internally cured
mixtures with lightweight aggregate have a larger reserve stress and are
less likely to crack.

170
CHAPTER 12. FREEZE THAW RESISTANCE OF MIXTURES CONTAINING PREWETTED LIGHTWEIGHT AGGREGATE
12.1. Introduction
Concrete can be susceptible to damage caused by repeated freezing and
thawing cycles (Powers 1950; Penttala et al. 2002). The propensity of the
mixture to undergo freeze-thaw damage is based on several factors but in
general is due to how well the mixture avoids reaching a critical degree of
saturation (Fagerlund 1977). Mixtures with low permeability require longer
periods of wetting to reach this point. Some concern exists with using lightweight
aggregates in freeze-thaw applications because they are porous and can absorb
water which may cause greater freezing damage (Roberts 1995). The porosity of
the paste plays a large role in the water movement within the sample. Therefore,
mixtures with low w/c may sufficiently prevent external water from reaching the
lightweight aggregates. This chapter investigates the freeze-thaw resistance of
high performance mixtures containing prewetted lightweight aggregate using
ASTM C 666 (ASTM 2008).
12.2. Materials
ASTM C150 Type I ordinary portland cement (OPC) was used, with a Blaine
fineness of 370 m2/kg and an estimated Bogue composition of 56 % C3S, 16 %
C2S, 12 % C3A, 7 % C4AF and a Na2O equivalent of 0.68 %, all by mass fraction.
A high-range water-reducing admixture (HRWRA) was added in varying rates
depending on the volume fraction of LWA replacing normal weight sand in order
to maintain similar mixture consistencies.

171
The normal weight sand used was natural river sand with a fineness modulus of
2.71 and an apparent specific gravity of 2.58. Portions of the normal weight sand
were replaced with manufactured rotary kilned expanded shale (LWA-K), with a
fineness modulus of 3.10 and an apparent specific gravity of 1.56. The 24 h
absorption of the normal weight sand, and LWA-K were determined to be 1.8 %
and 10.5 % by mass, respectively, according to ASTM C128-07 (2007). The
normal weight sand used was natural river sand with a fineness modulus of 2.71
and an apparent specific gravity of 2.58.
12.3. Mixture Proportions
Three low w/c mortar mixtures were used in this study to evaluate the freeze
thaw resistance of mixtures with internal curing. Mixture proportions are
designated as M-0k, M-11k, and M-24k and are presented in Table 12-1.
Table 12-1 – Mixture Proportions for Freeze Thaw Study
M-0 Plain Mortar
M-11k M-24k
Cement (Type I) 728 (1228) 728 (1228) 728 (1228)Water 218 (368) 218 (368) 218 (368)IC Water* 0 19.46 (32.82) 38.82 (65.49)Fine Aggregate 1444 (2435) 1155 (1948) 818 (1381)FLWA 0 188 (317) 408 (689)* Water absorbed in LWA at set
Material
Amount
kg/m3 (lbs/yd3)
Amount
kg/m3 (lbs/yd3)
Amount
kg/m3 (lbs/yd3)
Mixture M-0 was a plain mortar while mixtures M-11k and M-24k utilize internal
curing using pre-wetted fine lightweight aggregate (LWA). All mixtures had a
water-to-cement ratio of 0.30 by mass (w/c = 0.30) and a paste volume of 45 %.
The internally cured mixtures M-11k and M-24k had 11 % and 23.7 % of the total
mixture volume comprised of LWA, respectively. It should be noted the 23.7 %

172
LWA replacement value corresponds to the theoretical value of internal curing
water that is required to match the volume caused by chemical shrinkage.
12.4. Mixing and Freeze Thaw Testing Procedure
Aggregate for each mixture was prepared and batched in the oven dry state.
The LWA was then presoaked for 24 h ± 0.5 h in the mix water (including the
water for prewetting) while sealed in a container. Mixing was performed in
accordance with ASTM C 192-07. First, aggregate was loaded into the slightly
dampened mixer. Where applicable, the mixing water was decanted from the
LWA. The mixer was started and 50% of the total water was added. The cement
and remaining mix water containing the HRWRA were then added. The mortar
was mixed for 3 min, then rested for 3 min while the sides of the mixer were
scraped, then mixed for a final 2 min.
Three 75 mm x 405 mm x 100 mm (3”x16”x4”) prisms were cast for each mixture
and were sealed in plastic for 14 days after casting. For one mixture, M-11k, an
additional three prisms were cast and wet cured for the first 14 days after casting.
After 14 days, all samples were submerged in water and subjected to freezing
and thawing cycles at a rate of 2 per day. The temperature cycled from 10˚C to -
18˚C. Periodic measurements of the dynamic modulus and weight were taken
while the specimens were in the thawed state.
12.5. Results and Discussion
Figure 12-1 presents the average relative dynamic modulus of the three
mixtures. The relative dynamic modulus indicates that none of the mixtures
underwent freezing and thawing damage. Damage would have produced a
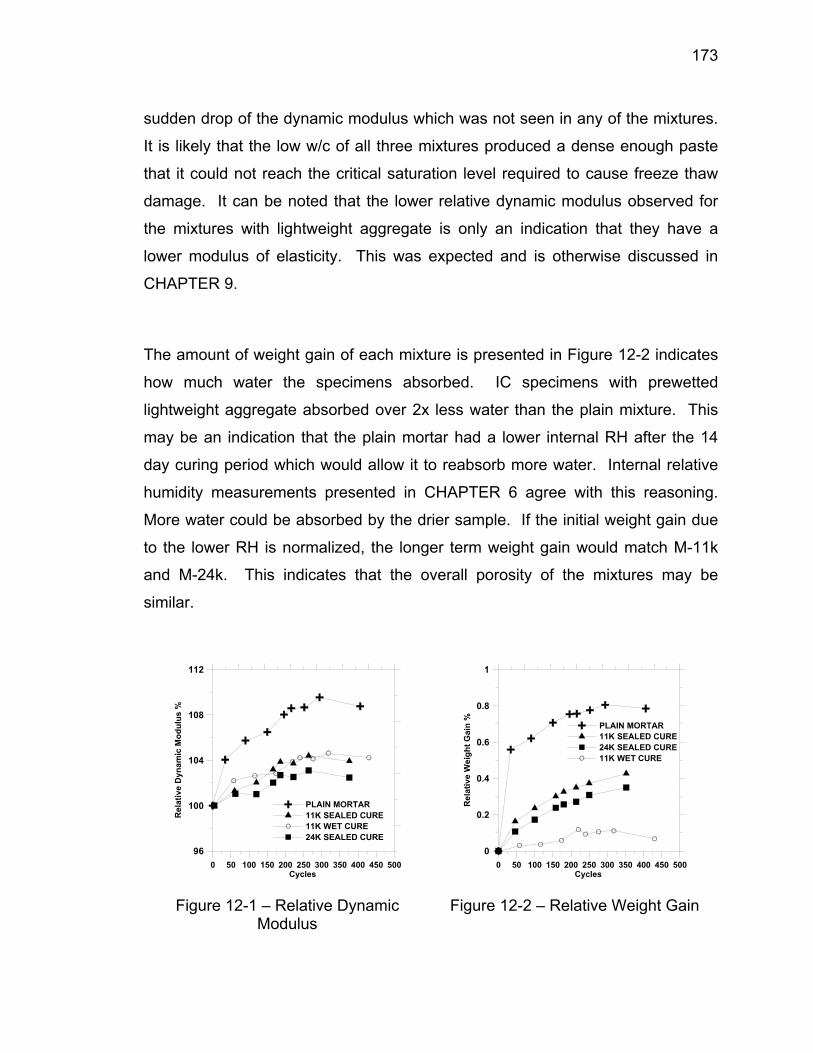
173
sudden drop of the dynamic modulus which was not seen in any of the mixtures.
It is likely that the low w/c of all three mixtures produced a dense enough paste
that it could not reach the critical saturation level required to cause freeze thaw
damage. It can be noted that the lower relative dynamic modulus observed for
the mixtures with lightweight aggregate is only an indication that they have a
lower modulus of elasticity. This was expected and is otherwise discussed in
CHAPTER 9.
The amount of weight gain of each mixture is presented in Figure 12-2 indicates
how much water the specimens absorbed. IC specimens with prewetted
lightweight aggregate absorbed over 2x less water than the plain mixture. This
may be an indication that the plain mortar had a lower internal RH after the 14
day curing period which would allow it to reabsorb more water. Internal relative
humidity measurements presented in CHAPTER 6 agree with this reasoning.
More water could be absorbed by the drier sample. If the initial weight gain due
to the lower RH is normalized, the longer term weight gain would match M-11k
and M-24k. This indicates that the overall porosity of the mixtures may be
similar.
PLAIN MORTAR11K SEALED CURE11K WET CURE24K SEALED CURE
96
100
104
108
112
Re
lati
ve D
yn
am
ic M
od
ulu
s %
0 50 100 150 200 250 300 350 400 450 500Cycles
PLAIN MORTAR11K SEALED CURE24K SEALED CURE11K WET CURE
0
0.2
0.4
0.6
0.8
1
Re
lati
ve
Wei
gh
t G
ain
%
0 50 100 150 200 250 300 350 400 450 500Cycles
Figure 12-1 – Relative Dynamic Modulus
Figure 12-2 – Relative Weight Gain

174
12.6. Conclusions
This chapter has described the freeze thaw behavior of mortars made with
prewetted lightweight aggregate. The inclusion of larger volumes of LWA in
these particular mixture proportions did not increase or decrease freeze thaw
performance. It is likely that the low w/c of the selected mixtures prevented the
degree of saturation from reaching a level where freeze thaw damage would
occur.

175
CHAPTER 13. FULL SCALE BATCHING AND TESTING OF INTERNALLY CURED MIXTURES USING PREWETTED LIGHTWEIGHT AGGREGATE
13.1. Introduction
Shrinkage is an inherent behavior of current portland cement based materials
(RILEM Commission 42-CEA 1981). Chemical reactions, self desiccation,
external drying, and thermal variations are factors that contribute to the overall
shrinkage behavior. The vast majority of concrete elements in the field are at
least partially restrained from shrinking. That is, other elements physically
prevent part of the shrinkage deformation from occurring. Examples include
slabs-on-grade, where the subgrade restrains the concrete shrinkage through
friction, concrete bridge decks restrained by the supporting girders and
abutments, or elevated composite deck slabs restrained by the composite beams
and deck.
Restraint plays a key role in the serviceability of concrete applications.
Restrained shrinkage generates residual tensile stress in the shrinking concrete
member. Cracking results if the residual internal stress exceeds the concrete’s
tensile capacity. This cracking is significant as it inhibits otherwise durable
concretes from reaching their potential service life by allowing deleterious
materials to enter the cracks, thereby accelerating corrosion and degradation
(Wang et al. 1997; Hobbs 1999; Weiss 1999) .
Researchers have utilized multiple testing techniques in the last two decades to
evaluate in-situ shrinkage cracking performance of concrete mixtures (RILEM

176
TC-181 EAS 2002). Most of the tests are performed at a relatively small scale
(e.g. ASTM C1581-09). While these techniques provide valuable information on
restrained shrinkage cracking potential of concrete mixtures, they lack the ability
to simulate issues that only a full scaled specimen can provide, such as the role
of reinforcement for obtaining a specific crack width in the field (Raoufi 2010).
This chapter describes the design and implementation of a large scale testing
system to evaluate the restrained shrinkage cracking propensity of internally
cured concrete mixtures. The test involves casting a concrete sample slab on
top of an aged concrete base. The base restrains the concrete sample slab and
results in residual stress development to possibly crack the sample.
13.2. Large Scale Testing Approach
The large scale restrained slab testing device presented in this paper was
operated inside a large 15’x45’ environmentally controlled chamber and was
designed to enable the test conditions (relative humidity and temperature) to be
well controlled, specified, and repeated. This large scale test provides a unique
opportunity to determine the effectiveness of technologies that mitigate early age
shrinkage cracking of concrete mixtures. Information from the large scale tests
can be used to calibrate finite element models and the standard restrained ring
tests.
The geometry of the specimen and restraining base was determined with a finite
element model capable of considering age dependant properties of concrete and
non linear fracture mechanics concepts. Effects of various parameters such as
length of slab, thickness of base and base rigidity on residual stress development
and cracking behavior of concrete slabs are discussed.

177
The test was then constructed based on the geometry established with the
model. Details of the test construction, mixture selection, and the results of the
test are discussed.
13.3. Design of the Large Scale Restrained Slab Test
13.3.1. Modeling Approach
A commercial finite element package, FEMMASSE MLS 8.5, was used for the
design of the large scale slab test. The program is used to investigate the
influence of the length and thickness of concrete slab and the rigidity of the
restraining base on stress development and cracking behavior of the concrete
slab. The software enables age-dependent material properties such as strength,
elastic modulus, fracture toughness and autogenous length change to be directly
input to study stress development and cracking behavior of concrete at early
ages. Non-linear fracture mechanics, strain softening, creep and stress relaxation
are considered in the analysis. Various environmental conditions such as
temperature, wind speed and relative humidity could also be considered in the
analysis. Stress, displacement, temperature rise and cracking were calculated
throughout the model.
In this analysis, concrete behaves as a linear elastic material until the tensile
strength of concrete is reached. If the tensile strength is reached a crack is
formed normal to the direction of the maximum principal stress when the
maximum principal stress reaches the strength of materials (Mode I fracture
behavior). The cohesive zone model was used to model the cracking of concrete
(Hillerborg et al. 1976). Once a crack is formed, as shrinkage increases, the

178
width of crack increases and stress gradually decreases to zero following the
strain softening relationship. Since stress in the softening relationship of
concrete is related to age-dependent strength of concrete, age-dependent
fracture toughness of concrete is also considered, thereby enabling the
simulation of crack development at early ages. Further details of the modeling
approach can be found in the FEMMASSE manual (B.V 2006) and in (Raoufi
2010).
13.3.2. Model Properties
The model consists of a concrete sample slab cast on an aged concrete base
slab as seen in Figure 13-1. The aged concrete base restrains the shrinkage of
the concrete slab. The restraining base slab would be cast several weeks in
advance of casting the sample slab and is treated as a mature concrete (with
constant material properties) in the model. To minimize the potential for cracking
near ends of the slab, each end of the concrete slab flares out and tapers down
as it wraps down over the edge of the restraining base slab.

179
Figure 13-1 - Basic Test Geometry (a) Longitudinal Cross Section View
(b) Plan View
The width of the restraining slab (as shown by “w-base” in Figure 13-1) is 0.8m
and was selected based on logistics related to the environmental chamber.
Since the analysis software is two-dimensional based the concrete slab and the
base were modeled in a half width along the longitudinal centerline in this
analysis. The restraining base slab mesh elements were defined as 0.4m deep.
The depths of the sample slab mesh elements were varied to simulate changes
in cross section width near the ends as shown in Figure 13-1. The analysis was
performed at a constant temperature of 23˚C and the model was completely
sealed from the environment (i.e., no temperature and moisture variations were
allowed). Although the concrete slab is subjected to uniform shrinkage in this
analysis, similar behavior would be expected in the case of drying concrete
specimens.
13.3.3. Modeled Concrete Properties Used to Design Large Scale Test Geometry
Age-dependent tensile strength (Hossain et al. 2004), elastic modulus (Dehrdrai
2008) shown in Figure 13-2, and autogenous shrinkage (Radlinska 2008) shown
in Figure 13-3, were used to model a concrete with a water-to-cement ratio of
0.30 and 55% fine aggregate (with maximum aggregate diameter of 3 mm) by
volume. A setting time of 5.9 hours were used while simulations started at the
time of casting. An age-dependent Maxwell Chain Model was used to model
creep and stress relaxation of concrete. A bilinear softening (stress-crack width)
relationship was used to model fracture behavior of concrete. The knee point in
the bilinear softening relationship was characterized by a stress-to-strength ratio
of 0.35 and crack width of 0.01 mm while a crack width of 0.08 mm defined the
critical crack width beyond which crack surfaces become traction free. A 10%

180
randomly distributed variation in the tensile strength of concrete was considered
(Radlinska 2008).
The restraining base slab was modeled as an aged concrete with a constant
tensile strength of 6 MPa, compressive strength of 80 MPa and density of 2100
kg/m3. The elastic modulus of the restraining base slab was modeled as a
constant 35 GPa except where the study investigated the effects it had on the
performance of the test. The middle section of concrete slab (the section with
uniform cross section) was connected to the base layer by a series of frictionless
and cohesiveless interface elements. The base layer was bonded to the concrete
slab at its ends to minimize ‘slipping’ of the concrete slab. A plain stress condition
was assumed in this study. Quadrilateral four-node elements were used to mesh
the model while the mesh in concrete slab was refined to enhance numerical
accuracy.
0 4 8 12 16 20 24 28Age of Concrete (days)
0
1
2
3
4
5
6
Te
nsi
le S
tren
gth
(M
Pa)
0
6
12
18
24
30
36
Ela
sti
c M
od
ulu
s (
MP
a)
Tensile StrengthElastic Modulus
(a)
0 4 8 12 16 20 24 28Age of Concrete (days)
-600
-500
-400
-300
-200
-100
0
Sh
rin
kag
e ()
(b)
Figure 13-2 – Elastic Modulus and Tensile Strength Used in Model
Figure 13-3 –Autogenous Shrinkage Used in Model

181
13.3.4. Results of Modeling and Selected Geometry
A large number of simulations were performed to gain an understanding of the
influence of geometry and stiffness on the behavior of the system while the slab
shrank. Two main features were observed in the response. First the slabs
curled. This curling occurred since moment is generated at both ends of the
slabs from the force couple of the shrinkage force and restraining force. Since
the sample slab is cast on top of the restraining slab, the two forces are offset by
a depth “d” as seen in Figure 13-4. The term Fshrink represents the shrinkage
force and the term Frestraint represents the restraint force from the restraining base
slab. The moment bends the sample and restraining base slabs in a concave
upward shape as exaggerated in the section view in Figure 13-5. This curvature
was quantified by measuring the vertical deflections along the length of the slab
model.
Figure 13-4 – Longitudinal Section at End of Slabs Depicting Shrinkage and Restraining Forces
Figure 13-5 – Exaggerated Longitudinal Section View of Slab Curvature During Test Specimen Shrinkage

182
The second feature from the test is that the restraining slab is that it undergoes
axial shortening. This elastic response occurs as the restraining slab is axially
loaded by the shrinking sample slab. The axial shortening of the restraining
slabs was quantified by measuring the horizontal displacements of the restraining
slab in the model.
The two observed features, slab curling and axial shortening, directly affected the
degree of restraint (DOR) of the sample slab because they effectively ‘give’ in to
the sample slab deformation. The DOR is a percentage that quantifies the
amount of shrinkage deformation is prevented by the restraining element. A DOR
of 0% would indicate the sample is completely free to deform (unrestrained) while
a DOR of 100% would indicate the sample is not allowed to deform. Increased
slab curling and axial shortening work to decrease the DOR which in turn
lengthens the time to possible cracking.
Three parameters were identified that influence the behavior of the test. They
include the restraining base thickness, sample slab length, and elastic modulus
of the restraining slab. FEMMASSE analyzed the influence of each variable and
the results will be discussed in the following sections.
13.3.4.1. Influence of Restraining Slab Base Thickness
The thickness of the restraining base slab was varied to study its effect on the
test deformation, stress uniformity over the depth of the sample, time until
cracking occurs, and the degree of restraint. Figure 13-6 summarizes the results
from the simulations. Increasing the restraining base slab thickness decreases
both curling and axial shortening. Figure 13-6(a) plots the vertical deflection of
the sample slab along its length from a point at mid slab. Thickening the
restraining base increases its flexural stiffness and in turn reduces the vertical

183
deflections (curvature). It also increases the self weight of the sample/restraining
slab assembly which counteracts the curling moment. Reducing the curvature of
the two slab assembly improves the stress uniformity of the sample slab as
shown in Figure 13-6(c) which depicts the stress variation across the depth of a
section at mid slab. It can also be seen that thickening the base slab becomes
less effective for thicknesses greater than 305mm. This occurs because the
stiffening effect of a deeper restraining slab is offset by the increased moment
couple arm “d” between the shrinkage and restraint forces. The increased
couple moment in turn increases the curling moment the slab assembly must
resist.
The time to cracking can be seen in Figure 13-6(b) which details the average
stress in the sample slab. The sudden reduction in average stress indicates the
sample slab cracks. Thickening the base slab decreases the time until cracking.
A 152mm thick restraining slab did not crack the sample while a 457mm thick
restraining slab cracked it at 3 days.
Increasing the base thickness also increases its axial stiffness. As the
restraining slab becomes stiffer, the Degree of Restraint (DOR) increases.
Figure 13-7 plots the DOR of the test against the thickness of the restraining
slab.

184
0.00 0.46 0.92 1.38 1.84 2.30Distance from Center (m)
0.0
0.2
0.4
0.6
0.8
1.0
1.2
1.4
1.6
Deflection (m
m)
Base Thickness (mm)152203254305356406457
(a)
0 96 192 288 384 480 576 672Age of Concrete (hrs)
0.00
0.75
1.50
2.25
3.00
3.75
4.50
Str
ess A
vera
ge (M
Pa)
Base Thickness (mm)152203254305356406457
(b)
1.0 1.5 2.0 2.5 3.0 3.5Stress (MPa)
0.0
20.0
40.0
60.0
80.0
100.0
Heig
ht (m
m) Base Thickness (mm)
152203254305356406457
(c)
Figure 13-6 – Restraining Base Thickness Influence on (a) Deflection (b) Average Stress (c) Stress Uniformity

185
0 50 100 150 200 250 300 350 400 450 500Base Thickness (mm)
0.55
0.60
0.65
0.70
0.75
0.80
De
gre
e o
f R
es
tra
int
Figure 13-7 - Effect of Restraining Base Thickness on Degree of Restraint
13.3.4.2. Influence of Test Slab Length
The effect of the sample and restraining slab lengths were also analyzed and the
results are presented in Figure 13-8 for a restraining slab depth of 305mm.
Longer slabs create a more uniform stress distribution towards the mid length of
the sample slab as can be seen in Figure 13-8(a). For example, a slab that is
9.1m long has a flat region that is 4.0m long whereas a 3.0m long slab does not
have any flat region. This behavior can be attributed to the action self weight has
in counteracting the curling moment. Slab curling lifts the end portions of slabs
from contacting the supporting base thereby creating a cantilever. The moment
generated by the cantilever opposes the curling moment. The longer slabs were
able to develop enough cantilever length to overcome the curling moment. It can
be seen in Figure 13-8(a) that 7.6m was the minimum length required to develop
enough self weight cantilever moment to overcome the effects of curling at the
center of the slab. The tensile stress distribution for the longer slabs is more
uniform as seen in Figure 13-8(c). Greater stress uniformity occurs because the
longer slabs have less curvature. Since less tensile stress is relieved by the
effect of curvature the longer slabs crack sooner as depicted in Figure 13-8(b).

186
A slab length of 4.6m was chosen for the test design geometry because it
provides relatively good tensile stress uniformity and fits logistically within the
testing facility.
13.3.4.3. Influence of Restraining Base Elastic Modulus
The elastic modulus of the restraining base slab can be manipulated by the type
of aggregates used in the concrete mixture. It is common to find the elastic
modulus for concrete in the range of 30GPa to 40GPa. Therefore, its influence
on the test behavior was also investigated. Increasing the restraining slab
modulus increases the both the flexural and axial restraining stiffness. This is
similar to deepening the restraining slab except that curling moment is not
increased. Figure 13-9 details the effect elastic modulus of the restraining slab
has on the vertical end deflection of the test. The modulus was varied while
holding the restraining slab depth constant at 305mm and slab length constant at
4.9m.
Varying the elastic modulus within the range of 30GPa to 40GPa had a sizeable
effect on the vertical deflection response. Increasing the modulus by 10GPa
decreased the vertical end deflections by 0.06mm. This has a positive influence
by reducing the curvature of the two slab assembly and creating more uniform
stress at mid length of the slab. An elastic modulus of 35GPa was selected for
the restraining base slab but may be modified once the actual slab tests are
performed. This allowance for adjustment may provide a method to change the
DOR without modifying the geometry of the sample slab.

187
0.0 0.5 1.0 1.5 2.0 2.5 3.0 3.5 4.0 4.5 5.0Distance from Center (m)
0.0
0.2
0.4
0.6
0.8
1.0
1.2
De
fle
cti
on
(m
m)
Slab Length (m)3.03.74.34.64.95.56.17.69.1
(a)
0 24 48 72 96 120 144 168 192 216Age of Concrete (hrs)
0.0
0.5
1.0
1.5
2.0
2.5
3.0
3.5
Str
es
s A
ve
rag
e (
MP
a)
Slab Length (m)3.03.74.34.64.95.56.17.69.1
(b)
2.0 2.2 2.4 2.6 2.8 3.0 3.2 3.4Stress (MPa)
0
20
40
60
80
100
He
igh
t (m
m)
Slab Length (m)3.03.74.34.64.95.56.17.69.1
(c)
Figure 13-8 – Test Slab Length influence on (a) Vertical Deflection (b) Average Stress (c) Stress Uniformity

188
0 10 20 30 40 50 60 70 80 90 100Base Elastic Modulus (GPa)
0.0
0.2
0.4
0.6
0.8
1.0
De
fle
cti
on
(m
m)
Figure 13-9 - Effect of Restraining Slab Modulus on Vertical Deflection at End of Slab
13.3.5. Summary of Large Scale Test Design
The simulations described in this chapter were used to select the final geometry
of the testing device that will be used in assessing restrained shrinkage cracking
in internally cured mixtures. It was determined that a sample slab that is 4.6m
long sitting on a 305mm thick base with a 35GPa base elastic modulus produced
an adequate behavior. Thinner and shorter restraining base slabs were found to
be susceptible to excessive curling which would lower the degree of restraint and
prevent the specimen from cracking.
13.4. Large Scale Testing of Internally Cured Proportions
13.4.1. Restraining Base Slab Construction
The restraining base slabs were cast in advance of the test specimens. A local
ready mix concrete producer supplied plain normalweight concrete proportioned
as shown in Table 13-1. Restraining base slabs were cast directly from the
ready mix truck, finished, and then covered with visqueen plastic sheeting. They

189
were then cured inside the environmental chamber which was maintained at an
RH of 50% ± 2% and a temperature of 23 ˚C ± 1˚C (73.4 ˚F ± 1.8˚F). A set of
6”x12” cylinders were cast according to ASTM C192 to monitor the elastic
modulus and strength development of the base restraining slabs. The elastic
modulus was measured in accordance with ASTM C 469-02. Compressive
strength was measured in accordance with ASTM C 39. At an age of 14 days,
the elastic modulus of the restraining base slabs was measured as 34 GPa
(4937ksi). The compressive strength was measured as 30.5 GPa (4.4 ksi).
These two values were acceptable and provided relatively good agreement with
the material properties used in the model. It should be noted that the restraining
base slabs were maintained in sealed conditions (covered in visqueen sheeting)
throughout all testing in this report.
Table 13-1 – Mixture Proportions for Restraining Base Slab
Restraining Base Concrete
Cement (Type I) 334 (564)Water 164 (276)IC Water* 0Fine Aggregate 842 (1420)FLWA 0Coarse Aggregate 1800 (1067)
Material
Amount
kg/m3 (lbs/yd3)
13.4.2. Mixture Proportioning for Test Slabs
Two large scale test slabs were used to show the effectiveness of internal curing
with prewetted lightweight aggregate. The mixture proportions for the test slabs
are presented in Table 13-2. The control mixture, designated as mixture C-0,
was a plain concrete with water-to-cement ratio of 0.30 by mass (w/c = 0.30).
Mixture C-0 volumetrically had 40% paste, 35% fine aggregate (sand), and 25%

190
coarse aggregate. The internally cured mixture was designated as mixture C-21.
This mixture had a water-to-cement ratio of 0.30 by mass (w/c = 0.30) with
volumetric proportions of 40% paste, 35% fine aggregate (sand), and 25%
coarse aggregate. Fine lightweight aggregate (LWA) replaced 61% of the
volume of sand or 21.5% of the total volume of the mixture. This LWA
replacement value reduced the overall batch weight of the mixture by 9.3%. It
should be noted that the term “Water” in the mixture proportioning Table 13-2 is
adjusted to compensate for absorption values of the normal weight sand and
coarse aggregate. This is done so the absorption of the normal weight
aggregates do not inadvertently lower the water-to-cement ratio.
The fine lightweight aggregate replacement value was determined with Equation
3-1 which supplies a volume of internal curing water that matches the volume of
chemical shrinkage voids that are created after set. The term “IC Water” in the
mixture proportioning Table 13-2 represents this volume of water. The chemical
shrinkage was assumed to be 0.064 lb of water per lb of cement. The degree of
saturation for the LWA was taken as 1 because the batched lightweight would be
soaked for 24 hours and the absorption value was based on a 24 hour soak.
A high-range water-reducing admixture (HRWRA) was added in varying rates to
maintain similar consistencies between the two mixtures. For mixture C-0 the
HRWRA was added at a dosage of 0.40 g per 100 g of cement. For mixture C-
21 the HRWRA was added at a dosage of 0.70 g per 100 g of cement.

191
Table 13-2 –Mixture Proportions for Large Scale Testing
C-0 Plain Concrete
C-21 IC Concrete
Cement (Type I) 647 (1091) 647 (1091)Water 194 (327) 194 (327)IC Water* 0 38.48 (64.90)Fine Aggregate 916 (1546) 354 (598)FLWA 0 334 (564)Coarse Aggregate 692 (1168) 692 (1168)* Water absorbed in FLWA at set
Amount
kg/m3 (lbs/yd3)Material
Amount
kg/m3 (lbs/yd3)
Table 13-3 – Coarse Aggregate Gradation for Large Scale Testing (Indiana #9)
1.00 - -
0.75 100% 28%0.50 73% 28%0.375 45% 38%
#4 8% 3%#8 5% 5%
Sieve SizePercent Passing
Percent Necessary
13.4.3. Materials
Type I ordinary portland cement was used (ASTM C 150-05) with a Blaine
fineness of 370 m2/kg (1809 ft2/lb), and an estimated Bogue composition of a 56
% C3S, 16 % C2S, 12 % C3A and 7 % C4AF. Normal weight river sand was used
with a fineness modulus of 2.71 and an oven dry specific gravity of 2.58, and an
absorption of 1.6% by mass. The fine lightweight aggregate was a manufactured
rotary kiln expanded shale with a fineness modulus of 4.3, an oven dry specific
gravity of 1.4, and a 24 hour absorption value of 11.5 % by mass. Mix water
consisted of tap water conditioned to 23 ˚C ± 1˚C (73.4 ˚F ± 1.8˚F). The coarse
aggregate was a locally supplied limestone with an oven dry specific gravity of

192
2.75 and a measured absorption of 0.8%. The coarse aggregate was graded to
an Indiana #9 gradation (Table 13-3).
13.4.4. Mixing Procedure
All mixing and aggregate preparation was performed in the laboratory.
Aggregates were weighed in the oven dry state and air cooled prior to mixing.
The LWA was oven dried, air cooled, and then submerged in the batched mix
water for 24 h ± 1 h before mixing. The volume of water used to submerge the
LWA included both mixing water and the water the LWA would absorb in 24 h (IC
water). The entire volume of water was required in order to fully submerge the
LWA. After remaining submerged for 24 h, the remaining unabsorbed water was
then decanted and used in the mixing process.
Mixing was performed in a drum mixer with a maximum 6 cu ft capacity of 9 total
cu ft. The sand, limestone, and decanted LWA were first added to the “buttered”
mixer. The cement and water were then added. The water-reducing admixture
was added along with the last 1/3 of the mix water. Once all the materials were
added to the mixer, it was operated for 5 minutes at full speed.
13.4.5. Large Scale Casting Procedure
Prior to casting the test slab, a layer of 0.006” thick visqueen plastic sheeting was
placed on the top face of the restraining slab and can be seen in Figure 13-10.
This plastic was placed in order to reduce adhesion between the test slab and
restraining slab and to facilitate demolding the test slab once the test completed.

193
Figure 13-10 – Photo of Formwork Prepared for Large Scale Test Slab
Figure 13-11 – Photo of Finished Test Slab

194
The test slabs were consolidated with a commercial hand vibrator. The top face
of the slabs were screeded and then finished with hand trowels to produce a
smooth surface. The slabs were then placed the environmental chamber which
operated at a constant RH of 50% ± 2% and temperature of 23 ˚C ± 1˚C (73.4 ˚F
± 1.8˚F). Initial curing during the first two days was sealed with visqueen plastic
After two days, the formwork was removed and the plastic was removed from the
test slab except for at each end. The two sides of the test slabs were sealed with
a layer of aluminum tape in order to allow external drying to occur from the top
surface. A photo of the finished slab is provided in Figure 13-11.
13.4.6. Experimental Results and Discussion
The test slabs were visually monitored to detect cracking. Mixture C-0 produced
a crack at 11 days after casting. The crack was full depth and full width across
the test slab and occurred at a distance 9’-7” from the end of the test slab. The
orientation of the crack was nearly perpendicular to the length of the slab. A
photo of the crack is presented in Figure 13-12. The crack width was then
monitored for the following 17 days with a crack width microscope. Width
measurements were taken at 4 points along the crack and the results are
presented in Figure 13-14. The initial average crack width was 0.72mm and
grew to 1.22mm during the monitoring period.
Mixture C-21 produced a crack at 42 days after casting. A photo of the crack is
presented in Figure 13-13. The crack was full depth and full width across the test
slab and occurred at a distance 11’-3” from the end of the test slab. The
orientation of the crack was nearly perpendicular to the length of the slab. The
average crack width was measured as 0.34mm.

195
The free shrinkage of the restraining slabs and test slabs was measured with
sets of 100mm x 100mm x 285mm (4”x4”x11 ¼”) prisms per ASTM C157.
Prisms were subjected to the same environmental conditions as their
representative slabs. The restraining slab prisms were cured in sealed
conditions and the test slab prisms were allowed to undergo external drying.
Figure 13-15 shows the individual free shrinkage results of mixture C-0 and its
restraining base slab (Base Slab 1). At the time of cracking, the plain C-0
mixture measured a free shrinkage value of 360 microstrain. The restraining
base under mixture C-0 (Base Slab 1) measured a free shrinkage value of 125
microstrain at the time of cracking.
The free shrinkage measurements for the internally cured mixture C-21 and its
restraining slab (Base Slab 4) are presented in Figure 13-16. At the time of
cracking, mixture C-21 measured a free shrinkage value of 420 microstrain. The
restraining base under mixture C-21 (Base Slab 4) measured a free shrinkage
value of 80 microstrain at the time of cracking.
The internally cured concrete test slab cracked approximately 4x later than the
plain concrete test slab. This extension in cracking time indicates that internal
curing reduced the cracking propensity of the mixture. It is likely that this is due
to a combination of better mechanical properties and improved shrinkage
behavior. The internally cured mixture measured a larger free shrinkage strain at
the time of cracking but measured smaller crack widths on the test slab. This
indicates a larger amount of stress relaxation is occurring as compared to the
plain mixture. Observations of the mechanical properties of IC mixtures in
CHAPTER 9 agree with this reasoning. Free shrinkage measurements of C-21
show it shrinks at a slower rate and shrinks later than the plain mixture C-0. Both
of these features improve cracking propensity. Shrinkage at a slower rate will
allow relaxation to reduce tensile stress. Shrinkage at a later age allows the

196
mixture to develop more tensile strength before being loaded with residual
tension.
Figure 13-12 – Mixture C-0 Test Slab Crack at 12 Day

197
Figure 13-13 – Mixture C-21 Test Slab Crack at 42 day
EDGE6"12"18"EDGE
0
0.4
0.8
1.2
1.6
2
Cra
ck
Wid
th (
mm
)
10 15 20 25 30Time (day)
C-0Base Slab 1
-450
-400
-350
-300
-250
-200
-150
-100
-50
0
50
100
Str
ain
(
)
0 5 10 15 20 25 30 35 40 45 50Time (day)
Figure 13-14 – C-0 Crack Width History Figure 13-15 – C-0 Free Shrinkage History
C-0Base Slab 1
-450
-400
-350
-300
-250
-200
-150
-100
-50
0
50
100
Str
ain
(
)
0 5 10 15 20 25 30 35 40 45 50Time (day)
Figure 13-16 – C-21 Free Shrinkage History
13.5. Large Scale Testing Conclusions
This chapter has presented the design a large scale slab testing device and how
the device was used to investigate the behavior of self curing concrete made with
prewetted lightweight aggregate. This chapter outlined the method used to

198
proportion a large batch of self curing concrete. Results of the large scale
testing show that using a sufficient amount of lightweight aggregate replacement
volume will improve the restrained cracking behavior. The self cured mixture
cracked at later ages and produced smaller crack widths.

199
CHAPTER 14. SUMMARY AND CONCLUSIONS
14.1. Summary
Internally cured concrete (IC) mixtures utilize prewetted lightweight aggregates
(LWA) to supply water during hydration thereby enabling a more dense
microstructure and a reduced autogenous shrinkage. These internally cured
mixtures have demonstrated that they can provide many desired benefits. This
report characterizes the local materials (Chapters 2 and 3), studies how well they
work as internal curing agents (Chapter 4), and then investigates how they
influence the durability and long term performance (Chapters 5 – 13).
Several factors should be considered when selecting a particular LWA in order
for internal curing to be effective. Specifically, the following three characteristics
of the LWA must be taken into consideration:
The LWA must be able to absorb an appropriate volume of curing
water. This volume is determined based the amount of internal void
space created by the hydrating cement. This volume can be
approximated as the volume of chemical shrinkage, however strictly
speaking; it is the difference in volume between the chemical shrinkage
and autogenous shrinkage. In this study, different LWA’s were
characterized based on their 24 hour absorption values, but
conceptually other time durations may be used (Castro et al. 2010).
The LWA must be able to desorb (i.e, release) a large portion of its
absorbed water during the hydration of the cement paste. To

200
accomplish this, the pores of the LWA must be larger than the pores of
the hydrating cement paste. If the pores in the LWA are not larger than
the pores in the paste, the water will remain in the pores of the LWA
and cannot be used for internal curing. Determining this characteristic
is more difficult than absorption but it is equally, if not more important.
Castro has shown in a related study that 92% of the absorbed water is
released by 92% RH for common expanded clays, shales, and slates.
The LWA must be well dispersed throughout the system so that the
water can physically travel to all regions of the paste. It was shown that
water could travel on the order of 2 mm after set during the first 75 h in
cement paste with a w/c of 0.30. Better dispersion is achieved by using
finer LWA aggregates and higher LWA replacement volumes.
Therefore, fine aggregates typically will perform far better than coarse
aggregates. Higher absorption LWA may suffer from a lack of
dispersion as these materials require lower replacement volumes for a
given amount of chemical shrinkage.
Internal curing with prewetted LWA can improve the shrinkage and cracking
performance (i.e., reduce shrinkage and reduce or eliminate cracking) of
concrete. When the specimens were in a sealed curing condition, providing
enough water to fill in the vapor-filled space cause by chemical shrinkage during
the first days of hydration could significantly improve the unrestrained length
change (i.e. shrinkage performance) and reduce or eliminate cracking in a
restrained specimen. When the specimens were in an unsealed condition, the
additional external drying effect required that a larger replacement volume of
lightweight aggregate to obtain a similar improvement in performance. This is
because specimens experience the combined effect of self-desiccation and
external drying. If a sufficient volume of lightweight aggregate is supplied and
they are dispersed properly, the shrinkage can be reduced. The incorporation of
prewetted lightweight aggregate into a mixture can also help reduce and prevent

201
the formation of plastic shrinkage cracks. The following summarizes the
observed benefits internal curing had on shrinkage and cracking performance in
this study:
When no LWA was used the unrestrained shrinkage strain at 28 d
in a sealed condition was -390 με. When 14.3 % of the total
mixture volume consists of LWA, the 28 d strain was an expansion
of 59 με.
When no LWA was used the unrestrained shrinkage strain at 28 d
in an unsealed condition was -750 με. When 33.0 % of the total
mixture volume contained LWA, the 28 d strain was 110 με.
When the mixture contained no LWA, cracking occurred at
approximately 6 d in sealed conditions. However when 14.3 % of
the total volume of the mixture contained LWA, cracking did not
occur during the 20 d of testing in sealed conditions and virtually no
residual stress developed in the system.
When the mixture contained no LWA, cracking occurred at
approximately 2 d in unsealed conditions. However when 33.0 %
of the total mixture volume contained LWA, cracking did not occur
during the 14 d of testing in unsealed conditions.
When no LWA was in the system, the mixture cracked during the
plastic state. When 18.0 % of the total mixture was LWA, plastic
shrinkage cracking was eliminated.
Mixtures that contained prewetted LWA required up to 3x the
amount of temperature change (i.e. a plain specimen required a
10°C change to crack while the IC specimen required a 30°C
change) to crack at a given time as compared to plain mixtures
without LWA.

202
Internal curing with prewetted LWA can also reduce the transport of fluid through
(i.e, reduce permeability) concrete mixtures. This is likely due to an increase in
the degree of hydration which densifies the bulk paste microstructure and
interfacial transition zone between the LWA and the cement paste. The following
item summarizes the observed benefits internal curing had on fluid transport:
When no LWA was in the system, the degree of hydration for a
mortar with a w/c of 0.30 was approximately 0.62 at 210 d of sealed
hydration. When 25.3 % of the mixture was LWA, the degree of
hydration for a w/c of 0.30 was approximately 0.66 at 210 d of
sealed hydration.
The water absorbed during eight days of testing for the mixture with
no LWA was approximately 21 g per cm3 of paste when the sample
was cured for 28 d in sealed conditions. Using the same curing
and testing conditions when 25.3 % of the mixture was LWA, the
volume of absorbed water was reduced to 14 g per cm3 of paste.
When no LWA is in the system, approximately 91 % of the ITZ
paste is percolated across the sample. When 25.3 % of the total
mixture is LWA, the ITZ is depercolated.
From a sorptivity and conductivity perspective, the behavior of the
mixture with 25.3% LWA (w/c of 0.30) has a performance of a plain
mortar mixture with a w/c of 0.23.
Internal curing with prewetted LWA has effects on the mechanical performance
of concrete. The compressive strength for the mixture containing 23.7% LWA
was 2% to 8% less than the plain mixture with no LWA. Short term split tensile
measurements made during the first 7 days showed a mixture with 23.7% LWA
was 11% weaker than the plain mixture. This is likely due to the low strength of
the LWA. The long term split tensile testing did not show a strong trend that

203
mixtures with LWA were weaker than plain mixtures with no LWA. As a result, it
is believed that the low strength of the LWA is offset by increased hydration of
the cement paste. The modulus of elasticity of the mixture with 23.7 had was up
to 13% less than the plain mixture with no LWA. The freeze thaw performance of
the tested 0.30 w/c mixtures was not increased or reduced by the addition of
LWA.
14.2. Conclusions
The results of this investigation indicate that internally cured concrete has great
potential for use in transportation structures. This occurs specifically due to the
reduced potential for shrinkage and thermal cracking, the reduced fluid transport,
and the increased densification of the matrix. It is recommended that field trials
be performed with instrumentation, documentation and monitoring to enable
Indiana to quantify the benefits of this material and to enable it to be more
commonly used. It is recommended that a performance based specification be
developed that would enable these materials to be used and specified more
widely in Indiana. It is recommended that a training video be developed that
highlights the benefits of this material, describes its use, and discusses important
features associated with placement and testing.

LIST OF REFERENCES
(1997, 1999, 2002, 2005). Self Dessiccation and Its Importance in Concrete Technology. Proceedings of Inernational Research Seminars.
(2002). Standard practice for maintaining constant relative humidity by means of aqueous solutions. ASTM G109-09a, ASTM International.
(2004). ASTM, Standard C 1581-04. Standard Test Method for Determining Age at Cracking and Induced Tensile Stress Characteristics of Mortar and Concrete under Restrained Shrinkage. ASTM International, West Conshohocken, PA Vol 4(2): 787-792.
(2004). Standard Test Method for Density, Relative Density (Specific Gravity), and Absorption of Coarse Aggregate. ASTM C127-04, ASTM International.
(2004). Standard Test Method for Determining Age at Cracking and Induced Tensile Stress Characteristics of Mortar and Concrete under Restrained Shrinkage. ASTM C1581-04, ASTM International.
(2004). Standard Test Method for Measurement of Rate of Absorption of Water by Hydraulic-Cement Concretes. ASTM C1585-04, ASTM International.
(2005). Standard Test Method for Chemical Shrinkage of Hydraulic Cement Paste. ASTM C1608-05 ASTM International.
(2006). Standard practice for making and curing concrete test specimens in the laboratory. ASTM C192-06, ASTM International.
(2006). Standard Practice for Mechanical Mixing of Hydraulic Cement Pastes and Mortars of Plastic Consistency. ASTM C305-06, ASTM International.
(2006). Standard practice for mechanical mixing of hydraulic cement pastes and mortars of plastic consistency, ASTM International.
(2006). Standard Test Method for Length Change of Hardened Hydraulic-Cement Mortar and Concrete. ASTM C157-06, ASTM International.

(2007). Standard Test Method for Density, Relative Density (Specific Gravity), and Absorption of Fine Aggregate. ASTM C128-07, ASTM International.
ACI (1998). Standard practice for the use of shrinkage-compensating concrete. Farmington Hill, MI, American Concrete Institute: 1-28.
ACI, Ed. (2004). ACI SP-220 Autogenous Deformation of Concrete. Farmington Hill, MI, American Concrete Institute.
Aitcin, P.-C., et al. (1997). "Integrated view of shrinkage deformation." Concrete International 19(9): 35-41.
Al-Khaiat, H. and M. N. Haque (1998). "Effect of initial curing on early strength and physical properties of a lightweight concrete." Cement and Concrete Research 28(6): 859.
Altoubat, S. A. and D. A. Lange (2001). "Creep, shrinkage, and cracking of restrained concrete at early age." ACI Materials Journal 98(Compendex): 323-331.
Altoubat, S. A. and D. A. Lange (2001). "Creep, shrinkage, and cracking of restrained concrete at early age." ACI Materials Journal 98(4): 323-331.
ASTM (2008). ASTM, Standard C 666. Standard Test Method for Resistance of Concrete to Rapid Freezing and Thawing. ASTM International, West Conshohocken, PA Vol 4(2).
B.V, F. (2006). FEMMASSE MLS 8.5 User Manual, “Finite Element Modules for Material Science and Structural Engineering”. Netherland.
Barcelo, L., et al. (2000). Early age shrinkage of concrete: back to physical mechanisms. Materials aspects of concrete repair and rehabilitation, Mont-Tremblant, RILEM.
Bentz, D. P. (2008a). "Influence of internal curing using lightweight aggregates on interfacial transition zone percolation and chloride ingress in mortars." Cement and Concrete Composites: Submitted.
Bentz, D. P., et al. (1998). "Modelling drying shrinkage in reconstructed porous materials: application to porous Vycor glass." Modelling Simul. Mater. Sci. Eng. 6: 211-236.
Bentz, D. P., et al. (1999a). "A hard core/soft shell microstructural model for studying percolation and transport in three-dimensional composite media."

Bentz, D. P., et al. (2001b). "Shrinkage-reducing admixtures and early-age desiccation in cement pastes and mortars." Cement and Concrete Research 31(7): 1075.
Bentz, D. P., et al. (2006a). Four-dimensional x-ray microtomography study of water movement during internal curing. Proceedings of the International RILEM Conference - Volume Changes of Hardening Concrete: Testing and Mitigation.
Bentz, D. P., et al. (2006b). Water movement during internal curing: Direct observation using x-ray microtomography. Concrete International. 28: 39-45.
Bentz, D. P. and O. M. Jensen (2004). "Mitigation strategies for autogenous shrinkage cracking." Cement and Concrete Composites 26(6): 677-685.
Bentz, D. P., et al. (2005). Mixture proportioning for internal curing. Concrete International. 27: 35-40.
Bentz, D. P., et al. (2008b). Reducing Early-Age Cracking in Concrete Today. West Lafayette, IN, Purdue University.
Bentz, D. P., et al. (2008). "Reducing Early-Age Cracking in Concrete Today." West Lafayette, IN, Purdue University.
Bentz, D. P. and K. A. Snyder (1999). "Protected paste volume in concrete: Extension to internal curing using saturated lightweight fine aggregate." Cement and Concrete Research 29(11): 1863-1867.
Bentz, D. P. and K. A. Snyder (1999b). "Protected paste volume in concrete: Extension to internal curing using saturated lightweight fine aggregate." Cement and Concrete Research 29(11): 1863.
Bisschop, J., et al. (2001). "Shrinkage microcracking in cement-based materials with low water-cement ratio." Concrete Science and Engineering 3(11): 151-156.
Bjontegaard and E. J. Sellevold (1998). Thermal dilation-autogenous shrinkage: How to separate. Autogenous Shrinkage of Concrete: Proceedings of the Int. Workshop organized by the JCI, Hiroshima.
Bjøntegaard, Ø., et al. (2004). "On the measurement of free deformation of early age cement paste and concrete." Cement and Concrete Composites 26(5): 427.
Black, R. W. (1986). "The Determination of Specific Gravity Using the Siphon-Can Method." Cement, Concrete, and Aggregates: 46.

Castro, J., et al. (2010). "Drying and Wetting of Concrete in the Presence of Deicing Solutions (In Production)."
Cohen, M. D., et al. (1990). "Mechanism of plastic shrinkage cracking in portland cement and portland cement-silica fume paste and mortar." Cement and Concrete Research 20(1): 103.
Couch, J., et al. (2006). Use of acoustic emission to detect cavitation and solidification (time zero) in cement pastes. International RILEM Conference on Volume Changes of Hardening Concrete: Testing and Mitigation.
Cusson, D. and T. Hoogeveen (2006). Preventing autogenous shrinkage of high-performance concrete structures by internal curing. Measuring, Monitoring and Modeling Concrete Properties: 83.
Dehrdrai, M. (2008). Health Monitoring of Civil Engineering Materials. West Lafayette, Purdue University. MS.
Delatte, N., et al. (2007). Evaluation of High Absorptive Materials to Improve Internal Curing of Low Permeability Concrete. State Job Number: 134227, for the Ohio Department of Transportation: 1-142.
Diamond, S. (1970). "Pore Size Distribution in Clays." Clay and Clay Minerals 18: 7-23.
Diamond, S. (2000). "Mercury porosimetry: An inappropriate method for the measurement of pore size distributions in cement-based materials." Cement and Concrete Research 30(10): 1517.
El-Dieb, A. S. and R. D. Hooton (1995). "Water-permeability measurement of high performance concrete using a high-pressure triaxial cell." Cement and Concrete Research 25(6): 1199.
Elsharief, A., et al. (2005). "Influence of lightweight aggregate on the microstructure and durability of mortar." Cement and Concrete Research 35(7): 1368.
ESCSI (1971). Lightweight Concrete, History, Applications, Economics, Expanded Shale, Clay and Slate Institute: 1-43.
Fagerlund, G. (1977). "The Critical Degree of Saturation Method of Assessing Freeze/Thaw Resistance of Concrete." Materiaux et constructions 58.
FHWA (2006). Compilation and evaluation of results from high-performance concrete bridge projects, volume 1: Final Report. McLean, VA, U.S. Department of Transportation: 180.

Folliard, K. J. and N. S. Berke (1997). "Properties of high-performance concrete containing shrinkage-reducing admixture." Cement and Concrete Research 27(9): 1357.
Ford, S. J., et al. (1998). "Assignment of features in impedance spectra of the cement-paste/steel system." Cement and Concrete Research 28(12): 1737.
Geiker, M. (1983). Studies of Portland cement hydration by measurements of chemical shrinkage and a systematic evaluation of hydration curves by means of the dispersion model, Technical University of Denmark. Ph. D.
Greenspan, L. (1977). "Humidity fixed points of binary saturated aqueous solutions." Journal of Research of the National Bureau of Standards - Physics and Chemistry 81A(1).
Guillaume, C. E. (1904). "Invar and its applications." Nature.
Hannah, R. L. and S. E. Reed (1992). Strain gage users' handbook.
Henkensiefken, R. (2008a). Volume Change and Cracking in Internally Cured Mixtures Made with Saturated Lightweight Aggregate Under Sealed and Drying Conditions, Presented at ACI Fall Convention, St. Louis, MO.
Henkensiefken, R., et al. (2009). "Volume change and cracking in internally cured mixtures made with saturated lightweight aggregate under sealed and unsealed conditions." Cement and Concrete Composites 31(7): 427-437.
Henkensiefken, R., et al. (2008b). "Volume change and cracking in internally cured mixtures made with saturated lightweight aggregate under sealed and drying conditions." Cement and Concrete Composites: Submitted.
Henkensiefken, R., et al. (2008c). "The Absorption Properties of Lightweight Aggregate: A Discussion on Critical Aspects of Moisture of Absorption for use in Proportioning Internal Curing Concrete." Journal of ASTM International.
Henkensiefken, R., et al. (2008d). "Saturated lightweight aggregate for internal curing in low w/c mixtures: Monitoring water movement using x-ray absorption." Strain: Submitted.
Henkensiefken, R., et al. (2008e). Reducing Restrained Shrinkage Cracking in Concrete: Examining the behavior of self-curing concrete made using different volumes of saturated lightweight aggregate. National Concrete Bridge Conference, St. Louis, MO.

Henkensiefken, R., et al. (2008f). Comments on the shrinkage of paste in mortar containing saturated lightweight aggregate. CONMOD. Delft, The Netherlands.
Henkensiefken, R., et al. (2008g). Detecting solidification using moisture transport from saturated lightweight aggregate. Technical session on “Transition from Fluid to Solid Re-examining the Behavior of Concrete at Early Ages" at the ACI Spring 2009 Convention. San Antonio, TX.
Henkensiefken, R. and J. Weiss (2008h). Effects of Cure Time on Internal Curing, Purdue University.
Hillerborg, A., et al. (1976). "Analysis of crack formation and crack growth in concrete by means of fracture mechanics and finite elements." Cement and Concrete Research 6(6): 163–168.
Hobbs, D. W. (1969). "Bulk Modulus and Thermal Expansion of a Two Phase Material." Nature 222: 849-851.
Hobbs, D. W. (1999). "Aggregate influence on chloride ion diffusion into concrete." Cement and Concrete Research 29(12): 1995-1998.
Holm, T. A. and T. W. Bremner (August 2000). State-of-the-art-report on high-strength, high-durability structural low-density concrete for applications in severe marine environments: 116
Holm, T. A. and J. P. Ries (2006). Lightweight concrete and aggregates. Significance of Tests and Properties of Concrete and Concrete-Making Materials, West Conshohocken, United States, American Society for Testing and Materials.
Hossain, A. B. and J. Weiss (2004). "Assessing residual stress development and stress relaxation in restrained concrete ring specimens." Cement and Concrete Composites 26(5): 531-540.
HPB (2004). General Haydite Properties - Chemical Analysis, Hydraulic Press Brick Company.
Igarashi, S.-I., et al. (2000). "Autogenous shrinkage and induced restraining stresses in high-strength concretes." Cement and Concrete Research 30(11): 1701-1707.
Jacobs, S. F. (1996). Measuring Invar's dimensional stability. Invar Effect. A Centennial Symposium. Proceedings of an International Symposium on the Invar Effect held on the occasion of the 100th Anniversary of its Discovery, 7-8 Oct. 1996, Warrendale, PA, USA, TMS.

Jensen, O. M. (2005). Autogenous phenomena in cement-based materials. Department of Building Technology and Structural Engineering, Aalborg University.
Jensen, O. M. and P. F. Hansen (1995). "A dilatometer for measuring autogenous deformation in hardening portland cement paste." Materials and Structures 28(7): 406.
Jensen, O. M. and P. F. Hansen (2001). "Water-entrained cement-based materials: I. Principles and theoretical background." Cement and Concrete Research 31(4): 647-654.
Jensen, O. M. and P. F. Hansen (2001a). "Autogenous deformation and RH-change in perspective." Cement and Concrete Research 31(12): 1859.
Jensen, O. M. and P. F. Hansen (2001b). "Water-entrained cement-based materials: I. Principles and theoretical background." Cement and Concrete Research 31(4): 647.
Kayir, H. and J. Weiss (2002). A fundamental look at settlement in fresh systems: role of mixing time and high range water reducers. First North American Conference on Self-Consolidating Concrete. Chicago, IL.
Khan, M. I. and C. J. Lynsdale (2002). "Strength, permeability, and carbonation of high-performance concrete." Cement and Concrete Research 32(1): 123.
Kim, H. and D. Bentz (2008). Internal curing with crushed returned concrete aggregate for high performance concrete. NRMCA Concrete Technology Forum: Focus on Sustainable Development.
Kleiger, P. and J. F. Lamond (1994). Significance of Tests and Properties of Concrete and Concrete-Making Materials. Fredericksburg, VA.
Knudsen, T. and M. Geiker (1982). Chemical shrinkage as an indicator of the stage of hardening. International RILEM Conference on Concrete of Early Ages, Paris.
Kovler, K. (1994). "Testing system for determining the mechanical behaviour of early age concrete under restrained and free uniaxial shrinkage." Materials and Structures 27(6): 324-330.
L'Hermite, R. G. (1960). Volume changes of concrete. 4th International Symposium on the Chemistry of Cement, Washington D.C.

La Chatelier, H. (1900). Sur les changements de volume qui accompagent le durcissement des ciments. Bulletin Societe de l'encouragemnent pour l'industrie nationale, Paris.
Le Chatelier, H. (1900). "Sur les changements de volume qui accompagnent le durcissement des ciments." Bulletin de la Societe d'Encouragement pour l'Industrie Nationale: 54-57.
Lement, B. S., et al. (1996). The dimensional behavior of Invar. Invar Effect. A Centennial Symposium. Proceedings of an International Symposium on the Invar Effect held on the occasion of the 100th Anniversary of its Discovery, 7-8 Oct. 1996, Warrendale, PA, USA, TMS.
Lo, T. Y. and H. Z. Cui (2004). "Effect of porous lightweight aggregate on strength of concrete." Materials Letters 58(6): 916.
Lopez, M., et al. (2008). The influence of internal curing on basic creep and autogenous shrinkage. Internal Curing of High-Performance Concretes: Laboratory and Field Experiences - ACI Fall Convention 2007, October 14, 2007 - October 18, 2007, Fajardo, Puerto rico, American Concrete Institute.
Lu, B. and S. Torquato (1992). "Nearest-surface distribution functions for polydispersed particle systems." Physical Review A 45(8): 5530.
Lura, P. (2003). Autogenous deformation and internal curing of concrete. Delft University of Technology. Delft PhD.
Lura, P. (2003a). Autogenous deformation and internal curing of concrete, Technical University of Delft. PhD Dissertation.
Lura, P., et al. (2006a). "Measurement of water transport from saturated pumice aggregates to hardening cement paste." Materials and Structures 39(9): 861.
Lura, P. and J. Bisschop (2004). "On the origin of eigenstresses in lightweight aggregate concrete." Cement and Concrete Composites 26(5): 445.
Lura, P., et al. (2007a). "Experimental observation of internal water curing of concrete." Materials and Structures 40(2): 211.
Lura, P., et al. (2007). "Experimental observation of internal water curing of concrete." Materials and Structures/Materiaux et Constructions 40(Compendex): 211-220.
Lura, P., et al. (2006b). Evaporation, settlement, temperature evolution, and development of plastic shrinkage cracks in mortars with shrinkage-

reducing admixtures. ConcreteLife'06 - International RILEM-JCI Seminar on Concrete Durability and Service Life Planning: Curing, Crack Control, Performance in Harsh Environments.
Lynam, C. G. (1934). Growth and movement in Portland cement concrete. London, England, Oxford University Press.
Maekawa, K., et al. (1999). Modelling of concrete performance: Hydration, microstructure and mass transport. London, Taylor and Francis.
Mohr, B. J. (2005). Durability of pulp fiber-cement composites, Georgia Institute of Technology. Ph. D.
Mohr, B. J., et al. (June 2005). Examination of wood-derived powders and fibers for internal curing of cement-based materials. 4rd International research seminar on self-desiccation and its importance in concrete technology, Lund University, Lund, Sweden.
Moon, J.-H., et al. (2006). "Quantifying the influence of specimen geometry on the results of the restrained ring test." Journal of ASTM International 3(8).
Nakamura, Y. (1976). "The Invar problem." IEEE Transactions on Magnetics MAG-12(Copyright 1976, IEE): 278-291.
Neithalath, N. (2006). "Analysis of moisture transport in mortars and concrete using sorption-diffusion approach." ACI Materials Journal 103(3): 209-218.
Neubauer, C. M., et al. (1996). "A three-phase model of the elastic and shrinkage properties of mortar." Advanced Cement Based Materials 4(1): 6.
Neville, H. A. and H. C. Jones (1929). "The study of hydration changes by a volume-change method." Lehigh University -- Publication 3(1): 309-318.
Nielsen, G. (2007). X-Ray CT System - Users Manual' GNI/XRAS/UM.003.
Nilsen, A. U., et al. (1995). "Estimation of the elastic moduli of lightweight aggregate." Cement and Concrete Research 25(2): 276.
O'Neil, M. J., et al. (2001). The Merck Index. Rahway, New Jersey, John Wiley & Sons.
Pease, B., et al. (2005). "Shrinkage behavior and residual stress development in mortar containing shrinkage reducing admixtures (SRAs)." SP-227 227.
Penttala, V. and F. Al-Neshawy (2002). "Stress and strain state of concrete during freezing and thawing cycles." Cement and Concrete Research 32(Compendex): 1407-1420.

Philleo, R. (1991). Concrete science and reality. Materials Science of Concrete II, Westerville, OH, American Ceramic Society.
Pickett, G. (1956). "Effect of Aggregate on Shrinkage of Concrete and Hypothesis Concerning Shrinkage." Journal of ACI 52: 581-590.
Pigeon, M., et al. (2000). "Equipment for the analysis of the behaviour of concrete under restrained shrinkage at early ages." Magazine of Concrete Research 52(Compendex): 297-302.
Powers, T. C. (1935). "Absorption of Water by Portland Cement Paste during the Hardening Process." Ind. Eng. Chem. 27(7): 790-794.
Powers, T. C. (1947). "A discussion of cement hydration in relation to the curing of concrete." Proc. Highw. Res. Board 27 178–188.
Powers, T. C. (1950). Air requirement of frost-resistant concrete: 1-19.
Powers, T. C. (1968). The Properties of Fresh Concrete. New York, John Wiley and Sons.
Powers, T. C. and T. L. Brownyard (2003a). Landmark Series: Studies of the Physical Properties of Hardened Portland Cement Paste. Concrete International. 25.
Powers, T. C. and T. L. Brownyard (2003b). Landmark Series: Studies of the Physical Properties of Hardened Portland Cement Paste, Part 2. Concrete International. 25.
Qi, C. (2003a). Quantitative assessment of plastic shrinkage cracking and its impact on the corrosion of steel reinforcement. School of Civil Engineering. West Lafayette, Purdue University. Ph. D.
Qi, C., et al. (2003b). "Characterization of plastic shrinkage cracking in fiber reinforced concrete using image analysis and a modified Weibull function." Materials and Structures 36(6): 386.
Qi, C., et al. (2005). Assessing the settlement of fresh concrete using a non-contact laser profiling approach. International Conference on Construction Materials: ConMat'05. Vancouver, BC, Canada.
Radlinska, A. (2008). Reliability-Based Analysis Of Early-Age Cracking In Concrete. West Lafayette, Purdue University. PhD.
Radlinska, A., et al. (2008). "Comments on the interpretation of results from the restrained ring test." Journal of ASTM International 5(Copyright 2009, The Institution of Engineering and Technology): JAI101944 (101912 pp.).

Radlinska, A., et al. (2008a). "Comments on the Interpretation of Results From the Restrained Ring Test." Journal of ASTM International.
Radlinska, A., et al. (2007). "Shrinkage Mitigation Strategies in Cementitious Systems: a Closer Look at Differences in Sealed and Unsealed Behavior." Accepted by Transportation Research Board.
Radlinska, A., et al. (2008b). Shrinkage mitigation strategies in cementitious systems: A closer look at sealed and unsealed material behavior. Accepted for publication in the Transportation Research Record.
Raoufi, K. (2010). Shrinkage Cracking of Concrete Systems: The Influence of Damage Localization On Crack Widths. West Lafayette, Purdue University. PhD.
RILEM (2007). Internal curing of concrete, Editor: Kovler, K. and O.M. Jensen, RILEM, ICC 196.
RILEM Commission 42-CEA (1981). "Properties of set concrete at early ages (state of the art report)." Mate´r. Const 84 399–460.
RILEM Report 41 (2007). Internal Curing of Concrete. K. Kovler and O. M. Jensen.
RILEM TC-181 EAS (2002). RILEM Report 25: Early age shrinkage induced stresses and cracking in cementitous systems. RILEM Technical Committee 181-EAS. A. Bentur.
Roberts, J. (1995). Freeze-thaw durability of concretes using lightweight aggregate of differing absorption characteristics. First Int. Conf. on Concrete under Severe Conditions—Environment and Loading. Sapporo, Japan: 139–146.
Sabir, B., et al. (1998). "A water sorptivity test for mortar and concrete." Materials and Structures 31(8): 568.
Saito, M., et al. (1991). "Role of aggregate in the shrinkage of ordinary portland and expansive cement concrete." Cement and Concrete Composites 13(2): 115.
Sant, G. (2007). Examining Volume Changes, Stress Development and Cracking in Cement Based Systems. West Lafayette, Purdue University. MSCE.
Sant, G., et al. (2008a). "The influence of shrinkage reducing-admixtures (SRAs) on moisture absorption in cementitious materials at early-ages." submitted to the ASCE Journal of Materials in Civil Engineering (2008).

Sant, G., et al. (2007). "Examining residual stress development in cementitious materials experiencing an early-age expansion." Proc., 9th CANMET-ACI Int. Conf.—T.C. Holland Symp: 21–29.
Sant, G., et al. (2006). "Measurement of volume change in cementitious materials at early ages: Review of testing protocols and interpretation of results." Transportation Research Record 1979.
Sant, G., et al. (2006). "Examining Early Age Expansion In Pastes Containing Shrinkage Reducing Admixtures (SRA’s)." Advances in Concrete through Science and Engineering, RILEM Quebec: abstract p. 353 (electronic proceedings pp. 311).
Sant, G. and J. Weiss (2008b). "Unpublished Results."
Sant, G. and W. Weiss (2008c). "The use of x-ray absorption for assessing moisture movement in cementitious materials." submitted to the Journal of ASTM International (2008).
Saxer, E. L. (1956). A Direct Method for Determining the Absorption and Specific Gravity of Aggregates. Rock Products: 78.
See, H. T., et al. (2004). "Potential for restrained shrinkage cracking of concrete and mortar." Cement, Concrete and Aggregates 26(2): 123-130.
Sellevold, E. J. and Bjontegaard (2006). Coefficient of thermal expansion of cement paste and concrete: Mechanisms of moisture interaction, Van Godewijckstraat 30, Dordrecht, 3311, Netherlands, Springer Science and Business Media Netherlands.
Shah, S. and S. H. Ahmad (1994). High performance concretes and applications, Butterworth-Heinemann.
Shah, S. P. and J. Weiss (2000). High Strength Concrete: Strength, Permeability, and Cracking. Proceedings of the PCI/FHWA International Symposium on HPC, Orlando, Florida.
Shah, S. P., et al. (1998). Shrinkage Cracking -- Can It Be Prevented? Concrete International. 20: 51-55.
Shah, S. P., et al. (1998). "Shrinkage cracking - can it be prevented?" Concrete International 20(4): 51-55.
Spaulding, J. (2007). Manufacturing of Lightweight Aggregate. R. Henkensiefken. Brooklyn, IN.

Springenschmid, R., et al. (1994). Development of the cracking frame and the temperature-stress testing machine. In: Proceedings of the International RILEM Symposium: Thermal Cracking in Concrete at Early Ages.
Thomas, M. (2008). Use of Conductive Gel. J. Weiss.
van Breugel, K. and H. de Vries (1998). Mixture Optimization of Low Water/Cement Ratio, High-Strength Concretes in View of Reduction of Autogenous Shrinkage. Proceedings International Symposium on High-Performance and Reactive Powder Concretes, University of Sherbrooke, Quebec, Canada.
van Breugel, K. and P. Lura (2000). Effect of Initial Moisture Content and Particle Size Distribution of Lightweight Aggregates on Autogenous Deformation. Proceedings of the 2nd International Symposium on Structural Lightweight Aggregate Concrete, Kristiansand, Norway.
Vishay Measurements Group (2005). "Application Note VMM-19 'Surface Preparation'."
Vishay Measurements Group (2007). "Tech Note TN-504-1 ‘Strain Gage Thermal Output and Gage Factor Variation With Temperature’."
Vishay Measurements Group (2007). "Tech Note TN-505-4 ‘Strain Gage Selection Criteria Procedures Recommendations’."
Vishay Measurements Group (2008). "Instruction Bulletin B-127-14 'M-Bond -200 Installation Instructions'."
Vlahinic, I., et al. (2008). "A constitutive model for drying shrinkage of a partially saturated porous material." Journal of the Mechanics and Physics of Solids.
Wang, K. and S. P. Shah (1997). "Permeability study of cracked concrete." Cement and Concrete Research 27(3): 381-393.
Washburn, E. W. (1921). "The Dynamics of Capillary Flow." Physical Review 17(3): 273.
Weber, S. and H. W. Reinhardt (1995). A blend of Aggregates to Support Curing of Concrete. Proceedings on Structural Lightweight Aggregate Concrete International Symposium, Sandefjord, Norway.
Weiss, J. (1999). Prediction of Early-Age Shrinkage Cracking in Concrete. Evanston, IL, Northwestern University.

Weiss, J. and T. Nantung (2007). Proposal for a Research Study on the Development of Self-Curing Concrete for Increased Service Life. SPR-3211, Joint Transportation Research Program: 1-13.
Weiss, W. and S. Shah (2002). "Restrained shrinkage cracking: the role of shrinkage reducing admixtures and specimen geometry." Materials and Structures 35(2): 85.
Weiss, W. J., et al. (2008). Aspects of monitoring moisture changes using electrical impedance spectroscopy. 2nd Symposium on Self-Desiccation and Its Importance in Concrete Technology, Lund, Sweden.
Wiegrink, K., et al. (1996). "Shrinkage cracking of high-strength concrete." ACI Materials Journal 93(5): 409-415.
Winslow, D. N., et al. (1994). "Percolation and pore structure in mortars and concrete." Cement and Concrete Research 24(1): 25.
Wittman, F. and J. Lukas (1974). "Experimental Study of Thermal Expansion of Hardened Cement Paste." 7(Compendex): 247-252.
Wittmann, F. H. (1976). "On the action of capillary pressure in fresh concrete." Cement and Concrete Research 6(1): 49.
Yang, Z. (2004). Assessing cumulative damage in concrete and quantifying its influence on life cycle performance modeling. West Lafayette, Purdue University. Ph. D.
Zhang, M.-H. and O. E. Gjørv (1990). "Microstructure of the interfacial zone between lightweight aggregate and cement paste." Cement and Concrete Research 20(4): 610.
Zhutovsky, S., K. Kovler, A. Bentur, (2002). "Efficiency of lightweight aggregates for internal curing of high strength concrete to eliminate autogenous shrinkage." Materials and Structures 35(2): 97-101.
Zhutovsky, S., et al. (2002). "Efficiency of lightweight aggregates for internal curing of high strength concrete to eliminate autogenous shrinkage." Materials and Structures 35(2): 97.

Appendix A. Calculation of LWA needed from Equation 2-1
1. Start with the initial mixture proportions:
Batch Size (ft3) 27.000w/c ratio 0.3
% FA 55%% CA 0%
Total Agg 55%
Cement (Type I) 3.15 1227.87 6.25 6.25 1227.87Water 1 368.36 5.90 5.90 368.36
Fine Aggregate 2.58 2390.73 14.85 14.85 2390.73Course Aggregate 2.75 0.00 0.00 0.00 0.00
MaterialsSpecific Gravity
Amount
(lbs/yd3)
Volume
(ft3/yd3)
Batch Volume
(ft3)Batch Weight
(lbs)
2. Determine the amount of dry LWA to add:
33
max68.623
105.01
83.0064.01228ydlbs
lbslbs
lbslbsydlbs
S
CSCM
LWA
f
LWA
3. Replace equal volume of sand by using the ratio of specific gravities
347.103156.1
58.2ydlbsM
SG
SGM LWA
LWA
FAFA
4. Replace that volume of fine aggregate with LWA yielding final mixture
proportions

Batch Size (ft3) 27.000w/c ratio 0.3
% FA 55%% CA 0%
Total Agg 55%
Cement (Type I) 3.15 1227.87 6.25 6.25 1227.87Water 1 368.36 5.90 5.90 368.36
Fine Aggregate 2.58 1359.26 8.44 8.44 1359.26Lightweight Aggregate 1.56 623.68 6.41 6.41 623.68
Coarse Aggregate 2.75 0.00 0.00 0.00 0.00
MaterialsSpecific Gravity
Amount
(lbs/yd3)
Volume
(ft3/yd3)Batch Weight
(lbs)
Batch Volume
(ft3)

Appendix B. Unrestrained Shrinkage Measurements
Table B-1 – All unrestrained shrinkage measurements in sealed conditions
Time (d) Strain (με) Strain (με) Strain (με) Time (d) Strain (με) Strain (με) Strain (με) Time (d) Strain (με) Strain (με) Strain (με)0.16 0.00 0 0 0.25 0.00 0.00 0.00 0.25 -4.64 -4.64 -4.640.25 -38.00 -38 -38 0.50 17.00 17.00 17.00 0.50 129.86 129.86 129.860.50 -38.00 -38 -38 0.75 -2.00 -2.00 -2.00 0.75 151.26 151.26 151.260.75 -36.00 -36 -36 1.00 -30.00 -30.00 -30.00 1.00 143.56 143.56 143.561.04 -54.00 -54 -54 2.88 -210.00 -120.00 -130.00 3.77 63.56 83.56 73.562.47 -164.00 -174.00 -184.00 6.94 -290.00 -190.00 -210.00 7.00 43.56 43.56 33.567.00 -254.00 -264.00 -254.00 14.02 -380.00 -270.00 -290.00 14.00 -66.44 -36.44 -76.4413.86 -334.00 -304.00 -334.00 20.90 -430.00 -310.00 -330.00 21.00 -96.44 -76.44 -96.4420.92 -354.00 -354.00 -384.00 27.84 -430.00 -320.00 -340.00 27.90 -146.44 -96.44 -116.4427.93 -374.00 -384.00 -414.00
7.3%k0.0% 11.0%k
Time (d) Strain (με) Strain (με) Strain (με) Time (d) Strain (με) Strain (με) Strain (με) Time (d) Strain (με) Strain (με) Strain (με)0.24 0.00 0.00 0.00 0.24 3.02 3.02 3.02 0.23 0.00 0.00 0.000.50 145.00 145.00 145.00 0.50 157.38 157.38 157.38 0.25 17.00 17.00 17.000.75 185.00 185.00 185.00 0.75 207.81 207.81 207.81 0.50 181.00 181.00 181.001.00 172.00 172.00 172.00 1.00 207.81 207.81 207.81 0.75 210.00 210.00 210.003.03 122.00 152.00 142.00 3.14 217.81 127.81 207.81 1.00 210.00 210.00 210.007.00 112.00 152.00 132.00 7.00 197.81 97.81 217.81 2.91 240.00 210.00 260.0013.83 92.00 122.00 122.00 13.98 167.81 57.81 187.81 6.97 260.00 240.00 250.0021.13 82.00 102.00 102.00 21.18 147.81 37.81 177.81 13.87 300.00 270.00 290.0027.90 32.00 82.00 62.00 28.00 127.81 7.81 147.81 20.85 290.00 240.00 280.00
27.83 280.00 260.00 280.00
14.3%k 18.3%k 25.3%k
Time (d) Strain (με) Strain (με) Strain (με) Time (d) Strain (με) Strain (με) Strain (με)0.25 13.81 13.81 13.81 0.25 13.71 13.71 13.710.50 180.15 180.15 180.15 0.50 174.04 174.04 174.040.75 216.77 216.77 216.77 0.75 201.41 201.41 201.411.00 225.91 225.91 225.91 1.00 203.00 203.00 203.002.85 255.91 285.91 255.91 4.06 243.00 273.00 253.006.99 285.91 325.91 295.91 7.00 263.00 283.00 283.0014.37 285.91 325.91 305.91 14.20 303.00 303.00 313.0021.09 295.91 315.91 325.91 21.22 303.00 303.00 313.0027.90 305.91 335.91 315.91 27.90 313.00 303.00 323.00
29.3%k 33.0%k
137

221
0 7 14 21 28Age of Specimen (d)
-500
-400
-300
-200
-100
0
100
200
300
400
Str
ain
(
)
Sealed33.0%k29.3%k25.3%k18.3%k14.3%k11.0%k7.3%k0.0%
Figure B-1 – All unrestrained, sealed shrinkage measurements
0 7 14 21 28Age of Specimen (d)
-500
-400
-300
-200
-100
0
100
200
300
400
Str
ain
(
)
Sealed0.0%
Figure B-2 – Unrestrained, sealed shrinkage for 0.0% mixture

222
0 7 14 21 28Age of Specimen (d)
-500
-400
-300
-200
-100
0
100
200
300
400
Str
ain
(
)
Sealed7.3%k
Figure B-3 – Unrestrained, sealed shrinkage for 7.3%k mixture
0 7 14 21 28Age of Specimen (d)
-500
-400
-300
-200
-100
0
100
200
300
400
Str
ain
(
)
Sealed11.0%k
Figure B-4 – Unrestrained, sealed shrinkage for 11.0%k mixture

223
0 7 14 21 28Age of Specimen (d)
-500
-400
-300
-200
-100
0
100
200
300
400
Str
ain
(
)
Sealed14.3%k
Figure B-5 – Unrestrained, sealed shrinkage 14.3%k mixture
0 7 14 21 28Age of Specimen (d)
-500
-400
-300
-200
-100
0
100
200
300
400
Str
ain
(
)
Sealed18.3%k
Figure B-6 – Unrestrained, sealed shrinkage for 18.3%k mixture

224
0 7 14 21 28Age of Specimen (d)
-500
-400
-300
-200
-100
0
100
200
300
400
Str
ain
(
)
Sealed25.3%k
Figure B-7 – Unrestrained, sealed shrinkage 25.3%k mixture
0 7 14 21 28Age of Specimen (d)
-500
-400
-300
-200
-100
0
100
200
300
400
Str
ain
(
)
Sealed29.3%k
Figure B-8 – Unrestrained, sealed shrinkage for 29.3%k mixture

225
0 7 14 21 28Age of Specimen (d)
-500
-400
-300
-200
-100
0
100
200
300
400
Str
ain
(
)
Sealed33.0%k
Figure B-9 – Unrestrained, sealed shrinkage for 33.0%k mixture

Table B-2 – All unrestrained shrinkage measurements in unsealed conditions
Time (d) Strain (με) Strain (με) Strain (με) Time (d) Strain (με) Strain (με) Strain (με)0.25 13.81 13.81 13.81 0.25 13.71 13.71 13.710.50 180.15 180.15 180.15 0.50 174.04 174.04 174.040.75 216.77 216.77 216.77 0.75 201.41 201.41 201.411.00 225.91 225.91 225.91 1.00 203.00 203.00 203.002.85 245.91 165.91 215.91 4.06 213.00 203.00 203.007.01 215.91 165.91 205.91 7.48 203.00 213.00 193.0014.37 155.91 115.91 195.91 14.20 193.00 193.00 203.0021.09 145.91 105.91 175.91 21.22 173.00 163.00 153.0028.00 105.91 65.91 145.91 28.00 173.00 143.00 143.00
33.0%k29.3%k
Time (d) Strain (με) Strain (με) Strain (με) Time (d) Strain (με) Strain (με) Strain (με) Time (d) Strain (με) Strain (με) Strain (με)0.24 0.00 0.00 0.00 0.24 3.02 3.02 3.02 0.23 0.00 0.00 0.000.50 145.00 145.00 145.00 0.50 157.38 157.38 157.38 0.25 17.00 17.00 17.000.75 185.00 185.00 185.00 0.75 207.81 207.81 207.81 0.50 181.00 181.00 181.001.00 172.00 172.00 172.00 1.00 207.81 207.81 207.81 0.75 210.00 210.00 210.003.09 -18.00 -38.00 -8.00 3.00 127.81 127.81 122.81 1.00 210.00 210.00 210.006.99 -168.00 -148.00 -138.00 6.97 47.81 47.81 37.81 2.91 170.00 130.00 180.0013.96 -358.00 -358.00 -328.00 13.94 -72.19 -62.19 -72.19 6.97 140.00 90.00 160.0020.98 -468.00 -458.00 -418.00 20.93 -202.19 -192.19 -212.19 13.87 110.00 50.00 120.0028.00 -548.00 -518.00 -518.00 27.90 -302.19 -272.19 -322.19 20.85 20.00 0.00 50.00
27.83 -50.00 -50.00 10.00
14.3%k 18.3%k 25.3%k
Time (d) Strain (με) Strain (με) Strain (με) Time (d) Strain (με) Strain (με) Strain (με) Time (d) Strain (με) Strain (με) Strain (με)0.16 0.00 0.00 0.00 0.25 0.00 0.00 0.00 0.25 -4.64 -4.64 -4.640.25 -38.00 -38.00 -38.00 0.50 17.00 17.00 17.00 0.50 129.86 129.86 129.860.50 -38.00 -38.00 -38.00 0.75 -2.00 -2.00 -2.00 0.75 151.26 151.26 151.260.75 -36.00 -36.00 -36.00 1.00 -30.00 -30.00 -30.00 1.00 143.56 143.56 143.561.04 -54.00 -54.00 -54.00 2.74 -210.00 -180.00 -220.00 3.75 -220.00 -240.00 -210.002.46 -274.00 -234.00 -234.00 6.96 -410.00 -390.00 -400.00 6.99 -370.00 -350.00 -340.007.00 -434.00 -404.00 -414.00 13.97 -600.00 -570.00 -560.00 13.98 -560.00 -560.00 -530.0013.84 -624.00 -564.00 -554.00 21.72 -690.00 -650.00 -660.00 20.98 -670.00 -660.00 -620.0020.91 -704.00 -654.00 -644.00 27.83 -760.00 -740.00 -740.00 28.00 -750.00 -720.00 -720.0027.92 -794.00 -744.00 -714.00
0.0% 7.3%k 11.0%k
143

227
Figure B-10 – All unrestrained, unsealed shrinkage measurements
0 7 14 21 28Age of Specimen (d)
-800
-600
-400
-200
0
200
400
Str
ain
(
)
Unsealed0.0%
Figure B-11 – Unrestrained, unsealed shrinkage for 0.0% mixture

228
0 7 14 21 28Age of Specimen (d)
-800
-600
-400
-200
0
200
400
Str
ain
(
)
Unsealed7.3%k
Figure B-12 – Unrestrained, unsealed shrinkage for 7.3%k mixture
0 7 14 21 28Age of Specimen (d)
-800
-600
-400
-200
0
200
400
Str
ain
(
)
Unsealed11.0%k
Figure B-13 – Unrestrained, unsealed shrinkage for 11.0%k mixture

229
0 7 14 21 28Age of Specimen (d)
-800
-600
-400
-200
0
200
400
Str
ain
(
)
Unsealed14.3%k
Figure B-14 – Unrestrained, unsealed shrinkage for 14.3%k mixture
0 7 14 21 28Age of Specimen (d)
-800
-600
-400
-200
0
200
400
Str
ain
(
)
Unsealed18.3%k
Figure B-15 – Unrestrained, unsealed shrinkage for 18.3%k mixture

230
0 7 14 21 28Age of Specimen (d)
-800
-600
-400
-200
0
200
400
Str
ain
(
)
Unsealed25.3%k
Figure B-16 – Unrestrained, unsealed shrinkage for 25.3%k mixture
0 7 14 21 28Age of Specimen (d)
-800
-600
-400
-200
0
200
400
Str
ain
(
)
Unsealed29.3%k
Figure B-17 – Unrestrained, unsealed shrinkage for 29.3%k mixture

231
0 7 14 21 28Age of Specimen (d)
-800
-600
-400
-200
0
200
400
Str
ain
(
)
Unsealed33.0%k
Figure B-18 – Unrestrained, unsealed shrinkage for 33.0%k mixture

Appendix C. Restrained Shrinkage Measurements
Table C-1 – Restrained, sealed measurements for 0.0% mixture
Days [με] [με] [με] [με] [με] [με]0.00 0.00 0.00 0.00 0.00 0.00 0.000.25 -7.84 -7.58 -9.15 -6.26 -8.79 -8.790.50 -24.36 -21.52 -18.00 -20.42 -23.55 -19.720.75 -29.61 -26.22 -21.60 -24.87 -28.60 -24.191.00 -34.96 -30.27 -25.52 -28.19 -32.64 -29.221.25 -38.47 -32.83 -27.85 -30.64 -35.08 -33.491.50 -41.23 -34.76 -30.86 -32.56 -37.36 -36.631.75 -43.75 -37.53 -33.51 -34.61 -39.42 -39.422.00 -45.19 -38.98 -34.96 -35.34 -41.11 -41.722.25 -47.60 -40.43 -36.77 -37.15 -42.55 -44.022.50 -49.53 -42.60 -39.30 -39.08 -44.73 -46.682.75 -51.09 -43.56 -40.99 -40.89 -45.93 -48.253.00 -52.41 -45.25 -43.16 -42.94 -47.26 -50.193.25 -54.10 -46.57 -45.10 -43.91 -48.10 -52.373.50 -55.42 -47.30 -45.46 -44.39 -48.95 -52.973.75 -55.90 -48.02 -46.54 -45.36 -49.67 -53.944.00 -56.26 -47.66 -45.22 -44.39 -48.95 -53.094.25 -57.22 -48.87 -46.30 -44.75 -49.67 -54.064.50 -58.91 -50.67 -48.71 -47.53 -51.72 -56.854.75 -59.87 -51.39 -48.95 -47.89 -52.33 -56.855.00 -58.91 -51.15 -48.11 -46.93 -52.09 -56.485.25 -59.99 -52.48 -49.56 -47.05 -53.05 -57.575.50 -61.67 -53.56 -51.49 -48.74 -54.62 -59.515.75 -61.67 -54.52 -51.49 -49.10 -55.58 -59.756.00 -60.75 -0.88 -51.41 -2.30 -56.35 -60.646.25 -61.11 -0.76 -51.65 -2.30 -2.53 -60.526.50 -60.63 -1.37 -53.22 -3.38 -3.38 -62.586.75 -22.51 -0.88 -0.12 -3.02 -3.02 -59.797.00 0.72 3.51 0.84 0.72 0.59 2.54
0.0%

Table C-2 – Restrained, sealed measurements for 3.8%k mixture
Days [με] [με] [με]
0.00 0.00 0.00 0.000.25 -2.07 -2.73 -4.510.50 -10.55 -8.82 -8.660.75 -15.69 -13.93 -6.841.00 -21.47 -20.22 -10.541.25 -23.19 -24.41 -13.911.50 -26.36 -28.43 -17.131.75 -28.37 -31.00 -19.872.00 -30.30 -33.10 -21.802.25 -32.23 -35.84 -25.512.50 -34.28 -38.58 -27.612.75 -35.49 -39.88 -28.093.00 -35.61 -40.84 -29.223.25 -38.38 -43.58 -32.123.50 -40.44 -45.03 -33.253.75 -41.40 -46.00 -35.194.00 -42.37 -47.29 -35.994.25 -44.30 -47.77 -37.284.50 -46.23 -49.71 -39.704.75 -43.21 -50.35 -40.355.00 -43.45 -50.19 -41.155.25 -44.54 -52.45 -42.765.50 -43.94 -53.42 -44.545.75 -44.91 -52.94 -45.516.00 -43.02 -52.90 -45.956.25 -43.98 -53.05 -47.406.50 -44.10 -53.22 -48.376.75 -43.86 -54.66 -48.697.00 -41.81 -53.54 -47.407.25 -41.81 -54.02 -49.507.50 -44.22 -56.60 -51.927.75 -41.33 -54.18 -4.198.00 -3.31 -49.67 -4.838.25 -2.22 -49.03 -4.358.50 -3.31 -49.67 -5.328.75 -3.55 -5.35 -5.169.00 -3.43 -4.86 -4.99
3.8%k

Table C-3 – Restrained, sealed measurements for 7.3%k mixture
Days [με] [με] [με]
0.00 0.00 0.00 0.000.25 1.28 1.57 -0.770.50 -9.94 -5.87 -11.850.75 -4.52 -3.21 -6.801.00 -2.13 -3.10 -2.851.25 -4.29 -4.23 -6.831.50 -6.81 -8.57 -11.301.75 -7.30 -9.86 -13.352.00 -10.66 -12.92 -15.882.25 -12.59 -15.01 -18.782.50 -14.27 -17.75 -22.162.75 -15.11 -18.40 -23.363.00 -15.71 -20.97 -25.533.25 -17.52 -22.42 -27.713.50 -19.32 -24.19 -30.243.75 -19.80 -25.48 -32.174.00 -20.77 -27.41 -32.774.25 -22.21 -28.22 -34.704.50 -23.65 -29.99 -37.724.75 -24.37 -31.44 -38.815.00 -25.22 -31.93 -37.725.25 -26.42 -33.54 -39.775.50 -27.98 -34.99 -42.065.75 -28.58 -35.63 -42.916.00 -29.11 -37.04 -43.076.25 -30.19 -37.20 -44.766.50 -31.03 -37.53 -45.736.75 -32.35 -38.65 -46.697.00 -33.68 -40.26 -47.537.25 -33.44 -40.10 -47.177.50 -34.04 -40.27 -47.207.75 -34.16 -41.24 -47.328.00 -35.00 -40.92 -48.048.25 -35.60 -40.59 -46.598.50 -36.20 -40.60 -46.358.75 -36.80 -41.08 -46.959.00 -37.76 -42.20 -46.47
7.3%k
Days [με] [με] [με]
9.25 -37.04 -41.88 -45.639.50 -37.76 -41.56 -45.99
9.75 -37.64 -42.53 -46.3510.00 -38.12 -42.53 -45.9910.25 -40.05 -42.21 -44.6610.50 -40.05 -42.05 -44.5410.75 -40.77 -41.90 -44.9011.00 -43.53 -39.80 -43.6911.25 -20.09 -40.12 -42.2511.50 -21.29 -41.08 -44.0611.75 -20.33 -40.60 -43.5812.00 -19.85 -13.50 -43.2212.25 -18.40 -13.49 -43.5812.50 -18.52 -13.82 -43.8212.75 -18.28 -11.88 -35.0113.00 -18.88 -12.21 -35.49
7.3%k

Table C-4 – Restrained, sealed measurements for 11.0%k mixture
Days [με] [με] [με]
0.00 0.00 0.00 0.000.25 -10.50 -13.35 -7.850.50 -10.63 -13.85 -9.550.75 -6.54 -12.53 -12.831.00 -2.36 -10.53 -9.021.25 -2.72 -10.78 -13.361.50 -3.92 -12.70 -15.651.75 -4.41 -12.70 -17.222.00 -5.13 -13.18 -17.102.25 -5.61 -14.01 -18.672.50 -6.09 -14.13 -19.512.75 -5.85 -14.01 -19.393.00 -5.73 -13.77 -18.423.25 -6.94 -14.97 -20.113.50 -8.14 -15.93 -21.323.75 -8.50 -15.09 -22.174.00 -8.98 -15.33 -22.404.25 -9.70 -16.17 -23.134.50 -10.78 -17.01 -24.464.75 -11.03 -17.25 -24.585.00 -11.39 -17.37 -24.465.25 -12.35 -17.97 -25.785.50 -13.31 -19.17 -27.475.75 -14.15 -19.89 -28.446.00 -13.31 -18.81 -26.996.25 -14.88 -20.25 -28.206.50 -15.96 -21.21 -28.806.75 -16.08 -20.98 -29.657.00 -16.44 -20.86 -28.207.25 -17.89 -21.70 -30.017.50 -20.17 -23.98 -33.157.75 -19.57 -23.26 -31.468.00 -19.81 -23.49 -32.068.25 -20.41 -23.98 -32.188.50 -21.85 -25.18 -34.358.75 -23.18 -25.78 -35.209.00 -24.02 -26.49 -35.20
11.0%k
Days [με] [με] [με]
9.25 -24.50 -26.74 -35.689.50 -25.47 -27.10 -36.41
9.75 -25.83 -27.10 -35.9210.00 -25.59 -27.10 -35.6810.25 -27.27 -28.65 -39.9010.50 -28.35 -28.17 -42.6710.75 -28.83 -29.14 -45.2011.00 -29.32 -29.02 -45.2011.25 -30.28 -29.86 -46.0411.50 -31.61 -30.46 -46.1611.75 -31.60 -30.33 -46.2812.00 -32.57 -31.54 -47.1312.25 -32.81 -31.17 -45.5612.50 -33.17 -31.78 -46.6412.75 0.97 -20.76 -31.2413.00 0.73 -17.50 -30.9213.25 1.45 -13.02 -30.4413.50 1.45 -7.31 -30.6013.75 1.45 -6.68 -29.6314.00 1.21 -6.80 -29.9514.25 1.69 -6.43 -28.6614.50 1.69 -5.83 -28.1814.75 1.45 0.91 -28.3415.00 1.93 0.54 -28.82
11.0%k

Table C-5 – Restrained, sealed measurements for 14.3%k mixture
Days [με] [με] [με]
0.00 0.00 0.00 0.000.25 0.38 -0.66 -2.030.50 -5.73 -8.14 -9.810.75 -0.17 -1.62 -4.511.00 4.25 4.37 0.521.25 2.45 2.85 -1.171.50 1.01 2.53 -1.901.75 2.33 3.01 -0.682.00 2.09 3.01 -1.652.25 1.49 2.21 -2.622.50 0.65 1.24 -3.352.75 1.61 1.89 -2.623.00 0.88 1.56 -2.633.25 1.01 1.73 -3.353.50 -0.20 0.60 -4.323.75 0.16 1.09 -4.564.00 0.64 1.57 -3.594.25 0.53 1.57 -3.834.50 -0.32 0.92 -4.804.75 0.88 1.57 -3.595.00 0.53 1.73 -4.565.25 0.40 1.73 -4.325.50 -0.92 0.76 -4.805.75 0.04 1.09 -4.566.00 -0.25 1.44 -4.606.25 -0.61 0.97 -5.096.50 -1.45 0.48 -5.096.75 -2.18 -0.32 -5.577.00 -2.42 -0.48 -6.307.25 -1.69 0.16 -5.577.50 -2.18 -0.32 -5.577.75 -2.78 -0.16 -6.068.00 -3.02 -0.32 -6.308.25 -2.42 -0.32 -6.068.50 -2.90 -0.64 -5.578.75 -3.38 -0.64 -6.309.00 -4.35 -1.44 -6.549.25 -4.11 -0.80 -6.309.50 -4.23 -1.12 -6.549.75 -4.47 -1.28 -7.2710.00 -4.59 -1.12 -6.78
14.3%k
Days [με] [με] [με]
10.25 -4.83 -1.44 -7.0210.50 -4.23 -1.12 -7.2710.75 -4.71 -0.80 -7.2711.00 -4.35 -0.15 -6.7811.25 -4.95 -1.12 -7.0211.50 -6.52 -1.92 -7.7511.75 -5.43 -1.60 -7.2712.00 -5.07 -1.44 -7.0312.25 -5.67 -1.60 -7.5112.50 -6.03 -1.60 -8.2412.75 -5.31 -1.44 -8.0013.00 -6.27 -1.76 -9.9313.25 -5.91 -1.76 -9.4513.50 -6.27 -1.60 -9.2013.75 -7.00 -2.73 -10.4214.00 -7.00 -2.24 -10.1714.25 -6.76 -2.09 -9.9314.50 -6.52 -2.25 -10.4214.75 -7.36 -3.05 -11.3815.00 -5.92 -3.05 -10.4215.25 -6.28 -2.73 -9.9315.50 -8.69 -4.82 -12.1115.75 -8.81 -4.50 -11.8716.00 -7.73 -3.53 -11.1416.25 -7.60 -4.50 -11.1416.50 -8.69 -4.34 -11.6316.75 -9.90 -5.94 -12.6017.00 -9.42 -6.26 -12.3517.25 -9.90 -5.95 -13.0817.50 -9.66 -5.63 -12.6017.75 -10.86 -7.39 -14.2918.00 -10.02 -6.10 -12.84
18.25 -10.86 -6.91 -13.3218.50 -11.47 -7.23 -13.0818.75 -11.59 -8.19 -14.0519.00 -12.08 -8.52 -14.30
14.3%k

Table C-6 – Restrained, sealed measurements for 25.3%k mixture
Days [με] [με] [με]
0.00 0.00 0.00 0.000.25 -3.89 -4.74 -3.080.50 -15.30 -15.19 -13.320.75 -7.54 -7.42 -5.761.00 -6.10 -5.50 -3.721.25 -4.92 -3.97 -2.911.50 -2.90 -2.31 -0.971.75 -2.62 -2.39 -1.002.00 -3.46 -2.39 -1.492.25 -1.65 -1.90 -0.362.50 -0.80 -1.18 0.612.75 -0.44 -0.94 1.093.00 -0.80 -0.70 0.613.25 -0.93 -0.94 1.253.50 -1.04 -0.82 0.933.75 -0.68 -1.42 0.614.00 -1.05 -0.82 0.614.25 -0.92 -1.30 1.264.50 -0.92 -1.30 1.264.75 -0.44 -1.18 1.425.00 -0.20 -0.46 2.065.25 -0.68 -0.94 1.415.50 -1.16 -1.06 1.425.75 -1.29 -1.54 0.936.00 -0.61 -0.86 1.946.25 -0.72 -0.62 1.786.50 -1.09 -1.22 1.466.75 -1.09 -1.22 1.137.00 -1.09 -0.74 1.617.25 -1.33 -1.35 1.457.50 -1.09 -1.10 1.627.75 -1.21 -0.98 1.628.00 -2.05 -1.82 0.818.25 -1.81 -2.07 1.298.50 -2.54 -2.67 0.498.75 -2.42 -2.67 0.979.00 -2.90 -3.15 0.16
25.3%k
Days [με] [με] [με]
9.25 -2.78 -2.91 0.819.50 -3.38 -2.79 0.00
9.75 -3.02 -3.39 -0.6510.00 -3.63 -3.27 -0.1610.25 -3.02 -2.91 0.4910.50 -2.54 -2.43 0.9710.75 -2.42 -2.43 0.6511.00 -3.02 -2.79 0.6511.25 -2.90 -2.79 0.8111.50 -2.54 -2.55 0.8111.75 -2.66 -2.07 1.4512.00 -2.30 -2.19 1.4512.25 -2.29 -2.67 1.2912.50 -2.17 -1.82 1.1312.75 -1.93 -2.19 1.2913.00 -2.66 -2.43 1.29
25.3%k

0 2 4 6 8 10 12 14 16 18 20Age of Specimen (d)
-70
-60
-50
-40
-30
-20
-10
0
10
Str
ain
(
)
Sealed25.3%k14.3%k11.0%k7.3%k3.8%k0.0%
Figure C-1 – All restrained, sealed shrinkage measurements
0 2 4 6 8 10 12 14 16 18 20Age of Specimen (d)
-70
-60
-50
-40
-30
-20
-10
0
10
Str
ain
(
)
Sealed0.0%
Figure C-2 – Restrained, sealed shrinkage for 0.0% mixture

0 2 4 6 8 10 12 14 16 18 20Age of Specimen (d)
-70
-60
-50
-40
-30
-20
-10
0
10
Str
ain
(
)
Sealed3.8%k
Figure C-3 – Restrained, sealed shrinkage for 3.8%k mixture
0 2 4 6 8 10 12 14 16 18 20Age of Specimen (d)
-70
-60
-50
-40
-30
-20
-10
0
10
Str
ain
(
)
Sealed7.3%k
Figure C-4 – Restrained, sealed shrinkage for 7.3%k mixture

0 2 4 6 8 10 12 14 16 18 20Age of Specimen (d)
-70
-60
-50
-40
-30
-20
-10
0
10
Str
ain
(
)
Sealed11.0%k
Figure C-5 – Restrained, sealed shrinkage for 11.0%k mixture
0 2 4 6 8 10 12 14 16 18 20Age of Specimen (d)
-70
-60
-50
-40
-30
-20
-10
0
10
Str
ain
(
)
Sealed14.3%k
Figure C-6 – Restrained, sealed shrinkage for 14.3%k mixture

0 2 4 6 8 10 12 14 16 18 20Age of Specimen (d)
-70
-60
-50
-40
-30
-20
-10
0
10
Str
ain
(
)
Sealed25.3%k
Figure C-7 – Restrained, sealed shrinkage for 25.3%k mixture

Table C-7 – Restrained, unsealed measurements for 0.0% mixture
Days [με] [με] [με] [με] [με] [με]
0.00 0.00 0.00 0.00 0.00 0.00 0.000.25 1.23 2.46 0.64 2.93 1.00 2.940.50 -7.33 -4.06 -4.55 -5.76 -4.55 0.170.75 -12.54 -9.79 -9.43 -17.04 -11.12 -6.541.00 -18.74 -16.26 -15.77 -25.32 -17.34 -13.631.25 -31.26 -28.59 -28.57 -37.76 -30.87 -27.681.50 -40.03 -37.53 -37.14 -46.93 -40.29 -37.481.75 -46.90 -44.29 0.40 -54.66 -47.29 -45.352.00 -51.95 -50.80 3.42 5.24 -50.91 8.522.25 -56.88 6.09 5.96 5.48 6.57 8.762.50 5.94 6.33 6.20 5.48 6.57 9.122.75 5.94 6.33 6.20 5.48 6.57 9.123.00 5.94 6.33 6.20 5.48 6.57 9.12
0.0%
Table C-8 – Restrained, unsealed measurements for 7.3%k mixture
Days [με] [με] [με]
0.00 0.00 0.00 0.000.25 1.06 0.64 0.940.50 -8.36 -7.42 -6.650.75 -5.45 -6.25 -4.131.00 -11.90 -14.05 -10.121.25 -22.69 -24.55 -23.231.50 -30.74 -32.05 -33.121.75 -36.51 -37.82 -41.312.00 -41.68 3.64 4.752.25 5.10 3.33 5.842.50 5.10 3.33 5.842.75 5.10 3.33 5.843.00 5.10 3.33 5.84
7.3%k

Table C-9 – Restrained, unsealed measurements for 11.0%k mixture
Days [με] [με] [με]
0.00 0.00 0.00 0.000.25 -0.85 -4.09 -5.140.50 -2.14 -6.46 -7.750.75 0.11 -4.21 -4.861.00 -4.13 -8.95 -6.881.25 -13.79 -15.36 -17.021.50 -21.38 -23.56 -26.451.75 -26.67 -28.14 -32.092.00 -31.01 -30.07 -36.602.25 4.98 -30.79 -37.732.50 5.22 -28.63 -33.222.75 4.98 6.84 2.383.00 5.58 6.11 2.38
11.0%k
Table C-10 – Restrained, unsealed measurements for 14.3%k mixture
Days [με] [με] [με]
0.00 0.00 0.00 0.000.25 1.99 1.87 1.310.50 -5.52 -6.84 -6.510.75 0.05 -0.31 -3.241.00 0.82 2.40 -1.151.25 -6.84 -4.77 -9.541.50 -12.51 -11.16 -17.121.75 -17.34 -16.23 -22.912.00 -20.59 -21.66 -27.272.25 -23.49 -26.00 -29.522.50 -24.57 -28.78 -30.812.75 -26.38 -29.27 -3.733.00 7.65 -0.21 -5.83
14.3%k

Table C-11 – Restrained, unsealed measurements for 25.3%k mixture
Days [με] [με] [με]
0.00 0.00 0.00 0.000.25 -0.29 -0.02 -1.720.50 -3.65 -4.21 -7.130.75 0.57 -0.01 -2.681.00 2.65 1.82 1.091.25 -1.20 -3.14 -0.971.50 -5.41 -7.85 -6.521.75 -9.02 -11.60 -10.262.00 -11.67 -15.22 -13.762.25 -14.67 -17.15 -16.292.50 -16.72 -19.09 -17.982.75 -21.17 -23.31 -26.073.00 -23.82 -25.24 -29.453.25 -21.29 -22.24 -23.173.50 -22.25 -21.87 -22.093.75 -24.06 -22.72 -22.934.00 -26.10 -24.53 -26.194.25 -26.94 -23.21 -23.064.50 -27.79 -23.33 -21.624.75 -27.91 -22.85 -19.325.00 -28.75 -23.94 5.675.25 -29.95 -25.39 5.195.50 -31.27 -25.16 5.555.75 -32.96 -25.28 5.196.00 -34.76 -25.52 4.836.25 -34.52 -25.28 4.596.50 -37.05 -25.04 4.716.75 -35.37 -23.47 4.597.00 -37.30 -24.44 1.937.25 4.33 -22.39 4.597.50 4.57 7.73 5.19
25.3%k

Table C-12 – Restrained, unsealed measurements for 29.3%k mixture
Days [με] [με] [με]
0.00 0.00 0.00 0.000.25 -2.24 -1.15 -1.870.50 -5.26 -7.41 -6.440.75 -2.04 -3.60 -4.571.00 -0.23 -1.30 -1.551.25 -0.20 -0.55 0.291.50 -0.20 -0.43 -0.321.75 -1.53 -1.53 -1.532.00 -3.46 -2.37 -0.682.25 -4.67 -3.21 -1.412.50 -4.55 -3.34 -0.322.75 -6.96 -4.79 -2.023.00 -9.02 -5.75 -3.593.25 -7.81 -5.15 -2.023.50 -8.90 -5.51 -2.023.75 -12.04 -7.43 -4.684.00 -11.68 -7.19 -4.314.25 -10.83 -6.47 -3.474.50 -11.67 -7.32 -4.074.75 -13.24 -8.04 -5.525.00 -15.06 -9.13 -6.375.25 -14.09 -8.89 -5.765.50 -16.26 -9.85 -7.825.75 -17.71 -11.30 -8.916.00 -18.80 -11.90 -10.126.25 -18.56 -11.90 -10.606.50 -20.00 -12.63 -11.336.75 -19.40 -13.23 -11.577.00 -20.97 -14.43 -12.307.25 -22.05 -14.80 -13.997.50 -20.85 -14.19 -13.507.75 -20.72 -14.19 -13.998.00 -21.33 -14.32 -14.238.25 -21.32 -14.56 -14.958.50 -22.17 -14.56 -15.078.75 -21.69 -14.43 -15.569.00 -22.17 -15.16 -15.92
29.3%k
Days [με] [με] [με]
9.25 -21.93 -14.92 -15.929.50 -22.89 -16.73 -17.37
9.75 -23.25 -17.70 -18.1010.00 -23.61 -18.06 -18.9410.25 -22.16 -16.85 -17.8510.50 -22.41 -17.94 -19.0610.75 -24.09 -19.14 -20.6411.00 1.50 -19.14 -21.3611.25 -0.92 -18.18 -19.9111.50 1.14 -18.30 -20.0311.75 0.89 -18.90 -21.4812.00 -0.07 -19.02 -21.4812.25 1.62 -18.66 -21.6012.50 2.35 -18.54 -21.7212.75 1.50 -19.27 -22.6913.00 0.53 -19.15 -22.3213.25 1.86 -17.47 -22.0813.50 2.47 -17.35 -21.9613.75 1.98 -18.20 -21.6014.00 0.77 -19.40 0.7714.25 2.59 -18.08 1.1414.50 3.19 -18.44 0.6614.75 2.23 -18.44 1.2615.00 2.83 -18.56 1.14
29.3%k

Table C-13 – Restrained, unsealed measurements for 33.0%k mixture
Days [με] [με] [με]
0.00 0.00 0.00 0.000.25 -7.18 -2.61 -2.760.50 -14.91 -9.12 -6.550.75 -9.63 -6.50 -2.891.00 -6.97 -2.40 0.731.25 -8.13 -2.13 2.051.50 -8.86 -0.92 1.731.75 -10.31 -0.92 1.572.00 -10.55 -0.92 1.252.25 -10.55 -0.68 0.922.50 -9.58 -0.20 1.572.75 -11.99 -0.44 0.443.00 -12.71 -1.17 0.283.25 -10.55 0.52 2.053.50 -10.07 0.52 1.893.75 -12.23 -0.20 0.604.00 -11.75 0.52 1.094.25 -11.27 1.24 2.374.50 -12.23 1.00 2.214.75 -13.43 0.28 2.215.00 -14.63 -0.20 1.085.25 -12.95 1.24 2.855.50 -14.63 0.28 1.895.75 -15.60 -0.20 1.256.00 -16.08 -0.20 0.766.25 -16.32 1.00 1.406.50 -17.52 0.76 0.446.75 -18.48 1.24 0.767.00 -19.44 1.00 0.287.25 -19.44 0.04 -0.377.50 -19.44 1.24 0.287.75 -19.20 1.73 0.608.00 -19.44 1.48 0.608.25 -19.92 1.97 0.768.50 -20.40 1.97 0.608.75 -20.40 2.21 0.769.00 -21.12 2.21 0.43
33.0%k
Days [με] [με] [με]
9.25 -19.44 2.20 0.759.50 -20.88 2.20 -0.21
9.75 -21.36 1.24 -0.7010.00 -21.84 1.24 -1.0210.25 -20.64 2.44 -0.2110.50 -21.84 1.24 -1.0210.75 -23.29 1.72 -2.1411.00 -23.53 1.24 -2.3111.25 -22.32 3.17 -1.3411.50 -23.53 2.69 -1.8211.75 -23.05 2.69 -2.1412.00 -24.01 2.20 -3.1112.25 -23.05 2.93 -1.8212.50 -24.01 2.20 -2.9512.75 -24.25 2.45 -3.1113.00 -24.25 2.44 -2.9513.25 -23.29 2.68 -2.1513.50 -24.49 3.17 -2.3113.75 -25.21 2.45 -2.7914.00 -26.41 2.69 -4.5614.25 -24.97 3.41 -2.9514.50 -25.93 3.65 -3.2714.75 -26.41 3.17 -3.1115.00 -28.10 2.69 -4.5615.25 -25.45 2.69 -4.4015.50 -26.65 3.65 -4.4015.75 -26.17 3.17 -4.8916.00 -25.93 2.93 -5.0516.25 -24.97 5.10 -4.2416.50 -24.73 5.82 -3.9216.75 -25.21 4.86 -4.0817.00 -25.45 4.86 -4.5617.25 -24.49 5.82 -3.9217.50 -24.73 5.10 -4.8817.75 -25.69 5.10 -5.6918.00 -25.45 5.34 -5.21
33.0%k

0 2 4 6 8 10 12 14Age of Specimen (d)
-60
-50
-40
-30
-20
-10
0
10
Str
ain
(
)
Unsealed33.0%k29.3%k25.3%k14.3%k11.0%k7.3%k0.0%
Figure C-8 – All restrained, unsealed shrinkage measurements
0 2 4 6 8 10 12 14Age of Specimen (d)
-60
-50
-40
-30
-20
-10
0
10
Str
ain
(
)
Unsealed0.0%
Figure C-9 – Restrained, unsealed shrinkage for 0.0% mixture

0 2 4 6 8 10 12 14Age of Specimen (d)
-60
-50
-40
-30
-20
-10
0
10
Str
ain
(
)
Unsealed7.3%k
Figure C-10 – Restrained, unsealed shrinkage for 7.3%k mixture
0 2 4 6 8 10 12 14Age of Specimen (d)
-60
-50
-40
-30
-20
-10
0
10
Str
ain
(
)
Unsealed11.0%k
Figure C-11 – Restrained, unsealed shrinkage for 11.0%k mixture

0 2 4 6 8 10 12 14Age of Specimen (d)
-60
-50
-40
-30
-20
-10
0
10
Str
ain
(
)
Unsealed14.3%k
Figure C-12 – Restrained, unsealed shrinkage for 14.3%k mixture
0 2 4 6 8 10 12 14Age of Specimen (d)
-60
-50
-40
-30
-20
-10
0
10
Str
ain
(
)
Unsealed25.3%k
Figure C-13 – Restrained, unsealed shrinkage for 25.3%k mixture

0 2 4 6 8 10 12 14Age of Specimen (d)
-60
-50
-40
-30
-20
-10
0
10
Str
ain
(
)
Unsealed29.3%k
Figure C-14 – Restrained, unsealed shrinkage for 29.3%k mixture
0 2 4 6 8 10 12 14Age of Specimen (d)
-60
-50
-40
-30
-20
-10
0
10
Str
ain
(
)
Unsealed33.0%k
Figure C-15 – Restrained, unsealed shrinkage for 33.0%k mixture

Appendix D. MECHANICAL PROPERTIES DATA
Table D-1 – Mixture M-0 Mechanical Properties
Mpa psi Mpa psi GPa ksi1 51.9 7522 4.08 591 27 39723 N/A N/A 4.80 696 26 37607 66.3 9611 4.46 647 29 423328 74.8 10844 4.22 612 31 449090 77.8 11290 5.36 778 32 4586
Tensile StrengthCompressive Strength Age (d)
ModulusM-0
Table D-2 – Mixture M-11 Mechanical Properties
Mpa psi Mpa psi GPa ksi1 41.9 6079 4.26 617 23 33853 52.6 7632 4.32 626 24 34557 59.7 8662 4.04 586 28 407528 70.6 10247 4.13 598 30 433290 76.4 11081 5.38 781 31 4506
ModulusM-11
Age (d)Compressive Strength Tensile Strength
Table D-3 – Mixture M-24 Mechanical Properties
Mpa psi Mpa psi GPa ksi1 48.9 7091 4.39 637 22 31873 54.0 7834 4.86 705 24 34997 65.1 9442 3.43 498 22 315328 73.6 10678 4.70 682 27 390890 71.6 10389 4.57 663 29 4221
Tensile Strength ModulusM-24
Age (d)Compressive Strength

Appendix E. DUAL RING DATA
Table E-1 – Mixture M-0 7-Day Mechanical Properties
Mpa psi Mpa psi GPa ksi1.01 45.52 6603 4.05 588 27.14 39372.91 56.37 8177 5.41 785 28.84 41835.18 57.75 8377 5.52 801 29.24 42417.03 61.35 8899 6.57 953 30.14 4372
ModulusM-0
Age (d)Compressive Tensile
Table E-2 – Mixture M-11 7-Day Mechanical Properties
Mpa psi Mpa psi GPa ksi1.01 48.92 7096 3.71 539 25.53 37042.91 57.50 8340 5.15 748 26.29 38135.18 59.95 8696 4.89 709 27.41 39757.03 60.76 8813 6.18 897 27.82 4035
M-11
Age (d)Compressive Tensile Modulus
Table E-3 – Mixture M-24 7-Day Mechanical Properties
Mpa psi Mpa psi GPa ksi1.01 45.31 6572 3.06 443 22.56 32732.91 52.76 7654 4.33 629 23.89 34655.18 56.88 8250 4.05 587 24.77 35927.03 58.11 8429 5.36 778 25.61 3714
Age (d)Compressive Tensile Modulus
M-24

Table E-4 – Mixture M-0 Dual Ring Data
Age (hr)
ΔT (°C)
Cracking Stress (Mpa)
Isothermal Stress (Mpa)
Reserve Stress (Mpa)
Factor Of
Safety33.5 20.1 4.6 2.5 2.1 0.4639.7 15.0 5.3 2.7 2.6 0.4943.4 11.9 5.3 2.9 2.4 0.4549.4 12.6 5.4 3.1 2.3 0.4372.6 10.6 6.3 3.6 2.7 0.43119.0 0.0 0.0 0.0 0.0 0.00
M-0
Table E-5 – Mixture M-11 Dual Ring Data
Age (hr)
ΔT (°C)
Cracking Stress (Mpa)
Isothermal Stress (Mpa)
Reserve Stress (Mpa)
Factor Of
Safety40.2 20.1 4.0 1.9 2.1 0.5350.5 19.0 5.5 2.1 3.4 0.6271.0 19.0 5.3 2.5 2.8 0.5390.8 14.0 5.7 2.8 2.9 0.51110.0 8.0 5.0 3.2 1.8 0.36124.0 1.0 3.8 3.5 0.3 0.08
M-11
Table E-6 – Mixture M-24 Dual Ring Data
Age (hr)
ΔT (°C)
Cracking Stress (Mpa)
Isothermal Stress (Mpa)
Reserve Stress (Mpa)
Factor Of
Safety96.0 30.0 0.0 0.0 0.0 0.00126.0 25.0 3.7 1.0 2.7 0.73197.0 8.0 2.7 1.7 1.0 0.37
M-24

Appendix F. FREEZE THAW DATA
Table F-1 – Mixture M-0 Freeze Thaw Data
Age (d) Cyles Pc
% Mass
Change34 0 100.00 0.00
37 6 101.13 0.36
45 22 102.59 0.43
51 34 104.05 0.56
62 56 104.77 0.60
72 76 105.32 0.59
79 90 105.74 0.62
86 104 106.39 0.65
99 130 106.17 0.68
109 150 106.49 0.71
125 182 107.36 0.74
128 188 107.32 0.74
132 196 108.03 0.75
135 202 107.51 0.73
139 210 107.76 0.75
142 216 108.59 0.76
149 230 108.34 0.78
156 244 108.05 0.77
160 252 108.66 0.78
167 266 108.69 0.79
174 280 108.69 0.81
181 294 109.55 0.81
208 348 109.25 0.79
225 382 110.27 0.85
237 406 108.76 0.78
274 480 111.46 0.83
M-0

Table F-2 – Mixture M-11 Sealed Cure Freeze Thaw Data
Age (d) Cycles Pc
% Mass
Change31 0 0.00 0.00
33 4 100.00 0.10
44 26 100.82 0.15
54 46 101.19 0.16
61 60 101.31 0.18
68 74 101.85 0.19
81 100 101.78 0.24
91 120 102.04 0.26
107 152 102.67 0.28
110 158 102.77 0.30
114 166 103.19 0.32
117 172 102.84 0.30
121 180 103.22 0.33
124 186 103.86 0.31
131 200 103.29 0.33
138 214 103.41 0.35
142 222 103.72 0.35
149 236 103.76 0.37
156 250 103.95 0.37
163 264 104.41 0.39
190 318 104.14 0.40
207 352 104.95 0.43
219 376 103.93 0.40
256 450 105.86 0.46
M-11 Sealed Cure

Table F-3 – Mixture M-24 Sealed Cure Freeze Thaw Data
Age (d) Cycles Pc
% Mass
Change31 0 0.00 0.00
33 4 100.00 0.08
44 26 100.71 0.12
54 46 101.05 0.11
62 62 101.05 0.13
68 74 101.43 0.15
81 100 101.02 0.17
91 120 101.02 0.19
107 152 101.64 0.23
110 158 101.76 0.24
114 166 102.03 0.25
117 172 101.64 0.24
121 180 102.12 0.26
124 186 102.70 0.25
131 200 102.41 0.28
138 214 102.38 0.27
142 222 102.53 0.28
149 236 102.48 0.29
156 250 102.89 0.31
163 264 103.11 0.31
190 318 103.06 0.33
207 352 103.59 0.35
219 376 102.48 0.31
256 450 104.58 0.39
M-24 Sealed Cure

Appendix G. LARGE SCALE UNRESTRAINED SHRINKAGE MEASUREMENTS
Table G-1 – Large Scale Restraining Slab 1 Unrestrained Shrinkage
Time (d) Strain (με)0.00 0.007.08 -51.5812.13 -116.5822.19 -171.5829.97 -161.5840.92 -196.58
Restraining Slab 1
Table G-2 – Large Scale Restraining Slab 4 Unrestrained Shrinkage
Time (d) Strain (με)0.00 0.005.08 -10.6710.13 -37.3420.19 -54.0127.97 -54.0138.92 -84.01
Restraining Slab 4
Table G-3 – Large Scale Mixture C-0 Unrestrained Shrinkage
Time (d) Strain (με)0.51 0.001.01 -40.002.20 -80.002.98 -120.004.00 -180.006.13 -240.006.92 -280.008.13 -280.009.92 -320.0011.14 -340.0012.91 -360.00
C-0

Table G-4 – Large Scale Mixture C-21 Unrestrained Shrinkage
Time (d) Strain (με)1.01 0.002.20 53.332.94 70.005.06 16.675.85 -50.007.06 -83.338.85 -146.6710.07 -153.3312.00 -173.3312.86 -203.3323.79 -330.00
C-21