Development of baseline (air quality) data in Pakistan
16
Environ Monit Assess (2007) 127:237–252 DOI 10.1007/s10661-006-9276-8 ORIGINAL ARTICLE Development of baseline (air quality) data in Pakistan Badar Ghauri · Arifa Lodhi · M. Mansha Received: 20 October 2004 / Accepted: 8 May 2006 / Published online: 21 October 2006 C Springer Science + Business Media B.V. 2006 Abstract During 2003–2004, SUPARCO, the Pak- istan Space and Upper Atmosphere Research Comm- ission has conducted a year long baseline air quality study in country’s major urban areas (Karachi, Lahore, Quetta, Rawalpindi, Islamabad and Peshawar). The objective of this study was to establish baseline levels and behavior of airborne pollutants in urban centers with temporal and spatial parameters. This study reveals that the highest concentrations of CO were observed at Quetta (14 ppm) while other pollutants like SO 2 (52.5 ppb), NO x (60.75 ppb) and O 3 (50 ppb) were higher at Lahore compared to other urban centers like Karachi, Peshawar etc. The maximum particulate (TSP) and PM10 levels were observed at Lahore (996 ug/m 3 and 368 ug/m 3 respectively), Quetta (778 ug/m 3 , 298 ug/m 3 ) and in Karachi (410 ug/m 3 , 302 ug/m 3 ). In all major cities the highest levels were recorded at major intersections and variations were directly correlated with traffic density. These pollutants showed highest levels in summer and spring while lowest were observed in winter and monsoon. A data bank has been generated for future planning and air pollution impact studies. B. Ghauri () · A. Lodhi · M. Mansha Pakistan Space & Upper Atmosphere Research Commission (SUPARCO) P.O. Box 8402, Karachi-75270, Pakistan e-mail: [email protected] Keywords Air quality . Mega cities . Particulates . Clean air Introduction Pakistan Space & Upper Atmosphere Research Com- mission (SUPARCO) has kept a very close watch on some atmospheric pollutants and trace metals for last many years. In its earlier study a chemical mass balance and multivariate analysis technique had been applied to delineate pollution sources in major cities of Pakistan. It was also reported that daily concentrations of partic- ulate matter in Karachi city were found exceeding the ambient air quality standard during most of time of the year except in monsoons. A non-automotive source of Pb aerosols was also identified (Parekh et al., 1987). Later (Ghauri et al., 1994) demonstrated that most of the air pollution in major cities came from the com- bustion of fossil fuels in vehicles, power plants, ce- ment and textiles mills, etc. Exposure to elevated pol- lutants concentrations or long continued exposure to low levels of ambient air pollutants has received in- creasing attention due to wide range of adverse effects of air pollutants on ecological system and human health (Dockery and Pope, 1994; Koenig, 2000; Pope et al., 2002). SUPARCO has undertaken air quality study dur- ing 2003–2004 in response to the initiative taken by FERTS (Fuel Efficiency in Road Transport Sector) of ENERCON/UNDP. This has generated the most Springer
Transcript of Development of baseline (air quality) data in Pakistan
Environ Monit Assess (2007) 127:237–252
DOI 10.1007/s10661-006-9276-8
O R I G I N A L A R T I C L E
Development of baseline (air quality) data in PakistanBadar Ghauri · Arifa Lodhi · M. Mansha
Received: 20 October 2004 / Accepted: 8 May 2006 / Published online: 21 October 2006C© Springer Science + Business Media B.V. 2006
Abstract During 2003–2004, SUPARCO, the Pak-
istan Space and Upper Atmosphere Research Comm-
ission has conducted a year long baseline air quality
study in country’s major urban areas (Karachi, Lahore,
Quetta, Rawalpindi, Islamabad and Peshawar). The
objective of this study was to establish baseline
levels and behavior of airborne pollutants in urban
centers with temporal and spatial parameters. This
study reveals that the highest concentrations of
CO were observed at Quetta (14 ppm) while other
pollutants like SO2 (52.5 ppb), NOx (60.75 ppb) and
O3 (50 ppb) were higher at Lahore compared to
other urban centers like Karachi, Peshawar etc.
The maximum particulate (TSP) and PM10 levels
were observed at Lahore (996 ug/m3 and 368 ug/m3
respectively), Quetta (778 ug/m3, 298 ug/m3) and in
Karachi (410 ug/m3, 302 ug/m3). In all major cities the
highest levels were recorded at major intersections and
variations were directly correlated with traffic density.
These pollutants showed highest levels in summer
and spring while lowest were observed in winter and
monsoon. A data bank has been generated for future
planning and air pollution impact studies.
B. Ghauri (�) · A. Lodhi · M. ManshaPakistan Space & Upper Atmosphere ResearchCommission (SUPARCO) P.O. Box 8402, Karachi-75270,Pakistane-mail: [email protected]
Keywords Air quality . Mega cities . Particulates .
Clean air
Introduction
Pakistan Space & Upper Atmosphere Research Com-
mission (SUPARCO) has kept a very close watch on
some atmospheric pollutants and trace metals for last
many years. In its earlier study a chemical mass balance
and multivariate analysis technique had been applied to
delineate pollution sources in major cities of Pakistan.
It was also reported that daily concentrations of partic-
ulate matter in Karachi city were found exceeding the
ambient air quality standard during most of time of the
year except in monsoons. A non-automotive source of
Pb aerosols was also identified (Parekh et al., 1987).
Later (Ghauri et al., 1994) demonstrated that most of
the air pollution in major cities came from the com-
bustion of fossil fuels in vehicles, power plants, ce-
ment and textiles mills, etc. Exposure to elevated pol-
lutants concentrations or long continued exposure to
low levels of ambient air pollutants has received in-
creasing attention due to wide range of adverse effects
of air pollutants on ecological system and human health
(Dockery and Pope, 1994; Koenig, 2000; Pope et al.,2002).
SUPARCO has undertaken air quality study dur-
ing 2003–2004 in response to the initiative taken by
FERTS (Fuel Efficiency in Road Transport Sector) of
ENERCON/UNDP. This has generated the most
Springer
238 Environ Monit Assess (2007) 127:237–252
needed information on environmental conditions of
major cities of the country. One of the important ob-
jectives of the study was to establish the baseline (air
quality) data in Pakistan with temporal and spatial pa-
rameters, to identify pollution sources and to determine
their relative contribution towards prevailing ambient
air quality of urban areas. The measurements of the fol-
lowing pollutants were carried out: SO2, CO, CO2, O3,
NOx, Hydrocarbons (Methane and Non-Methane), Par-
ticulates (TSP & PM10) and noise as well as meteoro-
logical parameters. TSP (total suspended particulates)
are aerosol particles (sometimes even above 100 μm
sizes) suspended in the air. PM10 means particulate
mass of particles smaller than 10 μm in diameter. The
study was carried out in six major cities of Pakistan i.e.
Karachi, Lahore, Peshawar, Quetta, Rawalpindi and Is-
lamabad and continued during the whole year. The state
of air quality in urban areas of the country and various
factors are being presented in the paper which are dete-
riorating air quality. A brief description for these cities
is given below:
Karachi (Lat: 24◦48′N, Long: 66◦59′E) with a
population of over 10 millions, is the biggest industrial
and commercial center in Pakistan. It offers immense
employment and business opportunities. It borders on
the Arabian Sea, and is not under the influence of any
other immediate industrial center. Therefore, we expect
the pollutants present are entirely derived from local
sources. With a population of more than seven million,
Lahore (Lat: 31◦35′N, Long: 74◦20′E) is country’s
second largest city after Karachi. It occupies a choice
site in the midst of fertile alluvial plains. It is country’s
second commercial and banking center. Although little
industry is located in the city itself, Lahore serves
as a distribution center for the heavily industrialized
surrounding area. The city of Quetta (Lat: 30◦12′N,
Long: 67◦E) is located in the mountainous region and
lies at the mouth of the Bolan Pass. Here population
is about 0.7 million. The district lies outside the range
of the monsoon currents and the rainfall is scanty and
irregular. Rawalpindi (Lat: 33◦36′N, Long: 73◦04′E) is
an industrial and military center with a petroleum refin-
ery, engineering workshops, steel-rolling mills, etc. Its
population is over 1.4 million. Lying at altitudes rang-
ing from 457 to 610 meters, Islamabad (Lat: 33◦42′N,
Long: 73◦10′E) the capital city is an expanse of natural
terraces drained by the Kurang River with the Margalla
Hills in the north east. Population is 524,500 (National
Census, 1998). Peshawar (Lat: 34◦1′N, Long: 71◦35′E)
is situated near the entrance to the Khyber Pass. Local
industries produce handicrafts and processed food.
Population is 988,055 (National Census, 1998).
Methodology
Measurements of major pollutants were carried out us-
ing two Mobile Pollution Monitoring Labs. The fixed-
point observations do not explain the whole situation
because pollutants concentration may be dominated by
local sources, making the results to some degree un-
representative of the area as a whole. Air pollution
in general, is much too complex and diverse because
of the wide variability in the type, intensity, density
and spatial distribution of emission sources. Interval of
measurement was taken as 15 minutes and monitoring
was carried out continuously for 48 h at a site and was
repeated over the year for all the four seasons. One-
hour mean were calculated from 15 min data. The peak
value in hourly mean was quoted as maximum value.
Any single extraordinary high peak was omitted (e.g.
at some places a single CO peak was omitted and then
2nd highest value was quoted as maximum level). First
time measurements at a site were marked as cycle 1,
repeated measurements at the same site were marked as
cycle 2, cycle 3 & cycle 4. There were total 33 sites in
six cities and each site was monitored four times. Fig-
ure 1 shows the location of six cities on country map.
Measurement techniques
Suspended particulate matter was collected on 20 ×25 cm Whatman 41 filters using high-volume sam-
plers. Air samples were collected for 24 h starting from
0800 h at a flow rate of 1.13 m3/min. The flow was
held at a constant volume by a mass flow controller
and was corrected for local temperature and barometric
pressure. A Sierra Andersen PM10 size-selective stage
(Model 321-A) was used to eliminate coarse particles
(>10 um). Weight of the filter paper was taken before
and after the loading at constant humidity (maintained
by keeping the filter paper in a desiccator for at least
24 h).
In accordance with 40 CFR part 53 of USEPA
air quality assessment in term of NOx , O3, CO &
SO2 was carried out using the Mobile lab, which
had on-board all analyzers. Ambient NOx Monitor
Springer
Environ Monit Assess (2007) 127:237–252 239
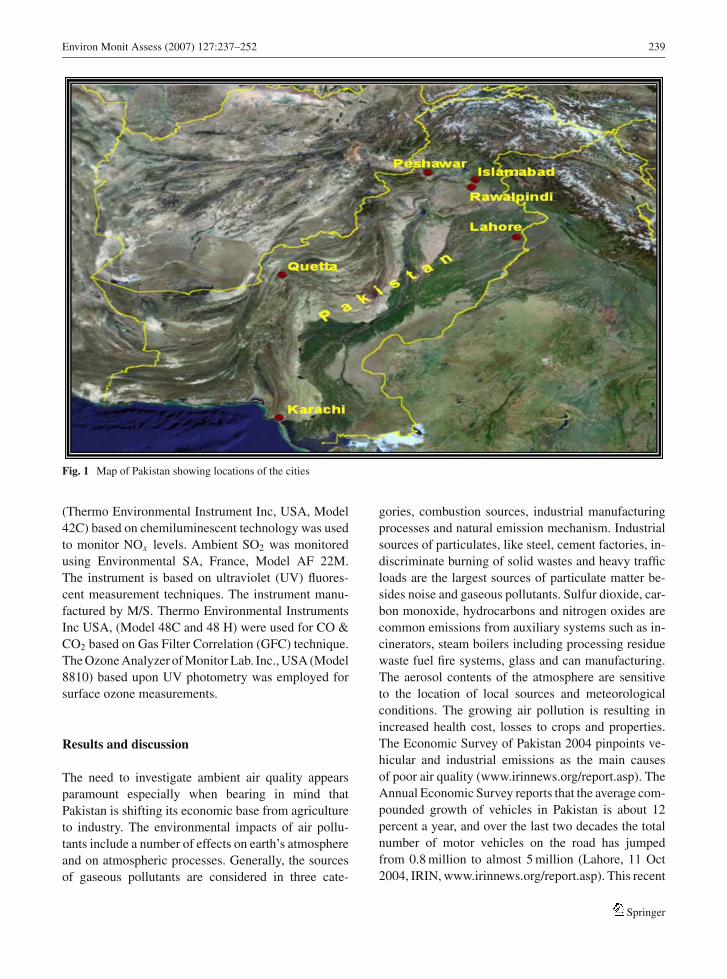
Fig. 1 Map of Pakistan showing locations of the cities
(Thermo Environmental Instrument Inc, USA, Model
42C) based on chemiluminescent technology was used
to monitor NOx levels. Ambient SO2 was monitored
using Environmental SA, France, Model AF 22M.
The instrument is based on ultraviolet (UV) fluores-
cent measurement techniques. The instrument manu-
factured by M/S. Thermo Environmental Instruments
Inc USA, (Model 48C and 48 H) were used for CO &
CO2 based on Gas Filter Correlation (GFC) technique.
The Ozone Analyzer of Monitor Lab. Inc., USA (Model
8810) based upon UV photometry was employed for
surface ozone measurements.
Results and discussion
The need to investigate ambient air quality appears
paramount especially when bearing in mind that
Pakistan is shifting its economic base from agriculture
to industry. The environmental impacts of air pollu-
tants include a number of effects on earth’s atmosphere
and on atmospheric processes. Generally, the sources
of gaseous pollutants are considered in three cate-
gories, combustion sources, industrial manufacturing
processes and natural emission mechanism. Industrial
sources of particulates, like steel, cement factories, in-
discriminate burning of solid wastes and heavy traffic
loads are the largest sources of particulate matter be-
sides noise and gaseous pollutants. Sulfur dioxide, car-
bon monoxide, hydrocarbons and nitrogen oxides are
common emissions from auxiliary systems such as in-
cinerators, steam boilers including processing residue
waste fuel fire systems, glass and can manufacturing.
The aerosol contents of the atmosphere are sensitive
to the location of local sources and meteorological
conditions. The growing air pollution is resulting in
increased health cost, losses to crops and properties.
The Economic Survey of Pakistan 2004 pinpoints ve-
hicular and industrial emissions as the main causes
of poor air quality (www.irinnews.org/report.asp). The
Annual Economic Survey reports that the average com-
pounded growth of vehicles in Pakistan is about 12
percent a year, and over the last two decades the total
number of motor vehicles on the road has jumped
from 0.8 million to almost 5 million (Lahore, 11 Oct
2004, IRIN, www.irinnews.org/report.asp). This recent
Springer
240 Environ Monit Assess (2007) 127:237–252
Table 1 Mean (48 h) & maximum (hourly) number of vehicles counted per day at monitoring sites (2003–2004)
Bick-up Loader Rickshaws
City Buses Jeeps Pick-ups Tractors Trucks M/Cycles (three wheelers) Cars
Karachi (10 sites) Mean 6512 2182 1928 18 1112 3400 1161 6330
Maximum 16052 4335 6032 217 4259 7588 2586 10593
Quetta (3 sites) Mean 3066 1222 1462 15 212 2228 1927 3376
Maximum 5091 1733 2412 313 637 2740 2001 5153
Lahore (7 sites) Mean 5256 1493 1559 30 515 3146 2213 4912
Maximum 14928 3926 3818 277 1645 5496 3744 7921
Rawalpindi (3 sites) Mean 4914 1276 1342 17 477 2865 1578 4268
Maximum 10829 2409 4399 140 1163 4431 1972 6700
Islamabad (3 sites) Mean 2764 1067 1054 13 220 1149 338 3008
Maximum 5091 1711 2412 39 733 2001 1019 4679
Peshawar (5 sites) Mean 3364 1226 920 42 327 1445 1035 3095
Maximum 6531 3391 3259 229 840 3450 3125 4940
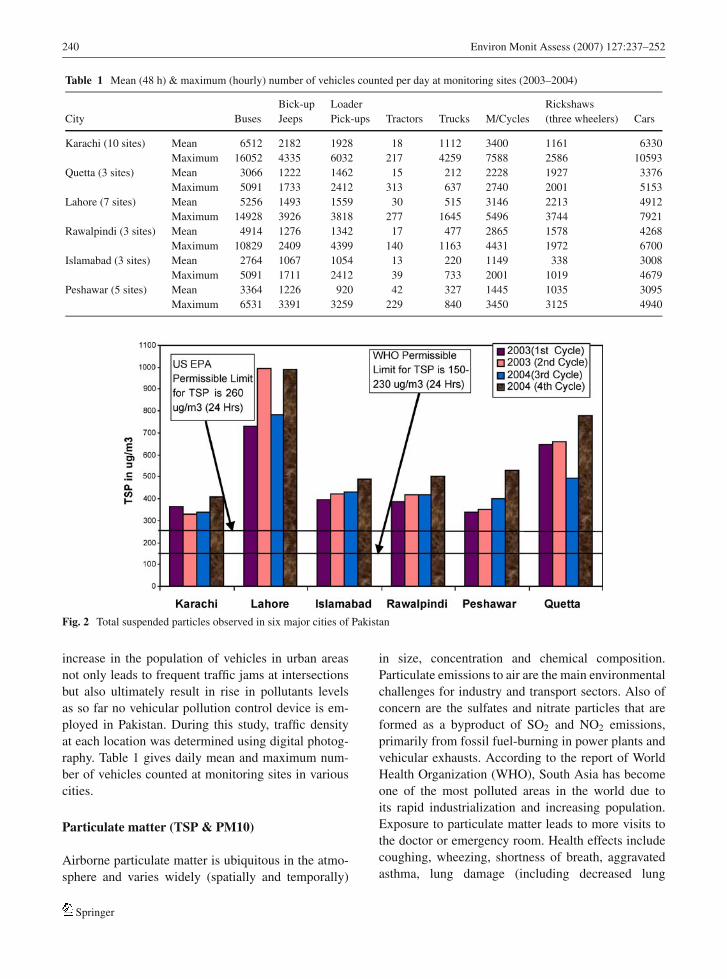
Fig. 2 Total suspended particles observed in six major cities of Pakistan
increase in the population of vehicles in urban areas
not only leads to frequent traffic jams at intersections
but also ultimately result in rise in pollutants levels
as so far no vehicular pollution control device is em-
ployed in Pakistan. During this study, traffic density
at each location was determined using digital photog-
raphy. Table 1 gives daily mean and maximum num-
ber of vehicles counted at monitoring sites in various
cities.
Particulate matter (TSP & PM10)
Airborne particulate matter is ubiquitous in the atmo-
sphere and varies widely (spatially and temporally)
in size, concentration and chemical composition.
Particulate emissions to air are the main environmental
challenges for industry and transport sectors. Also of
concern are the sulfates and nitrate particles that are
formed as a byproduct of SO2 and NO2 emissions,
primarily from fossil fuel-burning in power plants and
vehicular exhausts. According to the report of World
Health Organization (WHO), South Asia has become
one of the most polluted areas in the world due to
its rapid industrialization and increasing population.
Exposure to particulate matter leads to more visits to
the doctor or emergency room. Health effects include
coughing, wheezing, shortness of breath, aggravated
asthma, lung damage (including decreased lung
Springer
Environ Monit Assess (2007) 127:237–252 241
function and lifelong respiratory disease), and prema-
ture death in individuals with existing heart or lung
diseases. In major urban areas of Pakistan, peoples of
all ages suffer from throat infections especially when
season is cold and dry. In Pakistan, like the other low-
income countries the vehicular emissions have been
dominated by emissions from old and poorly main-
tained vehicles that contribute to enhanced ambient
concentrations of fine particulates & carbon monoxide.
It has been observed that levels of most of air pollutants
were higher in summer than in winter and monsoons,
which can easily be interpreted in terms of time depen-
dent changes primarily in meteorological conditions.
In urban areas the higher concentrations of PM10 are
indicative of higher traffic density, whereas higher TSP
values are indicative of size reduction process such as
iron, cement and ceramic industrial activities or natural
dust entrainment. The particulate levels as monitored in
different cities contain a significant amount of crustal
dust, which is a peculiar characteristics of local soil (es-
pecially in north & eastern Pakistan), lack of vegetation
and paved areas. It was observed that maximum TSP
load was recorded during summer season and minimum
in monsoon. Further daytime particulate load is higher
than nighttime one, indicating more urban activities
during day time. Lahore is facing alarming level of TSP
followed by Quetta, Peshawar, Rawalpindi, Islamabad,
and Karachi. The high TSP maximum (1 hr) TSP
levels in these cities are 2 to 4 times higher than the
standard limit of USEPA of 260 ug/m3 (Fig. 2). Even
the mean of 48 h exceeded the recommended limits
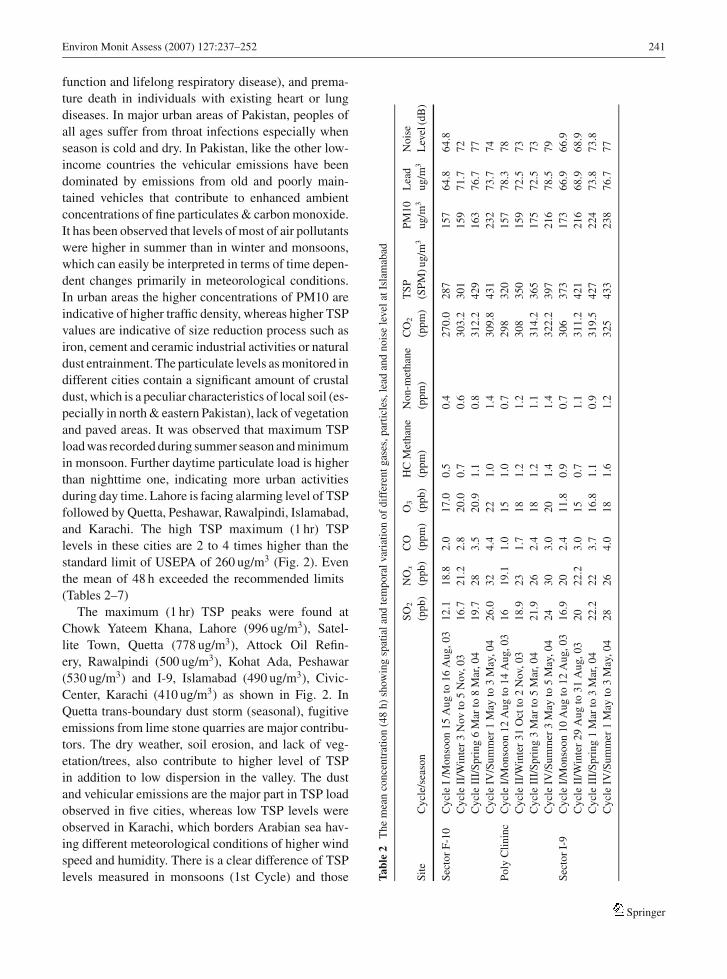
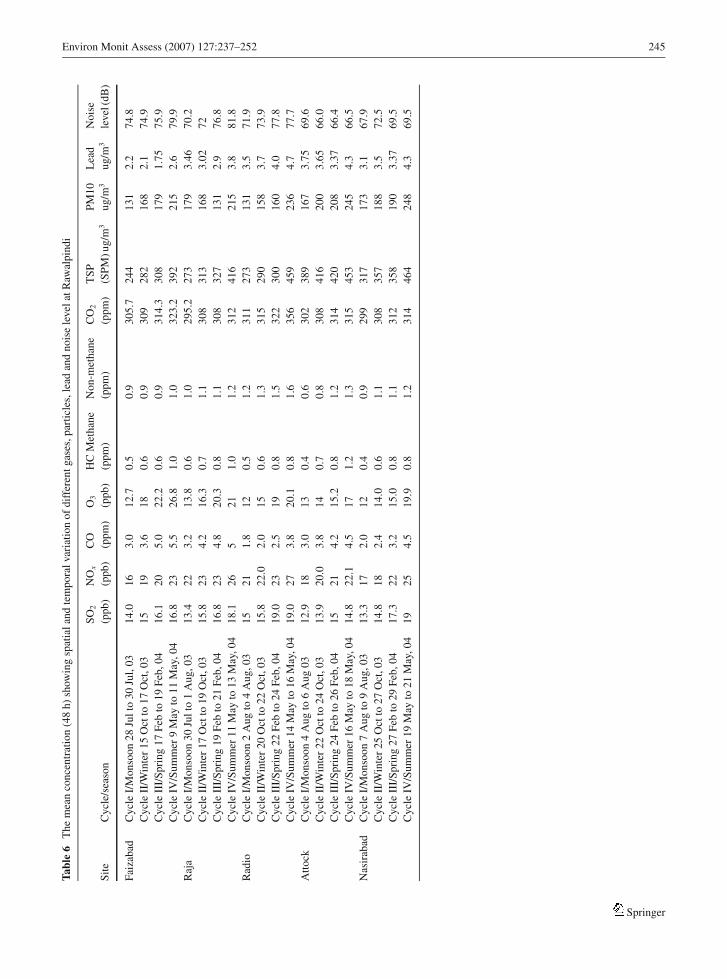
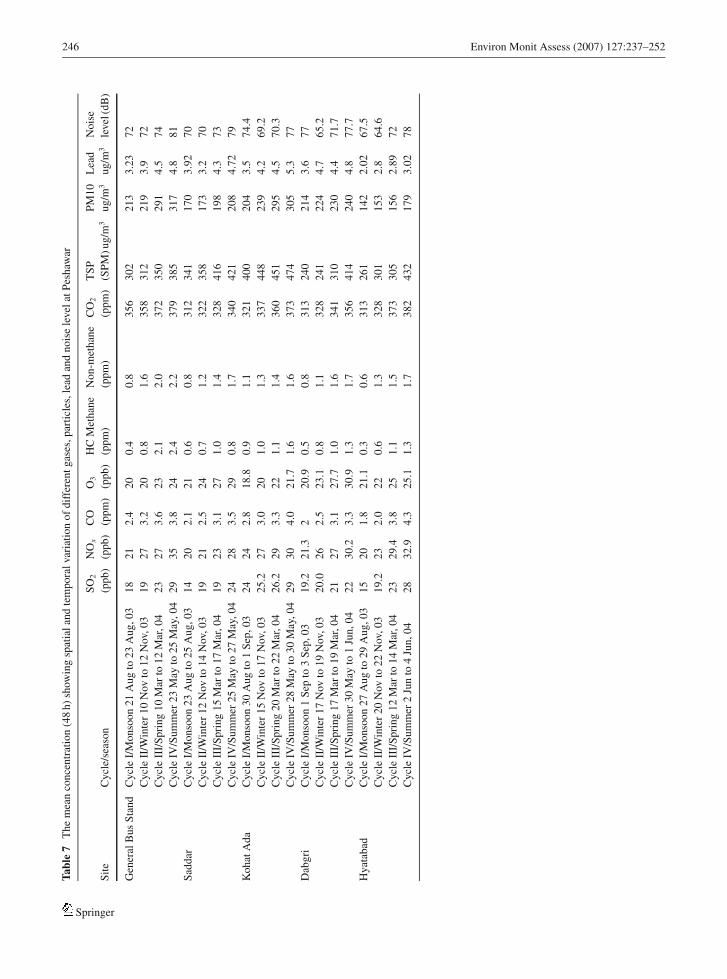
(Tables 2–7)
The maximum (1 hr) TSP peaks were found at
Chowk Yateem Khana, Lahore (996 ug/m3), Satel-
lite Town, Quetta (778 ug/m3), Attock Oil Refin-
ery, Rawalpindi (500 ug/m3), Kohat Ada, Peshawar
(530 ug/m3) and I-9, Islamabad (490 ug/m3), Civic-
Center, Karachi (410 ug/m3) as shown in Fig. 2. In
Quetta trans-boundary dust storm (seasonal), fugitive
emissions from lime stone quarries are major contribu-
tors. The dry weather, soil erosion, and lack of veg-
etation/trees, also contribute to higher level of TSP
in addition to low dispersion in the valley. The dust
and vehicular emissions are the major part in TSP load
observed in five cities, whereas low TSP levels were
observed in Karachi, which borders Arabian sea hav-
ing different meteorological conditions of higher wind
speed and humidity. There is a clear difference of TSP
levels measured in monsoons (1st Cycle) and those Tabl
e2
Th
em
ean
con
cen
trat
ion
(48
h)
show
ing
spat
ial
and
tem
po
ral
vari
atio
no
fd
iffe
ren
tgas
es,p
arti
cles
,le
adan
dn
ois
ele
vel
atIs
lam
abad
SO
2N
Ox
CO
O3
HC
Met
han
eN
on
-met
han
eC
O2
TS
PP
M1
0L
ead
No
ise
Sit
eC
ycl
e/se
aso
n(p
pb
)(p
pb
)(p
pm
)(p
pb
)(p
pm
)(p
pm
)(p
pm
)(S
PM
)u
g/m
3u
g/m
3u
g/m
3L
evel
(dB
)
Sec
tor
F-1
0C
ycl
eI
/Mo
nso
on
15
Au
gto
16
Au
g,0
31
2.1
18
.82
.01
7.0
0.5
0.4
27
0.0
28
71
57
64
.86
4.8
Cy
cle
II/W
inte
r3
Nov
to5
Nov,
03
16
.72
1.2
2.8
20
.00
.70
.63
03
.23
01
15
97
1.7
72
Cy
cle
III/
Sp
rin
g6
Mar
to8
Mar
,0
41
9.7
28
3.5
20
.91
.10
.83
12
.24
29
16
37
6.7
77
Cy
cle
IV/S
um
mer
1M
ayto
3M
ay,
04
26
.03
24
.42
21
.01
.43
09
.84
31
23
27
3.7
74
Po
lyC
lin
inc
Cy
cle
I/M
on
soo
n1
2A
ug
to1
4A
ug
,0
31
61
9.1
1.0
15
1.0
0.7
29
83
20
15
77
8.3
78
Cy
cle
II/W
inte
r3
1O
ctto
2N
ov,
03
18
.92
31
.71
81
.21
.23
08
35
01
59
72
.57
3
Cy
cle
III/
Sp
rin
g3
Mar
to5
Mar
,0
42
1.9
26
2.4
18
1.2
1.1
31
4.2
36
51
75
72
.57
3
Cy
cle
IV/S
um
mer
3M
ayto
5M
ay,
04
24
30
3.0
20
1.4
1.4
32
2.2
39
72
16
78
.57
9
Sec
tor
I-9
Cy
cle
I/M
on
soo
n1
0A
ug
to1
2A
ug
,0
31
6.9
20
2.4
11
.80
.90
.73
06
37
31
73
66
.96
6.9
Cy
cle
II/W
inte
r2
9A
ug
to3
1A
ug
,0
32
02
2.2
3.0
15
0.7
1.1
31
1.2
42
12
16
68
.96
8.9
Cy
cle
III/
Sp
rin
g1
Mar
to3
Mar
,0
42
2.2
22
3.7
16
.81
.10
.93
19
.54
27
22
47
3.8
73
.8
Cy
cle
IV/S
um
mer
1M
ayto
3M
ay,
04
28
26
4.0
18
1.6
1.2
32
54
33
23
87
6.7
77
Springer
242 Environ Monit Assess (2007) 127:237–252
Tabl
e3
Mea
nof
48
hours
show
ing
spat
ial
and
tem
pora
lva
riat
ions
of
dif
fere
nt
gas
es,par
ticl
es,le
adan
dnois
ele
vel
atQ
uet
ta
SO
2N
Ox
CO
O3
HC
Met
han
eN
on
-met
han
eC
O2
TS
PP
M1
0L
ead
No
ise
Sit
eC
ycl
e/se
aso
n(p
pb
)(p
pb
)(p
pm
)(p
pb
)(p
pm
)(p
pm
)(p
pm
)(S
PM
)u
g/m
3u
g/m
3u
g/m
3le
vel
(dB
)
Mez
anC
how
kC
ycl
eI/
Mo
nso
on
26
jun
to2
7ju
n,0
33
0.4
36
6.3
72
8.5
0.9
0.8
39
56
42
27
75
.27
2.8
Cy
cle
II/W
inte
r6
Nov
to8
Nov,
03
28
36
7.1
02
50
.70
.73
80
54
32
34
4.7
17
7
Cy
cle
III/
Sp
rin
g1
8F
ebto
20
Feb
,0
42
01
9.8
7.3
91
5.3
0.5
0.8
28
94
67
18
33
.81
76
.2
Cy
cle
IV/S
um
mer
13
May
to1
5M
ay,
04
38
.38
45
.38
.23
34
.40
.75
13
58
56
32
72
5.8
77
Sat
elli
teT
own
Cy
cle
I/M
on
soo
n2
7Ju
nto
29
Jun
,0
33
22
95
.65
28
0.9
0.8
38
46
53
29
84
.11
72
.2
Cy
cle
II/W
inte
r3
1O
ctto
11
Nov,
03
25
32
5.8
26
0.7
0.7
38
15
53
28
53
.44
76
.1
Cy
cle
III/
Sp
rin
g2
0F
ebto
22
Feb
,0
41
5.4
17
.96
.21
6.9
0.4
0.7
38
14
67
20
12
.31
76
.2
Cy
cle
IV/S
um
mer
15
May
to1
7M
ay,
04
21
.75
29
.36
.92
4.8
11
34
07
02
26
6.7
4.7
77
.7
Gaw
alM
and
iC
ycl
eI/
Mo
nso
on
29
Jun
to1
Jul,
03
32
38
7.1
02
9.8
0.9
0.8
38
57
10
28
64
.24
70
.8
Cy
cle
II/W
inte
r3
Nov
to5
Nov,
03
27
.23
5.4
6.0
24
.50
.70
.73
80
65
72
53
3.5
67
3
Cy
cle
III/
Sp
rin
g2
3F
ebto
25
Feb
,0
41
6.9
27
.36
.79
.60
.50
.63
53
41
62
01
2.5
46
0
Cy
cle
IV/S
um
mer
18
May
to2
0M
ay,
04
26
.83
1.3
7.3
26
.91
.41
.23
66
55
32
52
4.2
86
1.9
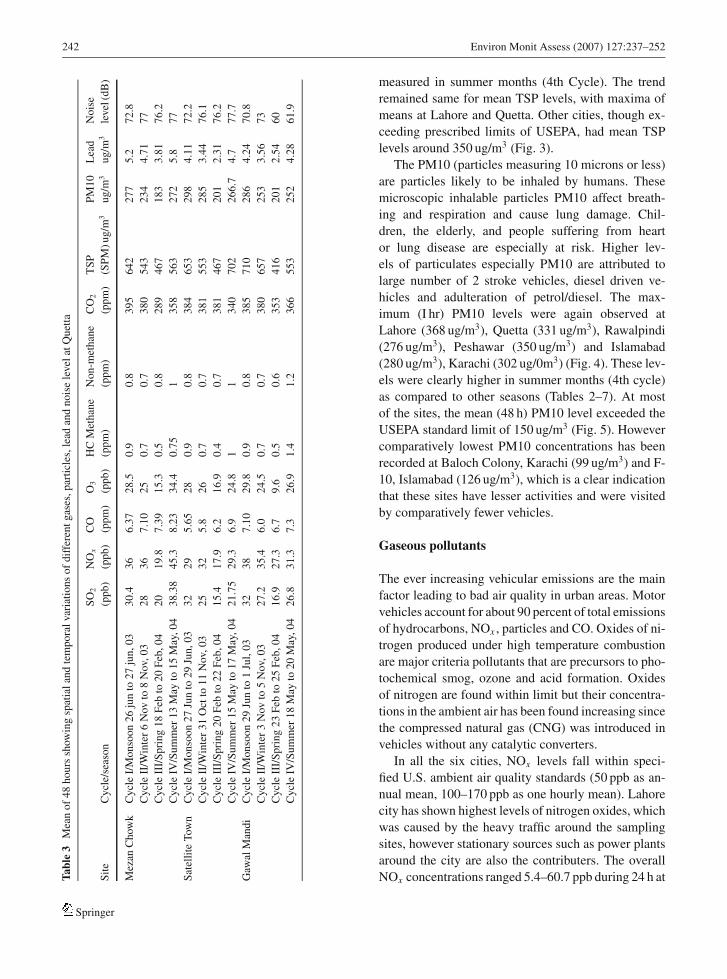
measured in summer months (4th Cycle). The trend
remained same for mean TSP levels, with maxima of
means at Lahore and Quetta. Other cities, though ex-
ceeding prescribed limits of USEPA, had mean TSP
levels around 350 ug/m3 (Fig. 3).
The PM10 (particles measuring 10 microns or less)
are particles likely to be inhaled by humans. These
microscopic inhalable particles PM10 affect breath-
ing and respiration and cause lung damage. Chil-
dren, the elderly, and people suffering from heart
or lung disease are especially at risk. Higher lev-
els of particulates especially PM10 are attributed to
large number of 2 stroke vehicles, diesel driven ve-
hicles and adulteration of petrol/diesel. The max-
imum (I hr) PM10 levels were again observed at
Lahore (368 ug/m3), Quetta (331 ug/m3), Rawalpindi
(276 ug/m3), Peshawar (350 ug/m3) and Islamabad
(280 ug/m3), Karachi (302 ug/0m3) (Fig. 4). These lev-
els were clearly higher in summer months (4th cycle)
as compared to other seasons (Tables 2–7). At most
of the sites, the mean (48 h) PM10 level exceeded the
USEPA standard limit of 150 ug/m3 (Fig. 5). However
comparatively lowest PM10 concentrations has been
recorded at Baloch Colony, Karachi (99 ug/m3) and F-
10, Islamabad (126 ug/m3), which is a clear indication
that these sites have lesser activities and were visited
by comparatively fewer vehicles.
Gaseous pollutants
The ever increasing vehicular emissions are the main
factor leading to bad air quality in urban areas. Motor
vehicles account for about 90 percent of total emissions
of hydrocarbons, NOx , particles and CO. Oxides of ni-
trogen produced under high temperature combustion
are major criteria pollutants that are precursors to pho-
tochemical smog, ozone and acid formation. Oxides
of nitrogen are found within limit but their concentra-
tions in the ambient air has been found increasing since
the compressed natural gas (CNG) was introduced in
vehicles without any catalytic converters.
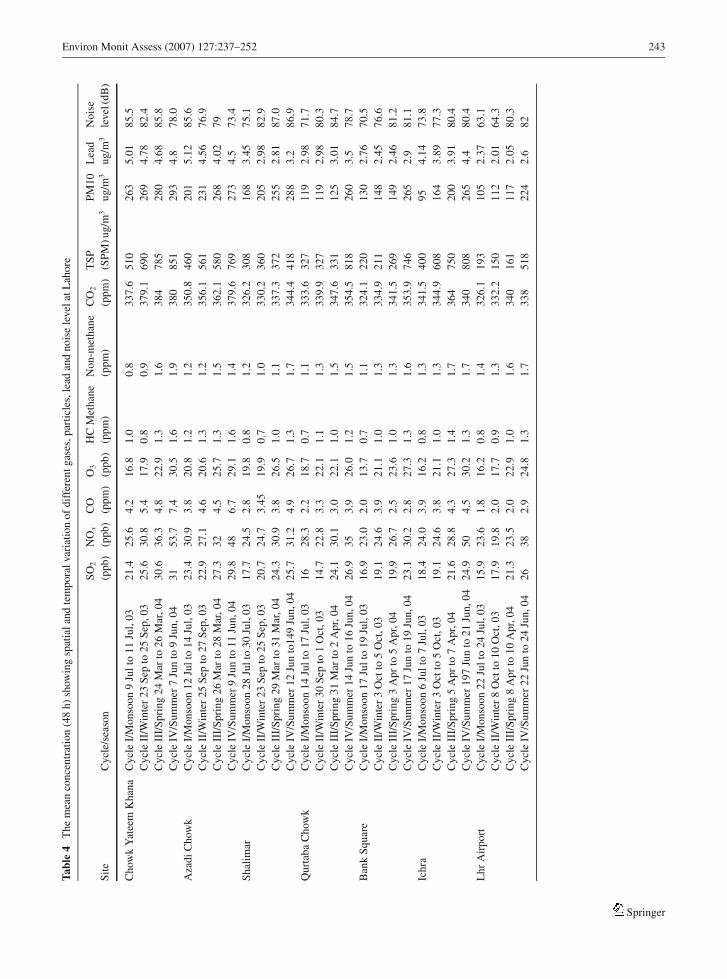
In all the six cities, NOx levels fall within speci-
fied U.S. ambient air quality standards (50 ppb as an-
nual mean, 100–170 ppb as one hourly mean). Lahore
city has shown highest levels of nitrogen oxides, which
was caused by the heavy traffic around the sampling
sites, however stationary sources such as power plants
around the city are also the contributers. The overall
NOx concentrations ranged 5.4–60.7 ppb during 24 h at
Springer
Environ Monit Assess (2007) 127:237–252 243
Tabl
e4
Th
em
ean
con
cen
trat
ion
(48
h)
show
ing
spat
ial
and
tem
po
ral
vari
atio
no
fd
iffe
ren
tgas
es,p
arti
cles
,le
adan
dn
ois
ele
vel
atL
aho
re
SO
2N
Ox
CO
O3
HC
Met
han
eN
on
-met
han
eC
O2
TS
PP
M1
0L
ead
No
ise
Sit
eC
ycl
e/se
aso
n(p
pb
)(p
pb
)(p
pm
)(p
pb
)(p
pm
)(p
pm
)(p
pm
)(S
PM
)u
g/m
3u
g/m
3u
g/m
3le
vel
(dB
)
Ch
owk
Yat
eem
Kh
ana
Cy
cle
I/M
on
soo
n9
Jul
to1
1Ju
l,0
32
1.4
25
.64
.21
6.8
1.0
0.8
33
7.6
51
02
63
5.0
18
5.5
Cy
cle
II/W
inte
r2
3S
epto
25
Sep
,0
32
5.6
30
.85
.41
7.9
0.8
0.9
37
9.1
69
02
69
4.7
88
2.4
Cy
cle
III/
Sp
rin
g2
4M
arto
26
Mar
,0
43
0.6
36
.34
.82
2.9
1.3
1.6
38
47
85
28
04
.68
85
.8
Cy
cle
IV/S
um
mer
7Ju
nto
9Ju
n,
04
31
53
.77
.43
0.5
1.6
1.9
38
08
51
29
34
.87
8.0
Aza
di
Ch
owk
Cy
cle
I/M
on
soo
n1
2Ju
lto
14
Jul,
03
23
.43
0.9
3.8
20
.81
.21
.23
50
.84
60
20
15
.12
85
.6
Cy
cle
II/W
inte
r2
5S
epto
27
Sep
,0
32
2.9
27
.14
.62
0.6
1.3
1.2
35
6.1
56
12
31
4.5
67
6.9
Cy
cle
III/
Sp
rin
g2
6M
arto
28
Mar
,0
42
7.3
32
4.5
25
.71
.31
.53
62
.15
80
26
84
.02
79
Cy
cle
IV/S
um
mer
9Ju
nto
11
Jun
,0
42
9.8
48
6.7
29
.11
.61
.43
79
.67
69
27
34
.57
3.4
Sh
alim
arC
ycl
eI/
Mo
nso
on
28
Jul
to3
0Ju
l,0
31
7.7
24
.52
.81
9.8
0.8
1.2
32
6.2
30
81
68
3.4
57
5.1
Cy
cle
II/W
inte
r2
3S
epto
25
Sep
,0
32
0.7
24
.73
.45
19
.90
.71
.03
30
.23
60
20
52
.98
82
.9
Cy
cle
III/
Sp
rin
g2
9M
arto
31
Mar
,0
42
4.3
30
.93
.82
6.5
1.0
1.1
33
7.3
37
22
55
2.8
18
7.0
Cy
cle
IV/S
um
mer
12
Jun
to1
49
Jun
,0
42
5.7
31
.24
.92
6.7
1.3
1.7
34
4.4
41
82
88
3.2
86
.9
Qu
rtab
aC
how
kC
ycl
eI/
Mo
nso
on
14
Jul
to1
7Ju
l,0
31
62
8.3
2.2
18
.70
.71
.13
33
.63
27
11
92
.98
71
.7
Cy
cle
II/W
inte
r3
0S
epto
1O
ct,0
31
4.7
22
.83
.32
2.1
1.1
1.3
33
9.9
32
71
19
2.9
88
0.3
Cy
cle
III/
Sp
rin
g3
1M
arto
2A
pr,
04
24
.13
0.1
3.0
22
.11
.01
.53
47
.63
31
12
53
.01
84
.7
Cy
cle
IV/S
um
mer
14
Jun
to1
6Ju
n,
04
26
.93
53
.92
6.0
1.2
1.5
35
4.5
81
82
60
3.5
78
.7
Ban
kS
qu
are
Cy
cle
I/M
on
soo
n1
7Ju
lto
19
Jul,
03
16
.92
3.0
2.0
13
.70
.71
.13
24
.12
20
13
02
.76
70
.5
Cy
cle
II/W
inte
r3
Oct
to5
Oct
,0
31
9.1
24
.63
.92
1.1
1.0
1.3
33
4.9
21
11
48
2.4
57
6.6
Cy
cle
III/
Sp
rin
g3
Ap
rto
5A
pr,
04
19
.92
6.7
2.5
23
.61
.01
.33
41
.52
69
14
92
.46
81
.2
Cy
cle
IV/S
um
mer
17
Jun
to1
9Ju
n,
04
23
.13
0.2
2.8
27
.31
.31
.63
53
.97
46
26
52
.98
1.1
Ich
raC
ycl
eI/
Mo
nso
on
6Ju
lto
7Ju
l,0
31
8.4
24
.03
.91
6.2
0.8
1.3
34
1.5
40
09
54
.14
73
.8
Cy
cle
II/W
inte
r3
Oct
to5
Oct
,0
31
9.1
24
.63
.82
1.1
1.0
1.3
34
4.9
60
81
64
3.8
97
7.3
Cy
cle
III/
Sp
rin
g5
Ap
rto
7A
pr,
04
21
.62
8.8
4.3
27
.31
.41
.73
64
75
02
00
3.9
18
0.4
Cy
cle
IV/S
um
mer
19
7Ju
nto
21
Jun
,0
42
4.9
50
4.5
30
.21
.31
.73
40
80
82
65
4.4
80
.4
Lh
rA
irp
ort
Cy
cle
I/M
on
soo
n2
2Ju
lto
24
Jul,
03
15
.92
3.6
1.8
16
.20
.81
.43
26
.11
93
10
52
.37
63
.1
Cy
cle
II/W
inte
r8
Oct
to1
0O
ct,0
31
7.9
19
.82
.01
7.7
0.9
1.3
33
2.2
15
01
12
2.0
16
4.3
Cy
cle
III/
Sp
rin
g8
Ap
rto
10
Ap
r,0
42
1.3
23
.52
.02
2.9
1.0
1.6
34
01
61
11
72
.05
80
.3
Cy
cle
IV/S
um
mer
22
Jun
to2
4Ju
n,
04
26
38
2.9
24
.81
.31
.73
38
51
82
24
2.6
82
Springer
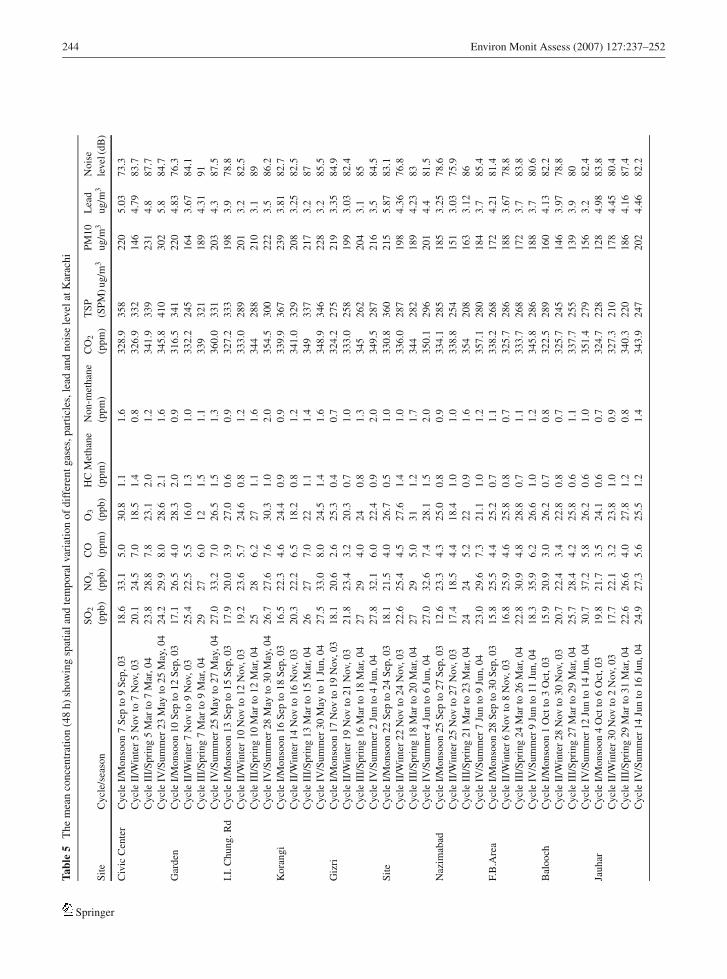
244 Environ Monit Assess (2007) 127:237–252
Tabl
e5
Th
em
ean
con
cen
trat
ion
(48
h)
show
ing
spat
ial
and
tem
po
ral
vari
atio
no
fd
iffe
ren
tgas
es,p
arti
cles
,le
adan
dn
ois
ele
vel
atK
arac
hi
SO
2N
Ox
CO
O3
HC
Met
han
eN
on
-met
han
eC
O2
TS
PP
M1
0L
ead
No
ise
Sit
eC
ycl
e/se
aso
n(p
pb
)(p
pb
)(p
pm
)(p
pb
)(p
pm
)(p
pm
)(p
pm
)(S
PM
)u
g/m
3u
g/m
3u
g/m
3le
vel
(dB
)
Civ
icC
ente
rC
ycl
eI/
Mo
nso
on
7S
epto
9S
ep,0
31
8.6
33
.15
.03
0.8
1.1
1.6
32
8.9
35
82
20
5.0
37
3.3
Cy
cle
II/W
inte
r5
Nov
to7
Nov,
03
20
.12
4.5
7.0
18
.51
.40
.83
26
.93
32
14
64
.79
83
.7
Cy
cle
III/
Sp
rin
g5
Mar
to7
Mar
,0
42
3.8
28
.87
.82
3.1
2.0
1.2
34
1.9
33
92
31
4.8
87
.7
Cy
cle
IV/S
um
mer
23
May
to2
5M
ay,
04
24
.22
9.9
8.0
28
.62
.11
.63
45
.84
10
30
25
.88
4.7
Gar
den
Cy
cle
I/M
on
soo
n1
0S
epto
12
Sep
,0
31
7.1
26
.54
.02
8.3
2.0
0.9
31
6.5
34
12
20
4.8
37
6.3
Cy
cle
II/W
inte
r7
Nov
to9
Nov,
03
25
.42
2.5
5.5
16
.01
.31
.03
32
.22
45
16
43
.67
84
.1
Cy
cle
III/
Sp
rin
g7
Mar
to9
Mar
,0
42
92
76
.01
21
.51
.13
39
32
11
89
4.3
19
1
Cy
cle
IV/S
um
mer
25
May
to2
7M
ay,
04
27
.03
3.2
7.0
26
.51
.51
.33
60
.03
31
20
34
.38
7.5
I.I.
Ch
un
g.R
dC
ycl
eI/
Mo
nso
on
13
Sep
to1
5S
ep,0
31
7.9
20
.03
.92
7.0
0.6
0.9
32
7.2
33
31
98
3.9
78
.8
Cy
cle
II/W
inte
r1
0N
ov
to1
2N
ov,
03
19
.22
3.6
5.7
24
.60
.81
.23
33
.02
89
20
13
.28
2.5
Cy
cle
III/
Sp
rin
g1
0M
arto
12
Mar
,0
42
52
86
.22
71
.11
.63
44
28
82
10
3.1
89
Cy
cle
IV/S
um
mer
28
May
to3
0M
ay,
04
26
.72
7.6
7.6
30
.31
.02
.03
54
.53
00
22
23
.58
6.2
Ko
ran
gi
Cy
cle
I/M
on
soo
n1
6S
epto
18
Sep
,0
31
6.5
22
.34
.62
4.4
0.9
0.9
33
9.9
36
72
39
3.8
18
2.7
Cy
cle
II/W
inte
r1
4N
ov
to1
6N
ov,
03
20
.32
2.2
6.5
18
.20
.81
.23
41
.03
29
20
83
.25
82
.5
Cy
cle
III/
Sp
rin
g1
3M
arto
15
Mar
,0
42
62
77
.02
21
.11
.43
49
33
72
17
3.2
87
Cy
cle
IV/S
um
mer
30
May
to1
Jun
,0
42
7.5
33
.08
.02
4.5
1.4
1.6
34
8.9
34
62
28
3.2
85
.5
Giz
riC
ycl
eI/
Mo
nso
on
17
Nov
to1
9N
ov,
03
18
.12
0.6
2.6
25
.30
.40
.73
24
.22
75
21
93
.35
84
.9
Cy
cle
II/W
inte
r1
9N
ov
to2
1N
ov,
03
21
.82
3.4
3.2
20
.30
.71
.03
33
.02
58
19
93
.03
82
.4
Cy
cle
III/
Sp
rin
g1
6M
arto
18
Mar
,0
42
72
94
.02
40
.81
.33
45
26
22
04
3.1
85
Cy
cle
IV/S
um
mer
2Ju
nto
4Ju
n,0
42
7.8
32
.16
.02
2.4
0.9
2.0
34
9.5
28
72
16
3.5
84
.5
Sit
eC
ycl
eI/
Mo
nso
on
22
Sep
to2
4S
ep,0
31
8.1
21
.54
.02
6.7
0.5
1.0
33
0.8
36
02
15
5.8
78
3.1
Cy
cle
II/W
inte
r2
2N
ov
to2
4N
ov,
03
22
.62
5.4
4.5
27
.61
.41
.03
36
.02
87
19
84
.36
76
.8
Cy
cle
III/
Sp
rin
g1
8M
arto
20
Mar
,0
42
72
95
.03
11
.21
.73
44
28
21
89
4.2
38
3
Cy
cle
IV/S
um
mer
4Ju
nto
6Ju
n,0
42
7.0
32
.67
.42
8.1
1.5
2.0
35
0.1
29
62
01
4.4
81
.5
Naz
imab
adC
ycl
eI/
Mo
nso
on
25
Sep
to2
7S
ep,0
31
2.6
23
.34
.32
5.0
0.8
0.9
33
4.1
28
51
85
3.2
57
8.6
Cy
cle
II/W
inte
r2
5N
ov
to2
7N
ov,
03
17
.41
8.5
4.4
18
.41
.01
.03
38
.82
54
15
13
.03
75
.9
Cy
cle
III/
Sp
rin
g2
1M
arto
23
Mar
,0
42
42
45
.22
20
.91
.63
54
20
81
63
3.1
28
6
Cy
cle
IV/S
um
mer
7Ju
nto
9Ju
n,0
42
3.0
29
.67
.32
1.1
1.0
1.2
35
7.1
28
01
84
3.7
85
.4
F.B
.Are
aC
ycl
eI/
Mo
nso
on
28
Sep
to3
0S
ep,0
31
5.8
25
.54
.42
5.2
0.7
1.1
33
8.2
26
81
72
4.2
18
1.4
Cy
cle
II/W
inte
r6
Nov
to8
Nov,
03
16
.82
5.9
4.6
25
.80
.80
.73
25
.72
86
18
83
.67
78
.8
Cy
cle
III/
Sp
rin
g2
4M
arto
26
Mar
,0
42
2.8
30
.94
.82
8.8
0.7
1.1
33
3.7
26
81
72
3.7
83
.8
Cy
cle
IV/S
um
mer
9Ju
nto
11
Jun
,0
41
8.3
35
.96
.22
6.6
1.0
1.2
34
5.8
28
61
88
3.7
80
.6
Bal
oo
chC
ycl
eI/
Mo
nso
on
1O
ctto
3O
ct,0
31
5.9
20
.93
.02
6.2
0.7
0.8
32
2.5
28
91
60
4.1
38
2.2
Cy
cle
II/W
inte
r2
8N
ov
to3
0N
ov,
03
20
.72
2.4
3.4
22
.80
.80
.73
25
.72
45
14
63
.97
78
.8
Cy
cle
III/
Sp
rin
g2
7M
arto
29
Mar
,0
42
5.7
28
.44
.22
5.8
0.6
1.1
33
7.7
25
51
39
3.9
80
Cy
cle
IV/S
um
mer
12
Jun
to1
4Ju
n,0
43
0.7
37
.25
.82
6.2
0.6
1.0
35
1.4
27
91
56
3.2
82
.4
Jau
har
Cy
cle
I/M
on
soo
n4
Oct
to6
Oct
,0
31
9.8
21
.73
.52
4.1
0.6
0.7
32
4.7
22
81
28
4.9
88
3.8
Cy
cle
II/W
inte
r3
0N
ov
to2
Nov,
03
17
.72
2.1
3.2
23
.81
.00
.93
27
.32
10
17
84
.45
80
.4
Cy
cle
III/
Sp
rin
g2
9M
arto
31
Mar
,0
42
2.6
26
.64
.02
7.8
1.2
0.8
34
0.3
22
01
86
4.1
68
7.4
Cy
cle
IV/S
um
mer
14
Jun
to1
6Ju
n,0
42
4.9
27
.35
.62
5.5
1.2
1.4
34
3.9
24
72
02
4.4
68
2.2
Springer
Environ Monit Assess (2007) 127:237–252 245
Tabl
e6
Th
em
ean
con
cen
trat
ion
(48
h)
show
ing
spat
ial
and
tem
po
ral
vari
atio
no
fd
iffe
ren
tgas
es,p
arti
cles
,le
adan
dn
ois
ele
vel
atR
awal
pin
di
SO
2N
Ox
CO
O3
HC
Met
han
eN
on
-met
han
eC
O2
TS
PP
M1
0L
ead
No
ise
Sit
eC
ycl
e/se
aso
n(p
pb
)(p
pb
)(p
pm
)(p
pb
)(p
pm
)(p
pm
)(p
pm
)(S
PM
)u
g/m
3u
g/m
3u
g/m
3le
vel
(dB
)
Fai
zab
adC
ycl
eI/
Mo
nso
on
28
Jul
to3
0Ju
l,0
31
4.0
16
3.0
12
.70
.50
.93
05
.72
44
13
12
.27
4.8
Cy
cle
II/W
inte
r1
5O
ctto
17
Oct
,0
31
51
93
.61
80
.60
.93
09
28
21
68
2.1
74
.9
Cy
cle
III/
Sp
rin
g1
7F
ebto
19
Feb
,0
41
6.1
20
5.0
22
.20
.60
.93
14
.33
08
17
91
.75
75
.9
Cy
cle
IV/S
um
mer
9M
ayto
11
May
,0
41
6.8
23
5.5
26
.81
.01
.03
23
.23
92
21
52
.67
9.9
Raj
aC
ycl
eI/
Mo
nso
on
30
Jul
to1
Au
g,0
31
3.4
22
3.2
13
.80
.61
.02
95
.22
73
17
93
.46
70
.2
Cy
cle
II/W
inte
r1
7O
ctto
19
Oct
,0
31
5.8
23
4.2
16
.30
.71
.13
08
31
31
68
3.0
27
2
Cy
cle
III/
Sp
rin
g1
9F
ebto
21
Feb
,0
41
6.8
23
4.8
20
.30
.81
.13
08
32
71
31
2.9
76
.8
Cy
cle
IV/S
um
mer
11
May
to1
3M
ay,
04
18
.12
65
21
1.0
1.2
31
24
16
21
53
.88
1.8
Rad
ioC
ycl
eI/
Mo
nso
on
2A
ug
to4
Au
g,0
31
52
11
.81
20
.51
.23
11
27
31
31
3.5
71
.9
Cy
cle
II/W
inte
r2
0O
ctto
22
Oct
,0
31
5.8
22
.02
.01
50
.61
.33
15
29
01
58
3.7
73
.9
Cy
cle
III/
Sp
rin
g2
2F
ebto
24
Feb
,0
41
9.0
23
2.5
19
0.8
1.5
32
23
00
16
04
.07
7.8
Cy
cle
IV/S
um
mer
14
May
to1
6M
ay,
04
19
.02
73
.82
0.1
0.8
1.6
35
64
59
23
64
.77
7.7
Att
ock
Cy
cle
I/M
on
soo
n4
Au
gto
6A
ug
03
12
.91
83
.01
30
.40
.63
02
38
91
67
3.7
56
9.6
Cy
cle
II/W
inte
r2
2O
ctto
24
Oct
,0
31
3.9
20
.03
.81
40
.70
.83
08
41
62
00
3.6
56
6.0
Cy
cle
III/
Sp
rin
g2
4F
ebto
26
Feb
,0
41
52
14
.21
5.2
0.8
1.2
31
44
20
20
83
.37
66
.4
Cy
cle
IV/S
um
mer
16
May
to1
8M
ay,
04
14
.82
2.1
4.5
17
1.2
1.3
31
54
53
24
54
.36
6.5
Nas
irab
adC
ycl
eI/
Mo
nso
on
7A
ug
to9
Au
g,0
31
3.3
17
2.0
12
0.4
0.9
29
93
17
17
33
.16
7.9
Cy
cle
II/W
inte
r2
5O
ctto
27
Oct
,0
31
4.8
18
2.4
14
.00
.61
.13
08
35
71
88
3.5
72
.5
Cy
cle
III/
Sp
rin
g2
7F
ebto
29
Feb
,0
41
7.3
22
3.2
15
.00
.81
.13
12
35
81
90
3.3
76
9.5
Cy
cle
IV/S
um
mer
19
May
to2
1M
ay,
04
19
25
4.5
19
.90
.81
.23
14
46
42
48
4.3
69
.5
Springer
246 Environ Monit Assess (2007) 127:237–252
Tabl
e7
Th
em
ean
con
cen
trat
ion
(48
h)
show
ing
spat
ial
and
tem
po
ral
vari
atio
no
fd
iffe
ren
tg
ases
,p
arti
cles
,le
adan
dn
ois
ele
vel
atP
esh
awar
SO
2N
Ox
CO
O3
HC
Met
han
eN
on
-met
han
eC
O2
TS
PP
M1
0L
ead
No
ise
Sit
eC
ycl
e/se
aso
n(p
pb
)(p
pb
)(p
pm
)(p
pb
)(p
pm
)(p
pm
)(p
pm
)(S
PM
)u
g/m
3u
g/m
3u
g/m
3le
vel
(dB
)
Gen
eral
Bu
sS
tan
dC
ycl
eI/
Mo
nso
on
21
Au
gto
23
Au
g,0
31
82
12
.42
00
.40
.83
56
30
22
13
3.2
37
2
Cy
cle
II/W
inte
r1
0N
ov
to1
2N
ov,
03
19
27
3.2
20
0.8
1.6
35
83
12
21
93
.97
2
Cy
cle
III/
Sp
rin
g1
0M
arto
12
Mar
,0
42
32
73
.62
32
.12
.03
72
35
02
91
4.5
74
Cy
cle
IV/S
um
mer
23
May
to2
5M
ay,
04
29
35
3.8
24
2.4
2.2
37
93
85
31
74
.88
1
Sad
dar
Cy
cle
I/M
on
soo
n2
3A
ug
to2
5A
ug
,0
31
42
02
.12
10
.60
.83
12
34
11
70
3.9
27
0
Cy
cle
II/W
inte
r1
2N
ov
to1
4N
ov,
03
19
21
2.5
24
0.7
1.2
32
23
58
17
33
.27
0
Cy
cle
III/
Sp
rin
g1
5M
arto
17
Mar
,0
41
92
33
.12
71
.01
.43
28
41
61
98
4.3
73
Cy
cle
IV/S
um
mer
25
May
to2
7M
ay,
04
24
28
3.5
29
0.8
1.7
34
04
21
20
84
.72
79
Ko
hat
Ad
aC
ycl
eI/
Mo
nso
on
30
Au
gto
1S
ep,0
32
42
42
.81
8.8
0.9
1.1
32
14
00
20
43
.57
4.4
Cy
cle
II/W
inte
r1
5N
ov
to1
7N
ov,
03
25
.22
73
.02
01
.01
.33
37
44
82
39
4.2
69
.2
Cy
cle
III/
Sp
rin
g2
0M
arto
22
Mar
,0
42
6.2
29
3.3
22
1.1
1.4
36
04
51
29
54
.57
0.3
Cy
cle
IV/S
um
mer
28
May
to3
0M
ay,
04
29
30
4.0
21
.71
.61
.63
73
47
43
05
5.3
77
Dab
gri
Cy
cle
I/M
on
soo
n1
Sep
to3
Sep
,0
31
9.2
21
.32
20
.90
.50
.83
13
24
02
14
3.6
77
Cy
cle
II/W
inte
r1
7N
ov
to1
9N
ov,
03
20
.02
62
.52
3.1
0.8
1.1
32
82
41
22
44
.76
5.2
Cy
cle
III/
Sp
rin
g1
7M
arto
19
Mar
,0
42
12
73
.12
7.7
1.0
1.6
34
13
10
23
04
.47
1.7
Cy
cle
IV/S
um
mer
30
May
to1
Jun
,0
42
23
0.2
3.3
30
.91
.31
.73
56
41
42
40
4.8
77
.7
Hy
atab
adC
ycl
eI/
Mo
nso
on
27
Au
gto
29
Au
g,0
31
52
01
.82
1.1
0.3
0.6
31
32
61
14
22
.02
67
.5
Cy
cle
II/W
inte
r2
0N
ov
to2
2N
ov,
03
19
.22
32
.02
20
.61
.33
28
30
11
53
2.8
64
.6
Cy
cle
III/
Sp
rin
g1
2M
arto
14
Mar
,0
42
32
9.4
3.8
25
1.1
1.5
37
33
05
15
62
.89
72
Cy
cle
IV/S
um
mer
2Ju
nto
4Ju
n,0
42
83
2.9
4.3
25
.11
.31
.73
82
43
21
79
3.0
27
8
Springer
Environ Monit Assess (2007) 127:237–252 247
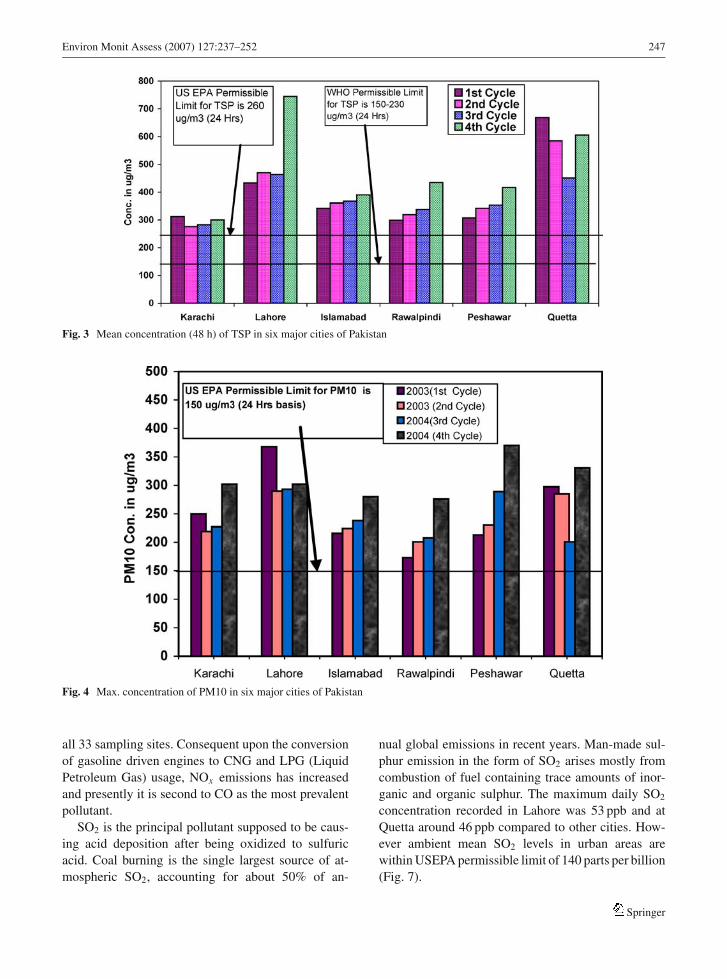
Fig. 3 Mean concentration (48 h) of TSP in six major cities of Pakistan
Fig. 4 Max. concentration of PM10 in six major cities of Pakistan
all 33 sampling sites. Consequent upon the conversion
of gasoline driven engines to CNG and LPG (Liquid
Petroleum Gas) usage, NOx emissions has increased
and presently it is second to CO as the most prevalent
pollutant.
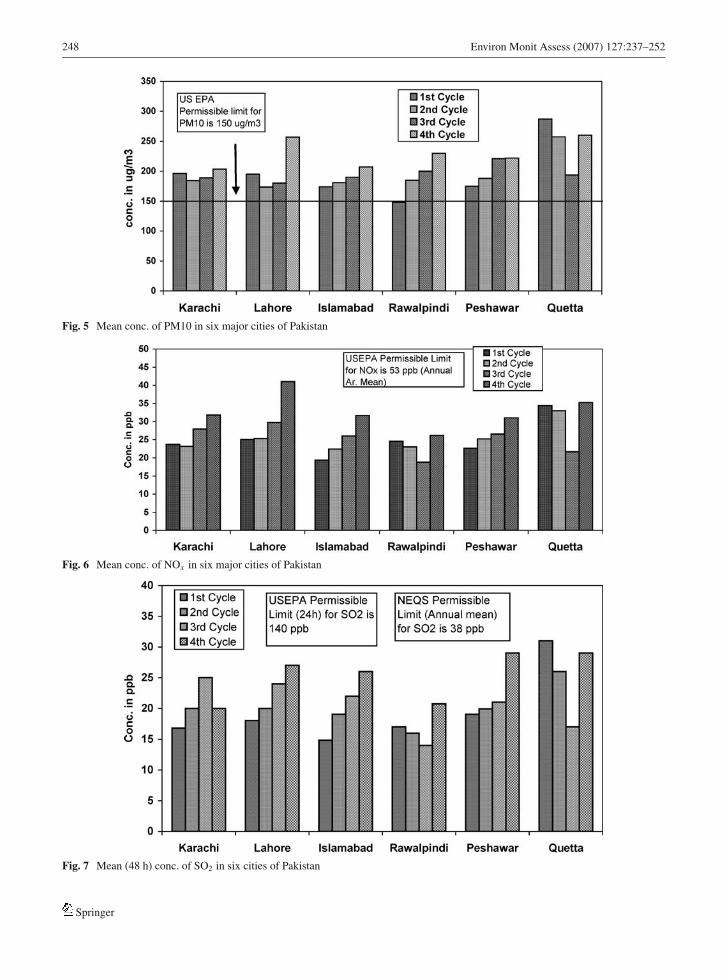
SO2 is the principal pollutant supposed to be caus-
ing acid deposition after being oxidized to sulfuric
acid. Coal burning is the single largest source of at-
mospheric SO2, accounting for about 50% of an-
nual global emissions in recent years. Man-made sul-
phur emission in the form of SO2 arises mostly from
combustion of fuel containing trace amounts of inor-
ganic and organic sulphur. The maximum daily SO2
concentration recorded in Lahore was 53 ppb and at
Quetta around 46 ppb compared to other cities. How-
ever ambient mean SO2 levels in urban areas are
within USEPA permissible limit of 140 parts per billion
(Fig. 7).
Springer
248 Environ Monit Assess (2007) 127:237–252
Fig. 5 Mean conc. of PM10 in six major cities of Pakistan
Fig. 6 Mean conc. of NOx in six major cities of Pakistan
Fig. 7 Mean (48 h) conc. of SO2 in six cities of Pakistan
Springer
Environ Monit Assess (2007) 127:237–252 249
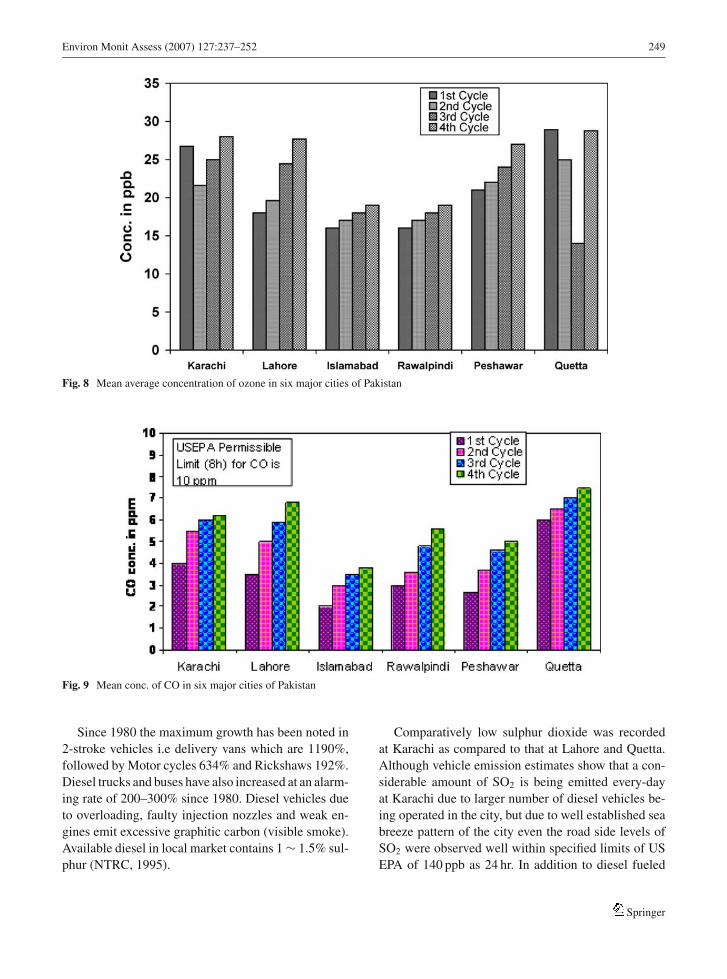
Fig. 8 Mean average concentration of ozone in six major cities of Pakistan
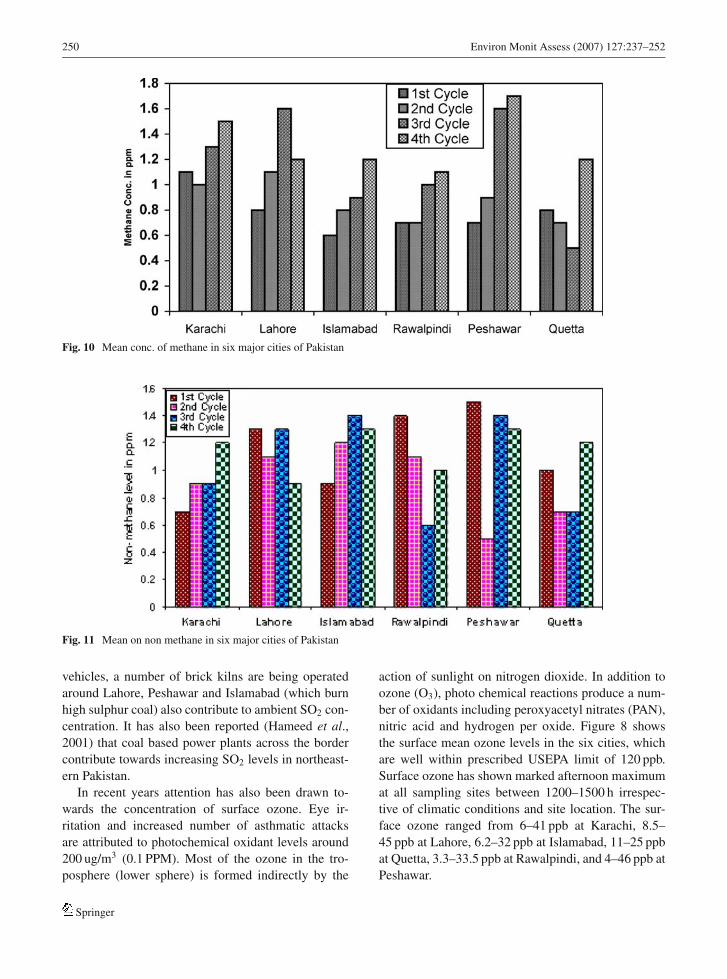
Fig. 9 Mean conc. of CO in six major cities of Pakistan
Since 1980 the maximum growth has been noted in
2-stroke vehicles i.e delivery vans which are 1190%,
followed by Motor cycles 634% and Rickshaws 192%.
Diesel trucks and buses have also increased at an alarm-
ing rate of 200–300% since 1980. Diesel vehicles due
to overloading, faulty injection nozzles and weak en-
gines emit excessive graphitic carbon (visible smoke).
Available diesel in local market contains 1 ∼ 1.5% sul-
phur (NTRC, 1995).
Comparatively low sulphur dioxide was recorded
at Karachi as compared to that at Lahore and Quetta.
Although vehicle emission estimates show that a con-
siderable amount of SO2 is being emitted every-day
at Karachi due to larger number of diesel vehicles be-
ing operated in the city, but due to well established sea
breeze pattern of the city even the road side levels of
SO2 were observed well within specified limits of US
EPA of 140 ppb as 24 hr. In addition to diesel fueled
Springer
250 Environ Monit Assess (2007) 127:237–252
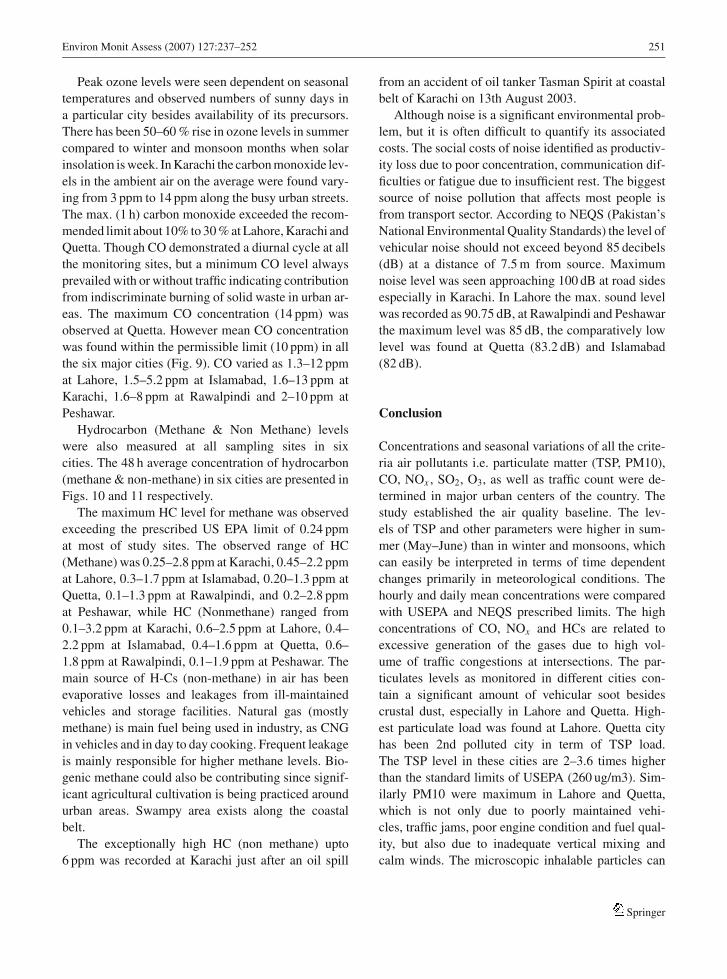
Fig. 10 Mean conc. of methane in six major cities of Pakistan
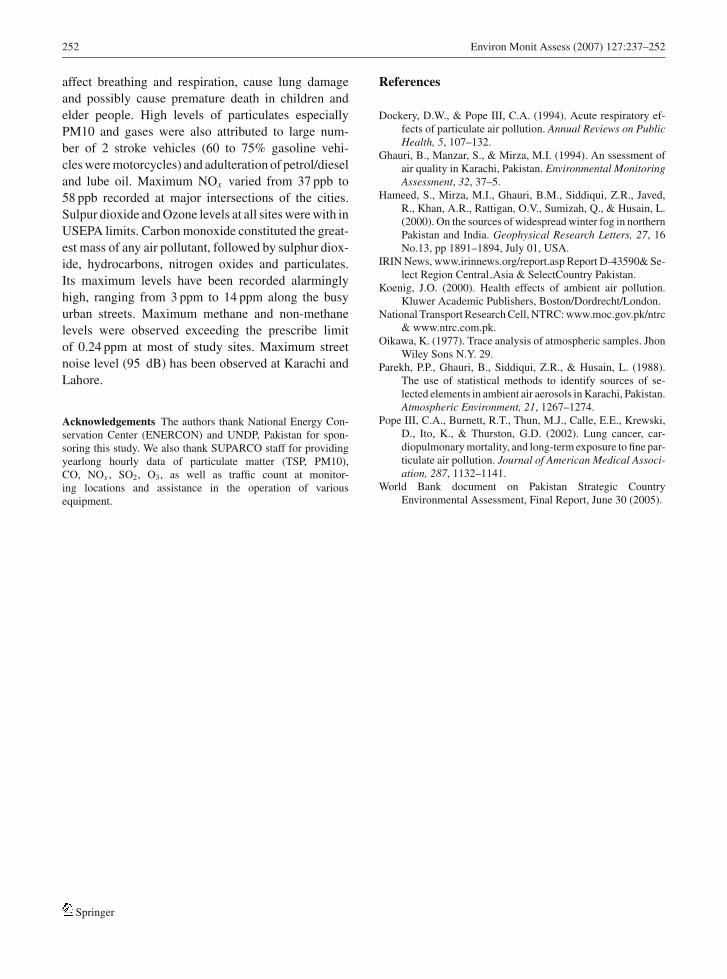
Fig. 11 Mean on non methane in six major cities of Pakistan
vehicles, a number of brick kilns are being operated
around Lahore, Peshawar and Islamabad (which burn
high sulphur coal) also contribute to ambient SO2 con-
centration. It has also been reported (Hameed et al.,2001) that coal based power plants across the border
contribute towards increasing SO2 levels in northeast-
ern Pakistan.
In recent years attention has also been drawn to-
wards the concentration of surface ozone. Eye ir-
ritation and increased number of asthmatic attacks
are attributed to photochemical oxidant levels around
200 ug/m3 (0.1 PPM). Most of the ozone in the tro-
posphere (lower sphere) is formed indirectly by the
action of sunlight on nitrogen dioxide. In addition to
ozone (O3), photo chemical reactions produce a num-
ber of oxidants including peroxyacetyl nitrates (PAN),
nitric acid and hydrogen per oxide. Figure 8 shows
the surface mean ozone levels in the six cities, which
are well within prescribed USEPA limit of 120 ppb.
Surface ozone has shown marked afternoon maximum
at all sampling sites between 1200–1500 h irrespec-
tive of climatic conditions and site location. The sur-
face ozone ranged from 6–41 ppb at Karachi, 8.5–
45 ppb at Lahore, 6.2–32 ppb at Islamabad, 11–25 ppb
at Quetta, 3.3–33.5 ppb at Rawalpindi, and 4–46 ppb at
Peshawar.
Springer
Environ Monit Assess (2007) 127:237–252 251
Peak ozone levels were seen dependent on seasonal
temperatures and observed numbers of sunny days in
a particular city besides availability of its precursors.
There has been 50–60 % rise in ozone levels in summer
compared to winter and monsoon months when solar
insolation is week. In Karachi the carbon monoxide lev-
els in the ambient air on the average were found vary-
ing from 3 ppm to 14 ppm along the busy urban streets.
The max. (1 h) carbon monoxide exceeded the recom-
mended limit about 10% to 30 % at Lahore, Karachi and
Quetta. Though CO demonstrated a diurnal cycle at all
the monitoring sites, but a minimum CO level always
prevailed with or without traffic indicating contribution
from indiscriminate burning of solid waste in urban ar-
eas. The maximum CO concentration (14 ppm) was
observed at Quetta. However mean CO concentration
was found within the permissible limit (10 ppm) in all
the six major cities (Fig. 9). CO varied as 1.3–12 ppm
at Lahore, 1.5–5.2 ppm at Islamabad, 1.6–13 ppm at
Karachi, 1.6–8 ppm at Rawalpindi and 2–10 ppm at
Peshawar.
Hydrocarbon (Methane & Non Methane) levels
were also measured at all sampling sites in six
cities. The 48 h average concentration of hydrocarbon
(methane & non-methane) in six cities are presented in
Figs. 10 and 11 respectively.
The maximum HC level for methane was observed
exceeding the prescribed US EPA limit of 0.24 ppm
at most of study sites. The observed range of HC
(Methane) was 0.25–2.8 ppm at Karachi, 0.45–2.2 ppm
at Lahore, 0.3–1.7 ppm at Islamabad, 0.20–1.3 ppm at
Quetta, 0.1–1.3 ppm at Rawalpindi, and 0.2–2.8 ppm
at Peshawar, while HC (Nonmethane) ranged from
0.1–3.2 ppm at Karachi, 0.6–2.5 ppm at Lahore, 0.4–
2.2 ppm at Islamabad, 0.4–1.6 ppm at Quetta, 0.6–
1.8 ppm at Rawalpindi, 0.1–1.9 ppm at Peshawar. The
main source of H-Cs (non-methane) in air has been
evaporative losses and leakages from ill-maintained
vehicles and storage facilities. Natural gas (mostly
methane) is main fuel being used in industry, as CNG
in vehicles and in day to day cooking. Frequent leakage
is mainly responsible for higher methane levels. Bio-
genic methane could also be contributing since signif-
icant agricultural cultivation is being practiced around
urban areas. Swampy area exists along the coastal
belt.
The exceptionally high HC (non methane) upto
6 ppm was recorded at Karachi just after an oil spill
from an accident of oil tanker Tasman Spirit at coastal
belt of Karachi on 13th August 2003.
Although noise is a significant environmental prob-
lem, but it is often difficult to quantify its associated
costs. The social costs of noise identified as productiv-
ity loss due to poor concentration, communication dif-
ficulties or fatigue due to insufficient rest. The biggest
source of noise pollution that affects most people is
from transport sector. According to NEQS (Pakistan’s
National Environmental Quality Standards) the level of
vehicular noise should not exceed beyond 85 decibels
(dB) at a distance of 7.5 m from source. Maximum
noise level was seen approaching 100 dB at road sides
especially in Karachi. In Lahore the max. sound level
was recorded as 90.75 dB, at Rawalpindi and Peshawar
the maximum level was 85 dB, the comparatively low
level was found at Quetta (83.2 dB) and Islamabad
(82 dB).
Conclusion
Concentrations and seasonal variations of all the crite-
ria air pollutants i.e. particulate matter (TSP, PM10),
CO, NOx , SO2, O3, as well as traffic count were de-
termined in major urban centers of the country. The
study established the air quality baseline. The lev-
els of TSP and other parameters were higher in sum-
mer (May–June) than in winter and monsoons, which
can easily be interpreted in terms of time dependent
changes primarily in meteorological conditions. The
hourly and daily mean concentrations were compared
with USEPA and NEQS prescribed limits. The high
concentrations of CO, NOx and HCs are related to
excessive generation of the gases due to high vol-
ume of traffic congestions at intersections. The par-
ticulates levels as monitored in different cities con-
tain a significant amount of vehicular soot besides
crustal dust, especially in Lahore and Quetta. High-
est particulate load was found at Lahore. Quetta city
has been 2nd polluted city in term of TSP load.
The TSP level in these cities are 2–3.6 times higher
than the standard limits of USEPA (260 ug/m3). Sim-
ilarly PM10 were maximum in Lahore and Quetta,
which is not only due to poorly maintained vehi-
cles, traffic jams, poor engine condition and fuel qual-
ity, but also due to inadequate vertical mixing and
calm winds. The microscopic inhalable particles can
Springer
252 Environ Monit Assess (2007) 127:237–252
affect breathing and respiration, cause lung damage
and possibly cause premature death in children and
elder people. High levels of particulates especially
PM10 and gases were also attributed to large num-
ber of 2 stroke vehicles (60 to 75% gasoline vehi-
cles were motorcycles) and adulteration of petrol/diesel
and lube oil. Maximum NOx varied from 37 ppb to
58 ppb recorded at major intersections of the cities.
Sulpur dioxide and Ozone levels at all sites were with in
USEPA limits. Carbon monoxide constituted the great-
est mass of any air pollutant, followed by sulphur diox-
ide, hydrocarbons, nitrogen oxides and particulates.
Its maximum levels have been recorded alarmingly
high, ranging from 3 ppm to 14 ppm along the busy
urban streets. Maximum methane and non-methane
levels were observed exceeding the prescribe limit
of 0.24 ppm at most of study sites. Maximum street
noise level (95 dB) has been observed at Karachi and
Lahore.
Acknowledgements The authors thank National Energy Con-servation Center (ENERCON) and UNDP, Pakistan for spon-soring this study. We also thank SUPARCO staff for providingyearlong hourly data of particulate matter (TSP, PM10),CO, NOx , SO2, O3, as well as traffic count at monitor-ing locations and assistance in the operation of variousequipment.
References
Dockery, D.W., & Pope III, C.A. (1994). Acute respiratory ef-fects of particulate air pollution. Annual Reviews on PublicHealth, 5, 107–132.
Ghauri, B., Manzar, S., & Mirza, M.I. (1994). An ssessment ofair quality in Karachi, Pakistan. Environmental MonitoringAssessment, 32, 37–5.
Hameed, S., Mirza, M.I., Ghauri, B.M., Siddiqui, Z.R., Javed,R., Khan, A.R., Rattigan, O.V., Sumizah, Q., & Husain, L.(2000). On the sources of widespread winter fog in northernPakistan and India. Geophysical Research Letters, 27, 16No.13, pp 1891–1894, July 01, USA.
IRIN News, www.irinnews.org/report.asp Report D-43590& Se-lect Region Central Asia & SelectCountry Pakistan.
Koenig, J.O. (2000). Health effects of ambient air pollution.Kluwer Academic Publishers, Boston/Dordrecht/London.
National Transport Research Cell, NTRC: www.moc.gov.pk/ntrc& www.ntrc.com.pk.
Oikawa, K. (1977). Trace analysis of atmospheric samples. JhonWiley Sons N.Y. 29.
Parekh, P.P., Ghauri, B., Siddiqui, Z.R., & Husain, L. (1988).The use of statistical methods to identify sources of se-lected elements in ambient air aerosols in Karachi, Pakistan.Atmospheric Environment, 21, 1267–1274.
Pope III, C.A., Burnett, R.T., Thun, M.J., Calle, E.E., Krewski,D., Ito, K., & Thurston, G.D. (2002). Lung cancer, car-diopulmonary mortality, and long-term exposure to fine par-ticulate air pollution. Journal of American Medical Associ-ation, 287, 1132–1141.
World Bank document on Pakistan Strategic CountryEnvironmental Assessment, Final Report, June 30 (2005).
Springer