A Novel Dataset for Quranic Words Identification and Authentication

SCIENCE CHINA Earth Sciences
© Science China Press and Springer-Verlag Berlin Heidelberg 2012 earth.scichina.com www.springerlink.com
*Corresponding author (email: [email protected])
• RESEARCH PAPER • September 2013 Vol.56 No.9: 1555–1565
doi: 10.1007/s11430-012-4542-9
Development of a 50-year daily surface solar radiation dataset over China
TANG WenJun1,2*, YANG Kun1, QIN Jun1 & MIN Min3
1 Key Laboratory of Tibetan Environment Changes and Land Surface Processes, Institute of Tibetan Plateau Research, Chinese Academy of Sciences, Beijing 100085, China;
2 Graduate School of Chinese Academy of Sciences, Beijing 100049, China; 3 Key Laboratory of Radiometric Calibration and Validation for Environmental Satellites, National Satellite Meteorological Center,
China Meteorological Administration, Beijing 100081, China
Received March 12, 2012; accepted September 18, 2012; published online November 23, 2012
Although solar radiation is a crucial parameter in designing solar power devices and studying land surface processes, long-term and densely distributed observations of surface solar radiation are usually not available. This paper describes the development of a 50-year dataset of daily surface solar radiation at 716 China Meteorological Administration (CMA) stations. First, a phys-ical model, without any local calibration, is applied to estimate the daily radiation at all 716 CMA routine stations. Then, an ANN-based (Artificial Neural Network) model is applied to extend radiation estimates to earlier periods at each of all 96 CMA radiation stations. The ANN-based model is trained with recent reliable radiation data and thus its estimate is more reliable than the physical model. Therefore, the ANN-based model is used to correct the physical model dynamically at a monthly scale. The correction generally improves the accuracy of the radiation dataset estimated by the physical model: the mean bias error (MBE) averaged over all the 96 radiation stations during 1994–2002 is reduced from 0.68 to 0.11 MJ m2 and the root mean square error (RMSE) from 2.01 to 1.80 MJ m2. The new radiation dataset shows superior performance over previous estimates by locally calibrated Ångström-Prescott models. Based on the new radiation dataset, the annual mean daily solar radiation over China is 14.3 MJ m2. The maximal seasonal mean daily solar radiation occurs in the Tibetan Plateau during summer with a value of 27.1 MJ m2, whereas the minimal seasonal mean daily solar radiation occurs in the Sichuan Basin during winter with a value of 4.7 MJ m2.
solar radiation, dataset, correction method, hybrid model, ANN
Citation: Tang W J, Yang K, Qin J, et al. Development of a 50-year daily surface solar radiation dataset over China. Science China: Earth Sciences, 2013, 56: 1555–1565, doi: 10.1007/s11430-012-4542-9
Information on the spatio-temporal distribution of surface solar radiation is indispensable for modeling land surface processes, studying climate changes, and designing photo-voltaic power and solar heating systems. Measurements by pyranometers on the ground are the most reliable method to obtain surface solar radiation, but this is not widely applied compared to the measurements of other meteorological var-
iables (such as wind speed, air temperature, relative humid-ity, precipitation, and sunshine duration), owing to its high cost [1, 2]. In addition, radiation measurements often con-tain erroneous and spurious values due to technical failures and/or operation-related problems [3]. As a result, lack of adequate and high-quality solar radiation data has become a universal problem [4], particularly in remote and highland regions. Therefore, methods for estimating solar radiation have to be developed to solve the problem.
So far, many approaches have been developed to esti-
1556 Tang W J, et al. Sci China Earth Sci September (2013) Vol.56 No.9
mate surface solar radiation, such as estimation from mete-orological variables, model simulation, and satellite retriev-als [5]. Among them, methods based on meteorological variables are widely used in agronomic, ecological, and hydrological modelings, depending on data availability. These methods could be divided roughly into three classes according to their inputs: sunshine-based [6–8], tempera-ture-based [9–12], and cloud-based [13–15]. In general, a well-calibrated sunshine-based model can perform better than cloud-based or temperature-based models [4, 16, 17].
Many researchers used local radiation observations to calibrate surface radiation models in China [2, 18–21] and tried to apply the models to other stations without radiation measurements. Based on local calibrations in different cli-matic zones, Lam et al. [18] proposed different Ång-ström-Prescott coefficients for each of the major thermal and solar climatic zones to estimate solar radiation. Liu et al. [2] calibrated the Ångström-Prescott coefficients (a, b) un-der different time scales and analyzed their impacts on es-timating solar radiation in the Yellow River Basin. Li et al. [19] calibrated different kinds of Ångström-Prescott models (quadratic, cubic, logarithmic, exponential, power, and their combination) on the Tibetan Plateau and their results showed that the modifications with a complex expression did not give an obvious improvement to the simple linear Ångström-Prescott model. Liu et al. [20] also validated sev-eral locally calibrated sunshine-based models and tempera-ture-based models for the Tibetan Plateau. Using four dif-ferent trigonometric models calibrated with local radiation observations, Li et al. [21] estimated daily solar radiation by day of year in China. Recently, a few researchers utilized ANN-based (Artificial Neural Network) models to estimate surface solar radiation from meterological variables [22–25]. Lam et al. [24] built ANN-based models from sunshine du-ration and mean air temperature at 40 individual radiation stations and nine different climatic regions in China, respec-tively. Evaluation results indicated that the models built at individual stations performed slightly better than the models built in the corresponding climatic regions.
However, it is difficult to extend the application of a cal-ibrated model from one site to another, because model pa-rameters are usually site-dependent, if a model (such as Ångström-Prescott model or ANN-based model) does not physically consider radiative extinction processes in the atmosphere. As indicated by Yang et al. [26, 27], a model calibrated in lowland (or humid) areas may underestimate the solar radiation in highland (or dry) areas, and vice versa. This problem increases the difficulties in estimating solar radiation in China, which is characterized by complex ter-rain and climatic conditions. Besides estimation from sur-face meteorological variables, the satellite remote sensing retrievals are promising methods that can estimate surface solar radiation [28–32] globally and show high application potential in various studies. However, their products usually have relatively short historical records.
In China, compared to 716 routine meteorological sta-tions, only slightly over 100 radiation stations have been sparsely deployed since 1961. Moreover, these radiation stations are seldom deployed in high-altitude regions and remote areas. Another issue is that radiation measurements in China often include erroneous and spurious values as well as missing data [33, 34]. Therefore, long-term and densely distributed solar radiation data are seldom available.
The objective of this study is to develop an effective method for regionalizing solar radiation estimation and then to produce a 50-year (1961–2010) daily surface solar radia-tion dataset at all CMA stations. First, we introduce a phys-ical model to estimate daily solar radiation at 716 CMA stations between 1961 and 2010. This model was developed to take advantages of the simplicity of the Ångström- Prescott model and the physical nature of the radiative transfer processes [26, 35], and thus is called a hybrid mod-el in the literature. Second, an ANN-based model is built at each radiation station. The ANN-based model is trained with reliable radiation data that are available in recent years (2003–2010) and then the trained model is used to estimate the daily solar radiation between 1961 and 2010 for each radiation station. This station data-based training makes the ANN-based model estimate more reliable than the hybrid model estimate. Third, we use the ANN-based estimate to correct the hybrid model estimate dynamically at a monthly scale and regionalize the correction, making it possible to derive a surface solar radiation dataset with high accuracy.
1 Dataset
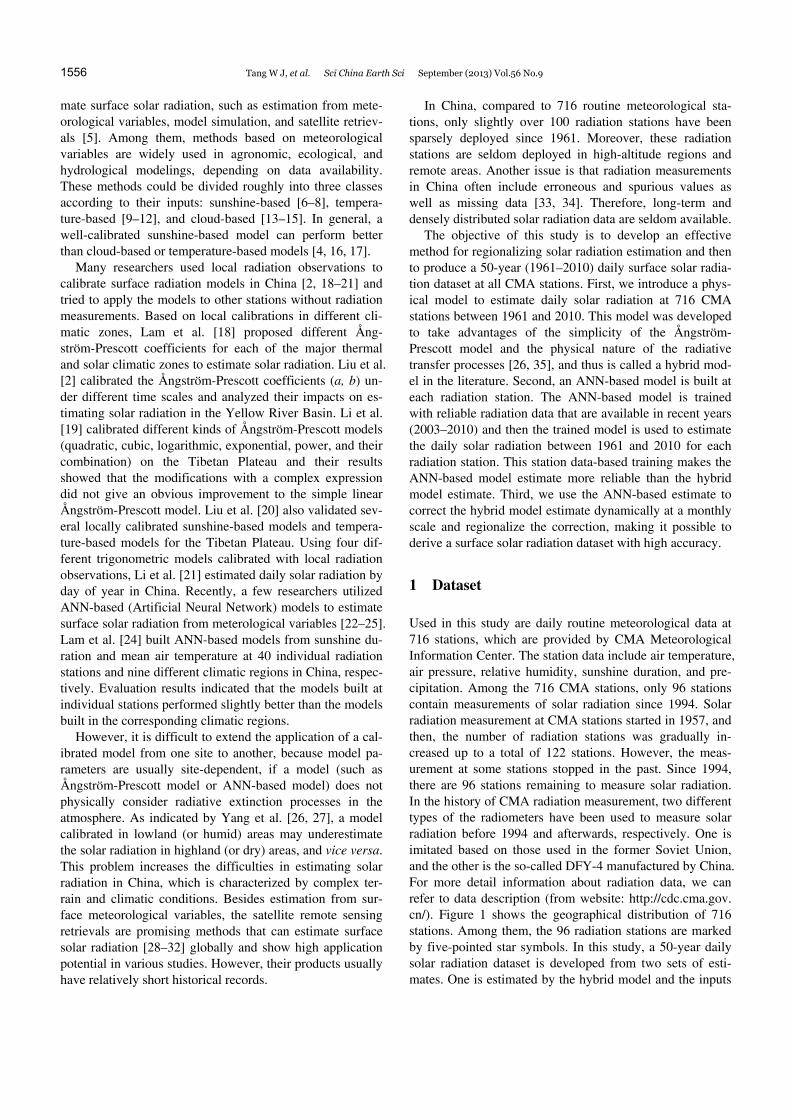
Used in this study are daily routine meteorological data at 716 stations, which are provided by CMA Meteorological Information Center. The station data include air temperature, air pressure, relative humidity, sunshine duration, and pre-cipitation. Among the 716 CMA stations, only 96 stations contain measurements of solar radiation since 1994. Solar radiation measurement at CMA stations started in 1957, and then, the number of radiation stations was gradually in-creased up to a total of 122 stations. However, the meas-urement at some stations stopped in the past. Since 1994, there are 96 stations remaining to measure solar radiation. In the history of CMA radiation measurement, two different types of the radiometers have been used to measure solar radiation before 1994 and afterwards, respectively. One is imitated based on those used in the former Soviet Union, and the other is the so-called DFY-4 manufactured by China. For more detail information about radiation data, we can refer to data description (from website: http://cdc.cma.gov. cn/). Figure 1 shows the geographical distribution of 716 stations. Among them, the 96 radiation stations are marked by five-pointed star symbols. In this study, a 50-year daily solar radiation dataset is developed from two sets of esti-mates. One is estimated by the hybrid model and the inputs

Tang W J, et al. Sci China Earth Sci September (2013) Vol.56 No.9 1557
Figure 1 The spatial distribution of 716 CMA stations, among which 96 radiation stations are denoted by five-pointed star symbols.
are air temperature, air pressure, relative humidity, and sunshine duration. The estimation is carried out at all 716 CMA stations. The other one is by the ANN-based model, which needs reliable radiation data to train the model, and thus it can only work at all 96 radiation stations. The two datasets are described below.
1.1 Daily solar radiation estimate at 716 CMA stations during 1961–2010
The hybrid model can reasonably model monthly, daily, and hourly solar radiation in both lowland and highland regions without local calibrations. Yang et al. [27] used this hybrid model to estimate solar radiation over the Tibetan Plateau and showed that their results are superior to two wide-ly-used satellite products (GEWEX-SRB [36] and ISSCP- FD [30]). Tang et al. [37] evaluated the hybrid model per-formance against quality-checked solar radiation data in China and showed that the model can estimate the surface solar radiation well over most of radiation stations. The de-tailed information of the hybrid model can be found in Yang et al. [26]. In this study, daily solar radiation dataset at 716 CMA stations between 1961 and 2010 is estimated by the hybrid model. A part of this dataset (the hybrid model esti-mate at 716 CMA stations from 1961 to 2006) has been used to analyze solar radiation variations in China in Tang et al. [37], which indicated that the dataset estimated by the hybrid model can detect the solar radiation trend, but the radiation values are slightly overestimated, compared with observations at some stations. In this study, we focus on eliminating the systematic biases in the dataset of the hybrid model estimate at 716 CMA stations from 1961 to 2010.
1.2 Daily solar radiation estimate at 96 radiation sta-tions during 1961–2010
Several problems exist in the observed daily solar radiation. One is data discontinuity. This is very common at most of the radiation stations. For example, among the 96 radiation stations, “complete records” (defined as a set of data which contains at least 20 days’ records in every month) between 1961 and 2006 are available only at 16 radiation stations. The other one is that there are obvious erroneous and spurious values in the original measurements at several stations, which had also been pointed out by Shi et al. [33] and Tang et al. [34]. Due to these deficiencies, the observed values are not suitable for correcting the hybrid model esti-mate. Alternatively, we introduce the ANN-based model to estimate the solar radiation from other meteorological vari-ables at each radiation station, and then utilize its estimate to correct the hybrid model estimate. The ANN-based mod-el can derive continuous time serials, and has higher accu-racy than the hybrid model estimate at each radiation station, since it is trained with recent reliable radiation data. In this study, the structure and type of the ANN-based model is the same as the one in Tang et al. [37]. The inputs of the ANN-based model are daily air temperature range, precipi-tation, sunshine duration, daily mean air temperature, air pressure, and relative humidity. To compare with previous estimates (section 3.3) effectively, we selected quality- controlled observation data between 2003 and 2010 to train the ANN-based model and data between 1994 and 2002 to validate the finial developed dataset at each of the 96 radia-tion stations. The trained model is then applied to estimate the daily solar radiation between 1961 and 2010 at each radiation station. Therefore, a daily solar radiation dataset
1558 Tang W J, et al. Sci China Earth Sci September (2013) Vol.56 No.9
for the 96 radiation stations between 1961 and 2010 is de-rived. This dataset will be used to correct the dataset esti-mated by the hybrid model at 716 CMA stations.
2 Correction method
The ANN-based model estimate is used to correct the hy-brid model estimate because the ANN-based model is trained with local radiation data whereas the hybrid model is not calibrated with radiation data over China. In order to build a solar radiation dataset with high accuracy, the fol-lowing three steps are taken:
Correction coefficients at the 96 radiation stations for each month between 1961 and 2010 were determined by the following expression:
ANN, monthly
hybrid, monthly
,RR (1)
where is the correction coefficient, RANN,monthly is the monthly-mean value of the ANN-based model estimate, and Rhybrid,monthly is the one of the hybrid model estimate.
The relationship between the correction coefficient and the stations’ geographical parameters (altitude, longitude, and latitude) for each month was given by the following function built by a feed-forward back-propagation (BP) neural network:
=f(alt, lon, lat), (2)
where alt, lon, and lat are the stations’ altitude, longitude, and latitude, respectively.
It is proven that any non-linear function can be repre-sented by a multilayer feed-forward network with a single hidden layer [38]. Furthermore, the Bayesian regularization training algorithm is generally superior to other training algorithms, and the best number of neurons in the single hidden layer is twice as much as the number of inputs vari-ables [39]. Therefore, the ANN in this section contains one hidden layer and one output layer. The hidden layer con-tains six neurons with hyperbolic tangent sigmoid transfer function as the transfer function, and the transfer function used for the neuron in the output is linear transfer function (“purelin”). The input layer includes three parameters, which are the stations’ altitude, longitude, and latitude. The target (or the output) of the ANN is the correction coeffi-cient defined in eq. (1). During the process of training, the Levenberg-Marquardt back-propagation optimization algo-rithm coupled with Bayesian regularization is used to train the ANN. For more details on the theoretical knowledge of ANN, we can refer to Neural Network Toolbox™ 6 User’s Guide [40].
The derived relation (eq. (2)) was applied to all 716 CMA stations according to their stations’ geographical pa-rameters, and the corrected dataset at 716 CMA stations was determined by the following expression assuming that the
correction coefficient for each station does not change within a month.
Rcorrected, daily=×Rhybrid, daily, (3)
where Rhybrid,daily is the daily value of the hybrid model esti-mate, and Rcorrected,daily is the corrected daily values.
3 Result evaluations
3.1 Evaluation of the corrected dataset
The new dataset is built after the hybrid model estimate at all 716 CMA stations has been corrected with the above procedures. The observed solar radiation dataset that con-tains nine years’ daily values during 1994–2002 at the 96 radiation stations, as shown in Figure 1, is selected to vali-date the new dataset. The observed dataset is quality- controlled according to quality-checked procedures of Tang et al. [33]. In order to evaluate the new radiation dataset, three indices of mean bias errors (MBE), root mean square errors (RMSE), and correlation coefficient (R) at each radi-ation station are calculated.
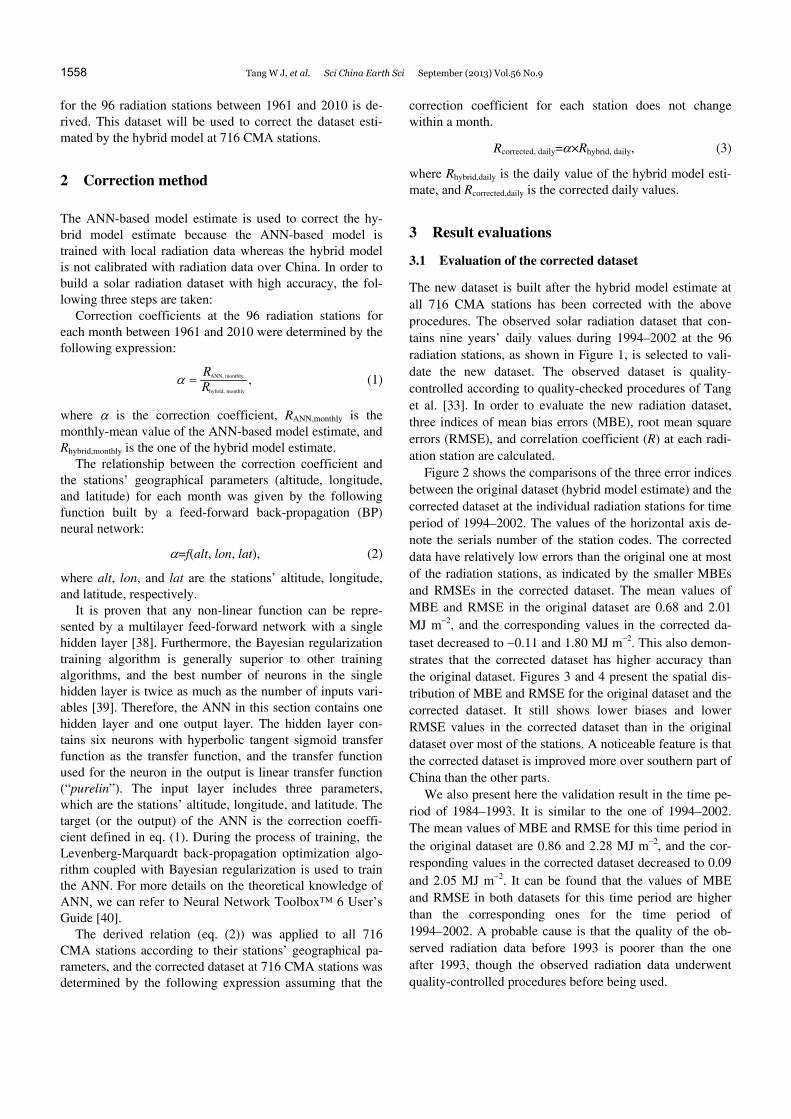
Figure 2 shows the comparisons of the three error indices between the original dataset (hybrid model estimate) and the corrected dataset at the individual radiation stations for time period of 1994–2002. The values of the horizontal axis de-note the serials number of the station codes. The corrected data have relatively low errors than the original one at most of the radiation stations, as indicated by the smaller MBEs and RMSEs in the corrected dataset. The mean values of MBE and RMSE in the original dataset are 0.68 and 2.01 MJ m2, and the corresponding values in the corrected da-taset decreased to 0.11 and 1.80 MJ m2. This also demon-strates that the corrected dataset has higher accuracy than the original dataset. Figures 3 and 4 present the spatial dis-tribution of MBE and RMSE for the original dataset and the corrected dataset. It still shows lower biases and lower RMSE values in the corrected dataset than in the original dataset over most of the stations. A noticeable feature is that the corrected dataset is improved more over southern part of China than the other parts.
We also present here the validation result in the time pe-riod of 1984–1993. It is similar to the one of 1994–2002. The mean values of MBE and RMSE for this time period in the original dataset are 0.86 and 2.28 MJ m2, and the cor-responding values in the corrected dataset decreased to 0.09 and 2.05 MJ m2. It can be found that the values of MBE and RMSE in both datasets for this time period are higher than the corresponding ones for the time period of 1994–2002. A probable cause is that the quality of the ob-served radiation data before 1993 is poorer than the one after 1993, though the observed radiation data underwent quality-controlled procedures before being used.

Tang W J, et al. Sci China Earth Sci September (2013) Vol.56 No.9 1559
Figure 2 The comparisons of three statistical indices between two datasets of before correction and after correction at each radiation station during 1994– 2002: (a) mean bias error (MBE), (b) root mean square error (RMSE) and (c) correlation coefficient (R).
Figure 3 Spatial distribution of MBE for daily solar radiation of two datasets during 1994–2002: (a) before correction, and (b) after correction. The diame-ter of the circles is corresponding to the size of MBE. The solid circle means that the MBE is greater than zero, and the open circle means that the MBE is less than zero.

1560 Tang W J, et al. Sci China Earth Sci September (2013) Vol.56 No.9
Figure 4 Similar to Figure 3, but for RMSE.
3.2 Estimation accuracy at stations without radiation observations
The above evaluation does not guarantee that the built ANN can be applied to correct the hybrid model estimates effec-tively at the stations without solar radiation measurements. In order to analyze this uncertainty, we separate the radia-tion stations into two groups: 86 stations are used to train the ANN radiation models and coefficient models (eq. (2)), and the remaining ten radiation stations are used to evaluate the performance of the ANN-based correction. Table 1 pre-sents the basic information of the ten stations that are se-lected for evaluation. They are located in different parts of China and generally have more improvements after correc-tion when all 96 radiation stations were used to train the ANN (eq. (2)). The estimates at the ten stations, if removed from the training stations, should have obviously lower ac-curacy if the correction method is not appropriate. In this
experiment, the procedure is the same as in section 2. First, the ANN radiation models are trained at the remaining 86 stations and the monthly-mean correction coefficients in eq. (1) are calculated. Second, the spatial distribution of the correction coefficients is constructed according to eq. (2) based on the values at the 86 stations. Third, the hybrid model estimate at all CMA stations (including the remain-ing ten radiation stations for evaluation) is corrected with the correction coefficients. Table 2 shows the performance at the ten stations for three datasets during 1994–2002, which are the original dataset (the hybrid model estimate), the dataset corrected by the 86 stations’ ANN-based model estimates (called the corrected dataset1), and the dataset corrected by the 96 stations’ ANN-based model estimates (called the corrected dataset2). As shown in Table 2, the two corrected datasets (except one station, Lhasa) generally have higher accuracy than the original dataset, though the three datasets produce the same R. Another characteristic is
Tang W J, et al. Sci China Earth Sci September (2013) Vol.56 No.9 1561
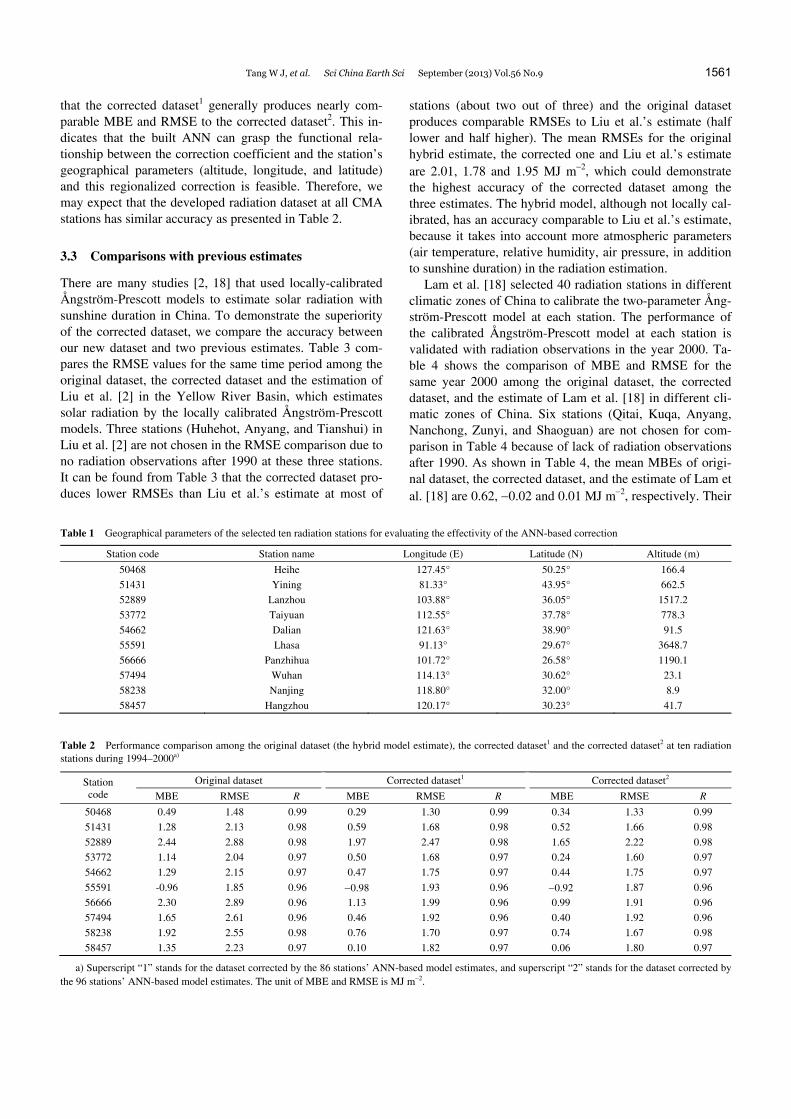
that the corrected dataset1 generally produces nearly com-parable MBE and RMSE to the corrected dataset2. This in-dicates that the built ANN can grasp the functional rela-tionship between the correction coefficient and the station’s geographical parameters (altitude, longitude, and latitude) and this regionalized correction is feasible. Therefore, we may expect that the developed radiation dataset at all CMA stations has similar accuracy as presented in Table 2.
3.3 Comparisons with previous estimates
There are many studies [2, 18] that used locally-calibrated Ångström-Prescott models to estimate solar radiation with sunshine duration in China. To demonstrate the superiority of the corrected dataset, we compare the accuracy between our new dataset and two previous estimates. Table 3 com-pares the RMSE values for the same time period among the original dataset, the corrected dataset and the estimation of Liu et al. [2] in the Yellow River Basin, which estimates solar radiation by the locally calibrated Ångström-Prescott models. Three stations (Huhehot, Anyang, and Tianshui) in Liu et al. [2] are not chosen in the RMSE comparison due to no radiation observations after 1990 at these three stations. It can be found from Table 3 that the corrected dataset pro-duces lower RMSEs than Liu et al.’s estimate at most of
stations (about two out of three) and the original dataset produces comparable RMSEs to Liu et al.’s estimate (half lower and half higher). The mean RMSEs for the original hybrid estimate, the corrected one and Liu et al.’s estimate are 2.01, 1.78 and 1.95 MJ m2, which could demonstrate the highest accuracy of the corrected dataset among the three estimates. The hybrid model, although not locally cal-ibrated, has an accuracy comparable to Liu et al.’s estimate, because it takes into account more atmospheric parameters (air temperature, relative humidity, air pressure, in addition to sunshine duration) in the radiation estimation.
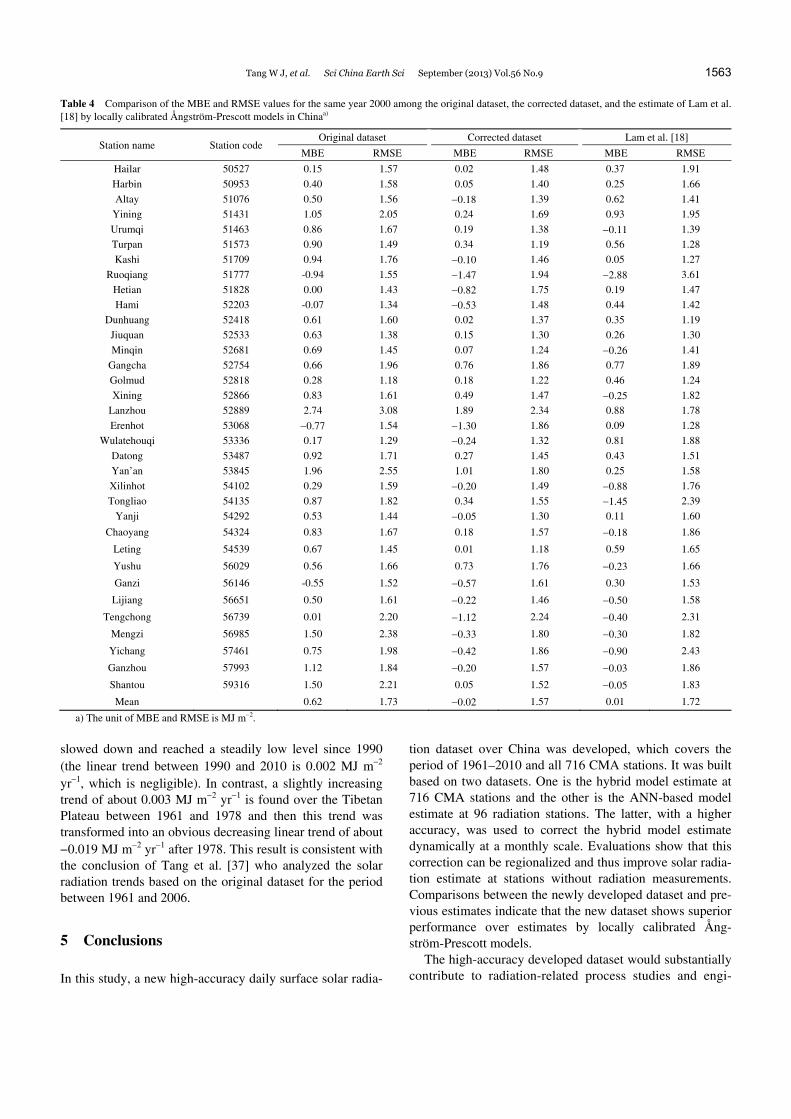
Lam et al. [18] selected 40 radiation stations in different climatic zones of China to calibrate the two-parameter Ång-ström-Prescott model at each station. The performance of the calibrated Ångström-Prescott model at each station is validated with radiation observations in the year 2000. Ta-ble 4 shows the comparison of MBE and RMSE for the same year 2000 among the original dataset, the corrected dataset, and the estimate of Lam et al. [18] in different cli-matic zones of China. Six stations (Qitai, Kuqa, Anyang, Nanchong, Zunyi, and Shaoguan) are not chosen for com-parison in Table 4 because of lack of radiation observations after 1990. As shown in Table 4, the mean MBEs of origi-nal dataset, the corrected dataset, and the estimate of Lam et al. [18] are 0.62, 0.02 and 0.01 MJ m2, respectively. Their
Table 1 Geographical parameters of the selected ten radiation stations for evaluating the effectivity of the ANN-based correction
Station code Station name Longitude (E) Latitude (N) Altitude (m)
50468 Heihe 127.45° 50.25° 166.4
51431 Yining 81.33° 43.95° 662.5
52889 Lanzhou 103.88° 36.05° 1517.2
53772 Taiyuan 112.55° 37.78° 778.3
54662 Dalian 121.63° 38.90° 91.5
55591 Lhasa 91.13° 29.67° 3648.7
56666 Panzhihua 101.72° 26.58° 1190.1
57494 Wuhan 114.13° 30.62° 23.1
58238 Nanjing 118.80° 32.00° 8.9
58457 Hangzhou 120.17° 30.23° 41.7
Table 2 Performance comparison among the original dataset (the hybrid model estimate), the corrected dataset1 and the corrected dataset2 at ten radiation stations during 1994–2000a)
Station code
Original dataset Corrected dataset1 Corrected dataset2
MBE RMSE R MBE RMSE R MBE RMSE R
50468 0.49 1.48 0.99 0.29 1.30 0.99 0.34 1.33 0.99
51431 1.28 2.13 0.98 0.59 1.68 0.98 0.52 1.66 0.98
52889 2.44 2.88 0.98 1.97 2.47 0.98 1.65 2.22 0.98
53772 1.14 2.04 0.97 0.50 1.68 0.97 0.24 1.60 0.97
54662 1.29 2.15 0.97 0.47 1.75 0.97 0.44 1.75 0.97
55591 -0.96 1.85 0.96 0.98 1.93 0.96 0.92 1.87 0.96
56666 2.30 2.89 0.96 1.13 1.99 0.96 0.99 1.91 0.96
57494 1.65 2.61 0.96 0.46 1.92 0.96 0.40 1.92 0.96
58238 1.92 2.55 0.98 0.76 1.70 0.97 0.74 1.67 0.98
58457 1.35 2.23 0.97 0.10 1.82 0.97 0.06 1.80 0.97
a) Superscript “1” stands for the dataset corrected by the 86 stations’ ANN-based model estimates, and superscript “2” stands for the dataset corrected by the 96 stations’ ANN-based model estimates. The unit of MBE and RMSE is MJ m2.

1562 Tang W J, et al. Sci China Earth Sci September (2013) Vol.56 No.9
Table 3 Comparison of the RMSE values (MJ m2) for the same time period among the original dataset, the corrected dataset, and the estimate of Liu et al. [2] by locally calibrated Ångström-Prescott models in the Yellow River Basin
Station name
Station code
Time period
Original dataset
Corrected dataset
Liu et al. [2]
Ejinaqi 52267 2001–2002 1.33 1.55 1.52
Dunhuang 52418 2000–2001 1.58 1.52 1.55
Minqin 52681 2001–2002 1.91 1.73 1.69
Gangcha 52754 2001–2002 1.78 1.78 1.39
Geermu 52818 2001–2002 1.33 1.37 1.86
Xining 52866 2001–2002 1.79 1.66 1.86
Lanzhou 52889 2001–2002 2.86 2.26 1.70
Erlianhaote 53068 1999–2000 1.63 1.84 1.79
Hailiutu 53336 2001–2002 1.55 1.54 1.98
Datong 53487 2001–2002 1.98 1.69 1.76
Dongsheng 53543 2001–2002 1.92 1.54 2.03
Yinchuan 53614 2001–-2002 1.68 1.54 1.81
Taiyuan 53772 2001–2002 2.05 1.65 2.56
Guyuan 53817 2001–2002 1.89 1.64 1.43
Yanan 53845 2001–2002 2.26 1.86 1.83
Houma 53963 2001–2002 2.4 1.68 1.90
Jinan 54823 2001–2002 2.88 2.04 1.74
Juxian 54936 1996–1997 1.88 1.84 1.78
Yushu 56029 2001–2002 1.92 1.91 2.15
Guoluo 56043 2001–2002 2.25 2.23 2.74
Changdu 56137 2001–2002 1.98 1.92 2.16
Ganzi 56146 2001–2002 1.56 1.57 2.31
Hongyuan 56173 2001–2002 2.22 2.21 1.69
Xian 57036 2001–2002 3.14 2.56 2.75
Zhengzhou 57083 2001–2002 1.91 1.69 1.99
Nanyang 57178 2001–2002 1.94 1.74 1.81
Ankang 57245 2001–2002 2.74 1.85 1.67
Gushi 58208 2001–2002 2.12 1.59 3.08
Mean 2.01 1.78 1.95
mean RMSEs are 1.73, 1.57 and 1.72 MJ m2, respectively. Again, the corrected dataset shows better accuracy than the other two.
In a word, the correction based on the hybrid model and the ANN-based model produces radiation estimates with higher accuracy than traditional methods do for China.
4 Solar radiation climatology and trend analy-sis over China
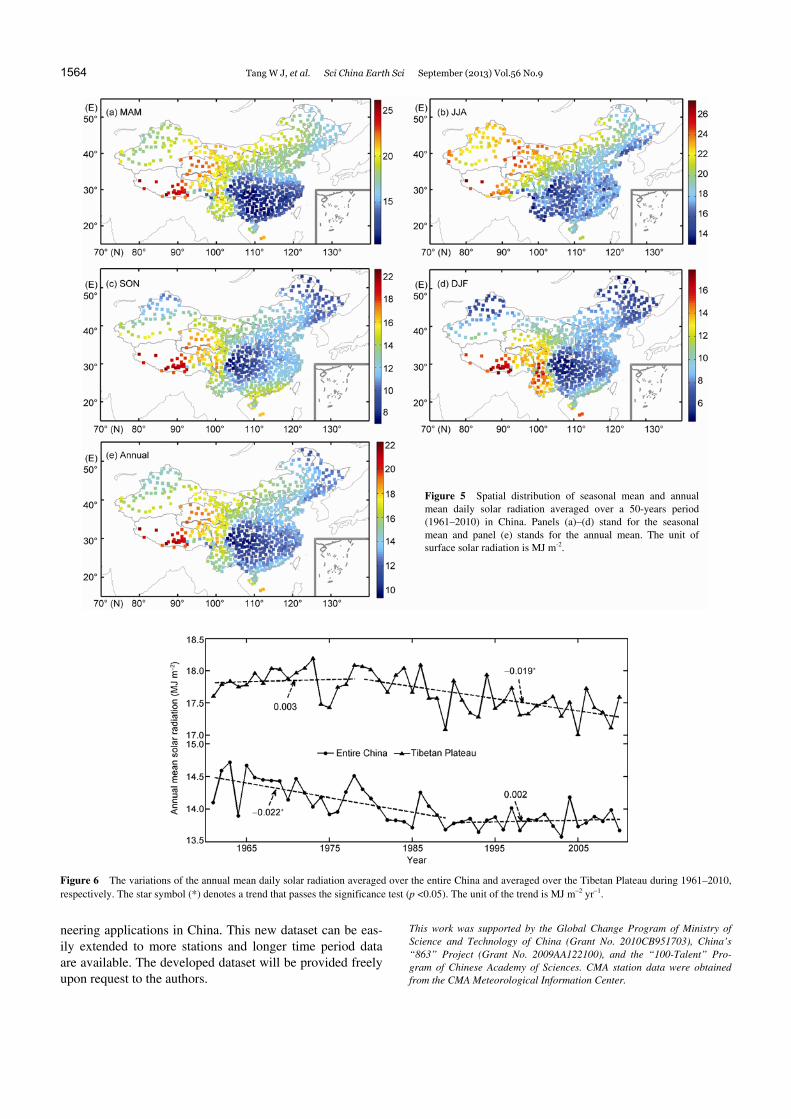
Based on the corrected 50-year (1961–2010) daily solar radiation dataset at 716 CMA stations, Figure 5 shows the spatial distribution of the seasonal mean and annual mean daily surface solar radiation over China averaged over the 50 years. Panels ((a)–(d)) denote the spatial distribution of the seasonal mean values for March, April, and May (MAM); June, July, and August (JJA); September, October, and November (SON); and December, January, and Febru-ary (DJF). Panel (e) denotes the spatial distribution of the annual mean values. As shown in the figure, the radiation values are largest in summer and lowest in winter, and in
between in spring and autumn. The distribution of radiation over China is extremely uneven, and the annual mean daily solar radiation over China is 14.3 MJ m2. Generally, the north of China has more radiation than the south of China, while the east of China has less radiation than the west of China. The highest seasonal mean daily solar radiation is 27.1 MJ m2 and occurs over the Tibetan Plateau in summer (JJA), whereas the lowest one is 4.7 MJ m2 and appears over the Sichuan Basin in winter (SON). This phenomenon can be easily explained. The average elevation of the Ti-betan Plateau is more than 4 km and thus radiation extinc-tion is small, whereas the Sichuan Basin is often covered by stratiform clouds and radiation extinction is large.
Moreover, based on the new dataset, Figure 6 shows the variations of the annual mean daily solar radiation averaged over the entire China and averaged over the Tibetan Plateau during 1961–2010, respectively. It can be found that the variation of solar radiation over the Tibetan Plateau is dif-ferent from that over the entire China. There is a decreasing linear trend of about 0.022 MJ m2 yr1, which is signifi-cant at a 95% level of confidence, over the entire China between 1961 and 1989, but then the decreasing trend
Tang W J, et al. Sci China Earth Sci September (2013) Vol.56 No.9 1563
Table 4 Comparison of the MBE and RMSE values for the same year 2000 among the original dataset, the corrected dataset, and the estimate of Lam et al. [18] by locally calibrated Ångström-Prescott models in Chinaa)
Station name Station code Original dataset Corrected dataset Lam et al. [18]
MBE RMSE MBE RMSE MBE RMSE
Hailar 50527 0.15 1.57 0.02 1.48 0.37 1.91
Harbin 50953 0.40 1.58 0.05 1.40 0.25 1.66
Altay 51076 0.50 1.56 0.18 1.39 0.62 1.41
Yining 51431 1.05 2.05 0.24 1.69 0.93 1.95
Urumqi 51463 0.86 1.67 0.19 1.38 0.11 1.39
Turpan 51573 0.90 1.49 0.34 1.19 0.56 1.28
Kashi 51709 0.94 1.76 0.10 1.46 0.05 1.27
Ruoqiang 51777 -0.94 1.55 1.47 1.94 2.88 3.61
Hetian 51828 0.00 1.43 0.82 1.75 0.19 1.47
Hami 52203 -0.07 1.34 0.53 1.48 0.44 1.42
Dunhuang 52418 0.61 1.60 0.02 1.37 0.35 1.19
Jiuquan 52533 0.63 1.38 0.15 1.30 0.26 1.30
Minqin 52681 0.69 1.45 0.07 1.24 0.26 1.41
Gangcha 52754 0.66 1.96 0.76 1.86 0.77 1.89
Golmud 52818 0.28 1.18 0.18 1.22 0.46 1.24
Xining 52866 0.83 1.61 0.49 1.47 0.25 1.82
Lanzhou 52889 2.74 3.08 1.89 2.34 0.88 1.78
Erenhot 53068 0.77 1.54 1.30 1.86 0.09 1.28
Wulatehouqi 53336 0.17 1.29 0.24 1.32 0.81 1.88
Datong 53487 0.92 1.71 0.27 1.45 0.43 1.51
Yan’an 53845 1.96 2.55 1.01 1.80 0.25 1.58
Xilinhot 54102 0.29 1.59 0.20 1.49 0.88 1.76
Tongliao 54135 0.87 1.82 0.34 1.55 1.45 2.39
Yanji 54292 0.53 1.44 0.05 1.30 0.11 1.60
Chaoyang 54324 0.83 1.67 0.18 1.57 0.18 1.86
Leting 54539 0.67 1.45 0.01 1.18 0.59 1.65
Yushu 56029 0.56 1.66 0.73 1.76 0.23 1.66
Ganzi 56146 -0.55 1.52 0.57 1.61 0.30 1.53
Lijiang 56651 0.50 1.61 0.22 1.46 0.50 1.58
Tengchong 56739 0.01 2.20 1.12 2.24 0.40 2.31
Mengzi 56985 1.50 2.38 0.33 1.80 0.30 1.82
Yichang 57461 0.75 1.98 0.42 1.86 0.90 2.43
Ganzhou 57993 1.12 1.84 0.20 1.57 0.03 1.86
Shantou 59316 1.50 2.21 0.05 1.52 0.05 1.83
Mean 0.62 1.73 0.02 1.57 0.01 1.72
a) The unit of MBE and RMSE is MJ m2.
slowed down and reached a steadily low level since 1990 (the linear trend between 1990 and 2010 is 0.002 MJ m2 yr1, which is negligible). In contrast, a slightly increasing trend of about 0.003 MJ m−2 yr−1 is found over the Tibetan Plateau between 1961 and 1978 and then this trend was transformed into an obvious decreasing linear trend of about −0.019 MJ m2 yr1 after 1978. This result is consistent with the conclusion of Tang et al. [37] who analyzed the solar radiation trends based on the original dataset for the period between 1961 and 2006.
5 Conclusions
In this study, a new high-accuracy daily surface solar radia-
tion dataset over China was developed, which covers the period of 1961–2010 and all 716 CMA stations. It was built based on two datasets. One is the hybrid model estimate at 716 CMA stations and the other is the ANN-based model estimate at 96 radiation stations. The latter, with a higher accuracy, was used to correct the hybrid model estimate dynamically at a monthly scale. Evaluations show that this correction can be regionalized and thus improve solar radia-tion estimate at stations without radiation measurements. Comparisons between the newly developed dataset and pre-vious estimates indicate that the new dataset shows superior performance over estimates by locally calibrated Ång-ström-Prescott models.
The high-accuracy developed dataset would substantially contribute to radiation-related process studies and engi-
1564 Tang W J, et al. Sci China Earth Sci September (2013) Vol.56 No.9
Figure 6 The variations of the annual mean daily solar radiation averaged over the entire China and averaged over the Tibetan Plateau during 1961–2010, respectively. The star symbol (*) denotes a trend that passes the significance test (p <0.05). The unit of the trend is MJ m2 yr1.
neering applications in China. This new dataset can be eas-ily extended to more stations and longer time period data are available. The developed dataset will be provided freely upon request to the authors.
This work was supported by the Global Change Program of Ministry of Science and Technology of China (Grant No. 2010CB951703), China’s “863” Project (Grant No. 2009AA122100), and the “100-Talent” Pro-gram of Chinese Academy of Sciences. CMA station data were obtained from the CMA Meteorological Information Center.
Figure 5 Spatial distribution of seasonal mean and annual mean daily solar radiation averaged over a 50-years period (1961–2010) in China. Panels (a)–(d) stand for the seasonal mean and panel (e) stands for the annual mean. The unit of surface solar radiation is MJ m-2.

Tang W J, et al. Sci China Earth Sci September (2013) Vol.56 No.9 1565
1 Thornton P E, Running S W. An improved algorithm for estimating incident daily solar radiation from measurements of temperature, hu-midity, and precipitation. Agric For Meteorol, 1999, 93: 211–228
2 Liu X Y, Mei X R, Li Y Z, et al. Calibration of the Ang-ström-Prescott coefficients (a, b) under different time scales and their impacts in estimating global solar radiation in the Yellow River basin. Agric For Meteorol, 2009, 149: 697–710
3 Moradi I. Quality control of global solar radiation using sunshine du-ration hours. Energy, 2009, 34: 1–6
4 Iziomon M G, Mayer H. Assessment of some global solar radiation parameterizations. J Atmos Solar-Terr Phys, 2002, 64: 1631–1643
5 Abraha M G, Savage M J. Comparison of estimates of daily solar ra-diation from air temperature range for application in crop simulations. Agric For Meteorol, 2008, 148: 401–416
6 Ångström A. Solar and terrestrial radiation. Q J R Meteorol Soc, 1924, 50: 121–125
7 Prescott J A. Evaporation from a water surface in relation to solar ra-diation. Trans Roy Soc Austr, 1940, 641: 114–125
8 Xu J Q, Masuda K, Ishigooka Y, et al. Estimation and verification of daily surface shortwave flux over China. J Meteorol Soc Jpn, 2011, 89A: 225–238
9 Bristow K L, Campbell G S. On the relationship between incoming solar radiation and daily maximum and minimum temperature. Agric For Meteorol, 1984, 31: 159–166
10 Meza F, Varas E. Estimation of mean monthly solar global radiation as a function of temperature. Agric For Meteorol, 2000, 100: 231–41
11 Liu D L, Scott B J. Estimation of solar radiation in Australia from rainfall and temperature observations. Agric For Meteorol, 2001, 106: 41–59
12 Liu X Y, Mei X R, Li Y Z, et al. Evaluation of temperature-based global solar radiation models in China. Agric For Meteorol, 2009, 149: 1433–1446
13 Reddy S J. An empirical method for estimating sunshine from total cloud amount. Sol Energy, 1974, 15: 281–285
14 Supit I, Kappel R R. A simple method to estimate global radiation. Sol Energy, 1998, 63: 147–160
15 Ehnberg J S G, Bollen M H J. Simulation of global solar radiation based on cloud observations. Sol Energy, 2005, 78: 157–62
16 Pohlert T. Use of empirical global radiation models for maize growth simulation. Agric For Meteorol, 2004, 126: 47–58
17 Almorox J, Hontoria C. Global solar radiation estimation using sun-shine duration in Spain. Energy Conv Manag, 2004, 45: 1529–1535
18 Lam J C, Wan K K W, Lau C C S, et al. Climatic influences on solar modelling in China. Renew Energy, 2008, 33: 1591–1604
19 Li H S, Ma W B, Lian Y W, et al. Global solar radiation estimation with sunshine duration in Tibet, China. Renew Energy, 2011, 36: 3141–3145
20 Liu J D, Liu J M, Linderholm H W, et al. Observation and calculation of the solar radiation on the Tibetan Plateau. Energy Conv Manag, 2012, 57: 23–32
21 Li H S, Ma W B, Lian Y W, et al. Estimating daily global solar radia-tion by day of year in China. Appl Energy, 2010, 87: 3011–3017
22 Tymvios F S, Jacovides C P, Michaelides S C, et al. Comparative study of Angström’s and artificial neural networks’ methodologies in estimating global solar radiation. Sol Energy, 2006, 78: 752–762
23 Mubiru J, Banda E J K B. Estimation of monthly average daily global solar irradiation using artificial neural networks. Sol Energy, 2008, 82: 181–187
24 Lam J C, Wan K K W, Yang L. Solar radiation modelling using ANNs for different climates in China. Energy Conv Manag, 2008, 49: 1080–1090
25 Jiang Y N. Computation of monthly mean daily global solar radiation in China using artificial neural networks and comparison with other empirical models. Energy, 2009, 34: 1276–1283
26 Yang K, Koike T, Ye B. Improving estimation of hourly, daily, and monthly downward shortwave radiation by importing global data sets. Agric For Meteorol, 2006, 137: 43–55
27 Yang K, He J, Tang W J, et al. On downward shortwave and longwave radiations over high altitude regions: Observation and modeling in the Tibetan Plateau. Agric For Meteorol, 2010, 150: 38–46
28 Pinker R T, Laszlo I. Modeling surface solar irradiance for satellite applications on a global scale. J Appl Meteorol, 1992, 31: 194–211
29 Zhang Y C, Rossow W B, Lacis A A. Calculation of surface and top of atmosphere radiative fluxes from physical quantities based on ISCCP data sets. 1. Method and sensitivity to input data uncertainties. J Geophys Res, 1995, 100(D1): 1149–1165
30 Zhang Y C, Rossow W B, Lacis A A, et al. Calculation of radiative fluxes from the surface to top of atmosphere based on ISCCP and other global data sets—refinements of the radiative transfer model and the input data. J Geophys Res, 2004, 109: D19105, doi: 10.1029/2003JD004457
31 Lu N, Liu R, Liu J, et al. An algorithm for estimating downward shortwave radiation from GMS 5 visible imagery and its evaluation over China. J Geophys Res, 2010, 115: D18102, doi: 10.1029/ 2009JD013457
32 Lu N, Qin J, Yang K, et al. A simple and efficient algorithm to esti-mate daily global solar radiation from geostationary satellite data. Energy, 2011, 36: 3179–3188, doi: 10.1016/j.energy.2011.03.007
33 Shi G Y, Hayasaka T, Ohmura A, et al. Data quality assessment and the long-term trend of ground solar radiation in China. J Appl Meteor Climatol, 2008, 47: 1006–1016
34 Tang W J, Yang K, He J, et al. Quality control and estimation of global solar radiation in China. Sol Energy, 2010, 84: 466–475
35 Yang K, Huang G W, Tamai N. A hybrid model for estimating global solar radiation. Sol Energy, 2001, 70: 13–22
36 Cox S J, Stackhouse P W, Gupta S K, et al. The NASA/GEWEX surface radiation budget project—Overview and analysis. In: The 12th Conference on Atmospheric Radiation, Madison, Wisconsin, USA, 2006, 10–14 July
37 Tang W J, Yang K, Qin J, et al. Solar radiation trend across China in recent decades: A revisit with quality-controlled data. Atmos Chem Phys, 2011, 11: 393–406, doi: 10.5194/acp-11-393-2011
38 Hornik K. Approximation capabilities of multilayer feedforward networks. Neural Networks, 1991, 4: 251–257
39 Qin J, Chen Z Q, Yang K, et al. Estimation of monthly mean daily global solar radiation based on MODIS and TRMM products over the Tibetan Plateau and its surroundings. Appl Energy, 2011, 88: 2480–2489
40 Demuth H, Beale M, Hagan M. Neural Network Toolbox 6 User Guide, 2008
Copyright © 2022 FDOKUMEN