KQA Pro: A Dataset with Explicit Compositional Programs for ...
Upload
khangminh22Category
view
3download
0
DrugOOD: Out-of-Distribution (OOD) Dataset Curatorand Benchmark for AI-aided Drug Discovery
– A Focus on Affinity Prediction Problems with Noise Annotations
Yuanfeng Ji1,3,∗ Lu Zhang1,2,∗ Jiaxiang Wu1 Bingzhe Wu1 Long-Kai Huang1
Tingyang Xu1 Yu Rong1 Lanqing Li1 Jie Ren1 Ding Xue1 Houtim Lai1
Shaoyong Xu1 Jing Feng1 Wei Liu1 Ping Luo3 Shuigeng Zhou2
Junzhou Huang1 Peilin Zhao1 Yatao Bian1†
1Tencent AI Lab, China2Fudan University, China
3The University of Hong Kong, China
January 25, 2022
Abstract
AI-aided drug discovery (AIDD) is gaining increasing popularity due to its promiseof making the search for new pharmaceuticals quicker, cheaper and more efficient. Inspite of its extensive use in many fields, such as ADMET prediction, virtual screening,protein folding and generative chemistry, little has been explored in terms of the out-of-distribution (OOD) learning problem with noise, which is inevitable in real world AIDDapplications.
In this work, we present DrugOOD1, a systematic OOD dataset curator and bench-mark for AI-aided drug discovery, which comes with an open-source Python packagethat fully automates the data curation and OOD benchmarking processes. We focus onone of the most crucial problems in AIDD: drug target binding affinity prediction, whichinvolves both macromolecule (protein target) and small-molecule (drug compound). Incontrast to only providing fixed datasets, DrugOOD offers automated dataset curator withuser-friendly customization scripts, rich domain annotations aligned with biochemistryknowledge, realistic noise annotations and rigorous benchmarking of state-of-the-artOOD algorithms. Since the molecular data is often modeled as irregular graphs usinggraph neural network (GNN) backbones, DrugOOD also serves as a valuable testbed forgraph OOD learning problems. Extensive empirical studies have shown a significant per-formance gap between in-distribution and out-of-distribution experiments, which high-lights the need to develop better schemes that can allow for OOD generalization undernoise for AIDD.
Keywords: AI-aided drug discovery (AIDD), graph OOD learning, OOD generaliza-tion, learning under noise, binding affinity prediction, drug-target interaction, virtualscreening
∗Equal contribution. Order was determined by tossing a coin.†Correspondence to: Yatao Bian, email: [email protected]
1. Project Page: https://drugood.github.io
arX
iv:2
201.
0963
7v1
[cs
.LG
] 2
4 Ja
n 20
22
Contents
1 Introduction 3
2 Background and Related Work 52.1 Binding Affinity Prediction in AI-aided Drug Discovery . . . . . . . . . . . . . . . . . . . . . . . 6
2.1.1 Databases . . . . . . . . . . . . . . . . . . . . . . . . . . . . . . . . . . . . . . . . . . . . . . 62.1.2 Methods . . . . . . . . . . . . . . . . . . . . . . . . . . . . . . . . . . . . . . . . . . . . . . . 72.1.3 Discussions . . . . . . . . . . . . . . . . . . . . . . . . . . . . . . . . . . . . . . . . . . . . . 8
2.2 General OOD Databases . . . . . . . . . . . . . . . . . . . . . . . . . . . . . . . . . . . . . . . . . . 82.3 Benchmark Scheme . . . . . . . . . . . . . . . . . . . . . . . . . . . . . . . . . . . . . . . . . . . . . 9
2.3.1 General Methods for OOD and Noisy Labels . . . . . . . . . . . . . . . . . . . . . . . . . . 92.3.2 Representation Learning for Affinity Prediction . . . . . . . . . . . . . . . . . . . . . . . . 11
3 Automated Dataset Curator with Real-world Domain and Noise Annotations 123.1 Filtering Data with Different Noise Levels . . . . . . . . . . . . . . . . . . . . . . . . . . . . . . . . 133.2 Processing Uncertainty and Multiple Measurements . . . . . . . . . . . . . . . . . . . . . . . . . . 143.3 Binary Classification Task with Adaptive Threshold . . . . . . . . . . . . . . . . . . . . . . . . . . 143.4 Domain Definition and Split . . . . . . . . . . . . . . . . . . . . . . . . . . . . . . . . . . . . . . . . 15
3.4.1 Domain Definition . . . . . . . . . . . . . . . . . . . . . . . . . . . . . . . . . . . . . . . . . 153.4.2 Domain Split . . . . . . . . . . . . . . . . . . . . . . . . . . . . . . . . . . . . . . . . . . . . 15
3.5 Overview of the Dataset Curation Pipeline . . . . . . . . . . . . . . . . . . . . . . . . . . . . . . . 17
4 Benchmarking State-of-the-art OOD Algorithms 174.1 Architecture Design . . . . . . . . . . . . . . . . . . . . . . . . . . . . . . . . . . . . . . . . . . . . . 184.2 Domain Generalization Algorithms . . . . . . . . . . . . . . . . . . . . . . . . . . . . . . . . . . . 19
5 Implementations and Package Usage 215.1 Dataset Curation . . . . . . . . . . . . . . . . . . . . . . . . . . . . . . . . . . . . . . . . . . . . . . 225.2 Dataset Loading . . . . . . . . . . . . . . . . . . . . . . . . . . . . . . . . . . . . . . . . . . . . . . . 235.3 Algorithm Configuration . . . . . . . . . . . . . . . . . . . . . . . . . . . . . . . . . . . . . . . . . . 24
6 Empirical Studies 256.1 Ligand Based Affinity Prediction (LBAP) . . . . . . . . . . . . . . . . . . . . . . . . . . . . . . . . 25
6.1.1 Setup . . . . . . . . . . . . . . . . . . . . . . . . . . . . . . . . . . . . . . . . . . . . . . . . . 256.1.2 Baseline Results . . . . . . . . . . . . . . . . . . . . . . . . . . . . . . . . . . . . . . . . . . . 286.1.3 Performance Drops of Different Domains . . . . . . . . . . . . . . . . . . . . . . . . . . . . 306.1.4 Performance Drops of Different Noise Levels . . . . . . . . . . . . . . . . . . . . . . . . . 30
6.2 Structure Based Affinity Prediction (SBAP) . . . . . . . . . . . . . . . . . . . . . . . . . . . . . . . 316.2.1 Setup . . . . . . . . . . . . . . . . . . . . . . . . . . . . . . . . . . . . . . . . . . . . . . . . . 316.2.2 Model . . . . . . . . . . . . . . . . . . . . . . . . . . . . . . . . . . . . . . . . . . . . . . . . 316.2.3 Baseline Results . . . . . . . . . . . . . . . . . . . . . . . . . . . . . . . . . . . . . . . . . . . 316.2.4 Performance Gap of Different Domains . . . . . . . . . . . . . . . . . . . . . . . . . . . . . 326.2.5 Study for Different Noise Levels . . . . . . . . . . . . . . . . . . . . . . . . . . . . . . . . . 336.2.6 Study for Different Measurement Types . . . . . . . . . . . . . . . . . . . . . . . . . . . . . 34
7 Discussions and Future Work 34
A Statistics of the Realized Datasets 51
2

1. Introduction
The traditional drug discovery process is extremely time-consuming and expensive. Typ-ically, the development of a new drug takes nearly a decade and costs about $3 billion(Pushpakom et al., 2019), whereas about 90% of experimental drugs fail during lab, ani-mal or human testing. Meanwhile, the number of drugs approved every year per dollarspent on development has plateaued or decreased for most of the past decade (Nosengo,2016). To accelerate the development for new drugs, drugmakers and investors turn theirattention to artificial intelligence (Muratov et al., 2020) techniques for drug discovery,which aims at rapidly identifying new compounds and modeling complex mechanismsin the body to automate previously manual processes (Schneider, 2018).
The applications of AI aided drug discovery is being continuously extended in thepharmaceutical field, ranging from ADMET prediction (Wu et al., 2018; Rong et al., 2020),target identification (Zeng et al., 2020; Mamoshina et al., 2018), protein structure predic-tion and protein design (Jumper et al., 2021; Baek et al., 2021; Gao et al., 2020), retrosyn-thetic analysis (Coley et al., 2017; Segler et al., 2018; Yan et al., 2020a), search of antibiotics(Stokes et al., 2020), generative chemistry (Sanchez-Lengeling et al., 2017; Simonovsky &Komodakis, 2018), drug repurposing for emerging diseases (Gysi et al., 2021) to virtualscreening (Hu et al., 2016; Karimi et al., 2019; Lim et al., 2019). Among them, virtualscreening is one of the most important yet challenging applications. The aim of virtualscreening is to pinpoint a small set of compounds with high binding affinity for a giventarget protein in the presence of a large number of candidate compounds. A crucial taskin solving the virtual screening problem is to develop computational approaches to pre-dict the binding affinity of a given drug-target pair, which is the main task studied in thispaper.
In the field of AI-aided drug discovery, the problem of distribution shift, where thetraining distribution differs from the test distribution, is ubiquitous. For instance, whenperforming virtual screening for hit finding, the prediction model is typically trained onknown target proteins. However, a “black swan” event like COVID-19 can occur, resultingin a new target with unseen data distribution. The performance on the new target willsignificantly degrades. To handle the performance degradation (Koh et al., 2021) causedby distribution shift, it is essential to develop robust and generalizable algorithms for thischallenging setting in AIDD. Despite its importance in the real-world problem, curatedOOD datasets and benchmarks are currently lacking in addressing generalization in AI-aided drug discovery.
Another essential issue in the field of AI-aided drug discovery is the label noise. TheAI model are typical trained on public datasets, such as ChEMBL, whereas the bioassaydata in the dataset are often noisy (Kramer et al., 2012; Cortés-Ciriano & Bender, 2016).For example, the activity data provided in ChEMBL is extracted manually from full textarticles in seven Medicinal Chemistry journals (Mendez et al., 2019). Various factorscan cause noise in the data provided in ChEMBL, including but not limited to differentconfidence levels for activities measured through experiments, unit-transcription errors,repeated citations of single measurements and different “cut-off” noise2. Figure 1 shows
2. E.g., measurements could be recorded with <, ≤, ≈, >, ≥ etc, which would introduce the “cut-off” noisewhen translated into supervision labels.
3

Data Curator
Trai
nTe
st
Assay Domain
x =
y = activate d = assay 311
x =
y = inactivate d = assay 1323
…
x =
y = activate d = assay 0
x =
y = activate d = assay 310
…
Scaffold Domain
x =
y = activate d = scaffold
24112
x =
y = activate d = scaffold
34806
…
x =
y = inactivate d = scaffold 0
x =
y = activate d = scaffold
24111
…
Molecular Size Domain
x =
y = activate d = size 229
x =
y = inactivate d = size 250
…
x =
y = inactivate d = size 0
x =
y = activate d = size 228
…
ChEMBL
… … …
Core
Refined
General x =
y = activate c = 0.99
x =
y = activate c = 0.88
x =
y = activate c = 0.79
x =
y = activate c = 0.77
x =
y = activate c = 0.42
x =
y = activate c = 0.41
Noi
se
Figure 1: DrugOOD provides large-scale, realistic, and diverse datasets for Drug AI OODresearch. Specifically, DrugOOD focuses on the problem of domain generalization, in whichwe train and test the model on disjoint domains, e.g., molecules in a new assay environ-ment. Top Left: Based on the ChEMBL database, we present an automated dataset curatorfor customizing OOD datasets flexibly. Top Right: DrugOOD releases realized exemplardatasets spanning different domain shifts. In each dataset, each data sample (x, y, d) isassociated with a domain annotation d. We use the background colours blue and greento denote the seen data and unseen test data. Bottom: Examples with different noise lev-els from the DrugOOD dataset. DrugOOD identifies and annotates three noise levels (left toright: core, refined, general) according to several criteria, and as the level increases, datavolume increases and more noisy sources are involved.
examples with different noisy levels. Meanwhile, real world data with noise annotationsis lacking for learning tasks under noise labels (Angluin & Laird, 1988; Han et al., 2020).
To help accelerate research by focusing community attention and simplifying sys-tematic comparisons between data collection and implementation method, we presentDrugOOD, a systematic OOD dataset curator and benchmark for AI-aided drug discoverywhich comes with an open-source Python package that fully automates the data cura-tion process and OOD benchmarking process. We focus on the most challenging OODsetting: domain generalization (Zhou et al., 2021b) problem in AI-aided drug discovery,though DrugOOD can be easily adapted to other OOD settings, such as subpopulation shift(Koh et al., 2021) and domain adaptation (Zhuang et al., 2020). Our dataset is also thefirst AIDD dataset curator with realistic noise annotations, that can serve as an importanttestbed for the setting of learning under noise.
Notably, we present an automated dataset curator based on the large-scale bioassaydeposition website ChEMBL (Mendez et al., 2019), in contrast to just providing a set ofcurated datasets. Figure 2 gives an overview of the automated dataset curator. Using thisdataset curator, potential researchers/practitioners can generate new OOD datasets basedon their specific needs by simply re-configuring the curation process, i.e., modifying the
4

YAML files in the python package. Specifically, we also realize this dataset curator bygenerating 96 OOD datasets spanning various domains, noise annotations and measure-ment types. This mechanism comes with two advantages: i) It ensures that our releaseddatasets and benchmarks are fully reproducible. ii) It allows great flexibility for futureusage since it is often difficult, even for domain experts, to agree on one specific config-uration. As an example, using EC50 as a measure of affinity, agreeing on a threshold forpartitioning to find active/inactive pairs may be challenging.
As OOD learning subsumes or is closed related to other learning settings with distri-bution shift, such as domain adaption (Zhuang et al., 2020), transfer learning (Pan & Yang,2009), and zero-shot learning (Romera-Paredes & Torr, 2015; Wang et al., 2019b), DrugOODcan also serve as a benchmark dataset or be used to generate datasets to study affinityprediction problems in AIDD under these learning settings. The following componentssummarize our major contributions:
1. Automated Dataset Curator: We provide a fully customizable pipeline for curatingOOD datasets for AI-aided drug discovery from the large-scale bioassay depositionwebsite ChEMBL.
2. Rich domain annotations: We present various approaches to generate specific domainsthat are aligned with the domain knowledge of biochemistry.
3. Realistic noise annotations: We annotate real-world noise according to the measure-ment confidence score, “cut-off” noise etc, offering a valuable testbed for learningunder real-world noise.
4. Rigorous OOD benchmarking: We benchmark six SOTA OOD algorithms with variousbackbones for the 96 realized dataset instances and gain insight into OOD learningunder noise for AIDD.
Paper Organizations. Section 2 presents background and related work on AI-aideddrug discovery, existing OOD algorithms, datasets, benchmarks and affinity prediction-related materials. In Section 3 we provide details on the automated dataset curator withreal-world domain and noise annotations. We present specifics on benchmarking SOTAOOD algorithms in Section 4. Section 5 gives implementation details and package usageguidelines. We present experimental results and corresponding discussions in Section 6.Lastly, Section 7 discusses and concludes the paper.
2. Background and Related Work
In this section, we review the current progress in binding affinity prediction problems,one of highly active research areas in AIDD. The performance of affinity prediction isoften limited by OOD issues and noisy labels, which motivates us to propose the DrugOODdatabase to explicitly tackle such problems. Lastly, we summarize general methods forOOD and noisy labels, together with representation learning for affinity prediction forvirtual screening, which are later used for benchmark tests on the DrugOOD datasets.
5

2.1 Binding Affinity Prediction in AI-aided Drug Discovery
The ability of AI techniques has been dramatically boosted in various domains, mainlydue to wide-spread applications of deep neural networks. We have witnessed a grow-ing number of researches attempting to solve traditional problems in the drug discov-ery with more advanced AI models. There have been several surveys (Sliwoski et al.,2013; Jing et al., 2018; Yang et al., 2019b; Paul et al., 2021; Deng et al., 2021; Bender &Cortés-Ciriano, 2021) summarizing recent advances and problems in this area, coveringkey aspects including major applications, representative techniques, and critical assess-ment benchmarks.
As pointed out in (Yang et al., 2019b; Paul et al., 2021), most of AI-driven applicationscan be roughly categorized into two domains, i.e., molecule generation and moleculescreening. Molecule generation aims at adopting generative models to produce a largepool of candidate drug molecules with certain restraints satisfied (Simonovsky & Ko-modakis, 2018; Sanchez-Lengeling et al., 2017; Satorras et al., 2021). On the other hand,molecule screening attempts to identify the most promising molecule(s) based on a widerange of predicted properties (Yang et al., 2019a; Feinberg et al., 2020; Jiménez et al., 2018).Other typical applications of AI techniques in drug discovery include target identification(Zeng et al., 2020; Mamoshina et al., 2018), target structure prediction (Jumper et al., 2021;Baek et al., 2021), drug re-purposing (Aliper et al., 2016; Issa et al., 2021; Pham et al., 2021),and molecule retrosynthesis (Coley et al., 2017; Zheng et al., 2019; Chen et al., 2020).
For conducting virtual screening on candidate molecules, both target-independent(e.g. ADMET) and target-dependent (e.g. binding affinity) properties are critical. Theformer ones measure how likely the molecule itself is qualified as a candidate drug, forinstance, it should not induce severe liver toxicity to human (Zhang et al., 2016; Asilaret al., 2020). On the other hand, target-dependent properties consider the tendency of itspotential interaction with the target (and other unrelated proteins), which often heavilydepends on the joint formulation of candidate molecule and target (Hu et al., 2016; Karimiet al., 2019; Lim et al., 2019). In this paper, we mainly concentrate on the binding affinitybetween molecule and protein target, which falls into the domain of predicting target-dependent properties. In this circumstance, the out-of-distribution issue may result insevere performance degradation (e.g., when the target distribution dramatically differsbetween model training and inference), which leads to the major motivation of this paper.
2.1.1 Databases
ChEMBL (Davies et al., 2015; Mendez et al., 2019) is a large-scale open-access databaseconsists of small molecules and their biological activity data. Such information is mainlyextracted from medicinal chemistry journal articles, supplemented with data collectedfrom approved drugs and clinical development candidates. It now contains over 2.1million distinct compounds and 18.6 million records of their activities, which involveover 14,500 targets.
BindingDB (Gilson et al., 2016) collects experimental interaction data between proteinsand small molecules, primarily from scientific articles and US patents. BindingDB alsogathers selected data entries from other related databases, including PubChem (Wanget al., 2009), ChEMBL (Mendez et al., 2019), PDSP Ki (Roth et al., 2000), and CSAR (Carl-
6

son & Dunbar Jr, 2011). Advanced search tools, hypothesis generation schemes (fromtargets to compounds and vice versa), and virtual compound screening methods are alsointegrated in the database.
PDBbind (Liu et al., 2014) is created to collect biomolecular complexes from the PDBdatabase (Burley et al., 2020), with experimental binding affinity data curated from orig-inal reference papers. The latest release of PDBbind (version 2020) consists of over23,000 biomolecular complexes, whose majority are protein-ligand complexes (19,443)and protein-protein complexes (2,852), and the remaining part are mainly protein-nucleicacid and nucleic acid-ligand complexes.
2.1.2 Methods
It is often critical to access the target structure before estimating the affinity of candidatemolecules, since the affinity is jointly determined by the interaction between moleculeand target. Depending on the availability of known target structures, affinity predictionmethods can be roughly divided into two categories: ligand-based and structure-based.
Ligand-based affinity prediction (LBAP). Based on the hypothesis that structurallyanalogous compounds tend to have similar biological activities (Johnson & Maggiora,1990), ligand-based affinity prediction methods are developed. The ultimate goal is toidentify promising compounds from a large candidate library, based on their similaritiesto known active compounds for an interested target. Several approaches are proposed tofilter compounds based on chemical similarity measurements, e.g., Tanimoto coefficients(Kim & Skolnick, 2008) and similarity ensemble approach (SEA) (Keiser et al., 2007).Such methods heavily rely on hand-crafted or learnt compound representations, describ-ing various properties including molecule weight, geometry, volume, surface areas, ringcontent, etc. On the other hand, quantitative structure-activity relationship (QSAR) basedapproaches attempt to explicitly formulate the relationship between structural proper-ties of chemical compounds and their biological activities (Kwon et al., 2019). Variousmachine learning techniques have been cooperated with QSAR-based affinity prediction,including linear regression (Luco & Ferretti, 1997), random forest (Svetnik et al., 2003),support vector machine (Zakharov et al., 2016), and neural networks (Burden & Winkler,1999; Pradeep et al., 2016). Particularly, multi-task neural networks (Dahl et al., 2014) al-leviate the over-fitting issue by optimizing over multiple bioassasys simultaneously, andwas adopted to achieve the best performance in the Merck Molecular Activity Challenge3.
Despite the satisfying performance of ligand-based affinity prediction approaches incertain scenarios, they do not take target structures in consideration. However, the in-teraction between target and molecule is indeed essential in accurately predicting thebinding affinity, which leads more and more researches to focus on structure-based affin-ity prediction.
Structure-based affinity prediction (SBAP). In contrast to ligand-based approaches,structure-based methods (Lim et al., 2021) usually take structures of protein targets and/orprotein-ligand complexes as inputs for affinity prediction. Some work (Wallach et al.,
3. Merck Molecular Activity Challenge: https://www.kaggle.com/c/MerckActivity
7

2015; Li et al., 2021b) predicts the binding affinity from experimentally determined protein-ligand co-crystal structures, but such data is highly expensive and time-consuming to ob-tain in practice. Others turn to computation-based docking routines (Trott & Olson, 2010;Koes et al., 2013; McNutt et al., 2021; Bao et al., 2021) to estimate protein-ligand com-plex structures through sampling and ranking, and then formulate the structure-affinityrelationship via various models.
Ballester & Mitchell (2010) propose the RF-Score approach to use random forest toimplicitly capture binding effects based on a series of carefully designed hand-crafted fea-tures. 3D convolutional neural networks are adopted in (Stepniewska-Dziubinska et al.,2018; Jiménez et al., 2018), where protein-ligand complex structures are discretized into3D voxels and then fed into the model for affinity prediction. However, such discretiza-tion fails to capture the 3D rotational and translational invariance of 3D structures, andthus relies on heavy data augmentation to overcome such limitations. Graph neural net-works are adopted in Jiang et al. (2021) to simultaneously formulate the intra-molecularand inter-molecular interactions, where nodes correspond to ligand/protein atoms, andedges are defined by both covalent and non-covalent linkages.
2.1.3 Discussions
For most machine learning based approaches, it is usually desirable that the data distribu-tion of training and evaluation subsets are as close as possible. However, this often doesnot hold true for affinity prediction tasks, e.g., the scaffold of small molecules and/orfamily of protein targets encountered during inference may be unseen throughout themodel training process. Simply dividing the database into training and evaluation sub-sets on a per target-molecule basis may lead to over-optimistic performance, which isunrealistic for real-world applications.
Nonetheless, most databases for experimental binding affinities do not provide anofficial data split or its generation pipeline for model training and evaluation. To makethings even more complicated, binding affinity annotations could be highly noisy, dueto different experimental settings, affinity measurements, and confidence scores. Re-searchers need to manually pre-process raw data entries and re-organize them into thestandard format, which is not only laborious and burdensome, but also unfavorable fora fair comparison against existing baselines. Therefore, we propose DrugOOD as a highlycustomizable curator for OOD datasets with noisy labels explicitly considered, so as topromote more efficient development of affinity prediction approaches in AIDD.
2.2 General OOD Databases
The out-of-distribution issue has attracted an ever-growing research interest in recentyears, due to its importance in improving the generalization ability in real-world ap-plications. Several databases have been constructed with great emphasis placed on theout-of-distribution generalization performance, mainly consist of computer vision andnatural language processing tasks.
In Koh et al. (2021), the WILDS benchmark is proposed to reflect various levels ofdistribution shifts that may occur in real-world scenarios. It considers two common typesof distribution shifts: domain generalization and sub-population shift. A total of 10
8

datasets are included, covering shifts across cameras for wildlife monitoring, hospitals fortumor identification, users for product rating estimation, andƒ scaffolds for biochemicalproperty prediction, etc. Sagawa et al. (2021) further extend this database to includeunlabeled data for unsupervised domain adaptation.
DomainBed (Gulrajani & Lopez-Paz, 2020) consists of 7 multi-domain image classifica-tion datasets, including Colored MNIST (Arjovsky et al., 2019), Rotated MNIST (Ghifaryet al., 2015), PACS (Li et al., 2017), VLCS (Fang et al., 2013), Office-Home (Venkateswaraet al., 2017), Terra Incognita (Beery et al., 2018), and DomainNet (Peng et al., 2019). Fur-thermore, authors point out the importance of model selection strategy in the domaingeneralization task, and conduct thorough benchmark tests over 9 baseline algorithmsand 3 model selection criteria. As it turns out, empirical risk minimization (ERM) (Vap-nik, 1999) with a careful implementation achieves state-of-the-art performance across alldatasets, even when compared against various domain generalization algorithms.
Ye et al. (2021) analyze the performance comparison between ERM and domain gener-alization algorithms on DomainBed, and point out that the distribution shift is composedof diversity shift and correlation shift, and existing domain generalization algorithms areonly optimized towards one of them. They further propose additional datasets, of whichWILDS-Camelyon17 (Koh et al., 2021) is dominated by diversity shift, and NICO (Heet al., 2021) and CelebA (Liu et al., 2015) are dominated by correlation shift.
As described above, general OOD databases are mostly built with image and textdata, with one exception being the ODGB-MolPCBA dataset from WILDS (Koh et al.,2021), which aims at predicting biochemical properties from molecular graphs. The dis-tribution shift is mainly caused by disjoint molecular scaffolds between training and testsubsets. This is indeed critical for accurate prediction of target-independent properties,but is still insufficient for affinity prediction where the target information should be ex-plicitly exploited. TDC (Huang et al., 2021) as another concurrent AIDD benchmark, of-fers SBAP datasets collated from BindingDB with a temporal split by patent year between2013-2021, which is still limited in scope for drug OOD problems. In contrast, DrugOODcovers comprehensive sources of out-of-distribution in affinity prediction, and provides adataset curator for highly customizable generation of OOD datasets. Additionally, noisyannotations are taken into consideration, so that algorithms can be evaluated in a morerealistic setting, which further bridges the gap between researches and pharmaceuticalapplications.
2.3 Benchmark Scheme
In additional to an automated dataset curator in DrugOOD, we also provide rigorous bench-mark tests over state-of-the-art OOD algorithms, with graph neural networks and BERT-like models used for representation learning from structural and sequential data. Next,we briefly review these OOD and representation learning algorithms, while more detaileddescriptions can be found in Section 4.
2.3.1 General Methods for OOD and Noisy Labels
The out-of-distribution and noisy label issues have been extensively studied in the ma-chine learning community, due to their importance in improving the generalization ability
9

and robustness. Here, we summarize recent progress in these two areas respectively, witha few overlaps since some approaches are proposed to jointly tackle these two issues inone shot.
Methods for OOD. To improve the model generalization ability over out-of-distributiontest samples, some work focuses on aligning feature representations across different do-mains. The minimization of feature discrepancy can be conducted over various distancemetrics, including second-order statistics (Sun & Saenko, 2016), maximum mean discrep-ancy (Tzeng et al., 2014) and Wasserstein distance (Zhou et al., 2021b), or measured byadversarial networks (Ganin et al., 2016). Others apply data augmentation to generatenew samples or domains to promote the consistency of feature representations, such asMixup across existing domains (Xu et al., 2020; Yan et al., 2020b), or in an adversarialmanner (Zhao et al., 2020; Qiao et al., 2020).
With the label distribution further taken into consideration, recent work aims at en-hancing the correlation between domain-invariant representations and labels. For in-stance, invariant risk minimization (Arjovsky et al., 2019) seeks for a data representation,so that the optimal classifier trained on top of this representation matches for all domains.Additional regularization terms are proposed to align gradients across domains (Koyama& Yamaguchi, 2021), reduce the variance of risks of all domains (Krueger et al., 2021b), orsmooth inter-domain interpolation paths (Chuang & Mroueh, 2021).
Methods for noisy labels. There is a rich body of literature trying to combat with thelabel-noise issue, starting from the seminal work (Angluin & Laird, 1988) for traditionalstatistical learning to recent work for deep learning (Han et al., 2018b, 2019; Song et al.,2020a). Generally speaking, previous methods attempt to handle noisy labels mainlyfrom three aspects (Han et al., 2020): training data correction (van Rooyen et al., 2015; vanRooyen & Williamson, 2017), objective function design (Azadi et al., 2016; Wang et al.,2017), and optimization algorithm design (Jiang et al., 2018; Han et al., 2018b).
From the training data perspective, prior work (van Rooyen & Williamson, 2017) firstlyestimates the noise transition matrix, which characterizes the relationship between cleanand noisy labels, and then employs the estimated matrix to correct noisy training labels.Typical work in this line includes using an adaptation layer to model the noise transitionmatrix (Sukhbaatar et al., 2015), label smoothing (Lukasik et al., 2020), and human-in-the-loop estimation (Han et al., 2018a).
Other work turns to the design of objective functions, which aims at introducing spe-cific regularization into the original empirical loss function to mitigate the label noiseeffect. In Azadi et al. (2016), authors propose a group sparse regularizer on the responseof image classifier to force weights of irrelevant or noisy groups towards zero. Zhang et al.(2017) introduce Mixup as an implicit regularizer, which constructs virtual training sam-ples by linear interpolation between pairs of samples and their labels. Such approach notonly regularizes the model to factor simple linear behavior, but also alleviates the mem-orization of corrupted labels. Similar work following this idea includes label ensemble(Laine & Aila, 2017) and importance re-weighting (Liu & Tao, 2015).
From the view of optimization algorithm design, some work (Han et al., 2018b; Liet al., 2020) introduces novel optimization algorithms or schedule strategies to solve thelabel noise issue. One common approach in this line is to train a single neural network
10

via small loss tricks (Ren et al., 2018; Jiang et al., 2018). Besides, other work proposesto co-train two neural networks via small-loss tricks, including co-teaching (Han et al.,2018b) and co-teaching+ (Yu et al., 2019).
2.3.2 Representation Learning for Affinity Prediction
As a fundamental building block of ligand- and structure-based affinity prediction, ma-chine learning models for encoding molecules and proteins have attracted a lot of atten-tion in the research community. Based on the input data and model type, existing studiescan be divided into following three categories.
Hand-crafted feature based backbones. Many early studies enlist domain experts todesign features from molecules and proteins which contain rich biological and chemicalknowledge, such as Morgan fingerprints (Morgan, 1965), circular fingerprints (Glen et al.,2006), and extended-connectivity fingerprint (Rogers & Hahn, 2010). Then, these hand-crafted features are fed to machine learning models to produce meaningful embeddingsfor downstream tasks. Typical models include logistic regression (Kleinbaum et al., 2002),random forest (Breiman, 2001), influence relevance voting (Swamidass et al., 2009), andneural networks (Ramsundar et al., 2015).
Sequence-based backbones. Since both molecules and proteins have their own sequen-tial formats, SMILES (Weininger, 1988) and amino-acid sequence (Sanger, 1952), it isreasonable to utilize models which can naively deal with the sequential data, includ-ing 1D-CNN (Hirohara et al., 2018), RNN (Goh et al., 2017), and BERT (Wang et al.,2019a; Brandes et al., 2021). Specifically, some studies (Xu et al., 2017; Min et al., 2021)introduce self-supervised techniques from natural language processing to generate high-quality embeddings. However, 1D linearization of molecular structure highly dependson the traverse order of molecular graphs, which means that two atoms that are close inthe sequence may be far apart and thus uncorrelated in the actual 2D/3D structures (e.g.,the two oxygen atoms in "CC(CCCCCCO)O"), therefore hinders language models to learneffective representations that rely heavily on the relative position of tokens (Wang et al.,2021).
Graph-based backbones. To eliminate the information loss in the sequence-based mod-els, recently, some studies start to explore the more complex graph-based representationof molecules and proteins and utilize graph neural networks (GNNs) to produce embed-dings which encode the information of chemical structures, such as GIN (Xu et al., 2018),GCN (Kipf & Welling, 2016), and GAT (Velickovic et al., 2018). Other than directly apply-ing the vanilla GNN model as the backbone, several studies try to incorporate the domainknowledge in the model design, such as ATi-FPGNN (Xiong et al., 2019), NF (Duvenaudet al., 2015), Weave (Kearnes et al., 2016), MGCN (Lu et al., 2019), MV-GNN (Ma et al.,2020), CMPNN (Song et al., 2020b), MPNN (Gilmer et al., 2017), and DMPNN (Yang et al.,2019a). Other than standard GNN models, several studies exploit Transformer-like GNNmodels to enhance the expressive power for training with a large number of moleculesand proteins, such as GTransformer (Rong et al., 2020) and Graphormer (Ying et al., 2021).
11

NoiseFiltering
• Assay Filter• Measurement Types• Number of Molecules• Units of Values• Confidence Score• Target Type
• Sample Filter• Value Relation• Missing Value• Legal SMILES
• Uncertainty Value Offset• Multiple Measurement
Average• Binary Classification
Task with Adaptive Threshold
Uncertainty Processing
• Domain Definition• Assay• Scaffold• Size• Protein• Protein Family
• Domain Split• Domain Sorting• OOD splitting• ID splitting
Domain Definition and Split
DrugOODDatasets
• 2 Tasks• LBAP, SBAP
• 3 Noise Level:• Core, Refined, General
• 4 Measurement Types• IC50, EC50, KI, Potency
• 5 Domains:• Assay, Scaffold, Size• Protein, Protein Family
Figure 2: Overview of the automated dataset curator. We mainly implement three majorsteps based on the ChEMBL data source: noise filtering, uncertainty processing, anddomain splitting. We have built-in 96 configuration files to generate the realized datasetswith the configuration of two tasks, three noise levels, four measurement types, and fivedomains.
3. Automated Dataset Curator with Real-world Domain and NoiseAnnotations
We construct all the datasets based on ChEMBL (Mendez et al., 2019), which is a large-scale, open-access drug discovery database that aims to capture medicinal chemistry dataand knowledge across the pharmaceutical research and development process. We use thelatest release in the SQLite format: ChEMBL 294. Moreover, we consider the setting ofOOD and different noise levels, which is an inevitable problem when the machine learn-ing model is applied to the drug development process. For example, when predictingSBAP bioactivity in practice, the target protein used in the model inference could be verydifferent from that in the training set and even does not belong to the same protein family.The real-world domain gap will invoke challenges to the accuracy of the model. On theother hand, the data used in the wild often have various kinds of noise, e.g. activitiesmeasured through experiments often have different confidence levels and different “cut-off” noise. Therefore, it is necessary to construct data sets with varying levels of noise inorder to better align with the real scenarios.
In the process of drug development, many predictive tasks are involved. Here, weconsider two crucial tasks from computer aided drug discovery (Sliwoski et al., 2013):ligand based affinity prediction (LBAP) and structure based affinity prediction (SBAP). InLBAP, we follow the common practice and do not involve any protein target information,which is usually used in the activity prediction for one specific protein target. In SBAP, weconsider both the target and drug information to predict the binding activity of ligands,aiming to develop models that can generalize across different protein targets.
4. Download link: http://ftp.ebi.ac.uk/pub/databases/chembl/ChEMBLdb/releases/chembl_29/chembl_29_sqlite.tar.gz
12

3.1 Filtering Data with Different Noise Levels
ChEMBL contains the experimental results reported in previously published papers,sorted by “assays”. However, the activity values for different assays and even differ-ent molecules in the same assay may have different accuracy and confidence levels. Forexample, assays that record the results of high-throughput screens (HTS) usually haveless accurate activity values. The data with different accuracy constitute different noiseannotations. Therefore, we set up filters with different stringency to screen for datasetswith varying noise levels.
Our filters consist assay filters and sample filters, which aim to screen for the requiredassays and samples. Specifically, we have built-in 5 assay filters and 3 sample filters inadvance. The details are shown as follows.
I Assay Filter
• Measurement Type: Filtering out the assays with required measurement types,e.g. IC50, EC50. Due to the big difference in meaning between measurementtypes, and its difficulty to merge them, we generate different datasets for eachmeasurement types.
• Number of Molecules: Assay noise is strongly related to the number of moleculesin an assay. For example, large assays are often derived from high-throughputscreens that are very noisy. Hence we set different molecules number limits fordifferent noise levels.
• Units of Values: The units of activity values recorded in ChEMBL are chaotic,e.g. nM, %, None. The conversion between some units is easy, such as nM andµM. But most of them cannot be converted between each other.
• Confidence Score: Due to the complex settings of different experimental as-says, sometimes it is not certain that the target that interacts with the com-pound is our designated target. Confidence score of an assay indicating howaccurately the assigned target(s) represent(s) the actually assay target.
• Target Type: There are dozens of target types in ChEMBL, from ’single protein’to ’organism’. Different target types have different confidence levels. For SBAPtasks, the target type of a ’single protein’ is more reliable than others.
I Sample Filter
• Value Relation: In many cases, the precise activity values of certain moleculescould not be obtained, but given a rough range. ChEMBL records qualitativevalues with different relationships, e.g. ’=’, ’>’, ’<’, ’»’. Obviously, ’=’ meansthe value is accurate, and the others means the value is not accurate.
• Missing Value: Filtering samples with any missing value.
• Legal SMILES: Filtering samples with illegal molecules.
The configurations of each filter for three different noise levels are shown in the Ta-ble 1. One can see that the three noise levels are now annotated jointly by “Confidence
13

Table 1: The filter configurations for three noise levels. > means the user configurationwill specify the measurement type. ’—’ denotes no restriction. Xindicates the conditionsneed to be met. "SP": single protein. "PC": protein complex. "PF": protein family. One cansee that the three noise levels are now annotated jointly by “Confidence Score”, "ValueRelation", "Number of Molecules" and "Target Type", which are shown in blue color.
Name Core Refined General
AssayFilter
Measurement Type > > >Number of Molecules [50, 3000] [32, 5000] [10, 5000]
Units of Values {nM, uM} {nM, uM} {nM, uM}Confidence Score ≥ 9 ≥ 3 —
Target Type {SP} {SP, PC, PF} —
SampleFilter
Value Relation {=,∼} {=,∼,≥,≤} {=,∼,≥,≤,>,<}Missing Value X X XLegal SMILES X X X
Score”, “Value Relation”, “Number of Molecules” and “Target Type”, which are shownin blue color. In Figure 1, we display some examples of the SBAP dataset, demonstratingdifferent kinds of noise levels.
3.2 Processing Uncertainty and Multiple Measurements
As mentioned above, ChEMBL records many activity values in an uncertainty way, andthey were reported as above or below the highest or lowest concentration tested. Here, wefollow the practice in pQSAR 2.0 (Martin et al., 2017) and offset them by 10-fold. Mean-while, since the same molecule may be reported in different sources, the same moleculemay also appear in multiple assays in ChEMBL. We call this phenomenon “multiple mea-surements”. Following the common practice (Hu et al., 2020), we average all the multiplemeasurements. For LBAP task, we average all the activity values for the same moleculebefore domain split. While for SBAP task, when the molecule and target pair is the same,we average their activity values.
3.3 Binary Classification Task with Adaptive Threshold
While ChEMBL record activity values as floating numbers, benchmarking OOD tasks asregression tasks is known to be extremely hard because various noises such as uncertaintymeasurements. Additionally, in the process of drug development, practitioners habituallyconsider whether a compound is active/inactive. Therefore, using a binary classificationtask is more robust and good enough to make decisions in the drug development. How-ever, in practice the threshold for binary classification depends on the specific circum-stances of the drug development project. Here, we choose to use an adaptive thresholdmethod that can adapt to a wider range of situations. In particular, the median value ofall compounds in the generated dataset defines the threshold, but the range of allowedthresholds are fixed to be 4 ≤ pValue ≤ 6, where pValue = − log10(Activity Value). Ifthe median is outside this range, a fixed threshold pValue = 5 is applied, which followsthe common practice (Mayr et al., 2018; Stanley et al., 2021) in drug discovery. In this
14

way, we can try our best to keep the dataset balanced while making the generated tasksmeaningful.
3.4 Domain Definition and Split
3.4.1 Domain Definition
As mentioned before, distributional shift is a common phenomenon in the drug develop-ment process. In order to make our benchmark more in line with the needs of drugdiscovery and development, we consider the OOD setting in the benchmark. In theprocess of drug research and development, when predicting the bioactivities of smallmolecules, we may encounter very different molecular scaffolds, sizes and so on fromthe model training set. These differences may also be reflected in the target in the SBAPtask. Hence, for LBAP task, we consider the following three domains: assay, scaffoldand molecule size. For SBAP tasks, in addition to the three domains mentioned above,we also consider two additional target-specific domains: protein and protein family. Theuser can also easily customize the domain through the configuration file and generate thecorresponding dataset. The details of the five domains are as follows.
• Assay: Samples in the same assay are put into the same domain. Due to the greatdifferences in different assay environments, the activity values measured by differentassays will have a large shift. At the same time, different assays have very differenttypes of experiments and test targets.
• Scaffold: Samples with the same molecular scaffold belong to the same domain.The molecular properties of different scaffolds are often quite different.
• Size: A domain consists of samples with the same number of atoms. As a result, wecan test the model’s performance on molecules that are quite different.
• Protein: In SBAP task, samples with the same target protein are in the same domain,in order to test the model performance when meeting a never-seen-before proteintarget.
• Protein Family: In SBAP tasks, samples with targets from the same family of pro-teins are in the same domain. Compared with protein domains, there are much lessprotein family domains albeit with greater differences among each other.
3.4.2 Domain Split
Based on the generated domains, we need to split them into training, OOD validation andOOD testing set. Our goal is to make the domain shifts between the training set and theOOD validation/testing set as significant as possible. This leads to the question of how tomeasure the differences between different domains and how to sort them into the trainingset and validation/testing set. Here, we design a general pipeline, that is, firstly generatedomain descriptor for each domain, and then sort the domains with descriptors. Thenthe sorted domains are sequentially divided into training set, OOD validation and testing
15

(a) OOD Split
Intermedia TrainOOD Val OOD Test
DrugOOD dataset
(b) ID Split
Intermedia Train
Train ID Val ID Test
Train ID Val ID Test OOD Val OOD Test
(c) Split Results
Figure 3: Illustration of our domain split process: (a) OOD Split: Based on the sorted data,we sequentially split them into an intermediate training set, OOD validation, and testingset. We try to keep the proportion of training, validation, and testing samples at around6:2:2. (b) ID Split: From the intermediate training set, we further separate the final train,ID validation, and ID test sets. (c) We get training, ID validation, ID test, OOD validation,and OOD test sets after executing the above steps.
set (Figure 3 (a)). Meanwhile, the number of domains in different splits are controlledby the number of total samples in each splits, and the proportion of sample numbers istrying to be kept at 6:2:2 for training, validation and testing set.
In the DrugOOD framework, we have built-in two domain descriptor generation meth-ods as follows.
• Domain Capacity: The domain descriptor is the number of samples in this domain.In practice, we found that the number of samples in a domain can well represent thecharacteristics of a domain. For example, an assay with 5000 molecules is usuallydifferent from an assay with 10 molecules in assay type. For SBAP, a protein familythat contains 1000 different proteins is very likely to be different from the proteinfamily that contains only 10 proteins. The descriptor is applied to the domains ofassay, protein and protein family.
• Molecular Size: For the size domain, the size itself is already a good domain de-scriptor and can be applied to sort the domains, which we found to effectively in-crease the generalization gap in practice. The descriptor is applied to the domain ofsize and scaffold.
Generating in-distribution data subsets. After splitting the training, OOD validationand OOD test sets, we split the ID validation and ID testing sets from the resultanttraining set (Figure 3 (b)). We follow similar settings as of WILDS (Koh et al., 2021),the ID validation and testing sets are merged from the randomly selected samples ofeach domain in the training set. The ratio of the number of samples in the OOD andID validation/test sets can be easily modified through the configuration files. After thisprocess, we get the final training, ID validation, ID test, OOD validation, OOD test sets(Figure 3 (c)).
16

Table 2: Statistical information of datasets in LBAP tasks under the IC50 measurementtype. Domain# represents the number of domains, and Sample# represents the number ofdata points.
Data subset Domain# Sample#
DrugOOD-lbap-core-ic50-assay 1,324 95,236DrugOOD-lbap-refined-ic50-assay 5,612 266,522DrugOOD-lbap-general-ic50-assay 29,938 568,556DrugOOD-lbap-core-ic50-scaffold 34,807 95,236DrugOOD-lbap-refined-ic50-scaffold 90,888 266,522DrugOOD-lbap-general-ic50-scaffold 186,875 568,556DrugOOD-lbap-core-ic50-size 251 95,236DrugOOD-lbap-refined-ic50-size 288 266,522DrugOOD-lbap-general-ic50-size 337 568,556
3.5 Overview of the Dataset Curation Pipeline
The overview of the datasets curation pipeline is shown in Figure 2. It mainly includesfour major steps: filtering data with different noise levels, processing uncertainty andmulti-measurements, binary classification task with adaptive threshold and domain split.We have built-in 96 configuration files to generate different datasets with the configura-tion of 2 tasks, 3 noise levels, 4 measurement types, and 5 domains. With our DrugOODdataset curation, the user can easily obtain the required datasets through customizing theconfiguration files.
Here, we show some statistics of datasets generated by our built-in configurationfiles. Table 2 and Table 3 show the statistics of domains and samples in LBAP task andSBAP task under IC50 measurement type, respectively. We can see that as the numberof samples increases, the noise level also increases. Meanwhile, for the same noise level,there are huge differences in the number of domains generated by different domain splitmethods, which will challenge the applicability of OOD algorithm in different domainnumbers. In order to show the comparison of data volume under different measurementtypes, we count the samples of different measurement types under different noise levels,as shown in Figure 4. As we can see, the number of samples varies greatly underdifferent measurement types in ChEMBL. Meanwhile, different measurement types mayalso bring different noise levels. Our curation can generate specific measurement types ofdatasets according to the needs of specific drug development scenarios. More statisticalinformation of the DrugOOD datasets under different setting are summarized in Table 10and Table 11.
4. Benchmarking State-of-the-art OOD Algorithms
Our benchmark implements and evaluates algorithms from various perspectives, includ-ing architecture design and domain generalization methods, to cover a wide range of ap-proaches to addressing the distribution shift problem. We believe this is the first paper tocomprehensively evaluate a large set of approaches under various settings for the DrugOODproblem.
17
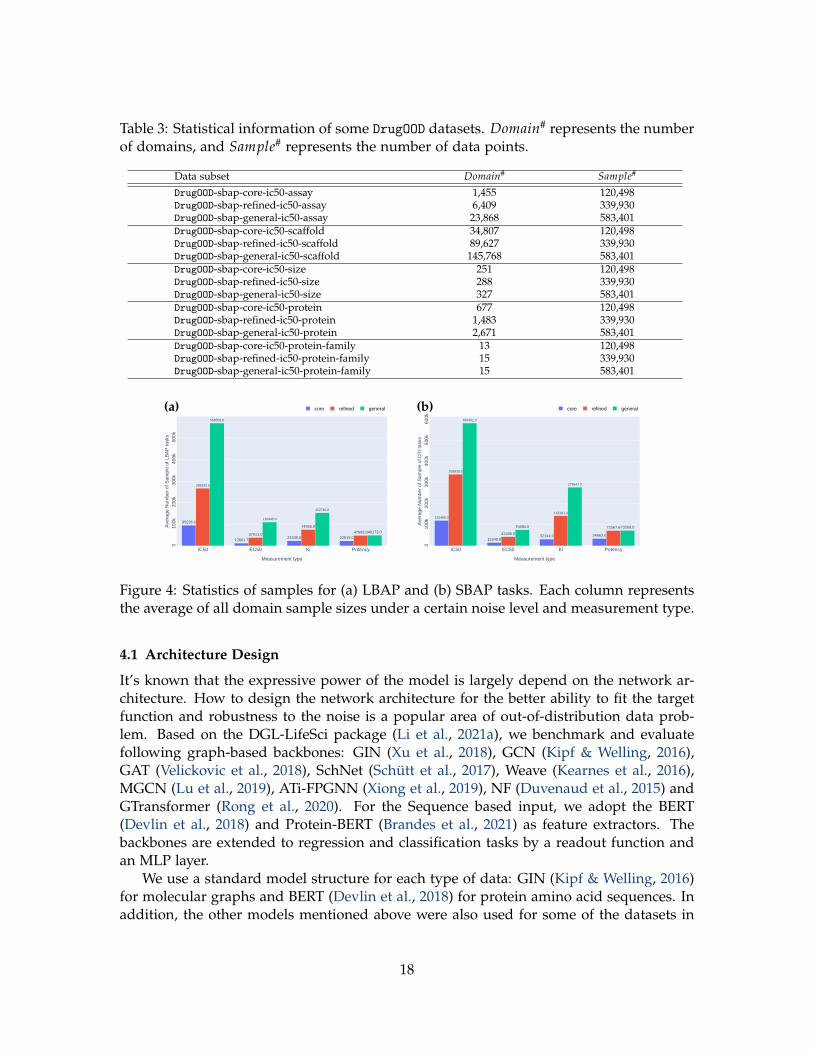
Table 3: Statistical information of some DrugOOD datasets. Domain# represents the numberof domains, and Sample# represents the number of data points.
Data subset Domain# Sample#
DrugOOD-sbap-core-ic50-assay 1,455 120,498DrugOOD-sbap-refined-ic50-assay 6,409 339,930DrugOOD-sbap-general-ic50-assay 23,868 583,401DrugOOD-sbap-core-ic50-scaffold 34,807 120,498DrugOOD-sbap-refined-ic50-scaffold 89,627 339,930DrugOOD-sbap-general-ic50-scaffold 145,768 583,401DrugOOD-sbap-core-ic50-size 251 120,498DrugOOD-sbap-refined-ic50-size 288 339,930DrugOOD-sbap-general-ic50-size 327 583,401DrugOOD-sbap-core-ic50-protein 677 120,498DrugOOD-sbap-refined-ic50-protein 1,483 339,930DrugOOD-sbap-general-ic50-protein 2,671 583,401DrugOOD-sbap-core-ic50-protein-family 13 120,498DrugOOD-sbap-refined-ic50-protein-family 15 339,930DrugOOD-sbap-general-ic50-protein-family 15 583,401
95236.0
12661.7 23339.0 22819.0
266522.0
37911.0
74956.047993.0
568556.0
110445.0
152745.0
49173.0
IC50 EC50 Ki Potency
010
0k20
0k30
0k40
0k50
0k
core refined general
Measurement type
Ave
rage
Num
ber
of S
ampl
e of
LB
AP
task
s
(a)
120498.0
15340.032144.0 34662.0
339930.0
42405.0
142181.4
72567.6
583401.0
75694.0
278547.0
73268.0
IC50 EC50 Ki Potency
010
0k20
0k30
0k40
0k50
0k60
0k
core refined general
Measurement type
Ave
rage
Num
ber
of S
ampl
e of
DT
I tas
ks
(b)
Figure 4: Statistics of samples for (a) LBAP and (b) SBAP tasks. Each column representsthe average of all domain sample sizes under a certain noise level and measurement type.
4.1 Architecture Design
It’s known that the expressive power of the model is largely depend on the network ar-chitecture. How to design the network architecture for the better ability to fit the targetfunction and robustness to the noise is a popular area of out-of-distribution data prob-lem. Based on the DGL-LifeSci package (Li et al., 2021a), we benchmark and evaluatefollowing graph-based backbones: GIN (Xu et al., 2018), GCN (Kipf & Welling, 2016),GAT (Velickovic et al., 2018), SchNet (Schütt et al., 2017), Weave (Kearnes et al., 2016),MGCN (Lu et al., 2019), ATi-FPGNN (Xiong et al., 2019), NF (Duvenaud et al., 2015) andGTransformer (Rong et al., 2020). For the Sequence based input, we adopt the BERT(Devlin et al., 2018) and Protein-BERT (Brandes et al., 2021) as feature extractors. Thebackbones are extended to regression and classification tasks by a readout function andan MLP layer.
We use a standard model structure for each type of data: GIN (Kipf & Welling, 2016)for molecular graphs and BERT (Devlin et al., 2018) for protein amino acid sequences. Inaddition, the other models mentioned above were also used for some of the datasets in
18

Table 4: The in-distribution (ID) vs out of distribution (OOD) of datasets with measure-ment type of IC50 trained with empirical risk minimization. The ID test datasets aredrawn from the training data with the same distribution, and the OOD test data aredistinct from the training data, which are described in Section 3. We adopt the Area un-der the ROC Curve (AUROC) to estimate model performance; the higher score is better.In all tables in this paper, we report in parentheses the standard deviation of 3 replica-tions, which measures the variability among replications. All datasets show performancedrops due to distribution shift, with substantially better ID performance than OOD per-formance. More experimental results under different setting are shown in Table 12 inAppendix.
Dataset In-dist Out-of-Dist Gap
DrugOOD-lbap-core-ic50-assay 89.62 (2.04) 71.98 (0.29) 17.64DrugOOD-lbap-core-ic50-scaffold 87.15 (0.48) 69.54 (0.52) 17.60DrugOOD-lbap-core-ic50-size 92.35 (0.15) 67.48 (0.47) 24.87DrugOOD-lbap-refined-ic50-assay 89.25 (0.64) 72.70 (0.00) 16.55DrugOOD-lbap-refined-ic50-scaffold 86.23 (0.08) 70.45 (0.54) 15.78DrugOOD-lbap-refined-ic50-size 91.31 (0.07) 68.74 (0.37) 22.58DrugOOD-lbap-general-ic50-assay 85.19 (1.15) 69.88 (0.13) 15.32DrugOOD-lbap-general-ic50-scaffold 85.15 (0.24) 67.55 (0.09) 17.60DrugOOD-lbap-general-ic50-size 89.77 (0.08) 66.05 (0.32) 23.72DrugOOD-sbap-core-ic50-protein 90.71 (0.29) 68.87 (0.53) 21.84DrugOOD-sbap-core-ic50-protein-family 89.88 (1.44) 72.20 (0.14) 17.68DrugOOD-sbap-refined-ic50-protein 86.87 (1.41) 69.51 (0.30) 17.36DrugOOD-sbap-refined-ic50-protein-family 86.44 (3.07) 70.61 (0.42) 15.82DrugOOD-sbap-general-ic50-protein 85.34 (1.67) 68.48 (0.27) 16.86DrugOOD-sbap-general-ic50-protein-family 79.18 (2.69) 68.60 (0.68) 10.58
measuring the effect of model structure on generalization ability. Following the model se-lection strategy in (Koh et al., 2021), we use a distinct OOD validation set for model earlystopping and hyper-parameter tuning. The OOD validation set is drawn from a similardistribution of the training set, which distant from the OOD test set. For example, inthe assay-based datasets, the training, validation, testing each consists of molecules fromdistinct sets of the assay environment. We detail the experimental protocol in Section 6.
Table 4 shows that for each dataset with the measurement type of IC50, the OODperformance is always significantly lower than the performance of the corresponding IDsetting.
4.2 Domain Generalization Algorithms
In machine learning, models are commonly optimized by the empirical risk minimiza-tion (ERM), which trains the model to minimize the average training loss. To improvethe model robustness under the distribution shift, current methods tend to learn invari-ant representations that can generalize across domains. There are two main directions:domain alignment and invariant predictors. Common approaches to domain alignmentis to minimize the divergence of feature distributions from different domains across dis-tance metrics, such as maximum mean discrepancy (Tzeng et al., 2014; Long et al., 2015)and adversarial loss (Ganin et al., 2016; Li et al., 2018), Wasserstein distance (Zhou et al.,2020a). In addition, other conventional methods along this line of research are adoptingdata augmentation. For example, Mixup (Zhang et al., 2017) augmentation proposes to
19

Table 5: The out-of-distribution (OOD) performance of baseline models trained with dif-ferent OOD algorithms on the DrugOOD-lbap-ic50 dataset.
Algorithms Assay Scaffold Sizecore refined general core refined general core refined general
ERM 71.98 (0.29) 69.54 (0.52) 67.48 (0.47) 69.88 (0.13) 67.55 (0.09) 66.05 (0.32) 72.70 (0.00) 70.45 (0.54) 68.74 (0.37)IRM 69.22 (0.51) 64.94 (0.30) 57.00 (0.39) 69.21 (0.16) 63.78 (0.53) 60.52 (0.35) 71.68 (0.53) 67.97 (0.66) 59.99 (0.48)DeepCoral 71.76 (0.60) 68.54 (0.01) 57.31 (0.44) 69.47 (0.13) 64.84 (0.53) 61.09 (0.23) 71.45 (0.09) 69.35 (0.73) 62.01 (0.38)DANN 70.08 (0.65) 66.37 (0.20) 63.45 (0.18) 65.12 (0.94) 62.90 (1.02) 64.74 (0.27) 67.20 (0.68) 67.26 (0.95) 66.83 (0.08)Mixup 71.34 (0.41) 69.29 (0.24) 67.73 (0.27) 69.87 (0.17) 67.64 (0.16) 66.01 (0.14) 72.13 (0.21) 70.68 (0.16) 68.69 (0.13)GroupDro 71.54 (0.46) 66.67 (0.67) 60.90 (1.23) 69.36 (0.09) 64.91 (0.25) 61.41 (0.10) 71.40 (0.52) 69.08 (0.38) 62.15 (0.54)
construct additional virtual training data by convex combination of both samples and la-bels from the original datasets. Follow-up works applied a similar idea to generate moredomain and enhance consistency of features during training (Yue et al., 2019; Zhou et al.,2020b; Xu et al., 2020; Yan et al., 2020b; Shu et al., 2021; Wang et al., 2020; Yao et al.,2022), or synthesize unseen domain in an adversarial way to imitate the challenging testdomains (Zhao et al., 2020; Qiao et al., 2020; Volpi et al., 2018).
For learning invariant predictors, the core idea is to enhance the correlations betweenthe invariant representation and the labels. Representatively, invariant risk minimization(IRM) (Arjovsky et al., 2019) penalizes the feature representation of each domain that hasa different optimal linear classifier, intending to find a predictor that performs well in alldomains. Following up IRM, subsequent approaches propose powerful regularizers bypenalizing variance of risk across domains (Krueger et al., 2021a), by adjusting gradientsacross domains (Koyama & Yamaguchi, 2020), by smoothing interpolation paths acrossdomains (Chuang & Mroueh, 2021). An alternative to IRM is to combat spurious domaincorrelation, a core challenge for the sub-population shift problem (Koh et al., 2021), bydirectly optimizing the worst-group performance with Distributionally Robust Optimiza-tion (Sagawa et al., 2019; Zhang et al., 2020; Zhou et al., 2021a), generating additionalsamples around the minority groups (Goel et al., 2020), and re-weighting among groupswith various size (Sagawa et al., 2020), or additional regulations (Chang et al., 2020).
We implement and evaluate the following representative OOD methods:
• ERM: ERM optimizes the model by minimizing the average empirical loss on ob-served training data.
• IRM: IRM penalizes feature distributions for domains that have different optimumpredictors.
• DeepCoral: DeepCoral penalizes differences in the means and covariances of thefeature distributions (i.e., the distribution of last layer activations in a neural net-work) for each domain. Conceptually, DeepCoral is similar to other methods thatencourage feature representations to have the same distribution across domains.
• DANN: Like IRM and DeepCoral, DANN encourages feature representations to beconsistent across domains.
20

• Mixup: Mixup constructs additional virtual training examples from two examplesdrawn at random from the training data, which alleviates the effects of domain-related spurious information through data interpolation.
• GroupDro: GroupDro uses distributionally robust optimization methods to mini-mize worst-case losses, aiming to combat spurious correlations explicitly.
Table 5 summarizes the experimental results on the datasets with IC50 measurementtype, showing that latest OOD algorithms exhibit no clear improvement over the simpleERM algorithm. There may be several reasons for this: 1). the molecular graph data aredifferent from visual and textual input by nature, thus making it challenging to use con-ventional strategies directly; 2). these algorithms are usually designed for datasets thatcontain enough data per domain, so it is difficult to apply directly to datasets that have alarge number of domains but few samples per domain. There is a need for improved ap-proaches to realistic DrugOOD problems, based on the results. Additionally, current OODresearch focus almost exclusively on the single-instance prediction tasks while overlookmulti-instance prediction tasks, and how to better handle the distribution shift in multipleinstance domains (e.g., molecule and protein inputs in the SBAP task) remains an openproblem. Lastly, while not explored in this paper, the large-scale realistic datasets alwayscome with non-negligible inherent noise, both aleatoric and epistemic (Lazic & Williams,2021). And how to incorporate noise learning with OOD generalization to boost model’srobustness and generalization in the meantime is an important research direction.
5. Implementations and Package Usage
DrugOOD develops a comprehensive benchmark for developing and evaluating OOD gen-eralization algorithms. Different with other codebases, DrugOOD builds on the OpenMM-Lab project (Chen et al., 2019), owning the following features:
Customizable dataset. DrugOOD supports various formats of data, providing related pro-cessing and converting tools. We provide 96 realized sub-datasets in advance. In addi-tion to this, users can additionally specify additional conditions to easily customize newdatasets from the original source dataset.
Modular design. Building on the design of OpenMMLab projects, we decompose theframework into different components and one can easily construct new OOD algorithmsby combing these modules.
Support for multiple frameworks out of the box. DrugOOD codebase directly supportsvarious popular and contemporary OOD generalization algorithms, e.g. DeepCoral, IRM,DANN, Mixup etc.
With the above abstraction, our benchmark framework is illustrated in Figure 5. Bysimply creating some new components and assembling existing ones, the researchers candevelop their approach efficiently.
21

Dataset Loading Benchmark Configuration
Drugood-lbap-core-ic50-size
…
Train Val Test
Algorithms
Backbones
Heads
Losses&M
etrics
Split 𝐷# 𝐶#
Train 311 34K
Val 314 19K
Test 699 19K
D Drug Y
12 CCCCc1cc(C(=O)O)n[nH]1 Inactive
89 Cc1ccc(S(=O)(=O)N2CCN(C activate
… … …
Data ExampleData Statistics
• 6 Algorithms:• IRM, DeepCoral, Mixup, etc.
• 10 Backbones:• GIN, GCN, GAT, BERT, etc.
• 2 Heads:• Classify, Regress
• 7 Losses & Metrics:• CE, MSE, AUC, ACC, etc.
96 DrugOOD Datasets
… … … …
Figure 5: Overview of the DrugOOD benchmark. DrugOOD conducts a comprehensive bench-mark for developing and evaluating OOD generalization algorithms for AIDD. After load-ing any of the datasets generated by the data curator, users can flexibly combine differenttypes of modules, including algorithms, backbones, etc., to develop OOD generalizationalgorithms in a flexible and disciplined manner.
5.1 Dataset Curation
The DrugOOD package provides a simple, standardized dataset curator based on the large-scale bioassay deposition website ChEMBL (Mendez et al., 2019), by proving a modifiedcuration files, the researcher can easily re-configure the curation process. Specifically, wehave provided 96 built-in configuration files for generating OOD dataset spanning variousdomains, noise annotations and measurement types. The Listing 1 provides a simpleexample, which covers all of the steps of generating an OOD dataset from ChEMBL.
1 # configure curation pipeline2 curator = dict(3 task="lbap",4 chembl=’../ chembl_29_sqlite/chembl_29.db’,5 save_dir=".data/lbap/lbap_core_EC50_assay",6 # noise filtering7 filter=dict(8 assay_filter=dict(9 measurement_type=["EC50"],
10 assay_value_units=["nM", "uM"],11 molecules_number=[50 , 3000],12 confidence_score=913 ),14 sample_filter=dict(15 filter_none=True ,16 smile_exist=True ,17 smile_legal=True ,18 value_relation=["=", "~"]19 )20 ),21 # uncertainty filtering
22

22 uncertainty=dict(23 multiple_measurement_average=True ,24 uncertainty_delta={’<’: -1, ’<=’: -1, ’>’: 1, ’>=’: 1},25 binary_threshold=dict(26 lower_bound=4,27 upper_bound=6,28 fix_value=5)29 ),30 # domain split31 split=dict(32 domain=dict(33 domain_generate_field="assay_id",34 domain_name="assay",35 sort_func="domain_capacity"36 ),37
38 fractions=dict(39 train_fraction_ood=0.6,40 val_fraction_ood=0.2,41 IID_train_sample_fractions=0.6,42 IID_val_sample_fractions=0.243 )44
45 ),46 )
Code Listing 1: Dataset curation example
5.2 Dataset Loading
As shown in Listing 2, DrugOOD provides a flexible and uniform interface for buildingdata pipelines, allowing users to easily and quickly adjust the experimental data flow.Meanwhile, Standardized and automated evaluation of specified dataset partitions canbe easily implemented by a few lines of code.
1 dataset_type = ’MOL’2 subset = ’lbap_ic50_core_assay ’3 data_prefix = "data/drugood"4 # data prepossess pipeline5 pipeline = [6 dict(type="SmileToGraph", keys=[’input’]),7 dict(type=’ToTensor ’, keys=[’gt_label ’]),8 dict(type=’Collect ’, keys=[’input’, ’gt_label ’, ’meta’])9 ]
10 # data sampling strategy11 sample_config = dict(12 uniform_over_groups=None ,13 n_groups_per_batch=2,14 distinct_groups=True15 )16 # data loading schedule17 data = dict(18 samples_per_gpu=256 ,
23

19 workers_per_gpu=0,20 train=dict(21 split="train",22 type=dataset_type ,23 subset=subset ,24 data_prefix=data_prefix ,25 pipeline=pipeline ,26 sample_mode="group",27 sample_config=sample_config28 ),29 val=dict(30 split="val",31 type=dataset_type ,32 subset=subset ,33 data_prefix=data_prefix ,34 pipeline=pipeline ,35 rule="greater", # model selection36 save_best="auc"37 ),38 test=dict(39 split="test",40 type=dataset_type ,41 subset=subset ,42 data_prefix=data_prefix ,43 pipeline=pipeline)44 )
Code Listing 2: Dataset loading example
5.3 Algorithm Configuration
DrugOOD also supports popular and contemporary OOD generalization algorithm out ofbox. Users can easily configure different modules to construct and develop new OODgeneralization algorithms effectively. We provide an example of building algorithm infew lines code, as shown in Listing 3.
1 # algorithm configuration2 model = dict(3 type="ERM",4 # backbone5 tasker=dict(6 type=’Classifier ’,7 backbone=dict(8 type=’GIN’, # backbone setting9 num_node_emb_list=[39],
10 num_edge_emb_list=[10],11 emb_dim=256 ,12 dropout=0.0,13 ),14 head=dict(15 type=’LinearClsHead ’,16 num_classes=2,17 in_channels=256 ,
24

18 loss=dict(type=’CrossEntropyLoss ’))19 ))
Code Listing 3: Algorithm configuration example
6. Empirical Studies
We present typical experimental results and corresponding analysis in this section. Moreresults and details are deferred to the Appendix.
6.1 Ligand Based Affinity Prediction (LBAP)
Precisely predicting the affinity score of small molecules will greatly boost the processof drug discovery by reducing the needs of costly laboratory experiments. However, theexperimental data available for training such models is limited compared to the extremelydiverse and combinatorially large universe of candidate molecules that we would want tomake predictions on. In this paper, we study the domain variation in experimental assay,molecules sizes, molecule sizes between training and test molecules.
6.1.1 Setup
Problem Definition. For the task of LBAP, we study a domain generalization prob-lem where model needs to be generalized to the molecules from different domain splits.Aligned with the knowledge of biochemistry, we define the following three domains: as-say, scaffold and molecular size. As an illustration, we treat the LBAP problem as a binaryclassification problem, where the input x is the graph data of a small molecule, label y isthe ground truth (active or inactive) of binary affinity classification, and the d representsdomain identifier for one specific domain splits.
Data Info. As mentioned before, we preprocess the ChEMBL dataset and generate intotal 36 exemplar datasets with varying noise levels, measurements types, and domaindefinitions. Each small molecule in each dataset is represented as a graph, where thenodes are atoms and edges are chemical bonds. Following the pre-processing strategy in(Xiong et al., 2019), we preprocess the molecules via the RDKit package (Landrum, 2013).Input node features are 39-dimensional vectors including atomic symbol, hybridization,hydrogens and so on. Input edge features are 10-dimensional vectors including bondtype, conjugation, ring and bond stereo chemistry. Following the detailed splitting strat-egy in Figure 3 of Section 3.4, we split the dataset via three types of domain annotations:
I Assay: Samples in the same assay are divided into the same domain. Due to the bigdifferences of experimental environments and protein targets in various assays, thebioactivity values measured by those assays will have a large shift. In this setting,we split the dataset along assays. This split provides a realistic estimate of modelperformance in prospective experimental settings by separating different moleculesinto different experimental environments. We assign the assays that contain largenumber of samples to the training set, and the assays with small number of samples
25

0 500 1000
020
040
060
080
010
00
0 50 100 150
010
020
030
040
050
060
070
080
0
0 100 200 300
010
020
030
040
050
060
070
0
0 20 40 60
050
010
0015
0020
00
train
val
test
mol
ecul
e nu
mbe
r
IC50 EC50 Ki Potency
assay id
(a)
0.74
0.88
0.99
0.5
0.89
0.92
0.99
0.41
0.91
0.83
0.93
0.6
IC50 EC50 Ki Potency
0.4
0.5
0.6
0.7
0.8
0.9
1
measurement
post
ive
labe
l rat
io
(b)
Figure 6: Analysis of the assay domain in the realized DrugOOD dataset. (a) shows thedistribution of molecule numbers in the assay environment for different measurementtypes (left to right: IC50, EC50, Ki and Potency) and (b) shows the ratio of positivesamples of four measurement types in the train/validation/test splits. Note that here thetrain, val, test refer to the Intermediate Train, OOD val and OOD test datasets in Figure 3.
to the test set. After such an assignment, the domain shifts between the trainingset and the OOD validation/testing set become sufficiently large. The proportion ofsamples is kept at around 6:2:2 in training, validation, test set.
Here takes the DrugOOD-lbap-core-ic50-assay dataset as an illustration here.
• Train: Contain total 34,179 molecules from the largest 311 assays with an aver-age of 110 molecules per assay.
• Validation (ID): Contain total 11314 molecules from the same 311 assays as inthe training sets.
• Test (ID): Contain total 11,683 molecules from the same 311 assay environ-ments as in the training sets.
• Validation (OOD): Contain total 19,028 molecules from the next largest 314assays with an average of 60.6 molecules per assay.
• Test (OOD): Contain total 19,302 molecules from the smallest 314 assays withan average of 27.6 molecules per assay.
Figure 6 illustrates the analysis of the assay domain in the realized DrugOODdataset. As shown in Figure 6 (a), the statistics of the assays in terms of the numbersof molecules in each assay, which implies that the scale of the experiments is highlyskewed, with the test set containing the assay with the fewest molecules. However,the difference in assay environments does not significantly change the statistics ofthe learning target in each split. In Figure 6, the label statistics still remain verysimilar in the training/validation/test splits, indicating that the main distributionvariation comes from differences in the detection environment.
I Scaffold: Scaffold split has been widely used in previous benchmarks (Koh et al.,2021; Hu et al., 2020), which splits datasets based on scaffold structure. Similarily,
26

0 5k 10k 15k
050
100
150
200
0 1000 2000
050
100
150
200
0 1000 2000 3000
050
100
150
0 2000 4000
010
2030
4050
60 train
val
test
num
ber
of m
olec
ules
IC50 EC50 Ki Potency
scaffold id
(a)
0.94 0.94
0.99
0.53
0.74
0.86
0.98
0.54
0.72
0.78
0.94
0.5
IC50 EC50 Ki Potency
0.5
0.6
0.7
0.8
0.9
1 train
val
test
measurement
post
ive
labe
l rat
io
(b)
Figure 7: Analysis of the scaffold domain in the DrugOOD dataset. (a) shows the distri-bution of number of molecules wrt the scaffold id and (b) shows the positive ratio ofmolecules of four measurement types in the train/validation/test splits. Note that herethe train, val, test refer to the Intermediate Train, OOD val and OOD test datasets inFigure 3.
we assign the largest scaffolds to training set and smallest scaffolds to the test set toensure its maximal diversity in scaffold structure. Take the DrugOOD-lbap-core-ic50-scaffold dataset as examples, the detailed information of splits are:
• Train: Contain in total 21,519 molecules from the largest 6,881 scaffolds withan average of 3.12 molecules per scaffold.• Validation (ID): Contain in total 4,920 molecules from the 1,912 scaffolds with
an average of 2.57 molecules per scaffold.• Test (ID): Have 24,112 scaffolds, with in total 30,708 molecules.• Validation (OOD): The next largest 6,345 scaffolds, with in total 11,683 molecules,
and an average of 1.84 molecules per scaffold.• Test (OOD): The smallest 4,350 scaffolds, with in total 19,048 molecules, and
an average of 4.42 molecules per scaffold.
In the same way, we plot the statics of the scaffolds in terms of the size of eachscaffold. As shown in Figure 7, we again observe that the distribution is highlyskewed and the test partition contains the smallest scaffolds.
I Size: We put samples with the same atomic number into a domain, and separatemolecules with different atomic sizes into different subsets for simulating the real-istic distribution shift. We organize the molecules with the largest atomic sizes intothe training set and those with smaller atomic sizes are assigned to the test set toensure sufficient variability of atomic sizes between the training and test data. Tak-ing the DrugOOD-lbap-core-ic50-size dataset dataset as an example, the details of thesplit are as follows:
• Train: The largest 190 size groups, with overall 36,597 molecules, and an aver-age of 192.61 molecules per group.
27
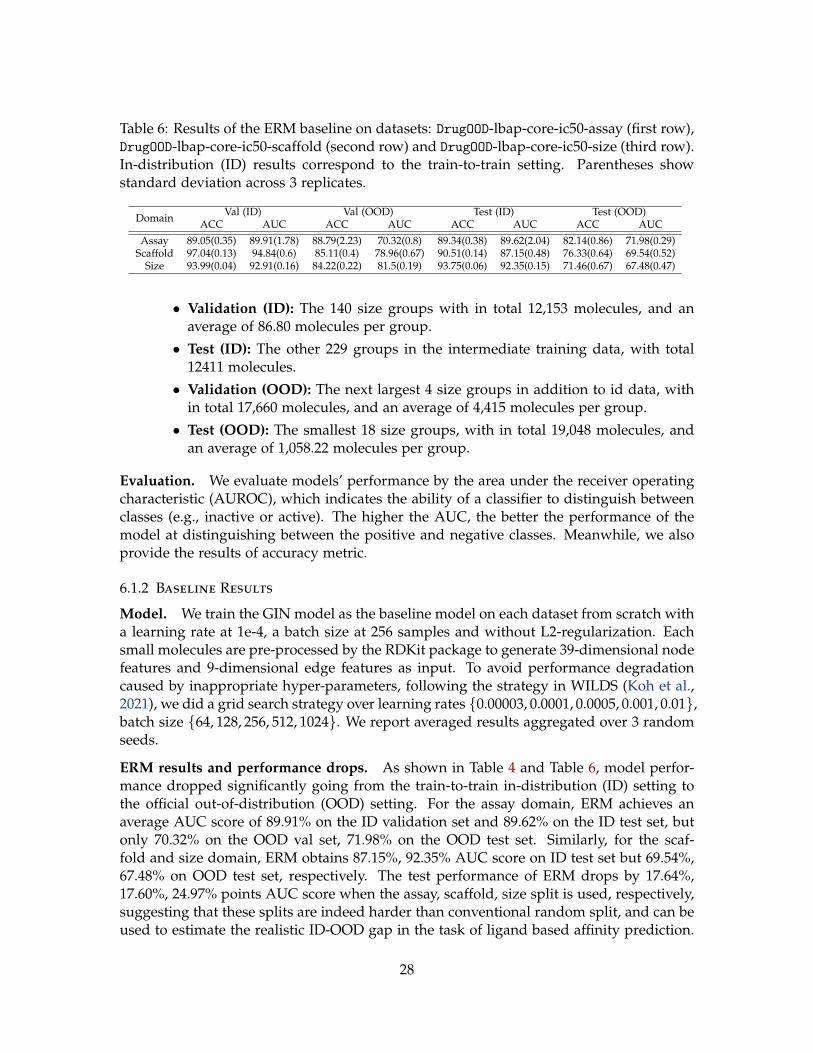
Table 6: Results of the ERM baseline on datasets: DrugOOD-lbap-core-ic50-assay (first row),DrugOOD-lbap-core-ic50-scaffold (second row) and DrugOOD-lbap-core-ic50-size (third row).In-distribution (ID) results correspond to the train-to-train setting. Parentheses showstandard deviation across 3 replicates.
Domain Val (ID) Val (OOD) Test (ID) Test (OOD)ACC AUC ACC AUC ACC AUC ACC AUC
Assay 89.05(0.35) 89.91(1.78) 88.79(2.23) 70.32(0.8) 89.34(0.38) 89.62(2.04) 82.14(0.86) 71.98(0.29)Scaffold 97.04(0.13) 94.84(0.6) 85.11(0.4) 78.96(0.67) 90.51(0.14) 87.15(0.48) 76.33(0.64) 69.54(0.52)
Size 93.99(0.04) 92.91(0.16) 84.22(0.22) 81.5(0.19) 93.75(0.06) 92.35(0.15) 71.46(0.67) 67.48(0.47)
• Validation (ID): The 140 size groups with in total 12,153 molecules, and anaverage of 86.80 molecules per group.
• Test (ID): The other 229 groups in the intermediate training data, with total12411 molecules.
• Validation (OOD): The next largest 4 size groups in addition to id data, within total 17,660 molecules, and an average of 4,415 molecules per group.
• Test (OOD): The smallest 18 size groups, with in total 19,048 molecules, andan average of 1,058.22 molecules per group.
Evaluation. We evaluate models’ performance by the area under the receiver operatingcharacteristic (AUROC), which indicates the ability of a classifier to distinguish betweenclasses (e.g., inactive or active). The higher the AUC, the better the performance of themodel at distinguishing between the positive and negative classes. Meanwhile, we alsoprovide the results of accuracy metric.
6.1.2 Baseline Results
Model. We train the GIN model as the baseline model on each dataset from scratch witha learning rate at 1e-4, a batch size at 256 samples and without L2-regularization. Eachsmall molecules are pre-processed by the RDKit package to generate 39-dimensional nodefeatures and 9-dimensional edge features as input. To avoid performance degradationcaused by inappropriate hyper-parameters, following the strategy in WILDS (Koh et al.,2021), we did a grid search strategy over learning rates {0.00003, 0.0001, 0.0005, 0.001, 0.01},batch size {64, 128, 256, 512, 1024}. We report averaged results aggregated over 3 randomseeds.
ERM results and performance drops. As shown in Table 4 and Table 6, model perfor-mance dropped significantly going from the train-to-train in-distribution (ID) setting tothe official out-of-distribution (OOD) setting. For the assay domain, ERM achieves anaverage AUC score of 89.91% on the ID validation set and 89.62% on the ID test set, butonly 70.32% on the OOD val set, 71.98% on the OOD test set. Similarly, for the scaf-fold and size domain, ERM obtains 87.15%, 92.35% AUC score on ID test set but 69.54%,67.48% on OOD test set, respectively. The test performance of ERM drops by 17.64%,17.60%, 24.97% points AUC score when the assay, scaffold, size split is used, respectively,suggesting that these splits are indeed harder than conventional random split, and can beused to estimate the realistic ID-OOD gap in the task of ligand based affinity prediction.
28

Table 7: Baseline results on three datasets for the six OOD algorithm. DrugOOD-lbap-core-ic50-assay (first row), DrugOOD-lbap-core-ic50-scaffold (second row) and DrugOOD-lbap-core-ic50-size (third row). In-distribution (ID) results correspond to the train-to-trainsetting. Parentheses show standard deviation across 3 replicates.
Domain Algos Val (ID) Val (OOD) Test (ID) Test (OOD)ACC AUC ACC AUC ACC AUC ACC AUC
Assay
ERM 89.05 (0.35) 89.91 (1.78) 88.79 (2.23) 70.32 (0.80) 89.34 (0.38) 89.62 (2.04 82.14 (0.86) 71.98 (0.29)IRM 88.14 (0.17) 82.82 (0.87) 90.67 (0.07) 68.23 (0.31) 88.39 (0.25) 83.10 (0.46 82.41 (0.20) 69.22 (0.51)
DeepCoral 88.59 (0.10) 88.10 (1.42) 91.09 (0.15) 70.26 (1.04) 88.88 (0.15) 88.23 (1.42 83.04 (0.08) 71.76 (0.60)DANN 88.47 (0.20) 83.39 (1.15) 91.32 (0.38) 68.30 (0.22) 88.72 (0.16) 83.20 (1.28 83.22 (0.10) 70.08 (0.65)Mixup 88.80 (0.52) 89.01 (2.06) 88.76 (1.92) 69.14 (0.56) 89.01 (0.43) 88.95 (2.17 81.65 (1.06) 71.34 (0.41)
GroupDro 88.80 (0.15) 89.42 (0.43) 89.81 (0.41) 70.34 (0.91) 88.96 (0.15) 89.24 (0.82 82.62 (0.23) 71.54 (0.46)
Scaffold
ERM 97.04 (0.13) 94.84 (0.60) 85.11 (0.40) 78.96 (0.67) 90.51 (0.14) 87.15 (0.48 76.33 (0.64) 69.54 (0.52)IRM 92.51 (4.34) 77.66 (0.79) 81.52 (4.25) 72.77 (0.66) 86.99 (3.93) 77.22 (0.32 72.96 (4.32) 64.94 (0.30)
DeepCoral 95.76 (0.29) 81.60 (1.45) 85.37 (0.47) 77.09 (0.26) 89.96 (0.08) 81.13 (0.49 76.90 (0.37) 68.54 (0.01)DANN 95.89 (0.09) 77.09 (0.64) 85.13 (0.81) 75.04 (0.65) 89.86 (0.10) 77.30 (0.65 77.11 (0.66) 66.37 (0.20)Mixup 97.19 (0.08) 95.51 (0.44) 85.55 (0.08) 79.42 (0.62) 90.74 (0.11) 87.35 (0.33 77.18 (0.19) 69.29 (0.24)
GroupDro 96.02 (0.12) 78.67 (2.75) 85.01 (0.64) 74.57 (0.60) 89.87 (0.18) 78.32 (1.09 76.18 (0.86) 66.67 (0.67)
Size
ERM 93.99 (0.04) 92.91 (0.16) 84.22 (0.22) 81.50 (0.19) 93.75 (0.06) 92.35 (0.15 71.46 (0.67) 67.48 (0.47)IRM 86.77 (4.05) 66.41 (1.79) 76.49 (4.36) 60.59 (0.29) 87.08 (3.72) 69.80 (1.74 66.39 (3.92) 57.00 (0.39)
DeepCoral 92.40 (0.06) 70.70 (1.68) 83.34 (0.27) 61.90 (0.39) 92.28 (0.20) 73.08 (0.98 72.36 (0.32) 57.31 (0.44)DANN 91.31 (2.12) 80.13 (3.59) 81.99 (2.46) 73.73 (0.49) 91.12 (2.12) 78.53 (3.71 70.08 (3.50) 63.45 (0.18)Mixup 94.23 (0.21) 92.89 (0.30) 84.64 (0.26) 81.79 (0.20) 93.88 (0.17) 92.48 (0.55 72.73 (0.68) 67.73 (0.27)
GroupDro 92.73 (0.17) 78.46 (0.91) 83.54 (0.52) 67.68 (0.42) 92.67 (0.27) 80.02 (0.44 72.64 (0.33) 60.90 (1.23)
More experimental results on different DrugOOD lbap datasets are shown in Table 12 of theAppendix.
Results of other baselines. Table 7 shows the performance of other conventional gen-eralization algorithms. For a fair comparison, all algorithms adopt the same backbonenetwork. Besides, we also make additional grid searches on algorithms’ specific hyper-parameters separately, IRM’s penalty weight in {1, 10, 100, 1000} and penalty anneal iter-ation in {100, 500, 1000}. DeepCoral’s penalty weight in {0.1, 1, 10}, GroupDro’s step sizein {0.001, 0.01, 0.1}, DANN’s inverse factor between {0.0001, 1} and Mixup’s probabilityand interpolate strength between {0.0001, 1}.
As shown in Table 7, ERM almost performs better than DeepCoral, IRM, and GroupDRO, all of which use assay, scaffolds, size as the domains, indicating these existingmethods can not solve the DrugOOD problem. Moreover, similar to the findings in theWILDS benchmark, current existing methods make model hard to fit the training data,For instance, under the scaffold domain split, DeepCoral, IRM achieves 81.6%, 77.66%AUC score in the In-Distribution validation set, respectively, while the AUC score pfERM baseline is 94.84%. Also, these methods are primarily designed for the case wheneach group contains a decent number of examples, which is not the common case for thedrug development scenario. Finally, the SOTA OOD algorithm does not work well in theDrugOOD setting, suggesting that robust methods need to be developed to solve the OODproblem for graph data.
29

ERM IRM CORAL DANN MIXUP GroupDro0
5
10
15
20
assay scaffold size
algorithm
perf
orm
ance
gap
ERM IRM CORAL DANN MIXUP GroupDro0
5
10
15
assay scaffold size
algorithm
perf
orm
ance
gap
ERM IRM CORAL DANN MIXUP GroupDro0
5
10
15
assay scaffold size
algorithm
perf
orm
ance
gap
Figure 8: Performance gap on AUC of different domain splits with varying levels of noiseand OOD algorithms on the DrugOOD-lbap datasets. The gap values are calculated onthe OOD test set and averaged over four measurement types. From left to right: corenoise level, refined noise level, general noise level. Color indicates domain annotationsfor LBAP tasks.
6.1.3 Performance Drops of Different Domains
For the LBAP task, three types of domains are defined, and we study the performance ofthe model under these different domain splits. Figure 8 shows the performance degra-dation for different domain partitions, the gap values are computed on the test set andaveraged over all measurement types. From the figure, we can conclude the following.1) Among several divisions, the size domain brings the largest performance degradation,which is consistent with daily experimental findings, where molecules of different sizesoften have very different properties. 2) As the noise level of the data set increases, theperformance degradation of different domains is somewhat mitigated, and the increaseddata to some extent increase the generalization ability of the model. In addition, thedegradation of the model performance is not further mitigated as the data continues toincrease, indicating that the increase in the amount of data brings limited improvementand that a truly effective method needs to be developed to address the DrugOOD problem.
6.1.4 Performance Drops of Different Noise Levels
We also investigated the ID and OOD performance at different noise levels. As shown inTable 8, we summarize different algorithms’ ID and OD performance under three noiselevels. From the table, one can observe that: 1) In the presence of more noise, the intro-duced noise produces pollution, which progressively affects the network’s performance.2) The increasing noise level brings more data, which provides more information aboutthe dataset. From the core to refined level, we can see a narrowing of the gap betweenID and OOD, however, the improvement from the refined level to general level reaches abottleneck without significant improvement. 3) By combining the above two points, wecan see that the introduction of large amounts of data with noise affects the learning ofthe model to a certain degree and affects its performance, but these noisy data, in turn,provide additional information so that the model is able to improve a small amount ofgeneralization ability.
30

Table 8: Baseline results on datasets: DrugOOD-lbap-core-ic50-assay (first row), DrugOOD-lbap-refined-ic50-assay (second row) and DrugOOD-lbap-general-ic50-size (third row)dataset. In-distribution (ID) results correspond to the train-to-train setting. Parenthesesshow standard deviation across 3 replicates.
Noise Algos Val (ID) Val (OOD) Test (ID) Test (OOD)ACC AUC ACC AUC ACC AUC ACC AUC
Core
ERM 89.05 (0.35) 89.91 (1.78) 88.79 (2.23) 70.32 (0.80) 89.34 (0.38) 89.62 (2.04 82.14 (0.86) 71.98 (0.29)IRM 88.14 (0.17) 82.82 (0.87) 90.67 (0.07) 68.23 (0.31) 88.39 (0.25) 83.10 (0.46 82.41 (0.20) 69.22 (0.51)
DeepCoral 88.59 (0.10) 88.10 (1.42) 91.09 (0.15) 70.26 (1.04) 88.88 (0.15) 88.23 (1.42 83.04 (0.08) 71.76 (0.60)DANN 88.47 (0.20) 83.39 (1.15) 91.32 (0.38) 68.30 (0.22) 88.72 (0.16) 83.20 (1.28 83.22 (0.10) 70.08 (0.65)Mixup 88.80 (0.52) 89.01 (2.06) 88.76 (1.92) 69.14 (0.56) 89.01 (0.43) 88.95 (2.17 81.65 (1.06) 71.34 (0.41)
GroupDro 88.80 (0.15) 89.42 (0.43) 89.81 (0.41) 70.34 (0.91) 88.96 (0.15) 89.24 (0.82 82.62 (0.23) 71.54 (0.46)
Refined
ERM 91.66 (0.11) 89.06 (0.63) 91.61 (0.52) 75.57 (0.16) 91.68 (0.08) 89.25 (0.64 84.85 (0.33) 72.70 (0.00)IRM 91.36 (0.08) 84.67 (0.91) 92.24 (0.13) 75.39 (0.32) 91.47 (0.08) 84.80 (0.95 85.17 (0.23) 71.68 (0.53)
DeepCoral 91.40 (0.05) 84.63 (0.85) 92.21 (0.23) 75.72 (0.47) 91.43 (0.04) 84.55 (0.84 85.23 (0.13) 71.45 (0.09)DANN 91.21 (0.12) 78.34 (0.20) 92.27 (0.31) 72.12 (0.39) 91.33 (0.16) 78.40 (0.24 85.09 (0.34) 67.20 (0.68)Mixup 91.47 (0.03) 87.30 (0.63) 92.25 (0.02) 75.67 (0.22) 91.57 (0.03) 87.36 (0.61 85.16 (0.11) 72.13 (0.21)
GroupDro 91.33 (0.10) 84.39 (1.72) 92.15 (0.28) 75.28 (0.23) 91.46 (0.15) 84.55 (2.20 85.20 (0.32) 71.40 (0.52)
General
ERM 88.91 (0.14) 85.17 (1.19) 82.48 (0.07) 74.04 (0.01) 89.21 (0.13) 85.19 (1.15 71.85 (0.08) 69.88 (0.13)IRM 88.37 (0.05) 80.77 (0.11) 82.37 (0.08) 73.11 (0.10) 88.67 (0.04) 80.75 (0.03 71.51 (0.07) 69.21 (0.16)
DeepCoral 88.41 (0.10) 81.01 (0.75) 82.43 (0.12) 73.57 (0.25) 88.71 (0.13) 81.00 (0.83 71.65 (0.08) 69.47 (0.13)DANN 87.77 (0.40) 76.47 (0.71) 81.87 (0.53) 70.40 (0.57) 88.08 (0.38) 75.82 (0.57 70.73 (0.54) 65.12 (0.94)Mixup 89.11 (0.31) 86.00 (1.15) 82.22 (0.28) 74.17 (0.02) 89.47 (0.23) 85.95 (1.19 71.74 (0.07) 69.87 (0.17)
GroupDro 88.35 (0.17) 81.06 (0.39) 82.39 (0.17) 73.45 (0.33) 88.68 (0.17) 81.31 (0.34 71.55 (0.06) 69.36 (0.09)
6.2 Structure Based Affinity Prediction (SBAP)
6.2.1 Setup
Compared with the LBAP task, the SBAP task considers target protein information. Inour benchmark, we represent proteins as protein sequences cause the ChEMBL databaseonly provide protein sequence information. However, DrugOOD can be easily extended byincorporating 3D structure information of targets by refering to protein sturcute deposit-ing database, such as PDB and uniprot (Consortium, 2014). This will be left as importantfuture work.
6.2.2 Model
We use a general SBAP prediction network that extracts molecular and protein featuresseparately, which are then concatenated together and fed into a fully connected layerto predict interaction probabilities. For the feature extraction of small molecules, wefollow the setting of LBAP task and use the same network and hyperparameters. Forprotein sequence, we use the pre-train BERT (Devlin et al., 2018): ’bert-base-uncase’ toextract a 768 dimensional protein feature. Then, the features of molecules and proteinare concatenated and fed into a one-layer fully connected layer to predict the interactionprobabilities.
6.2.3 Baseline Results
The results of different algorithms on sub-datasets with IC50 as measurement type andprotein as domain are shown in Table 9. From the table, we can see that: 1) The perfor-
31

Table 9: Baseline results on datasets: DrugOOD-sbap-core-ic50-protein (first row), DrugOOD-sbap-refined-ic50-protein (second row) and DrugOOD-sbap-general-ic50-protein (third row)dataset. In-distribution (ID) results correspond to the train-to-train setting. Parenthesesshow standard deviation across three replicates.
Noise Algos ID_VAL OOD_VAL ID_TEST OOD_TESTACC AUC ACC AUC ACC AUC ACC AUC
Core
ERM 89.28 (0.28) 90.83 (0.48) 84.22 (1.13) 74.12 (0.41) 89.32 (0.19) 90.71 (0.29 80.37 (1.32) 68.87 (0.53)IRM 88.94 (0.67) 88.93 (4.03) 82.61 (2.21) 74.10 (0.39) 89.04 (0.60) 88.81 (4.03 77.92 (4.25) 66.31 (0.45)
DeepCoral 89.03 (0.62) 90.86 (0.95) 82.11 (1.97) 74.12 (0.46) 89.17 (0.76) 90.65 (0.97 78.29 (2.39) 67.56 (1.01)DANN 88.23 (0.01) 84.58 (0.34) 84.93 (0.26) 71.47 (0.47) 88.54 (0.10) 84.49 (0.25 81.93 (0.51) 67.76 (0.41)Mixup 89.11 (0.15) 90.83 (0.38) 83.52 (2.61) 73.41 (0.73) 89.52 (0.20) 90.94 (0.32 80.37 (2.76) 67.97 (0.15)
GroupDro 89.05 (0.52) 89.49 (2.92) 83.26 (1.57) 74.10 (0.14) 89.22 (0.35) 89.26 (2.79 79.63 (2.41) 68.07 (0.98)
Refined
ERM 91.99 (0.26) 87.11 (1.50) 85.02 (0.31) 74.41 (0.09) 92.11 (0.20) 86.87 (1.41 83.17 (0.66) 69.51 (0.30)IRM 92.40 (0.12) 89.66 (0.63) 84.12 (0.14) 74.47 (0.15) 92.46 (0.13) 89.49 (0.74 81.73 (0.21) 69.30 (0.48)
DeepCoral 92.00 (0.03) 86.24 (0.15) 85.16 (0.33) 74.56 (0.25) 92.16 (0.09) 85.74 (0.24 83.41 (0.40) 69.27 (0.52)DANN 91.61 (0.13) 78.02 (0.54) 85.23 (0.17) 71.29 (0.17) 91.88 (0.15) 77.14 (0.64 83.42 (0.41) 66.58 (0.29)Mixup 92.01 (0.29) 86.58 (1.84) 85.39 (0.08) 74.25 (0.16) 92.18 (0.15) 86.02 (1.95 83.76 (0.13) 69.29 (0.19)
GroupDro 92.06 (0.17) 87.14 (0.47) 85.03 (0.16) 74.30 (0.22) 92.26 (0.09) 86.73 (0.33 83.22 (0.42) 69.40 (0.40)
General
ERM 91.16 (0.18) 85.62 (1.66) 85.61 (0.74) 73.67 (0.08) 90.95 (0.13) 85.34 (1.67 80.69 (0.95) 68.48 (0.27)IRM 90.87 (0.19) 82.78 (2.30) 85.81 (0.11) 73.61 (0.18) 90.70 (0.12) 82.68 (2.40 80.90 (0.34) 68.43 (0.33)
DeepCoral 90.82 (0.10) 82.22 (1.96) 86.00 (0.13) 73.34 (0.06) 90.63 (0.07) 81.98 (1.94 81.04 (0.60) 68.13 (0.73)DANN 90.84 (0.03) 80.96 (1.18) 85.90 (0.54) 71.52 (0.24) 90.70 (0.03) 80.20 (1.03 81.08 (0.82) 66.38 (0.29)Mixup 90.98 (0.18) 83.05 (1.63) 86.11 (0.20) 73.49 (0.28) 90.81 (0.19) 82.88 (1.70 81.32 (0.39) 68.45 (0.14)
GroupDro 90.77 (0.09) 82.53 (1.30) 85.69 (0.54) 73.36 (0.40) 90.59 (0.10) 82.43 (1.30 80.49 (1.07) 68.11 (0.38)
mance of OOD is degraded relative to that of ID. On the validation set of core noise level,the OOD performance of ERM degrades by 16.71% in AUC relative to the ID performance,while the performance drop expanded to 21.84% on test set. 2) OOD algorithms designedfor computer vision tasks hardly work in SBAP scenarios. The performance of algorithmsdesigned for OOD scenarios are difficult to match the performance of ERM, which meansin order to promote the development of AI aided drug discovery, it is necessary to designOOD algorithms with the consideration of characteristics of drug development scenarios.Next, we will further analyze the experimental results from different aspects.
6.2.4 Performance Gap of Different Domains
Different domain split methods may result in different distribution shifts, and thereforewill also bring different challenges to the algorithms. Here, we analyze 5 built-in domainsplits for the SBAP task. Figure 9 shows the performance gap of different domain splits.We conduct analysis under different noise levels and algorithms. The values of gap arecalculated on the testing set and averaged over all measurements types. From Figure 9,we can see that: 1) The noise level of the dataset has a great impact on the performancegap of ID and OOD. On one hand, each noise level has a different domain split methodthat can bring the biggest performance gap across all algorithms. For example, in corenoise level, the domain ’protein family’ brings the largest performance gap across all al-gorithms, while it changes to be ’size’ in refined noise level. On the other hand, as thenoise level increases, the performance gap gradually narrows. Combining with Table 9,we observe that this is caused by the degradation of ID performance. 2) Among all do-main split methods, the gap brought by scaffold is relatively small. We speculate that this
32

ERM IRM CORAL DANN MIXUP GroupDro0
10
20
30
assay protein protein_familyscaffold size
algorithm
perf
orm
ance
gap
ERM IRM CORAL DANN MIXUP GroupDro0
5
10
15
20
assay protein protein_familyscaffold size
algorithm
perf
orm
ance
gap
ERM IRM CORAL DANN MIXUP GroupDro0
5
10
15
20
assay protein protein_familyscaffold size
algorithm
perf
orm
ance
gap
Figure 9: Performance gap on AUC of different domain splits with different noise levelsand OOD algorithms on the DrugOOD-sbap datasets. The gap values are calculated on theOOD test set and averaged over four measurement types. Left to right: core noise level,refined noise level, general noise level. Color indicates domain splits for SBAP tasks.
may be due to the fact that scaffold split induces more domain than other split methods,which makes the training set cover a wider portion of the underlying distribution.
core refined generalnoise level
55
60
65
70
75
80
85
90
95
ID a
nd O
OD p
erfo
rman
ce o
f diff
eren
t noi
se
Algorithm = ERM
core refined generalnoise level
Algorithm = IRM
core refined generalnoise level
Algorithm = CORAL
core refined generalnoise level
Algorithm = GroupDro
splitID(AUC)OOD(AUC)
domainassayscaffoldsizeproteinprotein_family
Figure 10: ID and OOD performance with different noise levels. Left to right: ERM,IRM, DeepCoral, GroupDro. Blue color indicates the ID performance while orange colordenotes the OOD performance.
6.2.5 Study for Different Noise Levels
Here, we study the effect of different noise levels on ID and OOD performance. Figure 10shows the ID and OOD performance of 4 algorithms with different noises. The valuesare averaged over all measurement types. It can be seen that the performance of IDgenerally decreases with the increase of noise level. The introduction of noise hurts theperformance of the model despite the larger amount of data, which suggests that weneed to pay more attention to the noise of the data source in the realistic scenario. Howto design an algorithm that is robust to both noise and distribution shift is a worthyresearch direction. As for OOD performance, we can see that different domain splitshows different changing trend while the noise level increases. However, we notice thatthe OOD performance of different algorithms under a particular domain exhibits similarbehavior for ERM, which means that existing OOD algorithms do not incorporate thenoise of the real scene, nor are they designed to mitigate its impact.
33

core refined generalnoise level
0
20
40
60
80
Aver
age
Perfo
rman
ce o
f ID
measurement typeEC50IC50KiPotency
(a)
core refined generalnoise level
0
10
20
30
40
50
60
70
Aver
age
Perfo
rman
ce o
f OOD
measurement typeEC50IC50KiPotency
ERM IRM CORAL GroupDroalgorithm
0
20
40
60
80
Aver
age
Perfo
rman
ce o
f ID
measurement typeEC50IC50KiPotency
(b)
ERM IRM CORAL GroupDroalgorithm
0
10
20
30
40
50
60
70
Aver
age
Perfo
rman
ce o
f OOD
measurement typeEC50IC50KiPotency
Figure 11: Average performance of ID (left) and OOD (right) for different measurementtypes. We present the performance of varying measurement types with the change ofnoise levels (a) and OOD algorithms (b).
6.2.6 Study for Different Measurement Types
The automated dataset curator supports variant measurement types, e.g., EC50, IC50. Asdifferent measurement types will generate datasets with different distributions and noise,we analyze the performance of different measurement types by varying the noise levelsand algorithms. The results are shown in Figure 11. One can see that: 1) As a result of dif-ferent measurement types, ID and OOD performance can differ, for example, the Potencymeasurement is generally low in both ID and OOD, possibly due to the high noise levelin the Potency measurement. 2) Our benchmark algorithms are robust to measurementtypes since they have acceptable accuracy for almost all types of measurement.
7. Discussions and Future Work
In this work we have presented an automated dataset curator and benchmark based onthe large-scale bioassay deposition website ChEMBL, in order to facilitate OOD researchfor AI-aided drug discovery. It is very worthwhile to explore more in the followingrespects.
As observed in current benchmark results, existing general OOD methods do notsignificantly outperform the baseline ERM method. Most of these OOD methods are de-signed and validated with visual and/or textual data, which may fail in capturing criticalinformation for the affinity prediction problem. This implies that to further improve theperformance under various out-of-distribution scenarios, it is essential to develop moreadvanced OOD methods, particularly with drug-related domain knowledge integrated.
34

Another key characteristic of DrugOOD database is that the majority of data falls into thehighest noise level (“general”). Simply discarding such noisy labels and only referring tohigh-quality ones may severely limit the model performance due to insufficient trainingdata. It could be worth investigating that whether large-scale unsupervised pre-trainingcan be utilized to construct better representations for molecules and target proteins, whichare critical to accurate affinity predictions.
Additionally, learning with noisy labels has been extensively studied in the generalcontext, but it may be crucial to take the generation process of noisy affinity annotationsinto consideration. This includes different experimental precision, measurement types,activity relation annotation types, etc. It is possible that the data quality can be furtherimproved with carefully-designed denoising techniques, so that more accurate affinityprediction models can be trained.
35
References
Aliper, Alexander, Plis, Sergey, Artemov, Artem, Ulloa, Alvaro, Mamoshina, Polina, andZhavoronkov, Alex. Deep learning applications for predicting pharmacological proper-ties of drugs and drug repurposing using transcriptomic data. Molecular pharmaceutics,13(7):2524–2530, 2016.
Angluin, Dana and Laird, Philip. Learning from noisy examples. Machine Learning, 2(4):343–370, 1988.
Arjovsky, Martin, Bottou, Léon, Gulrajani, Ishaan, and Lopez-Paz, David. Invariant riskminimization. arXiv preprint arXiv:1907.02893, 2019.
Asilar, Ece, Hemmerich, Jennifer, and Ecker, Gerhard F. Image based liver toxicity predic-tion. Journal of chemical information and modeling, 60(3):1111–1121, 2020.
Azadi, Samaneh, Feng, Jiashi, Jegelka, Stefanie, and Darrell, Trevor. Auxiliary imageregularization for deep cnns with noisy labels. In ICLR, 2016.
Baek, Minkyung, DiMaio, Frank, Anishchenko, Ivan, Dauparas, Justas, Ovchinnikov,Sergey, Lee, Gyu Rie, Wang, Jue, Cong, Qian, Kinch, Lisa N, Schaeffer, R Dustin,et al. Accurate prediction of protein structures and interactions using a 3-track net-work. bioRxiv, 2021.
Ballester, Pedro J. and Mitchell, John B. O. A machine learning approach to predictingprotein–ligand binding affinity with applications to molecular docking. Bioinformatics,26(9):1169–1175, March 2010. doi: 10.1093/bioinformatics/btq112. URL https://doi.org/10.1093/bioinformatics/btq112.
Bao, Jingxiao, He, Xiao, and Zhang, John ZH. Deepbsp—a machine learning method foraccurate prediction of protein–ligand docking structures. Journal of Chemical Informationand Modeling, 2021.
Beery, Sara, Van Horn, Grant, and Perona, Pietro. Recognition in terra incognita. InProceedings of the European conference on computer vision (ECCV), pp. 456–473, 2018.
Bender, Andreas and Cortés-Ciriano, Isidro. Artificial intelligence in drug discovery:what is realistic, what are illusions? part 1: ways to make an impact, and why we arenot there yet. Drug discovery today, 26(2):511–524, 2021.
Brandes, Nadav, Ofer, Dan, Peleg, Yam, Rappoport, Nadav, and Linial, Michal. Protein-bert: A universal deep-learning model of protein sequence and function. bioRxiv, 2021.
Breiman, Leo. Random forests. Machine learning, 45(1):5–32, 2001.
Burden, Frank R. and Winkler, David A. Robust qsar models using bayesian regularizedneural networks. Journal of Medicinal Chemistry, 42(16):3183–3187, 1999.
Burley, Stephen K, Bhikadiya, Charmi, Bi, Chunxiao, Bittrich, Sebastian, Chen, Li,Crichlow, Gregg V, Christie, Cole H, Dalenberg, Kenneth, Di Costanzo, Luigi, Duarte,
36

Jose M, Dutta, Shuchismita, Feng, Zukang, Ganesan, Sai, Goodsell, David S, Ghosh, Su-tapa, Green, Rachel Kramer, Guranovic, Vladimir, Guzenko, Dmytro, Hudson, Brian P,Lawson, Catherine L, Liang, Yuhe, Lowe, Robert, Namkoong, Harry, Peisach, Ezra,Persikova, Irina, Randle, Chris, Rose, Alexander, Rose, Yana, Sali, Andrej, Segura, Joan,Sekharan, Monica, Shao, Chenghua, Tao, Yi-Ping, Voigt, Maria, Westbrook, John D,Young, Jasmine Y, Zardecki, Christine, and Zhuravleva, Marina. Rcsb protein databank: powerful new tools for exploring 3d structures of biological macromolecules forbasic and applied research and education in fundamental biology, biomedicine, biotech-nology, bioengineering and energy sciences. Nucleic Acids Research, 49(D1):D437–D451,11 2020. ISSN 0305-1048.
Carlson, Heather A and Dunbar Jr, James B. A call to arms: what you can do for compu-tational drug discovery, 2011.
Chang, Shiyu, Zhang, Yang, Yu, Mo, and Jaakkola, Tommi. Invariant rationalization. InInternational Conference on Machine Learning, pp. 1448–1458. PMLR, 2020.
Chen, Binghong, Li, Chengtao, Dai, Hanjun, and Song, Le. Retro*: learning retrosyntheticplanning with neural guided a* search. In International Conference on Machine Learning,pp. 1608–1616. PMLR, 2020.
Chen, Kai, Wang, Jiaqi, Pang, Jiangmiao, Cao, Yuhang, Xiong, Yu, Li, Xiaoxiao, Sun,Shuyang, Feng, Wansen, Liu, Ziwei, Xu, Jiarui, Zhang, Zheng, Cheng, Dazhi, Zhu,Chenchen, Cheng, Tianheng, Zhao, Qijie, Li, Buyu, Lu, Xin, Zhu, Rui, Wu, Yue, Dai,Jifeng, Wang, Jingdong, Shi, Jianping, Ouyang, Wanli, Change Loy, Chen, and Lin,Dahua. MMDetection: Open MMLab Detection Toolbox and Benchmark. arXiv e-prints,art. arXiv:1906.07155, June 2019.
Chuang, Ching-Yao and Mroueh, Youssef. Fair mixup: Fairness via interpolation. InInternational Conference on Learning Representations, 2021.
Coley, Connor W, Rogers, Luke, Green, William H, and Jensen, Klavs F. Computer-assisted retrosynthesis based on molecular similarity. ACS central science, 3(12):1237–1245, 2017.
Consortium, The UniProt. UniProt: a hub for protein information. Nucleic Acids Research,43(D1):D204–D212, 10 2014. ISSN 0305-1048. doi: 10.1093/nar/gku989. URL https://doi.org/10.1093/nar/gku989.
Cortés-Ciriano, Isidro and Bender, Andreas. How consistent are publicly reported cyto-toxicity data? large-scale statistical analysis of the concordance of public independentcytotoxicity measurements. ChemMedChem, 11(1):57–71, 2016.
Dahl, George E., Jaitly, Navdeep, and Salakhutdinov, Ruslan. Multi-task neural networksfor qsar predictions, 2014.
Davies, Mark, Nowotka, Michał, Papadatos, George, Dedman, Nathan, Gaulton, Anna,Atkinson, Francis, Bellis, Louisa, and Overington, John P. Chembl web services: stream-lining access to drug discovery data and utilities. Nucleic acids research, 43(W1):W612–W620, Jul 2015. ISSN 1362-4962.
37

Deng, Jianyuan, Yang, Zhibo, Ojima, Iwao, Samaras, Dimitris, and Wang, Fusheng.Artificial intelligence in drug discovery: applications and techniques. arXiv preprintarXiv:2106.05386, 2021.
Devlin, Jacob, Chang, Ming-Wei, Lee, Kenton, and Toutanova, Kristina. Bert: Pre-training of deep bidirectional transformers for language understanding. arXiv preprintarXiv:1810.04805, 2018.
Duvenaud, David, Maclaurin, Dougal, Aguilera-Iparraguirre, Jorge, Gómez-Bombarelli,Rafael, Hirzel, Timothy, Aspuru-Guzik, Alán, and Adams, Ryan P. Convolu-tional networks on graphs for learning molecular fingerprints. In Cortes, Corinna,Lawrence, Neil D., Lee, Daniel D., Sugiyama, Masashi, and Garnett, Roman (eds.),Advances in Neural Information Processing Systems 28: Annual Conference on NeuralInformation Processing Systems 2015, December 7-12, 2015, Montreal, Quebec, Canada,pp. 2224–2232, 2015. URL https://proceedings.neurips.cc/paper/2015/hash/f9be311e65d81a9ad8150a60844bb94c-Abstract.html.
Fang, Chen, Xu, Ye, and Rockmore, Daniel N. Unbiased metric learning: On the utiliza-tion of multiple datasets and web images for softening bias. In Proceedings of the IEEEInternational Conference on Computer Vision, pp. 1657–1664, 2013.
Feinberg, Evan N, Joshi, Elizabeth, Pande, Vijay S, and Cheng, Alan C. Improvement inadmet prediction with multitask deep featurization. Journal of medicinal chemistry, 63(16):8835–8848, 2020.
Ganin, Yaroslav, Ustinova, Evgeniya, Ajakan, Hana, Germain, Pascal, Larochelle, Hugo,Laviolette, Francois, Marchand, Mario, and Lempitsky, Victor. Domain-adversarialtraining of neural networks. The journal of machine learning research, 17(1):2096–2030,2016.
Gao, Wenhao, Mahajan, Sai Pooja, Sulam, Jeremias, and Gray, Jeffrey J. Deep learning inprotein structural modeling and design. Patterns, pp. 100142, 2020.
Ghifary, Muhammad, Kleijn, W Bastiaan, Zhang, Mengjie, and Balduzzi, David. Domaingeneralization for object recognition with multi-task autoencoders. In Proceedings of theIEEE International Conference on Computer Vision, pp. 2551–2559, 2015.
Gilmer, Justin, Schoenholz, Samuel S, Riley, Patrick F, Vinyals, Oriol, and Dahl, George E.Neural message passing for quantum chemistry. In International Conference on MachineLearning, pp. 1263–1272. PMLR, 2017.
Gilson, Michael K, Liu, Tiqing, Baitaluk, Michael, Nicola, George, Hwang, Linda, andChong, Jenny. Bindingdb in 2015: a public database for medicinal chemistry, com-putational chemistry and systems pharmacology. Nucleic acids research, 44(D1):D1045–D1053, 2016.
Glen, Robert C, Bender, Andreas, Arnby, Catrin H, Carlsson, Lars, Boyer, Scott, andSmith, James. Circular fingerprints: flexible molecular descriptors with applicationsfrom physical chemistry to adme. IDrugs, 9(3):199, 2006.
38

Goel, Karan, Gu, Albert, Li, Yixuan, and Ré, Christopher. Model patching: Closing thesubgroup performance gap with data augmentation. arXiv preprint arXiv:2008.06775,2020.
Goh, Garrett B, Hodas, Nathan O, Siegel, Charles, and Vishnu, Abhinav. Smiles2vec: Aninterpretable general-purpose deep neural network for predicting chemical properties.arXiv preprint arXiv:1712.02034, 2017.
Gulrajani, Ishaan and Lopez-Paz, David. In search of lost domain generalization. arXivpreprint arXiv:2007.01434, 2020.
Gysi, Deisy Morselli, Do Valle, Ítalo, Zitnik, Marinka, Ameli, Asher, Gan, Xiao, Varol,Onur, Ghiassian, Susan Dina, Patten, JJ, Davey, Robert A, Loscalzo, Joseph, et al. Net-work medicine framework for identifying drug-repurposing opportunities for covid-19.Proceedings of the National Academy of Sciences, 118(19), 2021.
Han, Bo, Yao, Jiangchao, Niu, Gang, Zhou, Mingyuan, Tsang, Ivor, Zhang, Ya, andSugiyama, Masashi. Masking: A new perspective of noisy supervision. In NeurIPS,pp. 5836–5846, 2018a.
Han, Bo, Yao, Quanming, Yu, Xingrui, Niu, Gang, Xu, Miao, Hu, Weihua, Tsang, Ivor,and Sugiyama, Masashi. Co-teaching: Robust training of deep neural networks withextremely noisy labels. In NeurIPS, pp. 8527–8537, 2018b.
Han, Bo, Yao, Quanming, Liu, Tongliang, Niu, Gang, Tsang, Ivor W, Kwok, James T, andSugiyama, Masashi. A survey of label-noise representation learning: Past, present andfuture. arXiv preprint arXiv:2011.04406, 2020.
Han, Jiangfan, Luo, Ping, and Wang, Xiaogang. Deep self-learning from noisy labels. InICCV, 2019.
He, Yue, Shen, Zheyan, and Cui, Peng. Towards non-iid image classification: A datasetand baselines. Pattern Recognition, 110:107383, 2021.
Hirohara, Maya, Saito, Yutaka, Koda, Yuki, Sato, Kengo, and Sakakibara, Yasubumi. Con-volutional neural network based on smiles representation of compounds for detectingchemical motif. BMC bioinformatics, 19(19):83–94, 2018.
Hu, Peng-Wei, Chan, Keith CC, and You, Zhu-Hong. Large-scale prediction of drug-target interactions from deep representations. In 2016 international joint conference onneural networks (IJCNN), pp. 1236–1243. IEEE, 2016.
Hu, Ruifeng, Xu, Haodong, Jia, Peilin, and Zhao, Zhongming. KinaseMD: kinase mu-tations and drug response database. Nucleic Acids Research, 49(D1):D552–D561, 112020. ISSN 0305-1048. doi: 10.1093/nar/gkaa945. URL https://doi.org/10.1093/nar/gkaa945.
Hu, Weihua, Fey, Matthias, Zitnik, Marinka, Dong, Yuxiao, Ren, Hongyu, Liu, Bowen,Catasta, Michele, and Leskovec, Jure. Open Graph Benchmark: Datasets for MachineLearning on Graphs. arXiv e-prints, art. arXiv:2005.00687, May 2020.
39

Huang, Kexin, Fu, Tianfan, Gao, Wenhao, Zhao, Yue, Roohani, Yusuf, Leskovec, Jure,Coley, Connor W, Xiao, Cao, Sun, Jimeng, and Zitnik, Marinka. Therapeutics datacommons: machine learning datasets and tasks for therapeutics. arXiv preprintarXiv:2102.09548, 2021.
Issa, Naiem T, Stathias, Vasileios, Schürer, Stephan, and Dakshanamurthy, Sivanesan.Machine and deep learning approaches for cancer drug repurposing. In Seminars incancer biology, volume 68, pp. 132–142. Elsevier, 2021.
Jiang, Dejun, Hsieh, Chang-Yu, Wu, Zhenxing, Kang, Yu, Wang, Jike, Wang, Ercheng,Liao, Ben, Shen, Chao, Xu, Lei, Wu, Jian, Cao, Dongsheng, and Hou, Tingjun. In-teractionGraphNet: A novel and efficient deep graph representation learning frame-work for accurate protein–ligand interaction predictions. Journal of Medicinal Chem-istry, 64(24):18209–18232, December 2021. doi: 10.1021/acs.jmedchem.1c01830. URLhttps://doi.org/10.1021/acs.jmedchem.1c01830.
Jiang, Lu, Zhou, Zhengyuan, Leung, Thomas, Li, Li-Jia, and Fei-Fei, Li. Mentornet: Learn-ing data-driven curriculum for very deep neural networks on corrupted labels. In ICML,pp. 2304–2313, 2018.
Jiménez, José, Skalic, Miha, Martinez-Rosell, Gerard, and De Fabritiis, Gianni. K deep:protein–ligand absolute binding affinity prediction via 3d-convolutional neural net-works. Journal of chemical information and modeling, 58(2):287–296, 2018.
Jing, Yankang, Bian, Yuemin, Hu, Ziheng, Wang, Lirong, and Xie, Xiang-Qun Sean. Deeplearning for drug design: an artificial intelligence paradigm for drug discovery in thebig data era. The AAPS journal, 20(3):1–10, 2018.
Johnson, M. A. and Maggiora, G. M. Concepts and applications of molecular similarity.Wiley, 1990.
Jumper, John, Evans, Richard, Pritzel, Alexander, Green, Tim, Figurnov, Michael, Ron-neberger, Olaf, Tunyasuvunakool, Kathryn, Bates, Russ, Zidek, Augustin, Potapenko,Anna, et al. Highly accurate protein structure prediction with alphafold. Nature, 596(7873):583–589, 2021.
Karimi, Mostafa, Wu, Di, Wang, Zhangyang, and Shen, Yang. Deepaffinity: interpretabledeep learning of compound–protein affinity through unified recurrent and convolu-tional neural networks. Bioinformatics, 35(18):3329–3338, 2019.
Kearnes, Steven, McCloskey, Kevin, Berndl, Marc, Pande, Vijay, and Riley, Patrick. Molec-ular graph convolutions: moving beyond fingerprints. Journal of computer-aided moleculardesign, 30(8):595–608, 2016.
Keiser, Michael J., Roth, Bryan L., Armbruster, Blaine N., Ernsberger, Paul, Irwin, John J.,and Shoichet, Brian K. Relating protein pharmacology by ligand chemistry. NatureBiotechnology, 25(2):197–206, Feb 2007. ISSN 1546-1696. doi: 10.1038/nbt1284. URLhttps://doi.org/10.1038/nbt1284.
40
Kim, Ryangguk and Skolnick, Jeffrey. Assessment of programs for ligand binding affinityprediction. Journal of Computational Chemistry, 29(8):1316–1331, 2008.
Kipf, Thomas N and Welling, Max. Semi-supervised classification with graph convolu-tional networks. arXiv preprint arXiv:1609.02907, 2016.
Kleinbaum, David G, Dietz, K, Gail, M, Klein, Mitchel, and Klein, Mitchell. Logisticregression. Springer, 2002.
Koes, David Ryan, Baumgartner, Matthew P, and Camacho, Carlos J. Lessons learnedin empirical scoring with smina from the csar 2011 benchmarking exercise. Journal ofchemical information and modeling, 53(8):1893–1904, 2013.
Koh, Pang Wei, Sagawa, Shiori, Marklund, Henrik, Xie, Sang Michael, Zhang, Marvin,Balsubramani, Akshay, Hu, Weihua, Yasunaga, Michihiro, Phillips, Richard Lanas, Gao,Irena, Lee, Tony, David, Etienne, Stavness, Ian, Guo, Wei, Earnshaw, Berton, Haque, Im-ran, Beery, Sara M, Leskovec, Jure, Kundaje, Anshul, Pierson, Emma, Levine, Sergey,Finn, Chelsea, and Liang, Percy. Wilds: A benchmark of in-the-wild distributionshifts. In Meila, Marina and Zhang, Tong (eds.), Proceedings of the 38th InternationalConference on Machine Learning, volume 139 of Proceedings of Machine Learning Research,pp. 5637–5664. PMLR, 18–24 Jul 2021. URL https://proceedings.mlr.press/v139/koh21a.html.
Koyama, Masanori and Yamaguchi, Shoichiro. Out-of-distribution generalization withmaximal invariant predictor. arXiv preprint arXiv:2008.01883, 2020.
Koyama, Masanori and Yamaguchi, Shoichiro. When is invariance useful in an out-of-distribution generalization problem ?, 2021.
Kramer, Christian, Kalliokoski, Tuomo, Gedeck, Peter, and Vulpetti, Anna. The experi-mental uncertainty of heterogeneous public k i data. Journal of medicinal chemistry, 55(11):5165–5173, 2012.
Krueger, David, Caballero, Ethan, Jacobsen, Joern-Henrik, Zhang, Amy, Binas, Jonathan,Zhang, Dinghuai, Le Priol, Remi, and Courville, Aaron. Out-of-distribution general-ization via risk extrapolation (rex). In International Conference on Machine Learning, pp.5815–5826. PMLR, 2021a.
Krueger, David, Caballero, Ethan, Jacobsen, Joern-Henrik, Zhang, Amy, Binas, Jonathan,Zhang, Dinghuai, Priol, Remi Le, and Courville, Aaron. Out-of-distribution general-ization via risk extrapolation (rex). In Proceedings of the 38th International Conference onMachine Learning, volume 139, pp. 5815–5826. PMLR, Jul 2021b.
Kwon, Sunyoung, Bae, Ho, Jo, Jeonghee, and Yoon, Sungroh. Comprehensive ensem-ble in qsar prediction for drug discovery. BMC Bioinformatics, 20(1):521, Oct 2019.ISSN 1471-2105. doi: 10.1186/s12859-019-3135-4. URL https://doi.org/10.1186/s12859-019-3135-4.
Laine, Samuli and Aila, Timo. Temporal ensembling for semi-supervised learning. InICLR, 2017.
41

Landrum, Greg. Rdkit: A software suite for cheminformatics, computational chemistry,and predictive modeling, 2013.
Lazic, Stanley E and Williams, Dominic P. Quantifying sources of uncertainty in drugdiscovery predictions with probabilistic models. Artificial Intelligence in the Life Sciences,pp. 100004, 2021.
Li, Da, Yang, Yongxin, Song, Yi-Zhe, and Hospedales, Timothy M. Deeper, broader andartier domain generalization. In Proceedings of the IEEE international conference on com-puter vision, pp. 5542–5550, 2017.
Li, Haoliang, Pan, Sinno Jialin, Wang, Shiqi, and Kot, Alex C. Domain generalization withadversarial feature learning. In Proceedings of the IEEE Conference on Computer Vision andPattern Recognition, pp. 5400–5409, 2018.
Li, Junnan, Socher, Richard, and Hoi, Steven CH. Dividemix: Learning with noisy labelsas semi-supervised learning. In ICLR, 2020.
Li, Mufei, Zhou, Jinjing, Hu, Jiajing, Fan, Wenxuan, Zhang, Yangkang, Gu, Yaxin, andKarypis, George. Dgl-lifesci: An open-source toolkit for deep learning on graphs in lifescience. ACS omega, 6(41):27233–27238, 2021a.
Li, Shuangli, Zhou, Jingbo, Xu, Tong, Huang, Liang, Wang, Fan, Xiong, Haoyi, Huang,Weili, Dou, Dejing, and Xiong, Hui. Structure-aware interactive graph neural networksfor the prediction of protein-ligand binding affinity. In Proceedings of the 27th ACMSIGKDD Conference on Knowledge Discovery & Data Mining, pp. 975–985, 2021b.
Lim, Jaechang, Ryu, Seongok, Park, Kyubyong, Choe, Yo Joong, Ham, Jiyeon, and Kim,Woo Youn. Predicting drug–target interaction using a novel graph neural networkwith 3d structure-embedded graph representation. Journal of chemical information andmodeling, 59(9):3981–3988, 2019.
Lim, Sangsoo, Lu, Yijingxiu, Cho, Chang Yun, Sung, Inyoung, Kim, Jungwoo, Kim,Youngkuk, Park, Sungjoon, and Kim, Sun. A review on compound-protein interac-tion prediction methods: Data, format, representation and model. Computational andStructural Biotechnology Journal, 19:1541, 2021.
Liu, Tongliang and Tao, Dacheng. Classification with noisy labels by importance reweight-ing. TPAMI, 38(3):447–461, 2015.
Liu, Zhihai, Li, Yan, Han, Li, Li, Jie, Liu, Jie, Zhao, Zhixiong, Nie, Wei, Liu, Yuchen, andWang, Renxiao. Pdb-wide collection of binding data: current status of the pdbbinddatabase. Bioinformatics, 31(3):405–412, 10 2014. ISSN 1367-4803.
Liu, Ziwei, Luo, Ping, Wang, Xiaogang, and Tang, Xiaoou. Deep learning face attributesin the wild. In Proceedings of the IEEE international conference on computer vision, pp.3730–3738, 2015.
42

Long, Mingsheng, Cao, Yue, Wang, Jianmin, and Jordan, Michael. Learning transferablefeatures with deep adaptation networks. In International conference on machine learning,pp. 97–105. PMLR, 2015.
Lu, Chengqiang, Liu, Qi, Wang, Chao, Huang, Zhenya, Lin, Peize, and He, Lixin. Molec-ular property prediction: A multilevel quantum interactions modeling perspective. InProceedings of the AAAI Conference on Artificial Intelligence, volume 33, pp. 1052–1060,2019.
Luco, Juan M. and Ferretti, Ferdinando H. Qsar based on multiple linear regression andpls methods for the anti-hiv activity of a large group of hept derivatives. Journal ofChemical Information and Computer Sciences, 37(2):392–401, 1997.
Lukasik, Michal, Bhojanapalli, Srinadh, Menon, Aditya Krishna, and Kumar, Sanjiv. Doeslabel smoothing mitigate label noise? In ICML, 2020.
Ma, Hehuan, Bian, Yatao, Rong, Yu, Huang, Wenbing, Xu, Tingyang, Xie, Weiyang, Ye,Geyan, and Huang, Junzhou. Multi-view graph neural networks for molecular propertyprediction. arXiv preprint arXiv:2005.13607, 2020.
Mamoshina, Polina, Volosnikova, Marina, Ozerov, Ivan V, Putin, Evgeny, Skibina, Eka-terina, Cortese, Franco, and Zhavoronkov, Alex. Machine learning on human muscletranscriptomic data for biomarker discovery and tissue-specific drug target identifica-tion. Frontiers in genetics, 9:242, 2018.
Martin, Eric J., Polyakov, Valery R., Tian, Li, and Perez, Rolando C. Profile-qsar 2.0: Kinasevirtual screening accuracy comparable to four-concentration ic50s for realistically novelcompounds. Journal of Chemical Information and Modeling, 57(8):2077–2088, 2017. doi:10.1021/acs.jcim.7b00166. URL https://doi.org/10.1021/acs.jcim.7b00166. PMID:28651433.
Mayr, Andreas, Klambauer, Günter, Unterthiner, Thomas, Steijaert, Marvin, Wegner,Jörg K, Ceulemans, Hugo, Clevert, Djork-Arné, and Hochreiter, Sepp. Large-scale com-parison of machine learning methods for drug target prediction on chembl. Chemicalscience, 9(24):5441–5451, 2018.
McNutt, Andrew T, Francoeur, Paul, Aggarwal, Rishal, Masuda, Tomohide, Meli, Rocco,Ragoza, Matthew, Sunseri, Jocelyn, and Koes, David Ryan. Gnina 1.0: molecular dock-ing with deep learning. Journal of cheminformatics, 13(1):1–20, 2021.
Mendez, David, Gaulton, Anna, Bento, A Patrícia, Chambers, Jon, De Veij, Marleen, Félix,Eloy, Magariños, María Paula, Mosquera, Juan F, Mutowo, Prudence, Nowotka, Michał,et al. Chembl: towards direct deposition of bioassay data. Nucleic acids research, 47(D1):D930–D940, 2019.
Min, Seonwoo, Park, Seunghyun, Kim, Siwon, Choi, Hyun-Soo, Lee, Byunghan, andYoon, Sungroh. Pre-training of deep bidirectional protein sequence representationswith structural information. IEEE Access, 9:123912–123926, 2021.
43

Morgan, HL. The generation of a unique machine description for chemical structures-atechnique developed at chemical abstracts service. J. Chemical Documentation, 5:107–113,1965.
Muratov, Eugene N, Bajorath, Jürgen, Sheridan, Robert P, Tetko, Igor V, Filimonov, Dmitry,Poroikov, Vladimir, Oprea, Tudor I, Baskin, Igor I, Varnek, Alexandre, Roitberg, Adrian,et al. Qsar without borders. Chemical Society Reviews, 49(11):3525–3564, 2020.
Nosengo, Nicola. Can you teach old drugs new tricks? Nature News, 534(7607):314, 2016.
Pan, Sinno Jialin and Yang, Qiang. A survey on transfer learning. IEEE Transactions onknowledge and data engineering, 22(10):1345–1359, 2009.
Paul, Debleena, Sanap, Gaurav, Shenoy, Snehal, Kalyane, Dnyaneshwar, Kalia, Kiran, andTekade, Rakesh K. Artificial intelligence in drug discovery and development. DrugDiscovery Today, 26(1):80, 2021.
Peng, Xingchao, Bai, Qinxun, Xia, Xide, Huang, Zijun, Saenko, Kate, and Wang, Bo.Moment matching for multi-source domain adaptation. In Proceedings of the IEEE/CVFInternational Conference on Computer Vision, pp. 1406–1415, 2019.
Pham, Thai-Hoang, Qiu, Yue, Zeng, Jucheng, Xie, Lei, and Zhang, Ping. A deep learn-ing framework for high-throughput mechanism-driven phenotype compound screen-ing and its application to covid-19 drug repurposing. Nature Machine Intelligence, 3(3):247–257, 2021.
Pradeep, Prachi, Povinelli, Richard J, White, Shannon, and Merrill, Stephen J. An ensem-ble model of qsar tools for regulatory risk assessment. Journal of Cheminformatics, 8(1):1–9, 2016.
Pushpakom, Sudeep, Iorio, Francesco, Eyers, Patrick A, Escott, K Jane, Hopper, Shirley,Wells, Andrew, Doig, Andrew, Guilliams, Tim, Latimer, Joanna, McNamee, Christine,et al. Drug repurposing: progress, challenges and recommendations. Nature reviewsDrug discovery, 18(1):41–58, 2019.
Qiao, Fengchun, Zhao, Long, and Peng, Xi. Learning to learn single domain generaliza-tion. In Proceedings of the IEEE/CVF Conference on Computer Vision and Pattern Recognition(CVPR), June 2020.
Ramsundar, Bharath, Kearnes, Steven, Riley, Patrick, Webster, Dale, Konerding, David,and Pande, Vijay. Massively multitask networks for drug discovery. arXiv preprintarXiv:1502.02072, 2015.
Ren, Mengye, Zeng, Wenyuan, Yang, Bin, and Urtasun, Raquel. Learning to reweightexamples for robust deep learning. In ICML, 2018.
Rogers, David and Hahn, Mathew. Extended-connectivity fingerprints. Journal of chemicalinformation and modeling, 50(5):742–754, 2010.
44
Romera-Paredes, Bernardino and Torr, Philip. An embarrassingly simple approach tozero-shot learning. In International conference on machine learning, pp. 2152–2161. PMLR,2015.
Rong, Yu, Bian, Yatao, Xu, Tingyang, Xie, Weiyang, Wei, Ying, Huang, Wenbing, andHuang, Junzhou. Self-supervised graph transformer on large-scale molecular data. InNeurIPS, 2020.
Roth, Bryan L, Lopez, Estelle, Patel, Shamil, and Kroeze, Wesley K. The multiplicity ofserotonin receptors: uselessly diverse molecules or an embarrassment of riches? TheNeuroscientist, 6(4):252–262, 2000.
Sagawa, Shiori, Koh, Pang Wei, Hashimoto, Tatsunori B, and Liang, Percy. Distribution-ally robust neural networks for group shifts: On the importance of regularization forworst-case generalization. arXiv preprint arXiv:1911.08731, 2019.
Sagawa, Shiori, Raghunathan, Aditi, Koh, Pang Wei, and Liang, Percy. An investigation ofwhy overparameterization exacerbates spurious correlations. In International Conferenceon Machine Learning, pp. 8346–8356. PMLR, 2020.
Sagawa, Shiori, Koh, Pang Wei, Lee, Tony, Gao, Irena, Xie, Sang Michael, Shen, Kendrick,Kumar, Ananya, Hu, Weihua, Yasunaga, Michihiro, Marklund, Henrik, et al. Extend-ing the wilds benchmark for unsupervised adaptation. arXiv preprint arXiv:2112.05090,2021.
Sanchez-Lengeling, Benjamin, Outeiral, Carlos, Guimaraes, Gabriel L, and Aspuru-Guzik,Alán. Optimizing distributions over molecular space. an objective-reinforced generativeadversarial network for inverse-design chemistry (organic). 2017.
Sanger, Frederick. The arrangement of amino acids in proteins. Advances in protein chem-istry, 7:1–67, 1952.
Satorras, Victor Garcia, Hoogeboom, Emiel, Fuchs, Fabian B, Posner, Ingmar, and Welling,Max. E(n) equivariant normalizing flows for molecule generation in 3d. arXiv preprintarXiv:2105.09016, 2021.
Schneider, Gisbert. Automating drug discovery. Nature reviews drug discovery, 17(2):97–113, 2018.
Schütt, Kristof T, Kindermans, Pieter-Jan, Sauceda, Huziel E, Chmiela, Stefan,Tkatchenko, Alexandre, and Müller, Klaus-Robert. Schnet: A continuous-filterconvolutional neural network for modeling quantum interactions. arXiv preprintarXiv:1706.08566, 2017.
Segler, Marwin HS, Preuss, Mike, and Waller, Mark P. Planning chemical syntheses withdeep neural networks and symbolic ai. Nature, 555(7698):604–610, 2018.
Shu, Yang, Cao, Zhangjie, Wang, Chenyu, Wang, Jianmin, and Long, Mingsheng. Opendomain generalization with domain-augmented meta-learning. In Proceedings of theIEEE/CVF Conference on Computer Vision and Pattern Recognition, pp. 9624–9633, 2021.
45

Simonovsky, Martin and Komodakis, Nikos. GraphVAE: Towards generation of smallgraphs using variational autoencoders. In International conference on artificial neural net-works, pp. 412–422. Springer, 2018.
Sliwoski, Gregory, Kothiwale, Sandeepkumar, Meiler, Jens, and Lowe Jr., Edward W. Com-putational methods in drug discovery. Pharmacological reviews, 66(1):334–395, Dec 2013.ISSN 1521-0081. doi: 10.1124/pr.112.007336. URL https://pubmed.ncbi.nlm.nih.gov/24381236. 24381236[pmid].
Song, Hwanjun, Kim, Minseok, Park, Dongmin, and Lee, Jae-Gil. Learning from noisylabels with deep neural networks: A survey. arXiv preprint arXiv:2007.08199, 2020a.
Song, Ying, Zheng, Shuangjia, Niu, Zhangming, Fu, Zhang-Hua, Lu, Yutong, and Yang,Yuedong. Communicative representation learning on attributed molecular graphs. InIJCAI, pp. 2831–2838, 2020b.
Stanley, Megan, Bronskill, John F, Maziarz, Krzysztof, Misztela, Hubert, Lanini, Jessica,Segler, Marwin, Schneider, Nadine, and Brockschmidt, Marc. FS-mol: A few-shot learn-ing dataset of molecules. In Thirty-fifth Conference on Neural Information Processing Sys-tems Datasets and Benchmarks Track (Round 2), 2021. URL https://openreview.net/forum?id=701FtuyLlAd.
Stepniewska-Dziubinska, Marta M, Zielenkiewicz, Piotr, and Siedlecki, Pawel. Devel-opment and evaluation of a deep learning model for protein–ligand binding affinityprediction. Bioinformatics, 34(21):3666–3674, 2018.
Stokes, Jonathan M, Yang, Kevin, Swanson, Kyle, Jin, Wengong, Cubillos-Ruiz, Andres,Donghia, Nina M, MacNair, Craig R, French, Shawn, Carfrae, Lindsey A, Bloom-Ackermann, Zohar, et al. A deep learning approach to antibiotic discovery. Cell, 180(4):688–702, 2020.
Sukhbaatar, Sainbayar, Bruna, Joan, Paluri, Manohar, Bourdev, Lubomir, and Fergus, Rob.Training convolutional networks with noisy labels. In ICLR Workshop, 2015.
Sun, Baochen and Saenko, Kate. Deep coral: Correlation alignment for deep domainadaptation. In European conference on computer vision, pp. 443–450. Springer, 2016.
Svetnik, Vladimir, Liaw, Andy, Tong, Christopher, Culberson, J. Christopher, Sheridan,Robert P., and Feuston, Bradley P. Random forest: A classification and regressiontool for compound classification and qsar modeling. Journal of Chemical Information andComputer Sciences, 43(6):1947–1958, 2003.
Swamidass, S Joshua, Azencott, Chloé-Agathe, Lin, Ting-Wan, Gramajo, Hugo, Tsai,Shiou-Chuan, and Baldi, Pierre. Influence relevance voting: an accurate and inter-pretable virtual high throughput screening method. Journal of chemical information andmodeling, 49(4):756–766, 2009.
Trott, Oleg and Olson, Arthur J. Autodock vina: improving the speed and accuracy ofdocking with a new scoring function, efficient optimization, and multithreading. Journalof computational chemistry, 31(2):455–461, 2010.
46

Tzeng, Eric, Hoffman, Judy, Zhang, Ning, Saenko, Kate, and Darrell, Trevor. Deep domainconfusion: Maximizing for domain invariance, 2014.
van Rooyen, Brendan and Williamson, Robert C. A theory of learning with corruptedlabels. JMLR, 18(1):8501–8550, 2017.
van Rooyen, Brendan, Menon, Aditya, and Williamson, Robert. Learning with symmetriclabel noise: The importance of being unhinged. In NeurIPS, pp. 10–18, 2015.
Vapnik, Vladimir. The nature of statistical learning theory. Springer science & businessmedia, 1999.
Velickovic, Petar, Cucurull, Guillem, Casanova, Arantxa, Romero, Adriana, Liò, Pietro,and Bengio, Yoshua. Graph attention networks. 2018. URL https://openreview.net/forum?id=rJXMpikCZ.
Venkateswara, Hemanth, Eusebio, Jose, Chakraborty, Shayok, and Panchanathan, Sethu-raman. Deep hashing network for unsupervised domain adaptation. In Proceedings ofthe IEEE conference on computer vision and pattern recognition, pp. 5018–5027, 2017.
Volpi, Riccardo, Namkoong, Hongseok, Sener, Ozan, Duchi, John, Murino, Vittorio, andSavarese, Silvio. Generalizing to unseen domains via adversarial data augmentation.arXiv preprint arXiv:1805.12018, 2018.
Wallach, Izhar, Dzamba, Michael, and Heifets, Abraham. Atomnet: a deep convolu-tional neural network for bioactivity prediction in structure-based drug discovery. arXivpreprint arXiv:1510.02855, 2015.
Wang, Hongwei, Li, Weijiang, Jin, Xiaomeng, Cho, Kyunghyun, Ji, Heng, Han, Jiawei,and Burke, Martin D. Chemical-reaction-aware molecule representation learning. arXivpreprint arXiv:2109.09888, 2021.
Wang, Sheng, Guo, Yuzhi, Wang, Yuhong, Sun, Hongmao, and Huang, Junzhou. Smiles-bert: large scale unsupervised pre-training for molecular property prediction. In Pro-ceedings of the 10th ACM international conference on bioinformatics, computational biologyand health informatics, pp. 429–436, 2019a.
Wang, Wei, Zheng, Vincent W, Yu, Han, and Miao, Chunyan. A survey of zero-shotlearning: Settings, methods, and applications. ACM Transactions on Intelligent Systemsand Technology (TIST), 10(2):1–37, 2019b.
Wang, Yanli, Xiao, Jewen, Suzek, Tugba O, Zhang, Jian, Wang, Jiyao, and Bryant,Stephen H. Pubchem: a public information system for analyzing bioactivities of smallmolecules. Nucleic acids research, 37(suppl_2):W623–W633, 2009.
Wang, Yixin, Kucukelbir, Alp, and Blei, David M. Robust probabilistic modeling withbayesian data reweighting. In ICML, pp. 3646–3655, 2017.
Wang, Yufei, Li, Haoliang, and Kot, Alex C. Heterogeneous domain generalization viadomain mixup. In ICASSP 2020-2020 IEEE International Conference on Acoustics, Speechand Signal Processing (ICASSP), pp. 3622–3626. IEEE, 2020.
47

Weininger, David. Smiles, a chemical language and information system. 1. introductionto methodology and encoding rules. Journal of chemical information and computer sciences,28(1):31–36, 1988.
Wu, Zhenqin, Ramsundar, Bharath, Feinberg, Evan N, Gomes, Joseph, Geniesse, Caleb,Pappu, Aneesh S, Leswing, Karl, and Pande, Vijay. Moleculenet: a benchmark formolecular machine learning. Chemical science, 9(2):513–530, 2018.
Xiong, Zhaoping, Wang, Dingyan, Liu, Xiaohong, Zhong, Feisheng, Wan, Xiaozhe, Li,Xutong, Li, Zhaojun, Luo, Xiaomin, Chen, Kaixian, Jiang, Hualiang, et al. Pushing theboundaries of molecular representation for drug discovery with the graph attentionmechanism. Journal of medicinal chemistry, 63(16):8749–8760, 2019.
Xu, Keyulu, Hu, Weihua, Leskovec, Jure, and Jegelka, Stefanie. How powerful are graphneural networks? In International Conference on Learning Representations, 2018.
Xu, Minghao, Zhang, Jian, Ni, Bingbing, Li, Teng, Wang, Chengjie, Tian, Qi, and Zhang,Wenjun. Adversarial domain adaptation with domain mixup. In The Thirty-Fourth AAAIConference on Artificial Intelligence, pp. 6502–6509. AAAI Press, 2020.
Xu, Zheng, Wang, Sheng, Zhu, Feiyun, and Huang, Junzhou. Seq2seq fingerprint: Anunsupervised deep molecular embedding for drug discovery. In BCB, 2017.
Yan, Chaochao, Ding, Qianggang, Zhao, Peilin, Zheng, Shuangjia, Yang, Jinyu, Yu, Yang,and Huang, Junzhou. Retroxpert: Decompose retrosynthesis prediction like a chemist.arXiv preprint arXiv:2011.02893, 2020a.
Yan, Shen, Song, Huan, Li, Nanxiang, Zou, Lincan, and Ren, Liu. Improve unsuperviseddomain adaptation with mixup training, 2020b.
Yang, Kevin, Swanson, Kyle, Jin, Wengong, Coley, Connor, Eiden, Philipp, Gao, Hua,Guzman-Perez, Angel, Hopper, Timothy, Kelley, Brian, Mathea, Miriam, et al. Ana-lyzing learned molecular representations for property prediction. Journal of chemicalinformation and modeling, 59(8):3370–3388, 2019a.
Yang, Xin, Wang, Yifei, Byrne, Ryan, Schneider, Gisbert, and Yang, Shengyong. Conceptsof artificial intelligence for computer-assisted drug discovery. Chemical reviews, 119(18):10520–10594, 2019b.
Yao, Huaxiu, Wang, Yu, Li, Sai, Zhang, Linjun, Liang, Weixin, Zou, James, and Finn,Chelsea. Improving out-of-distribution robustness via selective augmentation, 2022.
Ye, Nanyang, Li, Kaican, Hong, Lanqing, Bai, Haoyue, Chen, Yiting, Zhou, Fengwei,and Li, Zhenguo. Ood-bench: Benchmarking and understanding out-of-distributiongeneralization datasets and algorithms. arXiv preprint arXiv:2106.03721, 2021.
Ying, Chengxuan, Cai, Tianle, Luo, Shengjie, Zheng, Shuxin, Ke, Guolin, He, Di, Shen,Yanming, and Liu, Tie-Yan. Do transformers really perform bad for graph representa-tion? arXiv preprint arXiv:2106.05234, 2021.
48

Yu, Xingrui, Han, Bo, Yao, Jiangchao, Niu, Gang, Tsang, Ivor W, and Sugiyama, Masashi.How does disagreement help generalization against label corruption? In ICML, 2019.
Yue, Xiangyu, Zhang, Yang, Zhao, Sicheng, Sangiovanni-Vincentelli, Alberto, Keutzer,Kurt, and Gong, Boqing. Domain randomization and pyramid consistency: Simulation-to-real generalization without accessing target domain data. In Proceedings of theIEEE/CVF International Conference on Computer Vision, pp. 2100–2110, 2019.
Zakharov, Alexey V, Varlamova, Ekaterina V, Lagunin, Alexey A, Dmitriev, Alexander V,Muratov, Eugene N, Fourches, Denis, Kuz’min, Victor E, Poroikov, Vladimir V, Trop-sha, Alexander, and Nicklaus, Marc C. Qsar modeling and prediction of drug-druginteractions. Molecular pharmaceutics, 13(2):545–556, 2016.
Zeng, Xiangxiang, Zhu, Siyi, Lu, Weiqiang, Liu, Zehui, Huang, Jin, Zhou, Yadi, Fang,Jiansong, Huang, Yin, Guo, Huimin, Li, Lang, et al. Target identification among knowndrugs by deep learning from heterogeneous networks. Chemical Science, 11(7):1775–1797, 2020.
Zhang, Chen, Cheng, Feixiong, Li, Weihua, Liu, Guixia, Lee, Philip W, and Tang, Yun. Insilico prediction of drug induced liver toxicity using substructure pattern recognitionmethod. Molecular informatics, 35(3-4):136–144, 2016.
Zhang, Hongyi, Cisse, Moustapha, Dauphin, Yann N, and Lopez-Paz, David. mixup:Beyond empirical risk minimization. arXiv preprint arXiv:1710.09412, 2017.
Zhang, Jingzhao, Menon, Aditya, Veit, Andreas, Bhojanapalli, Srinadh, Kumar, Sanjiv,and Sra, Suvrit. Coping with label shift via distributionally robust optimisation. arXivpreprint arXiv:2010.12230, 2020.
Zhao, Long, Liu, Ting, Peng, Xi, and Metaxas, Dimitris. Maximum-entropy adversarialdata augmentation for improved generalization and robustness. In Larochelle, H., Ran-zato, M., Hadsell, R., Balcan, M. F., and Lin, H. (eds.), Advances in Neural InformationProcessing Systems, volume 33, pp. 14435–14447. Curran Associates, Inc., 2020.
Zheng, Shuangjia, Rao, Jiahua, Zhang, Zhongyue, Xu, Jun, and Yang, Yuedong. Predictingretrosynthetic reactions using self-corrected transformer neural networks. Journal ofChemical Information and Modeling, 60(1):47–55, 2019.
Zhou, Chunting, Ma, Xuezhe, Michel, Paul, and Neubig, Graham. Examining and com-bating spurious features under distribution shift. arXiv preprint arXiv:2106.07171, 2021a.
Zhou, Fan, Jiang, Zhuqing, Shui, Changjian, Wang, Boyu, and Chaib-draa, Brahim.Domain generalization with optimal transport and metric learning. arXiv preprintarXiv:2007.10573, 2020a.
Zhou, Fan, Jiang, Zhuqing, Shui, Changjian, Wang, Boyu, and Chaib-draa, Brahim. Do-main generalization via optimal transport with metric similarity learning. Neurocom-puting, 456(C):469–480, oct 2021b.
49

Zhou, Kaiyang, Yang, Yongxin, Hospedales, Timothy, and Xiang, Tao. Deep domain-adversarial image generation for domain generalisation. In Proceedings of the AAAIConference on Artificial Intelligence, volume 34, pp. 13025–13032, 2020b.
Zhuang, Fuzhen, Qi, Zhiyuan, Duan, Keyu, Xi, Dongbo, Zhu, Yongchun, Zhu, Hengshu,Xiong, Hui, and He, Qing. A comprehensive survey on transfer learning. Proceedings ofthe IEEE, 109(1):43–76, 2020.
50

Appendix of DrugOOD
A. Statistics of the Realized Datasets
Table 10: List of 36 lbap datasets in DrugOOD. Pos and Neg denote the numbers of positiveand negative data points, respectively. D# represents the number of domains, and C#
represent the number of data points.
Data subset Pos# Neg# Train ID Val ID Test OOD Val OOD Test
D# C# D# C# D# C# D# C# D# C#
DrugOOD-lbap-core-ic50-assay 83802 11434 311 34179 311 11314 311 11683 314 19028 699 19032DrugOOD-lbap-core-ic50-scaffold 83802 11434 6881 21519 1912 4920 24112 30708 6345 19041 4350 19048DrugOOD-lbap-core-ic50-size 83802 11434 190 36597 140 12153 229 12411 4 17660 18 16415DrugOOD-lbap-core-ec50-assay 10199 2462 47 4540 47 1502 47 1557 46 2572 101 2490DrugOOD-lbap-core-ec50-scaffold 10200 2462 850 2570 224 580 3668 4447 1193 2532 953 2533DrugOOD-lbap-core-ec50-size 10200 2462 167 4684 103 1513 205 1753 4 2313 17 2399DrugOOD-lbap-core-ki-assay 22851 488 112 8393 112 2769 112 2900 83 4631 169 4646DrugOOD-lbap-core-ki-scaffold 22851 488 1820 5323 521 1192 5826 7490 1366 4665 779 4669DrugOOD-lbap-core-ki-size 22851 488 89 8481 62 2799 118 2941 4 4644 24 4474DrugOOD-lbap-core-potency-assay 12265 10554 9 8549 9 2848 9 2856 7 4008 65 4558DrugOOD-lbap-core-potency-scaffold 12032 10787 2003 3361 284 433 8910 9898 2125 4563 1509 4564DrugOOD-lbap-core-potency-size 11994 10825 48 8629 38 2859 60 2938 3 4182 18 4211DrugOOD-lbap-refined-ic50-assay 240996 25526 1446 95373 1446 31401 1446 33164 1361 53293 2805 53291DrugOOD-lbap-refined-ic50-scaffold 240996 25526 19285 60908 5804 14068 66187 84942 15368 53300 9333 53304DrugOOD-lbap-refined-ic50-size 240996 25526 225 97779 176 32531 264 32847 4 51443 20 51922DrugOOD-lbap-refined-ec50-assay 32454 5457 141 13600 141 4504 141 4655 186 7586 372 7566DrugOOD-lbap-refined-ec50-scaffold 32454 5457 2834 7775 745 1647 10945 13324 3082 7587 2187 7578DrugOOD-lbap-refined-ec50-size 32454 5457 220 13762 140 4524 262 4843 5 8558 17 6224DrugOOD-lbap-refined-ki-assay 72484 2472 578 26752 578 8765 578 9462 414 14988 905 14989DrugOOD-lbap-refined-ki-scaffold 72484 2472 5643 17172 1692 3899 18612 23914 4436 15013 2386 14958DrugOOD-lbap-refined-ki-size 72484 2472 148 28230 102 9366 189 9591 4 13060 23 14709DrugOOD-lbap-refined-potency-assay 25382 22611 10 17894 10 5962 10 5974 7 8899 105 9264DrugOOD-lbap-refined-potency-scaffold 25120 22873 4928 8380 850 1145 16819 19270 4344 9598 2927 9600DrugOOD-lbap-refined-potency-size 25239 22754 51 17951 43 5969 65 6042 4 10731 18 7300DrugOOD-lbap-general-ic50-assay 476865 91691 6917 201951 6917 65424 6917 73777 6207 113704 16814 113700DrugOOD-lbap-general-ic50-scaffold 476865 91691 43552 129740 13516 29174 142173 182220 29513 113723 15189 113699DrugOOD-lbap-general-ic50-size 476865 91691 290 217294 243 72349 311 72742 4 102544 22 103627DrugOOD-lbap-general-ec50-assay 92445 18000 1079 39333 1079 12849 1079 14086 1137 22095 2883 22082DrugOOD-lbap-general-ec50-scaffold 92445 18000 8677 23481 2450 4977 30611 37811 7659 22095 4844 22081DrugOOD-lbap-general-ec50-size 92445 18000 294 42697 238 14151 312 14531 4 19301 20 19765DrugOOD-lbap-general-ki-assay 146212 6533 2251 54062 2251 17399 2251 20187 1753 30555 4281 30542DrugOOD-lbap-general-ki-scaffold 146212 6533 12334 34395 3625 7472 39232 49784 8780 30559 4280 30535DrugOOD-lbap-general-ki-size 146212 6533 190 55386 140 18407 235 18687 5 32508 22 27757DrugOOD-lbap-general-potency-assay 26784 22389 10 17746 10 5912 10 5926 9 10146 184 9443DrugOOD-lbap-general-potency-scaffold 25617 23556 5052 8647 887 1196 17122 19660 4565 9834 2674 9836DrugOOD-lbap-general-potency-size 25674 23499 51 18224 44 6060 66 6138 4 10916 18 7835
51

Table 11: List of the 60 SBAP datasets in DrugOOD. Pos and Neg denote the numbers ofpositive and negative data points, respectively. D# represents the number of domains andC# represent the number of data points.
Data subset Pos# Neg# Train ID Val ID Test OOD Val OOD Test
D# C# D# C# D# C# D# C# D# C#
DrugOOD-sbap-core-ic50-assay 10490715591 351 43250 351 14327 351 14737 381 24135 723 24049DrugOOD-sbap-core-ic50-protein 10490715591 127 43439 127 14449 127 14593 134 24006 416 24011DrugOOD-sbap-core-ic50-protein-family 10490715591 1 46890 1 15630 1 15631 2 21112 10 21235DrugOOD-sbap-core-ic50-scaffold 10490715591 9911 31201 2560 7149 24334 33948 6151 24138 4322 24062DrugOOD-sbap-core-ic50-size 10490715591 192 46390 154 15413 229 15685 4 21422 18 21588DrugOOD-sbap-core-ec50-assay 12053 3287 55 5541 55 1831 55 1898 53 3023 111 3047DrugOOD-sbap-core-ec50-protein 12053 3287 29 5524 29 1834 29 1867 28 3109 66 3006DrugOOD-sbap-core-ec50-protein-family 12053 3287 2 5684 2 1894 2 1897 2 3124 5 2741DrugOOD-sbap-core-ec50-scaffold 12053 3287 1381 3676 292 761 3680 4768 1154 3068 980 3067DrugOOD-sbap-core-ec50-size 12053 3287 170 5772 109 1874 205 2130 4 2740 17 2824DrugOOD-sbap-core-ki-assay 31292 852 164 11540 164 3801 164 3994 116 6427 180 6382DrugOOD-sbap-core-ki-protein 31292 852 37 11604 37 3858 37 3904 48 6409 125 6369DrugOOD-sbap-core-ki-protein-family 31292 852 2 16504 2 5501 2 5503 9 4636DrugOOD-sbap-core-ki-scaffold 31292 852 2712 8640 786 1983 5799 8670 1386 6456 786 6395DrugOOD-sbap-core-ki-size 31292 852 99 11934 67 3946 118 4094 4 5951 24 6219DrugOOD-sbap-core-potency-assay 18665 15997 10 12892 10 4295 10 4305 9 6296 63 6874DrugOOD-sbap-core-potency-protein 19369 15293 9 12699 9 4230 9 4241 7 6568 30 6924DrugOOD-sbap-core-potency-protein-family 18846 15816 1 15701 1 5233 1 5235 1 4379 6 4114DrugOOD-sbap-core-potency-scaffold 18665 15997 3460 7891 847 1487 9034 11430 2099 6921 1411 6933DrugOOD-sbap-core-potency-size 18665 15997 52 13093 46 4352 60 4414 3 6243 18 6560DrugOOD-sbap-refined-ic50-assay 30275237178 1760 121655 1760 40060 1760 42245 1712 68003 2937 67967DrugOOD-sbap-refined-ic50-protein 30275237178 219 122326 219 40715 219 40992 239 68065 1025 67832DrugOOD-sbap-refined-ic50-protein-family 30275237178 1 130685 1 43561 1 43563 2 70150 12 51971DrugOOD-sbap-refined-ic50-scaffold 3027523717828561 89798 7690 20509 65773 93651 14954 67993 8900 67979DrugOOD-sbap-refined-ic50-size 30275237178 225 123320 182 41046 264 41357 5 77829 19 56378DrugOOD-sbap-refined-ec50-assay 35977 6428 177 15205 177 5016 177 5239 212 8484 384 8461DrugOOD-sbap-refined-ec50-protein 35977 6428 47 15372 47 5112 47 5168 59 8351 195 8402DrugOOD-sbap-refined-ec50-protein-family 35977 6428 2 18027 2 6008 2 6011 1 4791 8 7568DrugOOD-sbap-refined-ec50-scaffold 35977 6428 3774 9950 890 2051 10441 13442 2854 8482 1957 8480DrugOOD-sbap-refined-ec50-size 35977 6428 228 15809 150 5202 262 5527 4 7763 18 8104DrugOOD-sbap-refined-ki-assay 136133 6050 688 50921 688 16783 688 17628 702 28440 1131 28411DrugOOD-sbap-refined-ki-protein 136133 6050 125 51209 125 17033 125 17193 121 28364 427 28384DrugOOD-sbap-refined-ki-protein-family 136133 6050 2 76074 2 25358 2 25359 11 15392DrugOOD-sbap-refined-ki-scaffold 136133 6050 9870 41972 2878 10685 19006 32687 4194 28531 2009 28308DrugOOD-sbap-refined-ki-size 136128 6047 164 54637 117 18164 190 18401 4 24120 21 26853DrugOOD-sbap-refined-potency-assay 39841 32727 13 26983 13 8991 13 9010 7 13315 99 14269DrugOOD-sbap-refined-potency-protein 39841 32727 12 26411 12 8800 12 8818 7 15531 41 13008DrugOOD-sbap-refined-potency-protein-family 41827 30741 1 31027 1 10342 1 10344 1 11239 6 9616DrugOOD-sbap-refined-potency-scaffold 39841 32727 7645 17457 1872 3292 17214 22791 4216 14549 2545 14479DrugOOD-sbap-refined-potency-size 39840 32726 53 26233 49 8729 65 8810 4 16635 18 12159DrugOOD-sbap-general-ic50-assay 51429669105 6171 207522 6171 67554 6171 74982 5678 11667112019116672DrugOOD-sbap-general-ic50-protein 51429669105 252 209978 252 69923 252 70236 307 116773 2112 116491DrugOOD-sbap-general-ic50-protein-family 51429669105 1 224277 1 74759 1 74759 2 122574 12 87032DrugOOD-sbap-general-ic50-scaffold 514296691055085215661214093353971091401580312451511669812113116663DrugOOD-sbap-general-ic50-size 51429669105 281 226190 233 75318 301 75688 4 102468 22 103737DrugOOD-sbap-general-ec50-assay 66827 8867 728 26966 728 8805 728 9667 769 15127 1605 15129DrugOOD-sbap-general-ec50-protein 66827 8867 68 27256 68 9068 68 9158 95 15134 468 15078DrugOOD-sbap-general-ec50-protein-family 66827 8867 2 31076 2 10358 2 10361 1 12651 10 11248DrugOOD-sbap-general-ec50-scaffold 66827 8867 6777 18581 1779 3923 17150 22913 4503 15168 2962 15109DrugOOD-sbap-general-ec50-size 66827 8867 286 27814 228 9195 301 9538 5 16147 20 13000DrugOOD-sbap-general-ki-assay 26446414083 3368 98880 3368 32029 3368 36227 2995 55701 5795 55710DrugOOD-sbap-general-ki-protein 26446414083 124 100249 124 33386 124 33528 164 55743 948 55641DrugOOD-sbap-general-ki-protein-family 26446414083 2 145756 2 48585 2 48588 12 35618DrugOOD-sbap-general-ki-scaffold 2644641408321901 81854 6745 20026 38438 65253 8186 55786 3797 55628DrugOOD-sbap-general-ki-size 26446414083 206 104541 159 34782 233 35078 4 48850 22 55296DrugOOD-sbap-general-potency-assay 40174 33094 13 26972 13 8987 13 9005 8 14494 138 13810DrugOOD-sbap-general-potency-protein 40174 33094 12 26423 12 8804 12 8820 7 15582 52 13639DrugOOD-sbap-general-potency-protein-family 42339 30929 1 31218 1 10406 1 10407 1 11240 7 9997DrugOOD-sbap-general-potency-scaffold 40174 33094 7724 17648 1894 3333 17338 22980 4236 14728 2551 14579DrugOOD-sbap-general-potency-size 40174 33094 53 26482 49 8813 65 8889 4 16820 18 12264
52

Table 12: The in-distribution (ID) vs. out of distribution (OOD) of DrugOOD lbap datasetstrained with empirical risk minimization. The ID test datasets are drawn from the trainingdata with the same distribution, and the OOD test data are distinct from the training data.
Dataset In-dist Out-of-Dist Gap
DrugOOD-lbap-core-ic50-assay 89.62 (2.04) 71.98 (0.29) 17.64DrugOOD-lbap-core-ic50-scaffold 87.15 (0.48) 69.54 (0.52) 17.60DrugOOD-lbap-core-ic50-size 92.35 (0.15) 67.48 (0.47) 24.87DrugOOD-lbap-core-ec50-assay 85.23 (0.41) 70.30 (1.45) 14.93DrugOOD-lbap-core-ec50-scaffold 84.86 (0.27) 68.07 (0.68) 16.80DrugOOD-lbap-core-ec50-size 91.47 (0.20) 64.73 (0.55) 26.74DrugOOD-lbap-core-ki-assay 89.10 (3.28) 76.63 (1.64) 12.46DrugOOD-lbap-core-ki-scaffold 83.53 (2.15) 74.11 (2.37) 9.42DrugOOD-lbap-core-ki-size 94.73 (0.74) 71.56 (2.07) 23.17DrugOOD-lbap-core-potency-assay 66.23 (0.50) 53.26 (0.95) 12.97DrugOOD-lbap-core-potency-scaffold 61.83 (0.31) 55.30 (0.72) 6.53DrugOOD-lbap-core-potency-size 67.30 (0.36) 56.84 (1.35) 10.46DrugOOD-lbap-refined-ic50-assay 89.25 (0.64) 72.70 (0.00) 16.55DrugOOD-lbap-refined-ic50-scaffold 86.23 (0.08) 70.45 (0.54) 15.78DrugOOD-lbap-refined-ic50-size 91.31 (0.07) 68.74 (0.37) 22.58DrugOOD-lbap-refined-ec50-assay 76.74 (0.50) 71.05 (1.91) 5.69DrugOOD-lbap-refined-ec50-scaffold 81.10 (0.50) 66.22 (0.34) 14.89DrugOOD-lbap-refined-ec50-size 87.67 (0.29) 62.39 (0.70) 25.28DrugOOD-lbap-refined-ki-assay 90.52 (0.26) 72.48 (1.39) 18.04DrugOOD-lbap-refined-ki-scaffold 82.89 (0.66) 70.11 (2.10) 12.79DrugOOD-lbap-refined-ki-size 89.23 (1.23) 72.44 (0.85) 16.78DrugOOD-lbap-refined-potency-assay 62.99 (0.23) 58.88 (0.51) 4.11DrugOOD-lbap-refined-potency-scaffold 60.54 (0.14) 56.00 (1.29) 4.54DrugOOD-lbap-refined-potency-size 64.94 (0.71) 58.13 (0.49) 6.81DrugOOD-lbap-general-ic50-assay 85.19 (1.15) 69.88 (0.13) 15.32DrugOOD-lbap-general-ic50-scaffold 85.15 (0.24) 67.55 (0.09) 17.60DrugOOD-lbap-general-ic50-size 89.77 (0.08) 66.05 (0.32) 23.72DrugOOD-lbap-general-ec50-assay 83.32 (0.60) 69.55 (0.44) 13.77DrugOOD-lbap-general-ec50-scaffold 80.12 (0.44) 63.66 (0.37) 16.46DrugOOD-lbap-general-ec50-size 86.22 (0.23) 62.67 (0.47) 23.55DrugOOD-lbap-general-ki-assay 87.98 (1.34) 74.54 (0.46) 13.44DrugOOD-lbap-general-ki-scaffold 81.05 (3.11) 70.35 (0.83) 10.69DrugOOD-lbap-general-ki-size 89.51 (0.88) 71.29 (0.94) 18.22DrugOOD-lbap-general-potency-assay 63.40 (0.39) 56.38 (0.72) 7.03DrugOOD-lbap-general-potency-scaffold 61.56 (0.29) 56.57 (0.42) 4.99DrugOOD-lbap-general-potency-size 65.15 (0.30) 57.32 (0.54) 7.83
53

Table 13: The in-distribution (ID) vs. out of distribution (OOD) of DrugOOD sbap datasetstrained with empirical risk minimization. The ID test dataset are drawn from the trainingdata with the same distribution, and the OOD test data are distinct from the training data.
Dataset In-dist Out-of-Dist Gap
DrugOOD-sbap-core-ic50-assay 91.32 (0.40) 71.04 (0.51) 20.28DrugOOD-sbap-core-ic50-protein 90.71 (0.29) 68.87 (0.53) 21.84DrugOOD-sbap-core-ic50-protein-family 89.88 (1.44) 72.20 (0.14) 17.68DrugOOD-sbap-core-ic50-scaffold 88.97 (0.13) 70.73 (0.34) 18.24DrugOOD-sbap-core-ic50-size 92.83 (0.07) 67.17 (0.16) 25.66DrugOOD-sbap-core-ec50-assay 87.57 (0.80) 75.67 (1.34) 11.89DrugOOD-sbap-core-ec50-protein 87.21 (0.78) 69.62 (4.45) 17.59DrugOOD-sbap-core-ec50-protein-family 92.67 (0.94) 56.01 (3.03) 36.66DrugOOD-sbap-core-ec50-scaffold 87.60 (0.32) 69.26 (1.20) 18.34DrugOOD-sbap-core-ec50-size 92.98 (0.30) 63.99 (1.36) 28.98DrugOOD-sbap-core-ki-assay 88.34 (4.18) 63.17 (2.46) 25.16DrugOOD-sbap-core-ki-protein 85.05 (4.48) 64.89 (1.95) 20.16DrugOOD-sbap-core-ki-scaffold 85.96 (1.10) 70.03 (2.90) 15.93DrugOOD-sbap-core-ki-size 92.76 (0.18) 69.68 (1.13) 23.09DrugOOD-sbap-core-potency-assay 70.22 (0.24) 51.39 (0.45) 18.83DrugOOD-sbap-core-potency-protein 70.72 (0.48) 54.62 (0.57) 16.10DrugOOD-sbap-core-potency-protein-family 62.60 (3.47) 49.83 (1.99) 12.77DrugOOD-sbap-core-potency-scaffold 63.36 (0.55) 56.87 (0.53) 6.49DrugOOD-sbap-core-potency-size 66.94 (0.37) 58.36 (0.23) 8.59DrugOOD-sbap-refined-ic50-assay 88.07 (1.48) 69.21 (0.29) 18.86DrugOOD-sbap-refined-ic50-protein 86.87 (1.41) 69.51 (0.30) 17.36DrugOOD-sbap-refined-ic50-protein-family 86.44 (3.07) 70.61 (0.42) 15.82DrugOOD-sbap-refined-ic50-scaffold 87.16 (0.08) 70.10 (0.52) 17.06DrugOOD-sbap-refined-ic50-size 90.22 (0.11) 65.23 (0.26) 24.99DrugOOD-sbap-refined-ec50-assay 80.60 (1.69) 70.38 (1.38) 10.22DrugOOD-sbap-refined-ec50-protein 81.62 (1.16) 73.45 (1.67) 8.17DrugOOD-sbap-refined-ec50-protein-family 83.09 (0.73) 68.81 (1.62) 14.27DrugOOD-sbap-refined-ec50-scaffold 82.44 (0.19) 68.45 (0.28) 13.99DrugOOD-sbap-refined-ec50-size 87.20 (0.04) 64.56 (0.51) 22.64DrugOOD-sbap-refined-ki-assay 96.35 (0.56) 68.00 (1.73) 28.35DrugOOD-sbap-refined-ki-protein 94.22 (0.48) 77.77 (0.60) 16.46DrugOOD-sbap-refined-ki-scaffold 88.27 (0.88) 59.81 (1.04) 28.46DrugOOD-sbap-refined-ki-size 91.56 (0.41) 61.64 (2.41) 29.92DrugOOD-sbap-refined-potency-assay 64.65 (0.11) 54.66 (0.79) 9.99DrugOOD-sbap-refined-potency-protein 65.46 (0.42) 53.14 (0.35) 12.32DrugOOD-sbap-refined-potency-protein-family 64.76 (0.88) 53.75 (0.82) 11.01DrugOOD-sbap-refined-potency-scaffold 61.90 (0.28) 55.05 (0.40) 6.85DrugOOD-sbap-refined-potency-size 64.64 (0.65) 55.79 (0.26) 8.85DrugOOD-sbap-general-ic50-assay 87.85 (1.47) 68.61 (0.54) 19.24DrugOOD-sbap-general-ic50-protein 85.34 (1.67) 68.48 (0.27) 16.86DrugOOD-sbap-general-ic50-protein-family 79.18 (2.69) 68.60 (0.68) 10.58DrugOOD-sbap-general-ic50-scaffold 84.33 (0.67) 67.49 (0.33) 16.84DrugOOD-sbap-general-ic50-size 87.81 (0.23) 65.34 (0.38) 22.47DrugOOD-sbap-general-ec50-assay 84.66 (1.32) 69.83 (0.54) 14.82DrugOOD-sbap-general-ec50-protein 82.10 (0.51) 70.16 (0.29) 11.94DrugOOD-sbap-general-ec50-protein-family 83.69 (1.74) 63.76 (1.05) 19.93DrugOOD-sbap-general-ec50-scaffold 82.97 (0.51) 67.95 (0.27) 15.01DrugOOD-sbap-general-ec50-size 87.98 (0.42) 65.64 (0.35) 22.33DrugOOD-sbap-general-ki-assay 94.15 (0.31) 72.05 (0.49) 22.10DrugOOD-sbap-general-ki-protein 90.72 (0.14) 74.41 (0.25) 16.31DrugOOD-sbap-general-ki-scaffold 87.09 (0.34) 67.36 (1.52) 19.73DrugOOD-sbap-general-ki-size 91.10 (0.26) 65.93 (1.13) 25.17DrugOOD-sbap-general-potency-assay 65.68 (0.17) 53.31 (0.32) 12.36DrugOOD-sbap-general-potency-protein 64.83 (0.77) 53.35 (0.33) 11.48DrugOOD-sbap-general-potency-protein-family 61.28 (0.87) 55.46 (1.24) 5.82DrugOOD-sbap-general-potency-scaffold 61.91 (0.84) 56.02 (0.27) 5.89DrugOOD-sbap-general-potency-size 65.80 (0.13) 55.33 (0.38) 10.47
54
Copyright © 2022 FDOKUMEN