Codebook Country score dataset - European Union
26
1 FINAL REPORT ON UPDATING THE REGIONAL AUTHORITY INDEX (RAI) FOR 43 COUNTRIES (1950-2011) Authors 1 : Arjan H. Schakel, University of Maastricht Liesbet Hooghe, VU University Amsterdam Gary Marks, VU University Amsterdam ** Please cite the dataset as follows ** If you use the 1950-2006 data: Hooghe, Liesbet, Gary Marks, Arjan H. Schakel. 2010. The Rise of Regional Authority: A Comparative Study of 42 Democracies (1950-2006). London: Routledge. If you use the 1950-2011 data: Hooghe, Liesbet, Gary Marks, Arjan H. Schakel. 2010. The Rise of Regional Authority: A Comparative Study of 42 Democracies (1950-2006). London: Routledge; and Hooghe, Liesbet, Gary Marks, Arjan H. Schakel, Sandra Chapman, Sara Niedzwiecki, Sarah Shair- Rosenfield (forthcoming). Governance Below the State: Regional Authority in 81 Countries. Oxford: OUP. Description of the project Update: code regional authority in 45 OECD+EU+ countries for 2007 through the end of 2011, and update country profiles. Appendix 1 contains the list of countries. Improve: check and correct errors for 1950-2006 Expand: add annual measures on borrowing autonomy and borrowing control for regional governments for 1950-2011, which increases the total number of dimensions to ten. Methodology The proposed instrument evaluates individual levels of government (or individual regions in asymmetric arrangements) on an annual basis across nine dimensions of regional authority. This will yield a refined picture of government structure. The investigators employ a mix of primary sources (constitutions, legislation, statutes), secondary literature, and consultation of country experts to achieve reliable and valid estimates. The coding scheme and the method have proven successful—and withstood the test of academic scrutiny—for estimates of regional authority in 42 democracies for 1950-2006 1 With thanks for research help from Hanna Kleider (University of North Carolina at Chapel Hill). Ref. Ares(2014)1447698 - 06/05/2014
-
Upload
khangminh22 -
Category
Documents
-
view
0 -
download
0
Transcript of Codebook Country score dataset - European Union

1
FINAL REPORT ON UPDATING THE REGIONAL AUTHORITY INDEX (RAI) FOR 43 COUNTRIES (1950-2011)
Authors1:
Arjan H. Schakel, University of Maastricht
Liesbet Hooghe, VU University Amsterdam
Gary Marks, VU University Amsterdam
** Please cite the dataset as follows **
If you use the 1950-2006 data: Hooghe, Liesbet, Gary Marks, Arjan H. Schakel. 2010. The Rise of Regional Authority: A Comparative Study of 42 Democracies (1950-2006). London: Routledge. If you use the 1950-2011 data: Hooghe, Liesbet, Gary Marks, Arjan H. Schakel. 2010. The Rise of Regional Authority: A Comparative Study of 42 Democracies (1950-2006). London: Routledge; and Hooghe, Liesbet, Gary Marks, Arjan H. Schakel, Sandra Chapman, Sara Niedzwiecki, Sarah Shair-Rosenfield (forthcoming). Governance Below the State: Regional Authority in 81 Countries. Oxford: OUP.
Description of the project Update: code regional authority in 45 OECD+EU+ countries for 2007 through the end of 2011, and update country profiles. Appendix 1 contains the list of countries. Improve: check and correct errors for 1950-2006 Expand: add annual measures on borrowing autonomy and borrowing control for regional governments for 1950-2011, which increases the total number of dimensions to ten. Methodology The proposed instrument evaluates individual levels of government (or individual regions in asymmetric arrangements) on an annual basis across nine dimensions of regional authority. This will yield a refined picture of government structure.
The investigators employ a mix of primary sources (constitutions, legislation, statutes), secondary literature, and consultation of country experts to achieve reliable and valid estimates. The coding scheme and the method have proven successful—and withstood the test of academic scrutiny—for estimates of regional authority in 42 democracies for 1950-2006
1 With thanks for research help from Hanna Kleider (University of North Carolina at Chapel Hill).
Ref. Ares(2014)1447698 - 06/05/2014

2
(Hooghe, Marks, Schakel 2008; 2010). The same methodology is applied to the extension to 2011 and the inclusion of Israel. Description of deliverables:
a) REPORT (this paper): robustness of results, methodology, basic trends 1950-2011. b) DATASETS: two datasets (excel format) for 45 countries: one with annual scores for
regional governments/ tiers for the period 1950–2011, and one aggregating these scores to the country level. These datasets provide a breakdown of the scoring 1) for each of ten dimensions, and 2) by tier or region (when regions have a special statute or where there is institutional asymmetry).
c) COUNTRY PROFILES: revised, double-checked, expanded country profiles with annual readings on 45 countries for 1950-2011 will be accessible on the website http://www.falw.vu/~mlg. The profiles build on Hooghe, Marks, Schakel (2008, 2010).
This report has six sections: I. Description of the coding method and coding scheme
II. Codebook of regional scores dataset III. Codebook of country scores dataset IV. Calculation of country scores (excel) V. Changes in the updated dataset (compared to 1950-2006 data)
VI. Descriptives
Appendix: Datasets (excel): regional-level and country-level aggregates
I. DESCRIPTION OF CODING METHOD AND CODING SCHEME Existing measures: The most refined and widely used data on regional government are financial data provided by the OECD and the IMF. These data have been used to good effect, but 1) they do not distinguish among levels of regional government and 2) they do not directly measure regional authority. It is one thing for a regional government to collect taxes or spend, but quite another to set the rate or base of taxes or determine spending priorities. Regional governments in Denmark and Sweden, for example, collect and spend far more than those in Spain or Belgium! An OECD study finds that regional taxes and spending are only weakly correlated with tax authority.
Measures that seek more direct estimates of regional authority rely on the basic distinction between federal and non-federal countries (Arzhagi & Henderson 2005; Inman 2008; Lane & Ersson 1999; Lijphart 1999; Hooghe and Marks, forthcoming). The distinction is useful for evaluating basic constitutional change, but it is insensitive to variation among federal countries or among non-federal countries (Rodden 2004; Schakel 2009). Several countries have seen considerable regionalization since 1950 without crossing the federal divide. Federal countries vary in interesting and significant ways. Measures that go beyond the non-

3
federal/federal distinction frame a limited number of dichotomous possibilities: whether or not a region has residual powers, is subject to central veto, has an elected executive, and has revenue-raising authority (Brancati 2006; Treisman 2002). The instrument proposed here encompasses nine dimensions, increases the range of coding choices, and places them in a comprehensive and nuanced conceptual framework.
Finally, existing measures estimate a constant for each country over the post-World War II period (Inman 2008; Lane & Ersson 1999; Treisman 2002), or provide a very small number of time points at decade or two-decade intervals (Hooghe & Marks 2001; Lijphart 1999). In the absence of adequate time series, attempts to test hypotheses about change have had to assume that cross-sectional analysis is a valid substitute for diachronic analysis. This measure: The instrument here evaluates levels of government (or individual regions in asymmetric arrangements) on an annual basis across a variety of dimensions. This yields a refined picture of government structure and bridges a troubling divide between case studies and existing datasets.
The measurement instrument is grounded in a well-established set of concepts.
Authority is defined as legitimate power, that is, power recognized as binding because it is derived from accepted principles of governance (Dahl 1968).
Formal authority is defined as authority exercised in relation to explicit rules, usually written in constitutions, legislation, treaties or statutes.
A regional government has some degree of authority, with respect to some territorial jurisdiction, over certain actions. The proposed instrument therefore specifies (A) the territory over which a government exercises authority; (B) the depth of that authority; and C) the spheres of action over which it exercises authority.
With respect to territorial scope of authority (A), a government may exercise authority in its own jurisdiction or co-exercise authority over a larger jurisdiction in which it is part. This is the distinction between self rule and shared rule (Elazar 1987). The expression of authority in self rule, that is rule over those within the regional territory, is fundamentally different from that in shared rule, that is, rule in the country as a whole.
With respect to depth of authority (B), one needs to estimate the degree to which a government has an independent legislative, fiscal, executive organization, the conditions under which it can act unilaterally, and its capacity to rule when opposed by the national government.
With respect to spheres of action (C), a regional or international government can have authority over a smaller or broader range of policies. Authority over taxation and borrowing, and over constitutional reform are especially important.
The coding scheme sets out the ten dimensions that constitute the latent variable of regional government. Readers interested in the measurement theory, decisions on operationalization, and crossvalidation are referred to ch. 1, 2, and 3 respectively of the 2010 book, and a discussion of the two new dimensions of borrowing in (Shair-Rosenfield, Marks, Hooghe, forthcoming; Chapman, Niedzwiecki, Hooghe, Marks forthcoming). Table 1 below describes these dimensions and the respective coding categories.
Coding scheme (see below)

4
Table 1: Self-Rule
Self-rule The authority exercised by a regional government over those who live in the region
Institutional depth The extent to which a regional government is autonomous rather than deconcentrated.
0-3 0 1 2 3
no functioning general-purpose administration at regional level deconcentrated, general-purpose, administration non-deconcentrated, general–purpose, administration subject to central government veto non-deconcentrated, general–purpose, administration not subject to central government veto
Policy scope The range of policies for which a regional government is responsible.
0-4 0 1
2 3 4
very weak authoritative competencies in a), b), c), d) authoritative competencies in a), b), c) or d) a) economic policy; b) cultural-educational policy; c) welfare policy; d) one of the following: residual powers, police, own institutional set–up, local government authoritative competencies in at least two of a), b), c), or d). authoritative competencies in d) and at least two of a), b), or c). criteria for 3 plus authority over immigration or citizenship
Fiscal autonomy The extent to which a regional government can independently tax its population.
0-4 0 1 2 3
4
central government sets base and rate of all regional taxes regional government sets the rate of minor taxes regional government sets base and rate of minor taxes regional government sets the rate of at least one major tax: personal income, corporate, value added, or sales tax regional government sets base and rate of at least one major tax
Borrowing autonomy The extent to which a regional government can borrow 0-3 0 1
2
3
the region (or regional tier) does not borrow (e.g. centrally imposed rules prohibit borrowing) the region (or regional tier) may borrow under prior authorization by the central government and with one or more of the following centrally imposed restrictions
a. golden rule (e.g. no borrowing to cover current account deficits) b. no foreign borrowing or borrowing from the central bank c. no borrowing above a ceiling, absolute level of subnational indebtedness, maximum
debt-service ratio for new borrowing d. borrowing is limited to specific purposes
the region (or regional tier) may borrow without prior authorization and under one or more of a), b), c), or d) the region (or regional tier) may borrow without centrally imposed restrictions
Representation The extent to which a region is endowed with an independent legislature and executive
0-4
0 1 2
0 1 2
Assembly: no regional assembly indirectly elected regional assembly directly elected assembly Executive: regional executive appointed by central government; dual executives appointed by central government and regional assembly regional executive is appointed by a regional assembly or directly elected
5
Table 2: Shared Rulea
Shared rule The authority exercised by a regional government or its representatives in the country as a whole
Law making The extent to which regional representatives co–determine national legislation.
0-2 0.5 0.5 0.5 0.5
regions are the unit of representation in the legislature regional governments designate representatives in the legislature regions have majority representation in the legislature the legislature with regional representation has extensive legislative authority
Executive control The extent to which a regional government co–determines national policy in intergovernmental meetings.
0-2 0 1
2
no routine meetings between central and regional governments to negotiate policy routine meetings between central and regional governments without legally binding authority. routine meetings between central and regional governments with authority to reach legally binding decisions
Borrowing control The extent to which a regional government co–determines subnational and national borrowing constraints.
0-2 0 1
2
regional governments are not routinely consulted over borrowing constraints regional governments negotiate routinely over borrowing constraints but do not have a veto regional governments negotiate routinely over borrowing constraints and have a veto
Fiscal control The extent to which regional representatives co–determine the distribution of national tax revenues.
0-2 0
1
2
regional governments or their representatives in the legislature are not consulted over the distribution of tax revenues regional governments or their representatives in the legislature negotiate over the distribution of tax revenues, but do not have a veto regional governments or their representatives in the legislature have a veto over the distribution of tax revenues
Constitutional reform The extent to which regional representatives co–determine constitutional change.
0-3 0
1
2
3
the central government and/or national electorate can unilaterally change the constitution a legislature based on the principle of regional representation can veto constitutional change; or constitutional change requires a referendum based on the principle of equal regional representation regional governments or their representatives in a legislature can, alone or collectively, do one or more of the following: postpone constitutional reform, introduce amendments, raise the decision hurdle in the other chamber, require a second vote in the other chamber, require a popular referendum regional governments or their representatives in a legislature can, alone or collectively, veto constitutional change.
a Shared rule criteria are adjusted for special autonomous regions.

6
II. REGIONAL SCORE CODEBOOK
ACCOMPANYING EXCEL FILE: RAI_region_scores_2013 Conceptualizing a region We seek to conceptualize a region in a way that meets, as far as possible, normal linguistic usage while providing the researcher with an unambiguous unit of analysis. A region has the following characteristics: a territory having a single, continuous, and non-intersecting boundary a set of legislative and executive institutions responsible for authoritative decision making intermediate government between local and national government
an average population of minimal 150,000 in 2011. 150,000 is the dividing line between regional and local government in the nomenclature d’unités territoriales statistiques, a geocode standard for referencing the administrative divisions of countries for statistical purposes in the European Union and the Council of Europe.
A regional government, then, is the government of a coherent territorial entity of a certain size situated between local and national levels with capacity for authoritative decision making. Unit of analysis The standard unit of analysis is a regional tier in a given year of evaluation: Spanish Comunidades in 1981; Comunidades in 1982; . . . Comunidades in 2008. The unit of analysis is an individual region in a given year of evaluation if a region's authority is different from the authority of the standard unit. This is so either because the region has an asymmetrical arrangement—it falls under a country-wide constitutional structure, but enjoys different (usually greater) authority—or because it is a special autonomous region—it has a sui generis statute. Hence Catalonia and the Basque Country have asymmetrical arrangements and therefore have separate entries in the dataset for the years in which their statute departs from that of the standard Spanish Comunidad. In Portugal, the Azores and Madeira are special autonomous regions with separate constitutional statutes, and they have separate entries for each year since 1976.
To measure the authority of an asymmetrical region, the same criteria are applied as for standard regions. For a special autonomous region, the criteria for measuring institutional depth, policy scope, fiscal autonomy, borrowing autonomy and representation are the same, but those for shared rule are adjusted to tap the extent to which a special autonomous region influences national legislation with respect to its territory, rather than for the country as a whole. See Hooghe, Marks, Schakel (2010: 131-132) for a comparative table of how to score special autonomous regions vs. standard regions.
For specific region names and number of regional units as well as changes over time (split-ups, merger, changes of names) please consult http://www.statoids.com

7
CODEBOOK FOR REGIONAL SCORES DATASET
VARIABLE NAME RANGE VALUES AND LABELS
country_ID 1–45 Country ID (see table 1)
country_name Country name in English (see table 1)
abbr_country Abbreviation of country name (see table 1)
region_ID 101–4502 Region ID
region_name Name of region in local language
Year 1950–2011 Year of evaluation
Tier 1–3 1: highest tier 2: second-highest tier 3: third tier
special_status 0–3 0: no special status 1: asymmetrical region 2: colony, dependency 3: special autonomous region
institutional_depth 0–3 Extent to which a regional government is autonomous rather than deconcentrated: 0: no functioning general-purpose administration at the regional level 1: deconcentrated, general-purpose, administration 2: non-deconcentrated, general–purpose, administration subject to central government veto 3: non-deconcentrated, general–purpose, administration not subject to central government veto
policy_scope 0–4 Range of policies for which a regional government is responsible: 0: no authoritative competencies over economic policy, cultural-educational policy, welfare state policy 1: authoritative competencies in one area: economic policy, cultural-educational policy, welfare state policy 2: authoritative competencies in at least two areas: economic policy, cultural-educational policy, welfare state policy 3: authoritative competencies in at least two areas above, and in at least two of the following: residual powers, police, authority over own institutional set-up, local government 4: regional government meets the criteria for 3, and has authority over immigration or citizenship
fiscal_autonomy 0–4 Extent to which a regional government can independently tax its population: 0: the central government sets base and rate of all regional taxes 1: the regional government sets the rate of minor taxes 2: the regional government sets base and rate of minor taxes 3: the regional government sets the rate of at least one major tax: personal income, corporate, value added or sales tax 4: the regional government sets base and rate of at least one major tax: personal income, corporate, value added or sales tax
borrowing_autonomy 0–3 Extent to which a regional government can borrow: 0: the region (or regional tier) does not borrow (e.g. centrally imposed rules prohibit borrowing) 1: the region (or regional tier) may borrow under prior authorization by the central government and with one or more of the following

8
centrally imposed restrictions e. golden rule (e.g. no borrowing to cover current account
deficits) f. no foreign borrowing or borrowing from the central bank g. no borrowing above a ceiling, absolute level of subnational
indebtedness, maximum debt-service ratio for new borrowing h. borrowing is limited to specific purposes
2: the region (or regional tier) may borrow without prior authorization and under one or more of a), b), c), or d) 3: the region (or regional tier) may borrow without centrally imposed restrictions
representation 0–4 Extent to which a region is endowed with an independent legislature and executive: Assembly: 0: no regional assembly 1: an indirectly elected regional assembly 2: a directly elected assembly Executive: 0: the regional executive is appointed by central government 1: dual executives appointed by central government and the regional assembly 2: the regional executive is appointed by a regional assembly or directly elected
self_rule 1–18 The authority exercised by a regional government over those who live in the region, which is the sum of institutional_depth, policy_scope, fiscal_autonomy, and representation.
law_making_a 0–0.5 0: regions are not the unit of representation in the legislature 0.5: regions are the unit of representation in the legislature
law_making_b 0–0.5 0: regional governments do not designate representatives in the legislature 0.5: regional governments designate representatives in the legislature
law_making_c 0–0.5 0: regions do not have majority representation in the legislature 0.5: regions have majority representation in the legislature
law_making_d 0–0.5 0: the legislature with regional representation has extensive legislative authority 0.5: the legislature with regional representation does not have extensive legislative authority
law_making 0–2 Extent to which regional representatives co-determine national legislation, which is the sum of law_making_a to law_making_d
executive_control 0–2 Extent to which a regional government co-determines national policy in intergovernmental meetings 0: no routine meetings between central and regional governments to negotiate policy 1: routine meetings between central and regional governments without legally binding authority 2: routine meetings between central and regional governments with authority to reach legally binding decisions
fiscal_control 0–2 Extent to which regional representatives co-determine the distribution of national tax revenues: 0: regional governments or their representatives in the legislature are not consulted over the distribution of tax revenues

9
1: regional governments or their representatives in the legislature negotiate over the distribution of tax revenues, but do not have a veto 2: regional governments or their representatives in the legislature have a veto over the distribution of tax revenues
borrowing_control 0–2 Extent to which a regional government co–determines subnational and national borrowing constraints: 0: regional governments are not routinely consulted over borrowing constraints 1: regional governments negotiate routinely over borrowing constraints but do not have a veto 2: regional governments negotiate routinely over borrowing constraints and have a veto
constitutional_reform 0–3 Extent to which regional representatives co-determine constitutional change: 0: the central government and/or national electorate can unilaterally change the constitution 1: a legislature based on the principle of regional representation must approve constitutional change; or constitutional change requires a referendum based on the principle of equal regional representation 2: regional governments are a directly represented majority in a legislature which can do one or more of the following: postpone constitutional reform, introduce amendments, raise the decision hurdle in the other chamber, require a second vote in the other chamber, require a popular referendum 3: a majority of regional governments can veto constitutional change
shared_rule 0–11 The authority exercised by a regional government or its representatives in the country as a whole, which is the sum of law_making, executive_control, fiscal_control, and constitutional_reform
RAI 1–29 Regional authority index, which is the sum of self_rule and shared_rule.

10
The table below provides country ID (country_ID), regional ID (region_ID), and the names of the regions as well as the years for which we evaluate regional authority.
Country ID
Country Region ID
Region name Years evaluated
1 Albania — — 1992—1999 101 Qarku 2000―2011
2 Australia 201 States 1950―2011 202 Northern Territory 1950―2011 203 Australian Capital Territory 1950―2011
3 Austria 301 Länder 1955―2011
4 Belgium 401 Provincies 1950―2011 402 Vlaamse Gemeenschap 1970―2011 403 Communauté française 1970―2011 404 Deutsche Gemeinschaft 1970―2011 405 Région wallonne 1980―2011 406 Brussel Hoofdstedelijk Gewest/ Région Bruxelles-
Capitale 1980―2011
5 Bosnia and 501 Entities 1995―2011 Herzegovina 502 Cantons (in Federacija B. i H.) 1995―2011
6 Bulgaria 601 Oblasti 1991―2011
7 Canada 701 Counties, Regions 1950―2011 702 Provinces 1950―2011 703 Northwest Territories 1950―2011 704 Yukon 1950―2011 705 Nunavut 1999―2011
8 Croatia — — 1991—1992 801 Županije 1993―2011
9 Cyprus — — 1960―2011
10 Czech — 1993―1999 Republic 1001 Kraje 2000―2011
11 Denmark 1101 Amter 1950―2006 1102 Grønland 1950―2011 1103 Færøerne 1950―2011 1104 Regioner 2007―2011
12 Estonia — — —
13 Finland 1301 Läänit 1950―2009

11
1302 Maakuntien 1993―2011 1303 Kainuu 2004―2011 1304 Åland 1950―2011 1305 Aluehallintovirasto 2010―2011
14 France 1401 Départements 1950―2011 1402 Régions 1964―2011 1403 Corse 1982―2011
15 Germany 1501 Kreise 1950―2011 1502 Regierungsbezirke 1950―2011 1503 Regierungsbezirke (Nordrhein Westfalen) 2001―2011 1504 Länder 1950―2011
16 Greece 1601 Nomoi 1950―2010 1602 Peripheria 1986―2011 1603 Apokentroménes dioikíseis 2011
17 Hungary 1701 Megyék 1990―2011 1702 Tervezési-statisztikai régiók 1999―2011
18 Iceland — — —
19 Ireland — — — 1901 Regional authorities 1987―2011
43 Israel 4301 Mehozot 1950―2011
20 Italy 2001 Provincia 1950―2011 2002 Bolzano-Bozen/ Trento 1950―2011 2003 Regioni a statuto ordinario 1970―2011 2004 Regioni a statuto speciale 1950―2011 2005 Trentino-Alto Adige-Südtirol 1950―2011
21 Japan 2101 Todofuken 1950―2011
22 Latvia — — 1990―2011
23 Lithuania — — 1992―1994 47 Apskritys 1995―2009 — — 2010―2011
24 Luxembourg — — 1950―2011
25 Macedonia — — 1991―2011
26 Malta — — 1964―2011
44 Montenegro — — 2007―2011

12
27 Netherlands 2701 Provincies 1950―2011
28 New Zealand
— — 1950—1962
2801 Regions 1974―2011 2802 Auckland 1963―2011 2803 Wellington 1974―2011
29 Norway 2901 Fylker 1950―2011
30 Poland 3001 Województwa 1990―2011
31 Portugal 3101 Distritos 1976―2011 3102 Comissões de desenvolvimento regional 1979―2011 3103 Açores 1976―2011 3104 Madeira 1976―2011
32 Romania 3201 Judete 1991―2011 3202 Regiuni de dezvoltare 1998―2011
33 Russian 3301 Respubliki 1993―2011 Federation 3302 Subwekty federacii 1993―2011 3303 Okruga 2000―2011
45 Serbia 4501 Okruzi 2006―2011 4502 Vojvodina 2006―2011
34 Serbia and 3401 Republics 1992―2006 Montenegro 3402 in Serbia: Okruzi 1992―2006 3403 in Serbia: Vojvodina 1992―2006 3404 in Serbia: Kosomet 1992―1998
35 Slovakia — — 1993―1995 3501 Kraje/ Samospravne kraje 1996―2011
36 Slovenia — — 1990―2011
37 Spain 3701 Provincias 1978―2011 3702 Comunidades autonomas* 1982―2011 3703 Comunidades autonomas** 1983―2011 3704 Pais Vasco 1979―2011 3705 Catalunya 1979―2011 3706 Galicia 1981―2011 3707 Andalucia 1981―2011 3708 Navarra 1982―2011 3709 Asturias, Cantabria 1981―2011 3710 Ceuta, Melilla 1978―2011 3711 In Pais Vasco: provincias 1978―2011

13
38 Sweden 3801 Län 1950―2011
39 Switzerland 3901 Cantons 1950―2011
40 Turkey 4001 Iller 1950―2011 4002 Kalkunna ajanslari 2009―2011
41 United 4101 Counties 1950―2011 Kingdom 4102 Regions 1994―2011 4103 Greater London Authority 2000―2011 4104 Northern Ireland 1950―2011 4105 Scotland 1950―2011 4106 Wales 1964―2011
42 United 4201 Counties/ Regions 1950―2011 States 4202 Regional councils 1980―2011 4203 States 1950―2011 4204 Alaska, Hawai 1950―2011 4205 Washington D.C. 1950―2011
III. COUNTRY SCORE CODEBOOK ACCOMPANYING EXCEL FILE: RAI_country_scores_2013
Unit of analysis The unit of analysis is a country in a given year of evaluation. Country scores aggregate scores for each regional tier and individual regional governments in a country.
The more regional tiers a country has, the higher is the country score, all other things equal. Where there is variation among regions at a given tier, scores are weighted by population. The following aggregation rules are employed: Horizontal asymmetry: Where a tier is composed of regions with different scores, an average
score for that tier is calculated by weighting each region’s score by its population.
Vertical asymmetry: Where lower–level regions exist only in some higher–level regions or where scores for lower–level regions vary between higher–level regions, the lower–level scores are weighted by the population of the higher–level regions of which they are part
Special autonomy: special autonomous regions are weighted by population relative to that of the national population.
Users can consult the calculation of a particular country score in the accompanying excel file.

14
CODEBOOK FOR COUNTRY SCORES DATASET
VARIABLE NAME RANGE VALUES AND LABELS
country_ID 1–42 Country ID (see table 1)
country_name Country name in English (see table 1)
abbr_country Abbreviation of country name (see table 1)
year 1950–2011 Year of evaluation
institutional_depth 0–3 Extent to which a regional government is autonomous rather than deconcentrated: 0: no functioning general–purpose administration at the
regional level 1: deconcentrated, general–purpose, administration 2: non–deconcentrated, general–purpose, administration
subject to central government veto 3: non–deconcentrated, general–purpose, administration not
subject to central government veto
policy_scope 0–4 Range of policies for which a regional government is responsible: 0: no authoritative competencies over economic policy,
cultural–educational policy, welfare state policy 1: authoritative competencies in one area: economic policy,
cultural–educational policy, welfare state policy 2: authoritative competencies in at least two areas: economic
policy, cultural–educational policy, welfare state policy 3: authoritative competencies in at least two areas above, and
in at least two of the following: residual powers, police, authority over own institutional set–up, local government
4: regional government meets the criteria for 3, and has authority over immigration or citizenship
fiscal_autonomy 0–4 Extent to which a regional government can independently tax its population: 0: the central government sets base and rate of all regional
taxes 1: the regional government sets the rate of minor taxes 2: the regional government sets base and rate of minor taxes 3: the regional government sets the rate of at least one major
tax: personal income, corporate, value added or sales tax 4: the regional government sets base and rate of at least one
major tax: personal income, corporate, value added or sales tax
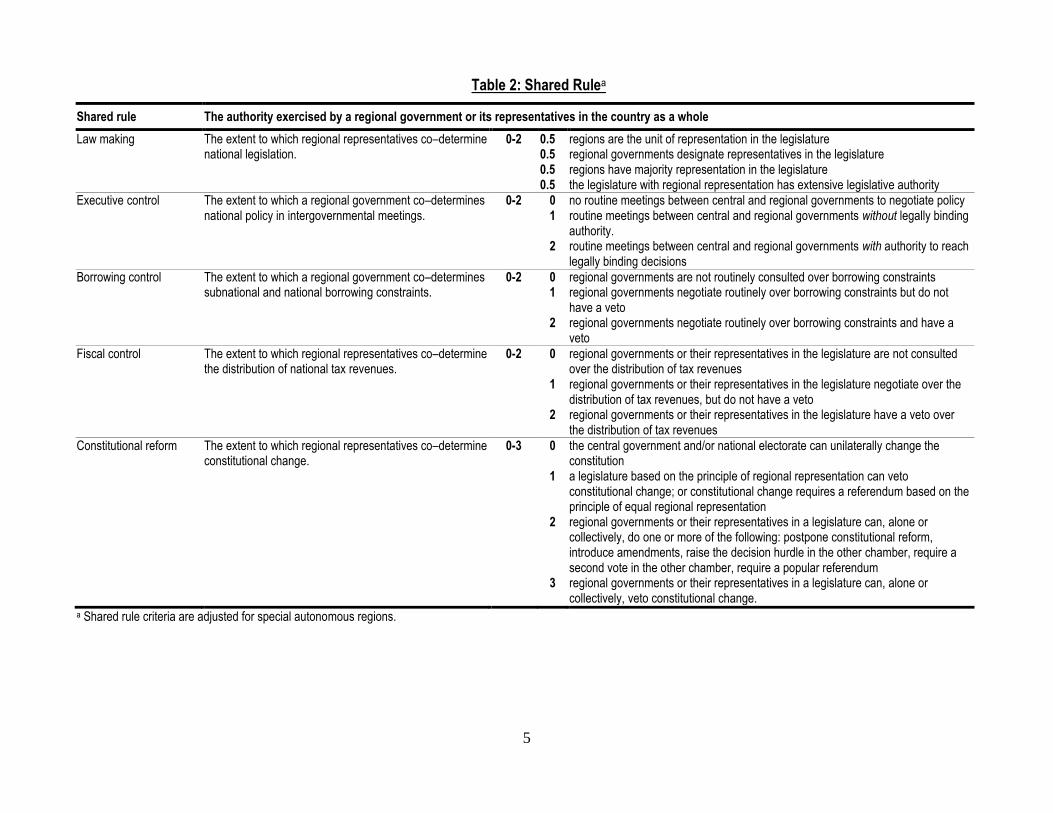
borrowing_autonomy 0–3 Extent to which a regional government can borrow: 0: the region (or regional tier) does not borrow (e.g. centrally
imposed rules prohibit borrowing) 1: the region (or regional tier) may borrow under prior
authorization by the central government and with one or
15
more of the following centrally imposed restrictions i. golden rule (e.g. no borrowing to cover current account
deficits) j. no foreign borrowing or borrowing from the central bank k. no borrowing above a ceiling, absolute level of
subnational indebtedness, maximum debt–service ratio for new borrowing
l. borrowing is limited to specific purposes 2: the region (or regional tier) may borrow without prior
authorization and under one or more of a), b), c), or d) 3: the region (or regional tier) may borrow without centrally
imposed restrictions
representation 0–4 Extent to which a region is endowed with an independent legislature and executive: Assembly: 0: no regional assembly 1: an indirectly elected regional assembly 2: a directly elected assembly Executive: 0: the regional executive is appointed by central government 1: dual executives appointed by central government and the
regional assembly 2: the regional executive is appointed by a regional assembly or
directly elected
self_rule 1–15 The authority exercised by a regional government over those who live in the region, which is the sum of institutional_depth, policy_scope, fiscal_autonomy, and representation.
law_making_a 0–0.5 0: regions are not the unit of representation in the legislature 0.5: regions are the unit of representation in the legislature
law_making_b 0–0.5 0: regional governments do not designate representatives in the legislature
0.5: regional governments designate representatives in the legislature
law_making_c 0–0.5 0: regions do not have majority representation in the legislature
0.5: regions have majority representation in the legislature
law_making_d 0–0.5 0: the legislature with regional representation has extensive legislative authority
0.5: the legislature with regional representation does not have extensive legislative authority
law_making 0–2 Extent to which regional representatives co–determine national legislation, which is the sum of law_making_a to law_making_d
executive_control 0–2 Extent to which a regional government co–determines national policy in intergovernmental meetings 0: no routine meetings between central and regional
governments to negotiate policy 1: routine meetings between central and regional governments

16
without legally binding authority 2: routine meetings between central and regional governments
with authority to reach legally binding decisions
fiscal_control 0–2 Extent to which regional representatives co–determine the distribution of national tax revenues: 0: regional governments or their representatives in the
legislature are not consulted over the distribution of tax revenues
1: regional governments or their representatives in the legislature negotiate over the distribution of tax revenues, but do not have a veto
2: regional governments or their representatives in the legislature have a veto over the distribution of tax revenues
borrowing_control 0–2 Extent to which a regional government co–determines subnational and national borrowing constraints: 0: regional governments are not routinely consulted over
borrowing constraints 1: regional governments negotiate routinely over borrowing
constraints but do not have a veto 2: regional governments negotiate routinely over borrowing
constraints and have a veto
constitutional_reform 0–3 Extent to which regional representatives co–determine constitutional change: 0: the central government and/or national electorate can
unilaterally change the constitution 1: a legislature based on the principle of regional
representation must approve constitutional change; or constitutional change requires a referendum based on the principle of equal
regional representation 2: regional governments are a directly represented majority in a
legislature which can do one or more of the following: postpone constitutional reform, introduce amendments, raise the decision hurdle in the other chamber, require a second vote in the other chamber, require a popular referendum
3: a majority of regional governments can veto constitutional change
shared_rule 0–9 The authority exercised by a regional government or its representatives in the country as a whole, which is the sum of law_making, executive_control, fiscal_control, and constitutional_reform
RAI 1–24 Regional authority index, which is the sum of self_rule and shared_rule.

17
The table below provides country ID (country_ID) and abbreviation as well as the years evaluated.
Country ID Country Abbr. Years evaluated
1 Albania ALB 1992–2011
2 Australia AUS 1950–2011
3 Austria AUT 1955–2011
4 Belgium BEL 1950–2011
5 Bosnia and Herzegovina BIH 1995–2011
6 Bulgaria BGR 1991–2011
7 Canada CAN 1950–2011
8 Croatia HRV 1991–2011
9 Cyprus CYP 1960–2011
10 Czech Republic CZE 1993–2011
11 Denmark DNK 1950–2011
12 Estonia EST 1992–2011
13 Finland FIN 1950–2011
14 France FRA 1950–2011
15 Germany GER 1950–2011
16 Greece GRC 1950–2011
17 Hungary HUN 1990–2011
18 Iceland ISL 1950–2011
19 Ireland IRL 1950–2011
43 Israel ISR 1950–2011
20 Italy ITA 1950–2011
21 Japan JAP 1950–2011
22 Latvia LVA 1990–2011
23 Lithuania LTU 1992–2011
24 Luxemburg LUX 1950–2011
25 Macedonia MKD 1991–2011
26 Malta MLT 1964–2011
44 Montenegro MNE 2006–2011
27 Netherlands NLD 1950–2011
28 New Zealand NZL 1950–2011
29 Norway NOR 1950–2011
30 Poland POL 1990–2011
31 Portugal PRT 1976–2011
32 Romania ROM 1991–2011
33 Russian Federation RUS 1993–2011
45 Serbia SRB 2006–2011
34 Serbia and Montenegro SAM 1992–2006
35 Slovakia SVK 1993–2011
36 Slovenia SVN 1990–2011
37 Spain ESP 1978–2011
38 Sweden SWE 1950–2011
39 Switzerland SWI 1950–2011
40 Turkey TUR 1950–2011
41 United Kingdom GBR 1950–2011
42 United States USA 1950–2011

18
IV. CALCULATION OF COUNTRY SCORES
We obtain country scores by first calculating a score for each regional tier and then aggregating these scores up to the national level. Hence, the more regional tiers a country has, the higher is the overall country score, all other things being equal. The general principle is that decentralization scores are weighted by population. The following aggregation rules are employed: • horizontal asymmetry - where a tier is composed of regions with different scores, an
average score for that tier is calculated by weighting each region’s score by its population;
• vertical asymmetry - where lower-level regions exist only in some higher-level regions or where scores for lower-level regions vary between higher-level regions, the lower-level scores are weighted by the population of the higher-level regions of which they are part;
• special autonomy - special autonomous regions are weighted by their population relative to that of the national population.
.
V. CHANGES IN THE UPDATED DATASET
The revision of 2013 entails three changes. First, we include a borrowing autonomy and a borrowing control index. The total number indicators increases to ten, five for self-rule and five for shared rule, and the maximum score on the Regional Authority Index increases from 24 to 29. Second, we update the scores and country profiles up to 2011; we detail regional reforms for after 2006. We extend the dataset with the inclusion of Israel, and because Serbia and Montenegro split up in 2006, the dataset now also contains separate entries for Montenegro and Serbia bringing the total number of included countries to 45. Third, we correct some of the pre-2006 scores.
Coding changes in 2013 update Borrowing autonomy index
The borrowing autonomy index measures the extent to which a regional government can borrow: 0 the region (or regional tier) does not borrow (e.g. centrally imposed rules prohibit borrowing)
1 the region (or regional tier) may borrow under prior authorization by the central government and with one or more of the following centrally imposed restrictions a. golden rule (e.g. no borrowing to cover current account deficits) b. no foreign borrowing or borrowing from the central bank c. no borrowing above a ceiling, absolute level of subnational indebtedness, maximum debt–service ratio for new borrowing d. borrowing is limited to specific purposes
2 the region (or regional tier) may borrow without prior authorization and under one or more of a), b), c), or d)
3 the region (or regional tier) may borrow without centrally imposed restrictions

19
Borrowing control index The borrowing control index measures the extent to which a regional government co–determines subnational and national borrowing constraints: 0 regional governments are not routinely consulted over borrowing constraints
1 regional governments negotiate routinely over borrowing constraints but do not have a veto
2 regional governments negotiate routinely over borrowing constraints and have a veto
Real-world changes in 2013 update Regional reforms since 2006 Germany, Länder 2010-2011, borrowing control from 1 to 2. Greece, Periphereies 2011, RAI from 2 to 8, nomoi were abolished and the periphereies took over their competences. Japan, todofuken 2006-2001, borrowing autonomy from 1 to 2. United Kingdom, Northern Ireland 2007-2001, RAI from 1 to 9.5, devolution was reinstated. United Kingdom, Wales 2007-2011, executive from 1 to 2. United Kingdom, Wales 2011, policy scope from 2 to 3. Regional reforms new/abolished regions since 2006 Denmark, regioner established in 2007 (replaced the Amter). Finland, aluehallintovirasto established in 2010 (replaced the läänit). Germany, Regierungsbezirke were abolished in Saxony in 2012. Greece, nomoi were abolished in 2011 and their competences were taken over by the periphereies. Greece, apokentroménes dioikíseis established in 2011. Lithuania, apskritys were abolished in 2010. Turkey, kalkunna ajanslari established in 2009. United Kingdom, regions were abolished in 2012.
Corrections in 1950-2006 data
Corrected RAI scores for pre-2006 Denmark, amter 1950-1969, assembly, from 1 to 2. Denmark, amter, 1970-2006, executive, from 1 to 2. Denmark, Greenland, 1950-1969, assembly, from 1 to 2. Denmark, Greenland, 1970-1978, executive, from 1 to 2. Finland, Kainuu, start scoring from 2005 instead of 2004. Ireland, regional authorities 1994-2011, institutional depth from 2 to 1. Ireland, regional authorities 1994-2011, policy scope from 1 to 0.

20
Ireland, regional authorities 1994-2011, executive from 2 to 1. Italy, regioni a statuto ordinario, start scoring from 1970 instead of 1972. Japan, todofuken 1950-1991, executive from 2 to 1. Romania, judete 2003-2011, fiscal autonomy from 0 to 1. Romania, regiuni de dezvoltare 1998-2011, executive from 2 to 0. Slovakia, samospravne kraje 2005-2011, fiscal autonomy from 0 to 1. Spain, Basque Country 1978-2011, fiscal autonomy from 4 to 0. Spain, provincias in the Basque Country 1981-2011, fiscal autonomy from 2 to 4. Sweden, län 1950-1970, assembly from 1 to 2. Sweden, län 1950-1970, executive from 0 to 1. Turkey, iller 2005-2011, executive from 0 to 1. Coding/ mathematical errors
A small number of country scores are updated in the dataset (compared to those in Appendix B in Regional and Federal Studies (2008)). The table below lists countries and years as well as the reason for adjustments. Differences in country scores between dataset and Appendix B in Regional and Federal Studies
Country Years Adjustment Reason
Australia 1965–1977 18.018.1 Rounding
Belgium 1970–1979 25.825.9 Population figures adjustment for German community; authority of Walloon region now includes authority exercised over German community (see footnote excel file)
1980–1988 22.923.0
Bosnia and Herzegovina
1995–2006 30.530.6 Population figures adjustment
Germany 1950–2003 +0.1 Now includes Bremen as having Kreise
Italy 1974–1976 14.514.6 Rounding 1997–2000 19.519.6
New Zealand 1963–1973 3.02.8 Now scores Wellington as a region from 1974 (instead of 1963)
Portugal 1999–2006 3.73.6 Rounding
Spain 1981 15.915.5 Adjusted for the fact that some Comunidades replace provincias at the time of signing the autonomy statute. Autonomy statute for Asturias and Cantabria signed in 1981 (instead of 1983).
1982 18.718.3
United 1964–1971 9.49.5 Population figures adjustment Kingdom 1972 9.39.2
1998 5.85.6 1999 9.29.3 2000–2002 9.99.7 2003–2006 9.69.5
United States 1950–1958 22.823.1 Now includes counties and regions in Massachusetts 1959 23.023.2 1960–1979 22.923.1 1980–2006 23.023.2

21
Further detail on scoring: Hooghe, Liesbet, Gary Marks, and Arjan H. Schakel (2008). “Operationalizing Regional Authority: A Coding Scheme for 42 Countries, 1950–2006.” Regional and Federal Studies, Vol.18, No.2–3, pp.123–142.
VI. DESCRIPTIVES
This section examines the coherence of the Regional Authority Index (RAI) across dimensions and over time. The analysis confirms the validity of considering the RAI as a single index. Changes in regional authority since 2006 or changes in coding do not affect the robustness of the single dimension. Yet the analysis also indicates the usefulness of disaggregating authority in distinct dimensions. The first level of disaggregation confirms the importance of distinguishing self-rule from shared rule.
Table. Pearson correlations between the 1950-2006 and 1950-2011 scores: country scores.
Self rule 2011 Shared rule 2011 RAI 2011
Self rule 2006 0.99 0.68 0.97
Shared rule 2006 0.69 0.99 0.83
RAI 2006 0.97 0.83 0.99
Notes: all Pearson correlations are statistically significant at the p < 0.0001 level; n = 42
(country scores in 2006).
Table. Pearson correlations between the 1950-2006 and 1950-2011 scores: region scores.
Self rule 2011 Shared rule 2011 RAI 2011
Self rule 2006 0.98 0.60 0.93
Shared rule 2006 0.61 0.98 0.82
RAI 2006 0.93 0.83 0.99
Notes: all Pearson correlations are statistically significant at the p < 0.0001 level; n = 90
(region scores in 2006).
Dimensionality
Cronbach’s alpha 1950-2006 country scores: 0.912 (n = 42)
Cronbach’s alpha 1950-2011 country scores: 0.925 (n = 44)
Cronbach’s alpha 1950-2006 region scores: 0.883 (n = 90)
Cronbach’s alpha 1950-2011 region scores: 0.892 (n = 91)

22
Russian doll analysis
Country scores 1950-2006: 68.2% well-ordered
Country scores 1950-2011: 63.3% well-ordered
Region scores 1950-2006: 81.7% well-ordered
Region scores 1950-2011: 68.5% well-ordered
Region scores 1950-2006 without special autonomous regions: 86.0% well-ordered
Region scores 1950-2011 without special autonomous regions: 77.0% well-ordered.

23
Figure. Robustness of regional authority index across alternative weights for shared rule and
self-rule.
Notes: Calculations are for 2011; n = 44. The Regional Authority Index weighs self-rule to
shared rule in the ration of 18:11. Spearman’s rho is calculated on ordinal scores, and
Pearson’s r is calculated on the interval scores.

24
Table. Factor analysis of regional authority: country scores.
Components Single–factor solution
Two–factor solution
Self–rule Shared rule
2011 2006 2011 2006 2011 2006
Institutional depth 0.88 0.88 0.89 0.91 0.29 0.32
Policy scope 0.92 0.92 0.90 0.87 0.35 0.42
Fiscal autonomy 0.87 0.86 0.85 0.73 0.33 0.48
Borrowing autonomy 0.86 – 0.90 – 0.24 –
Representation 0.85 0.83 0.91 0.94 0.23 0.20
Law making 0.83 0.85 0.44 0.33 0.78 0.89
Executive control 0.76 0.70 0.37 0.43 0.75 0.56
Fiscal control 0.84 0.85 0.41 0.34 0.83 0.88
Borrowing control 0.61 – 0.11 – 0.85 –
Constitutional reform 0.77 0.79 0.46 0.30 0.65 0.84
Eigenvalue 6.77 5.60 4.68 3.50 3.44 3.13
Chi–squared 507.9 361.6 490.7 361.6 490.7 361.6
Explained variance (%) 67.7 70.0 81.1 82.8 81.1 82.8
Factor correlation 0.62 0.68 0.62 0.68
Notes: Principal components factor analysis, orthogonal varimax (Kaiser off); n = 42 for 2006
country scores and n = 44 for 2011 country scores. For the two–factors solution, the highest
score for each dimension is in bold.

25
Table. Factor analysis of regional authority: region scores.
Components Single–factor solution
Two–factor solution
Self–rule Shared rule
2011 2006 2011 2006 2011 2006
Institutional depth 0.90 0.91 0.83 0.88 0.39 0.35
Policy scope 0.88 0.90 0.84 0.90 0.36 0.31
Fiscal autonomy 0.76 0.78 0.82 0.80 0.18 0.26
Borrowing autonomy 0.71 – 0.82 – 0.09 –
Representation 0.75 0.74 0.81 0.89 0.17 0.07
Law making 0.65 0.67 0.27 0.18 0.72 0.85
Executive control 0.72 0.69 0.32 0.35 0.77 0.67
Fiscal control 0.79 0.82 0.40 0.44 0.78 0.75
Borrowing control 0.54 – 0.05 – 0.83 –
Constitutional reform 0.61 0.66 0.49 0.21 0.37 0.78
Eigenvalue 5.47 4.81 3.98 3.41 2.89 2.63
Chi–squared 654.8 524.2 654.8 524.2 654.8 524.2
Explained variance (%) 54.8 60.0 68.7 75.4 68.7 75.4
Factor correlation 0.61 0.63 0.61 0.63
Notes: Principal components factor analysis, orthogonal varimax (Kaiser off); n = 90 for 2006
region scores and n = 91 for 2011 region scores. For the two–factors solution, the highest
score for each dimension is in bold.

26
Table. Pearson correlations between the dimensions.
1 2 3 4 5 6 7 8 9 10 11 12 13
1 – 0.89 0.71 0.58 0.81 0.44 0.56 0.62 0.43 0.44 0.91 0.65 0.90
2 0.88 – 0.69 0.64 0.78 0.41 0.55 0.58 0.43 0.40 0.92 0.61 0.89
3 0.77 0.88 – 0.64 0.55 0.35 0.36 0.53 0.20* 0.43 0.85 0.51 0.80
4 0.80 0.89 0.84 – 0.56 0.34 0.39 0.41 0.08* 0.51 0.79 0.48 0.75
5 0.95 0.89 0.75 0.81 – 0.30 0.37 0.39 0.32 0.27 0.86 0.42 0.77
6 0.59 0.62 0.69 0.56 0.53 – 0.48 0.61 0.45 0.61 0.42 0.82 0.62
7 0.56 0.64 0.54 0.54 0.53 0.62 – 0.68 0.58 0.41 0.50 0.79 0.67
8 0.59 0.67 0.63 0.55 0.54 0.88 0.68 – 0.58 0.47 0.58 0.86 0.75
9 0.42 0.42 0.31 0.31 0.39 0.57 0.75 0.65 – 0.07 0.33 0.62 0.48
10 0.54 0.59 0.63 0.60 0.48 0.79 0.51 0.74 0.43 – 0.47 0.74 0.63
11 0.94 0.97 0.90 0.92 0.95 0.64 0.60 0.63 0.40 0.60 – 0.61 0.95
12 0.63 0.69 0.68 0.62 0.58 0.92 0.79 0.93 0.74 0.87 0.68 – 0.83
13 0.92 0.96 0.90 0.90 0.91 0.76 0.70 0.76 0.53 0.72 0.98 0.82 –
Notes: all Pearson correlations are statistically significant at the p < 0.05 level except the ones
marked with a *. Below the diagonal country scores (in 2011; n = 44); above the diagonal
region scores (in 2011; n = 91).
1 = institutions depth
2 = policy scope
3 = fiscal autonomy
4 = borrowing control
5 = representation
6 = law making
7 = executive control
8 = fiscal control
9 = borrowing control
10 = constitutional reform
11 = self-rule
12 = shared rule
13 = regional authority index


![Una Limosna [orch] SCORE](https://static.fdokumen.com/doc/165x107/631e9c1925add517740b2033/una-limosna-orch-score.jpg)