Developing technology in the vicinity of science: Do firms really benefit? An empirical assessment...
24
Developing technology in the vicinity of science: Do firms really benefit? An empirical assessment on the level of Italian provinces. Bart Leten, Paolo Landoni and Bart Van Looy DEPARTMENT OF MANAGERIAL ECONOMICS, STRATEGY AND INNOVATION (MSI) Faculty of Economics and Applied Economics MSI 0711
Transcript of Developing technology in the vicinity of science: Do firms really benefit? An empirical assessment...

Developing technology in the vicinity of science: Do firms really benefit?An empirical assessment on the level of Italian provinces.
Bart Leten, Paolo Landoni and Bart Van Looy
DEPARTMENT OF MANAGERIAL ECONOMICS, STRATEGY AND INNOVATION (MSI)
Faculty of Economics and Applied Economics
MSI 0711

Developing Technology in the Vicinity of Science: Do Firms Really Benefit?
An Empirical Assessment on the Level of Italian Provinces.
Bart Leten1, *
Paolo Landoni 2
Bart Van Looy 3
1 Department of Managerial Economics, Strategy and Innovation
Faculty of Business and Economics Katholieke Universiteit Leuven
Naamsestraat 69, 3000 Leuven, Belgium [email protected]
2 Department of Management, Economics and Industrial Engineering
Polytecnico di Milano Piazza L. Da Vinci 32, 20133 Milano, Italy
3 Department of Managerial Economics, Strategy and Innovation Faculty of Business and Economics
Steunpunt STI Indicators Steunpunt Entrepreneurship and International Entrepreneurship
Research division INCENTIM, K.U. Leuven R&D Katholieke Universiteit Leuven
Naamsestraat 69, 3000 Leuven, Belgium [email protected]
Abstract The article examines whether firms benefit from the presence of universities when developing technology. By estimating regional knowledge production functions for 101 Italian regions, we observe a strong positive relation between industrial technological performance – measured by patents – and the local presence of universities. In addition, ‘academic’ regions witness higher levels of industrial technological output, the more pronounced the scientific eminence of the regional universities. Finally, our analysis indicates that the observed spillover effects are field-specific, with domains situated in the vicinity of science benefiting most. Together, these findings suggest complementary roles for scientific and industrial actors within regional innovation systems. Keywords University-Firm Knowledge Spillovers; Technology Transfer; Regional Innovation Systems * Corresponding author. Tel: +32 16326916. Fax: +32 16326732
1

1. Introduction Since the seminal work of Schumpeter (1934) and Solow (1957), the idea that economic growth relies on the production of new knowledge has gained wide acceptance. Firms are therefore spending considerable resources on searching and developing new innovative products and processes. At the same time, the inherently uncertain nature of R&D, the increasing interdisciplinarity and specialization of scientific and technological disciplines, the greater complexity of products and production processes, and the increasing costs of R&D activities have inspired many firms to look for external knowledge sources to complement internal R&D efforts. Relevant partners in this respect include public research centers, universities, governmental institutions, customers, suppliers, industry associations, and even direct competitors (Chesbrough, 2003; Von Hippel, 1988). This article examines empirically whether the technological performance of firms benefits from the presence of universities. In line with previous empirical work (Acs et al., 1991, 1994; Anselin et al., 1997 , 2000; Autant-Bernard, 2001; Blind and Grupp, 1999; Buesa et al, 2006; Del Barrio-Castro and Garcia-Quevedo, 2005; Feldman and Florida, 1994; Fischer and Varga, 2003; Jaffe, 1989; Piergiovanni et al., 1997; Piergiovanni and Santarelli, 2001), we adopt a regional knowledge production function framework. This article extends previous work by (i) introducing scientific eminence – measured by the number of peer-reviewed university publications – as an additional, variable explaining the presence and impact of spillovers (ii) verifying the robustness of previous research by introducing panel data (whereas previous analyses almost invariably used cross-sectional data sets) and (iii) exploring the field-specific nature of observed spillovers. The remainder of the article is structured as follows. The second section provides an overview of existing literature on university knowledge spillovers and details this article's contribution. The third section describes the data and indicators employed. The fourth section discusses the empirical findings; after highlighting the geographical distribution of technological activities in Italy, the results of the knowledge production functions are reported. We conclude by discussing the major findings, their implications as well as directions for future research.
2. Previous Research Over recent decades, an increasing interest in the role and effects of knowledge spillovers among different types of actors has been witnessed. Encompassing notions like national innovation systems (Freeman, 1987; Lundvall, 1992; Nelson, 1992) and the triple helix model (Leydesdorff and Etkowitz, 1996, 1998) not only point out that the innovation scenery entails multiple actors (universities, public research institutes, and governmental agencies in addition to firms) but also that interactions between these actors contribute to the innovative performance of nations or regions. University-industry collaborations are focal points of interest in this respect, as positive impacts on the level of regional economical/technological development (e.g. Acs, 2000; Cooke, 1997; Lecocq and Van Looy, 2007; Saxenian, 1994) and on the level of the firm’s innovative performance (Faems et al., 2005) have been advanced and documented empirically. University knowledge can be transferred to firms through various mechanisms. The main ones are scientific publications, attendance at university seminars, training of graduate students, formal collaborations such as faculty consulting and joint R&D projects, use of physical university facilities (libraries, laboratories and science
2

parks), licensing of intellectual property rights, and creation of university spin-offs. The effectiveness by which university knowledge can be transferred depends partly on the geographic distance between firms and the knowledge-generating universities. As previously stated by Polanyi (1966), knowledge sometimes tends to be difficult to codify. This knowledge is ‘tacit’ in nature and is stored in the memory of people (university professors, researchers and graduates) and institutions. It has low geographic mobility compared to capital and is mainly transferred by interpersonal interactions (Nonaka, 1994; Woolcock, 1998). Those interactions are more likely to take place if universities and firms are closely located to each other. The regional knowledge production framework, spatial variant of the firm-level knowledge production function of Griliches (1979), captures this broad range of knowledge spillovers and allows us to assess total knowledge spillover effects in a certain spatial area (Varga, 2002). This is done by relating the total technological – or in some cases, the innovative – performance of firms in a region to the size of the university knowledge pool in that region. The latter is proxied mostly by the research expenditures of universities within the region. If positive relationships are observed, spillovers are assumed to be present. Jaffe (1989) was the first to estimate spillover effects by means of regional knowledge production functions. He observed strong relationships between state-level university R&D spending and the amount of corporate patenting. Follow-up state-level studies showed the robustness of these initial findings by using firm innovation counts – rather than patent counts – as the dependent variable (Acs et al., 1991) or by adding additional control variables (Feldman and Florida, 1994). The geographic-bounded impact of the spillovers is investigated more directly in the work of Anselin and colleagues (Anselin et al., 1997, 2000). Arguing that state-level analyses are not appropriate to analyze local university-firm interactions, they developed knowledge production functions on a lower spatial level (125 U.S. metropolitan statistical areas or MSAs). Adding spatially lagged independent variables1, those studies find positive effects for MSA-level university research. Much smaller effects are associated with university research performed in nearby MSAs, signalling that university knowledge spillovers follow a geographical decay pattern. More recently, empirical studies – using knowledge production functions – have been undertaken for several European countries. Using data for Germany (Blind and Grupp, 1999), France (Autant-Bernard, 2001; Piergiovanni and Santarelli, 2001), Austria (Fischer and Varga, 2003), Italy (Piergiovanni et al., 1997) and Spain (Del Barrio-Castro and Garcia-Quevedo, 2005; Buesa et al, 2006), confirmation of the presence of localized university spillover effects has been obtained for different levels of spatial aggregation. Complementary evidence of this phenomenon has been advanced on the firm level. Several empirical studies have shown that the presence of universities within a region/country affects R&D investment decisions of national and multinational firms. Anselin et al. (1997), Bania et al. (1992), Jaffe (1989) and Woodward et al. (2006) showed that R&D plants in the U.S. are more likely to be established in states, metropolitan statistical areas and counties hosting university research. Similarly, Cantwell and Piscitello (2005), using data for Germany, UK, France, and Italy, demonstrated that European regions with higher levels of public R&D employment receive more foreign R&D investments. Likewise, Belderbos et al. (2007) observed that the R&D location decisions of high-technology firms are significantly affected by the strengths of academic research capabilities in host countries. Hence, these findings confirm survey-based observations indicating that the scientific strength of local universities 1 A spatially lagged explanatory variable takes the sum of the variable values in the nearby regions (neighboring or within a certain distance band)
3

and opportunities to collaborate with academia rank highly as factors determining the attractiveness of foreign R&D locations for multinational firms (Florida, 1997; Thursby and Thursby, 2006;). The extent to which private firms make use of university knowledge has been further corroborated through surveys of academic and industrial researchers (Mansfield, 1995, 1998; Tijssen, 2002). In surveys of U.S. researchers, Mansfield (1995, 1998) observed that a significant proportion (10%) of private firms’ new products and processes could not have been developed (or only with substantial delay) in the absence of recent academic research, accounting for 5% of firms’ total sales and resulting in cost savings of approximately 2%. A similar impact of public research is found in the case of Dutch firms in the study by Tijssen (2002). He noted that approximately 10% of patents held by Dutch firms are based on research carried out in close collaboration with Dutch universities. The quality of university faculty and research, as well as the geographical proximity to firms, determine how frequently firms make use of university knowledge. In line with previous research, this article adopts the regional knowledge production function approach to analyze the impact of the presence of university research activities on the technological performance of firms. It extends existing studies in three important ways. First, in addition to examining the impact of the mere presence of universities within the region, we enrich consecutive analysis by incorporating the number of scientific publications from universities located within the region. Consequently, it becomes feasible to examine the role of the scientific eminence of universities, a notion which is less well captured by the commonly used indicator in previous research2, i.e. university research budget size. Second, in our analysis we introduce panel data, whereas previous analyses almost invariably used single-year cross-sectional data. The use of panel models makes it possible to control for the effect of regional unobserved variables, which provides a more robust verification of the relationships under study. Finally, in this contribution, we explore the extent to which observed beneficial effects on the level of industrial technological activity - stemming from the presence of universities - are field specific. The distinctiveness of different technologies and industrial sectors has been previously highlighted in studies addressing innovation systems (e.g. Malerba (2002) introducing the concept of a sectoral innovation system) suggesting that the level of technological opportunities generated by university research might vary across technological fields (e.g. Van Looy et al. 2003 for a country level analysis). Only a limited number of studies (Acs et al., 1991; Anselin et al., 2000; Jaffe, 1989) have investigated the field-specific nature of university knowledge spillovers. Working on the level of two to four – broadly defined – technology classes (drugs and chemicals, electronics, mechanics, instruments), the results obtained are not consistent. Jaffe (1989) reports strong spillover effects in ‘drugs and chemicals’, while Anselin et al. (2000) found no effects of university research on innovation in this field. These inconsistencies highlight the need to further examine the technology-specific nature of university spillovers. This is done by adopting a more fine-grained perspective including data on 30 different technological fields. To summarize, the following research questions guide the empirical analysis reported in the sections that follow: RQ1: To what extent do we observe – for the Italian regions under study – positive effects of the regional presence of universities on technology-development activity undertaken by industry?
2 There are two exceptions in this respect. Blind and Grupp (1999) measured university knowledge pools using the number of professor patents, while Autant-Bernard (2001) employed total publication numbers (of all actors).
4

RQ2: To what extent does scientific eminence (of universities) create additional beneficial effects on industrial technology development? RQ3: To what extent are the observed relationships field-specific?
3. Data and Indicators
3.1 Sample The basic model for the econometric analyses is a regional knowledge production function. This function relates, on a regional level, the amount of technological activity on the level of the firm to the presence and size of the regional university knowledge pool while, at the same time, controlling for corporate R&D expenditures. Analyses are carried out on a panel dataset (1995-2001) for 101 Italian provinces (NUTS3 level 3). While Italy is composed of 103 Italian provinces, missing R&D expenditures data for two provinces (Bolzano-Bozen and Trento) has reduced analyses to 101 regions.
3.2 Dependent variable Technological activity of firms is measured by means of patent data. Patent indicators have the advantages of being easy to access; they cover long time series; and they contain detailed information on the technological content, owners, and inventors of the patented inventions. However, they also suffer from some shortcomings: not all inventions are patented and those that are patented vary in quality (Basberg, 1987; Griliches, 1990). Studies comparing patents with other indicators of technological knowledge, such as product announcements in trade and technical journals or expert opinions, have found a strong correlation between the different indicators – on the level of the firm (Hagedoorn and Cloodt, 2003; Narin and Noma, 1987) and on the regional level (Acs et al., 2002) – thus establishing patents as a good indicator of novel technological activity. In this study, indicators based on European (EPO) patent applications have been used. Due to the extensive time periods observed between application and granting decisions at the European Patent Office (four to six years), we opted for patent applications as the more correct indicator of ongoing technological activity. European patents are preferred to national Italian patents since they reflect, on average, higher value inventions. The applications reflect the inventor’s evaluation of the importance of the inventions, including the willingness to pay the patent office search and examination fees (Basberg, 1987) – which are relatively high in the EPO system compared to either the European national systems or the USPTO. Patent applications, having at least one assignee and inventor address located in Italy, have been classed as ‘Italian’. From this pool of patents, firm-owned patents have been identified by applying the sector allocation methods developed by Van Looy et al. (2006a). In a subsequent step, and following the most commonly used approach in patent studies, address information of the patent inventors is used to allocate patent applications to regions on the assumption that inventors live in the vicinity of their workplace4. Inventor addresses are assumed to be better indicators of the regional origin of patents than company (assignee) addresses. Indeed, in larger companies, the address of corporate headquarters is often used as the assignee address instead of the address of the research laboratory where the invention originated (Deyle and 3 The “Nomenclature of Units for Territorial Statistics (NUTS)” is the classification of European spatial units developed by the European Office for Statistics (Eurostat). 4 Note that commuting patterns might violate this assumption; in the empirical analysis, this potential problem is addressed – at least partially – by introducing spatially lagged BERD variables in the analysis.
5

Grupp, 2005). In case a patent contains multiple inventors from different Italian provinces, it is fully counted in each province. Finally, patents are assigned to technology fields based on their IPC technology codes and a technology concordance table that relates each IPC code uniquely to 30 technology fields5. When a patent is assigned to different technology fields, it is divided fractionally over those fields.
3.3. Explanatory variables The size of a region’s university knowledge pool is measured by the number of peer-reviewed publications of all universities present in a region. Publication data have been extracted from the ‘Web of Science’ database of Thomson Scientific. Only papers of the document type article, letter, note and review have been selected. After extensive name cleaning of publishing institutes’ names6, a list of all publishing Italian research universities7 – together with their annual publication numbers – has been created. Based on address information, universities are situated in Italian provinces, and regional university knowledge pools are calculated. More specifically, the variable regional scientific eminence contains the sum of the publications of all research universities in a province and year. The variable university presence is deducted from the latter and is a dummy variable that obtains a value of 1 if at least one research university is located in the province. To test the localized nature of university knowledge spillovers, spatially lagged variables are created. These variables are an indication of the presence of universities and their corresponding publication numbers in all neighboring provinces of a province8: sharing a common border is classified as neighboring. The impact of spillovers is proven to be geographically bounded when regional variables have a higher impact on regional technological performance than their spatially lagged counterparts. The data for regional private firm R&D expenditures (BERD) are compiled from Eurostat regional databases. Since Italian business R&D figures are only available at the level of 19 NUTS2 regions, weights have been used to apportion business R&D figures to the lower province (NUTS3) level. Weights are derived by relating available province-level data on manufacturing employee numbers (MAN_EMPL) to regional-level business R&D data. Concrete NUTS3 business R&D figures are estimated as follows:
BERDnuts3 = BERDnuts2 * [MAN_EMPLnuts3 / MAN_EMPLnuts2]
The reliability of this approximation has been verified by comparing real business R&D figures of NUTS2 regions with estimated figures, based on the approach outlined, yielding a correlation of 0.95 (p<0.0001). Hence, the estimated numbers can be considered an accurate approximation of R&D expenditures on the NUTS3 level. In line with the university presence
5 This concordance table has been developed jointly by Fraunhofer-Gesellschaft-ISI, Institut National de La Propriété Industrielle (INPI), and Observatoire de Sciences and des Techniques (OST). 6 This work has been carried out by Wolfgang Glänzel and Bart Thijs at Steunpunt O&O Indicatoren (Leuven/Belgium). 7 We have considered only universities with a significant number of scientific publications (at least 15 or more publications over a 10-year period); these universities are thus called 'research' universities in the paper. The few excluded universities were mostly recently founded. 8 The spatially lagged publication variable takes the sum of university publications from all neighboring provinces. The spatially lagged university presence variable indicates the number of neighboring provinces that host universities.
6
and scientific eminence variables, a spatially lagged variant of business R&D expenses has been created.
4. Results
4.1. Geographical distribution of industrial technological activities in Italy Table 1 provides descriptive statistics for the dependent and explanatory variables, based on average yearly values for all variables over the period 1995-2000. The mean yearly regional number of firm patents and firm R&D expenses amount to respectively 29 patents and 54 million Euros, with maximum values of 555 patents and 733 million Euros. About half (48 of 101) of Italian provinces host a minimum of one research-oriented university. Universities in those 48 regions publish on average 554 publications per province annually, with most (1/3) of Italian university publications originating from universities in Roma, Milano and Bologna.
INSERT TABLE 1
The geographic distribution of industrial technological activities in Italy is shown in Figure 1. This figure maps the average yearly number of firm patents (1995-2000) per province. A list of all province names is included in Appendix 2. Innovation activities are highly concentrated in the northern part of Italy, with limited activities in South Italy, Sicily, and Sardinia. Five northern regions – Milano, Torino, Bologna, Bergamo and Varese – account for 40% of all Italian patents. Milano is by far the most inventive region, filing on average 555 EPO patents annually. Rome is the only non-northern region with more than 50 filed patents per year.
INSERT FIGURE 1
The correlations in Table 2 provide some initial indications on the determinants of the number of firm patents in a province9 . Firm patent numbers correlate positively with firm R&D expenditure (strongly) and the university-related variables (presence, scientific eminence). The spatially lagged university variables correlate less with firm patents than the university variables of their own region, suggesting the localized nature of university knowledge spillovers. The geographic concentration of private R&D activities in Italy is also revealed in the positive correlation between regional firm R&D expenditure and expenditure in the neighboring regions. Correlations between university variables and their spatially lagged counterparts are not significant. This signals that research universities, in contrast to firms’ innovation activities, are more equally spread over Italian provinces.
INSERT TABLE 2
4.2. Effects of university presence and scientific eminence.
The impact of university research on firms’ technological performance is examined in two steps. First, the technological performance of firms in regions hosting research universities is compared with firm performance in regions lacking such universities. This is done by
9 Correlations are calculated on a dataset of 101 observations containing average yearly values for all variables.
7

including the university presence variable in a knowledge production function covering data on all 101 Italian provinces (Model 1). Second, for the subset of 48 regions having research-oriented universities, the effect of varying scientific eminence is examined in greater detail using university publication data (Model 2). This two-step approach differs from existing studies that restrict analyses to the subset of regions with universities (Anselin et al., 1997; Fischer and Varga, 2003; Jaffe, 1989) or perform analyses on such a highly aggregated level that all regions have universities (Blind and Grupp, 1999; Del Barrio-Castro and Garcia-Quevedo, 2005; Piergiovanni and Santarelli, 2001;). The regional number of patents is a typical example of a count variable, making count data regression techniques appropriate. Log-likelihood ratio tests on yearly and average (1995-2000) patent data show that the dependent variable is characterized by overdispersion, making Poisson regression models inappropriate. Hence, we adopted a negative binomial regression model in which the conditional variance of the count variable is modeled as a quadratic function of its conditional mean (Cameron and Trivedi, 1998).
INSERT TABLE 3
First, negative binomial regressions are estimated on a cross-sectional dataset of average (1995-2000) values for the different variables under study (see Table 3). As expected, regional firm R&D expenses are positive and strongly significant in both models. The estimated parameters for the spatially lagged firm R&D expenses are also positive, but not significant. In addition, the university presence variable is positive and significant in Model 1. Combined with a non-significant spatially lagged university presence variable, this indicates that firms benefit technologically from locating in close proximity to research universities. Furthermore, in Model 2 it becomes apparent that the impact of the presence of universities depends positively on the scientific eminence of local universities, while the spatially lagged counterpart is not significant.
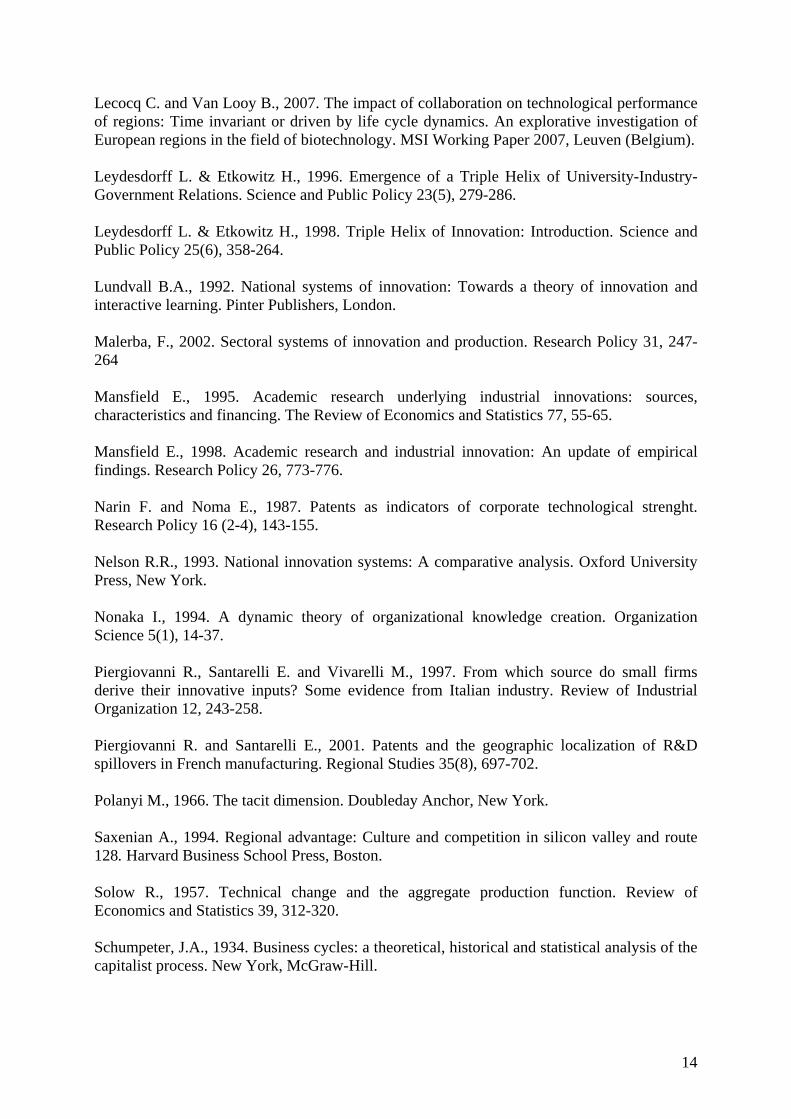
INSERT TABLE 4 In a subsequent step, the robustness of these results is tested by re-estimating the above models with panel data techniques (see Table 4). Yearly regional patent counts (1996-2001) are regressed on one-year lagged explanatory variables10. Both models are estimated first with random effects negative binomial regression techniques. To control for time-invariant unobserved regional characteristics, a fixed-effect negative binomial regression is estimated for the model including scientific eminence. The fixed-effect approach is not possible for the model that assesses the presence of universities since this presence is time-invariant. In line with the cross-sectional results, regional firm R&D expenses have, in all panel data models, positive and significant effects on firm technological performance. The estimated parameters for the spatially lagged firm R&D expenses are also positive and significant. This indicates that firms do benefit from knowledge spillovers from other firms in neighboring regions. Furthermore, the university presence variable has a positive and significant coefficient in the random effects estimation of Model 1 (Column 2 in Table 4), while the spatially lagged counterpart is not significant. This confirms our earlier finding that firms realize a technological premium by locating close to research universities. Random and fixed effect estimations of the second model are displayed in Columns 3 and 4 respectively of Table 4. Results are in line with the cross-sectional findings: the size of the university spillover effects
10 Data on private R&D expenses is missing for four observations, leading to a panel with 602 observations
8

depends on the scientific eminence of local research universities. It should be noted that, in contrary to the cross-sectional results, the spatially lagged publication variable is significantly positive. The coefficient is, however, two to three times smaller than the regional variable, again demonstrating the localized nature of university knowledge spillovers.
4.3. Exploring the field Specific Nature of University Knowledge Spillovers This section investigates whether university knowledge spillovers differ across technologies. Regional firm patent counts at the technology-field level (n=30) act as the new dependent variable. To ensure a greater number of positive observations for the dependent variable, analyses are performed on a cross-sectional dataset of aggregated values over time (1995-2000) for all variables. Note that regional data by field are not available for firm R&D expenses and university publications. Therefore, technology-specific analyses are only estimated for the model with the university presence variables (Model 1)11, controlling for total regional firm R&D expenditures (BERD). These data limitations give the field-specific analyses a more explorative character.
INSERT FIGURE 2
Average regional firm patent counts per technology field are plotted in figure 2 for both regions with and without research universities. For all technology fields, average patent counts in regions hosting universities are equal or larger than in regions without universities. The size of this technological performance difference varies across technology fields, indicating the field specific nature of university knowledge spillovers.
INSERT TABLE 5 Plotted patent counts are, however, not controlled for differences in regional firm R&D expenditures. This is done by running separate knowledge production functions for all 30 technology fields (101 observations per regression). As shown in Table 5, firm R&D expenses have positive and significant effects in 28 of the 30 technology fields. Firm technological activities in different technology fields are found to benefit differently from university knowledge spillovers. The estimated coefficients for the university presence variable vary between 0.11 and 1.19 and are significant for 15 of the 30 technology fields. Significant and positive effects for the spatially lagged university variable are found for six technologies. The strongest spillover effects are found in Pharmaceuticals, Semiconductors, IT Hardware, and Biotechnology. No or low effects are found for most mechanical and material processing technologies.
But what have technology fields that benefit most from university knowledge spillovers in common? It seems logic to hypothesize that these technologies belong to regimes (Dosi, 1982) where recent scientific insights are beneficial for overall technological progress. In order to formally test this hypothesis, we relied on citations to scientific articles found in the prior art section of patent documents. As documented by Van Looy et al. (2006b, 2007) the average number of citations to scientific articles observed in patent documents within a technology domain can be seen as an indicator of the relevance of science for technological 11 Publication propensities differ widely across scientific disciplines and corresponding technology fields, making total regional publication totals inappropriate estimators of technology-specific regional publication totals.
9

activity within that field. Since the majority of all non-patent documents in patents’ references are scientific in nature (journal articles, books etc.)12, data on frequencies of all non-patent documents are used to create a ‘science intensity’ index for each technological field. For calculating the index, citation data of all granted EPO patents (448 980 patents) with application years between 1991 and 2001, are used. Appendix 1 contains the ranked science-basedness values for the 30 technology fields. The fields ‘biotechnology’, ‘pharmaceuticals and cosmetics’, and ‘semiconductors’ obtain the highest scores on this indicator. In a subsequent step, this variable is incorporated in a model where industrial technological activity within a certain technological field (n=30) acts as a dependent variable. By pooling all technology-level observations (30*101 observations) in a knowledge production function and interacting regional university presence variables with the indicator of science-intensity, the results displayed in Table 6 are obtained.
INSERT TABLE 6 In Table 6, both firm R&D expenditures – including the lagged equivalent – and university presence are significant and positive, confirming the above findings. For science intensity, a significant and negative relationship is observed, signaling less (industrial) technological activity within Italian regions for fields close to science. At the same time, the interaction effects of the university presence variables (regional and spatially lagged) and the science-intensity of the fields are both positive and significant. This supports the hypothesis that university spillover effects are more pronounced for technologies that are located in the vicinity of science.
5. Conclusion and discussion This article has examined the impact of university knowledge spillovers on the technological performance of private firms following the regional knowledge production function framework. Applying panel data techniques on a dataset (1995-2001) containing patent indicators for 101 Italian provinces, total spillover effects at the regional level are estimated. The empirical results strongly confirm that firms realize a technological premium by locating in regions hosting research universities. The size of this premium depends positively on the scientific research strengths of the local research universities, as measured by the number of peer-reviewed scientific publications. Indeed, regions where scientific activity is taking place seem to find themselves in a beneficial position in terms of industrial technological activity. Consequently, our findings indicate that fostering research activities in universities will impact positively on the industrial technological performance in the encompassing region and should, therefore, become a focal point of attention for policy making (in this respect, see also Dosi et al., 2007). Furthermore, the results indicate that university knowledge spillovers follow a distance decay pattern, with firms in neighboring regions capturing only part of the university spillovers. This finding is in line with the idea that direct contacts between actors of an innovation system are important to transfer knowledge (see also the notions of tacit knowledge, Polanyi, 1966; Von Hippel, 1994). In addition, we investigated whether university knowledge spillovers differ across technology fields. Exploratory analyses on the level of 30 different technology fields reveal that industrial
12 Callaert et al. (2006) calculated for a sample of 5 000 non-patent references in EPO patents that 92% of the references can be classified as scientific (journal articles, books etc.).
10

technological activities do not benefit equally from the close proximity of research universities. The strongest spillover effects are found in the set of technologies that can be classed as science-based technological regimes – such as pharmaceuticals, biotechnology, and semiconductors. As more pronounced impacts have been observed for science-intensive technological fields, complementary roles of industry and academia within regional innovation systems emerge. Finally, our findings also revealed that several technological fields do not benefit from the presence of universities (see Table 5). The question then arises whether scientific knowledge is irrelevant for these fields or whether appropriate forms of university-industry collaboration are lacking. While the regional knowledge production framework allows us to assess the presence of spillovers, it does not provide insights into the mechanisms by which such spillovers are enacted. Further research investigating the specific impact of different transfer mechanisms within different fields seems highly relevant to further inform policy makers on the appropriate balance between fostering the scientific eminence of universities and stimulating science-industry interactions. We hope the current analysis inspires other scholars to engage in such efforts.
11

References Acs Z., Audretsch D. and Feldman M., 1991. Real effects of academic research: Comment. American Economic Review 81, 363-367. Acs Z., Audretsch D. and Feldman M., 1994. R&D spillovers and recipient firm size. The Review of Economics and Statistics 76, 336-340. Acs Z., 2000. Regional Innovation, Knowledge and Global Change. Pinter, London. Acs Z., Anselin L. and Varga A., 2002. Patents and innovation counts as measures of regional production of new knowledge. Research Policy 31, 1069-1085. Anselin L., Varga A. and Acs Z., 1997. Local geographic spillovers between university research and high technology innovations. Journal of Urban Economics 42, 422-448. Anselin L., Varga A. and Acs Z., 2000. Geographic and sectoral characteristics of academic knowledge externalities. Papers in Regional Science 79, 435-445. Autant-Bernard C., 2001. Science and knowledge flows: evidence from the French case. Research Policy 30, 1069-1078. Bania N., Calkins L. and Dalenberg D., 1992. The effects of regional science and technology policy on the geographic distribution of industrial R&D laboratories. Journal of Regional Science 32(2), 209-228. Basberg B., 1987. Patents and the measurement of technological change: A survey of the literature. Research Policy 16, 131-141. Belderbos R., Leten B. and Suzuki S., 2007. Does excellence in academic research attract foreign R&D? MSI Working Paper 2007, Leuven (Belgium). Blind K. and Grupp H., 1999. Interdependencies between the science and technology infrastructure and innovation activities in German regions: empirical findings and policy consequences. Research Policy 28, 451-468. Buesa M., Heijs J., Pellitero M. and Baumert T., 2006. Regional systems of innovation and the knowledge production function: the Spanish case. Technovation 26, 463-472. Callaert J., Van Looy B., Verbeek A., Debackere K. and Thijs B., 2006. Traces of prior art: An analysis of non-patent references found in patent documents. Scientometrics 69, 1, 3-20. Cameron A. and Trivedi P., 1998. Regression analysis of count data. Cambridge University Press, Cambridge. Cantwell J. and Piscitello L., 2005. Recent location of foreign-owned research and development activities by large multinational corporations in the European regions: The role of spillovers and externalities. Regional Studies 39, 1, 1-16.
12

Chesbrough H., 2003. Open Innovation: The new imperative for creating and profiting from technology. Harvard Business School Press, Boston, Cooke P., Uranga M. G., Etxebarria G., 1997. Regional Innovation Systems: Institutional and organisational dimensions, Research Policy 26, 475-491 Del Barrio-Castro T. and Garcia-Quevedo J., 2005. Effects of university research on the geography of innovation. Regional Studies 39(9), 1217-1229. Deyle H. and Grupp H., 2005. Commuters and the regional assignment of innovative activities: A methodological patent study of German districts. Research Policy 34, 221-234. Dosi G., 1982. Technological paradigms and technological trajectories. Research Policy 11, 1982, 147-162. Dosi G., Llerena P, Labini M.S., 2006. The relationships between science, technologies and their industrial exploitation: An illustration through the myths and realities of the so-called 'European Paradox'. Research Policy 35(10), 1450-1464. Faems D., Van Looy B. and Debackere K., 2005. Interorganizational collaboration and innovation: Toward a portfolio approach. The journal of product innovation management 22(3), 238-250. Feldman M. and Florida R., 1994. The geographic sources of innovation: Technological infrastructure and product innovation in the United States. Annals of the Association of American Geographers 84(2), 210-229. Fischer M. and Varga A., 2003. Spatial knowledge spillovers and university research: Evidence from Austria. The Annals of Regional Science 37, 303-322. Florida R., 1997. The globalization of R&D: results of a survey of foreign-affiliated R&D laboratories in the USA. Research Policy 26, 85-103. Freeman, C., 1987, Technology Policy and Economic Performance. Pinter, London.
Fritsch M. and Franke G., 2004. Innovation, regional knowledge spillovers and R&D cooperation. Research Policy 33, 245-255. Griliches Z., 1979. Issues in assessing the contribution of research and development to productivity growth. Bell Journal of Economics 10, 92-116. Griliches Z., 1990. Patent statistics as economic indicators – a survey. Journal of Economic Literature 28(4), 1661-1707. Hagedoorn J. and Cloodt M., 2003. Measuring innovative performance: is there an advantage in using multiple indicators? Research Policy 32, 1365-1379. Jaffe A., 1989. Real effects of academic research. American Economic Review 79, 957-970.
13
Lecocq C. and Van Looy B., 2007. The impact of collaboration on technological performance of regions: Time invariant or driven by life cycle dynamics. An explorative investigation of European regions in the field of biotechnology. MSI Working Paper 2007, Leuven (Belgium). Leydesdorff L. & Etkowitz H., 1996. Emergence of a Triple Helix of University-Industry-Government Relations. Science and Public Policy 23(5), 279-286. Leydesdorff L. & Etkowitz H., 1998. Triple Helix of Innovation: Introduction. Science and Public Policy 25(6), 358-264. Lundvall B.A., 1992. National systems of innovation: Towards a theory of innovation and interactive learning. Pinter Publishers, London. Malerba, F., 2002. Sectoral systems of innovation and production. Research Policy 31, 247-264 Mansfield E., 1995. Academic research underlying industrial innovations: sources, characteristics and financing. The Review of Economics and Statistics 77, 55-65. Mansfield E., 1998. Academic research and industrial innovation: An update of empirical findings. Research Policy 26, 773-776. Narin F. and Noma E., 1987. Patents as indicators of corporate technological strenght. Research Policy 16 (2-4), 143-155. Nelson R.R., 1993. National innovation systems: A comparative analysis. Oxford University Press, New York. Nonaka I., 1994. A dynamic theory of organizational knowledge creation. Organization Science 5(1), 14-37. Piergiovanni R., Santarelli E. and Vivarelli M., 1997. From which source do small firms derive their innovative inputs? Some evidence from Italian industry. Review of Industrial Organization 12, 243-258. Piergiovanni R. and Santarelli E., 2001. Patents and the geographic localization of R&D spillovers in French manufacturing. Regional Studies 35(8), 697-702. Polanyi M., 1966. The tacit dimension. Doubleday Anchor, New York. Saxenian A., 1994. Regional advantage: Culture and competition in silicon valley and route 128. Harvard Business School Press, Boston. Solow R., 1957. Technical change and the aggregate production function. Review of Economics and Statistics 39, 312-320. Schumpeter, J.A., 1934. Business cycles: a theoretical, historical and statistical analysis of the capitalist process. New York, McGraw-Hill.
14

Tijssen R., 2002. Science dependence of technologies: evidence from inventions and inventors. Research Policy 31, 509-526. Thursby J. and Thursby M., 2006. Here or there? A survey of factors in multinational R&D location. Report to the government-university-industry research roundtable, National academy of sciences. Van Looy B., Zimmermann E., Veugelers R., Verbeek A., Mello J. and Debackere K., 2003. Do science-technology interactions pay off when developing technology? An explorative analysis of 10 science-intensive technology domains. Scientometrics 57(3), 355-367. Van Looy B., Du Plessis M. and Magerman T., 2006a. Data production methods for harmonized patent indicators: Assignee sector allocation. EUROSTAT working paper and studies, Luxemburg. Van Looy B., Debackere K., Callaert J., Tijssen R. and Van Leeuwen T., 2006b. Scientific capabilities and technological performance of national innovation systems: An exploration of emerging industrial relevant research domains. Scientometrics 66(2), 295-310. Van Looy B., Magerman T. and Debackere K., 2007. Developing technology in the vicinity of science: An examination of the relationship between science intensity (of patents) and technological productivity within the field of biotechnology. Scientometrics 70(2), 441-458. Varga, Attila, 2002. Knowledge Transfers from Universities to the Regional Economy: A Review of the Literature, in: Varga, A., László S. (Eds.), Innovation, Entrepreneurship and Regional Economic Development: International Experiences and Hungarian Challenges. University of Pécs Press, Pécs, pp. 147-171. Von Hippel E., 1988. The sources of innovation. Oxford University press, New York. Von Hippel E., 1994. Sticky information and the locus of problem solving: Implications for innovations. Management Science 40(3), 429-439. Woodward D., Figueiredo O., Guimaraes P., 2006. Beyond the Silicon Valley: University R&D and high-technology location. Journal of Urban Economics 60, 15-32. Woolcock, M., 1998. Social capital and economic development: toward a theoretical synthesis and policy framework. Theory and society 27, 151-208.
15

Tables & Figures Figure 1: Geographic Distribution of Innovation Activity in Italy
Table 1: Descriptive Statistics
Obs. Mean Std. Dev. Min Max Firm Patents 101 29.21 64.37 1 555 Firm R&D 101 54.12 108.12 0.12 732.53 University Presence 101 0.47 0.50 0 1 Scientific Eminence (#Publications)
101 263.14 565.10 0 3 488.83
Lagged firm R&D 101 278.83 316.09 0.43 1 180.85 Lagged University Presence 101 2.27 1.22 0 5 Lagged Scientific Eminence 101 1 394.22 1 202.74 0 4 637.33
16

Table 2: Correlation Matrix Firm
Patents Firm R&D
University Presence
Scientific Eminence
Lagged Firm R&D
Lagged University Presence
Lagged Scientific Eminence
Firm Patents 1 Firm R&D 0.85* 1 University Presence 0.27* 0.26*
1 Scientific Eminence 0.62* 0.63* 0.49*
1 Lagged Firm R&D 0.33* 0.38* 0.05 0.02 1 Lagged University Presence
0.21* 0.14 -0.05 0.10 0.37*
1 Lagged Scientific Eminence
0.05 0.02 0 -0.09 0.56* 0.56*
1 Note: Significance of correlations is indicated by *(0.05) Table 3: Total Regional Effects (Cross Sectional Data)
Model 1 Model 2 Firm R&D 0.0059** 0.0028* (0.0016) (0.0014) University Presence 0.5784** (0.1988) Scientific Eminence 0.0007** (0.0002) Lagged University Presence 0.0951 (0.1020) Lagged Firm R&D 0.0007 0.0013 (0.0004) (0.0007) Lagged Scientific Eminence 0.0001 (0.0002) Constant 1.8525** 2.0985** (0.2602) (0.2354) N 101 48 ll -393.0363 -203.3965 LR chi2(4) 81.04 52.68 Note: Significance of correlations is indicated by * (0.05), ** (0.01)
17
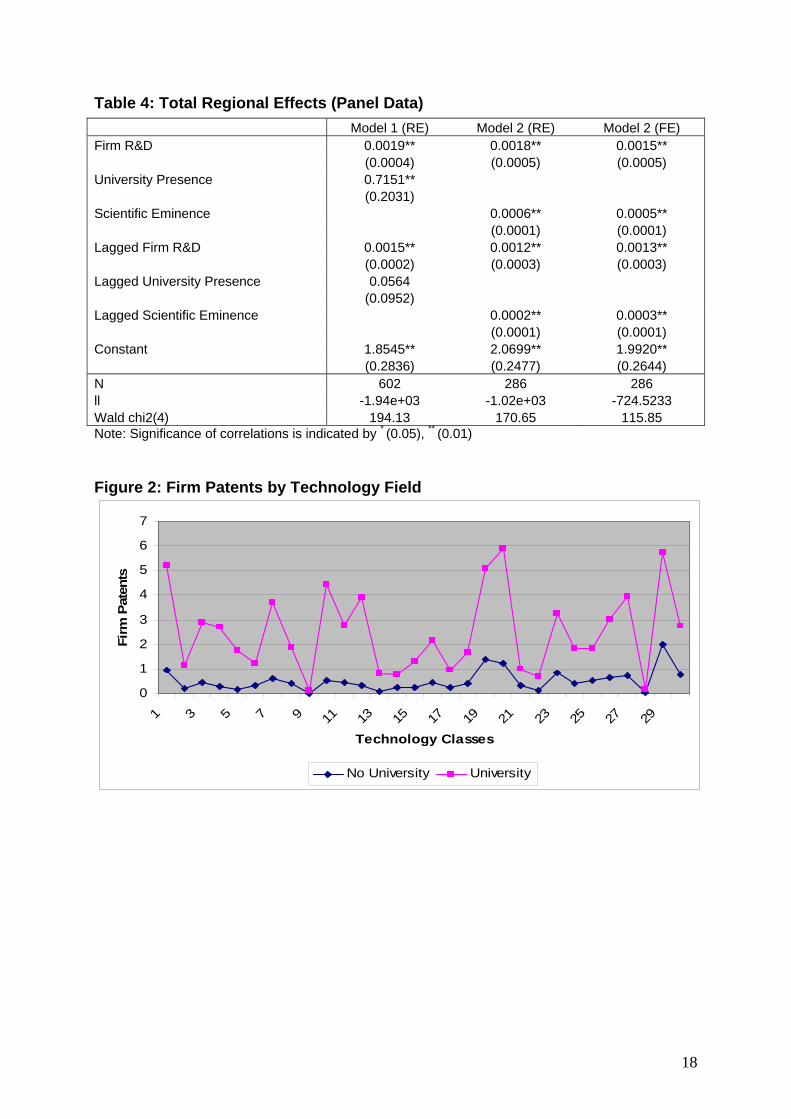
Table 4: Total Regional Effects (Panel Data)
Model 1 (RE) Model 2 (RE) Model 2 (FE) Firm R&D 0.0019** 0.0018** 0.0015** (0.0004) (0.0005) (0.0005) University Presence 0.7151** (0.2031) Scientific Eminence 0.0006** 0.0005** (0.0001) (0.0001) Lagged Firm R&D 0.0015** 0.0012** 0.0013** (0.0002) (0.0003) (0.0003) Lagged University Presence 0.0564 (0.0952) Lagged Scientific Eminence 0.0002** 0.0003** (0.0001) (0.0001) Constant 1.8545** 2.0699** 1.9920** (0.2836) (0.2477) (0.2644) N 602 286 286 ll -1.94e+03 -1.02e+03 -724.5233 Wald chi2(4) 194.13 170.65 115.85 Note: Significance of correlations is indicated by * (0.05), ** (0.01) Figure 2: Firm Patents by Technology Field
0
1
2
3
4
5
6
7
1 3 5 7 9 11 13 15 17 19 21 23 25 27 29
Technology Classes
Firm
Pat
ents
No University University
18

Table 5: Separate Regressions per Technology Field (Cross Sectional Data)
Nr Technology Class Firm R&D University Presence
Lagged Firm R&D
Lagged University Presence
1 Electrical Machinery 0.0041** 0.5523** 0.0010** -0.0159 2 Audio-Visual Technology 0.0029** 0.4927 0.0007* 0.2624** 3 Telecommunications 0.0037** 0.5289** 0.0009** 0.1126* 4 Information Technology 0.0027** 0.9797** 0.0012** 0.1199 5 Semiconductors 0.0038** 0.9805** 0.0007 -0.0094 6 Optics 0.0040** 0.0635 0.0011** -0.0567
7 Analysis, Measurement and Control Tech. 0.0036** 0.7933** 0.0003 0.1102
8 Medical Technology 0.0016 0.9231 0.0014 0.0257 9 Nuclear Engineering 0.0031** 0.6489** 0.0002 0.0201 10 Organic Fine Chemistry 0.0032** 0.8638** 0.0012** 0.2715**
11 Macromolecular Chemistry, Polymers 0.0026** 0.8126** 0.0011** 0.0853
12 Pharmaceuticals, Cosmetics 0.0038** 1.1983** 0.0007* 0.2394** 13 Biotechnology 0.0027** 0.9187** 0.0000 0.3528** 14 Agriculture, Food Chemistry 0.0030** 0.2676 0.0003 0.0432
15 Chemical & Petrol Industry, Basic Materials 0.0031** 0.5323* 0.0007* 0.1588
16 Chemical Engineering 0.0028** 0.6892** 0.0007* 0.1714* 17 Surface Technology, Coating 0.0029** 0.1174 0.0004 0.1312 18 Materials, Metallurgy 0.0037** 0.4153 0.0002 0.0907
19 Materials Processing, Textiles, Paper 0.0043** 0.2045 0.0010** 0.0683
20 Handling, Printing 0.0050* 0.7772** 0.0005 0.1317
21 Agricultural and Food Processing Machinery 0.0020 0.4441 0.0005 -0.1136
22 Environmental Technology 0.0030** 0.6486* 0.0002 0.0424 23 Machine Tools 0.0041** 0.4462 0.0002 -0.0600 24 Engines, Pumps and Turbines 0.0038** 0.5961* 0.0002 -0.0158 25 Thermal Processes and Apparatus 0.0033** 0.5269 0.0003 0.0275 26 Mechanical Elements 0.0044** 0.3605 0.0008* -0.0224 27 Transport 0.0053** 0.3812 0.0008* -0.1347 28 Space Technology and Weapons 0.0032** 0.2737 -0.0007 0.1744 29 Consumer Goods and Equipment 0.0047** 0.1101 0.0001 0.1409
30 Civil Engineering, Building and Mining 0.0038** 0.1818 0.0003 0.0516
Note: Significance of correlations is indicated by * (0.05), ** (0.01)
19

Table 6: Exploring the field-specific nature of spillover effects: negative binomial regression with industrial patents by field/region acting as the dependent variable.
Model 1 Firm R&D 0.0038** (0.0002) University Presence 0.3400** (0.0837) Lagged Firm R&D 0.0006** (0.0001) Lagged University Presence -0.0134 (0.0364) Science Intensity of Field -0.6821** (0.0997) University Presence * Science Intensity of Field 0.2391** (0.0769) Lagged University Presence * Science Intensity of Field 0.0945** (0.0313) Constant -0.1230 (0.1072) N 3030 ll -4.39e+03 LR chi2(7) 1327.44 Note: Significance of correlations is indicated by * (0.05), ** (0.01)
20

Appendices
Appendix 1: Science Basedness Indicator
Technology field Index 1 Biotechnology 3.340 2 Pharmaceuticals and cosmetics 2.061 3 Semiconductors 2.030 4 Organic fine chemistry 1.732 5 Agriculture and food chemistry 1.726 6 Optics 1.407 7 Information technology 1.333 8 Materials, metallurgy 1.322 9 Telecommunications 1.214 10 Audio-visual technology 1.184 11 Surface technology, coating 1.119 12 Analysis, measurement and control technology 1.066 13 Chemical & petrol industry, basic materials 1.051 14 Nuclear engineering 1.045 15 Macromolecular chemistry and polymers 0.807 16 Electrical machinery 0.766 17 Environmental technology 0.714 18 Materials processing, textiles and paper 0.695 19 Machine Tools 0.666 20 Engines, pumps and turbines 0.578 21 Chemical engineering 0.553 22 Thermal processes and apparatus 0.472 23 Handling and printing 0.467 24 Agricultural and food processing machinery 0.417 25 Transport 0.370 26 Mechanical elements 0.335 27 Space technology and weapons 0.329 28 Medical technology 0.288 29 Consumer goods and equipment 0.216 30 Civil engineering, building and mining 0.181
21

Appendix 2: List of Province Names
Code Province Name Code Province Name AG Agrigento MS Massa Carrara AL Alessandria MT Matera AN Ancona NA Napoli AO Aosta NO Novara AP Ascoli Piceno NU Nuoro AQ L'Aquila OR Oristano AR Arezzo PA Palermo AT Astio PC Piacenza AV Avellino PD Padova BA Bari PE Pescara BG Bergamo PG Perugia BI Biella PI Pisa BL Belluno PN Pordenone BN Benevento PO Prata BO Bologna PR Parma BR Brindisi PS Pesaro E Urbino BS Brescia PT Pistoia BZ Bolzano PV Pavia CA Cagliari PZ Potenza CB Campobasso RA Ravenna CE Caserta RC Reggio di Calabria CH Chieti RE Reggio Nell'Emilia CL Caltanissetta RG Ragusa CN Cuneo RI Rieti CO Como RM Roma CR Cremona RN Rimini CS Cosenza RO Rovigo CT Catania SA Salerno CZ Catanzaro SI Siena EN Enna SO Sondrio FE Ferrara SP La Spezia FG Foggia SR Siracusa FI Firenze SS Sassari FO Forli-Cesena SV Savona FR Frosinone TA Taranto GE Genova TE Teramo GO Gorizia TN Trento GR Grosseto TO Torino IM Imperia TP Trapani IS Isernia TR Terni KR Crotone TS Trieste LC Lecco TV Treviso LE Lecce UD Udine LI Livorno VA Varese LO Lodi VB Verbano-Cusio-Ossola LT Latina VC Vercelli LU Lucca VE Venezia MC Macerata VI Vicenza ME Messina VR Verona MI Milano VT Viterbo MN Mantova VV Vibo Valentia MO Modena
22

Acknowledgements The authors wish to express their gratitude to participants at the 6th Triple Helix Conference (Singapore) and Rene Belderbos for their useful comments and suggestions. In addition, we would like to explicitly thank Wolfgang Glanzel, Bart Thijs, Tom Magerman and Andrea Tricoli for providing access to, and helping us work with, the publication and patent data.
23