
Allocative efficiency measurement revisited—Do we really need input prices?
Upload
independentCategory
view
0download
0
Is Busy Really Busy? Board Governance Revisited*
Christian Andres, WHU – Otto Beisheim School of Management1 Inga van den Bongard, University of Mannheim2
Mirco Lehmann, University of Bonn3
ABSTRACT
We investigate the relationship between firm governance and the board’s position in the
social network of directors. Using a sample of 133 German firms over the four-year period
from 2003 to 2006, we find that firms with intensely connected supervisory boards (1) are
associated with lower firm performance, and (2) pay their executives significantly more. We
interpret these results as evidence of poor monitoring in firms with directors who are more
embedded in the social network. In both cases, simple measures for busy directors that were
used by other studies in the past fail to show any significant pattern. The findings suggest that
the quality and structural position of additional board seats may play a bigger role than simply
the number of board appointments.
JEL Classification: G30, G38
Keywords: Director Network, Busy Board, Agency Theory, Executive Compensation
1Corresponding author, Address: WHU – Otto Beisheim School of Management, Burgplatz 2, 56179 Vallendar, Germany; email: [email protected] 2Address: University of Mannheim, Schloss, 68131 Mannheim, Germany; email: [email protected] 3Address: University of Bonn, Adenauerallee 24-42, 53113 Bonn, Germany; email: [email protected] * We would like to thank an anonymous referee, the editor (Martin Walker), Ingolf Dittmann, Kevin McLaughlin, Ernst Maug, Stefan Petry, Harley E. Ryan, Jr., Erik Theissen, seminar participants at the University of Mannheim, the University of Innsbruck, the University of Hamburg, and the University of Rotterdam, participants of the 2009 European Financial Management Association Meeting in Milan, the 2009 Annual Meeting of the German Finance Association in Frankfurt, and the 2010 Annual Meeting of the Financial Management Association in New York for their helpful comments.
1
1. Introduction
A growing literature on board characteristics investigates the question of whether directors
with multiple board appointments are too busy to perform their monitoring duties (Ferris et
al., 2003; Fich and Shivdasani, 2006). The “busyness hypothesis” associates firms that have
busy directors with weak corporate governance, the assumption being that directors who serve
on a large number of boards may become overcommitted and unable to adequately comply
with the requirements of their position as monitors of management. Fich and Shivdasani
(2006) confirm this assertion, showing firms with busier boards to exhibit significantly lower
market-to-book ratios, whereas Ferris et al. (2003) find no evidence of a relationship between
number of board appointments and firm performance.
In this paper, we revisit the association between board busyness and firm governance. We
maintain that prior approaches, having been largely based on number of board seats, ignore
central aspects of “busyness”, which concept has more than one dimension. We suggest that a
crucial determinant of busyness is how “embedded” (Granovetter, 1985, 1992) directors are in
their social networks, that is, the “extent to which [a director’s] economic action is embedded
in structures of social relations” (Granovetter, 1985: 481). We argue that counting numbers of
board seats or connections to other directors is inadequate, that a more effective measure of
busyness incorporates a detailed characterization of a director’s social network including
analyses of individual ties and overall network architecture. More specifically, we propose
that an appropriate analysis of busyness needs to reflect not only directors’ immediate
connections to other directors within their social networks, but also connections among the
directors to whom they are connected. We argue that maintaining and adhering to the
demands of a large social network can consume substantial temporal and cognitive resources,
rendering intensely connected directors exceedingly busy and compromising their ability to
serve as efficient monitors.
2
To explore the foregoing hypothesis, we build on notions and methods derived from social
capital theory and social network analysis that facilitate the characterization of directors’
social networks with respect to busyness. The variables we use attempt to capture the
demands of such networks for time and cognitive resources, and may be interpreted as a
proxy for time- and attention-consuming social obligations inherent in a director’s network.
For example, directors’ formal ties with one another often reflect informal ties (Hwang and
Kim, 2009), such as joint memberships in golf clubs or charitable organizations. Being a well-
connected director likely also entails connections to important agents outside the boardroom,
as in politics, media, sports, and so forth. Arguably, directors who spend considerable time
catering to such social demands have less time to devote to monitoring duties.
A caveat is in order at this point. Previous literature has documented benefits of social
networks to agents (e.g., Cohen et al., 2010, Horton et al., 2012), such as privileged and
timely access to information or augmentation of social capital (Adler and Kwon, 2000). If
such advantages enable directors to better fulfil their board obligations, intense social
networks may benefit corporate governance. There is no evidence, however, that such
advantages accrue to directors through the network of board directorships, particularly in the
context of a two-tier system such as Germany has. Adams and Ferreira (2007: 235) argue that
a “dual board structure allows for the cleanest separation of the board’s two roles”, that is,
advising and monitoring. This being the case, it is unclear whether information that passes
through the network of directors1 is equally useful to directors whose primary role is to
monitor management (as stipulated in article 111 of the German Stock Corporation Act). We
suggest that when participation in a social network simultaneously elevates busyness and
bestows informational advantages, the busyness effect should dominate in this environment.
1 For ease of notation, the terms director and member of the supervisory board are used interchangeably throughout the paper. Members of the executive board are referred to as management or executives.

3
To empirically investigate the impact of busyness on firm governance, we collect data on the
social network of all members of the supervisory boards of all publicly traded German firms
(less financials) included in the DAX, MDAX, and SDAX indices over four consecutive years
(from 2003 to 2006). We map for each year the connections among all of the sample firms’
directors. Our dataset includes roughly 1,600 directors, and reflects approximately 35,000
connections, per year. We aggregate at the board-level different measures used to calculate
individual director’s busyness, and explore in a multivariate panel framework whether firms
with busy boards exhibit weaker firm governance.
Using fixed-effects panel regressions, we find firms with strongly connected supervisory
boards to tend to have significantly lower values of Tobin’s q. We further document the
average remuneration of executives in firms with strongly connected directors to be
significantly higher. Simple measures of director “busyness” used in prior research fail to
show any significant pattern in either case. We interpret our findings as evidence of weaker
governance and poorer monitoring in firms that have directors who play an important role in
their social network.
Our results make a number of important contributions. First, our study informs the debate on
the effects of multiple board appointments, supporting Shivdasani and Yermack (1999), Core
et al. (1999), and Fich and Shivdasani (2006), who find busy directors to be associated with
less effective monitoring. Our results are counter to those of previous studies that ascribe
positive value to multiple board appointments. Mace (1986), for example, argues that the
number of board seats can signal director quality, Brown and Maloney (1999) use number of
board appointments as a proxy for reputational capital, and Perry and Peyer (2005) argue that
“sender” firms can benefit from additional directorships that expose their directors to
management styles or strategies used in other firms. Our findings also have implications for
the notion of imposing arbitrary limits on the number of directorships that can be held,

4
indicating that such limitations are insufficient to prevent directors from becoming
overcommitted.
Second, previous research in this area has been conducted almost exclusively on U.S. data,
where (inside) firm governance is based on the one-tier system. Because corporate boards in
this environment consist of inside directors who run the firm and outside directors who are not
part of the management team, the literature focuses on outside directors on the premise that
inside directors do not monitor management (Fich and Shivdasani, 2006). Because in the one-
tier setting management might prefer to appoint to the board directors from the same social
circle (Mace, 1986; Barnea and Guedj, 2009), network measures capture how well connected
not only an outside (i.e., monitoring) director, but also management, is. This complicates the
interpretation of a relationship between network variables and firm governance, as slack
monitoring may reflect not so much exceeding “busyness” as members of the board simply
being more “lenient” towards management by way of reciprocating or positioning themselves
for other board seats (Wade et al., 1990). We use data from Germany, in which governance
structures are based on the two-tier system with an independent supervisory board. Most
importantly, German law explicitly forbids executives from nominating candidates for the
supervisory board.2 This legal environment enables us to examine the effect on firm
governance of position in the social network independent of interaction with executives.
Third, we add to the growing literature that attempts to incorporate mathematical concepts of
sociology (see Scott (2000) for an overview) into assessments of the impact of network
structures on finance. Horton et al. (2012), using methods of social network analysis to
investigate whether directors’ social networks provide valuable resources to their firms, find
them to be rewarded for their connectedness, and their connectedness to be positively related
2 According to paragraph 124(3) of the German Stock Corporation Act (AktG), executives are not allowed to nominate members of the supervisory board. Monitoring the executive board is the main responsibility of the supervisory board.

5
to future firm performance. Barnea and Guedj (2009), using measures that account for
directors’ importance in their social networks, find CEO remuneration to be higher and
turnover less sensitive to firm performance in firms with more connected directors. We draw
on social capital theory and social network analysis for methods and insights with which to
extend previous work on busy boards (Ferris et al., 2003, Fich and Shivdasani, 2006). Our
findings suggest that detailed characterizations of directors’ social networks capture busyness
more adequately and comprehensively than previously applied definitions based on simply
tallying numbers of board seats.
The remainder of the paper is organized as follows. In the next section, we develop our
central argument, building on notions drawn from social capital theory and social network
analysis. The dataset and network measures are described, and our descriptive statistics
presented, in section 3. Section 4 reports results of the multivariate panel data analysis.
Section 5 concludes.
2. Social Networks and Busy Boards
Directors are linked both directly, for example, through boards on which they jointly sit, and
indirectly, as through common acquaintances. We argue that maintaining connections and
satisfying associated obligations to other directors deplete limited temporal and cognitive
resources directors need to monitor management, and that analysing these connections affords
a way to characterize directors’ busyness.
Multiple board assignments are associated with a large number of direct obligations, most
notably attending a variety of board meetings, reading corporate reports, etc., thus rendering
directors busy. However, a multitude of board seats likewise mirror being intensely connected
to the network of interlocking directorships. These intense connections reflect the direct

6
obligations from sitting on a number of boards, but they similarly reflect the indirect
connections and the resulting obligations, for example joint memberships in golf clubs or a
charitable organization (Hwang and Kim, 2009). In addition, they are often associated with
connections to important agents outside the boardroom, e.g., in politics, media, or sports. We
maintain that because such social demands consume considerable time, too many may drive
selective allocation (Ferriani et al., 2009) that may result in neglect of monitoring duties.
In the presence of limits to human cognition (Kahneman, 1973), exposure to an abundance of
information through intense network ties may impair information processing in a variety of
ways (for an overview, see Eppler and Mengis (2004)) including inability to identify relevant
data (Schneider, 1987), inordinate attention to irrelevant issues, overlooking large amounts of
information, and “greater tolerance of error” (Sparrow, 1999: 144). Most recently, Oldroyd
and Morris (2012) theorized that cognitive limitations restrict the value of network ties
because the voluminous information generated by intense network connections, unmanaged,
can devolve into information overload, with adverse consequences for agents’ performance.
We hypothesize an analogous debilitating effect of excessive information gathered from
network connections on directors’ monitoring abilities. We further posit that the number and
quality of network connections determine the intensity of contacts and information and
resulting busyness. We argue, for example, that a director connected to a large number of
well-connected directors is busier than a director whose network connections have few further
connections.
The network on which our analysis is based is characterized by a strong core-periphery
structure with dense, cohesive subgroups (see Figure 1). In such environments, the quality of
higher-order (triadic) relations among directors, that is, relations among the directors to whom
a director is related, are of particular importance. The literature on social capital (e.g.,
Coleman, 1988) has emphasized the beneficial effects of network “closure”, by which is

7
meant the existence of connections among a director’s connections, because it facilitates
enforcement of social norms. Consider, for example, three actors, A, B, and C, the latter two
having in common a connection to A. B and C, if they are not connected to each other, have
no means of imposing sanctions on A for deviating from any social norm. But if a link is
established between B and C, resulting in a so-called “closed” triad in which all actors are
connected to each other, B and C can combine forces to collectively sanction A. Under the
assumption that monitoring management constitutes a social norm, one might expect directors
to devote more time to the activity in the context of a relatively “closed” network. A system
with strongly embedded interactions offers a further incentive in that failure to properly
monitor is exposed to other directors (Raub and Weesie, 1990). Still, there are some
arguments that closure may be a detriment to efficient monitoring. First, closure may restrict
directors in their ability to freely allocate resources among their monitoring duties. This is a
particularly likely scenario among directors with large numbers of connections in a network in
which additional restrictions should, ceteris paribus, have more intense effects.
Second, we suggest that a more important avenue by which closed networks can affect
busyness is by exacerbating the social obligations that arise within the network. If, for
example, the aforementioned directors B and C each host a social event, director A will feel
more compelled to attend both if B and C know each other than if they do not. Thus, by
imposing more social obligations network closure may translate into increased busyness.3 The
greater the number of a director’s connections, the more detrimental this effect is likely to be.
The propensity for members of a group to “feel obligated to help others [...] [as] a societal
norm prescribes socially responsible behaviour” (Cialdini and Trost, 1998: 157), applied to
the supervisory board, might take the form of members feeling obliged to assume tasks and
respond to requests for advice, which behaviour might be driven by the notion of reciprocity
3 Note that much of what might be subsumed under “obligations” could equally be called perquisites. From a director’s point of view, for example, attending a social event may be beneficial. This does not alter, however, the fact that such activities reduce the time available for a director’s monitoring duties.

8
among actors who feel indebted to return favours received in the past (Gouldner, 1960). Being
generous, moreover, enhances one’s social status, whereas seeking more often than providing
help can engender a negative public image (Lee, 1997, Flynn et al., 2006). But because time
spent helping others is time not devoted to meeting one’s own responsibilities (Hansen et al.,
2001), network-related activities may turn into a time-consuming social liability.
A high degree of closure can affect directors’ monitoring ability in a variety of ways. The
social indebtedness implicit in close-knit social environments, for example, can have adverse
effects beyond increasing busyness (Flynn et al., 2006). In the foregoing example, effective
monitoring of directors B and C might be impeded by potential consequences for director A’s
social life. The lines between social and professional environments, because of the high
transitivity of the connections, are likely to become blurred, dissuading directors from taking
actions that are counter to the interests of other board members. In this sense, network closure
might also foster unwarranted leniency among directors.
Our findings thus suggest that embeddedness in a social network of directors effectively limits
monitoring ability. Maintaining intense network connections may consume time and cognitive
resources, and closed network structures restrict and limit directors’ ability to freely allocate
resources. The metrics we employ attempt to capture these different dimensions of being part
of a network of directors.
3. Dataset and Network Measures
3.1 Sample Selection
The sample for this investigation includes all 150 companies that were part of the three largest
German stock indices as of 31 December 2002 (30 DAX, 70 MDAX, and 50 SDAX).4
4 The DAX (largest firms), MDAX (mid caps), and SDAX (small caps) are Deutsche Börse’s three major indexes of firms in the classic sectors. These companies, being part of the Prime Standard segment, must fulfil the highest transparency requirements in the EU including publishing on a quarterly basis financial reports in

9
Excluding all companies that abandoned their listing status during the four-year period (2002-
2006) during which we followed them left us with a balanced panel of 133 (non-financial)
firms, or 532 firm-year observations.5 Accounting data is from Datastream and Hoppenstedt
Aktienführer.6 Information on the composition of the supervisory board was manually
collected from the annual reports of the firms in the dataset. Panel A of Table 1 presents
descriptive statistics for several firm characteristics.
3.2 Measurement of Multiple Directorships
According to section 125 of the German Stock Corporation Act (AktG), publicly traded firms
must disclose all directorships held by members of their supervisory boards in other (for-
profit) firms. We therefore count all directorships in public and non-public firms.7 This
information enables us to detect connections between directors outside the 133 firms in our
sample. For example, although “FC Bayern München AG” is not a sample firm, four of the
directors in our sample are connected by virtue of sitting on its board.
In the two-tiered German corporate board system, members of the supervisory board oversee
the actions of the executive board, which is to say, management. Among other duties,
members of the supervisory board appoint, dismiss, and set remuneration for executives, and
approve management decisions.8 Employees are allocated control rights through the
supervisory board by codetermination laws that apply to public and private companies with
500 or more employees. Firms with more than 500 but fewer than 2,000 employees must
allocate one-third, firms with more than 2,000 employees one-half, of supervisory board seats both German and English, applying international accounting standards (IFRS/IAS or US-GAAP), releasing a financial calendar, conducting at least one analyst conference per year, and publishing their ad-hoc disclosures in English as well as in German. 5 Most firms terminate their listings following a squeeze-out by the dominant shareholder (10 firms). Only four firms dropped out of the sample due to insolvency. 6 The Hoppenstedt Aktienführer is an annual publication that provides detailed information (e.g., ownership structure, balance sheet information) on German listed firms. 7 If voluntarily reported, we exclude board appointments in non-profit organizations, trusts, and charitable organizations for reasons of data consistency. 8 See the German Stock Corporation Act (AktG) for a comprehensive description of the rights and duties of the supervisory board.

10
to employee representatives.9 Although employee representatives are often union members (in
the case of large firms, high ranking union officials), in fact, any employee can be elected to
the supervisory board. About 55% (25%) of the firms in our sample are subject to one-half
(one-third) representation, and 20% have no employee representatives on their supervisory
boards. The data in our main analysis is based on all members of the supervisory board. As a
robustness test, we construct all network variables based only on shareholder representatives.
The results, being qualitatively and quantitatively similar, are not tabulated.
Following Ferris et al. (2003) and the alternative methodology used by Fich and Shivdasani
(2006), we construct three variables that classify supervisory boards as busy/not busy based
on the number of board appointments held by members. In line with these papers, and
consistent with prior work by Core et al. (1999), we consider as busy directors who hold three
or more board appointments. Based on this definition, 52.44% (excluding employee
representatives) and 33.07% (including employee representatives) of the directors are
classified as busy. Panel B of Table 1 reports for our sample data the frequency of multiple
board appointments.
[Insert Table 1 about here]
The median board in our sample consists of 13 directors, seven shareholder, and six
employee, representatives. On average, directors hold 3.49 (excluding employee
representatives) and 2.72 (including employee representatives) directorships. In line with Fich
and Shivdasani (2006), we construct a dummy (0,1) variable set to one if 50% or more of a
board’s shareholder representatives are busy. By this measure, about 47% of firms are
governed by “busy boards”. Unlike Ferris et al. (2003), we do not find a positive correlation
between multiple directorships and firm size.
9 See Gorton and Schmid (2004) for a detailed description of the system, and legal background, of codetermination.

11
3.3 Social Network Measures
A social network consists of multiple agents connected through such social relations as direct
contacts, group attachments, or meetings (Scott, 2000). Network members and their
connections can be visualized as a structure of nodes and ties. In our analysis, nodes are the
individual directors within a network, ties the relationships between them. Directors who
serve on the same supervisory board are connected.
We collect for each firm and year in our sample data on all directors who serve on a firm’s
board.10 This yields a database of about 1,600 nodes and roughly 35,000 ties. We build an
annual social matrix in which each director is represented by a column and a row. If two
directors, i and j, serve on the same board, the value of the intersection point, that is, cell (i,j),
is 1, otherwise 0. Because relationships are always bilateral (director i knows director j, which
implies that j must know i), this procedure results in a symmetric matrix, the diagonal of
which (i.e., relation between i and i) is 0 by definition. Figure 1 visualizes the entire network
of directors for the year 2003.11
[Insert Figure 1 about here]
We use four well-established measures to capture how embedded a director is in the network.
Our construction encompasses the overall architecture of a director’s social network, that is,
we consider pairwise (dyadic) as well as higher-order (triadic) relations.
The first measure, Degree centrality (CD), is of the number of direct links (or contacts)
incident to a node (i.e., director), and is defined as
CD ni( )= di ni( )= xij
j=1
g
∑ = xjij=1
g
∑ (1)
10 If a director leaves a board during a fiscal year, whether due to end of tenure, dismissal, or death, we include both old and new director in the count for that year’s board. 11 The Organizational Risk Analyzer (ORA) software v. 1.9.0, which has been developed by CASOS (2008) at Carnegie Mellon is used to visualize the social network.

12
where g is the total number of directors or nodes ni. The variable is further normalized by
dividing (1) by the number of possible connections of director ni with the other g-1 nodes in
the network. Theoretically, because it captures only the number of connections, this measure
should be closest to the variable “busy board”. Degree centrality describes how active agents
are in the network. This measure is intuitive and comparatively easy to implement, but its
explanatory power is limited to the first network level, which means that two directors with
the same number of direct connections will be assigned the same value CD(ni), irrespective of
how well connected their contacts are. The second measure, Eigenvalue centrality, addresses
this issue.
Connectiveness, or Eigenvector centrality (CC), developed by Bonacich (1972, 1987), uses
weighted scores that measure the “quality” of connections when assessing the centrality of an
agent, which is to say, the extent to which a director is connected to other well-connected
directors. Being connected to other well-connected agents boosts not only a director’s
centrality, but the centrality of other directors connected to that director. Formally, the
individual centrality of each director is computed as:
CC ni( )=
WijCC (nj )j=1
g∑
λmax (2)
where Wij stands for the intersection of row i and column j in the social matrix discussed
above. Bonacich (1972) shows that there exists a positive Eigenvalue λ for every Matrix W
that results in a corresponding Eigenvector CC that consists only of positive values or 0. This
condition is met for the largest positive Eigenvalue. Like Degree centrality, Eigenvector
centrality is normalized.
We calculate the local Clustering Coefficient (Watts and Strogatz, 1988) as a proxy for the
degree of triadic closure within a director’s network. Clustering Coefficient, defined as the

13
probability that two randomly selected contacts of director A are also connected to each other,
measures the connectedness, or density, of an actor’s neighbourhood. In other words, it is the
ratio of the number of pairwise relations between director A’s contacts to the maximum
possible number of relations among them. For example, director A’s neighbourhood, if
director A is connected to directors B, C, and D, has three potential pairs (BC, CD, BD). If
only one pair is connected, for example, (BC), the clustering coefficient of director A is 1/3.
The Clustering Coefficient can range from zero (neither of A’s contacts is connected) to one
(all of A’s contacts are connected). A larger Clustering Coefficient thus implies a higher
degree of triadic closure within a director’s neighbourhood.
We apply, as a final measure, the K-Core decomposition, which enables us to identify dense,
cohesive subgroups in the network. This procedure, proposed by Seidman (1983), is based on
the minimum nodal degree within a sub-graph. A K-Core, then, is a sub-graph in which each
node is connected to at least k other nodes. It can be identified by recursively removing, or
“peeling off”, all nodes with a degree smaller than k until all remaining nodes in the sub-
network have at least a degree of k. This approach generates sub-graphs of gradually
increasing cohesion. Hence, the higher the K-Core score, the better connected an actor’s
neighbours and the more restricted the actor’s actions. We normalize this measure by dividing
by its largest value.
Our choice of the UCINET software package v6.171 to compute our network measures is
based on Huisman and van Duijn (2005), who compare different software packages used for
social network analysis. Table 2 lists the ten most central directors in terms of degree and
eigenvector centrality for each year of our sample period.12 To facilitate comparison of the
data over different years, the figures in the table are computed relative to the size of the
network.
12 We do not tabulate clustering coefficient and K-Core because, owing to the definition of the variables, a large number of directors have the largest possible values in each variable and year.

14
[Insert Table 2 about here]
The Degree measure, as can be seen in Table 2, is comparatively stable over time. The
number of directorships does not seem to change dramatically among the best-connected
directors. It becomes apparent, upon closer examination of Degree, that the best-connected
directors are mostly chairmen of large DAX companies. Our second measure,
Connectiveness, emphasizes the quality of connections. The example of Henning Schulte-
Noelle (chairman of Allianz AG) is illustrative. In 2003, Mr. Schulte-Noelle was among the
best-connected directors with respect to Degree and Connectiveness. When in 2004 he gave
up several directorships and lost more than 50 direct connections, Mr. Schulte-Noelle dropped
off the list of directors with the highest Degree. Although Connectiveness also decreased,
because he retained his positions at well-connected firms like E.ON AG and ThyssenKrupp
AG, Mr. Schulte-Noelle remained among the best-connected directors throughout the 2004-
2006 period.
Our last step, aggregating at the firm level the data on individual directors, enables us to draw
conclusions about the extent to which members of the supervisory board, and thus the board
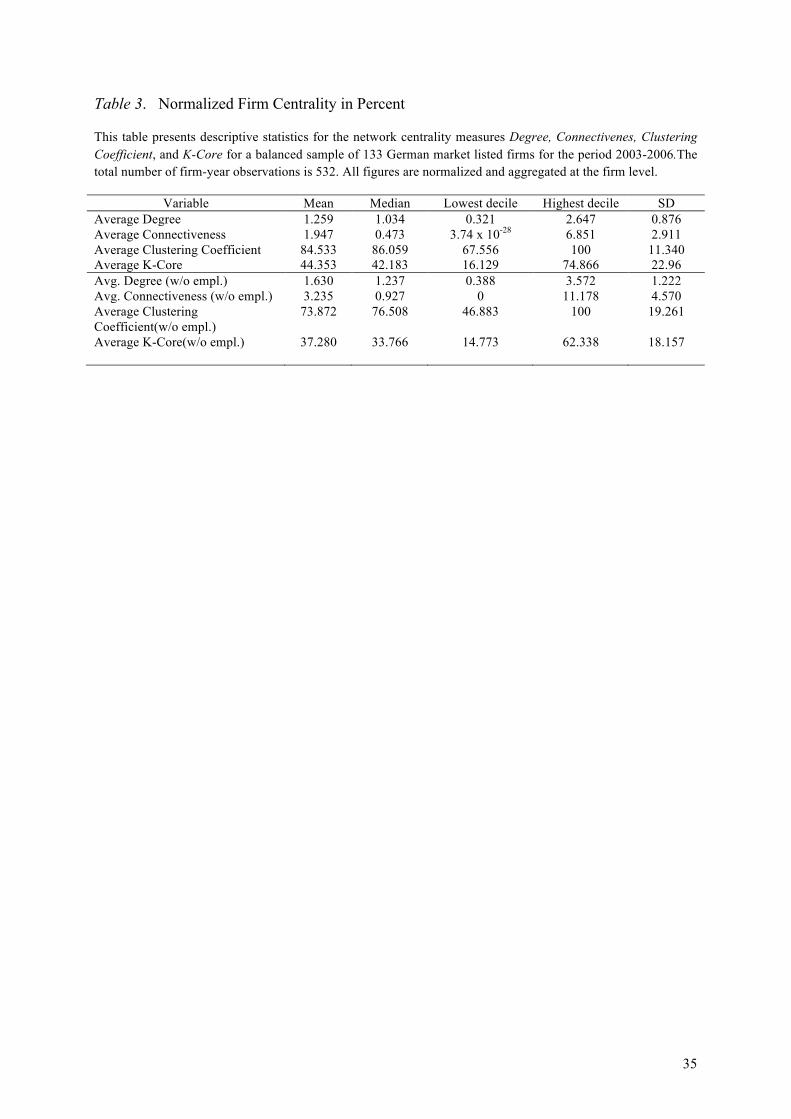
as a whole, might be busy or overcommitted. Table 3 presents descriptive statistics (in
percent) for our centrality measures.
[Insert Table 3 about here]
4. Multivariate Analysis
Our main hypothesis rests on the assumption that overcommitted individuals might shirk their
responsibilities as directors. Previous literature derived “busyness” simply from the number of
directorships. Believing this measure to be too simplistic because it does not capture the
“quality” of other obligations, we propose an alternative approach based on measures adopted
and adapted from social network research.

15
In this section, we examine, in a multivariate panel regression framework, the effect of
overcommitted boards on firm performance (measured by Tobin’s q) and executive
remuneration.
4.1 Multiple Directorships and Firm Performance
Our first step is to apply to our dataset the methodology used by Ferris et al. (2003) and Fich
and Shivdasani (2006). Specifically, we estimate firm fixed-effects models using market-to-
book value as the dependent variable.13 These models assume agency costs (incurred due to
poor monitoring by overcommitted directors) to be reflected in a lower market-to-book ratio.
Used as a proxy for Tobin’s q, the market-to-book ratio is calculated as market value of equity
at the end of the year plus book value of debt divided by the book value of assets at the end of
the year. We include as explanatory variables the three alternative measures for “busy boards”
used by Fich and Shivdasani (2006) together with variables that control for corporate
governance and financial characteristics. We control for firm size using the natural logarithm
of total assets. Yermack’s (1996) and Fich and Shivdasani’s (2006) results suggesting that
board size has a negative and significant effect on firm performance, we control for board size
using the log of the number of directors. We also control for the fraction of employee
representation on the board. In a study of German codetermination, Gorton and Schmid
(2004) find market valuation to decrease as the number of employee representatives on the
supervisory board increases. Several studies have shown ownership characteristics to also
play an important role in the German system of corporate governance (Franks and Mayer,
2001, Andres, 2008). In the absence of an active takeover market, large blockholders often act
as a firm’s main monitors. Because a large blockholder, given an incentive to expropriate
13 Ferris et al. (2003) use a cross-section of 1995 data; Fich and Sivdasani (2006) analyze data from 1989-1995 using fixed-effects regressions.
16
minority shareholders, might abuse its position, we include as control variables both the
voting rights of the largest blockholder (> 5%) and its squared term. The regressions further
control for the (log) number of board meetings, age of the firm (natural logarithm of years
since incorporation), risk (return volatility, measured as the standard deviation of share price
returns for the previous 36 months), and capital structure (leverage, defined as book value of
total debt divided by book value of total assets). Lastly, all models include year dummies.
Tests for correlation between the explanatory variables and variance inflation factors (not
reported) indicate that our regression models do not suffer from multicollinearity bias.14
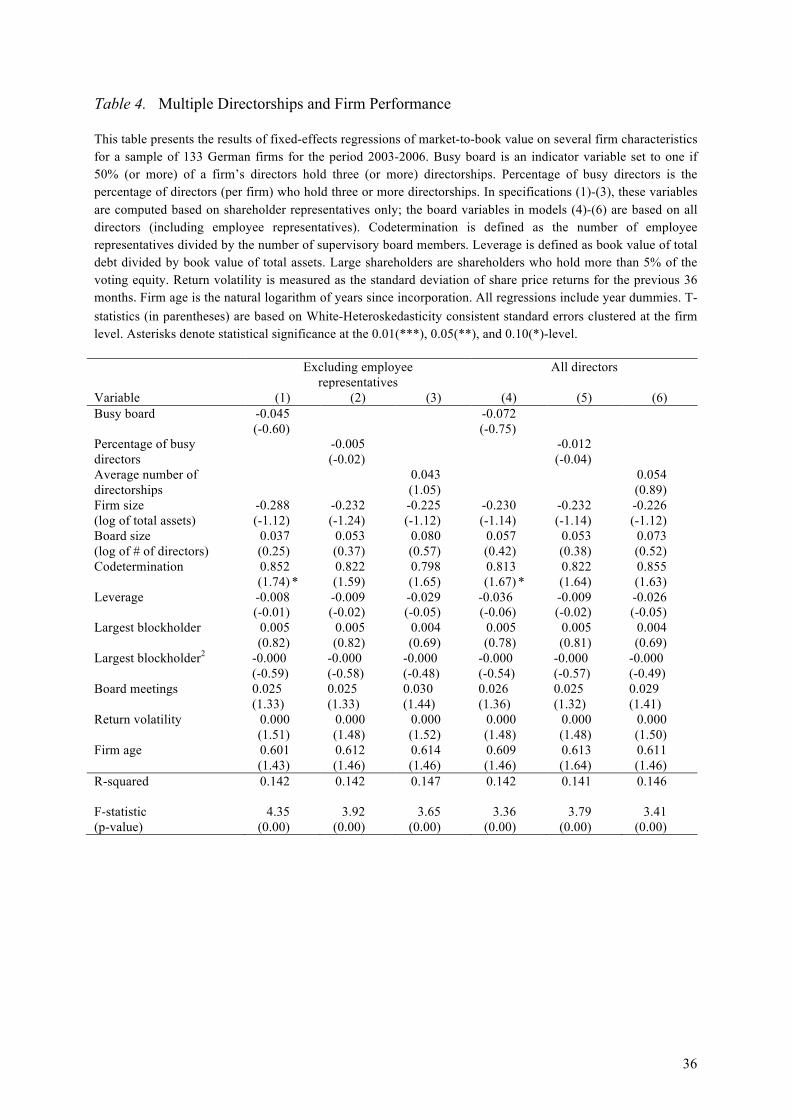
The results of the multivariate panel regressions are reported in Table 4. In models (1)-(3), all
variables that measure the extent to which boards are busy are based on directors who
represent shareholder interests (i.e., exclude employee representatives). Regressions (4)-(6)
are based on all directors including employee representatives. We do not find signs of a
significant relationship between busy directors and firm performance in any model
specification. The coefficients for busy board (a dummy set to one if 50% or more of the
directors hold three or more directorships) and percentage of busy directors (both used by
Fich and Shivdasani (2006)) are negative but insignificant. The coefficients of the variable
average number of directorships (used by Ferris et al. (2003)) are positive but insignificant.
These findings indicate that the number of board appointments a director holds does not seem
to influence firm performance in Germany. Compared to U.S. studies, the results are in line
with those of Ferris et al. (2003), but somewhat at odds with those of Fich and Shivdasani
(2006).
[Insert Table 4 about here]
14 The only exception is a comparatively high correlation between the variables size and board size, which might be too high (0.67). Estimating all regressions without board size, as a robustness test, we find the results to not be influenced by the correlation between the two variables.

17
4.2 Director Networks and Firm Governance
The preceding results do not support the hypothesis that busy boards are associated with poor
firm performance. A number of other research papers have tested the hypothesis that directors
overcommitted by virtue of having too many board assignments might lack the time and
attention required of vigilant monitors of management. In these studies, as noted above,
boards are classified as busy/not busy based on the number and percentage of directorships
per director. We maintain, however, that these measures will be noisy if they fail to
adequately capture the extent to which directors are truly busy and overcommitted. Consider,
for example, two of the directors in our sample, Mr. Schulte-Noelle, who held only four board
appointments in 2006, and Michael Busch, director at Washtec AG (a producer of vehicle
washing equipment), who served on seven boards in the same year. Based on the number of
board appointments, Mr. Busch is busier. Mr. Schulte-Noelle, however, is chairman of
Allianz AG and a director at Siemens AG, ThyssenKrupp AG, and E.ON AG, some of the
most important German companies with connections to politics, media, and sports. Being
among the best-connected of directors, and sitting at the heart of an “inner circle” of
organizational elites (Useem, 1984), he is more likely than Mr. Busch to be overcommitted,
not so much because of the (direct) duties associated with his directorships, but owing to the
indirect obligations that stem from his central position in the network. Because simple
measures, such as number of board seats and other closely related metrics, fail to detect this
dimension of additional directorships, we use alternative measures employed in social
network analysis, namely, the variables Degree, Connectiveness, Clustering Coefficient, and
K-Core (aggregated at the firm level), to measure the extent to which a firm’s directors are
overcommitted.
We first examine the effect on firm performance of directors’ embeddedness in the social
network. Tables 5.a and 5.b report the results of fixed-effects regressions with Tobin’s q as

18
the dependent variable. In Table 5.a, we use the network measures as substitutes for the busy
board variables included in section 4.1. Model specifications in Table 5.b contain the busy
dummy as an additional control variable, and use as network measures average Degree,
Connectiveness, Clustering Coefficient, and K-Core for every firm and year.15 All other
control variables are the same as in the regressions above.
[Insert Table 5 about here]
The influence of the number of directorships (captured by the variable busy board) on Tobin’s
q is reflected in the results in Table 5.b, which confirm the preceding findings and show
insignificant coefficients in all model specifications. Negative and significant coefficients (at
the 0.05-level) on the variables Degree and Connectiveness indicate an association between
directors who are comparatively central in the network and poor firm performance. Intense
network connections, although theoretically potentially beneficial to firms (e.g., by affording
access to financial resources), may overcommit directors in terms of time and cognitive
resources consumed. We further explore the impact of a director’s higher order relations using
first the local Clustering Coefficient, which measures the degree of closure within a director’s
neighbourhood. Although there is no clear prediction regarding the relation between network
closure and firm performance at low levels of director connectedness, we expect a negative
relation at high levels of connectedness. Because it does not indicate to how many other
directors a director is connected, we interact Clustering Coefficient with directors’ nodal
degree, with both interaction variables centered at their respective means. Our findings
suggest that the degree of triadic closure does not significantly affect the performance of firms
with an average nodal degree. The interaction term, however, is negative and highly
significant (at the 0.01-level), that is, the marginal effect of closure significantly decreases as
a director’s number of connections increases. As stated above, we expect monitoring ability,
15 Because using the median of the normalized values as a robustness test does not materially change the results, these specifications are not reported.

19
especially of a director already highly connected, to be adversely affected by a relatively
closed network structure. We illustrate this effect in Figure 2, which plots the average
marginal effect of Clustering Coefficient for different levels of degree (range: 10%-90%
percentile of degree).
[Insert Figure 2 about here]
At low levels of Degree, the marginal effect of closure is positive, but not significantly
different from zero. At higher levels of Degree, the effect shrinks and, if the normalized
Degree amounts to roughly 1.7 (1.5), becomes negative and significant (at the 0.05 (0.10)-
level). Network closure thus seems to negatively affect firm performance if a boards’
directors hold a large number of relations. These findings provide support for the idea that
closed network structures, by imposing too many time-consuming social obligations, may
impede efficient monitoring. We also find a negative and significant coefficient (at the 0.05-
level) on the variable K-Core, which implies an association between directors with relations
clustered in a cohesive subgroup and lower firm performance. The results are robust to
including the busy dummy as an additional control.
We further investigate the effect on firm governance by examining the relation between
network embeddedness and level of executive compensation. The rationale advanced by prior
academic research that finds weak monitoring and poor governance to be positively related to
executive compensation is that executives in firms with weak corporate governance structures
and insufficient monitoring can more effectively influence their compensation committees.
Core et al. (1999), for example, find CEO compensation to be higher when boards are large
and CEOs hold the position of chairman of the board. Yermack (1997) presents related
evidence of a correlation between CEO influence on the board and being assigned stock
options at favourable times. In line with Core et al. (1999), Cyert et al. (2002) show, both
theoretically and empirically, that top management compensation is higher when the CEO is

20
also chairman of the board, and Sapp (2008) reports a positive relation between measures for
weaker boards and level of CEO compensation.
According to Shleifer and Vishny (1986), the presence of a large shareholder occasions closer
monitoring of management’s performance. Bertrand and Mullainathan (2001) find CEO
compensation to be less dependent on managerial effort in firms that lack a large external
blockholder, and CEOs to be less likely to be rewarded for luck in better governed firms.
Hartzell and Starks (2003), examining the relation between ownership concentration and
executive compensation, find higher pay-performance sensitivities and lower executive
compensation with more concentrated institutional ownership, and Shivdasani (1993) finds
evidence of a positive relation between CEO compensation and number of directorships.
These papers, by and large, find executive compensation to be an important component of
corporate governance, and poor governance to be associated with comparatively high levels of
executive pay. We further investigate the hypothesis that overcommitted directors spend less
time and effort monitoring management by examining the relation between directors’
embeddedness in the network and level of executive compensation. As the dependent
variable, we compute for each firm and year the average per-capita executive compensation
(total compensation including options, etc.).16 As before, director busyness is measured by the
variables Degree, Connectiveness, Clustering Coefficient, and K-Core (aggregated at the firm
level).17 One of the stylized facts of compensation research is the positive relation between
firm size and executive pay. It is well documented in the empirical literature that large firms
pay executives more (see, for example, Murphy (1985) and Ryan and Wiggins (2001)). We
16 Until recently, German companies were not required to disclose executive remuneration on an individual basis. Disclosure of aggregate executive remuneration, however, has been mandated by the German Commercial Code. We combine the information on aggregate compensation with information on the number of executives to compute average per-capita remuneration for all sample firms. From 2007 onwards, publicly listed firms have been required by law to disclose executive compensation on an individual basis (if the shareholders’ meeting does not grant an exemption from the disclosure requirement). 17 As in the preceding regressions, using the median of the normalized network measures as a robustness test yields results quantitatively and qualitatively similar to those reported in the text.
21
therefore include firm size (logarithm of total assets) as a control variable. We include as
controls the board characteristics size (measured as the log of the number of executives) and
fraction of employee representatives. Among the explanatory variables, we include the
fraction of voting rights of the largest blockholder and its squared term. Although most firms’
executive compensation packages include some form of equity-based compensation, pay-
performance sensitivities are generally found to be low (e.g., Jensen and Murphy, 1990). We
nevertheless control for past operating performance (return on assets), leverage (book value of
total debt divided by book value of total assets, John and John (1993)), stock price
performance (the CDAX performance index is used to adjust stock returns over the past 12
months), and age of the firm (natural logarithm of years since incorporation). We include
dummy variables to control for year fixed effects.18
The results of fixed-effects panel regressions with executive compensation as the dependent
variable are presented in Tables 6.a and 6.b. In Table 6.a, we substitute our network measures
for the busy board variable, whereas the model specifications in Table 6.b contain the busy
dummy as an additional control.19 We find the hypothesized positive and significant relation
between the network measures and level of executive compensation. Although we find no
evidence of a relation between Clustering Coefficient and K-Core, the coefficients on Degree
and Connectiveness are all positive and significant (at the 0.10-level). This finding implies
that German firms in which members of the supervisory board are better connected in the
network of directors pay their executives more. Because the regressions also control for size
and performance, these results can be interpreted as supporting evidence for the hypothesis
that well-connected directors are associated with poor monitoring. The coefficients on busy
board are positive but insignificant in all model specifications, and we find, in line with the 18 As in the previous regressions, we compute variance inflation factors and cross-correlations. The test statistics (not reported) confirm that the coefficients obtained in our compensation regressions are not biased by multicollinearity. 19 We also run all regressions with executive compensation as the dependent variable using the three measures for busy boards derived from the number of directorships per director (not reported). The coefficients on these measures are negative but insignificant in all regressions.

22
literature, a significantly positive relation between firm size and executive compensation.
Remuneration seems to be positively influenced by stock price performance over the past 12
months.
[Insert Table 6 about here]
In the aggregate, the results of the regression analysis provide evidence of high levels of
director embeddedness being associated with low firm performance and high levels of
executive compensation. The results further suggest that the explanatory power of social
network measures exceeds that of simple measures of director busyness. We interpret our
findings as evidence of weaker governance and poorer monitoring in firms with directors
intensely connected in their social networks.
4.3 Robustness Tests
The findings presented above potentially suffer from the problem of endogeneity. Poorly
performing firms might seek to populate their boards with well-connected directors with
reputations for, and experience in, improving corporate performance. This reverse causality
would imply that performance is not worse due to better connected boards, but rather that
only poorly performing firms seek the advice of, and thereby boost their boards’ network
embeddedness through the appointment of, well-connected directors. We test the causality of
our results by estimating regression models of the relation between past performance and
changes in network embeddedness. Roughly following Yermack (1996), we take the total
annual change in the network measure (from t=-1 to t=0) as the dependent variable and
include as explanatory variables the abnormal stock price performance (raw stock price return
minus the return of the CDAX index) during the same year (t=-1 to t=0) and in the previous
year (t=-2 to t=-1). If poorly performing companies appointed well-connected directors,
performance either in the year of the board change or in the previous year (and, hence, the

23
coefficients of these two variables) should show some level of significance. We include as
additional control variables changes in Tobin’s q and firm size (log of total assets).
Table 7 reports the results of these OLS regressions. The models provide no evidence that
firms alter the centrality of their boards in response to poor performance. In other words, we
find no evidence of reverse causality, well-connected directors not seeming to be appointed in
response to bad performance. Adding lagged changes in Tobin’s q (i.e., from t=-2 to t=-1) as
additional control variables yields qualitatively similar results. There is weak evidence that
Degree tends to decrease in response to (positive) changes in firm size.
[Insert Table 7 about here]
As an additional robustness test, we identify the top and bottom deciles for 2003 abnormal
stock price returns and compute the average (and median) annual change in network measures
for these groups. As argued above, if the findings presented in section 4.2 are the result of
reverse causality, companies should appoint well-connected directors in the wake of poor
performance. Table 8 reports the average change in network centrality for the deciles with the
best and worst abnormal stock performance during 2003. This table displays the longest
possible interval (2003-2006). This is the most conservative measure, as board changes
usually take time, and a four-year time window theoretically allows for replacement of the
entire board (maximum tenure is five years). That all network measures except Clustering
Coefficient decrease for these groups over the 2003-2006 period is not surprising, given the
break up of so-called “Deutschland AG,” with its strong inter-firm connections (Dittmann et
al. 2010). However, changes in the network measures are almost indistinguishable (and
statistically insignificant) between the best and worst performers. Performing for other
periods similar calculations that relate the top and bottom performance deciles in terms of
abnormal stock price performance and changes in Tobin’s q to subsequent changes in board

24
embeddedness yields similar results.20 This can be regarded as supporting evidence of the
main finding that the negative relation between firm performance and board centrality is not
the result of reverse causality.
[Insert Table 8 about here]
5. Conclusion
In the wake of a number of corporate scandals, governance structures have recently become a
subject of public debate in many countries. Shareholder activists and organizations that
defend the interests of minority shareholders often criticize firms for appointing as directors
individuals who hold directorships in other firms, arguing that serving on too many boards
may impair directors’ effectiveness as monitors of management. Corporate governance policy
advocates have therefore called for the number of directorships a director can hold to be
limited.
The debate has also spurred empirical research on whether busy directors are associated with
poor governance. Empirical evidence thus far is scarce and limited to the United States. More
important, previous papers use as a measure of busyness only the number of directorships,
which metric fails to capture the quality and structural position of additional board seats. We
propose an alternative approach based on measures from the social network literature.
We examine a sample of 133 German firms over four years, which yields a network of
approximately 1,600 directors and 35,000 connections. We use this data, aggregated at the
firm level, to investigate the relation between firm governance and directors’ embeddedness
in the network. Our results show boards populated by well-connected (in terms of Degree and
Connectedness) directors to be associated with lower performance (as measured by Tobin’s q)
20 Tables for these computations, which are not reported as the results are qualitatively similar to those reported in Table 8, are available upon request.

25
and higher executive compensation. We interpret these findings as evidence of poor
monitoring in firms with well-connected directors.
We by no means claim to have found the “perfect” measure of director busyness. Supervisors
with weak or no connections to the corporate elite may be busier than other directors owing to
such activities as hobbies and volunteerism. Nevertheless, our results are evidence of an
important contribution of network measures to the complex and difficult to assess issue of
busyness by helping to explain dimensions beyond simply the number of board appointments.
These findings have direct policy implications. They suggest, for example, that calls to
impose limits on multiple directorships that do not take into account the quality of the
attendant obligations are ill advised. Our results also imply that it might not be optimal for
shareholders to select directors solely on the basis of reputation, as the most reputable
directors will likely already be serving on multiple boards and therefore have to balance the
interests of many parties. Having a preponderance of intensely connected directors, if it
translates into an overcommitted board, may be counterproductive.
26
References:
Adams, R. and D. Ferreira (2007), ‘A Theory of Friendly Boards’, Journal of Finance, Vol.
62, No. 1 (February), pp. 217-50.
Adler, P. S. and S. Kwon (2000), ‘Social Capital: The Good, the Bad, and the Ugly’, in
Lesser, E. (ed.), Knowledge and Social Capital: Foundations and Applications (Boston:
Butterworth-Heineman), pp. 89-115.
Andres, C. (2008), ‘Large Shareholders and Firm Performance – An Empirical Examination
of Founding-Family Ownership’, Journal of Corporate Finance, Vol. 14, No. 4 (September),
pp. 431-45.
Barnea, A. and I. Guedj (2009), ‘Director Networks’, working paper. Available at SSRN:
http://papers.ssrn.com/sol3/papers.cfm?abstract_id=966555.
Bertrand, M. and S. Mullainathan (2001), ‘Are CEOs Rewarded for Luck? The Ones Without
Principals Are’, Quarterly Journal of Economics, Vol. 116, No. 3 (August) pp. 901-32.
Bonacich, P. (1972), ‘Factoring and Weighting Approaches to Status Scores and Clique
Identification’, Journal of Mathematical Sociology, Vol. 2, No. 1, pp. 113-20.
——— (1987), ‘Power and Centrality: A Family of Measures’, American Journal of
Sociology, Vol. 92, No. 5 (March), pp. 1170-82.
Brown, W. O. and M. T. Maloney (1999), ‘Exit, voice, and the role of corporate directors:
Evidence from acquisition performance’, Working Paper, Claremont McKenna College.
CASOS (2008) Organizational Risk Analyzer v1.9.0, Carnegie Mellon University, School of
Computer Science, http://www.casos.cs.cmu.edu/projects/ora/.
Cialdini, R. B. and M. R. Trost (1998), ‘Social Influence: Social Norms, Conformity and
Compliance’, in D. T. Gilbert, S. T. Fiske and G. Lindzey (eds.), The Handbook of Social
Psychology, Vol. 2 (Boston, MA: McGraw-Hill), pp. 151-92.
Cohen, L. H., C. J. Malloy and A. Frazzini (2010), ‘Sell-Side School Ties’, Journal of
Finance, Vol. 65, No. 4 (August), pp. 1409–37.

27
Coleman, J. S. (1988), ‘Social Capital in the Creation of Human Capital’, The American
Journal of Sociology, Vol. 94, No. 1 (January), Supplement: Organizations and Institutions:
Sociological and Economic Approaches to the Analysis of Social Structure, pp. 95-120.
Core J., R. Holthausen and D. Larcker (1999), ‘Corporate Governance, Chief Executive
Officer Compensation, and Firm Performance’, Journal of Financial Economics, Vol. 51, No.
3 (March), pp. 371-406.
Cyert, R. M., S. H. Kang and P. Kumar (2002), ‘Corporate Governance, Takeovers, and Top-
Management Compensation: Theory and Evidence’, Management Science, Vol. 48, No. 4
(April), pp. 453-69.
Dittmann, I., E. Maug and C. Schneider (2010), ‘Bankers on the Boards of German Firms:
What They Do, What They Are Worth, and Why They Are (Still) There’, Review of Finance,
Vol. 14, No. 1 (May), pp. 35-71.
Eppler, M. J. and J. Mengis (2004), ‘The Concept of Information Overload: A Review of
Literature from Organization Science, Accounting, Marketing, MIS, and Related Disciplines’,
The Information Society: An International Journal, Vol. 20, No. 5 (November), pp. 325-44.
Ferriani, S., G. Cattani and C. Baden-Fuller (2009), ‘The Relational Antecedents of Project-
Entrepreneurship: Network Centrality, Team Composition and Project Performance’,
Research Policy, Vol. 38, No. 10 (December), pp. 1545–58.
Ferris, S. P., M. Jagannathan and A. C. Pritchard (2003), ‘Too Busy to Mind the Business?
Monitoring by Directors with Multiple Board Appointments’, Journal of Finance, Vol. 58,
No. 3 (June), pp. 1087-1111.
Fich, E. M. and A. Shivdasani (2006), ‘Are Busy Boards Effective Monitors?’, Journal of
Finance, Vol. 61, No. 2 (April), pp. 689-724.
Flynn, F. J., R. E. Reagans, E. T. Amanattulah and D. R. Ames (2006), ‘Helping One’s Way
to the Top: Self-Monitors Achieve Status by Helping Others and Knowing Who Helps
Whom’, Journal of Personality and Social Psychology, Vol. 91, No. 6 (December), pp. 1123-
37.
Franks, J. and C. Mayer (2001), ‘Ownership and Control of German Corporations’, Review of
Financial Studies, Vol. 14, No. 4 (October), pp. 943-77.

28
Gorton, G., and F. A. Schmid (2004), ‘Capital, Labor, and the Firm: A Study of German
Codetermination’, Journal of the European Economic Association, Vol. 2, No. 5 (September),
pp. 863-904.
Gouldner, A. W. (1960), ‘The Norm of Reciprocity: A Preliminary Statement’, American
Sociological Review, Vol. 25, No. 2 (April), pp. 161-78.
Granovetter, M. (1985), ‘Economic Action and Social Structure: The Problem of Embedded-
ness’, American Journal of Sociology, Vol. 91, No. 3 (November), pp. 481- 510.
——— (1992), ‘Problems of Explanation in Economic Sociology’, in N. Nohria and R. G.
Eccles (eds.), Networks and Organizations: Structure, Form, and Action (Boston, MA:
Harvard Business School Press), pp. 25-56.
Hansen, M. T., J. M. Podolny and J. Pfeffer (2001), ‘So Many Ties, So Little Time: A Task
Contingency Perspective on Corporate Social Capital in Organizations’, in S. M. Gabbay and
R. T. A. J. Leenders (eds.), Social Capital of Organizations: Research in the Sociology of
Organizations, Vol. 18 (Amsterdam: Emerald Group Publishing Limited), pp. 21-57.
Hartzell, J. C. and L. T. Starks (2003), ‘Institutional Investors and Executive Compensation’,
Journal of Finance, Vol. 58, No. 6 (December), pp. 2351-74.
Horton, J., Y. Millo and G. Serafeim (2012), ‘Resources or Power? Implications of Social
Networks on Compensation and Firm Performance’, Journal of Business Finance and
Accounting, Vol. 39, Nos. 3&4 (April/May), pp. 399–426.
Huisman, M. and M. A. J. van Duijn (2005), ‘Software for Social Network Analysis’, in P. J.
Carrington, J. Scott and S. Wasserman (eds.), Models and Methods in Social Network
Analysis (New York, NY: Cambridge University Press), pp. 270-316.
Hwang, B.-H. and S. Kim (2009), ‘It Pays to Have Friends’, Journal of Financial Economics,
Vol. 93, No. 1 (July), pp. 138-58.
Jensen, M. C. and K. J. Murphy (1990), ‘Performance Pay and Top-Management Incentives’,
Journal of Political Economy, Vol. 98, No. 2 (April), pp. 225-64.
John, T. A. and K. John (1993), ‘Top-Management Compensation and Capital Structure’,
Journal of Finance, Vol. 48, No. 3 (July), pp. 949-74.
Kahneman, D. (1973), Attention and Effort (Englewood Cliffs, NJ: Prentice-Hall).
29
Lee, F. (1997), ‘When the Going Gets Tough, Do the Tough Ask for Help? Help Seeking and
Power Motivation in Organizations’, Organizational Behavior and Human Decision
Processes, Vol. 72, No. 3 (December), pp. 336–63.
Mace, M. L. (1986), Directors: Myth and Reality, 2nd edition (Boston, MA: Harvard Business
School Press).
Murphy, K. J. (1985), ‘Corporate Performance and Managerial Remuneration – An Empirical
Analysis’, Journal of Accounting and Economics, Vol. 7, Nos. 1-3 (April), pp. 11-42.
Oldroyd, J. and S. Morris (2012), ‘Catching Falling Stars: A Human Resource Response to
Social Capital’s Detrimental Effect of Information Overload for Star Employees’, Academy
of Management Review, Vol. 37, No. 3 (July), pp. 396-418.
Perry, T. and U. Peyer (2005), ‘Board Seat Accumulation by Executives: A Shareholder’s
Perspective’, Journal of Finance, Vol. 60, No. 4 (August), pp. 2083-2123.
Raub, W. and J. Weesie (1990), ‘Reputation and Efficiency in Social Interactions: An
Example of Network Effects’, American Journal of Sociology, Vol. 96, No. 3 (November),
pp. 626-54.
Ryan, H. E. and R. A. Wiggins (2001), ‘The Influence of Firm- and Manager-Specific
Characteristics on the Structure of Executive Compensation’, Journal of Corporate Finance,
Vol. 7, No. 2 (June), pp. 101-23.
Sapp, S. G. (2008), ‘The Impact of Corporate Governance on Executive Compensation’,
European Financial Management, Vol. 14, No. 4 (September), pp. 710-46.
Schneider, S. C. (1987), ‘Information Overload: Causes and Consequences’, Human Systems
Management, Vol. 7, No. 2 (January), pp. 143-53.
Scott, J. P. (2000), Social Network Analysis – A Handbook, 2nd edition (London: Sage
Publications).
Seidman, S. B. (1983), ‘Network Structure and Minimum Degree’, Social Networks, Vol. 5,
No. 3 (September), pp. 269–87.
Shleifer, A. and R. Vishny (1986), ‘Large Shareholders and Corporate Control’, Journal of
Political Economy, Vol. 94, No. 3 (June), pp. 461-88.

30
Shivdasani, A. (1993), ‘Board Composition, Ownership Structure and Hostile Takeovers’,
Journal of Accounting and Economics, Vol. 16, Nos. 1-3 (January-July), pp. 167-98.
——— and D. Yermack (1999), ‘CEO Involvement in the Selection of New Board Members:
An Empirical Analysis’, Journal of Finance, Vol. 54, No. 5 (October), pp. 1829-53.
Sparrow, P. R. (1999), ‘Strategy and Cognition: Understanding the Role of Management
Knowledge Structures, Organizational Memory and Information Overload’, Creativity and
Innovation Management, Vol. 8, No. 2 (June), pp. 140-49.
Useem, M. (1984), ‘The Inner Circle: Large Corporations and the Rise of Business Political
Activity’ (New York, Oxford: Oxford University Press).
Wade, J. B., C. A. O’Reilly and I. Chandratat (1990), ‘Golden Parachutes: CEOs and the
Exercise of Social Influence’, Administrative Science Quarterly, Vol. 35, No. 4 (December),
pp. 587-603.
Watts, D.J. and S. H. Strogatz (1988), ‘Collective Dynamics of “Small-World” Networks’,
Nature, Vol. 393, No. 6684 (June), pp. 440-42.
Yermack, D. (1996), ‘Higher Market Valuations of Companies with a Small Board of
Directors’, Journal of Financial Economics, Vol. 40, No. 2 (February), pp. 185-221.
——— (1997), ‘Good Timing: CEO Stock Option Awards and Company News
Announcements’, Journal of Finance, Vol. 52, No. 2 (June), pp. 449-76.

31
Figure 1. Network of all directors
This graphic shows connections between all directors of 133 German firms for the year 2003. The total number of directors is 1,654, the number of connections 35,106.

32
Figure 2. Average marginal effect (AME) of ‘Clustering coefficient’ on Tobin’s q with 95%
confidence intervals (CIs)
-6-4
-20
2
Effe
cts
on L
inea
r Pre
dict
ion
.5 1 1.5 2 2.5Degree
AMEs of 'Clustering coefficient' with 95% CIs

33
Table 1. Data Description
This table presents descriptive statistics for 532 annual observations of 133 German firms for the period 2003-2006. Leverage is defined as book value of total debt divided by book value of total assets. Tobin’s q is calculated as market value of equity at the end of the year plus book value of debt divided by book value of assets at the end of the year. Executive remuneration is the average per-capita executive remuneration per year. Panel B provides data on 1,654 directors.
Panel A Variable Mean Median SD
Market value of equity (Mio. €) 5,382 759 11,490 Book value of assets (Mio. €) 35,602 1,317 25,167 Leverage 0.66 0.68 0.18 Tobin’s q 1.48 1.16 1.03 Age (years since incorporation) 79.54 78.50 56.05 Listing age (in years) 29.74 13.00 36.76 Return on assets 3.82 % 3.07 % 7.04 % Executive remuneration (1,000 €) 1,100.4 820.8 970.0 Without options (1,000 €) 1,009.4 765.5 817.0
Panel B
Variable Mean Median SD Board size 13.58 13 6.06 Ordinary board members 7.78 7 2.51 Employee representatives 5.80 6 4.71 Number of directorships 3.49 3.17 1.70 Including employee representatives 2.72 2.40 1.29 Percentage of busy directors 52.44 Including employee representatives 33.07 Percentage of busy boards 46.78 Including employee representatives 19.36

34
Table 2. Most Central Directors
This table lists the ten most central directors in the network of German firms subdivided into the Degree (C’D) and Connectiveness (C’C) centrality measures for the period 2003-2006.
Panel A: Top 10 Degree and Connectiveness for 2003 in Percent No. Name C’D Name C’C 1 Schneider, Manfred 9.56 Cromme, Gerhard 26.32 2 Kohlhaussen, M 9.01 Schulte-Noelle, H. 23.89 3 Cromme, Gerhard 8.83 Baumann, Karl-H. 23.34 4 Baumann, Karl-H. 8.59 Schneider, Manfred 21.78 5 Hartmann, Ulich 8.29 Voss, Bernd W. 21.52 6 Schulte-Noelle, H. 7.99 Hartmann, Ulrich 21.05 7 Voss, Bernd W. 7.74 Breuer, Rolf-E. 20.19 8 Walter, Bernhard 7.74 Kohlhaussen, Martin 20.16 9 Breuer, Rolf E. 7.68 Diekmann, Michael 17.09
10 Schinzler, Hans-J. 7.56 Strube, Jürgen 16.82
Panel B: Top 10 Degree and Connectiveness for 2004 in Percent No. Name C’D Name C’C 1 Cromme, Gerhard 8.91 Cromme, Gerhard 28.11 2 Schneider, Manfred 8.85 Schneider, Manfred 23.42 3 Hartmann, Ulrich 8.52 Hartmann, Ulrich 22.79 4 Walter, Bernhard 8.00 Kuhnt, Dietmar 21.47 5 Kuhnt, Dietmar 7.60 Baumann, Karl-H. 20.93 6 Baumann, Karl-H. 7.21 Kohlhaussen, Martin 20.10 7 Kohlhaussen, Martin 7.21 Schulte-Noelle, H. 19.37 8 Strube, Jürgen 6.49 Pierer, Heinrich von 19.18 9 Reich, Hans W. 6.42 Neuber, Friedel 19.04
10 Kley, Max Dietrich 6.36 Walter, Bernhard 18.23
Panel C: Top 10 Degree and Connectiveness for 2005 in Percent No. Name C’D Name C’C 1 Schneider, Manfred 8.98 Cromme, Gerhard 26.56 2 Cromme, Gerhard 8.40 Pierer, Heinrich von 25.69 3 Pierer, Heinrich von 8.27 Schneider, Manfred 23.30 4 Hartmann, Ulrich 8.08 Hartmann, Ulrich 21.97 5 Walter, Bernhard 7.95 Kohlhaussen, Martin 20.78 6 Kohlhaussen, M. 7.18 Schulz, Ekkehard D. 19.78 7 Schulz, Ekkehard D. 6.93 Schulte-Noelle, H. 18.48 8 Reich, Hans W. 6.35 Baumann, Karl-H. 17.63 9 Kuhnt, Dietmar 6.16 Walter, Bernhard 17.43
10 Kley, Max Dietrich 6.09 Weber, Jürgen 17.19
Panel D: Top 10 Degree and Connectiveness for 2006 in Percent No. Name C’D Name C’C 1 Schneider, Manfred 9.31 Cromme, Gerhard 26.27 2 Cromme, Gerhard 8.67 Schneider, Manfred 25.14 3 Hartmann, Ulrich 8.41 Schulz, Ekkehard D. 23.36 4 Schulz, Ekkehard D. 8.29 Hartmann, Ulrich 22.86 5 Pierer, Heinrich von 7.00 Kuhnt, Dietmar 20.03 6 Kuhnt, Dietmar 6.74 Weber, Jürgen 19.30 7 Kohlhaussen, Martin 6.62 Pierer, Heinrich von 18.67 8 Reich, Hans W. 6.42 Kohlhaussen, Martin 18.58 9 Grünberg, Hubertus 6.23 Schulte-Noelle, H. 16.52
10 Strube, Jürgen 5.97 Grünberg, Hubertus 15.97
35
Table 3. Normalized Firm Centrality in Percent
This table presents descriptive statistics for the network centrality measures Degree, Connectivenes, Clustering Coefficient, and K-Core for a balanced sample of 133 German market listed firms for the period 2003-2006.The total number of firm-year observations is 532. All figures are normalized and aggregated at the firm level.
Variable Mean Median Lowest decile Highest decile SD Average Degree 1.259 1.034 0.321 2.647 0.876 Average Connectiveness 1.947 0.473 3.74 x 10⁻²⁸ 6.851 2.911 Average Clustering Coefficient 84.533 86.059 67.556 100 11.340 Average K-Core 44.353 42.183 16.129 74.866 22.96 Avg. Degree (w/o empl.) 1.630 1.237 0.388 3.572 1.222 Avg. Connectiveness (w/o empl.) 3.235 0.927 0 11.178 4.570 Average Clustering Coefficient(w/o empl.)
73.872 76.508 46.883 100 19.261
Average K-Core(w/o empl.) 37.280 33.766 14.773 62.338 18.157
36
Table 4. Multiple Directorships and Firm Performance This table presents the results of fixed-effects regressions of market-to-book value on several firm characteristics for a sample of 133 German firms for the period 2003-2006. Busy board is an indicator variable set to one if 50% (or more) of a firm’s directors hold three (or more) directorships. Percentage of busy directors is the percentage of directors (per firm) who hold three or more directorships. In specifications (1)-(3), these variables are computed based on shareholder representatives only; the board variables in models (4)-(6) are based on all directors (including employee representatives). Codetermination is defined as the number of employee representatives divided by the number of supervisory board members. Leverage is defined as book value of total debt divided by book value of total assets. Large shareholders are shareholders who hold more than 5% of the voting equity. Return volatility is measured as the standard deviation of share price returns for the previous 36 months. Firm age is the natural logarithm of years since incorporation. All regressions include year dummies. T-statistics (in parentheses) are based on White-Heteroskedasticity consistent standard errors clustered at the firm level. Asterisks denote statistical significance at the 0.01(***), 0.05(**), and 0.10(*)-level. Excluding employee
representatives All directors
Variable (1) (2) (3) (4) (5) (6) Busy board
-0.045 (-0.60)
-0.072 (-0.75)
Percentage of busy directors
-0.005 (-0.02)
-0.012 (-0.04)
Average number of directorships
0.043 (1.05)
0.054 (0.89)
Firm size (log of total assets)
-0.288 (-1.12)
-0.232 (-1.24)
-0.225 (-1.12)
-0.230 (-1.14)
-0.232 (-1.14)
-0.226 (-1.12)
Board size (log of # of directors)
0.037 (0.25)
0.053 (0.37)
0.080 (0.57)
0.057 (0.42)
0.053 (0.38)
0.073 (0.52)
Codetermination 0.852 (1.74) *
0.822 (1.59)
0.798 (1.65)
0.813 (1.67) *
0.822 (1.64)
0.855 (1.63)
Leverage
-0.008 (-0.01)
-0.009 (-0.02)
-0.029 (-0.05)
-0.036 (-0.06)
-0.009 (-0.02)
-0.026 (-0.05)
Largest blockholder
0.005 (0.82)
0.005 (0.82)
0.004 (0.69)
0.005 (0.78)
0.005 (0.81)
0.004 (0.69)
Largest blockholder2 -0.000 (-0.59)
-0.000 (-0.58)
-0.000 (-0.48)
-0.000 (-0.54)
-0.000 (-0.57)
-0.000 (-0.49)
Board meetings
0.025 (1.33)
0.025 (1.33)
0.030 (1.44)
0.026 (1.36)
0.025 (1.32)
0.029 (1.41)
Return volatility 0.000 (1.51)
0.000 (1.48)
0.000 (1.52)
0.000 (1.48)
0.000 (1.48)
0.000 (1.50)
Firm age
0.601 (1.43)
0.612 (1.46)
0.614 (1.46)
0.609 (1.46)
0.613 (1.64)
0.611 (1.46)
R-squared
0.142 0.142 0.147 0.142 0.141 0.146
F-statistic (p-value)
4.35 (0.00)
3.92 (0.00)
3.65 (0.00)
3.36 (0.00)
3.79 (0.00)
3.41 (0.00)

37
Table 5.a Director Networks and Firm Performance
This table presents the results of fixed-effects regressions of market-to-book value on several firm characteristics for a sample of 133 German firms for the period 2003-2006. Degree, Connectiveness, Clustering Coefficient, and K-Core are measures of the embeddedness of a firm’s directors in the social network. Busy board is an indicator variable set to one if 50% (or more) of a firm’s directors hold three (or more) directorships. Codetermination is defined as the number of employee representatives divided by the number of supervisory board members. Leverage is defined as book value of total debt divided by book value of total assets. Large shareholders are shareholders who hold more than 5% of the voting equity. Return volatility is measured as the standard deviation of share price returns for the previous 36 months. Firm age is the natural logarithm of years since incorporation. All regressions include year dummies. T-statistics (in parentheses) are based on White-Heteroskedasticity consistent standard errors clustered at the firm level. Asterisks denote statistical significance at the 0.01(***), 0.05(**), and 0.10(*)-level.
Variable
(1) (2) (3) (4)
Degree
-0.449 (-2.21)**
-0.704 (-2.57)**
Connectiveness
-0.073 (-2.07)**
Clustering coefficient -0.771 (-1.28)
Clustering coefficient *Degree
-1.535 (-2.74)***
K-core
-1.076 (-2.05)**
Firm size (log of total assets)
-0.232 (-1.17)
-0.222 (-1.10)
-0.261 (-1.33)
-0.250 (-1.25)
Board size (log of # of directors)
0.367 (1.69)*
0.125 (0.84)
0.602 (2.06)**
0.430 (1.61)
Codetermination 0.721 (1.83)*
0.768 (1.93)*
0.529 (1.26)
0.640 (1.27)
Leverage
-0.124 (-0.22)
-0.101 (-0.18)
-0.116 (-0.21)
-0.033 (-0.06)
Largest blockholder
0.006 (0.96)
0.005 (0.84)
0.007 (1.06)
0.006 (0.97)
Largest blockholder2 -0.000 (-0.78)
-0.000 (-0.66)
-0.000 (-0.88)
-0.000 (-0.72)
Board meetings
0.027 (1.42)
0.025 (1.32)
0.030 (1.55)
0.027 (1.40)
Return volatility 0.000 (1.53)
0.000 (1.36)
0.000 (1.67)*
0.000 (1.54)
Firm age
0.743 (1.77)*
0.646 (1.54)
0.763 (1.86)*
0.677 (1.66)*
R-squared
0.160 0.151 0.178 0.148
F-statistic (p-value)
4.44 (0.00)
4.28 (0.00)
3.89 (0.00)
3.47 (0.00)

38
Table 5.b Director Networks and Firm Performance
This table presents the results of fixed-effects regressions of market-to-book value on several firm characteristics for a sample of 133 German firms for the period 2003-2006. Degree, Connectiveness, Clustering Coefficient, and K-Core are measures of the embeddedness of a firm’s directors in the social network. Busy board is an indicator variable set to one if 50% (or more) of a firm’s directors hold three (or more) directorships. Codetermination is defined as the number of employee representatives divided by the number of supervisory board members. Leverage is defined as book value of total debt divided by book value of total assets. Large shareholders are shareholders who hold more than 5% of the voting equity. Return volatility is measured as the standard deviation of share price returns for the previous 36 months. Firm age is the natural logarithm of years since incorporation. All regressions include year dummies. T-statistics (in parentheses) are based on White-Heteroskedasticity consistent standard errors clustered at the firm level. Asterisks denote statistical significance at the 0.01(***), 0.05(**), and 0.10(*)-level.
Variable
(1) (2) (3) (4)
Degree
-0.444 (-2.27)**
-0.686 (-2.66)***
Connectiveness
-0.073 (-2.10)**
Clustering coefficient -0.679 (-1.16)
Clustering coefficient *Degree
-1.542 (-2.77***)
K-core
-1.078 (-2.05)**
Busy board 0.062 (0.73)
0.070 (0.76)
0.072 (0.90)
0.073 (0.78)
Firm size (log of total assets)
-0.230 (-1.17)
-0.220 (-1.10)
-0.258 (-1.32)
-0.247 (-1.25)
Board size (log of # of directors)
0.367 (1.70)*
0.128 (0.86)
0.588 (2.08)**
0.434 (1.62)
Codetermination 0.717 (1.82)*
0.763 (1.92)*
0.529 (1.27)
0.633 (1.26)
Leverage
-0.145 (-0.26)
-0.125 (-0.22)
-0.137 (-0.25)
-0.058 (-0.11)
Largest blockholder
0.006 (0.95)
0.005 (0.82)
0.007 (1.05)
0.006 (0.96)
Largest blockholder2 -0.000 (-0.77)
-0.000 (-0.65)
-0.000 (-0.86)
-0.000 (-0.71)
Board meetings
0.028 (1.45)
0.026 (1.35)
0.031 (1.59)
0.028 (1.43)
Return volatility 0.000 (1.52)
0.000 (1.35)
0.000 (1.66)*
0.000 (1.53)
Firm age
0.739 (1.76)*
0.642 (1.53)
0.756 (1.84)*
0.674 (1.65)
R-squared
0.161 0.152 0.179
0.149
F-statistic (p-value)
4.15 (0.00)
3.99 (0.00)
3.68 (0.00)
3.28 (0.00)
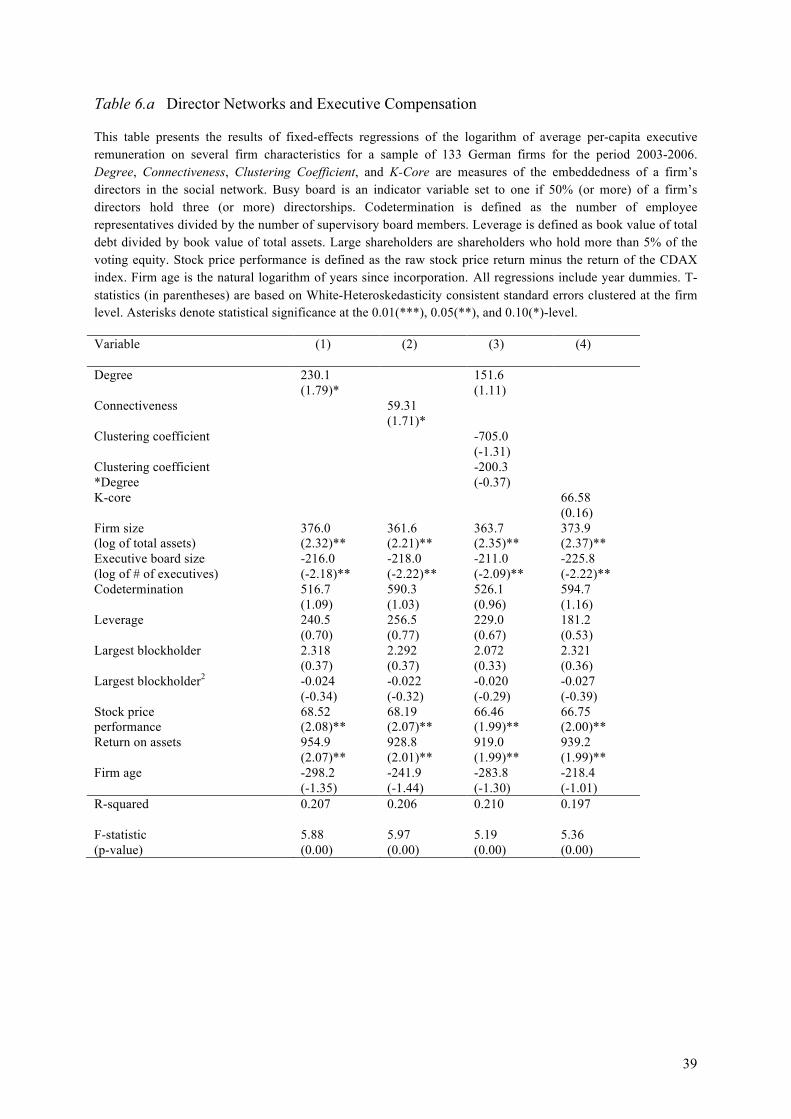
39
Table 6.a Director Networks and Executive Compensation
This table presents the results of fixed-effects regressions of the logarithm of average per-capita executive remuneration on several firm characteristics for a sample of 133 German firms for the period 2003-2006. Degree, Connectiveness, Clustering Coefficient, and K-Core are measures of the embeddedness of a firm’s directors in the social network. Busy board is an indicator variable set to one if 50% (or more) of a firm’s directors hold three (or more) directorships. Codetermination is defined as the number of employee representatives divided by the number of supervisory board members. Leverage is defined as book value of total debt divided by book value of total assets. Large shareholders are shareholders who hold more than 5% of the voting equity. Stock price performance is defined as the raw stock price return minus the return of the CDAX index. Firm age is the natural logarithm of years since incorporation. All regressions include year dummies. T-statistics (in parentheses) are based on White-Heteroskedasticity consistent standard errors clustered at the firm level. Asterisks denote statistical significance at the 0.01(***), 0.05(**), and 0.10(*)-level.
Variable
(1) (2) (3) (4)
Degree
230.1 (1.79)*
151.6 (1.11)
Connectiveness
59.31 (1.71)*
Clustering coefficient -705.0 (-1.31)
Clustering coefficient *Degree
-200.3 (-0.37)
K-core
66.58 (0.16)
Firm size (log of total assets)
376.0 (2.32)**
361.6 (2.21)**
363.7 (2.35)**
373.9 (2.37)**
Executive board size (log of # of executives)
-216.0 (-2.18)**
-218.0 (-2.22)**
-211.0 (-2.09)**
-225.8 (-2.22)**
Codetermination 516.7 (1.09)
590.3 (1.03)
526.1 (0.96)
594.7 (1.16)
Leverage 240.5 (0.70)
256.5 (0.77)
229.0 (0.67)
181.2 (0.53)
Largest blockholder
2.318 (0.37)
2.292 (0.37)
2.072 (0.33)
2.321 (0.36)
Largest blockholder2 -0.024 (-0.34)
-0.022 (-0.32)
-0.020 (-0.29)
-0.027 (-0.39)
Stock price performance
68.52 (2.08)**
68.19 (2.07)**
66.46 (1.99)**
66.75 (2.00)**
Return on assets
954.9 (2.07)**
928.8 (2.01)**
919.0 (1.99)**
939.2 (1.99)**
Firm age -298.2 (-1.35)
-241.9 (-1.44)
-283.8 (-1.30)
-218.4 (-1.01)
R-squared
0.207 0.206 0.210 0.197
F-statistic (p-value)
5.88 (0.00)
5.97 (0.00)
5.19 (0.00)
5.36 (0.00)
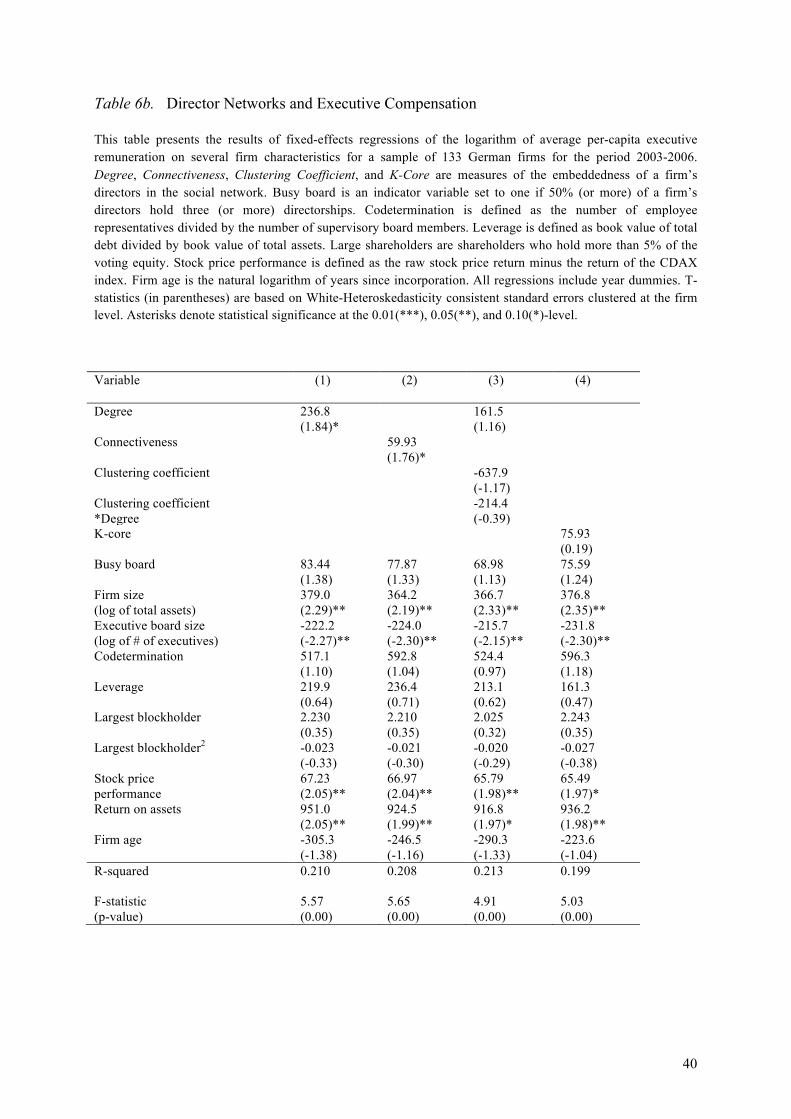
40
Table 6b. Director Networks and Executive Compensation
This table presents the results of fixed-effects regressions of the logarithm of average per-capita executive remuneration on several firm characteristics for a sample of 133 German firms for the period 2003-2006. Degree, Connectiveness, Clustering Coefficient, and K-Core are measures of the embeddedness of a firm’s directors in the social network. Busy board is an indicator variable set to one if 50% (or more) of a firm’s directors hold three (or more) directorships. Codetermination is defined as the number of employee representatives divided by the number of supervisory board members. Leverage is defined as book value of total debt divided by book value of total assets. Large shareholders are shareholders who hold more than 5% of the voting equity. Stock price performance is defined as the raw stock price return minus the return of the CDAX index. Firm age is the natural logarithm of years since incorporation. All regressions include year dummies. T-statistics (in parentheses) are based on White-Heteroskedasticity consistent standard errors clustered at the firm level. Asterisks denote statistical significance at the 0.01(***), 0.05(**), and 0.10(*)-level.
Variable
(1) (2) (3) (4)
Degree
236.8 (1.84)*
161.5 (1.16)
Connectiveness
59.93 (1.76)*
Clustering coefficient -637.9 (-1.17)
Clustering coefficient *Degree
-214.4 (-0.39)
K-core
75.93 (0.19)
Busy board
83.44 (1.38)
77.87 (1.33)
68.98 (1.13)
75.59 (1.24)
Firm size (log of total assets)
379.0 (2.29)**
364.2 (2.19)**
366.7 (2.33)**
376.8 (2.35)**
Executive board size (log of # of executives)
-222.2 (-2.27)**
-224.0 (-2.30)**
-215.7 (-2.15)**
-231.8 (-2.30)**
Codetermination 517.1 (1.10)
592.8 (1.04)
524.4 (0.97)
596.3 (1.18)
Leverage 219.9 (0.64)
236.4 (0.71)
213.1 (0.62)
161.3 (0.47)
Largest blockholder
2.230 (0.35)
2.210 (0.35)
2.025 (0.32)
2.243 (0.35)
Largest blockholder2 -0.023 (-0.33)
-0.021 (-0.30)
-0.020 (-0.29)
-0.027 (-0.38)
Stock price performance
67.23 (2.05)**
66.97 (2.04)**
65.79 (1.98)**
65.49 (1.97)*
Return on assets
951.0 (2.05)**
924.5 (1.99)**
916.8 (1.97)*
936.2 (1.98)**
Firm age -305.3 (-1.38)
-246.5 (-1.16)
-290.3 (-1.33)
-223.6 (-1.04)
R-squared
0.210 0.208 0.213 0.199
F-statistic (p-value)
5.57 (0.00)
5.65 (0.00)
4.91 (0.00)
5.03 (0.00)
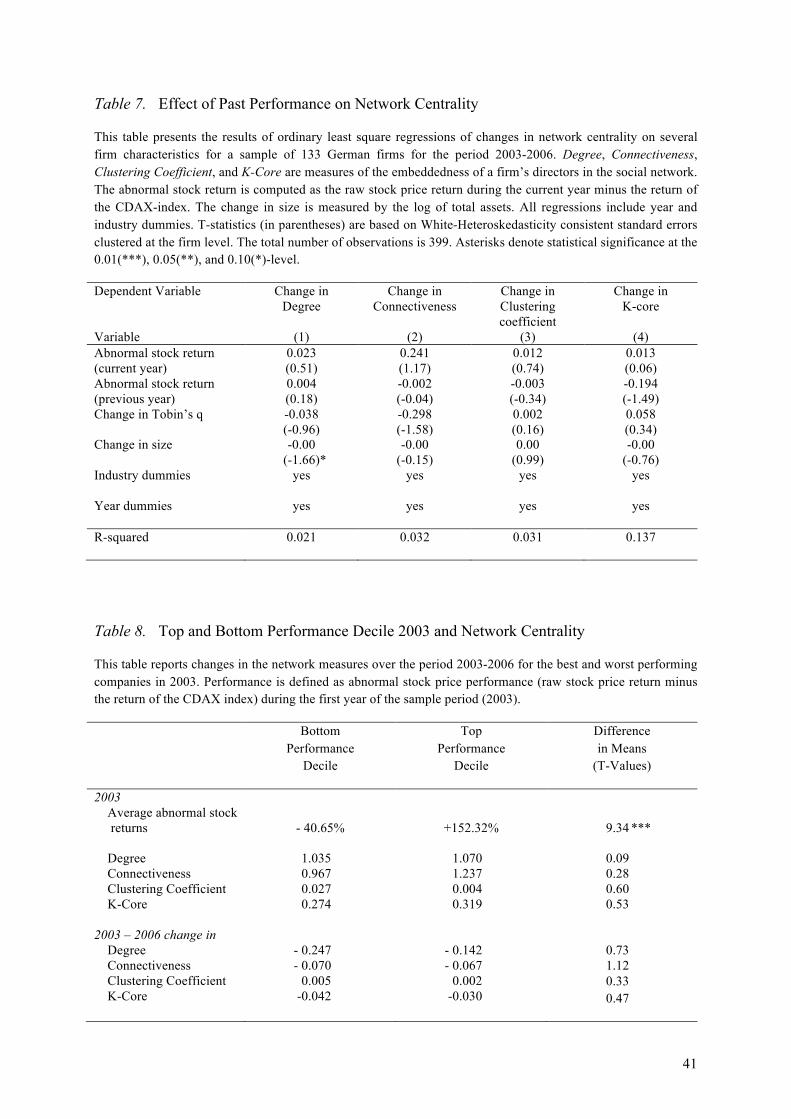
41
Table 7. Effect of Past Performance on Network Centrality
This table presents the results of ordinary least square regressions of changes in network centrality on several firm characteristics for a sample of 133 German firms for the period 2003-2006. Degree, Connectiveness, Clustering Coefficient, and K-Core are measures of the embeddedness of a firm’s directors in the social network. The abnormal stock return is computed as the raw stock price return during the current year minus the return of the CDAX-index. The change in size is measured by the log of total assets. All regressions include year and industry dummies. T-statistics (in parentheses) are based on White-Heteroskedasticity consistent standard errors clustered at the firm level. The total number of observations is 399. Asterisks denote statistical significance at the 0.01(***), 0.05(**), and 0.10(*)-level.
Dependent Variable Variable
Change in Degree
(1)
Change in Connectiveness
(2)
Change in Clustering coefficient
(3)
Change in K-core
(4)
Abnormal stock return (current year)
0.023 (0.51)
0.241 (1.17)
0.012 (0.74)
0.013 (0.06)
Abnormal stock return (previous year)
0.004 (0.18)
-0.002 (-0.04)
-0.003 (-0.34)
-0.194 (-1.49)
Change in Tobin’s q
-0.038 (-0.96)
-0.298 (-1.58)
0.002 (0.16)
0.058 (0.34)
Change in size -0.00 (-1.66)*
-0.00 (-0.15)
0.00 (0.99)
-0.00 (-0.76)
Industry dummies yes yes yes yes
Year dummies yes yes yes yes
R-squared 0.021 0.032 0.031 0.137
Table 8. Top and Bottom Performance Decile 2003 and Network Centrality
This table reports changes in the network measures over the period 2003-2006 for the best and worst performing companies in 2003. Performance is defined as abnormal stock price performance (raw stock price return minus the return of the CDAX index) during the first year of the sample period (2003).
Bottom Performance
Decile
Top Performance
Decile
Difference in Means
(T-Values)
2003 Average abnormal stock returns
- 40.65%
+152.32%
9.34 ***
Degree Connectiveness
1.035 0.967
1.070 1.237
0.09 0.28
Clustering Coefficient K-Core
0.027 0.274
0.004 0.319
0.60 0.53
2003 – 2006 change in Degree Connectiveness
- 0.247 - 0.070
- 0.142 - 0.067
0.73 1.12
Clustering Coefficient K-Core
0.005 -0.042
0.002 -0.030
0.33 0.47
Copyright © 2022 FDOKUMEN