Is a Specific Grant Really ”Specific”?: Case of Indonesian Provinces, 2003 – 2010
25
Working Paper in Economics and Development Studies Department of Economics Padjadjaran University Is a Specific Grant Really ”Specific”?: Case of Indonesian Provinces, 2003 – 2010 Kodrat Wibowo, Ph.D, Astia Dendi, Ph.D, and No. 201109 Center for Economics and Development Studies, Department of Economics, Padjadjaran University Jalan Cimandiri no. 6, Bandung, Indonesia. Phone/Fax: +62-22-4204510 http://www.ceds.fe.unpad.ac.id For more titles on this series, visit: http://econpapers.repec.org/paper/unpwpaper/ Zulhanif, SSi, MS Center for Economics and Development Studies (CEDS) Padjadjaran University September, 2011
-
Upload
univesitaspadjadjaran -
Category
Documents
-
view
0 -
download
0
Transcript of Is a Specific Grant Really ”Specific”?: Case of Indonesian Provinces, 2003 – 2010
Working Paper in Economics and Development Studies
Department of EconomicsPadjadjaran University
Is a Specific Grant Really ”Specific”?: Case of Indonesian Provinces, 2003 –2010
Kodrat Wibowo, Ph.D, Astia Dendi, Ph.D, and
No. 201109
Center for Economics and Development Studies,Department of Economics, Padjadjaran UniversityJalan Cimandiri no. 6, Bandung, Indonesia. Phone/Fax: +62-22-4204510http://www.ceds.fe.unpad.ac.id
For more titles on this series, visit:http://econpapers.repec.org/paper/unpwpaper/
Astia Dendi, Ph.D, and Zulhanif, SSi, MS
Center for Economics and Development Studies (CEDS)
Padjadjaran University
September, 2011
1
Is a Specific Grant Really ”Specific”?: Case of Indonesian Provinces, 2003 – 2010 Kodrat Wibowo, Ph.D, Astia Dendi, Ph.D, and Zulhanif, SSi, MS. 1 Abstract Theoretically, according to Shah (1994), the specific purpose transfer fund suited for correcting inefficiencies in financing of public facilities with externalities (spillovers) to communities outside the recepient regions. Various types of matching grant: open-ended and closed-ended are in fact not intended to address the fiscal imbalance or insufficiency of fiscal capacity among regions. The central government of Indonesia prefers the closed-ended specific purpose transfer (specific grant) fund, so called Dana Alokasi Khusus (DAK) in its inter-governmental balancing fund system considering that problem of moral hazard occured in open-ended approach. By definition, the DAK is a fund sourced from the central budget revenues allocated to specific regions in order to help funding, also specific activities that are of regional affairs and in accordance with national priorities. In fact, the number of the DAK-funded priority areas has been increasing from only 5 fields at the beginning of the year 2003 and became 14 fields in 2010. Moreover, the number of DAK recipient regions always reaches almost 90% of total regions in Indonesia in the same period. There appears a question of how the essential of ‘specificness’ of DAK can be evidenced from these facts? This study will use the 2003-2009 DAK fund allocation of 33 provinces in Indonesia and ultilize statistics analysis to analyze the ‘specificness’ of DAK. Based on the evaluation during the period 2003 – 2010 the essence of specificness is drowned out by more sightings of the essence of 'equalization' fiscal capacity both horizontally and vertically which are more functions of the block grant (DAU) and Revenue Sharing Transfer (DBH). The results of our study also shows that the pattern and magnitude of DAK allocation is applied over the years, do not contribute significantly to the goals (outcomes and impact) of national development. Keywords: Public Finance, Transfer Fund, Fiscal Decentralization. 1. Introduction In line with the policy of decentralization in Indonesia, there is an urgent need to improve the effectiveness of regional development in accordance with the principles of good corporate governance. In the decentralized system, the capacity building of local authorities with an effective and efficient utilization of development funds based on the standard is clearly a very important prerequisite.
1 We thank Deutsche Gesselschaft fuer Internationale Zusammenarbeit (GIZ) and BAPPENAS for providing us the full DAK dataset and funding for our research. We also thank the Technical Team of DAK from BAPPENAS, the Ministry of Finance and the Ministry of Home Affairs for inputs and comments during the process of this research. Special thanks go to Dr. Budhi Santoso from BAPPENAS and Tim Auracher from GIZ for their valuable inputs and comments to the authors.

2
With regard to the use of development funds in its regions, the Central Government of Indonesia continues to seek improvement of policy tools, including the need to revise the Law No.33/2004 about the fiscal balance between central-local government as well as Government Regulation (PP) No.55/2005 about the balance funds to better reflect its new challenge and the dynamics of decentralized development financing. The development funding from Specific Purpose Transfer funds (DAK), although is small compared to the overall fund balance (only about 8.5%), the emergence of a variety of perspectives based on recent performance evaluation of current DAK, requires policies that are more consistent (coherent) and effective. It is inevitable that for certain regions, particularly regions with low fiscal capacity condition and mostly spend their block grants funds (DAU) for salaries and other routine expenditures, financing the regions’ development through DAK will be increasingly important. Article 39 of Law No. 33/2004 mentions that the DAK is allocated to local government to fund the activities of certain "special" areas which are also the local affairs. Meanwhile, Article 51 of PP No. 55/2005 also states that DAK is allocated to specific regions to fund "special" activities which are parts of a program that is a national priority and also regional affair. Further, Article 52 of PP No. 55/2005 states that the program which is a national priority is contained in the Government Work Plan (RKP) budget year concerned. Based on national priorities as set out in the RKP, the technical ministries will propose specific activities determined after coordination with the Ministry of Home Affairs, Ministry of Finance, and State Minister for National Development Planning (Bappenas). Finally, the technical ministries will deliver those specific activities that have been assigned to the Ministry of Finance. The DAK allocation calculation is done through two stages:
a. Determination of specific regions which will receive DAK allocation b. Determination of the monetary amount of DAK allocation for each recepient
regions. The Determination of specific regions that received DAK must meet the general criteria, specific criteria, and technical criteria. On the other hand, the determination of the amount of DAK allocation for each recepient regions is also determined by calculating an index based on general criteria,specific criteria, and technical criteria. Following are the details General criteria The general criteria is to look at the ability of local budget to finance its needs within the framework of regional development as reflected in the general revenue budget substracted by personnel expenditure. Local financial capacity is calculated through the net fiscal index (IFN) set each year. Regions that have low financial capacity should be allowed to receive DAK. Based on the definition, the regions that have low financial capability are those with financial capability under the national average.

3
Technical criteria It based on indicators that can describe the condition of local facilities and infrastructure, as well as the achievement of the technical implementation of DAK activity in the area. These criteria made by the relevant technical ministries. Special criteria The Act No. 33/2004 about Fiscal Balance between Central and Local Government Article 40 paragraph 3 explains that "the specific criteria established by taking into account legislation and regional characteristics," and complemented through PP No. 55/ 2005 on the Balancing Funds of article 56 paragraph 2: "specific criteria formulated by regional indices that are calculated by the Ministry of Finance to consider the input from the State Ministry for National Development Planning and the technical Ministry. Special criteria utilized in calculating the allocation of DAK: regions with special criteria: the Districts/Cities in the Province of Papua and West Papua (special autonomy), remote regions, and the area with characteristics covering the coastal areas and/or small islands, regions with borders with foreign countries, disaster-prone areas, areas that fall into the category of food security, and regional tourism. Data on the 'specificness' area are provided by the Ministry of Finance in coordination with relevant institutions. However, in practice the essence of such “specificness” is not visible on the implementation of DAK transfers from 2003 until 2010. As the evidence, almost all provinces and regional/cities received DAK allocations. In other words, the essence of “specificness” in the determination of the DAK recepient regions is proved to be very weak. In addition, the number of priority sectors tends to always rise and is expected to continue rising to the following years; if the patterns and mechanisms of current DAK to be implemented. As an illustration, the following section describes the evaluation of the implementation of DAK 2003-2010. 2. DAK Priority Sectors and Recepient Regions By definition, the DAK is transfer funds from the national budget allocated to specific regions in order to support funding special activities that are regional affairs and in accordance with national priorities. Since it started in 2003, the DAK allocation experienced significant growth from year to year, both in terms of total allocation and the magnitude of the coverage sectors are funded by DAK. In 2003, the allocation of DAK was Rp. 2.269 billion and only allocated to five sectors: education, health, road infrastructure, irrigation, and infrastructure of government, then in 2010 the number raises to Rp. 21.133,3 billion and 14 sectors: Education, Health, Road Infrastructure, Irrigation Infrastructure, Water Supply Infrastructure, Sanitation Infrastructure, Maritime Affairs and Fisheries, Agriculture, Government Infrastructures, Environment, Family Planning, Forestry, Rural Infrastructure and Trade. Table 1 and 2 presents the development of DAK allocation per area from 2003 to 2010.

4
Table 1 Development of the DAK Allocation
Year 2003 – 2010
Table 2 The DAK Allocation Per Priority Sectors
Year 2003-2010
From 2003 to 2010, the number of province and regency/municipality receive DAK allocation tends to rise (except Province). In 2003, there were 24 provinces received DAK allocation, in 2004 there was no recepient province, while in 2005 only two provinces to receive the DAK. In 2006 and 2007 there was no province received the DAK. In the next three years (2008, 2009, and 2010), there were respectively 24, 28, and 32 recepient Provinces. The more detailed can be seen in Table 3. Along with the expansion of number in Regency and Municipality, the number of the District receiving the DAK allocation continues to increase. In 2003 there were only 265 districts received the DAK allocation. In 2010, then there were 398 districts received it, which means that during the period of 2003-2010 the number of districts that receive
(dalam juta rupiah)
TAHUNTAHUNTAHUNTAHUN 2003200320032003 2004200420042004 2005200520052005 2006200620062006 2007200720072007 2008200820082008 2009200920092009 2010201020102010
Kabupaten 2.125.800 2.838.500 3.994.000 11.569.800 17.094.100 20.439.635 23.459.123 20.304.331
Provinsi 143.200 20.000 762.506 1.360.466 829.052
Total DAKTotal DAKTotal DAKTotal DAK 2.269.0002.269.0002.269.0002.269.000 2.838.5002.838.5002.838.5002.838.500 4.014.0004.014.0004.014.0004.014.000 11.569.80011.569.80011.569.80011.569.800 17.094.10017.094.10017.094.10017.094.100 21.202.14121.202.14121.202.14121.202.141 24.819.58924.819.58924.819.58924.819.589 21.133.38321.133.38321.133.38321.133.383
*) Alokasi DAK Reboisasi
Sumber: Diolah dari data Departemen Keuangan
Dalam Juta Rupiah
2003200320032003 2004200420042004 2005200520052005 2006200620062006 2007200720072007 2008200820082008 2009200920092009 2010201020102010
Pendidikan 625.000 652.600 1.221.000 2.919.525 5.195.290 7.015.420 9.334.882 9.334.882
Kesehatan * 375.000 456.180 620.000 2.406.795 3.381.270 3.817.370 4.017.370 2.829.760
Infrastruktur Jalan 842.500 839.050 945.000 2.575.705 3.113.060 4.044.681 4.500.917 2.810.207
Infrastruktur Irigasi 338.500 357.200 384.500 627.675 858.910 1.497.230 1.548.980 968.402
Infrastruktur Air Minum ** 203.500 608.000 1.062.370 1.142.290 1.142.290 357.232
Infrastruktur Sanitasi 357.232
Kelautan dan Perikanan 305.470 322.000 775.675 1.100.360 1.100.360 1.100.360 1.207.840
Pertanian 170.000 1.094.875 1.492.170 1.492.170 1.492.170 1.543.633
Prasarana Pemerintah 88.000 228.000 148.000 448.675 539.060 362.000 562.000 386.253
Lingkungan Hidup 112.875 351.610 351.610 351.610 351.610
Keluarga Berencana *** 279.010 329.010 329.010
Kehutanan 100.000 100.000 250.000
Sarana dan Prasaran Perdesaan 190.000 300.000
Perdagangan 150.000 107.323
TotalTotalTotalTotal 2.269.0002.269.0002.269.0002.269.000 2.838.5002.838.5002.838.5002.838.500 4.014.0004.014.0004.014.0004.014.000 11.569.80011.569.80011.569.80011.569.800 17.094.10017.094.10017.094.10017.094.100 21.202.14121.202.14121.202.14121.202.141 24.819.58924.819.58924.819.58924.819.589 21.133.38321.133.38321.133.38321.133.383
Sumber: Diolah dari data Departemen Keuangan
Keterangan :
*) Bidang Kesehatan 2009 terdiri dari :
1. Pelayanan Dasar
2. Pelayanan Rujukan
**) Tahun 2009 adalah Bidang Air Minum dan Sanitasi
***) Tahun 2008 adalah Bidang Kependudukan
BIDANGBIDANGBIDANGBIDANGTAHUNTAHUNTAHUNTAHUN

5
DAK allocation had increased by almost 50%. Likewise, the amount of the city received the DAK allocation, if initially there were only 65 recepient cities then in 2010 there were 93 cities, which means that during the period of 2003 to 2010 the number of the City received the DAK allocation had increased almost 50%. Noteworthy, the 2010 data showed that there were a total of 530 regions; consists of: 33 provinces, 398 districts, 93 cities and 6 Administrative Cities.
Table 3 The Number of DAK Recipient Regions
Year 2003-2010
Therefore, in 2010, it is worth noting that the number of DAK recipients regions of 490 when compared with the total area in Indonesia (530) had reached 93%. So the magnitude of receiving DAK allocation, in any sense, does not even reflect the elements of 'specificness' mandated by the Act and the definition of universal specific purpose transfer. 3. DAK Implementation Issues Problems of implementation of DAK so far has shown some problems as follow:
• Determining the mechanism of selection of regions receiving less attention to the essence of DAK allocation specificness and put forward the essence of equalization
• There is an increasing number of special criterions set by central government, implies a widening of the scope of regional characteristics that can receive DAK.
• As the increase in the amount of the budget, the number of DAK recipient regions continues to rise from year to year, so impressed with the determination of DAK receiving regions become more important than a focus on priority sectors funded by DAK.
ProvinsiProvinsiProvinsiProvinsi KabKabKabKab KotaKotaKotaKota Kab dan KotaKab dan KotaKab dan KotaKab dan Kota
2003 24 265 65 330
2004 - 283 71 354
2005 2 305 72 377
2006 - 348 86 434
2007 - 348 86 434
2008 24 363 88 451
2009 28 386 91 477
2010 32 398 93 491
Sumber: Diolah dari data Departemen Keuangan
TahunTahunTahunTahunJumlah PenerimaJumlah PenerimaJumlah PenerimaJumlah Penerima
6
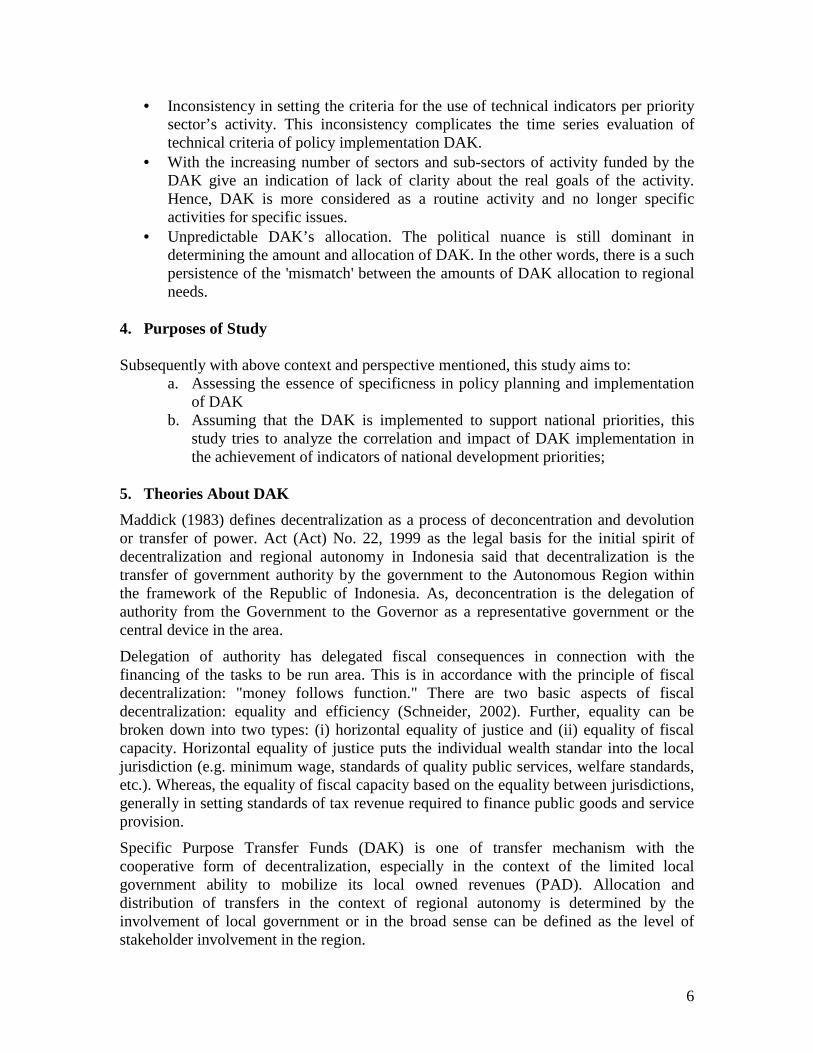
• Inconsistency in setting the criteria for the use of technical indicators per priority sector’s activity. This inconsistency complicates the time series evaluation of technical criteria of policy implementation DAK.
• With the increasing number of sectors and sub-sectors of activity funded by the DAK give an indication of lack of clarity about the real goals of the activity. Hence, DAK is more considered as a routine activity and no longer specific activities for specific issues.
• Unpredictable DAK’s allocation. The political nuance is still dominant in determining the amount and allocation of DAK. In the other words, there is a such persistence of the 'mismatch' between the amounts of DAK allocation to regional needs.
4. Purposes of Study Subsequently with above context and perspective mentioned, this study aims to:
a. Assessing the essence of specificness in policy planning and implementation of DAK
b. Assuming that the DAK is implemented to support national priorities, this study tries to analyze the correlation and impact of DAK implementation in the achievement of indicators of national development priorities;
5. Theories About DAK
Maddick (1983) defines decentralization as a process of deconcentration and devolution or transfer of power. Act (Act) No. 22, 1999 as the legal basis for the initial spirit of decentralization and regional autonomy in Indonesia said that decentralization is the transfer of government authority by the government to the Autonomous Region within the framework of the Republic of Indonesia. As, deconcentration is the delegation of authority from the Government to the Governor as a representative government or the central device in the area.
Delegation of authority has delegated fiscal consequences in connection with the financing of the tasks to be run area. This is in accordance with the principle of fiscal decentralization: "money follows function." There are two basic aspects of fiscal decentralization: equality and efficiency (Schneider, 2002). Further, equality can be broken down into two types: (i) horizontal equality of justice and (ii) equality of fiscal capacity. Horizontal equality of justice puts the individual wealth standar into the local jurisdiction (e.g. minimum wage, standards of quality public services, welfare standards, etc.). Whereas, the equality of fiscal capacity based on the equality between jurisdictions, generally in setting standards of tax revenue required to finance public goods and service provision.
Specific Purpose Transfer Funds (DAK) is one of transfer mechanism with the cooperative form of decentralization, especially in the context of the limited local government ability to mobilize its local owned revenues (PAD). Allocation and distribution of transfers in the context of regional autonomy is determined by the involvement of local government or in the broad sense can be defined as the level of stakeholder involvement in the region.

7
According to Oates (1999) there are at least four reasons for the implementation of the decentralization policy: economic efficiency, cost efficiency, accountability, and the mobilization of resources. Economic efficiency is the efficiency of resource allocation, i.e. the decision made by the scope of smaller government will produce the level of public services more in line with local preferences, especially if the needs are relatively different among regions (Oates 1972, 1999). Decentralization is generally applied in many countries because of its potential in improving public sector performance. Pressure for the implementation of the decentralization policy is basically motivated by reasons of support for economic development (Brodjonegoro, 2006) and the need to improve public service system (Dillinger, 1994).
The cost efficiency of the decentralization policy can be realized by the internalization of the public services costs or the assessment of the capacity of the tax base that is more optimal if performed within the scope of smaller government (Bahl and Linn 1994). Increased accountability of the decentralization policies relates to the visibility of public service and the stakeholders’ role at a lower level of government so as to facilitate the process of directing government activities.
Bird and Vaillancourt (1998) argued that decentralization can help solving problems of national economy because the local government may carry out a public service for people with a lower cost or more efficient than central government’: (a) Local governments know better about the community needs as well as how to meet those needs in the most efficient way, and (b) The local government is closer to its people, so it will react more quickly if the need arose, and ultimately the public will feel satisfied with the services of his/her local government. If the connection between society and government can work well, then satisfaction would boost the productivity of the local community that can ultimately lead to economic growth in regions of higher and reached a maximum level of welfare. Fiscal transfer is required to: (i) address the vertical fiscal imbalance, (ii) address horizontal fiscal imbalance, (iii) the obligation to maintain minimum service standards of achievement in each region, (iv) overcome the problem of interjurisdictional spillover effects, and (v) rehabilitation, which is to achieve stabilization of the central government. So in principle, fiscal transfer is to minimize the fiscal imbalance between central and local governments as a consequence of the centralization of tax administration (vertical fiscal disparity), minimize fiscal disparities among local governments at the same level of government; to increase access and leveling the quality of public services (horizontal disparity), and internalize some or all of the spillover benefits (costs) of public goods and service. Additionally, there is an argument that the fiscal transfer is in order to ensure coordination of the different governments’s fiscal performance.
4.1 Intergovernmental Transfer Fiscal transfer between levels of government, especially from the central to local government included in the issue of fiscal federation. Studies on this subject find the most appropriate relationship so that the optimal performance can be achieved. There are a number of views available in the literature, such as from Joseph Stiglitz, Anwar Shah,
8
Oates, Gramlich, and so forth. According to Stiglitz (1988, pp 634-635) fiscal transfers from central government to regional governments are divided into two major groups:
1. General Revenue Sharing: Block Grants, which is a kind of transfer from the central government revenues such as income taxes on local governments. These funds can be used according to the needs of the local government’s community, represented by the local parliament (in this case the Local House of Representatives and local government.
2. Incentives: categorical Grants and Matching Grants. Transfer of these funds are used as a way of influencing local government programs, eliminating the need to control the system, but with the incentive system, which consists of: a. Categorical grants, which the central government will provide funding for
certain activities in accordance with the criteria of the central government. In the United States (U.S.), this is exemplified in the field of education and urban programs.
b. Matching Grants, where the central government will fund programs up to a certain percentage of local government, which must also comply with the criteria of the central government.
Another view of the more recent studies can be seen in the writings of Anwar Shah (World Bank Working Paper 4039, December 2006). There are two types of Intergovernmental transfer: General Purpose Transfer (GPT) and Spedific Purpose Transfers (SPT). Similar to Stiglitz, Shah also stated that the use of GPT left entirely to the sub-national governments’ needs, while the SPT must follow the provisions of central or national government. Somewhat different from Stiglitz, Shah dividing GPT in the group block transfers and block grants. Block transfers are used freely by recepient region in certain expenses such as education within the national territory. Furthermore, block grants are used freely in any sectors by the recepient region but limited in its territory. Apparently this does not matter much because each region is indeed a specific region that became the recipient of fiscal transfers.
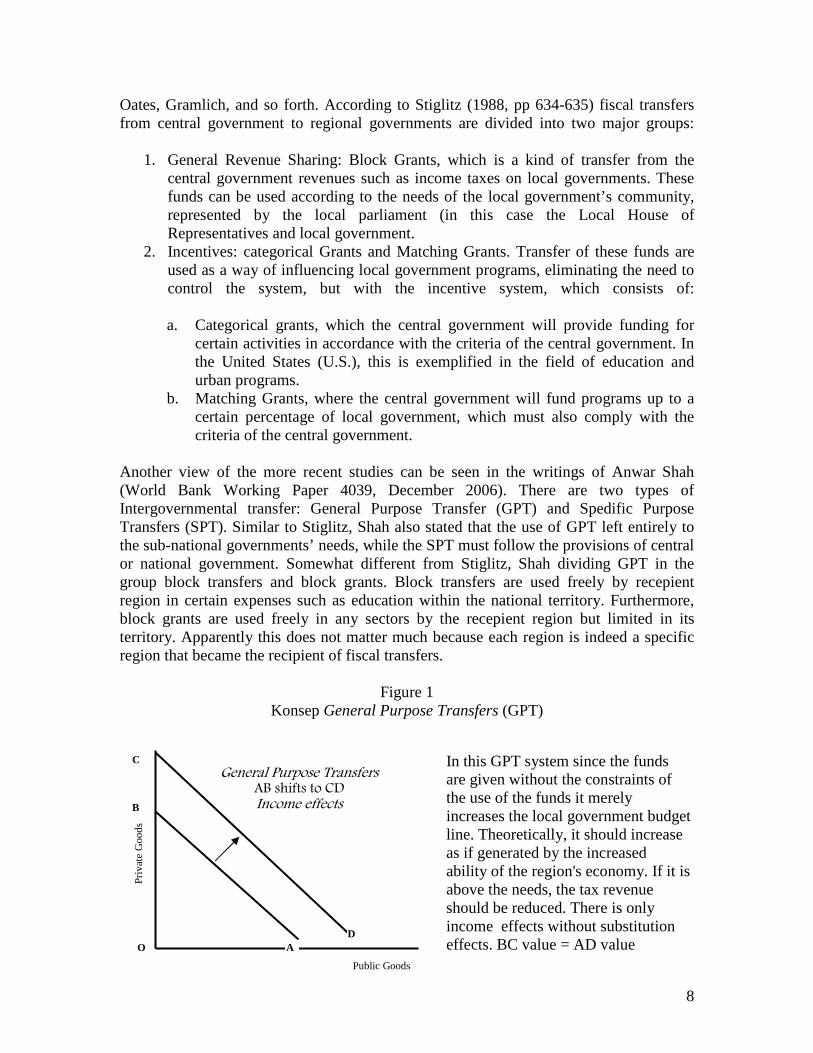
Figure 1
Konsep General Purpose Transfers (GPT)
General Purpose Transfers AB shifts to CD Income effects
In this GPT system since the funds are given without the constraints of the use of the funds it merely increases the local government budget line. Theoretically, it should increase as if generated by the increased ability of the region's economy. If it is above the needs, the tax revenue should be reduced. There is only income effects without substitution effects. BC value = AD value
Public Goods
D
C
B
A O
Priv
ate
Goo
ds

9
Specific Purpose Transfers (SPT) is the instrument of intergovernmental transfers which is an incentive for local or sub-national governments to implement specific projects or activities, so that the SPT is a conditional transfer. Specific Purpose Transfers can still be divided into two groups:
1. Conditional transfers or Matching Grants which can still be divided into: (i) the input-based conditionality such as for capital or operating costs, and (ii) output-based conditionality such as the achievement of some particular public services. Input-based is considered more coercive in the recepient regions compared to output-based. Conditional transfers determine certain percentage provided by subnational governments or local governments (matching requirements). Matching requirements may be open (open ended matching) in which the central government will provide a portion of the program needs without limits, and closed system (closed-ended matching) where there is a cost limit that can be provided by the central government. There is criticism on the magnitude of a fixed percentage of the matching criteria, for harming the regions with lower fiscal capacity. To overcome this it is proposed that the percentage of matching criteria such as the provision of own funds required is inversely proportional to the ability of the receiving areas. For example, only 5 percent of the poor areas are rich region provides 25 per cent. This proposal is somewhat incompatible with the “No One-Size Fits All” (NOSFA)
2. Unconditional Transfer, in which a certain amount of funds transfered to regions that run a particular program, without having to provide matching funds with a certain proportion. The central government had only provided initial funding, when the region is to expand the program, the additional funding should be provided by the local government.
Figure 2 Figure 3 Matching Grants Uncondidional Transfer
There is a substitution effect. BA subsidized budget line was more oblique than subsidized BC. From the economics sense, it causes inefficiency
There is no substitution effect, kinked budget line BCD C
A C
B
O
D
B
A
O Certain Public Goods
Oth
er
Pub
lic G
ood
s
Oth
er
Pub
lic G
ood
s
Certain Public Goods
10
The case in Figure 4 can describe what is so called the open ended and closed-ended matching Grants.
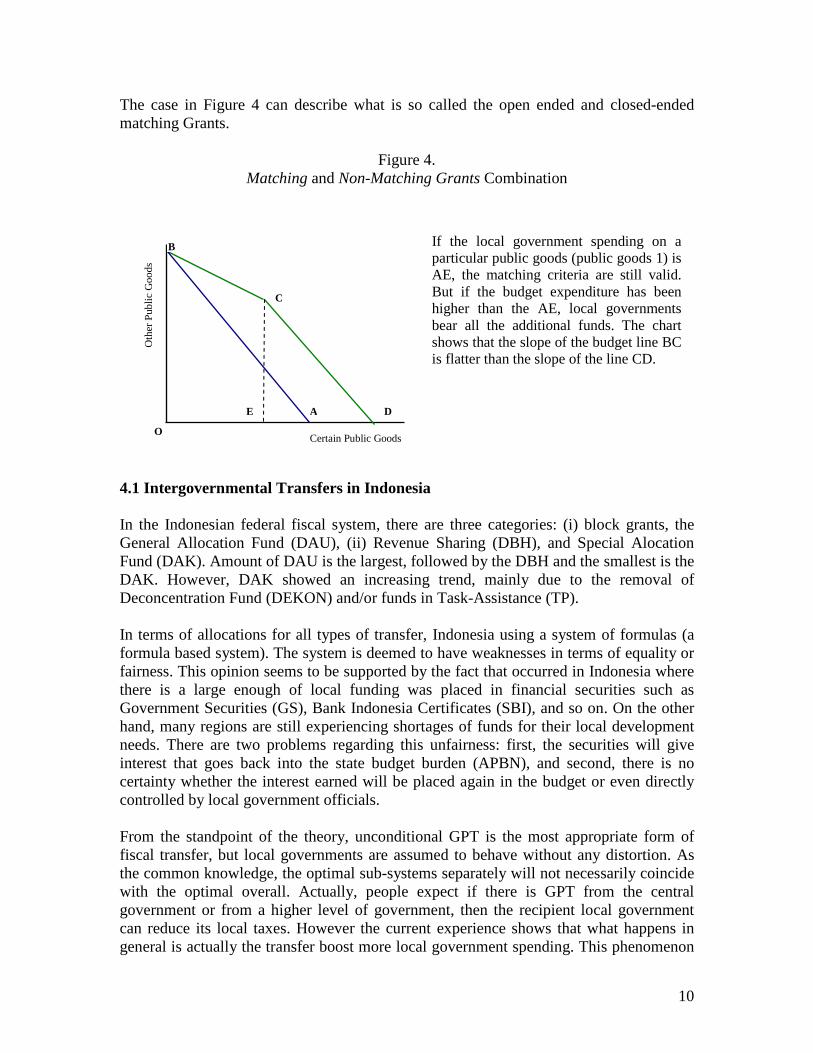
Figure 4.
Matching and Non-Matching Grants Combination
4.1 Intergovernmental Transfers in Indonesia In the Indonesian federal fiscal system, there are three categories: (i) block grants, the General Allocation Fund (DAU), (ii) Revenue Sharing (DBH), and Special Alocation Fund (DAK). Amount of DAU is the largest, followed by the DBH and the smallest is the DAK. However, DAK showed an increasing trend, mainly due to the removal of Deconcentration Fund (DEKON) and/or funds in Task-Assistance (TP). In terms of allocations for all types of transfer, Indonesia using a system of formulas (a formula based system). The system is deemed to have weaknesses in terms of equality or fairness. This opinion seems to be supported by the fact that occurred in Indonesia where there is a large enough of local funding was placed in financial securities such as Government Securities (GS), Bank Indonesia Certificates (SBI), and so on. On the other hand, many regions are still experiencing shortages of funds for their local development needs. There are two problems regarding this unfairness: first, the securities will give interest that goes back into the state budget burden (APBN), and second, there is no certainty whether the interest earned will be placed again in the budget or even directly controlled by local government officials. From the standpoint of the theory, unconditional GPT is the most appropriate form of fiscal transfer, but local governments are assumed to behave without any distortion. As the common knowledge, the optimal sub-systems separately will not necessarily coincide with the optimal overall. Actually, people expect if there is GPT from the central government or from a higher level of government, then the recipient local government can reduce its local taxes. However the current experience shows that what happens in general is actually the transfer boost more local government spending. This phenomenon
B
O
A D
C
E
If the local government spending on a particular public goods (public goods 1) is AE, the matching criteria are still valid. But if the budget expenditure has been higher than the AE, local governments bear all the additional funds. The chart shows that the slope of the budget line BC is flatter than the slope of the line CD.
Oth
er
Pub
lic G
ood
s
Certain Public Goods
11
is well known as “flypaper effects”, where the funds provided in one region will be retained in its use of expenditure categories, and is not used to reduce revenue from other sources, especially local tax relief. By looking at the various theoretical, the DAK in Indonesia is categorized as the Conditional Transfer or Transfer with Closed-Ended Matching Requirement. From the standpoint of the theory, without regard to the potential differences between sub-nastional and the national level, transfers with matching requirements will cause distortions that appear in the form of the substitution effect. Public goods and service with funding from transfers will be more consumed by the community than any other public goods or private goods. However, in situations where there is potential differences between regional and central government priorities, central government can provide incentives for local concern public goods or services to underpin the national optimum point. The example is road construction at the bordered regions, where the road would be more supportive of increased production in neighboring regions, while the effect can be very small for the region with road construction site. In this case, DAK is appropriate, and thus will improve the outcome along the two regions and will also increase the production of aggregates on the national level. DAK system is analogous to the financing of merit goods to members of society, where consumption of goods was considered would improve the overall performance of the community. In this case, members of the community are subnational or local governments. Merit goods can also be provided by the subnational government, in this case the supply by subnational or local government should receive central government subsidies. With respect to the role of DAK in encouraging local governments to conduct an activity that cannot be done by them without subsidy, mid-term evaluation of DAK should also analyze the performance difference between local governments receiving and others who do not receive DAK, especially in the same field of priority sector (the same activity is importan so that we can compare ‘apple to apple’). In terms of road construction in one region that is used for transportation of the pockets of production in other regions, then the performance results of those two regions must show some improvements. This step is nothing but a process of internalizing the external effects between regions are taken over by the central government with a wider coverage area. From the standpoint of the theory, it can be shown that the negative externalities between regions may lead to disputes between the two so it boils down to inoptimality performance. On the other hand, the occurence of the positive effects of public goods or services among regions will trigger a reduction in the development of public goods, and it is becoming a process referred to as “the race to the bottom”, which in the aggregate would be disadvantageous to all. DAK is appropriate instruments to both in encouraging the development of certain public goods that will positively impact all regions together and in handling the negative external effects.

12
From the variation of incentive systems, especially those developed by the Shah as previously described, it can be concluded that the DAK’s important role is still very limited. Maybe there will be times when the instrument of the unconditional transfers to certain activities can be used, but must be accompanied with better guidance from the government. Formula-based system in the allocation of funds in any type is still forced to run on for the high demands of transparency. However, it is necessary to start looking for a better system other that the nature and extent of transparency can still be assured and more acceptable in broader aspects.
5 Effect of DAK in the Regional Financial Capacity DAU allocation plays a role in reducing the financial disparities among regions (horizontal gap). It is indicated by the decreased value of the coefficient of variation during the period of 2005-2009. With the allocation of DAK, further reducing of financial disparities among the regions is demonstrated by the diminishing value of the coefficient of variation. In 2005, with the allocation of DBH, value of the coefficient of variation is 1.93 and then added with the DAU allocation, the value of the coefficient of variation decreased to 0.64, further reduces after the DAK showed the coefficient of variation of allocation becomes 0.61.
Table 3.
Variation Coefficient of Balancing Funds, Districts/Cities (2005-2009)
Sumber: DJPK, Kemenkeu 2010
However, this good picture of decreasing fiscal gap among regions is not very convincing, especially after seeing 2003-2009 DAK recepient regions based on the ability of local fiscal capacity through fiscal net index (IFN) presented in table 4 below:
Jenis Dana Perimbangan 2005 2006 2007 2008 2009
DBH 1,93 2,63 2,39 2,28 1,85
DBH+DAU 0,64 0,68 0,61 0,48 0,55
DBH+DAU+DAK 0,61 0,63 0,55 0,44 0,50

13
Table 4 Distribution of DAK recepient based on Fiscal Capacity (APBD 2003 s.d 2009)
Fiscal
Capacity N DAK & DAU
Below average DAK & DAU
Above Average Total
high NH 100 93 193 % 27.78 83.04 40.89 low NL 260 19 279 % 72.22 16.96 59.11 Total N 360 112 472 Sumber: DJPK, Kemenkeu, diolah kembali
There are 16.96% of districts/cities with the low category which have total DAK and DAU above national average, while the districts/cities with high fiscal capacity almost 83.04% of them, in fact receive total DAK and DAU above national average. Especially, if these types of district/cities are connected to the correlation between DAK allocation with Local Taxes Revenue, Local Owned Revenue (PAD), Retribution, The profit of Local owned Corporates (laba BUMD), DAU, Human Development Index (HDI), and GDRP, the issue of specificness becomes more obvious: • Group of Districts/Citieswith High Fiscal Capacity
Variable I Variable II Corr. Coeff.
DAK Local Tax Revenue -0.203***
PAD -0.228*** Restribusi -0.237*** Laba BUMD -0.111*** DAU 0.413*** HDI -0.512*** GDRP -0.323*** * Significant at α=10% ** Significant at α=5% *** Significant at α=1%
14
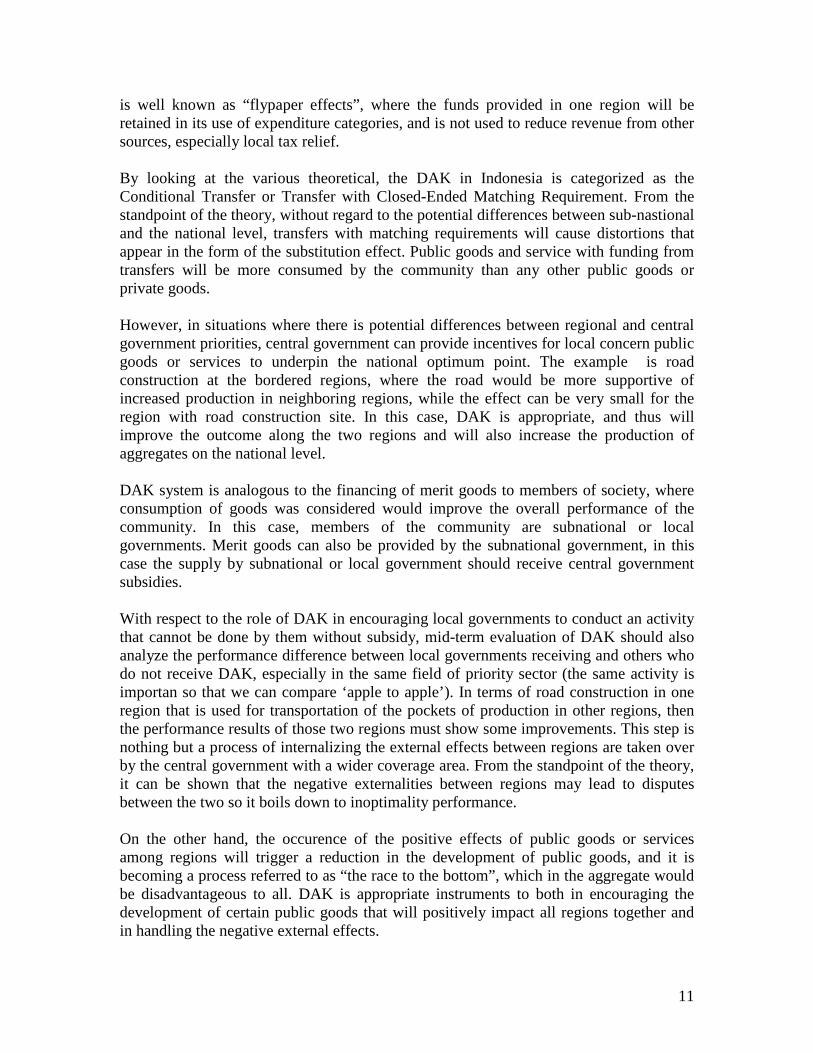
• Group of Districts/Citieswith Low Fiscal Capacity
Variabel Variabel Koef Korelasi
DAK Local Tax Revenue -0.189***
PAD -0.161*** Restribusi -0.172*** Laba BUMD 0.093 DAU 0.416*** HDI -0.417*** GDRP -0.127*** * Significant at α=10% ** Significant at α=5% *** Significant at α=1%
DAK as the focus of this study was reported to only correlate positively and significantly with the amount of DAU course which means that acceptance of DAK allocation depends positively on the amount of DAU allocation. In other words, the essence of 'specificness' DAK is still questionable especially when one considers all negative and significant correlations between the allocation of DAK with each local fiscal capacity components. It is quite obvious that regions with low fiscal capacity will get the balance (equalization) through the disbursement of funds for DAK allocation. This condition is consistently occurred in all regions, both high capacity and low capacity. However, that does not mean the essence of 'specificness' does not get a share of attention due to the assumption that the HDI and GDRP is the determinant of 'specificness' of a region then it is true wether reception of DAK allocation varies negatively and significantly with the performance of HDI and GDRP; the lower the region with low GDRP and HDI performance, the greater the region will receive funding of DAK allocations. This condition is also consistently occurred in all regions both high capacity and low capacity. Thus the subsequent discussion is to assess the effectiveness of DAK allocation during the period 2003 to 2010 with an effort to obtain a more "clear" about the ambiguous results illustrated the essence of consistency 'specificness' DAK in accordance with the mandate of the Act and the essence of equalization that should has heavier portion on the DAU allocation. 5.1 Comparison of DAU with DAK Allocation From the foregoing discussion it can also be hypothesized that the regions with low fiscal capacity will get large DAK allocations and vice versa.
15
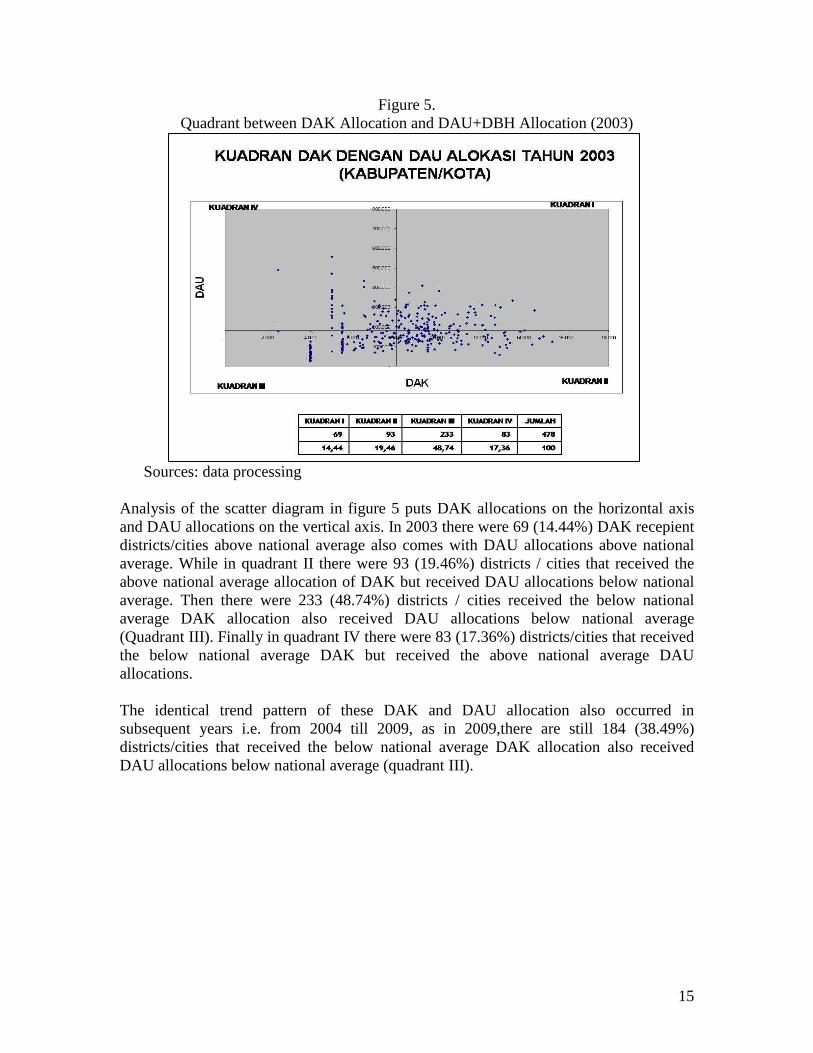
Figure 5. Quadrant between DAK Allocation and DAU+DBH Allocation (2003)
Sources: data processing
Analysis of the scatter diagram in figure 5 puts DAK allocations on the horizontal axis and DAU allocations on the vertical axis. In 2003 there were 69 (14.44%) DAK recepient districts/cities above national average also comes with DAU allocations above national average. While in quadrant II there were 93 (19.46%) districts / cities that received the above national average allocation of DAK but received DAU allocations below national average. Then there were 233 (48.74%) districts / cities received the below national average DAK allocation also received DAU allocations below national average (Quadrant III). Finally in quadrant IV there were 83 (17.36%) districts/cities that received the below national average DAK but received the above national average DAU allocations. The identical trend pattern of these DAK and DAU allocation also occurred in subsequent years i.e. from 2004 till 2009, as in 2009,there are still 184 (38.49%) districts/cities that received the below national average DAK allocation also received DAU allocations below national average (quadrant III).
16
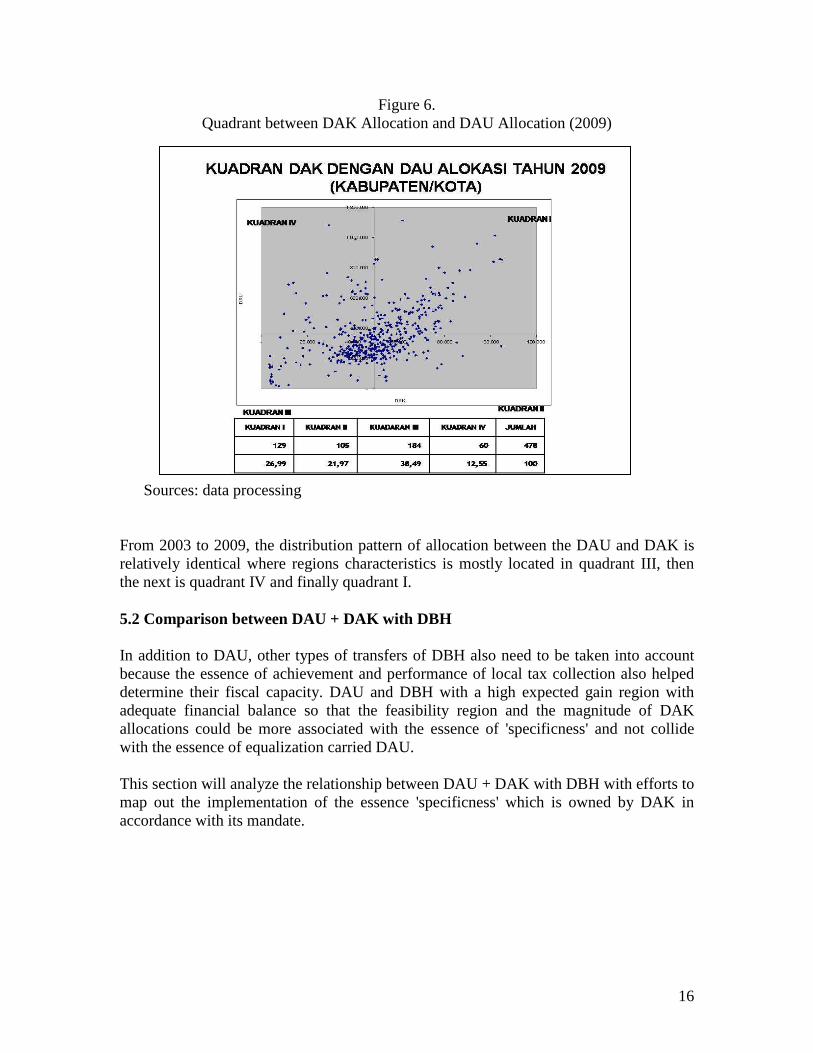
Figure 6. Quadrant between DAK Allocation and DAU Allocation (2009)
Sumber: Pengolahan data
Sources: data processing From 2003 to 2009, the distribution pattern of allocation between the DAU and DAK is relatively identical where regions characteristics is mostly located in quadrant III, then the next is quadrant IV and finally quadrant I. 5.2 Comparison between DAU + DAK with DBH In addition to DAU, other types of transfers of DBH also need to be taken into account because the essence of achievement and performance of local tax collection also helped determine their fiscal capacity. DAU and DBH with a high expected gain region with adequate financial balance so that the feasibility region and the magnitude of DAK allocations could be more associated with the essence of 'specificness' and not collide with the essence of equalization carried DAU. This section will analyze the relationship between DAU + DAK with DBH with efforts to map out the implementation of the essence 'specificness' which is owned by DAK in accordance with its mandate.
17
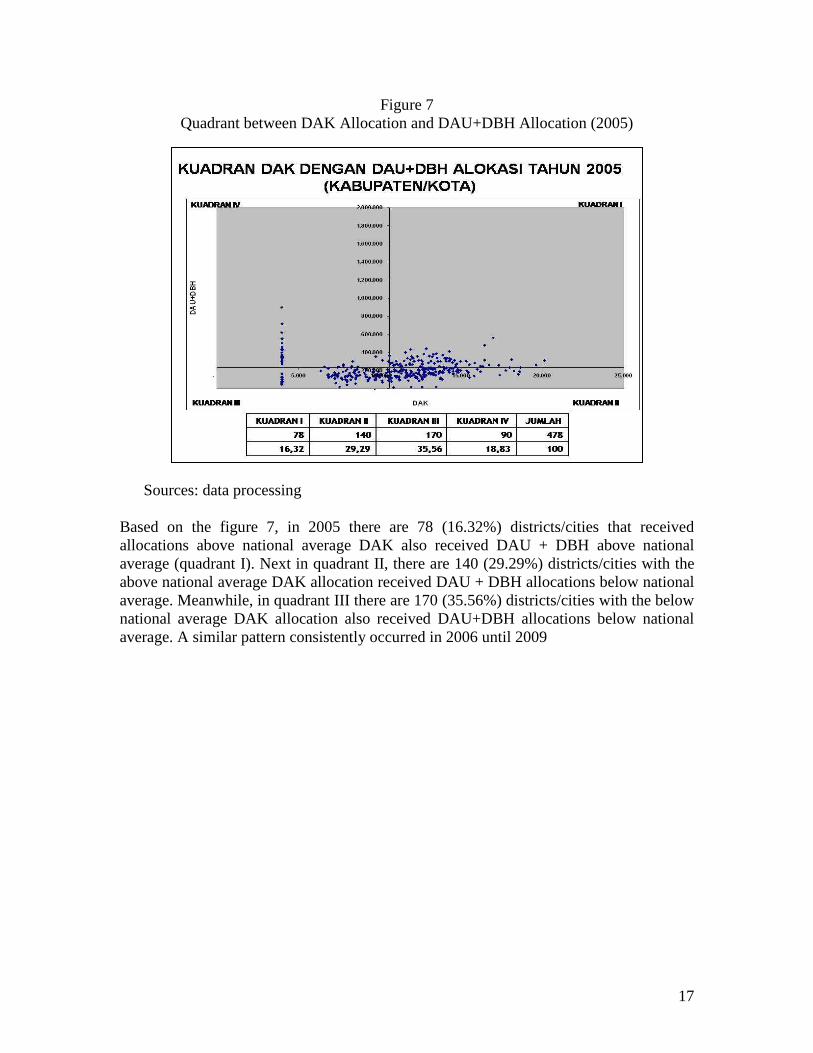
Figure 7 Quadrant between DAK Allocation and DAU+DBH Allocation (2005)
Sources: data processing
Based on the figure 7, in 2005 there are 78 (16.32%) districts/cities that received allocations above national average DAK also received DAU + DBH above national average (quadrant I). Next in quadrant II, there are 140 (29.29%) districts/cities with the above national average DAK allocation received DAU + DBH allocations below national average. Meanwhile, in quadrant III there are 170 (35.56%) districts/cities with the below national average DAK allocation also received DAU+DBH allocations below national average. A similar pattern consistently occurred in 2006 until 2009
18
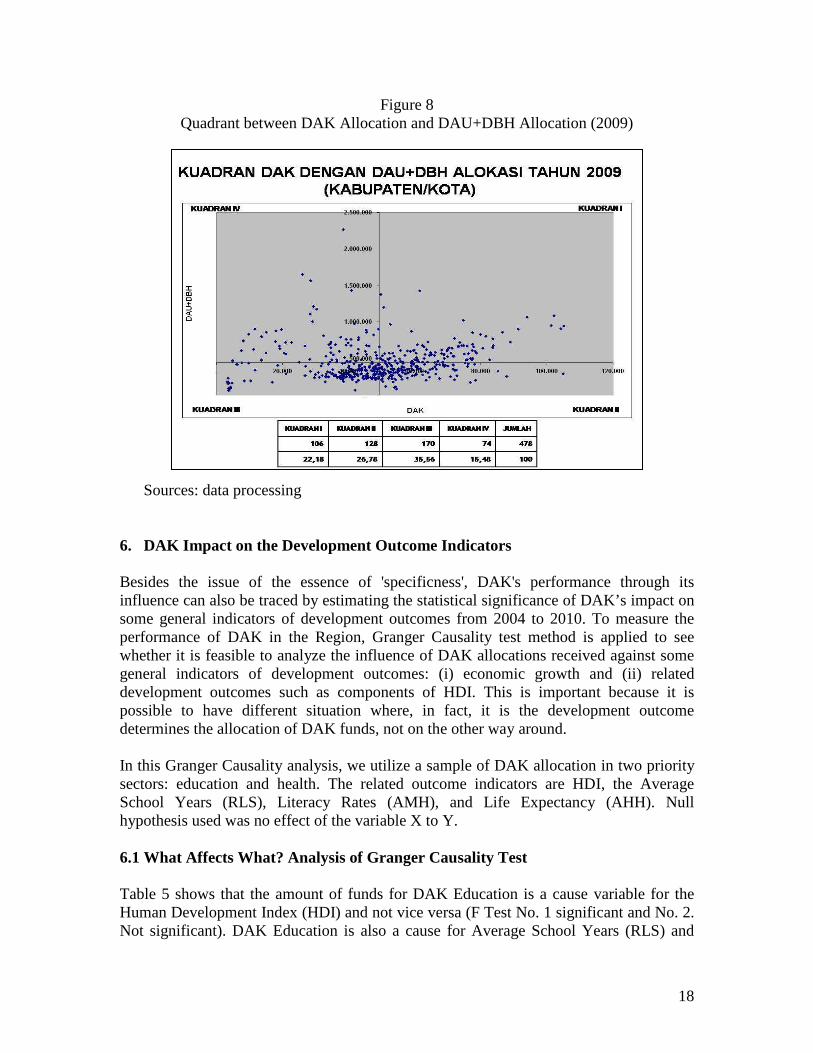
Figure 8 Quadrant between DAK Allocation and DAU+DBH Allocation (2009)
Sources: data processing
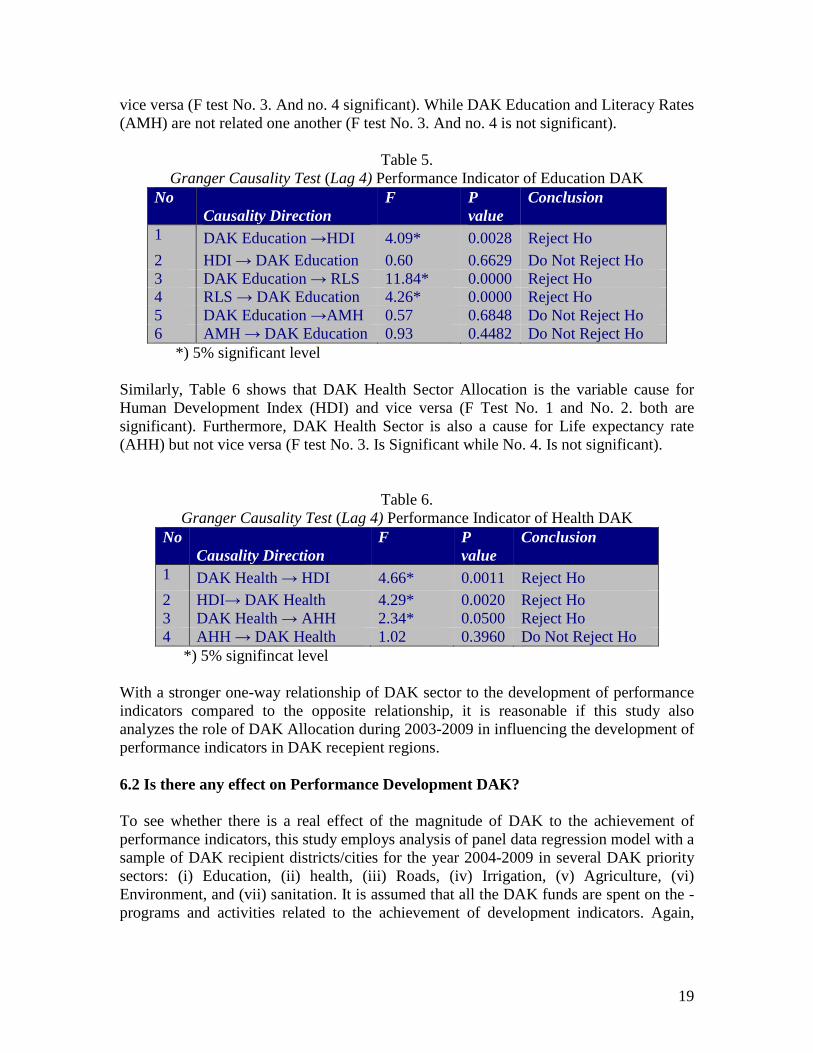
6. DAK Impact on the Development Outcome Indicators Besides the issue of the essence of 'specificness', DAK's performance through its influence can also be traced by estimating the statistical significance of DAK’s impact on some general indicators of development outcomes from 2004 to 2010. To measure the performance of DAK in the Region, Granger Causality test method is applied to see whether it is feasible to analyze the influence of DAK allocations received against some general indicators of development outcomes: (i) economic growth and (ii) related development outcomes such as components of HDI. This is important because it is possible to have different situation where, in fact, it is the development outcome determines the allocation of DAK funds, not on the other way around. In this Granger Causality analysis, we utilize a sample of DAK allocation in two priority sectors: education and health. The related outcome indicators are HDI, the Average School Years (RLS), Literacy Rates (AMH), and Life Expectancy (AHH). Null hypothesis used was no effect of the variable X to Y. 6.1 What Affects What? Analysis of Granger Causality Test Table 5 shows that the amount of funds for DAK Education is a cause variable for the Human Development Index (HDI) and not vice versa (F Test No. 1 significant and No. 2. Not significant). DAK Education is also a cause for Average School Years (RLS) and
19
vice versa (F test No. 3. And no. 4 significant). While DAK Education and Literacy Rates (AMH) are not related one another (F test No. 3. And no. 4 is not significant).
Table 5.
Granger Causality Test (Lag 4) Performance Indicator of Education DAK No
Causality Direction F P
value Conclusion
1 DAK Education →HDI 4.09* 0.0028 Reject Ho 2 HDI → DAK Education 0.60 0.6629 Do Not Reject Ho 3 DAK Education → RLS 11.84* 0.0000 Reject Ho 4 RLS → DAK Education 4.26* 0.0000 Reject Ho 5 DAK Education →AMH 0.57 0.6848 Do Not Reject Ho 6 AMH → DAK Education 0.93 0.4482 Do Not Reject Ho
*) 5% significant level Similarly, Table 6 shows that DAK Health Sector Allocation is the variable cause for Human Development Index (HDI) and vice versa (F Test No. 1 and No. 2. both are significant). Furthermore, DAK Health Sector is also a cause for Life expectancy rate (AHH) but not vice versa (F test No. 3. Is Significant while No. 4. Is not significant).
Table 6.
Granger Causality Test (Lag 4) Performance Indicator of Health DAK No
Causality Direction F P
value Conclusion
1 DAK Health → HDI 4.66* 0.0011 Reject Ho 2 HDI→ DAK Health 4.29* 0.0020 Reject Ho 3 DAK Health → AHH 2.34* 0.0500 Reject Ho 4 AHH → DAK Health 1.02 0.3960 Do Not Reject Ho
*) 5% signifincat level With a stronger one-way relationship of DAK sector to the development of performance indicators compared to the opposite relationship, it is reasonable if this study also analyzes the role of DAK Allocation during 2003-2009 in influencing the development of performance indicators in DAK recepient regions. 6.2 Is there any effect on Performance Development DAK? To see whether there is a real effect of the magnitude of DAK to the achievement of performance indicators, this study employs analysis of panel data regression model with a sample of DAK recipient districts/cities for the year 2004-2009 in several DAK priority sectors: (i) Education, (ii) health, (iii) Roads, (iv) Irrigation, (v) Agriculture, (vi) Environment, and (vii) sanitation. It is assumed that all the DAK funds are spent on the -programs and activities related to the achievement of development indicators. Again,
20
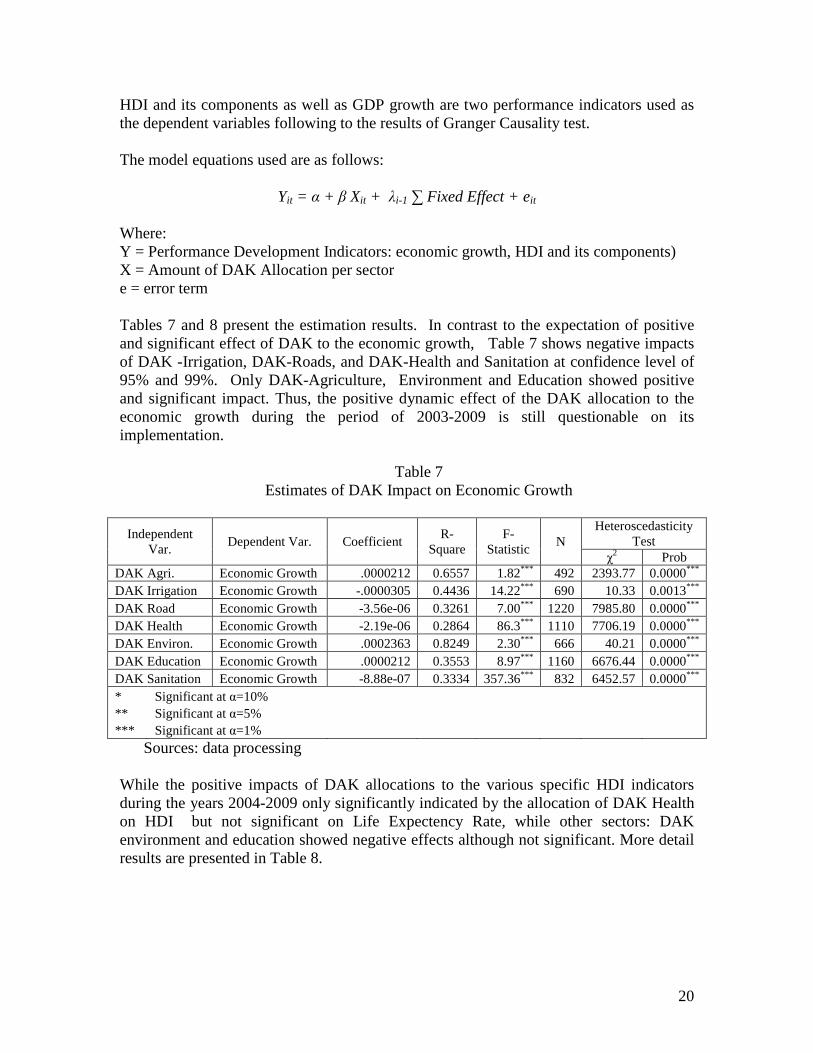
HDI and its components as well as GDP growth are two performance indicators used as the dependent variables following to the results of Granger Causality test. The model equations used are as follows:
Yit = α + β Xit + λi-1 ∑ Fixed Effect + eit Where: Y = Performance Development Indicators: economic growth, HDI and its components) X = Amount of DAK Allocation per sector e = error term Tables 7 and 8 present the estimation results. In contrast to the expectation of positive and significant effect of DAK to the economic growth, Table 7 shows negative impacts of DAK -Irrigation, DAK-Roads, and DAK-Health and Sanitation at confidence level of 95% and 99%. Only DAK-Agriculture, Environment and Education showed positive and significant impact. Thus, the positive dynamic effect of the DAK allocation to the economic growth during the period of 2003-2009 is still questionable on its implementation.
Table 7 Estimates of DAK Impact on Economic Growth
Independent Var.
Dependent Var. Coefficient R-
Square F-
Statistic N
Heteroscedasticity Test
χ2 Prob
DAK Agri. Economic Growth .0000212 0.6557 1.82*** 492 2393.77 0.0000***
DAK Irrigation Economic Growth -.0000305 0.4436 14.22*** 690 10.33 0.0013***
DAK Road Economic Growth -3.56e-06 0.3261 7.00*** 1220 7985.80 0.0000***
DAK Health Economic Growth -2.19e-06 0.2864 86.3*** 1110 7706.19 0.0000***
DAK Environ. Economic Growth .0002363 0.8249 2.30*** 666 40.21 0.0000***
DAK Education Economic Growth .0000212 0.3553 8.97*** 1160 6676.44 0.0000***
DAK Sanitation Economic Growth -8.88e-07 0.3334 357.36*** 832 6452.57 0.0000***
* Significant at α=10% ** Significant at α=5% *** Significant at α=1%
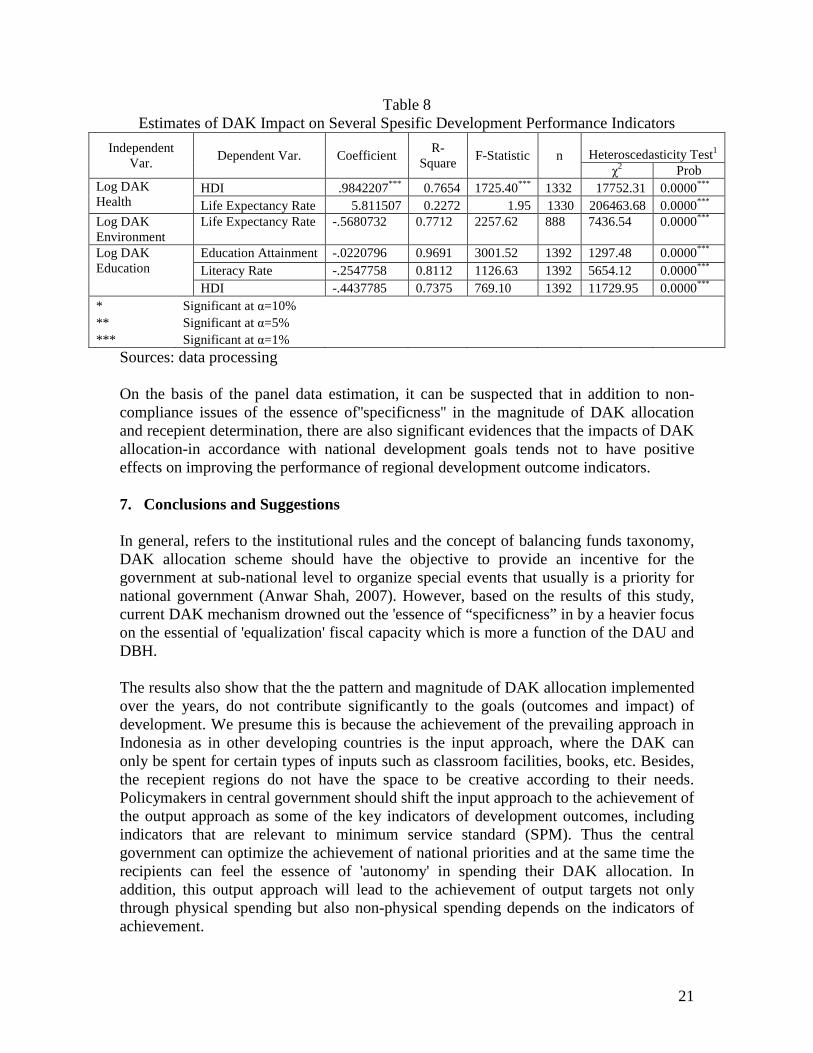
Sources: data processing While the positive impacts of DAK allocations to the various specific HDI indicators during the years 2004-2009 only significantly indicated by the allocation of DAK Health on HDI but not significant on Life Expectency Rate, while other sectors: DAK environment and education showed negative effects although not significant. More detail results are presented in Table 8.
21
Table 8 Estimates of DAK Impact on Several Spesific Development Performance Indicators
Independent Var.
Dependent Var. Coefficient R-
Square F-Statistic n Heteroscedasticity Test1
χ2 Prob
Log DAK Health
HDI .9842207*** 0.7654 1725.40*** 1332 17752.31 0.0000***
Life Expectancy Rate 5.811507 0.2272 1.95 1330 206463.68 0.0000***
Log DAK Environment
Life Expectancy Rate -.5680732 0.7712 2257.62 888 7436.54 0.0000***
Log DAK Education
Education Attainment -.0220796 0.9691 3001.52 1392 1297.48 0.0000***
Literacy Rate -.2547758 0.8112 1126.63 1392 5654.12 0.0000*** HDI -.4437785 0.7375 769.10 1392 11729.95 0.0000***
* Significant at α=10% ** Significant at α=5% *** Significant at α=1%
Sources: data processing On the basis of the panel data estimation, it can be suspected that in addition to non-compliance issues of the essence of''specificness'' in the magnitude of DAK allocation and recepient determination, there are also significant evidences that the impacts of DAK allocation-in accordance with national development goals tends not to have positive effects on improving the performance of regional development outcome indicators. 7. Conclusions and Suggestions In general, refers to the institutional rules and the concept of balancing funds taxonomy, DAK allocation scheme should have the objective to provide an incentive for the government at sub-national level to organize special events that usually is a priority for national government (Anwar Shah, 2007). However, based on the results of this study, current DAK mechanism drowned out the 'essence of “specificness” in by a heavier focus on the essential of 'equalization' fiscal capacity which is more a function of the DAU and DBH. The results also show that the the pattern and magnitude of DAK allocation implemented over the years, do not contribute significantly to the goals (outcomes and impact) of development. We presume this is because the achievement of the prevailing approach in Indonesia as in other developing countries is the input approach, where the DAK can only be spent for certain types of inputs such as classroom facilities, books, etc. Besides, the recepient regions do not have the space to be creative according to their needs. Policymakers in central government should shift the input approach to the achievement of the output approach as some of the key indicators of development outcomes, including indicators that are relevant to minimum service standard (SPM). Thus the central government can optimize the achievement of national priorities and at the same time the recipients can feel the essence of 'autonomy' in spending their DAK allocation. In addition, this output approach will lead to the achievement of output targets not only through physical spending but also non-physical spending depends on the indicators of achievement.
22
Therefore, this study also suggests that the DAK allocation should be more targeted to regions in need with more emphasis on the essence of 'specificness' rather than the essence of 'equalization'. Thus the formulation of DAK in the future should utilize the variables directly related to public accessibility of public services and goods financed by the allocation of DAK. National priority-setting has the time dimension in accordance with national and regional medium-term development planning (4-5 years). Since the output approach, especially using SPM and HDI indicators can not be accomplished within a budget year, so the time dimension must be multiyears DAK allocation, either through the national budget allocation and regional budget planning.
23
References Ahmad, Ehtisham and Jon Craig, Intergovernmental Transfer, in Fiscal Federalism in
Theory and Paractice, Teresa Ter-Minassian (ed), IMF, 1997 Bahl, Roy and James Alin, Decentralization in Indonesia: Prospects and Problems,
Working Report, USAID, Juni 1999 Bahl, Roy and Johannes F. Linn, Urban Public Finance in Developing Countries, Oxford
University Press, 1992 Bailey, S. J. (1999). Local Government Economics. MacMillan Press Ltd. Government Regulation No.104/2000 Regarding Transfer Fund. Ma, Jun, (1997), Intergovernmental Transfer in Nine Countries, the World Bank,
Washington DC. Mahi, Raksaka dan Budy Resosudarmo, Studi Kebijakan untuk Menentukan Kriteria dan
Mekanisme Distribusi Dana Alokasi Khusus, CLEAN Urban Project, 2000. Mahi, Raksaka, Adrian Pangabean, Bambang Brodjonegoro, dan Martin Panggabean,
Konsep dan Formula Distribusi Dana Alokasi Umum, laporan penelitian (tidak diterbitkan) untuk CLEAN Urban Project, dan Departemen Keuangan, 2000
Mahi, Raksaka, Kajian Implementasi Dana Alokasi Khusus, laporan penelitian bekerjasama dengan Biro Dati I dan Transmigrasi, Bappenas, 2000
Musgrave, Richard and Peggy Musgrave, Public Finance in Theory and Practice, 5th edition, McGraw-Hill, 1989
Shah, A. (2006). A Practitioner's Guide to Intergovernmental Fiscal Transfers, World Bank Working Paper 4039 , 4039.
Shah, A., Qureshi, Z., Binder, B., & Zou, H. F. (1994). Intergovernmental Fiscal Relations in Indonesia. World Bank Working Papers Papers.
Shah, Anwar, and Zia Qureshi, Brian Binder, Heng-fu Zou, Intergovernmental Fiscal Relations in Indonesia, World Bank Papers, 1994
Stiglitz, Joseph E. (1988). Economics of Public Sectors, W.W.Norton, New York. Ter-Minassian, Teresa, Fiscal Federalism in Theory and Paractice, International
Monetary Fund, 1997

24
Glossary DBH : Dana Bagi Hasil - Revenue Sharing Funds DAU : Dana Alokasi Umum – Block Grants DAK : Dana Alokasi Khusus – Specific Grants APBN : Anggaran Penerimaan Belanja Negara – Central Government
Budget Dekon : Dana Dekonsentrasi – Deconcentration Funds TP : Tugas Pembantuan –Task Assistance