Developing a Web-Based Mechanism for Assessing Teacher Science Content Knowledge
17
Developing a Web-Based Mechanism for Assessing Teacher Science Content Knowledge Al Byers • Susan Koba • Greg Sherman • Joan Scheppke • Roger Bolus Published online: 16 March 2011 Ó The Association for Science Teacher Education, USA 2011 Abstract The National Science Teachers Association (NSTA) recently launched a comprehensive electronic professional development (e-PD) online portal, the NSTA Learning Center. This support site for educators currently includes over 6,000 e-PD resources and opportunities available on-demand, as well as various tools designed to help educators maximize the effectiveness of using NSTA resources. One tool, the PD Indexer, helps teachers identify their own areas of content strengths and weaknesses by selecting content-specific assessments. Individual NSTA resources are recommended based on assessment outcomes. This paper presents a detailed description of the procedures employed by NSTA to develop valid and reliable PD Indexer content-specific multiple-choice assessment items. A. Byers (&) e-Learning and Government Partnerships, National Science Teachers Association, 1840 Wilson Blvd., Arlington, VA 22201-3000, USA e-mail: [email protected] S. Koba Science Education Consultant President-Elect, National Science Education Leadership Association (NSELA), 1219 N. 54th Street, Omaha, NE 68132, USA e-mail: [email protected] G. Sherman School of Teacher Education and Leadership, College of Education and Human Resources, Radford University, Radford, VA, USA e-mail: [email protected] J. Scheppke Education Consultant, 7324 Golden Star Ln, Carlsbad, CA 92011-4852, USA e-mail: [email protected] R. Bolus Research Solutions Group, 1016 Quail Gardens Court, Encinitas, CA 92024, USA e-mail: [email protected] 123 J Sci Teacher Educ (2011) 22:273–289 DOI 10.1007/s10972-011-9227-2
-
Upload
independent -
Category
Documents
-
view
1 -
download
0
Transcript of Developing a Web-Based Mechanism for Assessing Teacher Science Content Knowledge

Developing a Web-Based Mechanism for AssessingTeacher Science Content Knowledge
Al Byers • Susan Koba • Greg Sherman •
Joan Scheppke • Roger Bolus
Published online: 16 March 2011
� The Association for Science Teacher Education, USA 2011
Abstract The National Science Teachers Association (NSTA) recently launched a
comprehensive electronic professional development (e-PD) online portal, the NSTA
Learning Center. This support site for educators currently includes over 6,000 e-PD
resources and opportunities available on-demand, as well as various tools designed
to help educators maximize the effectiveness of using NSTA resources. One tool,
the PD Indexer, helps teachers identify their own areas of content strengths and
weaknesses by selecting content-specific assessments. Individual NSTA resources
are recommended based on assessment outcomes. This paper presents a detailed
description of the procedures employed by NSTA to develop valid and reliable PD
Indexer content-specific multiple-choice assessment items.
A. Byers (&)
e-Learning and Government Partnerships, National Science Teachers Association,
1840 Wilson Blvd., Arlington, VA 22201-3000, USA
e-mail: [email protected]
S. Koba
Science Education Consultant President-Elect, National Science Education Leadership Association
(NSELA), 1219 N. 54th Street, Omaha, NE 68132, USA
e-mail: [email protected]
G. Sherman
School of Teacher Education and Leadership, College of Education and Human Resources,
Radford University, Radford, VA, USA
e-mail: [email protected]
J. Scheppke
Education Consultant, 7324 Golden Star Ln, Carlsbad, CA 92011-4852, USA
e-mail: [email protected]
R. Bolus
Research Solutions Group, 1016 Quail Gardens Court, Encinitas, CA 92024, USA
e-mail: [email protected]
123
J Sci Teacher Educ (2011) 22:273–289
DOI 10.1007/s10972-011-9227-2

Keywords Online professional development � Science content knowledge �Teacher self-assessment
Strengthening elementary and middle schoolteacher science content knowledge and
science teaching abilities is a national imperative in the United States. Strategic
policies outlined within the America Competes Act (2007) as well as findings and
recommendations from the U.S. Department of Education’s National Commissionon Mathematics and Science Teaching for the twenty-first Century speak directly to
the need for improving science content and science pedagogy among elementary
and middle school teachers in America (America Competes Act, 2007; American
Association for the Advancement of Science 1993; National Research Council
1996; U.S. Department of Education 2000). Given this long-standing imperative and
the challenge of supporting the three million teachers in the United States, exploring
distributed online models seem axiomatic. Providing a mechanism for teachers to
diagnose gaps in content knowledge and select appropriate on-demand, self-directed
electronic professional development (PD) tools and resources is one viable solution.
In 2001 the National Science Foundation sponsored a survey in which over 5,700
science and mathematics educators across America identified perceived strengths
and limitations with science content knowledge. Results of this survey indicated that
71% of elementary teachers in self-contained classrooms (Grades K–4), and 67% of
middle level teachers (Grades 5–8) reported a need ‘‘…to deepen their own science
content knowledge,’’ while only 18–29% of K–4 teachers felt very well prepared to
teach physical science, Earth science, and life science (Weiss et al. 2001). An
analysis of data from the 2004 National Center for Education Statistics Schools and
Staffing Survey indicates that, as of 2007, over 50% of upper elementary teachers in
Grades 5–6 are teaching in self-contained classrooms and are responsible for all
core subjects, including science, but have little formal preparation in science
(Council of Chief State School Officers 2007). These results clearly identify a
tremendous need for science content and science pedagogy PD among practicing
elementary school educators. From a national perspective, primary challenges
facing those invested in improving science education for teachers include the need
to design and implement a PD model that is both scalable and sustainable to reach
America’s 1.7 million elementary teachers of science (U.S. Department of
Education and National Center for Education Statistics 2009).
This article does not take a research position, but one of timely and pertinent
dissemination of information concerning the development of a personal self-
assessment tool in support of self-directed electronic professional development for
science educators. The content herein is intended for practitioners, science leaders,
and science education administrators interested in learning about what is available
from the National Science Teachers Association (NSTA). It discusses the
importance of teacher content knowledge as a key component for elementary
teacher professional development and describes NSTA’s solution to address this
need through electronic professional development. Additionally, it documents the
rigorous procedures NSTA uses to develop a voluntary personal self-assessment
274 A. Byers et al.
123

tool to assist educators in diagnosing their individual science education PD resource
needs. Detailed procedures for developing and testing this PD self-diagnostic tool
are presented, including the results of pilot testing as well as a description of the
expert reviews conducted throughout the development process. Also included is a
collection of sample items developed for one specific science content area.
Importance of Elementary Teacher Science ContentProfessional Development
Many researchers now agree that classroom instructional practices are significantly
linked to teacher quality as defined by teachers’ knowledge and ability to apply
subject matter and pedagogical content knowledge related to the subjects taught
(Bransford et al. 2000; Council of Chief State School Officers 2007; Darling-
Hammond 2006; Goldhaber 2002; Mundry 2005; Wilson et al. 2002). If elementary
teachers of science do not possess a comprehensive understanding in these areas and
their conception and beliefs concerning the nature of science is poor, research has
shown significant and potentially negative impacts to their teaching in the following
ways: (a) avoidance of teaching science altogether; (b) limiting time, structure,
discourse, and topics selected for learning; (c) utilization of instructional strategies
and questions that may limit or fail to formatively assess and build upon students’
ideas to facilitate conceptual understanding; (d) failure to inculcate an understand-
ing about the dynamic nature of science; and (e) facilitation of erroneous content
knowledge and misconceptions in the students they teach (Abell 2007; Appleton
2007; Griffith 2008; Heywood 2007; Howitt 2007; Kang 2007; Wilson et al. 2002).
A lack of science content knowledge, when not part of a coherent conceptual
framework, limits a teacher’s ability to effectively plan and deliver effective science
instruction. This, in turn, facilitates inert knowledge acquisition of science concepts
in students as they wrestle with discrete sets of isolated facts and fail to gain an
appreciation for the nature of science that facilitates understanding of the concepts
in question (Bransford et al. 2000; Fishman et al. 2003; Hanuscin and Lee 2008;
Heywood 2007; Luera 2005; Mundry 2005). So the question then is, ‘‘What are
viable alternatives to costly on-site face-to-face professional development that may
extend and enhance delivering PD to scale on a national level alleviating travel cost,
release time, and substitute pay typically associated with on-site only models?’’
NSTA’s Response to Scalable and Sustainable On-DemandProfessional Development
One solution that directly addresses the issue of scale is to provide PD online. In
April 2008 NSTA formally launched a comprehensive electronic professional
development (e-PD) portal called the NSTA Learning Center, which represents a
collection of web-based tools designed to help professional educators identify,
access, manage, and evaluate professional development resources and opportunities.
Anderson’s (2003) rationale and guide for the development of effective and efficient
Developing a Web-Based Mechanism for Assessing 275
123

distance education provided the theoretical framework used to establish the
sufficiency of this self-assessment tool to determine teachers’ content learning
needs, and therefore to target their online experiences. His equivalency theorem
states that a high level of interaction for one of three different interaction forms
(learner—instructor; learner—learner, or learner—content) is adequate and does not
degrade the educational experience even if the other two interactions are minimal or
even absent. As outlined in this article, the rigorous process used to develop both the
self-assessment tool and the associated e-PD assures the quality of the student—
content interaction provided in the e-learning system NSTA offers.
The Learning Center currently has over 6,000 e-PD resources and opportunities
available on-demand to support teachers’ individual and unique science education
PD needs. Some of the tools available in the Learning Center include an advanced
search form enabling teachers to easily locate NSTA resources such as journal
articles, archived web-based interactive lectures (web seminar sessions), electronic
copies of NSTA Press book chapters, and free self-directed web-based interactive
content-specific learning opportunities called Science Objects and SciPacks.
Science Objects are 2-h online experiences that employ an inquiry-based design
and incorporate interactive and embedded questions to facilitate teacher learning.
SciPacks are 10 h long and include three to five science objects, plus a glossary,
pedagogical implications component, unlimited email help from content experts
(learner-instructor interaction), and an opportunity to complete a final assessment to
document content knowledge understanding. When a teacher identifies professional
development resources of interest, access to these resources are easily stored and
organized into collections within the Learning Center’s My Library tool. These
resources can also be shared with colleagues if desired.
The Learning Center also provides teachers with tools that enable them to
identify personal PD goals, manage goal accomplishments, and communicate
successful personal goal completions with others through the use of the MyCalendar and My Professional Development Plan and Portfolio tools.
The NSTA PD Indexer Tool
Most of the tools provided in the NSTA Learning Center are designed to help
teachers locate, organize, and manage the use of NSTA professional development
resources. But the Learning Center also provides a tool designed to help individual
teachers identify possible areas of PD related to gaps in specific science content.
The My PD Indexer tool represents a diagnostic experience in which teachers select
general areas of science content and then answer questions related to their chosen
topics. These multiple-choice assessment items reflect randomly drawn questions
from a database of well-designed questions aligned to specific content areas.
Currently, the topics available in the PD Indexer represent many of the specific
content areas addressed within Science Objects developed for the general content
areas of Earth and space science, life science, and physical science.
The PD Indexer tracks individual results for each diagnostic assessment
completed and recommends specific NSTA resources addressing the content of
276 A. Byers et al.
123

those items not answered correctly. These resources are easily added to a teacher’s
online library, and specific PD goals are generated based on identified content
deficiencies. Recommendations include such resources as journal articles, book
chapters, web seminars, online short courses, and Science Objects. When the
Learning Center is deployed through a district and state initiative incorporating
learner-learner interactions within a larger systematic PD initiative, these items are
available for use as pre- and post-assessment instruments to document gain in content
knowledge after completing a SciPack. Teachers complete 15–25 items in a content
area, such as plate tectonics, and the results are saved for comparison to the post-test
(same items) once the SciPack on the same content area is completed. Science
Objects and SciPacks represent the most direct remediation to any identified content
deficiencies because they were developed to facilitate deeper understanding
associated with the content addressed by the PD Indexer items. Additional PD
Indexer items are created and made available in the PD Indexer tool as more Science
Objects are developed. PD Indexer details may be reviewed at http://learningcenter.
nsta.org/indexer/.Figure 1 presents a screen capture of the PD Indexer tool, including subject
knowledge tests available at the time of this writing. If a teacher selects all the items for
a discipline (i.e., Earth and space science) five randomly selected questions from each
of the available science content topic areas are administered. When teachers score
below 80% for individual areas, they are provided selected resources for consideration.
Figure 2 presents a sample of recommended resources resulting from the performance
of a PD Indexer user. Teachers selecting single content areas, such as rock cycle,
complete 10 items from the 15–25 available for each content area, providing more in-
depth coverage. The diagnostic PD indexer can be taken as many times as desired by
individual users since it is not designed as a summative evaluation tool.
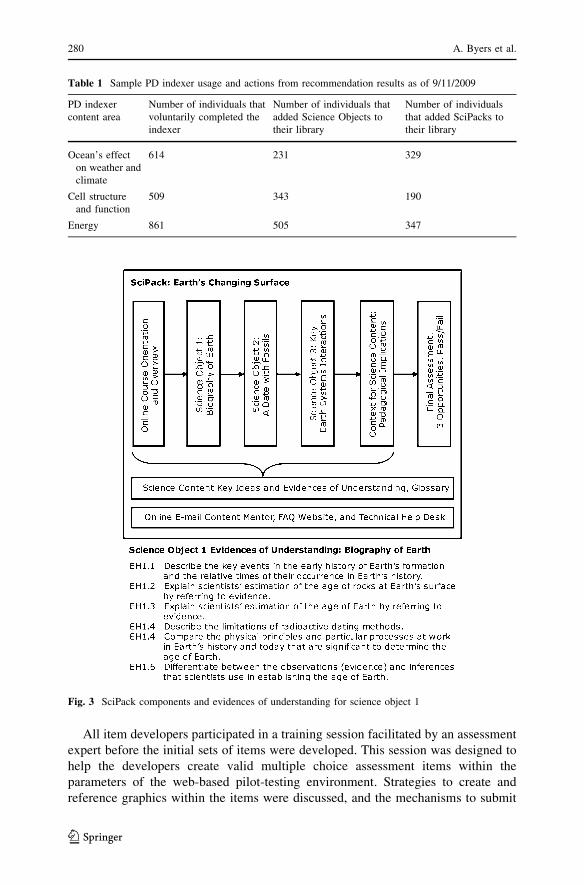
Table 1 shows recent sample usage statistics from the PD Indexer tool. These
data indicate that a significant number of users add free resources, such as science
objects, to their personal library after viewing the recommendations at the
completion of the selected indexer content area. These results indicate that PD
Indexer participants use their evaluation information to help them select PD
resources targeting specific content needs.
PD Indexer: Pre- and Post-Assessment Item Content Areas
The content areas addressed within the latest round of NSTA PD Indexer item
development included the specific topics included in 11 different sets of Science
Objects. These Science Objects comprise the content for the following SciPacks:
Earth’s History; Food Science Safety; Magnetic and Electric Forces; Nature of
Light; Resources and Human Impact; Atomic Structure, Chemical Reactions,
Elements, Atoms, and Molecules; Nutrition; Cell Division and Differentiation; and
Cells and Chemical Reactions. Each SciPack listed contains three or four Science
Objects. The outcomes or ‘‘evidences of understanding’’ for all SciPacks are well
defined. The components for one of the SciPacks (Earth’s History) and a sample of
the respective evidences of understanding are presented in Fig. 3.
Developing a Web-Based Mechanism for Assessing 277
123

The overall goal of this round of PD Indexer item development was to generate
enough items to ensure that at least five well-designed, effective items for each
Science Object could be selected, resulting in final test sets for each SciPack that
include 15 and 25 items. The rigorous, 4-stage process for indexer item
development ensures valid and reliable items and involves the stages summarized
below.
Stage 1: Develop Draft Items
Item developers were selected by members of the NSTA PD Indexer development
team based on their previous work with NSTA, their demonstrated grasp of the
Fig. 1 PD indexer tool depicting prior saved results and new content areas for assessment
278 A. Byers et al.
123

content knowledge, and in some cases their previously identified status as master
teachers. For example, a recently retired master biology teacher with experience in
item development for WestEd was secured for the topic of Food Science Safety. A
retired master teacher in physics, who had experience in national curriculum
development, generated draft items for Atomic Structure and Magnetic and Electric
Forces content areas. Several retired district and state science administrators with
earned doctoral degrees and national board certification assisted in generating draft
items for the science topics in biology and resources and human impact.
Fig. 2 Results after completing PD indexer for all topics available in earth and space science
Developing a Web-Based Mechanism for Assessing 279
123
All item developers participated in a training session facilitated by an assessment
expert before the initial sets of items were developed. This session was designed to
help the developers create valid multiple choice assessment items within the
parameters of the web-based pilot-testing environment. Strategies to create and
reference graphics within the items were discussed, and the mechanisms to submit
Fig. 3 SciPack components and evidences of understanding for science object 1
Table 1 Sample PD indexer usage and actions from recommendation results as of 9/11/2009
PD indexer
content area
Number of individuals that
voluntarily completed the
indexer
Number of individuals that
added Science Objects to
their library
Number of individuals
that added SciPacks to
their library
Ocean’s effect
on weather and
climate
614 231 329
Cell structure
and function
509 343 190
Energy 861 505 347
280 A. Byers et al.
123

items and revise them using web-based tools were demonstrated. Additionally, the
item developers were provided with documents that detailed the evidences of
understanding as well as background information associated with the content
addressed within their assigned SciPack topic. Access to the material developed for
the actual SciPack was provided as well.
The item developers created items for each Science Object based on their
respective evidences of understanding and submitted them to the PD Indexer team
upon completion. Once an initial set of items was developed, it was submitted to a
subject matter expert for content review. The reviewers were experts in their
respective fields with doctoral degrees in the appropriate science content area under
review. For example, a professor with a PhD in biology reviewed assessment items
for the cell division and differentiation topic, and a university professor with a PhD
in physics reviewed items for the nature of light topic.
Based on the feedback of subject matter experts, individual items were edited by
either the item developer or members of the PD Indexer team. In some cases, items
were discarded if they were too similar to existing, usable items or, in rare cases, if
they were too difficult to repair without completely rewriting the entire item. At this
stage, the project assessment expert also reviewed items to ensure they conformed
to guidelines reflecting valid and reliable multiple-choice assessment item
development. These criteria were based on a number of assessment design models
(Bashaw 1991; Dick et al. 2008; Gagne and Driscoll 1988; Merrill and Tennyson
1994; Popham 2008; Sullivan and Higgins 1983) and included such strategies for
well-developed multiple-choice assessment as (a) items are free of prompts or cues
that could be used to determine the correct answer; (b) no choices (distracters) are
obviously incorrect; (c) words such as a, an, he, she, or plural words are not used to
cue learners toward the correct answer; (d) words such as ‘‘All’’ or ‘‘Never’’ are not
used in the answer options; and (e) key concept words from the question are not
repeated in the answer options.
Stage 2: Pilot Tests
Once the overall set of assessment items for each topic was developed and edited
(approximately 3 times the target number of assessment items), the items were
entered into NSTA’s online assessment system for pilot testing. Pilot testers were
recruited from NSTA membership. In order to reach the SciPack target audience of
middle school teachers, e-mail contacts were selected from NSTA’s database of
members who subscribe to the NSTA middle school journal Science Scope. The
testing was scheduled to be open for 1 week or until the target of 100 pilot testers
for each topic was reached. After 100 pilot testers completed a test, it was closed for
further participation. If the target number of pilot tests were not completed within
3 days, a follow-up e-mail was sent. In most cases, the target number of testers was
reached within 3 days of the initial e-mail.
When the pilot testing was completed, the data were exported, formatted, and
sent to a psychometrician for independent item analysis. The statistics generated in
the item analysis for one actual pilot test item are presented in Table 2. The
objective of the initial item analysis was to identify obvious candidates for the final
Developing a Web-Based Mechanism for Assessing 281
123

version of each test based on reliability measures, identify items that might require
some modification, and eliminate items that did not measure their targeted outcomes
within acceptable parameters of statistical reliability.
For each item, a response distracter analysis was first provided. This analysis
reported the percentage of respondents selecting each choice. Each analysis further
reported percentages by the top and bottom one-third performing group based on
overall test score. The correct response for each item was identified with an asterisk
(*) and the additional distracters were identified. This analysis documented the
degree to which test-takers were drawn to each of the distracters (i.e., incorrect
choices). Low percentages of respondents selecting certain distracters might
indicate a weak distracter. If a large percentage of respondents from the upper third
performing group (i.e., ‘‘high ability’’ participants) selected the same incorrect
distracter, the statement was carefully examined to determine whether it could be
correct, or whether the wording of the distracter made it too plausible. The
percentage of responses for the keyed-correct choice reflected the item’s difficulty
level. The analysis illustrated in Table 2 indicates a correct response rate of 82%,
which, based upon the skill measured by the item, resulted in its exclusion from the
final assessment set.
The next set of statistics presented in Table 2 illustrates the item’s discriminating
power (i.e., the ability of the item to accurately differentiate more knowledgeable
respondents from less knowledgeable respondents). Point biserial correlations were
calculated for each item, representing the average relationship between the
participants’ performances on a single item (correct or incorrect) versus how well
they performed on the entire test. Like most correlations, this calculation is reported
as a coefficient between -1 (a perfect negative relationship) and ?1 (a perfect
positive relationship). A positive coefficient implies that respondents who selected a
specific distracter scored higher on the overall test, while a negative coefficient
implies the opposite. Note that the point biserial statistics are provided for the
‘‘Item-Total’’ and ‘‘Item-Remainder.’’ In the current setting, the latter presents a
more accurate picture as it evaluates the relationship of the item with a total score
removing the effect of the item under examination.For diagnostic purposes, these statistics were provided for each choice. In
examining the efficacy of each item, the PD Indexer development team selected
positive point-biserial correlations greater than ?.20 (Nunnally 1967) as the
Table 2 Sample statistical analysis results for single pilot test item
Item 3: * is keyed 1* 2 3 4
Responses 82.0% 4.5% 8.1% 5.4%
Upper 33% 91.9% .0% 2.7% 5.4%
Lower 33% 73.5% 8.8% 8.8% 8.8%
Item-total
Point Biserial .259 -.243 -.077 -.125
Item-remainder
Point Biserial .207 -.221 -.042 -.098
282 A. Byers et al.
123

absolute minimum for inclusion in the final set. In some cases, point biserial scores
were so aberrant (i.e., -.90) that the item was evaluated to ensure the scoring key
was correct, or that more than one correct answer was not provided. According to
Crocker and Algina (1986), common causes for aberrant response patterns include:
no correct answers to an item, multiple correct answers to an item, an item written in
such a way that ‘‘high ability’’ persons read more into the item than intended and
thus choose an unintended distracter while ‘‘low ability’’ people are not distracted
by a subtlety in the item and answer it as intended, an item having nothing to do
with the topic being tested, or a mistakenly keyed incorrect response as the correct
one on the scoring key. Items following an aberrant point-biserial pattern were
subject to modification or elimination.
An example summary of the item difficulty levels and item-remainder point-
biserials for the science content topic of Earth’s History items are included in
Table 2.
Stage 3: Select Final Items
After all the analyses were conducted for the pilot test items, the results were
submitted to item review team members. These item reviewers were selected for
their experience in the appropriate subject matter areas and assessment item
development. This panel included expertise in both content and assessment. For
example, a university faculty in the subject area in question (e.g., PhD professor of
Earth science at the University of Northern Iowa) reviewed with a senior researcher
from major education institutions and organizations (e.g., Westat and Department of
Education State Science Assessment Directors). Reviewers used the item-level
analysis to determine item quality, and they evaluated each item whose point
biserial scores may have been aberrant. Reviewers also analyzed each item for bias
based on the ETS Fairness Review Guidelines (Educational Testing Service 2009).
Bias was evaluated according to the categories detailed by Hambleton and Rodgers
(2004): content, language, structure, formatting fairness, and stereotyping.
Once an item was identified as reliable and unbiased, review team members
evaluated the degree to which it appeared to align with the stated evidence of
understanding. Although the item developers in consultation with an assessment
expert previously addressed such alignment issues, review team members ranked
the degree to which multiple items addressed specific evidences of understanding,
based on their own understanding of the evidences. After establishing the intent of
each evidence of understanding, reviewers used the following criteria to rate the
alignment of each candidate item:
Level Criteria Recommended action
3 Item completely meets the intent Keep
2 Item meets most of the intent Revise part needed to match
1 Item partially meets the intent Completely revise or eliminate
0 Item does not meet the intent Eliminate
Developing a Web-Based Mechanism for Assessing 283
123

Reviewers worked individually reviewing items for degree of match, recording
responses on an Item Content Alignment Form. For example, the reviewers for
assessment items developed for the Magnetic and Electric Forces suggested
improvements such as more accurate representations for illustrations, replacing
distracters if a significant percentage of low-scoring respondents selected a
distracter, or increasing the length for certain distracters to equalize length. Each
independent reviewer completed a summary sheet that included item quality, bias,
and alignment scores.
All summary sheets presenting the alignment scores, bias feedback, point biserial
data, recommendations, and general comments from each of the items were
aggregated for analysis. Members of the PD Indexer team then assessed these
reviews, and decisions were made regarding the selection of items to be included in
the PD Indexer. In most cases, if both reviewers recommended items, they were
included in the final set. If there was a discrepancy (i.e., recommended by one
reviewer but not by the other), notes on the items were evaluated to determine if a
simple edit might address concerns.
Once the final sets of items for all 11 SciPacks were identified, test-level
statistical analyses were conducted on the pilot test results for the selected items.
The data in Table 3 present the number of items selected for each set, the number of
pilot test results for each test, mean and standard deviation, median and quartile
scores, and Cronbach Alpha internal consistency correlation statistics.
Based on the data presented in Table 3, the PD Indexer development team
approved the final set of items. There was some concern that the Resources and
Human Impact test results indicated an assessment that was not adequately
Table 3 Test-level statistical analysis results
Test No. of
items
No. of
cases
Mean Std deviation 1st
Qrtile
Median 3rd
Qrtile
Internal
consistencya
Earth history 20 111 62.3 18.2 50 60 75 .704
Food science safety 22 102 61.7 19.1 45 62 77 .787
Magnetic and
electric forces
22 114 56.1 21.9 36 55 73 .821
Nature of light 20 105 55.6 19.7 40 55 70 .737
Resources and
human impact
16 100 79.0 15.2 69 81 91 .656
Atomic structure 16 102 65.9 27.0 50 75 88 .882
Chemical reactions 23 101 60.5 24.6 39 61 83 .877
Elements, atoms,
and molecules
28 103 83.3 14.3 75 86 93 .812
Nutrition 20 97 67.5 14.9 60 70 75 .609
Cell division and
differentiation
22 97 69.1 17.4 59 73 82 .752
Cells and chemical
reactions
24 94 59.4 20.1 46 58 75 .821
a Chronbach’s Alpha
284 A. Byers et al.
123

discriminating, with a mean score of 79% and a lower reliability score (.656).
However, the evidences of understanding measured by the selected items generally
addressed lower cognitive ability, and the items did align well with these evidences.
The same argument is posited for Nutrition.
Stage 4: Final Item Preparation
Before the items were placed into the online PD Indexer system, the text of the
items was sent to an editor, and the graphics for those items requiring them were
sent to a graphic designer to ensure that they were clear and easily decipherable. The
Senior Director of e-Learning Production then reviewed the items and, in
coordination with the technology staff, placed items in the online tool available
for use. When used within the PD indexer to diagnose teachers’ content knowledge,
correct answers and scores are not reported for the end user, and only a smaller
subset of the 20- to 15-item bank is available. When the items are used as a pre/post
assessment instrument, the entire bank of items in a content area is presented for the
learner. Table 4 provides a sample of two items for Magnetic and Electric Forces,
which collectively reported a Chronbach Alpha internal consistency reliability of
.821 in Table 3.
Summary
Helping our nation’s 1.7 million elementary science teachers better understand the
science content they teach was the primary reason the NSTA launched an on-
demand electronic professional development portal called the Learning Center in
April 2008. This e-PD tool currently provides over 6,000 distinct resources and
opportunities, with over 1,850 completely free. A suite of freely available tools also
resides within the portal to help educators plan, track, and document their growth
over time. The PD Indexer represents just one of these tools, but it remains an
important asset supporting all other tools and resources because it assists teachers in
diagnosing their individual PD science content needs. The rigorous development
process of the PD Indexer, coupled with quality resources recommended based on
the assessment, help assure a high level of learner—content interactions necessary
for effective and efficient distance education (Anderson 2003). NSTA has expended
significant effort to ensure that the items in the PD Indexer self-assessment tool are
internally valid and reliable, and that the recommended resources, such as the free
Science Objects, are high quality and effective, thus providing teachers an on-
demand, self-directed e-PD resource to meet their individual needs at a time, place,
and convenient pace. Figure 4 reflects the positive usage trends of the NSTA
Learning Center and its e-PD resources over the past year. These encouraging data
indicate that over 62,000 teacher accounts currently include over 430,000 individual
e-PD resources in their online libraries. If this trend continues, the Learning Center
may significantly help address the challenge of increasing K–8 teachers’ compe-
tence in science education via a model that is sustainable on a national level to
address the scale needed for our country’s teachers of science.
Developing a Web-Based Mechanism for Assessing 285
123

Table 4 Final PD indexer—pre/post assessment item set for magnetic and electric forces
Item 1 ID MEF1.1.2
Question Docents at science museums often invite a student with long hair to step up to the podium
and participate in a demonstration on static electricity. With all safety measures in place,
the student is asked to place two hands on the ball of a Van de Graff generator
The student’s individual hair strands collect the same charge, and the hair sprays out from
the head as depicted in the photograph. Which of the following statements best explains
what causes this person’s hair to stand on end?
Correct
Answer
The individual hair strands are all the same charge, so they repel each other
Distracter 1 The hair strands stand up so that they can transmit the electrons from the generator to the
air
Distracter 2 Hair strands are forced up because of the repulsion of the opposite charge collecting at the
feet of the student
Distracter 3 Hair strands repel each other because of the energy of the neutrons flowing through the
Van de Graff generator to the student
Item 20 ID MEF3.2.5
Question The Earth’s magnetic field is represented in the field line diagram
Which of the following statements best explains the existence of the Earth’s magnetic field?
286 A. Byers et al.
123

References
Abell, S. K. (2007). Research on science teacher knowledge. In S. K. Abell & N. G. Leaderman (Eds.),
Handbook of research on science education (pp. 1105–1149). Mahwah, NJ: Lawrence Erlbaum
Associates.
Table 4 continued
Item 20 ID MEF3.2.5
Correct
Answer
The Earth’s magnetic field exists because currents move in the outer core producing
electric currents
Distracter 1 The Earth’s magnetic field exists because lodestone and metallic minerals are found in the
crust
Distracter 2 The Earth’s magnetic field exists because the Earth’s core largely consists of mono-polar
materials
Distracter 3 The Earth’s magnetic field exists because solar winds from the Sun strip electrons off of
the crust near the northern pole, making the Earth into a huge bar magnet
Fig. 4 Learning center account trajectory and resource usage as of September
Developing a Web-Based Mechanism for Assessing 287
123

America COMPETES Act, H.R. 2272, 110th Congress, 1st Session, (2007).
American Association for the Advancement of Science. (1993). Benchmarks for science literacy.
New York, NY: Oxford University Press.
Anderson, T. (2003). Getting the mix right again: An updated and theoretical rationale for interaction.
International Review of Research in Open and Distance Learning, 4(2). Retrieved April 29, 2009
from http://www.irrodl.org/index.php/irrodl/article/view/149/708.
Appleton, K. (2007). Elementary science teaching. In S. K. Abell & N. G. Lederman (Eds.), Handbook ofresearch on science education (pp. 493–535). Mahwah, NJ: Lawrence Erlbaum Associates.
Bashaw, W. (1991). Assessing learner performance. In L. Briggs, K. Gustafsen, & M. Tillman (Eds.),
Instructional design: Principles and applications (pp. 151–167). Englewood Cliffs, NJ: Educational
Technology Publications.
Bransford, J. D., Brown, A. L., Cocking, R. R., Donovan, M. S., & Pellegrino, J. W. (Eds.). (2000). Howpeople learn: Brain, mind, experience, and school. Washington, DC: National Academy Press.
Council of Chief State School Officers. (2007). Fifty-state analysis of the preparation of teachers andconditions for teaching: Results from the NCES schools and staffing survey. Washington, DC:
Blank, R. K., & Toye, C.
Crocker, L., & Algina, J. (1986). Introduction to classical and modern test theory. New York, NY: Holt,
Rinehart, and Winston.
Darling-Hammond, L. (2006). Constructing 21st-century teacher education. Journal of TeacherEducation, 57, 300–314.
Dick, W., Carey, L., & Carey, J. O. (2008). The systematic design of instruction (7th ed.). Upper Saddle
River, NJ: Merrill.
Educational Testing Service. (2009). ETS Guidelines for fairness review of assessment, Princeton, NJ.
Retrieved April 29, 2009 from http://www.ets.org/Media/About_ETS/pdf/overview.pdf.
Fishman, B. J., Marx, R. W., Best, S., & Tal, R. T. (2003). Linking teacher and student learning to
improve professional development in systemic reform. Teaching and Teacher Education, 19,
643–658.
Gagne, R., & Driscoll, M. (1988). Essentials of learning for instruction. Englewood Cliffs, NJ: Prentice
Hall.
Goldhaber, D. (2002). The mystery of good teaching. Education Next, 2, 50–55.
Griffith, G. (2008). Initial impacts of no child left behind on elementary science education. Journal ofElementary Science Education, 20, 35–48.
Hambleton, R. K., & Rodgers, H. J. (2004). Developing an item bias review form. ERIC Doc: ED398241.
Clearinghouse on Assessment and Evaluation. Retrieved April 29, 2009 from http://ericae.net/ft/
tamu/biaspub2.htm.
Hanuscin, D. L., & Lee, M. H. (2008). Using the learning cycle as a model for teaching the learning cycle
to preservice elementary teachers. Journal of Elementary Science Education, 20, 51–66.
Heywood, D. S. (2007). Problematizing science subject matter knowledge as a legitimate enterprise in
primary teacher education. Cambridge Journal of Education, 37, 519–542.
Howitt, C. (2007). Preservice elementary teachers’ perceptions of factors in a holistic methods course
influencing their confidence in teaching science. Research in Science Education, 37, 41–58.
Kang, N. (2007). Elementary teachers’ epistemological and ontological understanding of teaching for
conceptual learning. Journal of Research in Science Teaching, 44, 1292–1317.
Luera, G. R. (2005). What type and level of science content knowledge of elementary education students
affect their ability to construct an inquiry-based lesson. Journal of Elementary Science Education,17, 12–25.
Merrill, M. D., & Tennyson, R. (1994). Teaching concepts: An instructional design. Englewood Cliffs,
NJ: Educational Technology.
Mundry, S. (2005). Changing perspectives in professional development. Science Education, 14, 9–15.
National Research Council. (1996). National science education standards. Washington, DC: National
Academy Press.
Nunnally, J. (1967). Psychometric theory. New York, NY: McGraw-Hill.
Popham, W. J. (2008). Classroom assessment: What teachers need to know. Boston, MA: Pearson.
Sullivan, H., & Higgins, N. (1983). Teaching for competence. New York, NY: Teachers College Press.
U.S. Department of Education. (2000). Before it’s too late: A report to the nation from the nationalcommission on mathematics and science teaching for the 21st century. Washington, DC: National
Commission on Mathematics and Science Teaching for the 21st Century.
288 A. Byers et al.
123

U.S. Department of Education, & National Center for Education Statistics. (2009). Common core of data(CCD), State nonfiscal survey of public elementary/secondary education, 2000–2001 through 2005–
2006. Retrieved April 29, 2009 from http://nces.ed.gov/programs/digest/d07/tables/dt07_062.asp?
referrer=list.
Weiss, I. R., Banilower, E. R., McMahon, K. C., & Smith, S. P. (2001). Report of the 2000 nationalsurvey of science and mathematics education (No. REC-9814246). Chapel Hill, NC: Horizon
Research, Inc.
Wilson, S. M., Floden, R. E., & Ferrini-Mundy, J. (2002). Teacher preparation research: An insider’s
view from the outside. Journal of Teacher Education, 53, 190–204.
Developing a Web-Based Mechanism for Assessing 289
123