Determination of Multiple Trace Element Compositions in Thin (> 30 ?m) Layers of NIST SRM 614 and...
16
The chemical compositions of rock-forming minerals have been investigated to understand the chemical and physical processes related to rock formation and alteration. In situ trace element and isotopic Determination of Multiple Trace Element Compositions in Thin (< 30 µm) Layers of NIST SRM 614 and 616 Using Laser Ablation-Inductively Coupled Plasma-Mass Spectrometry (LA-ICP-MS) Vol. 29 — N° 1 p.107-122 To understand and/or avoid small-scale chemical heterogeneities within geological materials prepared as normal thin sections, in situ multiple trace element determination coupled with the simultaneous microscopic observation of the sample during analysis is preferable. We have examined fifty trace elements in thin (< 30 µm) layers of the NIST SRM 614 and 616 glass reference materials by LA-ICP-MS using different pit diameters and internal standard elements (Ca and Si). Compositional heterogeneities of Tl, Bi, As and Cd were found in NIST SRM 614 and 616 at the spatial resolution of ca. 100 µm. Except for these elements, the RSDs of six determinations for most elements were better than 10% in NIST SRM 614 when ablation diameters were > 50 µm. The measured concentrations for most elements in NIST SRM 614 and 616 agree with previous values in the literature at the 95% confidence level with the exception of W and Bi. New LA-ICP-MS data for K, As and Cd are also reported. The results support the view that the latest LA-ICP-MS is a powerful and flexible analytical technique for the determination of multiple ultra-trace element compositions in geological materials prepared as normal thin sections of the type that has been used for polarising optical microscopic observations since the end of the 19th century. Keywords: LA-ICP-MS, thin sections, trace elements, NIST SRM 614 and 616. Pour comprendre et/ou éviter les problèmes d’hétérogénéités à petite échelle existant dans les matériaux géologiques qui se présentent en lames minces, l'analyse multi-élémentaire des éléments en trace couplée à l'examen microscopique simultanée est une excellente solution. Nous avons analysé par LA-ICP-MS cinquante éléments dans des tranches fines (< 30 µm) des verres de référence NIST SRM 614 et 616, en utilisant des diamètres d'analyse variables et Ca et Si comme standards internes. Des hétérogénéités dans la répartition de Tl, Bi, As et Cd ont été observées dans NIST SRM 614 et 616 à une résolution spatiale de 100 µm. Mis à part ces éléments, les RSD obtenues sur six déterminations de tous ces éléments étaient meilleures que 10% dans NIST SRM 614 pour un diamètre d'impact > 50 µm. Les concentrations mesurées pour la plupart de ces éléments dans NIST SRM 614 et 616 concordent avec les valeurs publiées, avec un degré de confiance de 95%, à l'exception de W et Bi. De nouveaux résultats de K, As et Cd obtenus par LA-ICP-MS sont aussi présentés. Les résultats confirment que les dernières LA-ICP-MS sont des outils analytiques puissants et adaptés à l'étude de compositions multi-élémentaires (traces et ultra- traces) dans des matériaux géologiques préparés sous forme de lames minces de l'épaisseur classiquement utilisée en microscope polarisant depuis la fin du 19ème siècle. Mots-clés : LA-ICP-MS, lame mince, éléments en trace, NIST SRM 614 et 616. 107 03 05 Tomoaki Morishita (1)*, Yoshito Ishida (2), Shoji Arai (2) and Miki Shirasaka (2) (1) Graduate School of Natural Science and Technology, Kanazawa University, Kakuma, Kanazawa 920-1192, Japan (2) Department of Earth Sciences, Kanazawa University, Kakuma, Kanazawa 920-1192, Japan * Corresponding author. e-mail: [email protected] Received 02 Mar 04 — Accepted 16 Sep 04 GEOSTANDARDS and RESEARCH GEOANALYTICAL
-
Upload
kanazawa-u -
Category
Documents
-
view
1 -
download
0
Transcript of Determination of Multiple Trace Element Compositions in Thin (> 30 ?m) Layers of NIST SRM 614 and...
The chemical compositions of rock-forming mineralshave been investigated to understand the chemical
and physical processes related to rock formationand alteration. In situ trace element and isotopic
Determination of Multiple Trace Element Compositionsin Thin (< 30 µm) Layers of NIST SRM 614 and 616Using Laser Ablation-Inductively CoupledPlasma-Mass Spectrometry (LA-ICP-MS)
Vol. 29 — N° 1 p . 1 0 7 - 1 2 2
To understand and/or avoid small-scale chemicalheterogeneities within geological materials prepared as normal thin sections, in situ multipletrace element determination coupled with the simultaneous microscopic observation of the sampleduring analysis is preferable. We have examinedfifty trace elements in thin (< 30 µm) layers of theNIST SRM 614 and 616 glass reference materials byLA-ICP-MS using different pit diameters and internalstandard elements (Ca and Si). Compositional heterogeneities of Tl, Bi, As and Cd were found in NIST SRM 614 and 616 at the spatial resolutionof ca. 100 µm. Except for these elements, the RSDsof six determinations for most elements were betterthan 10% in NIST SRM 614 when ablation diameterswere > 50 µm. The measured concentrations formost elements in NIST SRM 614 and 616 agree with previous values in the literature at the 95%confidence level with the exception of W and Bi.New LA-ICP-MS data for K, As and Cd are alsoreported. The results support the view that the latestLA-ICP-MS is a powerful and flexible analyticaltechnique for the determination of multiple ultra-trace element compositions in geologicalmaterials prepared as normal thin sections of thetype that has been used for polarising opticalmicroscopic observations since the end of the 19th century.
Keywords: LA-ICP-MS, thin sections, trace elements,NIST SRM 614 and 616.
Pour comprendre et/ou éviter les problèmes d’hétérogénéités à petite échelle existant dans lesmatériaux géologiques qui se présentent en lamesminces, l'analyse multi-élémentaire des éléments entrace couplée à l'examen microscopique simultanéeest une excellente solution. Nous avons analysé parLA-ICP-MS cinquante éléments dans des tranchesfines (< 30 µm) des verres de référence NIST SRM614 et 616, en utilisant des diamètres d'analysevariables et Ca et Si comme standards internes. Deshétérogénéités dans la répartition de Tl, Bi, As et Cdont été observées dans NIST SRM 614 et 616 à unerésolution spatiale de 100 µm. Mis à part ces éléments, les RSD obtenues sur six déterminationsde tous ces éléments étaient meilleures que 10%dans NIST SRM 614 pour un diamètre d'impact > 50µm. Les concentrations mesurées pour la plupart deces éléments dans NIST SRM 614 et 616 concordentavec les valeurs publiées, avec un degré deconfiance de 95%, à l'exception de W et Bi. Denouveaux résultats de K, As et Cd obtenus par LA-ICP-MS sont aussi présentés. Les résultats confirment que les dernières LA-ICP-MS sont desoutils analytiques puissants et adaptés à l'étude de compositions multi-élémentaires (traces et ultra-traces) dans des matériaux géologiques préparéssous forme de lames minces de l'épaisseur classiquement utilisée en microscope polarisantdepuis la fin du 19ème siècle.
Mots-clés : LA-ICP-MS, lame mince, éléments en trace,NIST SRM 614 et 616.
1 0 7
0305
Tomoaki Morishita (1)*, Yoshito Ishida (2), Shoji Arai (2) and Miki Shirasaka (2)
(1) Graduate School of Natural Science and Technology, Kanazawa University, Kakuma, Kanazawa 920-1192, Japan(2) Department of Earth Sciences, Kanazawa University, Kakuma, Kanazawa 920-1192, Japan* Corresponding author. e-mail: [email protected]
Received 02 Mar 04 — Accepted 16 Sep 04
GEOSTANDARDS and
RESEARCHGEOANALYTICAL
compositions of minerals can provide fundamentalinformation to solve diverse geological problems. Oneof the best developed techniques for in situ trace ele-ment analysis is secondary ionisation mass spectrome-try (SIMS). In SIMS analysis, however, the analyticaltime is relatively long, and complex matrix-relatedinterference corrections are often required to obtainaccurate results. In the last decade, laser ablation-inductively coupled plasma-mass spectrometry (LA-ICP-MS) has emerged as a powerful and flexible analyticaltechnique for direct elemental and isotopic determina-tion of solid materials. Advantages of the LA-ICP-MStechnique include its rapidity, spectral simplicity andrelatively straightforward data reduction. LA-ICP-MS isthus becoming widely used for geological samples toyield large amounts of precise geochemical information.
A significant difference between SIMS and LA-ICP-MS is the volume of material sampled during an anal-ysis, with laser ablation consuming significantly morematerial than SIMS. This is particularly significant in thecontext of analysing geological material prepared inthe form of thin sections, which are only 30 µm thick.Optical microscope observation of thin sections permitsidentification of the minerals present, investigation oftheir textural relations and heterogeneity within grainssuch as zoning, exsolution and the presence of inclu-sions. When combined with capabilities for in situmicro-analysis this represents a powerful approach tounderstanding geological processes. Studies of theoptimisation of analytical conditions for the LA-ICP-MSof geological materials prepared as normal thin sec-tions have been limited (e.g., Jackson et al. 1992),because of the ease of penetrating such thin samplesby repetitive sampling with high powered lasers. LA-ICP-MS analyses have usually been applied to relati-vely thick sections or minerals mounted in an epoxydisk so that they can be ablated for the longer timesrequired to improve precision.
Trace elements in the NIST SRM glass referencematerials 614 and 616, which are synthetic silicateglasses with a nominal concentration of 1 µg g-1 and20 ng g-1 for sixty-one elements, respectively, are use-ful as reference materials for microbeam determina-tions of ultra-trace elements in geological materials aswell as for demonstrating the accuracy and precisionof determinations. However, there is little publisheddata for these materials, particularly NIST SRM 616.High laser pulse rates (e.g., 10 Hz) coupled with longablation times have usually been used for LA-ICP-MSanalysis of these materials (e.g., Horn et al. 1997,
Kurosawa et al. 2002, Gao et al. 2002). The latestgeneration of quadrupole ICP-MS instruments coupledwith a 193 nm excimer laser system offer lower back-grounds and higher sensitivity, and raise the possibilityof accomplishing quantitative analysis at ultra-tracelevels from small amounts of material.
In this study, we measured multiple trace elementscompositions covering the mass range from 7Li to 238Uin thin (< 30 µm thick) layers of the NIST SRM 614 and616 by LA-ICP-MS using different pit diameters. Theresults allowed us to examine the presence of localdepletion and/or enrichment of elements in NIST SRM614 and 616. These concentrations were comparedwith the previous values from the literature to evaluatethe ability to analyse trace element compositions fromsmall amounts of samples. New LA-ICP-MS data forCd, As and K in NIST SRM 614 are included in thedata presented here, noting that these are importantelements, especially in the environmental sciences.
Experimental
Instrumentation and operating conditions
Quartered NIST SRM glass wafers (614 and 616)were embedded in 25 mm diameter epoxy discs andwere polished using 1 µm diamond paste to producea flat, scratch-free surface that was suitable for anal-ysis. Determinations were performed at the IncubationBusiness Laboratory Centre of Kanazawa University,using a quadrupole ICP-MS (Agilent 7500s) equippedwith a commercially available laser-ablation system(MicroLas: GeoLas Q-Plus) (Ishida et al. 2004).
The GeoLas Q-Plus used an argon fluoride gasmixture to produce 193 nm laser light and was equip-ped with a beam homogeniser and aperture-imagingoptical system. The diameter of the ablation spot couldbe varied from 4 to 160 µm across, depending on thesize of the aperture used. In this study we used fourdifferent pit sizes (30, 50, 70 and 100 µm) for anal-ysis. Due to the homogeneous illumination of the aper-ture, the energy density on the sample surface wasconstant at all beam sizes, leading to the projection ofa flat top beam onto the sample surface. The laserfluence at the sample surface could be changed byvarying the discharge voltage of the laser and byusing a beam splitter, with accessible energy on thesample ranging up to 35 J cm-2. Craters on the surfaceof a normal slide glass used for thin section makingwere cut vertically through the centre after 500 and
1 0 8
GEOSTANDARDS and
RESEARCHGEOANALYTICAL

1000 pulses at an energy of 10 J cm-2 on the samplesurface and were then observed using an opticalmicroscope (Ishida et al. 2004). As a result, the rate ofmaterial removal was estimated to be approximately< 0.2 µm/pulse. Günther et al. (1997) suggested thatthe ablation rate with a 193 nm excimer laser systemis relatively matrix-independent when comparing theNIST SRM 612 and natural minerals. Therefore, 150pulses were selected for all the analyses in this study;i.e., 30 seconds were available for data acquisition ata laser pulse repetition rate of 5 Hz (Figure 1). Thedepth of the holes we drilled was simply confirmed byoptical microscope and was less than 30 µm.
The ablation cell used allowed a normal thinsection and two external reference glasses (e.g., NISTSRM 610 and 612) to be loaded and analysed in asingle uninterrupted session. In order to increase theefficiency of aerosol transport into the ICP-MS system(Bleiner and Günther 2001), the volume of the abla-tion cell was reduced (from ca. 38,000 mm3 to 5,600mm3) by an in-house constructed sample folder madeof acrylic resin and designed to fit the ablation cell. Ahigh-quality CCD camera and LCD monitors wereincorporated into the laser system and allowed bothtransmitted- and reflected-light viewing when sear-ching for points to be analysed.
All data were obtained by ablating in a He atmos-phere (ca. 0.2 l min-1) prior to combining with thedominant Ar carrier flow (ca. 1.2 l min-1). Helium wasused to minimise post-ablation surface condensationand to maximise sample transport efficiency into theICP (Eggins et al. 1998a, Günther and Heinrich 1999,
Ishida et al. 2004). Platinum sampler and skimmercones were used for all of the analyses. The operatingparameters of the instrumentation used in this studyare summarised in Table. 1.
We usually optimised the ICP-MS using a signalobtained from the ablation of NIST SRM 612 glass witha laser raster procedure to facilitate invariant signalintensities over the relatively long time used for tuningof instrumental conditions. Taking into account the massablation rate, instrument sensitivity was tuned to giveapproximately 4000 cps/µg g-1, 10000 cps/µg g-1
and 5000 cps/µg g-1 for 7Li, 89Y and 209Bi, respectively,when ablating a 70 µm circular spot at a laser pulserepetition rate of 5 Hz. 248ThO/232Th was maintainedbelow 0.5%, and other potentially interfering oxides
1 0 9
GEOSTANDARDS and
RESEARCHGEOANALYTICAL
10
100
1000
10000
0 20 40 60 80 100 120
Y89Pb208Th232U238
Laser-on Laser-off
Figure 1. Typical LA-ICP-MS
calibration spectra of 89Y, 208Pb,232Th and 238U showing intensity
(counts per second) vs time on
NIST SRM 614 glass using a 50
µm pit diameter. Backgrounds on
the dry plasma were collected for
50-60 seconds prior to ablating
for 30 seconds. Ablation was
stopped at about 90 seconds,
and the signal returned to
background levels after about
10 seconds.
Time (seconds)
Coun
ts p
er s
econ
d
Table 1.Typical operating conditions for the LA-ICP-MS method in this study
ICP-MSModel 7500s (Agilent)Forward power 1200 WReflected power 1 WCarrier gas flow 1.16 l min-1 (Ar)
0.2 l min-1 (He)Auxiliary gas flow 1.0 l min-1
Plasma gas flow 15 l min-1
Cones Pt sample conePt skimmer cone
LaserModel GeoLas Q+ (MicroLas)Wavelength 193 nm, ArFRepetition rate 5 HzEnergy density at target 10 J cm-2

1 1 0
GEOSTANDARDS and
RESEARCHGEOANALYTICAL
Table 2.Analyte elements, isotopes, dwell time per element, observed sensitivities, background countsrates and calculated detection limits (Ca-normalised) for LA-ICP-MS using different pit diameters
Element Isotope D.T. BG cps Sensitivity (cps/µg g-1) Detection limit (µg g-1)(ms)
(100) (70) (50) (30) (100) (70) (50) (30)
Li 7 25 300 8219 4238 2206 954 0.011 0.019 0.039 0.12
Be 9 50 20 1095 583 312 138 0.014 0.025 0.056 0.12
Mg 24 25 250 5804 3003 1566 683 0.013 0.027 0.42 0.14
Si 29 10 300000 169 87 46 21 51 83 167 480
K 39 25 150000 13752 6951 3628 1608 0.17 0.18 0.31 0.31
Ca 42 10 20000 114 59 31 14 11 20 50 127
Sc 45 25 2000 13023 6804 3612 1646 0.018 0.034 0.067 0.17
Ti 47 25 150 898 460 245 111 0.043 0.090 0.18 0.43
V 51 25 700 15180 7757 4080 1852 0.008 0.017 0.031 0.085
Cr 53 50 5000 1263 645 343 159 0.21 0.37 0.77 2.1
Mn 55 25 25000 15800 8073 4328 1952 0.061 0.13 0.20 0.47
Co 59 25 1300 12195 6129 3326 1502 0.017 0.033 0.049 0.14
Ni 60 25 150 2531 1286 707 321 0.027 0.050 0.084 0.21
Zn 66 25 200-1300 1307 691 401 187 0.070 0.12 0.35 1.1
Ga 69 25 200 11146 5684 3044 1374 0.007 0.013 0.025 0.062
Ge 72 25 2000 4208 2137 1157 523 0.053 0.10 0.18 0.51
As 75 50 350 1451 729 413 191 0.051 0.075 0.14 0.42
Rb 85 25 800 16248 8153 4363 1992 0.009 0.018 0.034 0.086
Sr 88 25 250 19958 10203 5404 2488 0.005 0.008 0.015 0.04
Y 89 25 20 18241 9430 5084 2412 0.001 0.002 0.004 0.011
Zr 90 25 20 9540 4960 2682 1270 0.002 0.004 0.006 0.020
Nb 93 25 20 17784 9086 4918 2293 0.001 0.002 0.004 0.010
Mo 95 25 25 2968 1487 815 370 0.008 0.018 0.031 0.074
Cd 111 50 100 956 512 295 146 0.037 0.068 0.12 0.28
In 115 25 25 18827 9444 5228 2333 0.001 0.003 0.005 0.014
Sn 118 25 100 5383 2795 1458 543 0.010 0.021 0.038 0.091
Sb 121 25 125 4686 2529 1344 506 0.013 0.025 0.046 0.11
Cs 133 25 100 22516 11632 6170 2314 0.005 0.009 0.014 0.038
Ba 137 50 25 2605 1357 720 266 0.013 0.012 0.024 0.19
La 139 25 20 20092 10610 5720 2155 0.001 0.002 0.004 0.010
Ce 140 25 20 21643 11267 5972 2237 0.001 0.002 0.003 0.010
Pr 141 25 20 24307 12798 6749 2558 0.001 0.002 0.003 0.008
Nd 146 50 20 3760 2003 1056 407 0.004 0.008 0.015 0.039
Sm 147 50 20 3084 1650 864 333 0.006 0.011 0.017 0.041
Eu 153 25 20 11836 6334 3329 1255 0.002 0.004 0.007 0.017
Gd 157 50 20 2798 1524 802 313 0.006 0.011 0.019 0.048
Tb 159 25 25 18818 10220 5389 2077 0.001 0.002 0.004 0.010
Dy 163 50 25 4216 2298 1206 472 0.005 0.008 0.015 0.037
Ho 165 25 25 16701 9107 4820 1853 0.002 0.003 0.006 0.014
Er 166 50 25 5609 3059 1623 623 0.003 0.006 0.011 0.027
Tm 169 25 25 16609 9117 4853 1829 0.002 0.003 0.005 0.011
Yb 172 50 25 3527 1937 1024 395 0.005 0.008 0.016 0.050
Lu 175 25 25 14681 8077 4300 1666 0.002 0.003 0.006 0.013
Hf 178 25 25 4423 2418 1300 494 0.005 0.010 0.019 0.045
Ta 181 25 20 12798 6966 3692 1424 0.002 0.004 0.007 0.017
W 182 25 25 3294 1756 934 347 0.007 0.012 0.027 0.062
Tl 205 50 45 9090 5026 2593 1018 0.003 0.006 0.010 0.063
Pb 208 25 90 6276 3431 1829 689 0.007 0.016 0.028 0.068
Bi 209 25 40 11710 6437 3461 1294 0.003 0.005 0.010 0.025
Th 232 25 40 9769 5414 2947 1128 0.003 0.005 0.009 0.14
U 238 25 30 11490 6305 3395 1277 0.003 0.004 0.008 0.021
D.T. dwell time. BG background count. Number in parenthesis pit diameter (µm).

were assumed to be negligible, based on the relativeease of Th oxide production (Leichte et al. 1987).
Analytical elements and data reduction
Dwell time and the number of elements to be deter-mined are important parameters in optimising dataacquisition procedures (Günther et al. 1999). Data werecollected by peak hopping in time-resolved mode tomonitor possible compositional heterogeneities. We chosedwell times of 10 ms for internal standard elements (i.e.,29Si and 42Ca) and 25 or 50 ms for other elementsdepending on sensitivity and relative isotope abundance(settling time is approximately 1.8 ms; Table 2). In practice,about thirty isotopes covering light to heavy masseswere flexibly selected for determination depending onthe analytical objectives. In order to resolve chemicalheterogeneity effects in samples, the shortest sweep timeis required. In order to reduce sweep time (< 1000 ms),the isotopes were divided into two groups based onmass number (7Li to 115In and 118Sn to 238U). The sameanalytical conditions were used for these two sets.
All signal intensities were corrected for the back-ground signal obtained from measurement of a gasblank for 50-60 seconds prior to initiating ablation(Figure 1). Typical sensitivity and gas blank for eachelement are given in Table 2. The reason is not clearfor the wide range of background count rates for Zn(200-1300 cps). After the end of the ablation period,the signal usually returned to the background levelafter 10 seconds (Figure 1). Total analysis time wasthus 120 seconds per spot including backgrounds andwashout of the sample prior to the next analysis.
Data reduction followed a protocol essentiallyidentical to that outlined by Longerich et al. (1996).
The use of internal standards produces a much morerobust calibration method by allowing a correction tobe applied for di f fer ing ablat ion yields betweensample and reference material. Previous studies haveindicated that the ablation rate with excimer systems isrelatively matrix-insensitive when comparing NIST SRM612 and minerals (hornblende, augite and garnet;Günther et al. 1997). Compositions of minerals, cali-brated against NIST SRM 612 or 610 using a majorelement as an internal standard, agreed well withindependent data obtained by other methods despitethe very considerable difference in matrix between theNIST SRM glasses and the samples (Jackson et al.1992, Fedorowich et al. 1995, Ludden et al. 1995,Norman et al. 1996, 1998, Günther et al. 1997, Egginset al. 1998b). Both 42Ca and 29Si were used as inter-nal standards to correct for variations in the absoluteamount of material that was ablated and transportedduring analysis. Major element compositions of NISTSRM 614 and 616 were determined using a JEOL JXA-8800 Superprobe at the Centre for Cooperat iveResearch of Kanazawa University (Table 3). The externalcalibration sample was the NIST SRM 612 referencematerial. Many investigations have concluded that theNIST SRM glasses are essentially homogeneous inmajor and trace elements (Si, Al, Ca, Na, Rb, Cs, Sr,Ba, Sc, Y, REE, Ti, Zr, Hf, Nb, Ta, Pb, Th and U), but com-positional heterogeneity problems have been reportedfor some elements (Hinton et al. 1995, Norman et al.1996, Rocholl et al. 1997, Kane 1998, Hinton 1999,Sylvester and Eggins 1997, Eggins and Shelley 2002).In this study, the elemental concentrations of NIST SRM612 used for calibration were selected from the prefer-red values of Pearce et al. (1997), because these datahave been widely used in the external calibration ofmany LA-ICP-MS analyses of NIST SRM glasses as wellas geological materials (e.g., Horn et al. 1997, Mason
1 1 1
GEOSTANDARDS and
RESEARCHGEOANALYTICAL
Table 3.Major element compositions (% m/m) of NIST SRM 614 and 616 determined by EPMA
NIST SRM 614 n = 22 NIST SRM 616 n = 20average sd average sd
SiO2 71.83 0.44 72.35 0.23Al2O3 1.95 0.03 1.95 0.03CaO 11.71 0.08 11.75 0.09Na2O 13.78 0.08 13.84 0.15total 99.27 0.48 99.89 0.35
Major element compositions were determiend using a JEOL JXA-8800 microprobe at the Cooperative Centre of Kanazawa University. The analyses were performed under an accelerating volatage of 15 kV and a beam current of 15 nA using 30 µm diameter beam. JEOL software using ZAF corrections was employed. No loss of Na was observed during the analysis under these analytical conditions.n number of analyses. sd one standard deviation.
1 1 2
GEOSTANDARDS and
RESEARCHGEOANALYTICAL
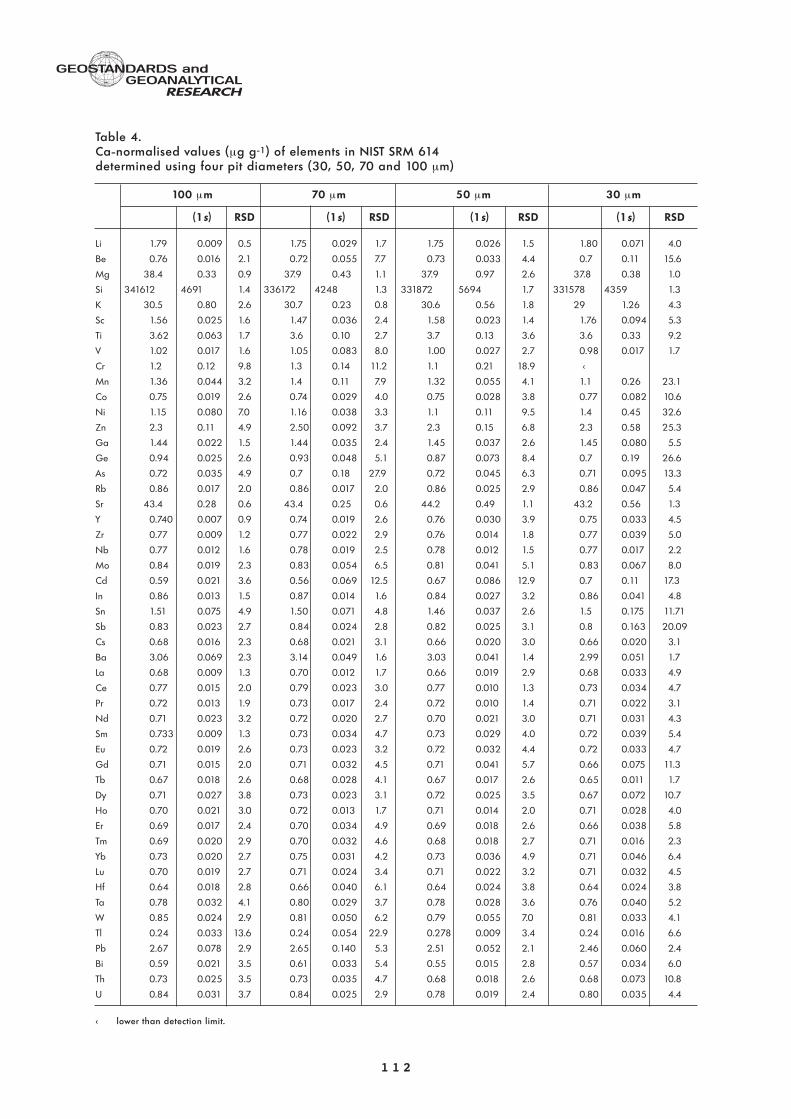
Table 4.Ca-normalised values (µg g-1) of elements in NIST SRM 614determined using four pit diameters (30, 50, 70 and 100 µm)
100 µm 70 µm 50 µm 30 µm
(1s) RSD (1s) RSD (1s) RSD (1s) RSD
Li 1.79 0.009 0.5 1.75 0.029 1.7 1.75 0.026 1.5 1.80 0.071 4.0
Be 0.76 0.016 2.1 0.72 0.055 7.7 0.73 0.033 4.4 0.7 0.11 15.6
Mg 38.4 0.33 0.9 37.9 0.43 1.1 37.9 0.97 2.6 37.8 0.38 1.0
Si 341612 4691 1.4 336172 4248 1.3 331872 5694 1.7 331578 4359 1.3
K 30.5 0.80 2.6 30.7 0.23 0.8 30.6 0.56 1.8 29 1.26 4.3
Sc 1.56 0.025 1.6 1.47 0.036 2.4 1.58 0.023 1.4 1.76 0.094 5.3
Ti 3.62 0.063 1.7 3.6 0.10 2.7 3.7 0.13 3.6 3.6 0.33 9.2
V 1.02 0.017 1.6 1.05 0.083 8.0 1.00 0.027 2.7 0.98 0.017 1.7
Cr 1.2 0.12 9.8 1.3 0.14 11.2 1.1 0.21 18.9 <
Mn 1.36 0.044 3.2 1.4 0.11 7.9 1.32 0.055 4.1 1.1 0.26 23.1
Co 0.75 0.019 2.6 0.74 0.029 4.0 0.75 0.028 3.8 0.77 0.082 10.6
Ni 1.15 0.080 7.0 1.16 0.038 3.3 1.1 0.11 9.5 1.4 0.45 32.6
Zn 2.3 0.11 4.9 2.50 0.092 3.7 2.3 0.15 6.8 2.3 0.58 25.3
Ga 1.44 0.022 1.5 1.44 0.035 2.4 1.45 0.037 2.6 1.45 0.080 5.5
Ge 0.94 0.025 2.6 0.93 0.048 5.1 0.87 0.073 8.4 0.7 0.19 26.6
As 0.72 0.035 4.9 0.7 0.18 27.9 0.72 0.045 6.3 0.71 0.095 13.3
Rb 0.86 0.017 2.0 0.86 0.017 2.0 0.86 0.025 2.9 0.86 0.047 5.4
Sr 43.4 0.28 0.6 43.4 0.25 0.6 44.2 0.49 1.1 43.2 0.56 1.3
Y 0.740 0.007 0.9 0.74 0.019 2.6 0.76 0.030 3.9 0.75 0.033 4.5
Zr 0.77 0.009 1.2 0.77 0.022 2.9 0.76 0.014 1.8 0.77 0.039 5.0
Nb 0.77 0.012 1.6 0.78 0.019 2.5 0.78 0.012 1.5 0.77 0.017 2.2
Mo 0.84 0.019 2.3 0.83 0.054 6.5 0.81 0.041 5.1 0.83 0.067 8.0
Cd 0.59 0.021 3.6 0.56 0.069 12.5 0.67 0.086 12.9 0.7 0.11 17.3
In 0.86 0.013 1.5 0.87 0.014 1.6 0.84 0.027 3.2 0.86 0.041 4.8
Sn 1.51 0.075 4.9 1.50 0.071 4.8 1.46 0.037 2.6 1.5 0.175 11.71
Sb 0.83 0.023 2.7 0.84 0.024 2.8 0.82 0.025 3.1 0.8 0.163 20.09
Cs 0.68 0.016 2.3 0.68 0.021 3.1 0.66 0.020 3.0 0.66 0.020 3.1
Ba 3.06 0.069 2.3 3.14 0.049 1.6 3.03 0.041 1.4 2.99 0.051 1.7
La 0.68 0.009 1.3 0.70 0.012 1.7 0.66 0.019 2.9 0.68 0.033 4.9
Ce 0.77 0.015 2.0 0.79 0.023 3.0 0.77 0.010 1.3 0.73 0.034 4.7
Pr 0.72 0.013 1.9 0.73 0.017 2.4 0.72 0.010 1.4 0.71 0.022 3.1
Nd 0.71 0.023 3.2 0.72 0.020 2.7 0.70 0.021 3.0 0.71 0.031 4.3
Sm 0.733 0.009 1.3 0.73 0.034 4.7 0.73 0.029 4.0 0.72 0.039 5.4
Eu 0.72 0.019 2.6 0.73 0.023 3.2 0.72 0.032 4.4 0.72 0.033 4.7
Gd 0.71 0.015 2.0 0.71 0.032 4.5 0.71 0.041 5.7 0.66 0.075 11.3
Tb 0.67 0.018 2.6 0.68 0.028 4.1 0.67 0.017 2.6 0.65 0.011 1.7
Dy 0.71 0.027 3.8 0.73 0.023 3.1 0.72 0.025 3.5 0.67 0.072 10.7
Ho 0.70 0.021 3.0 0.72 0.013 1.7 0.71 0.014 2.0 0.71 0.028 4.0
Er 0.69 0.017 2.4 0.70 0.034 4.9 0.69 0.018 2.6 0.66 0.038 5.8
Tm 0.69 0.020 2.9 0.70 0.032 4.6 0.68 0.018 2.7 0.71 0.016 2.3
Yb 0.73 0.020 2.7 0.75 0.031 4.2 0.73 0.036 4.9 0.71 0.046 6.4
Lu 0.70 0.019 2.7 0.71 0.024 3.4 0.71 0.022 3.2 0.71 0.032 4.5
Hf 0.64 0.018 2.8 0.66 0.040 6.1 0.64 0.024 3.8 0.64 0.024 3.8
Ta 0.78 0.032 4.1 0.80 0.029 3.7 0.78 0.028 3.6 0.76 0.040 5.2
W 0.85 0.024 2.9 0.81 0.050 6.2 0.79 0.055 7.0 0.81 0.033 4.1
Tl 0.24 0.033 13.6 0.24 0.054 22.9 0.278 0.009 3.4 0.24 0.016 6.6
Pb 2.67 0.078 2.9 2.65 0.140 5.3 2.51 0.052 2.1 2.46 0.060 2.4
Bi 0.59 0.021 3.5 0.61 0.033 5.4 0.55 0.015 2.8 0.57 0.034 6.0
Th 0.73 0.025 3.5 0.73 0.035 4.7 0.68 0.018 2.6 0.68 0.073 10.8
U 0.84 0.031 3.7 0.84 0.025 2.9 0.78 0.019 2.4 0.80 0.035 4.4
< lower than detection limit.
et al. 1999, Kurosawa et al. 2002). Furthermore, 42Castandardised intensities of elements in NIST SRM 612were stable during laser sampling and nearly identi-cal across all analytical points measured in this study.An additional drift correction was applied to unk-nowns, which were bracketed between NIST SRM 612calibrations, assuming a linear variation in measuredinternal standard intensity ratios through the analysissequence.
Results
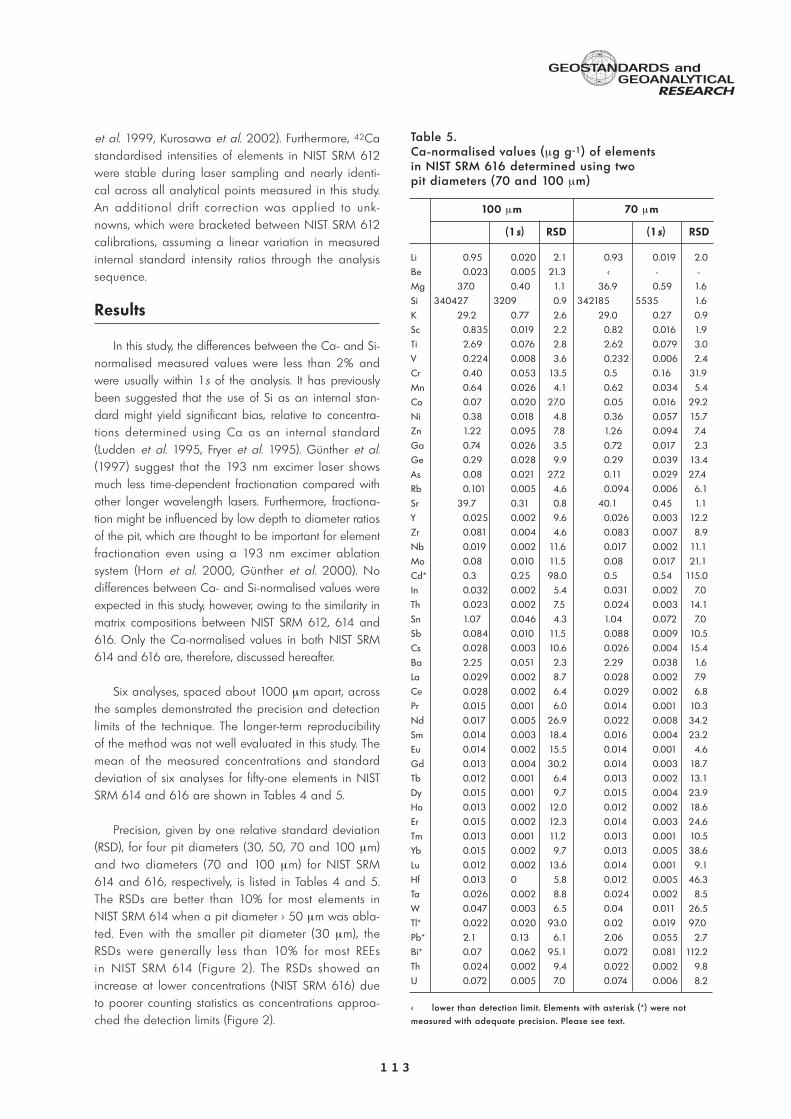
In this study, the differences between the Ca- and Si-normalised measured values were less than 2% andwere usually within 1s of the analysis. It has previouslybeen suggested that the use of Si as an internal stan-dard might yield significant bias, relative to concentra-tions determined using Ca as an internal standard(Ludden et al. 1995, Fryer et al. 1995). Günther et al.(1997) suggest that the 193 nm excimer laser showsmuch less time-dependent fractionation compared withother longer wavelength lasers. Furthermore, fractiona-tion might be influenced by low depth to diameter ratiosof the pit, which are thought to be important for elementfractionation even using a 193 nm excimer ablationsystem (Horn et al. 2000, Günther et al. 2000). Nodifferences between Ca- and Si-normalised values wereexpected in this study, however, owing to the similarity inmatrix compositions between NIST SRM 612, 614 and616. Only the Ca-normalised values in both NIST SRM614 and 616 are, therefore, discussed hereafter.
Six analyses, spaced about 1000 µm apart, acrossthe samples demonstrated the precision and detectionlimits of the technique. The longer-term reproducibilityof the method was not well evaluated in this study. Themean of the measured concentrations and standarddeviation of six analyses for fifty-one elements in NISTSRM 614 and 616 are shown in Tables 4 and 5.
Precision, given by one relative standard deviation(RSD), for four pit diameters (30, 50, 70 and 100 µm)and two diameters (70 and 100 µm) for NIST SRM614 and 616, respectively, is listed in Tables 4 and 5.The RSDs are better than 10% for most elements inNIST SRM 614 when a pit diameter > 50 µm was abla-ted. Even with the smaller pit diameter (30 µm), theRSDs were generally less than 10% for most REEsin NIST SRM 614 (Figure 2). The RSDs showed anincrease at lower concentrations (NIST SRM 616) dueto poorer counting statistics as concentrations approa-ched the detection limits (Figure 2).
1 1 3
GEOSTANDARDS and
RESEARCHGEOANALYTICAL
Table 5.Ca-normalised values (µg g-1) of elementsin NIST SRM 616 determined using two pit diameters (70 and 100 µm)
100 µm 70 µm
(1s) RSD (1s) RSD
Li 0.95 0.020 2.1 0.93 0.019 2.0
Be 0.023 0.005 21.3 < - -
Mg 37.0 0.40 1.1 36.9 0.59 1.6
Si 340427 3209 0.9 342185 5535 1.6
K 29.2 0.77 2.6 29.0 0.27 0.9
Sc 0.835 0.019 2.2 0.82 0.016 1.9
Ti 2.69 0.076 2.8 2.62 0.079 3.0
V 0.224 0.008 3.6 0.232 0.006 2.4
Cr 0.40 0.053 13.5 0.5 0.16 31.9
Mn 0.64 0.026 4.1 0.62 0.034 5.4
Co 0.07 0.020 27.0 0.05 0.016 29.2
Ni 0.38 0.018 4.8 0.36 0.057 15.7
Zn 1.22 0.095 7.8 1.26 0.094 7.4
Ga 0.74 0.026 3.5 0.72 0.017 2.3
Ge 0.29 0.028 9.9 0.29 0.039 13.4
As 0.08 0.021 27.2 0.11 0.029 27.4
Rb 0.101 0.005 4.6 0.094 0.006 6.1
Sr 39.7 0.31 0.8 40.1 0.45 1.1
Y 0.025 0.002 9.6 0.026 0.003 12.2
Zr 0.081 0.004 4.6 0.083 0.007 8.9
Nb 0.019 0.002 11.6 0.017 0.002 11.1
Mo 0.08 0.010 11.5 0.08 0.017 21.1
Cd* 0.3 0.25 98.0 0.5 0.54 115.0
In 0.032 0.002 5.4 0.031 0.002 7.0
Th 0.023 0.002 7.5 0.024 0.003 14.1
Sn 1.07 0.046 4.3 1.04 0.072 7.0
Sb 0.084 0.010 11.5 0.088 0.009 10.5
Cs 0.028 0.003 10.6 0.026 0.004 15.4
Ba 2.25 0.051 2.3 2.29 0.038 1.6
La 0.029 0.002 8.7 0.028 0.002 7.9
Ce 0.028 0.002 6.4 0.029 0.002 6.8
Pr 0.015 0.001 6.0 0.014 0.001 10.3
Nd 0.017 0.005 26.9 0.022 0.008 34.2
Sm 0.014 0.003 18.4 0.016 0.004 23.2
Eu 0.014 0.002 15.5 0.014 0.001 4.6
Gd 0.013 0.004 30.2 0.014 0.003 18.7
Tb 0.012 0.001 6.4 0.013 0.002 13.1
Dy 0.015 0.001 9.7 0.015 0.004 23.9
Ho 0.013 0.002 12.0 0.012 0.002 18.6
Er 0.015 0.002 12.3 0.014 0.003 24.6
Tm 0.013 0.001 11.2 0.013 0.001 10.5
Yb 0.015 0.002 9.7 0.013 0.005 38.6
Lu 0.012 0.002 13.6 0.014 0.001 9.1
Hf 0.013 0 5.8 0.012 0.005 46.3
Ta 0.026 0.002 8.8 0.024 0.002 8.5
W 0.047 0.003 6.5 0.04 0.011 26.5
Tl* 0.022 0.020 93.0 0.02 0.019 97.0
Pb* 2.1 0.13 6.1 2.06 0.055 2.7
Bi* 0.07 0.062 95.1 0.072 0.081 112.2
Th 0.024 0.002 9.4 0.022 0.002 9.8
U 0.072 0.005 7.0 0.074 0.006 8.2
< lower than detection limit. Elements with asterisk (*) were not measured with adequate precision. Please see text.

1 1 4
GEOSTANDARDS and
RESEARCHGEOANALYTICAL
0.1
1
10
100
LiBe
MgSi
KCa
ScTi
VCrMnCo
NiZnGaGe
AsRb
SrYZrNb
MoCd
InSn
SbCs
BaLa
CePr
NdSm
EuGd
TbDy
HoErTm
YbLuHf
TaW
TlPb
BiTh
U
0.1
1
10
100
LiBe
MgSi
KCa
ScTi
VCrMnCo
NiZnGaGe
AsRb
SrYZrNb
MoCd
InSn
SbCs
BaLa
CePr
NdSm
EuGd
TbDy
HoErTm
YbLuHf
TaW
TlPb
BiTh
U
NIST SRM 614
NIST SRM 616
100 µm 70 µm 50 µm 30 µm
Figure 2. Relative standard deviations
(RSD) of the Ca-normalised measured
values determined for different pit
diameters in NIST SRM 614 and 616.
Rela
tive
sta
nda
rd d
evia
tion
(%)
Rela
tive
sta
nda
rd d
evia
tion
(%)
Rela
tive
dev
iatio
n (%
)Re
lativ
e d
evia
tion
(%)
-40
-20
0
20
40
LiBeMg
SiKSc
TiVCrMn
CoNi
ZnGa
GeAs
RbSr
YZrNbMo
CdIn
SnSb
CsBa
LaCe
PrNd
SmEuGd
TbDyHo
ErTm
YbLu
HfTa
WTl
PbBi
ThU
70/10050/10030/100
-40
-20
0
20
40
LiBeMg
SiKSc
TiVCrMn
CoNi
ZnGa
GeAs
RbSr
YZrNbMo
CdIn
SnSb
CsBa
LaCe
PrNd
SmEuGd
TbDyHo
ErTm
YbLu
HfTa
WTl
PbBi
ThU
NIST SRM 614
NIST SRM 616
Figure 3. Relative deviations of the
Ca-normalised measured values
determined by small pit diameters
from the Ca-normalised measured
values determined by 100 µm pit
diameter in NIST SRM 614 and 616.
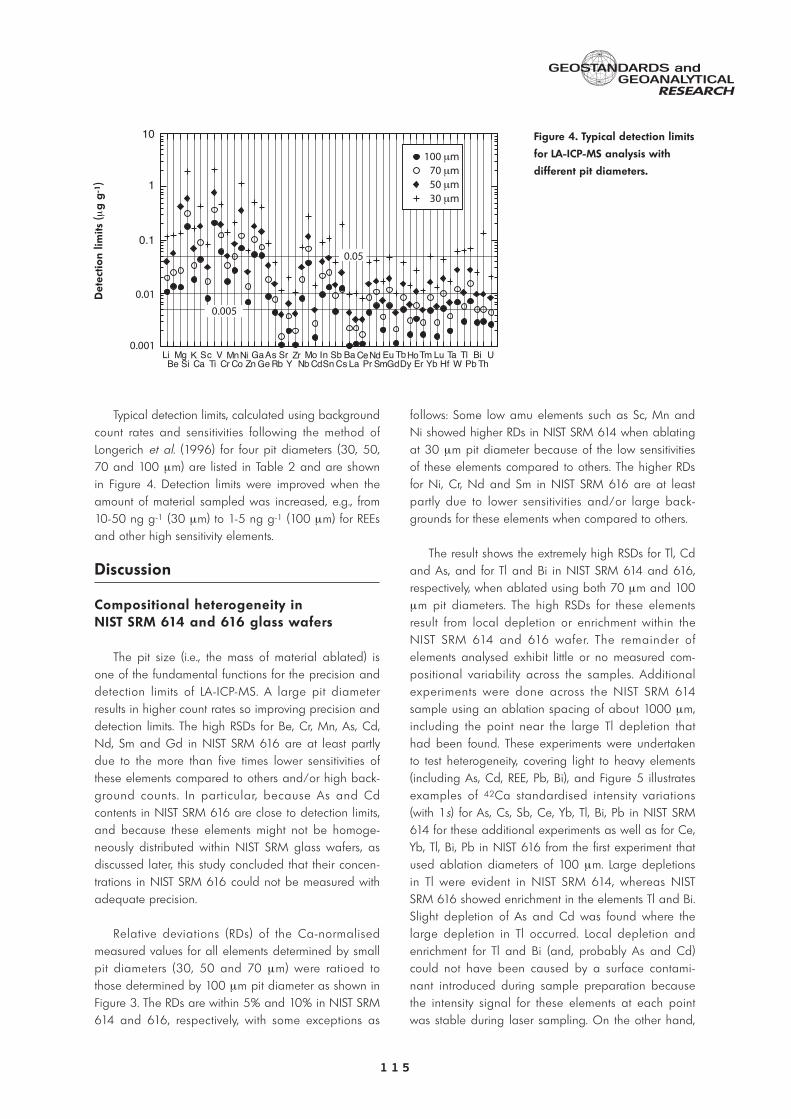
Typical detection limits, calculated using backgroundcount rates and sensitivities following the method ofLongerich et al. (1996) for four pit diameters (30, 50,70 and 100 µm) are listed in Table 2 and are shownin Figure 4. Detection limits were improved when theamount of material sampled was increased, e.g., from10-50 ng g-1 (30 µm) to 1-5 ng g-1 (100 µm) for REEsand other high sensitivity elements.
Discussion
Compositional heterogeneity inNIST SRM 614 and 616 glass wafers
The pit size (i.e., the mass of material ablated) isone of the fundamental functions for the precision anddetection limits of LA-ICP-MS. A large pit diameterresults in higher count rates so improving precision anddetection limits. The high RSDs for Be, Cr, Mn, As, Cd,Nd, Sm and Gd in NIST SRM 616 are at least partlydue to the more than five times lower sensitivities ofthese elements compared to others and/or high back-ground counts . In part icular, because As and Cdcontents in NIST SRM 616 are close to detection limits,and because these elements might not be homoge-neously distributed within NIST SRM glass wafers, asdiscussed later, this study concluded that their concen-trations in NIST SRM 616 could not be measured withadequate precision.
Relative deviations (RDs) of the Ca-normalisedmeasured values for all elements determined by smallpit diameters (30, 50 and 70 µm) were ratioed tothose determined by 100 µm pit diameter as shown inFigure 3. The RDs are within 5% and 10% in NIST SRM614 and 616, respectively, with some exceptions as
follows: Some low amu elements such as Sc, Mn andNi showed higher RDs in NIST SRM 614 when ablatingat 30 µm pit diameter because of the low sensitivitiesof these elements compared to others. The higher RDsfor Ni, Cr, Nd and Sm in NIST SRM 616 are at leastpartly due to lower sensitivities and/or large back-grounds for these elements when compared to others.
The result shows the extremely high RSDs for Tl, Cdand As, and for Tl and Bi in NIST SRM 614 and 616,respectively, when ablated using both 70 µm and 100µm pit diameters. The high RSDs for these elementsresult from local depletion or enrichment within theNIST SRM 614 and 616 wafer. The remainder ofelements analysed exhibit little or no measured com-positional variability across the samples. Additionalexperiments were done across the NIST SRM 614sample using an ablation spacing of about 1000 µm,including the point near the large Tl depletion thathad been found. These experiments were undertakento test heterogeneity, covering light to heavy elements(including As, Cd, REE, Pb, Bi), and Figure 5 illustratesexamples of 42Ca standardised intensity variations(with 1s) for As, Cs, Sb, Ce, Yb, Tl, Bi, Pb in NIST SRM614 for these additional experiments as well as for Ce,Yb, Tl, Bi, Pb in NIST 616 from the first experiment thatused ablation diameters of 100 µm. Large depletionsin Tl were evident in NIST SRM 614, whereas NISTSRM 616 showed enrichment in the elements Tl and Bi.Slight depletion of As and Cd was found where thelarge depletion in Tl occurred. Local depletion andenrichment for Tl and Bi (and, probably As and Cd)could not have been caused by a surface contami-nant introduced during sample preparation becausethe intensity signal for these elements at each pointwas stable during laser sampling. On the other hand,
1 1 5
GEOSTANDARDS and
RESEARCHGEOANALYTICAL
0.01
10
1
0.1
0.001
0.05
0.005
100 µm70 µm50 µm30 µm
LiBe
MgSi
KCa
ScTi
VCr
MnCo
NiZn
GaGe
AsRb
SrY
ZrNb
MoCd
InSn
SbCs
BaLa
CePr
NdSm
EuGd
TbDy
HoEr
TmYb
LuHf
TaW
TlPb
BiTh
U
Figure 4. Typical detection limits
for LA-ICP-MS analysis with
different pit diameters.
Det
ectio
n lim
its (µ
g g
-1)

high counts in Pb were observed at some analyticalpoints. In this case, high Pb counts could be attributednot only necessari ly to heterogeneity but also tosurface contamination during sample preparation.Aside from the elevated readings relative to otherpoints, observed high count rates of Pb at the begin-ning of laser sampling suggest surface contamination.
Eggins and Shelley (2002) carefully examinedcompositional heterogeneity of many trace elements inNIST SRM glasses and concluded that all NIST SRM610-617 wafers contain domains that are significantlydepleted in Ag, As, Au, B, Bi, Cd, Cr, Cs, Mo, Pb, Re,Sb, Se, Te, Tl and W within individual glass wafers. Ourresults are consistent with their data and support theobservation that variations in the intensity of Tl is anexcellent marker for the possible presence of localdepletion and/or enrichments that affect other elements
in NIST SRM 614 glass wafers as suggested by Egginsand Shelley (2002).
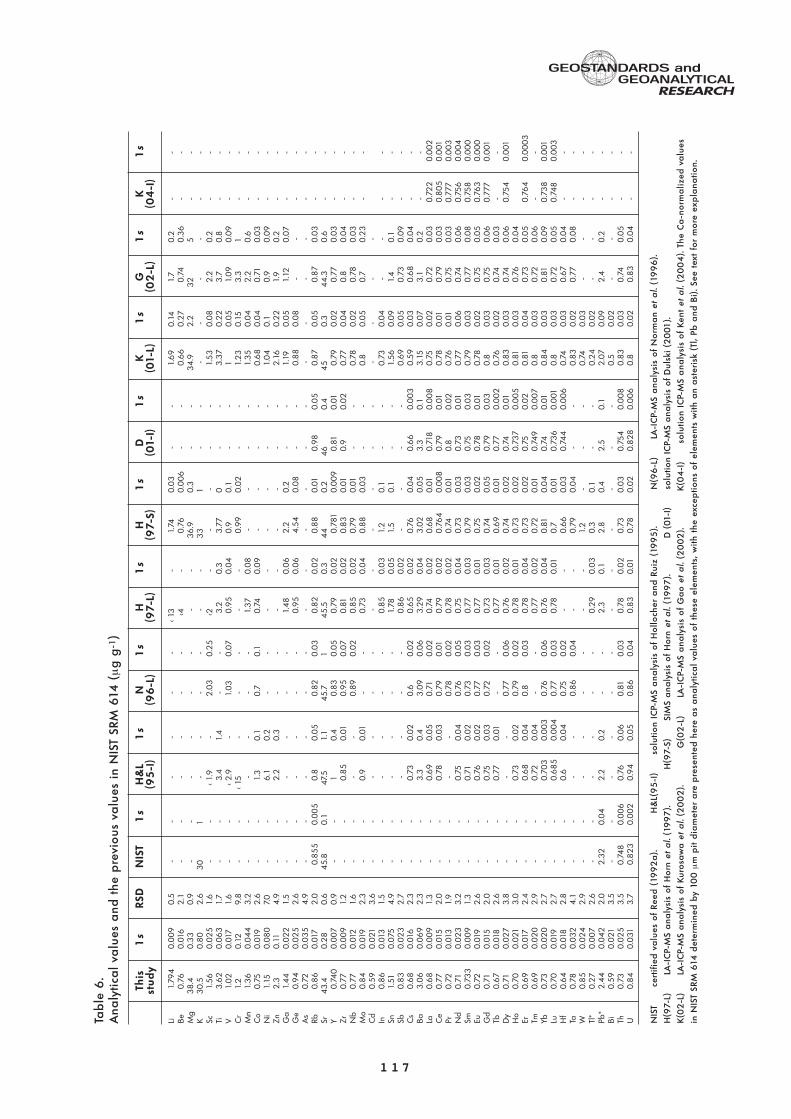
Comparison of the measured values in thisstudy with previous values in the literature
Presented in this paper are forty-nine and forty-seven analytical values for NIST SRM 614 and 616(Tables 6 and 7), respectively, based on the experi-mental results described above. The Ca-normalisedvalues in both NIST SRM 614 and 616 determinedusing a 100 µm pit diameter are presented here asanalytical values for elements, with the exceptions ofPb and Tl for NIST SRM 614 and Pb, Tl and Bi forNIST SRM 616. Due to the relatively high Pb contentsat some points in the first experiment (probably due tocomposit ional heterogeneity coupled with surfacecontamination as suggested above) Pb contents in
1 1 6
GEOSTANDARDS and
RESEARCHGEOANALYTICAL
Figure 5. Ca-normalised intensity of selected trace elements measured at about 1 mm spacing across quartered
samples of NIST SRM 614 and 616. Individual determination error bars are ± 1 standard deviations about the mean
value calculated for each analytical point. A large depletion of Tl and a large enrichment of Tl and Bi occurs in NIST
SRM 614 and 616, respectively, which are clearly heterogeneously distributed in this wafer. Several other elements
such as As and Cd in NIST SRM 614 and Pb in NIST SRM 616 displayed possible subtle compositional heterogeneities.
See text for details.
Inte
nsity
ra
tio (e
lem
ent/
42Ca
)
Inte
nsity
ra
tio (e
lem
ent/
42Ca
)
0.005
0.01
0.015
0.02
0.025
0.02
0.03
0.04
0.25
0.3
Pb
0.035
0.04
0.045
0.05
0.055
Yb
0.15
0.2
0.25
A B C D E F
0.004
0.006
0.008
Cd
0.05
0.06
Sb
0.08
0.1
0.12
0.14
Bi
As
A B C D E F
NIST SRM 614
Tl
Ce
0.002
0.004
0.006
0.008
0.01
Ce
0.002
0.004
0.006
0.008
Tl
0.12
0.13
0.14
0.15
0.16
Pb
0
0.01
0.02
AA BB CC DD EE FF
Bi
NIST SRM 616
1 1 7
GEOSTANDARDS and
RESEARCHGEOANALYTICAL
Tab
le 6
.A
naly
tica
l va
lues
and
the
pre
viou
s va
lues
in
NIS
T SR
M 6
14 (
µg
g-1
)
This
1s
RSD
NIS
T1
sH
&L
1s
N1
sH
1s
H1
sD
1s
K1
sG
1s
K1
sst
udy
(95
-I)
(96
-L)
(97-
L)(9
7-S)
(01-
I)(0
1-L)
(02
-L)
(04
-I)
Li1.
794
0
.00
9
0.5
-
--
--
-< 1
3-
1.74
0.0
3-
-1.
69
0.1
41.
70
.2-
-Be
0.7
6
0.0
16
2.1
-
--
--
-<4
-0
.76
0.0
06
--
0.6
60
.27
0.7
40
.36
--
Mg
38
.4
0.3
3
0.9
-
--
--
--
-3
6.9
0.3
--
34
.92
.23
25
--
K3
0.5
0
.80
2
.6
30
1
-
--
--
-3
31
--
--
--
--
Sc1.
56
0
.02
5
1.6
-
-< 1
.9-
2.0
30
.25
<2-
--
--
1.5
30
.08
2.2
0.2
--
Ti3
.62
0
.06
3
1.7
-
-3
.4
1.4
-
-3
.20
.33
.77
0-
-3
.37
0.2
23
.70
.8-
-V
1.0
2
0.0
17
1.6
-
-< 2
.9-
1.0
30
.07
0.9
50
.04
0.9
0.1
--
10
.05
1.0
90
.09
--
Cr
1.2
0
.12
9
.8
--
< 15
--
--
-0
.99
0.0
2-
-1.
23
0.1
53
.31
--
Mn
1.3
6
0.0
44
3
.2
--
--
--
1.3
70
.08
--
--
1.3
50
.04
2.2
0.6
--
Co
0.7
5
0.0
19
2.6
-
-1.
3
0.1
0
.70
.10
.74
0.0
9-
--
-0
.68
0.0
40
.71
0.0
3-
-N
i1.
15
0.0
80
7.
0
--
6.1
0
.2
--
--
--
--
1.0
40
.10
.90
.09
--
Zn2
.3
0.1
1
4.9
-
-2
.2
0.3
-
--
--
--
-2
.16
0.2
21.
90
.2-
-G
a1.
44
0
.02
2
1.5
-
--
--
-1.
48
0.0
62
.20
.2-
-1.
190
.05
1.12
0.0
7-
-G
e0
.94
0
.02
5
2.6
-
--
--
-0
.95
0.0
64
.54
0.0
8-
-0
.88
0.0
8-
--
-A
s0
.72
0
.03
5
4.9
--
--
--
--
--
--
--
--
--
Rb0
.86
0
.017
2
.0
0.8
55
0
.00
5
0.8
0
.05
0
.82
0.0
30
.82
0.0
20
.88
0.0
10
.98
0.0
50
.87
0.0
50
.87
0.0
3-
-Sr
43
.4
0.2
8
0.6
4
5.8
0
.1
47.5
1.
1
45
.71
45
.50
.34
40
.24
60
.44
50
.34
4.3
0.6
--
Y0
.74
0
0.0
07
0
.9
--
1
0.4
0
.83
0.0
50
.79
0.0
20
.781
0.0
09
0.8
10
.01
0.7
90
.02
0.7
70
.03
--
Zr0
.77
0
.00
9
1.2
-
-0
.85
0
.01
0
.95
0.0
70
.81
0.0
20
.83
0.0
10
.90
.02
0.7
70
.04
0.8
0.0
4-
-N
b0
.77
0
.012
1.
6
--
--
0.8
90
.02
0.8
50
.02
0.7
90
.01
--
0.7
80
.02
0.7
80
.03
--
Mo
0.8
4
0.0
19
2.3
-
-0
.9
0.0
1
--
0.7
30
.04
0.8
80
.03
--
0.8
0.0
50
.70
.23
--
Cd
0.5
9
0.0
21
3.6
-
--
--
--
--
--
--
--
-In
0.8
6
0.0
13
1.5
-
--
--
-0
.85
0.0
31.
20
.1-
-0
.73
0.0
4-
--
-Sn
1.51
0
.075
4
.9
--
--
--
1.78
0.0
51.
50
.1-
-1.
56
0.0
91.
40
.1-
-Sb
0.8
3
0.0
23
2
.7
--
--
--
0.8
60
.02
--
--
0.6
90
.05
0.7
30
.09
--
Cs
0.6
8
0.0
16
2.3
-
-0
.73
0
.02
0
.60
.02
0.6
50
.02
0.7
60
.04
0.6
60
.00
30
.59
0.0
30
.68
0.0
4-
-Ba
3.0
6
0.0
69
2
.3
--
3.3
0
.4
3.0
90
.06
3.2
90
.04
3.0
20
.05
3.3
0.1
3.1
50
.07
3.1
0.2
--
La0
.68
0
.00
9
1.3
-
-0
.69
0
.05
0
.71
0.0
20
.74
0.0
20
.68
0.0
10
.718
0.0
08
0.7
50
.02
0.7
20
.03
0.7
22
0.0
02
C
e0
.77
0
.015
2
.0
--
0.7
8
0.0
3
0.7
90
.01
0.7
90
.02
0.7
64
0.0
08
0.7
90
.01
0.7
80
.01
0.7
90
.03
0.8
05
0.0
01
Pr0
.72
0
.013
1.
9
--
--
0.7
80
.02
0.7
80
.02
0.7
40
.01
0.8
0.0
20
.76
0.0
10
.75
0.0
30
.777
0.0
03
N
d0
.71
0
.02
3
3.2
-
-0
.75
0
.04
0
.76
0.0
50
.75
0.0
40
.73
0.0
30
.73
0.0
10
.77
0.0
60
.74
0.0
60
.75
60
.00
4
Sm0
.73
3
0.0
09
1.
3
--
0.7
1
0.0
2
0.7
30
.03
0.7
70
.03
0.7
90
.03
0.7
50
.03
0.7
90
.03
0.7
70
.08
0.7
58
0.0
00
Eu
0.7
2
0.0
19
2.6
-
-0
.76
0
.02
0
.77
0.0
30
.77
0.0
10
.75
0.0
20
.78
0.0
10
.78
0.0
20
.75
0.0
50
.76
30
.00
0
Gd
0.7
1
0.0
15
2.0
-
-0
.75
0
.03
0
.72
0.0
20
.73
0.0
30
.74
0.0
50
.79
0.0
30
.80
.03
0.7
50
.06
0.7
770
.001
Tb
0.6
7
0.0
18
2.6
-
-0
.77
0
.01
-
-0
.77
0.0
10
.69
0.0
10
.77
0.0
02
0.7
60
.02
0.7
40
.03
--
Dy
0.7
1
0.0
27
3
.8
--
--
0.7
70
.06
0.7
60
.02
0.7
40
.02
0.7
40
.01
0.8
30
.03
0.7
40
.06
0.7
54
0.0
01
Ho
0.7
0
0.0
21
3.0
-
-0
.73
0
.02
0
.79
0.0
20
.78
0.0
10
.73
0.0
20
.73
70
.00
50
.81
0.0
30
.76
0.0
4Er
0.6
9
0.0
17
2.4
-
-0
.68
0
.04
0
.80
.03
0.7
80
.04
0.7
30
.02
0.7
50
.02
0.8
10
.04
0.7
30
.05
0.7
64
0.0
00
3
Tm0
.69
0
.02
0
2.9
-
-0
.72
0
.04
-
-0
.77
0.0
20
.72
0.0
10
.74
90
.00
70
.80
.03
0.7
20
.06
--
Yb0
.73
0
.02
0
2.7
-
-0
.70
3
0.0
03
0
.76
0.0
60
.76
0.0
40
.81
0.0
40
.74
0.0
10
.84
0.0
30
.81
0.0
90
.73
80
.001
Lu
0.7
0
0.0
19
2.7
-
-0
.68
5
0.0
04
0
.77
0.0
30
.78
0.0
10
.70
.01
0.7
36
0.0
010
.80
.03
0.7
20
.05
0.7
48
0.0
03
H
f0
.64
0
.018
2
.8
--
0.6
0
.04
0
.75
0.0
2-
-0
.66
0.0
30
.74
40
.00
60
.74
0.0
30
.67
0.0
4-
-Ta
0.7
8
0.0
32
4
.1
--
--
0.8
60
.04
--
0.7
90
.04
--
0.8
30
.02
0.7
70
.08
--
W0
.85
0
.02
4
2.9
-
--
--
--
-1.
2-
--
0.7
40
.03
--
--
Tl*
0.2
7
0.0
07
2
.6
--
--
--
0.2
90
.03
0.3
0.1
--
0.2
40
.02
--
--
Pb*
2.4
4
0.0
42
2
.0
2.3
2
0.0
4
2.2
0
.2
--
2.3
0.1
2.8
0.4
2.5
0.1
2.0
70
.09
2.4
0.2
--
Bi0
.59
0
.021
3
.5
--
--
--
--
--
--
0.5
0.0
2-
--
-Th
0.7
3
0.0
25
3
.5
0.7
48
0
.00
6
0.7
6
0.0
6
0.8
10
.03
0.7
80
.02
0.7
30
.03
0.7
54
0.0
08
0.8
30
.03
0.7
40
.05
--
U0
.84
0
.031
3
.7
0.8
23
0
.00
2
0.9
4
0.0
5
0.8
60
.04
0.8
30
.01
0.7
80
.02
0.8
28
0.0
06
0.8
0.0
20
.83
0.0
4-
-
NIS
T
c
ertif
ied
va
lues
of
Reed
(19
92
a).
H
&L(
95
-I)
sol
utio
n IC
P-M
S a
naly
sis
of H
ollo
cher
and
Rui
z (1
99
5).
N
(96
-L)
LA
-IC
P-M
S a
naly
sis
of N
orm
an
et a
l.(1
99
6).
H(9
7-L)
LA
-IC
P-M
S a
naly
sis
of H
orn
et a
l.(1
99
7).
H
(97-
S)
SIM
S a
naly
sis
of H
orn
et a
l.(1
99
7).
D
(01
-I)
sol
utio
n IC
P-M
S a
naly
sis
of D
ulsk
i (2
001
).K
(02
-L)
LA
-IC
P-M
S a
naly
sis
of K
uros
aw
a e
t a
l.(2
00
2).
G
(02
-L)
LA
-IC
P-M
S a
naly
sis
of G
ao
et a
l.(2
00
2).
K
(04
-I)
sol
utio
n IC
P-M
S a
naly
sis
of K
ent
et a
l.(2
00
4).
The
Ca
-nor
ma
lized
va
lues
in N
IST
SRM
614
det
erm
ined
by
100
µm
pit
dia
met
er a
re p
rese
nted
her
e a
s a
naly
tica
l va
lues
of
thes
e el
emen
ts,
with
the
exc
eptio
ns o
f el
emen
ts w
ith a
n a
ster
isk
(Tl,
Pb a
nd B
i). S
ee t
ext
for
mor
e ex
pla
natio
n.

NIST SRM 614 and 616 were analysed two moretimes on different dates. Lead contents in both NISTSRM 614 and 616 from the first experiments (2.67± 0.078 (1s) µg g-1 and 2.1 ± 0.12 (1s) µg g-1,respec t ively ) are s l ight ly but s igni f icant ly higherthan those from the latter two additional measure-ments (2.45 ± 0.044 (1s) and 2.42 ± 0.035 (1s)µg g-1 for NIST SRM 614, and 1.93 ± 0.045 (1s)and 1.91 ± 0.045 (1s) µg g-1 for NIST SRM 616).By contrast, other elements (such as REE) are basi-cally identical to those in the f irst experiment asdescribed later. The Pb values presented in Tables6 and 7 are the average of the two latter measure-ments. Thallium in NIST SRM 614, and Tl and Bi inNIST SRM 616 were recalculated from the selecteddata that showed no local depletion or enrichmentof these elements.
The measured values of forty-seven elements inNIST SRM 614 are compared to the certified valuesf rom NIST (Reed 1992a) , LA - ICP-MS analy s i s o fNorman et al. (1996), Kurosawa et al. (2002) andGao et al. (2003), both SIMS and LA-ICP-MS analysesof Horn et al. (1997), and solution ICP-MS analysis ofHollocher and Ruiz (1995), Dulski (2001) and Kent(2004). The measured concentrations in NIST SRM 614are consistent with previously reported values to within10% relative and/or do not differ significantly from theprevious values at the 95% confidence level except forsome elements as follows (Figure 6). Gao et al. (2002)suggested that further work was required to characteriseSc, Cr, Mn and Ni in NIST SRM 614. Our data forthese elements are in agreement with the results ofHorn et al. (1997) and Kurosawa et al. (2002) within2s errors (95% confidence level). Horn et al. (1997)
1 1 8
GEOSTANDARDS and
RESEARCHGEOANALYTICAL
Figure 6. Relative deviation (RD)
of the measured values in NIST
SRM 614 (upper panel) and 616
(lower panel) from previous
values of NIST (Reed 1992a, b),
LA-ICP-MS analysis of Norman
et al. (1996), Kurosawa et al.
(2002) and Gao et al. (2002),
SIMS and LA-ICP-MS analysis
of Horn et al. (1997), and
solution-ICP-MS analysis of
Hollocher and Ruiz (1995),
Dulski (2001) and Kent et al.
(2004). RD of Ni in NIST SRM
614 from the value of Hollocher
and Ruiz (1995) is -81%. RDs of
Co and Zr in NIST SRM 616 from
the values of Kurosawa et al.
(2002) are 130% and 110%,
respectively. RDs of Ge and In
in NIST SRM 616 from the SIMS
values of Horn et al. (1997) are
93% and 83%, respectively.
These elements plot out of the
range of the figure.
Rela
tive
dev
iatio
n (%
)Re
lativ
e d
evia
tion
(%)
-80
-60
-40
-20
0
20
40
60
80
LiBeMg
KSc
TiVCr
MnCo
NiZn
GaGe
RbSr
YZrNb
MoInSn
SbCs
BaLa
CePr
NdSm
EuGd
TbDy
HoEr
TmYb
LuHf
TaW
TlPb
BiTh
U
NIST (Reed, 92)Hollocher and Ruiz (95)Norman et al. (96)Horn et al. (97 LA-ICP-MS)Horn et al. (97 SIMS)
Dulski (01)Kurosawa et al. (02)Gao et al. (02)Kent et al. (04)
-80
-60
-40
-20
0
20
40
60
80
LiBe
MgKSc
TiVCrMn
CoNi
ZnGa
GeRb
SrYZr
NbMo
InSn
SbCs
BaLa
CePrNdSm
EuGd
TbDy
HoErTm
YbLu
HfTa
WTlPb
BiTh
U
NIST SRM 614
NIST SRM 616
1 1 9
GEOSTANDARDS and
RESEARCHGEOANALYTICAL
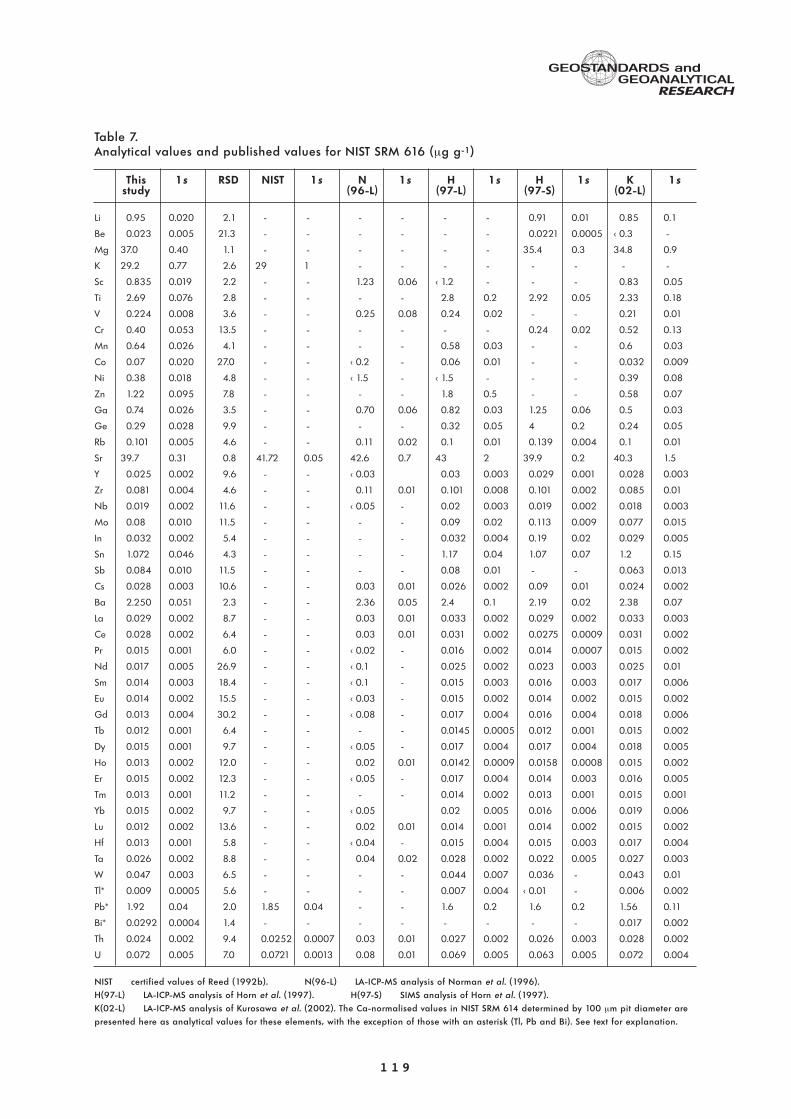
Table 7.Analytical values and published values for NIST SRM 616 (µg g-1)
This 1s RSD NIST 1s N 1s H 1s H 1s K 1sstudy (96-L) (97-L) (97-S) (02-L)
Li 0.95 0.020 2.1 - - - - - - 0.91 0.01 0.85 0.1
Be 0.023 0.005 21.3 - - - - - - 0.0221 0.0005 < 0.3 -
Mg 37.0 0.40 1.1 - - - - - - 35.4 0.3 34.8 0.9
K 29.2 0.77 2.6 29 1 - - - - - - - -
Sc 0.835 0.019 2.2 - - 1.23 0.06 < 1.2 - - - 0.83 0.05
Ti 2.69 0.076 2.8 - - - - 2.8 0.2 2.92 0.05 2.33 0.18
V 0.224 0.008 3.6 - - 0.25 0.08 0.24 0.02 - - 0.21 0.01
Cr 0.40 0.053 13.5 - - - - - - 0.24 0.02 0.52 0.13
Mn 0.64 0.026 4.1 - - - - 0.58 0.03 - - 0.6 0.03
Co 0.07 0.020 27.0 - - < 0.2 - 0.06 0.01 - - 0.032 0.009
Ni 0.38 0.018 4.8 - - < 1.5 - < 1.5 - - - 0.39 0.08
Zn 1.22 0.095 7.8 - - - - 1.8 0.5 - - 0.58 0.07
Ga 0.74 0.026 3.5 - - 0.70 0.06 0.82 0.03 1.25 0.06 0.5 0.03
Ge 0.29 0.028 9.9 - - - - 0.32 0.05 4 0.2 0.24 0.05
Rb 0.101 0.005 4.6 - - 0.11 0.02 0.1 0.01 0.139 0.004 0.1 0.01
Sr 39.7 0.31 0.8 41.72 0.05 42.6 0.7 43 2 39.9 0.2 40.3 1.5
Y 0.025 0.002 9.6 - - < 0.03 0.03 0.003 0.029 0.001 0.028 0.003
Zr 0.081 0.004 4.6 - - 0.11 0.01 0.101 0.008 0.101 0.002 0.085 0.01
Nb 0.019 0.002 11.6 - - < 0.05 - 0.02 0.003 0.019 0.002 0.018 0.003
Mo 0.08 0.010 11.5 - - - - 0.09 0.02 0.113 0.009 0.077 0.015
In 0.032 0.002 5.4 - - - - 0.032 0.004 0.19 0.02 0.029 0.005
Sn 1.072 0.046 4.3 - - - - 1.17 0.04 1.07 0.07 1.2 0.15
Sb 0.084 0.010 11.5 - - - - 0.08 0.01 - - 0.063 0.013
Cs 0.028 0.003 10.6 - - 0.03 0.01 0.026 0.002 0.09 0.01 0.024 0.002
Ba 2.250 0.051 2.3 - - 2.36 0.05 2.4 0.1 2.19 0.02 2.38 0.07
La 0.029 0.002 8.7 - - 0.03 0.01 0.033 0.002 0.029 0.002 0.033 0.003
Ce 0.028 0.002 6.4 - - 0.03 0.01 0.031 0.002 0.0275 0.0009 0.031 0.002
Pr 0.015 0.001 6.0 - - < 0.02 - 0.016 0.002 0.014 0.0007 0.015 0.002
Nd 0.017 0.005 26.9 - - < 0.1 - 0.025 0.002 0.023 0.003 0.025 0.01
Sm 0.014 0.003 18.4 - - < 0.1 - 0.015 0.003 0.016 0.003 0.017 0.006
Eu 0.014 0.002 15.5 - - < 0.03 - 0.015 0.002 0.014 0.002 0.015 0.002
Gd 0.013 0.004 30.2 - - < 0.08 - 0.017 0.004 0.016 0.004 0.018 0.006
Tb 0.012 0.001 6.4 - - - - 0.0145 0.0005 0.012 0.001 0.015 0.002
Dy 0.015 0.001 9.7 - - < 0.05 - 0.017 0.004 0.017 0.004 0.018 0.005
Ho 0.013 0.002 12.0 - - 0.02 0.01 0.0142 0.0009 0.0158 0.0008 0.015 0.002
Er 0.015 0.002 12.3 - - < 0.05 - 0.017 0.004 0.014 0.003 0.016 0.005
Tm 0.013 0.001 11.2 - - - - 0.014 0.002 0.013 0.001 0.015 0.001
Yb 0.015 0.002 9.7 - - < 0.05 0.02 0.005 0.016 0.006 0.019 0.006
Lu 0.012 0.002 13.6 - - 0.02 0.01 0.014 0.001 0.014 0.002 0.015 0.002
Hf 0.013 0.001 5.8 - - < 0.04 - 0.015 0.004 0.015 0.003 0.017 0.004
Ta 0.026 0.002 8.8 - - 0.04 0.02 0.028 0.002 0.022 0.005 0.027 0.003
W 0.047 0.003 6.5 - - - - 0.044 0.007 0.036 - 0.043 0.01
Tl* 0.009 0.0005 5.6 - - - - 0.007 0.004 < 0.01 - 0.006 0.002
Pb* 1.92 0.04 2.0 1.85 0.04 - - 1.6 0.2 1.6 0.2 1.56 0.11
Bi* 0.0292 0.0004 1.4 - - - - - - - - 0.017 0.002
Th 0.024 0.002 9.4 0.0252 0.0007 0.03 0.01 0.027 0.002 0.026 0.003 0.028 0.002
U 0.072 0.005 7.0 0.0721 0.0013 0.08 0.01 0.069 0.005 0.063 0.005 0.072 0.004
NIST certified values of Reed (1992b). N(96-L) LA-ICP-MS analysis of Norman et al. (1996).H(97-L) LA-ICP-MS analysis of Horn et al. (1997). H(97-S) SIMS analysis of Horn et al. (1997).K(02-L) LA-ICP-MS analysis of Kurosawa et al. (2002). The Ca-normalised values in NIST SRM 614 determined by 100 µm pit diameter arepresented here as analytical values for these elements, with the exception of those with an asterisk (Tl, Pb and Bi). See text for explanation.
suggested that there is a significant difference in theresults for In, Cs, Ga and Ge between SIMS andLA-ICP-MS because the behaviour of these elementsduring laser ablation differs significantly from Ca, theinternal standard (elemental fractionation). The measu-red value for Zr presented here tends to be lower thanthe previous values but agrees with the SIMS data ofHorn et al. (1997) and LA-ICP-MS data of Kurosawa etal. (2002) and Gao et al. (2002) at the 95% confidencelevel. The measured value for W (0.85 ± 0.024 (1s)µg g-1) is lower than the SIMS value (1.2 µg g-1) of Hornet al. (1997) but higher than the previous value (0.74 ±0.03 (1s) µg g-1) of Kurosawa et al. (2002). The measu-red value for Bi is higher than the previous value ofKurosawa et al. (2002). Tungsten and Bi contents in NISTSRM 614 were measured twice on different dates, andthe results were 0.808 ± 0.041 (1s) and 0.805 ± 0.034(1s) µg g-1 for W, and 0.58 ± 0.015 (1s) and 0.570 ±0.006 (1s) µg g-1 for Bi. These data are in agreementwith the presented data at the 95% confidence level.
Previous studies on NIST SRM 616 are very limited(LA - ICP-MS analys is of Norman et al . 1996 andKurosawa et al. 2002; SIMS and LA-ICP-MS analyses ofHorn et al. 1997). The measured concentrations in NISTSRM 616 are in agreement with previously reportedvalues of Horn et al. (1997) and Kurosawa et al. (2002)to within 20% relative, which means no significant diffe-rences from the previous values at the 95% confidencelevel, with some exceptions as follows (Figure 6). The highRDs for Ga, Ge, Cs and In from SIMS values of Horn et al.(1997) are probably due to the differences in the beha-viour of elemental fractionation between SIMS and LA-ICP-MS as suggested above. Cobalt and Zn are 130 and110% higher than those of Kurosawa et al. (2002), res-pectively, but are in good agreement with LA-ICP-MSvalues of Horn et al. (1997) at the 95% confidence level.Bismuth is 72% higher than that of Kurosawa et al. (2002).
The measured values of REE, particularly heavy REEcontents in both NIST SRM 614 and 616, are slightlylower than the previous values, although some of thesedata are in agreement with them at the 95% confidencelevel as suggested above. Measurements from twoadditional determinations of all REEs on different datesyielded values that are in good agreement with thepresent data (e.g., 0.73 ± 0.02 (1s), 0.71 ± 0.02 (1s)and 0.73 ± 0.015 (1s) µg g-1 for Yb in NIST SRM 614,and 0.015 ± 0.002 (1s), 0.014 ± 0.003 (1s) and 0.015± 0.002 (1s) µg g-1 for Yb in NIST SRM 616). The rea-sons for the correspondingly low value for HREE in thisstudy are, therefore, not immediately apparent.
Evaluation of new data for K,As and Cd in NIST SRM 614
New LA-ICP-MS data for K, As and Cd in NIST SRM614 are evaluated here. The measured value of K inNIST SRM 614 (30.5 ± 0.80 (1s) µg g-1) is almost thesame as that in NIST SRM 616 (29.2 ± 0.77 (1s) µg g-1),which is in agreement with the certified value of K forNIST SRM 616 (29 ± 1 (1s) µg g-1, Reed 1992b).Although there are potential isobaric overlaps and tai-lings from 39Ar and 40Ar on 39K, Ar isotopes are not aserious problem when measuring these glasses. NISTSRM 614 and 616 were prepared by diluting a traceelement-spiked base glass (batch 95 GCF) with baseglass components (Eggins and Shelley 2002). Egginsand Shelley (2002) suggested that K appears to beseriously contaminated and overabundant in the NISTSRM glasses series by ~ 30 µg g-1. The value of K inboth the NIST SRM 614 and 616 glasses measured heresuggests that the base glass contains ca. 30 µg g-1 K.
Arsenic and Cd are representative of those ele-ments showing heterogeneous distributions in all NISTSRM glasses (Eggins and Shelley 2002 and this study).Special attention should be given to abnormalities inthe spot analyses of As and Cd when using NIST SRMglasses as reference samples. In this study, the RDs ofAs and Cd contents used for the calculation of analyt-ical values were better than 5% and 3%, respectively.Furthermore, these values (0.72 ± 0.035 (1s) and 0.59± 0.021 (1s) µg g-1 for As and Cd, respectively) areconsistent with those determined using a 70 µm pitdiameter (0.7 ± 0.18 (1s) µg g-1 and 0.56 ± 0.069(1s) µg g-1 for As and Cd, respectively) as well as thosedetermined in another experiment (0.72 ± 0.030 (1s)µg g-1 and 0.57 ± 0.017 (1s) µg g-1 for As and Cd,respectively). Such consistency therefore implies that Asand Cd in the homogeneous region of NIST SRM 614were measured with adequate precision.
Conclusions
To apply in situ trace element analysis for geologi-cal materials prepared as normal thin sections, weexamined forty-nine trace elements determined in thin(< 30 µm) layers of the NIST SRM 614 and 616 glassreference materials by LA-ICP-MS using different pitdiameters as well as two internal standard elements(Ca and Si).
Local depletions or enrichments in Tl, Bi, Cd and As(probably Pb also) were found both in NIST SRM 614
1 2 0
GEOSTANDARDS and
RESEARCHGEOANALYTICAL

and 616 at the spatial resolution used in this study (ca.100 µm pit diameter).
The RSDs of six determinations were better than10% for most elements in NIST SRM 614 when abla-ting > 50 µm. The measured concentrations in NISTSRM 614 and 616 generally agree with the previousvalues at the 95% confidence level except for someelements. Scandium, Cr, Mn and Ni in NIST SRM 614were in good agreement with the results of Horn et al.(1997) and Kurosawa et al. (2002) when compared atthe 95% confidence level. The measured values for Wand Bi were different from the previous values in theliterature. Cobalt and Zn in NIST SRM 616 were inagreement with LA-ICP-MS values of Horn et al. (1997)at the 95% confidence level. New LA-ICP-MS data forAs, Cd and K in relatively homogeneous regions ofNIST SRM 614 were 0.72 ± 0.035 (1s), 0.59 ± 0.021(1s) and 30.5 ± 0.80 (1s) µg g-1, respectively.
Acknowledgements
We wish to acknowledge the support from the 21stCentury COE project (led by K. Hayakawa) and theIncubation Business Laboratory Centre of KanazawaUniversity. Takafumi Hirata is thanked for his encoura-gement at the beginning of this study. We thank KazueTazaki for EPMA analysis and Eric Suello Andal forsome grammatical comments in the manuscript. T.M.thanks Mike Shelley, Steve Eggins and Charlotte Allenfor thei r technical advice and hospi ta l i t y at theResearch School of Earth Sciences of the AustralianNational University. The constructive reviews of threeanonymous reviewers much improved the manuscript.
References
Bleiner D. and Günther D. (2001)Theoretical description and experimental observation ofaerosol transport processes in laser ablation inductivelycoupled-mass spectrometry. Journal of Analytical AtomicSpectrometry, 16, 449-456.
Dulski P. (2001)Reference materials for geochemical studies: New analytical data by ICP-MS and critical discussion of reference values. Geostandards Newsletter: The Journalof Geostandards and Geoanalysis, 25, 87-125.
Eggins S.M., Kinsley L.K. and Shelley J.M.G. (1998a)Deposition and element fractionation processes duringatmospheric pressure laser sampling for analysis by ICP-MS. Applied Surface Science, 127-129, 278-286.
Eggins S.M., Rudnick R.L. and McDonough W.F. (1998b)The composition of peridotites and their minerals: A laser-ablation ICP-MS study. Earth and Planetary ScienceLetters, 154, 53-71.
Eggins S.M. and Shelley J.M.G. (2002)Compositional heterogeneity in NIST SRM 610-617glasses. Geostandards Newsletter: The Journal ofGeostandards and Geoanalysis, 26, 269-286.
Fedorowich J.S., Jain J.C. and Kerrich R. (1995)Trace-element analysis of garnet by laser-ablation microprobe ICP-MS. The Canadian Mineralogist, 33,469-480.
Fryer B.J., Jackson S.E. and Longerich H.P. (1995)The design, operation and role of the laser-ablationmicroprobe coupled with an inductively coupled plasma-mass spectrometer (LAM-ICP-MS) in the Earth sciences.The Canadian Mineralogist, 33, 303-312.
Gao S., Liu X., Yuan H., Hattendorf B., Günther D.,Chen L. and Hu S. (2002)Determination of forty two major and trace elements inUSGS and NIST SRM glasses by laser ablation-inductivelycoupled plasma-mass spectrometry. GeostandardsNewsletter: The Journal of Geostandards andGeoanalysis, 26, 181-196.
Günther D., Frischknechet R., Heinrich C.A. andKahlert H.-J. (1997)Capabilities of an argon fluoride 193 nm excimer laserfor laser ablation inductively coupled plasma-mass spectrometry microanalysis of geological materials.Journal of Analytical Atomic Spectrometry, 12, 939-944.
Günther D. and Heinrich C.A. (1999)Comparison of the ablation behaviour of 266 nm Nd:YAG and 193 nm ArF excimer lasers for LA-ICP-MS analysis. Journal of Analytical Atomic Spectrometry, 14,1369-1374.
Günther D., Jackson S.E. and Longerich H.P. (1999)Laser ablation and arc/spark solid sample introductioninto inductively coupled plasma-mass spectrometers.Spectrochimica Acta Part B, 54, 381-409.
Günther D., Horn I. and Hattendorf B. (2000)Recent trends and developments in laser ablation-ICP-mass spectrometry. Fresenius’ Journal ofAnalytical Chemistry, 368, 4-14.
Hinton R.W. (1999)NIST SRM 610, 611 and SRM 612, 613 multi-elementglasses: Constraints from element abundance ratios measured by microprobe techniques. GeostandardsNewsletter: The Journal of Geostandards andGeoanalysis, 23, 197-207.
Hinton R.W., Harte B. and Witt-Eickschen G. (1995)Ion probe measurements of National Institute ofStandards and Technology standard reference materialSRM 610 glass: Trace elements. The Analyst, 120, 1315-1319.
1 2 1
GEOSTANDARDS and
RESEARCHGEOANALYTICAL
references
Hollocher K. and Ruiz J. (1995)Major and trace element determinations on NIST glassstandard materials 611, 612, 614 and 1834 by inductivelycoupled plasma-mass spectrometry. GeostandardsNewsletter, 19, 27-34.
Horn I., Rudnick R.L. and McDonough W.F. (2000)Precise elemental and isotope ratio determination bysimultaneous solution nebulization and laser ablation-ICP-MS: Application to U-Pb geochronology.Chemical Geology, 164, 281-301.
Horn I., Hinton R.W., Jackson S.E. and Longerich H.P. (1997)Ultra-trace element analysis of NIST SRM 616 and 614using laser ablation microprobe-inductively coupled plasma mass spectrometry (LAM-ICP-MS): A comparisonwith secondary ion mass spectrometry (SIMS).Geostandards Newsletter: The Journal of Geostandardsand Geoanalysis, 21, 191-203.
Houk R.S. (1986)Mass spectrometry of inductively coupled plasmas.Analytical Chemistry, 58, 97-105.
Ishida H., Morishita T., Arai S. and Shirasaka M. (2004)Simultaneous in situ multi-element analysis of minerals onthin section using LA-ICP-MS. The Science Reports ofKanazawa University, in press.
Jackson S.E., Longerich H.P., Dunning G.R. andFryer B.J. (1992)The application of laser-ablation microprobe-inductivelycoupled plasma-mass spectrometry (LAM-ICP-MS) to insitu trace-element determinations in minerals. CanadianMineralogist, 30, 1049-1064.
Kane J.S. (1998)An assessment of the suitability of NIST glass SRM literature data for the derivation of reference values.Geostandards Newsletter: The Journal of Geostandardsand Geoanalysis, 22, 15-31.
Kent A.J.R., Jacobsen B., Peate D.W., Waight T.E.and Baker J.A. (2004)Isotope dilution MC-ICP-MS rare earth element analysisof geochemical reference materials NIST SRM 610, NISTSRM 612, NIST SRM 614, BHVO-2G, BHVO-2, BCR-2G,JB-2, WS-E, W-2, AGV-1 and AGV-2. Geostandards andGeoanalytical Research, 28, 417-429.
Kurosawa M., Jackson S.E. and Sueno S. (2002)Trace element analysis of NIST SRM 614 and 616 glassreference materials by laser ablation microprobe-inductivelycoupled plasma-mass spectrometry. GeostandardsNewsletter: The Journal of Geostandards andGeoanalysis, 26, 75-84.
Leichte F.E., Meier A. and Crock J.G. (1987)Determination of the rare-earth elements in geologicalmaterials by inductively coupled plasma-mass spectrometry. Analytical Chemistry, 59, 1150-1157.
Longerich H.P., Jackson S.E. and Günther D. (1996)Laser ablation inductively coupled plasma-mass spectrometric transient signal data acquisition and analyte concentration calculation. Journal of AnalyticalAtomic Spectrometry, 11, 899-904.
Ludden J.N., Feng R., Gauthier G. and Stix J. (1995)Applications of LAM-ICP-MS analysis to minerals. TheCanadian Mineralogist, 33, 419-434.
Mason P.R.D., Jarvis K.E., Downs H. and Vannucci R. (1999)Determination of incompatible trace elements in mantleclinopyroxenes by LA-ICP-MS: A comparison of analyticalperformance with established techniques. GeostandardsNewsletter: The Journal of Geostandards andGeoanalysis, 23, 157-172.
Norman M.D., Pearson N.J., Sharma A. and Griffin W.L. (1996)Quantitative analysis of trace elements in geologicalmaterials by laser ablation ICP-MS: Instrumental operating conditions and calibration values of NISTglasses. Geostandards Newsletter, 20, 247-261.
Norman M.D., Griffin W.L., Pearson N.J., Garcia M.O. and O’Reilly S.Y. (1998)Quantitative analysis of trace element abundances inglasses and minerals: A comparison of laser ablationinductively coupled plasma-mass spectrometry, solutioninductively coupled plasma-mass spectrometry, protonmicroprobe and electron microprobe data. Journal ofAnalytical Atomic Spectrometry, 13, 477-482.
Pearce N.J.G, Perkins W.T., Westgate J.A., Gorton M.P., Jackson S.E., Neal C.R. and Chenery S.P. (1997)A compilation of new and published major and traceelement data for NIST SRM 610 and NIST SRM 612 glassreference materials. Geostandards Newsletter: TheJournal of Geostandards and Geoanalysis, 21, 115-144.
Reed W.P. (1992a)Certificate of analysis: Standard Reference Materials 614-615. National Institute of Standards andTechnology, 3pp.
Reed W.P. (1992b)Certificate of analysis: Standard Reference Materials 616-617. National Institute of Standards and Technology, 3pp.
Rocholl A., Dulski P. and Raczek I. (2000)New ID-TIMS, ICP-MS and SIMS data on the trace element composition and homogeneity of NIST certifiedreference material SRM 610-611. GeostandardsNewsletter: The Journal of Geostandards andGeoanalysis, 24, 261-274.
Sylvester P.J. and Eggins S.M. (1997)Analysis of Re, Au, Pd, Pt and Rh in NIST SRM glass certified reference materials and natural basalt glass bylaser ablation ICP-MS. Geostandards Newsletter: TheJournal of Geostandards and Geoanalysis, 21,215-229.
1 2 2
GEOSTANDARDS and
RESEARCHGEOANALYTICAL


!["Aitzineuskararen berreraiketaz: gogoetak barneberreraiketaz eta berreraiketa konparatuaz", ASJU XXXI-2 (1997 [2000]), 537-616.](https://static.fdokumen.com/doc/165x107/631508255cba183dbf07d28a/aitzineuskararen-berreraiketaz-gogoetak-barneberreraiketaz-eta-berreraiketa-konparatuaz.jpg)