Determination of arsenic and mercury metals in suspended particulate matter by flame/flameless...
10
Atmospheric Pollution Research 1 (2010) 118‐127 Atmospheric Pollution Research www.atmospolres.com Study on surface O 3 chemistry and photochemistry by UV energy conservation Jianhui Bai LAGEO, Institute of Atmospheric Physics, Chinese Academy of Sciences, Beijing, 100029, China ABSTRACT The point of view of transmission and conservation of UV energy was put forward to study O 3 photochemical processes. Surface O 3 , NO X , UV radiation and meteorological parameters were monitored at three sites. An energy relationship between O 3 and its affecting factors (NO X , photochemistry, scattering, UV radiation) was built, and used to analyze O 3 and its relations with all factors. The calculated hourly and daily O 3 agreed well with that observed under different sky conditions and at different sites. The interactions between O 3 and its factors were analyzed, and it was found that UV is an important energy to trigger O 3 chemical and photochemical (C&P) reactions in the atmosphere, and 1 hour is a suitable time for UV energy transfer and utilization. The important roles of main factors to O 3 in clear and all skies were investigated and NO term was found to be more important than NO 2 term for the contribution to O 3 . Direct and indirect UV energy (including chemical energy) utilization by NO, NO 2 , and other constituents in the atmosphere control the formation and destruction of O 3 . The photochemical term is an important bridge to relate O 3 C&P processes and UV absorption. The sensitivity studies showed that O 3 is more sensitive to its precursors than the other factors, and more sensitive to NO 2 than NO in summer. The responses of O 3 to the changes of all affecting factors are higher in summer than in autumn and higher in clear sky compared to cloudy sky conditions. Keywords: Surface ozone NO X UV energy Chemical and photochemical reaction Aerosol Article History: Received: 05 November 2009 Revised: 27 December 2009 Accepted: 16 January 2010 Corresponding Author: Jianhui Bai Tel: +86‐10‐82995079 Fax: +86‐10‐62028604 E‐mail: [email protected] © Author(s) 2010. This work is distributed under the Creative Commons Attribution 3.0 License. doi: 10.5094/APR.2010.015 1. Introduction Tropospheric O 3 is a critical constituent in the atmosphere. It is also a key precursor for the hydroxyl radical (OH) which is an oxidant controlling the oxidizing capacity of the atmosphere and the lifetime of many gases. Because O 3 absorbs in the solar ultra‐ violet and infrared spectrum as well as in the terrestrial infrared, it also contributes to the energy budget of the atmosphere (Kentarchos et al., 2001). Tropospheric O 3 has two major sources, stratospheric intrusions and photochemical production (Crutzen, 1988). The relative contributions of these two sources vary in terrestrial and marine areas. In populated regions, the tropo‐ spheric O 3 budget is dominated by photochemical production and destruction (P&D) (Ayers et al., 1992; Kentarchos et al., 2001; Varotsos et al., 2001). In situ photochemistry, rather than transport, is the major cause of the seasonal O 3 cycle in the atmospheric boundary layer. During daytime, photochemical processes mainly control the O 3 P&D [chemical coupling with NO, NO 2 (and with HO 2 radical, organic peroxy radicals (RO 2 ), volatile organic compounds (VOCs), and so on]. O 3 P&D by chemical and photochemical (C&P) processes in the troposphere can occur over large distances and time scales (Kondratyev et al., 2001a; Kondratyev et al., 2001b). Finally, O 3 is also destroyed at the Earth’s surface by dry deposition. Tropospheric O 3 has substantially increased over preindustrial values, as a result of anthropogenic emissions of NO X (Volz and Kley, 1988; Cartalis and Varotsos, 1994), most notably in East Asia, due to the continued rapid increase of NO X emissions from East Asia (Streets and Waldhoff, 2000). High tropospheric O 3 has detrimental effects on human health and ecosystems. In model calculations of tropospheric O 3 , especially surface O 3 , uncertainties in kinetics and other variables may be assessed. However, the chemistry of organic compounds generally cannot be assessed. For example, there is little data available on the chemistry of compounds with carbon numbers greater than 3 or 4, and most of the chemistry of those compounds is based upon extrapolating experimental studies of the reactions of lower molecular weight compounds (WMO, 1998). In addition, there are many problems related to radiative transfer model, such as how to quantitatively describe the roles of clouds and aerosols. Then, it may be another practical and reasonable way to explore the complex O 3 C&P processes by establishing an energy relationship or distribution between O 3 and its dependence on major factors based on the point of view of UV energy conservation and transmission. Therefore, an empirical model of surface O 3 was developed. Advantages of the model are its objectivity (the actual energy relationship is determined by analyzing experimental data) and being timesaving (significant time saving on the calculation). It avoids describing thousands of complicated C&P reactions including those that are not well understood until now. Some issues related to energy method in dealing with O 3 C&P processes were discussed in more detail and the responses of surface O 3 to the changes of main factors under different sky conditions were studied.
-
Upload
independent -
Category
Documents
-
view
6 -
download
0
Transcript of Determination of arsenic and mercury metals in suspended particulate matter by flame/flameless...

Atmospheric Pollution Research 1 (2010) 118‐127
Atmospheric Pollution Research
www.atmospolres.com
Study on surface O3 chemistry and photochemistry by UV energy conservation Jianhui Bai
LAGEO, Institute of Atmospheric Physics, Chinese Academy of Sciences, Beijing, 100029, China
ABSTRACT
The point of view of transmission and conservation of UV energy was put forward to study O3 photochemical processes. Surface O3, NOX, UV radiation and meteorological parameters were monitored at three sites. An energy relationship between O3 and its affecting factors (NOX, photochemistry, scattering, UV radiation) was built, and used to analyze O3 and its relations with all factors. The calculated hourly and daily O3 agreed well with that observed under different sky conditions and at different sites. The interactions between O3 and its factors were analyzed, and it was found that UV is an important energy to trigger O3 chemical and photochemical (C&P) reactions in the atmosphere, and 1 hour is a suitable time for UV energy transfer and utilization. The important roles of main factors to O3 in clear and all skies were investigated and NO term was found to be more important than NO2 term for the contribution to O3. Direct and indirect UV energy (including chemical energy) utilization by NO, NO2, and other constituents in the atmosphere control the formation and destruction of O3. The photochemical term is an important bridge to relate O3 C&P processes and UV absorption. The sensitivity studies showed that O3 is more sensitive to its precursors than the other factors, and more sensitive to NO2 than NO in summer. The responses of O3 to the changes of all affecting factors are higher in summer than in autumn and higher in clear sky compared to cloudy sky conditions.
Keywords: Surface ozone
NOX UV energy
Chemical and photochemical reaction Aerosol
Article History: Received: 05 November 2009 Revised: 27 December 2009 Accepted: 16 January 2010
Corresponding Author: Jianhui Bai
Tel: +86‐10‐82995079 Fax: +86‐10‐62028604
E‐mail: [email protected]
© Author(s) 2010. This work is distributed under the Creative Commons Attribution 3.0 License. doi: 10.5094/APR.2010.015 1. Introduction
Tropospheric O3 is a critical constituent in the atmosphere. It is also a key precursor for the hydroxyl radical (OH) which is an oxidant controlling the oxidizing capacity of the atmosphere and the lifetime of many gases. Because O3 absorbs in the solar ultra‐violet and infrared spectrum as well as in the terrestrial infrared, it also contributes to the energy budget of the atmosphere (Kentarchos et al., 2001). Tropospheric O3 has two major sources, stratospheric intrusions and photochemical production (Crutzen, 1988). The relative contributions of these two sources vary in terrestrial and marine areas. In populated regions, the tropo‐spheric O3 budget is dominated by photochemical production and destruction (P&D) (Ayers et al., 1992; Kentarchos et al., 2001; Varotsos et al., 2001). In situ photochemistry, rather than transport, is the major cause of the seasonal O3 cycle in the atmospheric boundary layer. During daytime, photochemical processes mainly control the O3 P&D [chemical coupling with NO, NO2 (and with HO2 radical, organic peroxy radicals (RO2), volatile organic compounds (VOCs), and so on]. O3 P&D by chemical and photochemical (C&P) processes in the troposphere can occur over large distances and time scales (Kondratyev et al., 2001a; Kondratyev et al., 2001b). Finally, O3 is also destroyed at the Earth’s surface by dry deposition.
Tropospheric O3 has substantially increased over preindustrial
values, as a result of anthropogenic emissions of NOX (Volz and Kley, 1988; Cartalis and Varotsos, 1994), most notably in East Asia, due to the continued rapid increase of NOX emissions from East
Asia (Streets and Waldhoff, 2000). High tropospheric O3 has detrimental effects on human health and ecosystems.
In model calculations of tropospheric O3, especially surface O3,
uncertainties in kinetics and other variables may be assessed. However, the chemistry of organic compounds generally cannot be assessed. For example, there is little data available on the chemistry of compounds with carbon numbers greater than 3 or 4, and most of the chemistry of those compounds is based upon extrapolating experimental studies of the reactions of lower molecular weight compounds (WMO, 1998). In addition, there are many problems related to radiative transfer model, such as how to quantitatively describe the roles of clouds and aerosols. Then, it may be another practical and reasonable way to explore the complex O3 C&P processes by establishing an energy relationship or distribution between O3 and its dependence on major factors based on the point of view of UV energy conservation and transmission. Therefore, an empirical model of surface O3 was developed. Advantages of the model are its objectivity (the actual energy relationship is determined by analyzing experimental data) and being timesaving (significant time saving on the calculation). It avoids describing thousands of complicated C&P reactions including those that are not well understood until now. Some issues related to energy method in dealing with O3 C&P processes were discussed in more detail and the responses of surface O3 to the changes of main factors under different sky conditions were studied.

Bai – Atmospheric Pollution Research 1 (2010) 118‐127 119
2. Instruments and Observation Sites
Field experiments were carried out at three sites, Dinghushan Biosphere Reserve (DBR) (23°10′N,112°32′E, altitude, 38 m), Guangdong province; Institute of Atmospheric Physics, Chinese Academy of Sciences (IAP, CAS) (39°58′N, 116°22′E, altitude, 50 m), Beijing city; and Mohe county (52°59′N, 122°33′E, altitude, 430 m), Heilongjiang province (Figure 1). These sites represent tropical forest, boreal city and boreal rural in China, respectively. The continuous measurements of surface O3, NO, NO2, solar spectral radiation, and meteorological parameters have been conducted in DBR, Beijing, and Mohe from June to December 1998, October 7 to November 6, 1998, and March 1–11, 1997, respectively. DBR is a subtropical evergreen broad–leaf forest. The instruments of solar radiation were installed on a building surrounded by forest. O3 and NOX were measured using a Model 49 O3 analyzer and a model 42S NOX analyzer (TE Co.). The detection limit of two analyzers is 2 ppb and 0.05 ppb, respectively. The observational instruments of solar radiation consist of two parts: 1) Three spectral radiation sensors with the wavelength of 290–3 200, 400–3 200, 700–3 200 nm (Model TBQ–2, Jinzhou 322 Institute, China), 290–400 nm (TUVR, Eppley), solar direct radiation (Model TBS–2, Jinzhou 322 Institute). 2) Solar radiation recorder, model RYJ–2 having a percent relative standard deviation (% RSD) of ±5%. Air temperature, cloudiness, and weather conditions were observed hourly (Bai et al., 2005). Around the observation site of Beijing, there were buildings, grass and a small river, and the height of samplers was 47 m above the ground. During the observation period at Mohe, the ground was covered by snow, and the height of radiation and gas samplers was 20 m above the ground. The radiation sensors were calibrated regularly for every 1 or 2 years. The instruments were the same at all three sites as described in Table 1.
Figure 1. Three experimental sites of the study.
Table 1. Observational sites, instruments, and variables Sites Instruments VariablesDBR TBQ–2, TUVR, TBS–2 and RYJ–2
recorder, Model 49 O3 analyzer, Model 42S NO–NO2–NOX analyzer, thermometer
Solar spectral radiation, solar scattering and direct radiation, UV, O3, NO, NO2, NOX, T, Humidity, Cloudiness
Beijing Same as above Same as above Mohe TBQ–2, TUVR, TBS–2 and RYJ–2
recorder, Model 49 O3 analyzer, thermometer
Solar spectral radiation, solar scattering and direct radiation, UV, O3, T, Humidity, Cloudiness (observed by eye visual)
3. The Energy Relationship between the Surface O3 and its Affecting Factors
3.1. Relationship between O3 and NO2/NO, and analysis
Good correlations were found between O3 and NO2/NO for
hourly and daily averages for clear sky (cloudiness N<3/10) and all sky (cloudiness N≤9/10), according to measurements from June to December 1998 in DBR (Bai et al., 2005). When O3 versus NO2/NO was plotted, the following relationships were found for hourly and daily average values for clear sky:
O3 = 0.756[NO2/NO] + 21.027 (R2=0.819) (1)
O3 = 0.737[NO2/NO] + 21.121 (R2=0.856) (2)
and the equations for hourly and daily average values for all sky are:
O3 = 0.3896[NO2/NO] + 25.633 (R2=0.394) (3)
O3 = 0.578[NO2/NO] + 23.043 (R2=0.629) (4)
Similarly, the equation for Beijing 12 daily values in all sky is as follow:
O3 = 7.503[NO2/NO] + 15.653 (R2=0.665) (5)
The photostationary state involving NO, NO2, O3 is described by reactions:
NO+O3 NO2+O2, NO2+hv (λ<424nm) NO+O(3P) (6)
O (3P)+O2 (+M) O3 (+M) (7)
The photostationary steady state parameter is defined as:
Ф = JNO2[NO2]/k1[NO][O3] (8)
where JNO2 is the photolysis rate of NO2, and k1 is a rate coefficient. In clear and free atmosphere, it holds around ф=1, but it is not always equal to unity in urban and rural areas, where there are large differences of ф from unity (Leighton, 1961; Calvert and Stockwell, 1983). Many other factors may control the C&P processes of O3 with NO and NO2, such as HO2 radical and RO2, other oxidants, and some missing oxidants (Calvert and Stockwell, 1983; Hauglustaine et al., 1996). The assumption of photostationary state is an ideal condition, and must be used carefully (Kleinman et al., 1995). At DBR and other sites, several factors should be considered: (1) important roles of VOCs (i.e., over 50 species of VOCs emitted from the trees in DBR were measured in summer) in the chemistry of O3, NO, NO2, OH and HO2 radicals (Leighton, 1961; Frost et al., 1998), (2) many homogeneous and heterogeneous reactions of the gases, water vapor, and aerosols in the atmosphere, and (3) available UV energy for C&P reactions in actual atmosphere. In this paper, energy method is used to process the microcosmic processes of O3 P&D, i.e., UV conservation and its applications at three sites under different skies are fully introduced, which includes some important issues related to O3 chemistry and photochemistry, compared to a previous study (Bai et al., 2005).

120 Bai – Atmospheric Pollution Research 1 (2010) 118‐127
3.2. UV Energy conservation to deal with O3 C&P processes The photochemical processes of surface O3 are driven by
actinic radiation. When UV radiation transfers through the atmosphere, three key processes should be considered:
(1) The attenuation/absorption of NO, NO2 and O3 to UV are
expressed by ( ) and called NO, NO2 and O3 term, respect‐tively, ki (i = 1, 2, 3) are averaged attenuation/absorption coeffi‐cients of NO, NO2 and O3 in the UV band, respectively (Gushin, 1963; Schneider et al., 1987; Bai et al., 2005). In order to describe the energy role of NO in C&P processes with O3, NO2, OH radicals, VOCs, in which NO utilizes energy coming from other UV absorbers, then, a similar expression was used where m is the air mass.
(2) Total UV energy consumption by all substances in the
atmosphere is expressed by ( ) (photochemical term), k4 is the mean absorption coefficient of water vapor in the wavelength range of 0.70–2.845 μm, w (water vapor content in the whole atmospheric column) is calculated from empirical formula by water vapor pressure (e) at the ground (i.e. w = 0.21e; the average relative bias of this method for calculating w compared to using radiosonde data is less than 20%). ( ) expresses the direct absorption by the other substances that are not considered in part one, and “indirect absorption” or utilization of UV when they are participating in C&P reactions. This part also includes chemical energy converted from UV energy absorption by the absorbers, which provided for these chemical reactions in daytime. To date, no other calculating methods can be selected for this term. Therefore, this empirical method was used.
OH is an active radical and an important agent of energy
transmission and exchange in the atmosphere (Bai et al., 2005). When molecules or substances (such as O3, NO2, NO, SO2, CO, and VOCs) in the atmosphere taking part in C&P reactions, their total UV absorption must have a quantitative relationship with H2O, OH radical and UV radiation (H2O does not absorb UV, but OH P&D is directly relative to H2O, UV, O3, and VOCs). This energy relationship can be objectively determined by analyzing field experimental data, and based on radiation transmission and energy conser‐vation.
Considering difficulties in estimating OH concentration and all
reactions in the atmosphere, it is impossible to estimate total UV absorption by all substances taking part in C&P reactions by the present analytical method. Energy conservation, however, may be used to describe complicated O3 photochemistry. It is a fact that the ratio of UV to solar global radiation (Quv/Q) arriving at the ground is basically constant, about 5.5%±0.4% at 8 stations over China, we also obtained a similar observation in Beijing. Thus, it was assumed that the contributions from each three main factors (O3, Quv′/Q′, aerosol) to Quv/Q are basically constant, respectively. Then, Quv′/Q′= A, Quv′ is UV absorption by all kinds of substances in C&P reactions, Q′ is the solar shortwave radiation (0.70–2.845 μm) absorption by water vapor, A is a constant and derived from analyzing field experimental data. (e‐k4wm 1‐∆S/(I0cosZ)) (Bai et al., 2005), ∆S is the absorption of solar shortwave radiation by water vapor. So, the photochemical term can be calculated. When NO was considered in (1), its energy role would be taken out and not considered in this term. Their actual roles and interactions in actual atmosphere would be determined by analyzing experi‐mental data and energy distributions.
(3) The multi‐scattering roles of UV by all substances (such as
gas molecules, aerosols, clouds, and the Earth’s surface) in the atmosphere, which is expressed by (e‐S/D) and called scattering term, where S and D are solar scattered and direct radiations, respectively. Scattering factor S/D can objectively express scattering energy of UV by all substances (gases, liquids, solids) in the atmosphere. S and D are radiations in broad waveband, and
they include the information of scattering and direct radiation in UV band, so, S/D contains total scattering information of all materials in UV band. Their specific contributions can be determined by the empirical method of energy distribution and negative exponential law, and quantified by its coefficient, though UV is only a small part in broad waveband.
Considering the complexity of O3 C&P system, energy
conservation is an objective and practical method, and the actual roles/energy distributions of all parameters in the changing atmosphere would be quantified by their coefficients.
Lambert‐Beer’s law describes monochromatic radiation and
each material is independent. But, in the actual atmosphere and UV band, the gases of O3, NO, NO2, and VOCs are not independent, or, they react with each other in C&P reactions. In addition, there are numerous heterogeneous reactions on different aerosols surfaces. Therefore, Lambert‐Beer’s law may not be representative for the actual atmospheric conditions. For a single material in UV band, it was assumed to obey Lambert‐Beer’s law and its energy role or contribution was empirically determined by experimental data and form of Lambert‐Beer’s law. For all kinds of materials, UV energy received at the surface is the summation of UV attenuated by all atmospheric materials. Because UV and its affecting factors are interacted through different physical, chemical and biological processes (such as numerous biogenic VOCs emissions, and VOCs can take part in O3 C&P processes), the feasible way is to determine their actual relationships by analyzing experimental datasets and using multiple regression models. All coefficients can exhibit their actual roles/contributions. So, based on the point of view of UV energy conservation, UV radiation (Quv) at the ground can be expressed as follows:
Quv=(A1′e mnk 11− +A2
′e mnk 22− +A3′e
mnk 33−+…+ A4
′ewmk4−
+A5′e
DS /−+A0
′ (9)
where Ai′ (i=1, 2, 3, 4, 5) is the coefficient, A0′ is a constant, and they were determined from the analysis of observational data.
Apart from NO2 and O3, there are large numbers of gases that absorb UV energy, and their UV attenuation should be considered in the first part in Equation (9). In fact, only these measured gases can be considered, and the other gases/molecules that utilize and absorb UV energy indirectly (when they take part in the C&P reactions, including homogeneous and heterogeneous reactions), their absorption role in O3 chemistry and photochemistry will be included in (A4 ), and their scattering role can be included in the scattering term. Finally, a new real energy relationship will be determined by analyzing experimental data:
Quv=A1emnk 11−+A2e
mnk 22−+A3e
mnk 33−+A4e
wmk4−+A5e
DS /−+A0 (10)
The formula for calculating surface O3 (n3) is:
emnk 33−=B1e
mnk 11−+B2e
mnk 22−+B3e
wmk4−+B4e
DS /−+ B5Quv+B0 (11)
In order to obtain stable coefficients in Equations (10) or (11),
each absorption coefficients should be divided by total absorption coefficient. But considering the facts carefully: (1) each absorption or attenuation coefficient of gases, photochemical term, scattering term are different, in particular, with different magnitude of order; (2) each exponent term should be less than 1. Thus, in practical calculations, NO, NO2 and O3 items in Equation (10) were normalized individually by dividing kinim (i = 1, 2, 3) by 1, 10 and 100, respectively. In real atmosphere, UV attenuation of NO2, O3 at different locations is closer, whereas UV attenuations of photochemical term, scattering term at different locations are different, which can be seen from the data analysis that Ai (i = 1, 2,

Bai – Atmospheric Pollution Research 1 (2010) 118‐127 121
3) were almost the same, and Ai (i = 4, 5) were a little different under clear and actual skies in DBR. It implies that the processes related to O3, NO, NO2 in the atmosphere are almost the same and the others are different under different skies and at different locations (because the species and concentrations of gases, aerosols and their physical, C&P processes are different), which properly reflects the actual and changing atmosphere.
Equation (10) was the best expression for the relationship
between all parameters, such as between Quv and k1n1m, k2n2m, k3n3m, k4wm, S/D, Quv and n1, n2, n3, w, S/D, ln(Quv) and k1n1m, k2n2m, k3n3m, k4wm, S/D. The relationship between ln(Quv) and k1n1m, k2n2m, k3n3m, k4wm, S/D (which is the transformation form of Lambert‐Beer’s law) was not the best, because it is not suited for the actual atmospheric conditions, i.e., most gases are not independent, such as most absorption spectrums are overlapped. The real form obeyed Lambert‐Beer’s law should be ln(Quv/Quv0) and k1n1m, k2n2m, k3n3m, k4wm, S/D, Quv0 is the UV radiation outside the atmosphere, ln(Quv0) can be considered as a constant and merged into the constant term. By data analysis, Equation (10) or (11) expressed well their natural law (physical and chemical mechanisms) between O3 and its factors in actual atmosphere, and the accuracy of calculated O3 by Equation (11) was the best. It also implies that correlation analysis of pure numbers is not suitable for such complicated and nonlinear system. In addition, negative exponential terms (the natural law of energy attenuation) for most substances (i.e., NO, NO2, O3, S/D) decreased the calculating error in Equations (10) and (11) to some extent, and the bias of NO, NO2, and O3 terms would be decreased when the concentrations of these gases are high. Though some errors may be introduced by taking the mean value of absorption coefficients over all UV‐region for each absorbing gas molecules in the Beer’s exponential term of the model equation, instead of the actual value for each wavelength in the UV‐region, the measurement of O3 and empirically statistical method based on energy conservation can ensure the least error for O3 estimation.
The important role of photochemical term should be
introduced briefly: When UV transfers through the atmosphere, it is influenced by three main factors: (1) O3 term ( , where n3 is the total O3 amount in the whole column), (2) Photochemical term ( ), (3) Scattering term (e‐S/D). Then, UV radiation at the ground QUV is equal to the summation of these three terms. Based on statistical analysis on monthly averages observed in Beijing in 1990, a similar equation as (10) was determined. In clear sky (N<3/10) and all sky (N is from 0 to 10/10), the relative biases of calculated and observed QUV, the fractional bias (FB), the normalized mean square error (NMSE) (Chang and Hanna, 2004; Chang and Hanna, 2005) are given in Table 2 for considering different terms: (1) only O3 term, (2) O3 and photochemical terms, (3) three terms. R value between QUV and different factors and the standard errors are also given in Table 2. The maximum and averaged relative biases ( , ), and NMSE were decreased evidently when photochemical term was added in UV calculation in clear and all skies. Water or water vapor does not have UV absorption, and a reasonable explanation is UV was absorbed (through OH radical) by all atmospheric substances apart from O3. During the C&P reactions, OH radical is an important bridge for UV energy transfer and utilization. So, photochemical term represents total UV energy absorption by all substances (apart from O3 under this condition) in the whole atmospheric column. It also implies that the photochemical term can well represent total UV energy absorption by all substances under different skies, which includes direct spectral absorptions that are not considered in the formula and the other absorptions and utilizations (probably, it may be called “indirect absorption”) of UV in the atmosphere. In detail, it also includes these chemical energies converted from UV absorption in daytime. It should be pointed out that O3, photochemical and scattering parameters express the whole atmospheric column under this condition.
Table 2. The relative biases (%) between calculated and observed QUV (W m‐2) in 1990 (12 months) in Beijing under different sky conditions
Clear sky condition All sky condition(1) (2) (3) (1) (2) (3)
maximum 13.10 8.02 8.78 16.55 8.05 6.89minimum 0.19 0.09 0.15 0.91 0.73 0.76average 5.83 3.79 3.62 4.77 3.35 3.02R 0.933 0.970 0.973 0.960 0.984 0.987σ 0.100 0.071 0.072 0.063 0.042 0.040FB ‐0.0013 ‐0.0006 ‐3.36x10‐16 0 ‐0.0008 ‐2.14x10‐16
NMSE 0.0050 0.0022 0.0019 0.0031 0.0013 0.0009
In this study, when O3 photochemistry near the surface layer
is concerned, the main objective will be changed, i.e., when experimental data of surface O3, NO, NO2, whole column photochemical and scattering terms were used, UV energy distributes in: (1) the near surface layer related to O3, NO, NO2, it was assumed that the relative air mass in the near surface layer is the same as m, because it is a relative air mass. Their diurnal variations were similar, when the height of planetary boundary layer (PBL) changes during daytime, (2) whole atmospheric column related to all substances apart from (1), because OH radicals can take part in almost all atmospheric reactions, and (3) scattering energy by all substances in the whole column. Because of the ability of daily convective motion, field experimental data of surface O3, NO, NO2 can represent the conditions near surface layer. When these data were taken into the consideration in the empirical model, the actual energy distributions between O3, NO and NO2 near the surface layer were determined and quantified by their coefficients.
The photochemical term can represent almost total energy
absorption by all substances [apart from (1), as it was taken out from this term to study their roles clearly] in the whole atmospheric column, because the whole column parameters were used in this term. During the processes of formation and destruction (or quenching) of O(1D) and OH radicals in the atmosphere, UV energy will be absorbed, transferred and utilized by O3, NO2, VOCs, and H2O, then the energy distributions in these substances will be determined quantitatively by analyzing the experimental dataset. According to above discussions, the roles surface O3, NO and NO2 play near the surface layer were described in part (1), the roles of O3 and NO2 play in the stratosphere, and other materials play in the whole atmosphere (i.e. in the troposphere and stratosphere) were described in part (2), all scattering roles by all materials in the atmosphere was described in part (3). Though there was large difference in O3 concentration and mechanism in the troposphere and stratosphere (Schulz et al., 2001), their roles were described and would be determined by their coefficients in part (1) and part (2), respectively. In other words, the main roles of O3, NO, and NO2 play in surface layer and in stratosphere were quantitatively expressed in energy, respectively, no matter how large their differences were. When UV is transferred in the atmosphere, the attenuation of each substance would obey the law of negative exponent attenuation or Lambert‐Beer, then, total UV reached the ground is the summation or contribution of all substances in the atmosphere. When air mass exchanges between stratosphere and troposphere (such as intrusion from stratosphere to troposphere), or between different regions, the concentrations of O3, NO, NO2, VOCs, and water vapor, and radiations S, D, UV, Q would change simultaneously. Then, all UV absorptions, attenuations, scatterings by the substances in the studied region were quantified in the empirical model simulta‐neously. So, the energy relationship Equation (10) determined by experimental dataset is also a dynamic regulation, which actually expresses their dynamic interrelations in O3 C&P reactions. Generally, Equation (10) is the best expression of O3 C&P system found by analyzing long‐term time series dataset until now. By analyzing and testing measured dataset, it was concluded that

122 Bai – Atmospheric Pollution Research 1 (2010) 118‐127
Equation (10) was better than the form of Lambert‐Beer’s law, which indicated that the point of view of energy can be used to study O3 C&P system, and Lambert‐Beer law may need to be developed for the application in actual atmosphere.
It is one advantage of empirical method to grasp the main
physical and chemical processes, express their energy roles in the atmosphere and make the actual roles of all main factors to be quantified statistically. Any attention on so complicated and detailed processes in O3 C&P reactions need not be paid.
If VOCs specific role is needed to be studied, its term should
be moved out from photochemical term and appeared in the formula. Once VOCs dataset can be obtained in the future and much more well defined environments can also be selected for accurate investigations, then, other O3 mechanism taking place in the troposphere would be investigated by a similar method, and a more clear and accurate UV distribution and utilization in the O3‐NOX‐VOCs system would be obtained, and O3 accuracy would be improved as well.
3.3. The hourly values in clear sky
The relationship between O3 and its factors in clear sky is
studied first. In this paper, all discussions of O3 issues are in daytime, and scattering term was changed from (e‐S/D) to (e‐S/Q). The gas concentration is hourly average in ppb, and the solar radiation is hourly exposure in MJ m‐2.
By statistical analysis of DBR dataset in 1998, the formula
similar to (11) for 113 hourly data between O3 term and other terms was obtained, their correlation coefficient was R = 0.966, and the important factors affecting O3 term were NO, NO2, then photo‐chemical, and UV and scattering term, as indicated by their F‐test results (Bai et al., 2005). So, the atmospheric substances which utilize UV energy directly and indirectly are main affecting factors, and UV consumption by all substances in O3 C&P reactions is an important energy chain. Good results of hourly O3 were obtained and was 6.82%, FB = ‐8.5x10‐5, NMSE = 0.0067 (Bai et al., 2005). During the establishment of empirical formula (10) and (11), no evident correlations were found between any two terms, i.e., there were not interrelated.
3.4. The hourly values in all sky
Variation of O3, NO, NO2, UV and aerosols were affected by
clouds in all sky. Any changes of meteorological conditions and rain often result in their evident changes. Hourly data in all sky in 1998 were also analyzed, and a formula similar to (11) was obtained (R = 0.91), and the order that affecting O3 term is NO, NO2, photochemical, scattering, and UV terms. Good results were also obtained for O3 ( = 11.3%, FB = ‐0.0002, NMSE = 0.0172) (Bai et al., 2005).
For two sky conditions, the best O3 estimations were obtained
when comparing solar radiation 1 hour earlier than the other parameters, compared to those 1 hour later and synchronous dataset. This implies that UV is a triggering energy for O3 C&P processes in actual atmosphere, and 1 hour is an appropriate time scale for UV transfer and utilization. Then, all hourly data were dealt with by this method. For both sky conditions, UV utilization in O3 C&P processes results in a nonlinear relationship between O3 and its affecting factors [Equations (10) and (11)].
3.5. Daily values in daytime clear sky
Daily averages of all parameters in clear sky in 1998 were also
analyzed, and good results were obtained ( = 4.7%, FB = 0, NMSE = 0.0032). The order of terms affecting O3 is the same as hourly values in clear sky (Bai et al., 2005). There are differences in all kinds of physical and chemical processes in the atmosphere
between hourly‐values and daily‐values. The treatment of daily averages will smooth some specific processes related to O3 photochemistry, UV transmission and scattering. It is reasonable that the coefficients of daily averages were slightly different from that of hourly averages.
O3, NO, NO2, and radiation were measured in Beijing city from
October 7 to November 6, 1998, and daily averages of all terms in clear sky were analyzed by the similar method. A similar conclusion was obtained, and the difference was the coefficients implying that some additional factors affecting O3 C&P processes should be considered, and O3 chemistry and photochemistry at different regions displays different characteristics, including the different atmospheric constituents (i.e., VOCs, black carbon) and their homogeneous and heterogeneous atmospheric reactions. The observed and calculated daily O3 and their relative bias, NO and NO2, and scattered plot are shown in Figure 2. The calculated daily averages also agreed well with those observed, the maximum and minimum relative biases ( , ) were 12.8% and 0.1%, respectively, and = 3.9%, FB = 0.0010, NMSE = 0.0036. Though the level of NO and NO2 was different in DBR and Beijing. There were good relationships between O3 and its affecting factors, and the , and values were basically close. Observed NO concentrations lower than NO2 concentrations (Figure 2b) were mainly due to the conversion of NO to NO2 by VOCs and OH radicals through photochemical reactions, though NO concen‐trations are usually higher than NO2 near the combustion sources.
3.6. Daily values in daytime in all sky
Good results were also obtained by analyzing 46 days data in DBR ( = 6.7%). The order of terms affecting O3 is NO, NO2, scattering, photochemical and UV terms (Bai et al., 2005).
The main factors affecting O3 are NO term and NO2 term for
hourly and daily averages under clear and all skies indicating that the C&P reactions between NO, NO2 and O3 or the O3 precursors are the most important factors affecting O3, i.e., direct and indirect UV absorption/utilization by NO, NOX and O3 are the primarily important for O3 P&D. Compared to daily averages in clear sky, the order of scattering term moves ahead of photochemical term and UV term in all sky indicated that aerosols or heterogeneous processes play more important roles in all sky than clear sky because much UV energy was attenuated by aerosols and clouds. As UV energy attenuated by aerosols in clear sky is the smallest, the order of scattering term for daily averages is the last. For the conditions of hourly and daily averages [the data involved in the two averaging procedures (hourly and daily) are the same] in both skies, they describe two different physical and chemical processes. Daily averages would smooth some processes, then the change of some term’s order is reasonable and reflects the practical role of these terms. However, the main order remains the same indicating that the key physical and chemical processes are basically the same. Good daily results were obtained ( = 13.1%,
= 0.1%, = 6.7%, FB = 0.0001, NMSE = 0.0064) (Figure 3). During March 1 to 11, 1997; O3, UV, S, D, Q, temperature (dry
and wet bulb) in all sky in Mohe county were measured. Under this conditions, UV energy conservation is also useful, when two major factors affecting O3 were not included in the equation. The daily averages were calculated by the similar method, and good results were obtained (Figure 4) ( = 15.6%, = 3.5%, = 9.0%, FB = 0.0092, NMSE = 0.0084). There were not big differences in O3 estimation at two sites, and the energy conservation technique worked well. It implies that the photochemical term can represent total energy utilization by all substances.
When NO and NO2 were not included in Equation (11) for DBR
from July to December, the recalculated results are as follows: R between O3 and its factors were 0.71 and 0.85 for 113 hourly and 20 daily O3 in clear skies, respectively. = 21.3% and

Bai – Atmospheric Pollution Research 1 (2010) 118‐127 123
= 91.3%, FB = ‐0.0002, NMSE = 0.0445 for hourly O3. The ratios of relative biases in 113 data at different intervals are shown in Table 3. Eighty six percent of is within 40%. Around the early morning and the late evening > 70%, O3 was usually lower and not important for O3 photochemistry around this time period. Thus, this method can well represent O3 in the case that NO and NO2 are not included in the formula. Some results show that concentrations of tropospheric O3 are more than a factor of 2 lower for many of the models (Park et al., 1999). When NO and NO2 were not included in Equation (11) for DBR (and for Mohe), the recalculated O3 also agreed well with observed. This is because that photochemical term and scattering term include most important roles of UV absorption and scattering by all substances (including NO and NO2 under this condition) after energy relationship between O3 term and photochemical, scattering and UV term was established. If we want to quantify the roles of NO and NO2, they have to be included in the equation instead of hiding them in photochemical term.
(a)
(b)
(c)
Figure 2. (a) The observed and calculated concentrations of O3 and their relative biases at Beijing from October 14 to November 4, 1998, (b) The observed concentrations of NO and NO2 at Beijing from October 14 to November 4, 1998, (c) The scatter plot of surface O3 calculated vs. observed at Beijing.
(a)
(b)
(c) Figure 3. (a) The observed and calculated O3 concentrations at DBR in all skies from July to December, 1998, (b) The relative biases between observed and calculated O3 at DBR in all skies from July to December, 1998, (c) The scatter plot of surface O3 calculated vs. observed at DBR in all skies.
Based on above results under different skies in DBR (low level
of NOX), Beijing (high level of NOX) and Mohe, good relationships between O3 and its affecting factors were obtained.
There was a high correlation between O3 and NO2/NO,
R = 0.91 and 0.93 for hourly and daily averages in clear sky, R = 0.91 and 0.79 for hourly and daily averages in all sky, respectively. Whereas, in the analysis of O3 and its factors by using energy conservation, most R values between O3 and affecting factors were increased to 0.97 and 0.98 for hourly and daily averages in clear sky, 0.91 and 0.97 for hourly and daily averages in all sky. It implies that description of energy conservation is much closer to the actual state of O3–NOX–VOCs C&P system. Hourly O3 was calculated by the correlation between O3 and NO2/NO for 113 data in clear sky in DBR, = 95.7%, bigger than ±15% was 42 groups, and less than ±15% was 72 groups with the ratio of 62.8% ( = 14.9%, FB = 6.4×10‐16, NMSE = 0.0197). So, energy process is a basic process in the atmosphere, and energy conservation is a useful method to study O3 C&P process.
y = 0.995xR2 = 0.8751
0
5
10
15
20
25
30
35
40
45
50
0 10 20 30 40 50
Observed O3 (ppb)
Cal
cula
ted
O 3 (
ppb)
y = 0.994xR2 = 0.9252
0
10
20
30
40
50
60
0 20 40 60
Observed O3 (ppb)
Cal
cula
ted
O 3 (
ppb)
0
10
20
30
40
50
10-1
4
10-1
5
10-1
7
10-1
8
10-1
9
10-2
0
10-2
2
10-2
7
10-2
8
10-3
1
11-2
11-4
Month-Day
O3 (
ppb)
-15
-10
-5
0
5
10
15B
ias
(%)
O3 Obs O3 Cal Bias
010203040506070
10-1
4
10-1
5
10-1
7
10-1
8
10-1
9
10-2
0
10-2
2
10-2
7
10-2
8
10-3
1
11-2
11-4
Month-Day
NO
, NO
2 (pp
b)
NO NO2
0102030405060
7-10
7-29 8-2
8-14
8-19
9-19
9-30
10-1
6
10-2
4
11-6
12-1
2
12-2
8
Month-Day
O3 (
ppb)
O3 Obs O3 Cal
-15-10-505
1015
7-10
7-29 8-
2
8-14
8-19
9-19
9-30
10-1
6
10-2
4
11-6
12-1
2
12-2
8
Month-Day
Bias
(%)

124 Bai – Atmospheric Pollution Research 1 (2010) 118‐127
Generally, the more factors are selected and displayed in Equation (11), the more deeply understanding of O3 C&P processes can be achieved.
(a)
(b) Figure 4. (a) The observed and calculated O3 and their relative biases at Mohe county in all sky from March 1 to 11, 1997, (b) The scatter plot of surface O3 calculated vs. observed at Mohe county in all skies.
The model gets some good O3 estimations with some errors
that were probably contributed from the instruments used to measure pollutant concentrations, radiation and meteorological parameters, and hypothesis in the model and because of the limitation in our current knowledge. Photochemical term may represent almost all UV energy absorption, but not all (some may not be related with OH radicals). If main VOCs, such as isoprene and monoterpenes can be included in the equation, it would be improved to some extent.
Table 3. The interval of frequency of relative biases in 113 data at different intervals
Intervals (%) 0‐20 20‐30 30‐40 40‐50 50‐60 60‐70 70‐80 80‐90 90‐100
Interval of frequency (%)
64.9 9.7 11.5 2.7 5.3 2.7 1.8 0.9 0.9
4. Test for Reliability of the Statistical Model
The applicability of the empirical model was tested. The hourly
data in all sky from July to November 1998 (DBR) was analyzed by the same method as above, and R between O3 term and its affecting factors was 0.92. The hourly O3 in all sky in December
were recalculated by new coefficients obtained from 5‐month data, the calculated and observed results and are given in Figure S1 (with some time breaks). In comparison, Figure S1 also shows the calculated hourly O3 in December in all sky from the coefficients of 6‐month data (see Supporting Material, SM).
There was not a big difference between those two calculated
results, which agreed well with those observed, and the relative biases were also close. for (1) 6 months and (2) 5 months were –29.0% and –26.5%, respectively, were 11.3% and 11.5%, respectively, and FB were ‐0.0145 and ‐0.0237, respectively, NMSE were 0.0166 and 0.0173, respectively. Therefore, this model shows a good reliability. This energy formula based on experimental data analysis is capable to analyze O3 phenomenon in a specific district. If larger datasets were used more reliable energy relationships could be obtained. This is different from the “pure” correlation analysis that depends on numbers.
The coefficients Bi and B0 of hourly averages in clear and all
skies in DBR were ‐0.15, 0.60, ‐1.32, 0.001, 0.06, 1.5 and ‐0.14, 0.68, ‐0.8, ‐0.01, 0.06, 1.3, respectively. It was indicated that under these sky conditions, the relationship between O3 term and NO, NO2, photochemical and S/Q term is similar, and the negative and positive coefficients of NO, NO2 expressed the different roles they played in C&P reactions (which agree with the observations). The very similar coefficients of NO, NO2 in two sky conditions indicated that their roles in C&P reactions and their interactions with O3 were similar, which also agreed with measurements (see Section 3.1).
5. Sensitivity Analysis of O3 to its Affecting Factors
The sensitivity analysis of O3 to its factors was conducted by
using the equation and monthly averages of all parameters under all sky conditions at DBR. The results show how O3 responses due to the change of each parameter by a factor of from 0.1 to 2, and the other parameters stay the same.
O3 shows a non‐linear increase/decrease with the decrease/
increase of NO in all months, bigger O3 changes were caused by NO decreases than NO increases at the same changing rate (such as 0.5 and 1.5). The highest changing rate of O3 with different changes of NO was in July. Generally, the response of O3 to NO change was higher in summer than in winter (see SM, Figure S2a).
Similarly, a non‐linear increase/decrease of O3 with the
increase/decrease of NO2, or water vapor (using water vapor pressure at the ground, e and scattering factor (S/Q) was found in all months (see SM, Figures S2b‐S2d). Bigger O3 responses were caused by the decrease of NO2, or e, S/Q than their increase at the same changing rate. The highest changing rates of O3 were in July due to different changes of NO2, e and S/Q. In general, the higher responses of O3 to the change of NO2, or e, S/Q were in summer, and O3 is more sensitive to NO2 than NO in summer.
Based on the analysis of actual atmosphere, a practical way to
control O3 and photochemical smog is to control the higher emission of NO2, more efficiently in summer than in winter (for example, O3 will decrease by 160% due to NO2 decreases by 50% in July). The higher response of O3 to e was in summer indicated that water or OH radicals play more important roles in O3 chemistry and photochemistry. It also reflects the important roles of VOCs through OH radicals, as VOCs have higher emissions in summer than in winter, especially at DBR, a subtropical forest region.
O3 shows a similar non‐linear increase/decrease with the
increase/decrease of UV in all months. O3 presented similar changes when UV decreases or increases at the same changing rate. The highest changing rate of O3 was also in July with different changes of UV. Generally, the changing rate of O3 was higher in summer than in winter at the same changing rate of UV that
010203040506070
3-1
3-2
3-3
3-4
3-5
3-7
3-8
3-9
3-10
3-11
Month-Day
O3 (
ppb)
-20-15-10-505101520
Bia
s (%
)
Obs.
Cal.Bias
y = 0.9835xR2 = 0.5783
0
10
20
30
40
50
60
70
0 20 40 60 80Observed O3 (ppb)
Cal
cula
ted
O 3 (p
pb)
Bai – Atmospheric Pollution Research 1 (2010) 118‐127 125
reflected the importance of UV energy source in O3 C&P processes in summer (see SM, Figure S2e).
The biggest responses of O3 to all factors with different
changing ratios were in July (summer season), and the smallest were in December (winter season). For the situation of same changing rate at different month, O3 was more sensitive to the change of NO2 and NO, followed by water vapor term and S/D term, and water vapor term was more important than S/D term, and finally UV. So, it reflects that NO2 and NO, the O3 precursors, play the primarily important roles in O3 C&P processes; water vapor and S/D terms, the other substance in C&P process and in the whole atmosphere (S/D can describe the relative total amount of the substances in the atmosphere) apart from NO2 and NO, play the secondary important roles; and UV the third. But, UV energy consumed by all substances in the atmosphere is a chain for O3 photochemistry. In essence, all O3 C&P processes in the atmosphere are initiated and controlled by UV energy absorption and utilization. It is reasonable to say that the importance order of UV at the ground is the last. For O3 C&P production and depletion, the substances, including NO2, NO, e, VOCs, and others in the atmosphere play the most important roles.
For comparison, Figures S2f through S2k (see SM) show O3
non‐linear response to each individual factor from July to December. The biggest changing rate of O3 caused by each factor was at 0.1 (i.e. decreasing 90%) for all months, and the more evident O3 changes were caused by the decreases rather than the increase of all factors at the same changing rates for all months, such as 0.1 to 2.0.
Similarly, the changing rates of O3 with the changes of e, S/Q
and UV were non‐linear at different changing ratios for all months. Figure S2l (see SM) shows the response in O3 concentrations if
NO2 increases by factors of 2, 4, 8, 16, 32, 64, 128, 256, and the values of other parameters remain the same. When NO2 increased to bigger than a factor of 8, O3 changing rates for each month were almost the same as that NO2 increased by a factor of 4. It means that O3 C&P production has a saturation condition, which may be caused by the limitation of UV energy and oxidizing power of the atmosphere, which depended on different conditions at different months or seasons. The highest production rate was in summer season, then, decreased quickly in autumn, and it was almost zero in winter. This also indicated that an oxidizing power of the actual atmosphere was the highest in summer, then, decreased in autumn and winter, which corresponded to the VOCs emission pattern (highest in the summer). In addition, an obvious UV decrease from summer to winter also contributed to this pattern of O3 production rate to some extent.
O3 production rates increased with the increases of e (water
vapor pressure) or UV, when each of them increased by factors of
2, 4, 8, 16, 32, 64, 128, 256, respectively, and the values of other parameters remain the same, O3 production rates displayed no saturation for each month (see SM, Figures S2l and S2m). For both conditions, the highest production rates of O3 were in July, and then quickly decreased to the lowest values in winter. So, the higher e and UV favor producing higher surface O3, and this phenomena was more evident in summer than it was in autumn and winter.
A sensitivity test was conducted to determine if there is a real
saturation for O3 production by NO2 increase in the actual atmosphere. NO2 and UV increase by a factor of 4, 64 (case 1); 8, 64 (case 2); and 8, 128 (case 3), respectively, and the other parameters keep their original values. We can see that O3 production rate has a saturation state at a stable UV level, but, it would increase with the increase of NO2 and UV, i.e., it does not have a saturation state (see SM, Figure S2o). In more detail, we can see that O3 saturation point is where NO2 increased by a factor of 4 for each month. Taking saturation point of O3 as an example ,when UV increases to different levels and the other parameters keep their original values, O3 production rate will increase with the increase of UV for each month (see SM, Figure S2o), having the higher production rate in summer. So, O3 saturation points vary not only with NO2, but also UV and other parameters. Therefore, the empirical model based on the energy method and field data analysis can be a practical way to deal with O3 chemistry and photochemistry, and the interactions between O3 and its affecting factors.
Similarly, the response of O3 to each factor in clear sky in DBR
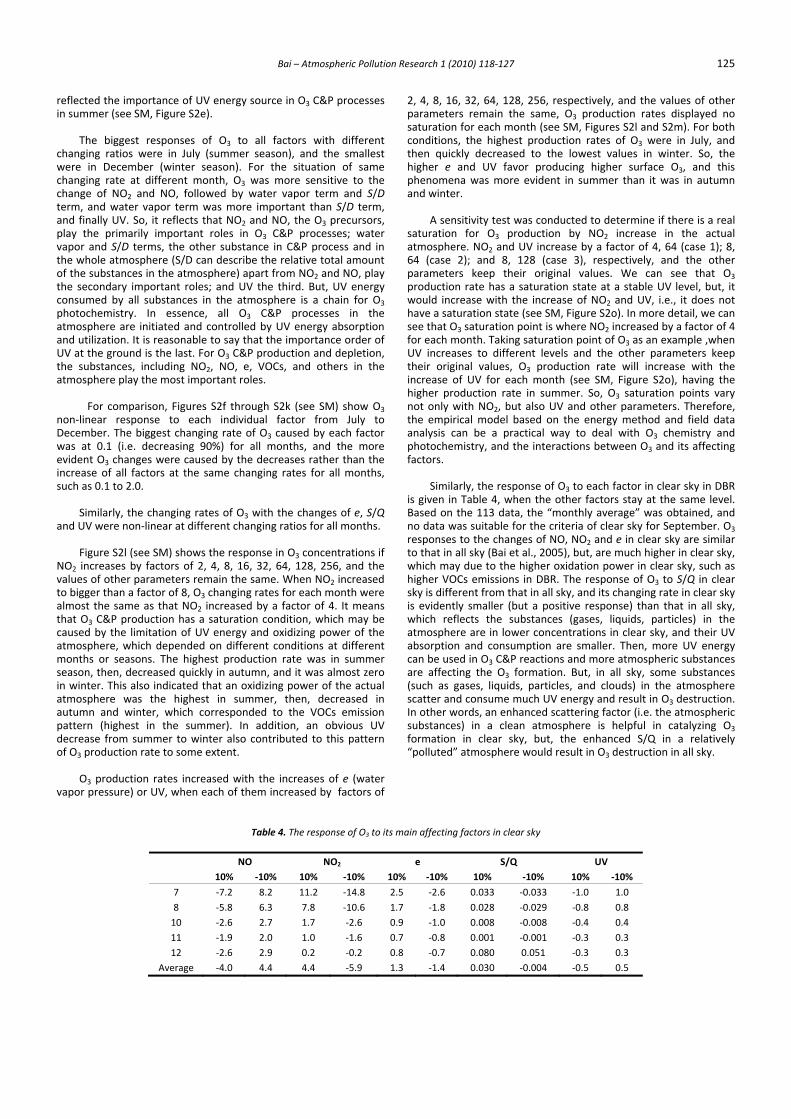
is given in Table 4, when the other factors stay at the same level. Based on the 113 data, the “monthly average” was obtained, and no data was suitable for the criteria of clear sky for September. O3 responses to the changes of NO, NO2 and e in clear sky are similar to that in all sky (Bai et al., 2005), but, are much higher in clear sky, which may due to the higher oxidation power in clear sky, such as higher VOCs emissions in DBR. The response of O3 to S/Q in clear sky is different from that in all sky, and its changing rate in clear sky is evidently smaller (but a positive response) than that in all sky, which reflects the substances (gases, liquids, particles) in the atmosphere are in lower concentrations in clear sky, and their UV absorption and consumption are smaller. Then, more UV energy can be used in O3 C&P reactions and more atmospheric substances are affecting the O3 formation. But, in all sky, some substances (such as gases, liquids, particles, and clouds) in the atmosphere scatter and consume much UV energy and result in O3 destruction. In other words, an enhanced scattering factor (i.e. the atmospheric substances) in a clean atmosphere is helpful in catalyzing O3 formation in clear sky, but, the enhanced S/Q in a relatively “polluted” atmosphere would result in O3 destruction in all sky.
Table 4. The response of O3 to its main affecting factors in clear sky
NO NO2 e S/Q UV 10% ‐10% 10% ‐10% 10% ‐10% 10% ‐10% 10% ‐10%
7 ‐7.2 8.2 11.2 ‐14.8 2.5 ‐2.6 0.033 ‐0.033 ‐1.0 1.0 8 ‐5.8 6.3 7.8 ‐10.6 1.7 ‐1.8 0.028 ‐0.029 ‐0.8 0.8 10 ‐2.6 2.7 1.7 ‐2.6 0.9 ‐1.0 0.008 ‐0.008 ‐0.4 0.4 11 ‐1.9 2.0 1.0 ‐1.6 0.7 ‐0.8 0.001 ‐0.001 ‐0.3 0.3 12 ‐2.6 2.9 0.2 ‐0.2 0.8 ‐0.7 0.080 0.051 ‐0.3 0.3
Average ‐4.0 4.4 4.4 ‐5.9 1.3 ‐1.4 0.030 ‐0.004 ‐0.5 0.5
126 Bai – Atmospheric Pollution Research 1 (2010) 118‐127
The responses of O3 to UV are different in two skies. In clear sky, when UV at the surface increases, O3 will decrease, which reflects the situation: higher biogenic VOCs emissions in DBR due to higher PAR and temperature, limited NO and NO2 (the maximum concentrations of hourly NO and NO2 in 1998 were 1.98 and 10.9 ppb, respectively) and enhanced UV leads to O3 depletion. In all sky, when UV at the surface increases, O3 will increase, which reflects the situation: sufficient O3 precursors NO and NO2 (the maximum concentrations of hourly NO and NO2 in 1998 were up to 3.30 and 19.4 ppb, respectively), and lower biogenic VOCs emissions, so, the enhanced UV will result in O3 production by their integrated action. In addition, the increase of scattered UV will make good use of UV energy in O3 C&P reactions and lead to O3 decrease. In DBR, the emissions of NO, NO2, VOCs from anthropogenic sources can be assumed at the same level in two sky conditions. Previous results indicated that the absorption of ozone at 355 nm is enhanced by two orders of magnitude when the ozone is dissolved in water (Hurwitz and Naaman, 1995). This implied that O3 UV absorption and its photolysis in cloudy skies will be enhanced which is consistent with this model. The potential and important O3 and other gases UV absorption in all skies may be increased to some extent, and should be studied and considered in the models.
The responses of O3 to each factor are higher in summer than
in autumn, and higher in clear sky than in all sky (compared to Bai et al., 2005), except for S/Q. According to the above discussions, the empirical model based on UV energy conservation can reflect some mechanisms in O3 chemistry and photochemistry under different sky conditions.
6. Conclusions
An empirical model was developed to study O3 C&P processes
based on UV energy conservation, and good estimations of hourly and daily O3 were obtained in two sky conditions and at different sites. The empirical model is objective, reliable and easy to obtain. It is reasonable and practical to analyze the relationship between O3 and its main affecting factors in actual atmosphere. The substances (O3 precursors, water vapor, and VOCs) play the primary important roles in O3 C&P processes, and UV is an energy source for initiating and supplying the substances in O3 C&P processes. O3 is more sensitive to all factors in summer than in winter and more sensitive in clear sky than in all sky. An efficient and feasible way to control O3 smog is to control high NO2 emissions in summer. Acknowledgments
The author gratefully acknowledges all anonymous reviewers for their beneficial recommendations, and Prof. Wang MX, Wang GC, Kong QX, and Greenberg J for their help and suggestions. This work was supported by the field station foundation of CAS.
Supporting Material Available
The observed and calculated O3, (1) 6 months, (2) 5 months (Figure S1a), The relative biases between observed and calculated O3, (1) 6 months, (2) 5 months (Figure S1b), The scattered plot of surface O3 calculated vs. observed, (1) 6 months (Figure S1c), The scattered plot of surface O3 calculated vs. observed, (2) 5 months (Figure S1d.), O3 changing rate caused by NO change at DBR (Figure S2a), O3 changing rate caused by NO2 change at DBR, its changing rate by 0.1NO2 described in the right coordinate (Figure S2b), O3 changing rate caused by the change of water vapor at DBR (Figure S2c), O3 changing rate caused by the change of scattering factor at DBR (Figure S2d), O3 changing rate caused by UV change at DBR (Figure S2e), O3 changing rate caused by the changes of all factors in July at DBR (Figure S2f), O3 changing rate caused by the changes of all factors in August at DBR (Figure S2g), O3 changing rate caused by the changes of all factors in September at DBR (Figure S2h), O3
changing rate caused by the changes of all factors in October at DBR (Figure S2i), O3 changing rate caused by the changes of all factors in November at DBR (Figure S2j), O3 changing rate caused by the changes of all factors in December at DBR (Figure S2k), O3 production rate caused by NO2 increases at DBR (Figure S2l), O3 changing rate caused by the change of water vapor at DBR (Figure S2m), O3 changing rate caused by the change of UV at DBR (Figure S2n), O3 production rate caused by the increase of NO2 and UV at DBR (Figure S2o). This information is available free of charge via the Internet at http://www.atmospolres.com.
References
Ayers, G.P., Penkett, S.A., Gillett, R.W., Bondy, B., Golbally, I.E., Meyer, C.P., Elsworth, C.M., Bentley, S.T., Forgan, B.W., 1992. Evidence for photochemical control of ozone concentrations in unpolluted marine air. Nature 360, 446‐449.
Bai, J.H., Wang, G.C., Wang, M.X., 2005. An empirical correlation between surface O3 and its factors. Atmospheric Environment 39, 4419‐4423.
Calvert, J.G., Stockwell, W.R., 1983. Deviations from the O3‐NO‐NO2 photostationary state in tropospheric chemistry. Canadian Journal of Chemistry 61, 983‐992.
Cartalis, C., Varotsos, C., 1994. Surface ozone in Athens, Greece, at the beginning and at the end of the 20th‐century. Atmospheric Environment 28, 3‐8.
Chang, J.C., Hanna, S.R., 2005. Technical descriptions and user' guide for the BOOT statistical model evaluation software package, version 2.0.
Chang, J.C., Hanna, S.R., 2004. Air quality model performance evaluation. Meteorology and Atmospheric Physics 87, 167‐196.
Crutzen, P.J., 1988. Tropospheric ozone: An overview, in Tropospheric Ozone Regional and Global Scale Interactions, Isaksen I.S.A. Eds, NATO ASI Series, Series C 227, pp.3‐32.
Frost, G.J., Trainer, M., Allwine, G., Buhr, M.P., Calvert, J.G., Cantrell, C.A., Fehsenfeld, F.C., Goldan, P.D., Herwehe, J., Hubler, G., Kuster, W.C., Martin, R., McMillen, R.T., Montzka, S.A., Norton, R.B., Parrish, D.D., Ridley, B.A., Shetter, R.E., Walega, J.G., Watkins, B.A., Westberg, H.H., Williams, E.J., 1998. Photochemical ozone production in the rural southeastern United States during the 1990 Rural Oxidants in the Southern Environment (ROSE) program. Journal of Geophysical Research 103, 22491‐22508.
Gushin, G.P., 1963. Study on atmospheric ozone, Hydrometeorological Press: Leningard, p.17.
Hauglustaine, D.A., Madronich, S., Ridley, B.A., Walega, J.G., Cantrell, C.A., Shetter, R.E., Hubler, G., 1996. Observed and model‐calculated photostationary state at Mauna Loa Observatory during MLOPEX 2. Journal of Geophysical Research 101, 14681‐14696.
Hurwitz, Y., Naaman, R., 1995. Production of OH by dissociating ozone‐water complexes at 266 and 355 nm and by reacting O(1D) with water dimers. The Journal of Chemical Physics 102, 1941‐1943.
Kentarchos, A.S., Roelofs, G.J., Lelieveld, J., 2001. Altitude distribution of tropospheric ozone over the Northern Hemisphere during 1996, simulated with a chemistry‐general circulation model at two different horizontal resolutions. Journal of Geophysical Research‐Atmospheres 106, 17453‐17469.
Kleinman, L., Lee, Y.N., Springston, S.R., Lee, J.H., Nunnermacker, L., Weinstein‐Lloyd, J., Zhou, X.L., Newman, L., 1995. Peroxy radical concentration and ozone formation rate at a rural site in the southeastern United States. Journal of Geophysical Research‐Atmospheres 100, 7263‐7273.
Kondratyev, K.Y., Varotsos, C.A., 2001a. Global tropospheric ozone dynamics‐Part I: Tropospheric ozone precursors‐Part II: Numerical modelling of tropospheric ozone variability. Environmental Science and Pollution Research 8, 57‐62.
Kondratyev, K.Y., Varotsos, C.A., 2001b. Global tropospheric ozone dynamics‐Part II: Numerical modelling of tropospheric ozone variability
Bai – Atmospheric Pollution Research 1 (2010) 118‐127 127
‐ Part I: Tropospheric ozone precursors [ESPR 8 (1) 57‐62 (2001)]. Environmental Science and Pollution Research 8, 113‐119.
Leighton, P.A., 1961. Photochemistry of air pollution, Academic Press: New York, Pp.152‐183.
Park, J.H., Ko, M.K.W., Jackman, C.H., Plumb, R.A., Kaye, J.A., Sage, K.H. (eds.), 1999. M&M‐2, NASA: Models and Measurements Intercomparison II. TM_1999_209554, September 1999, p.7.
Schneider, W., Moortgat, G.K., Tyndall, G.S., Burrows, J.P., 1987. Absorption cross‐section of NO2 in the UV and visible region (200‐700 nm) at 298 K. Journal of Photochemistry and Photobiology A: Chemistry 40, 195‐217.
Schulz, A., Rex, M., Harris, N.R.P., Braathern, G.O., Reimer, E., Alfier, R., Kilbane‐Dawe, I., Eckermann, S., Allaart, M., Alpers, M., Bojkov, B., Cisneros, J., Claude, H., Cuevas, E., Davies, J., De Backer, H., Dier, H., Dorokhov, V., Fast, H., Godin, S., Johnson, B., Kois, B., Kondo, Y., Kosmidis, E., Kyro, E., Litynska, Z., Mikkelsen, I.S., Molyneux, M.J., Murphy, G., Nagai, T., Nakane, H., O'Connor, F., Parrondo, C.,
Schmidlin, F.J., Skrivankova, P., Varotsos, C., Vialle, C., Viatte, P., Yushkov, V., Zerefos, C., Von Der Gathen, P., 2001. Arctic ozone loss in threshold conditions: Match observations in 1997/1998 and 1998/1999. Journal of Geophysical Research‐Atmospheres 106, 7495‐7503.
Streets, D.G., Waldhoff, S.T., 2000. Present and future emissions of air pollutants in China: SO2, NOX, and CO. Atmospheric Environment 34, 363‐374.
Varotsos, C., Kondratyev, K.Y., Efstathiou, M., 2001. On the seasonal variation of the surface ozone in Athens, Greece. Atmospheric Environment 35, 315‐320.
Volz, A., Kley, D., 1988. Evaluation of the Montsouris series of ozone measurements made in the nineteenth century. Nature 332, 240‐242.
WMO (World Meteorological Organization), 1998. Global Ozone Research and Monitoring Project‐ Report No. 44, Scientific assessment of ozone depletion: 1998, 8.19‐8.27.