
Determinants of medium-term blood pressure variability and ...
321
Determinants of medium-term blood pressure variability and the related risks of stroke and dementia. Thesis submitted for degree of Doctor of Philosophy Alastair Webb MA (Cantab) BMBCh (Oxon) MSc (Oxon) MRCP Wadham College Department of Clinical Neurosciences University of Oxford Trinity Term 2013
-
Upload
khangminh22 -
Category
Documents
-
view
3 -
download
0
Transcript of Determinants of medium-term blood pressure variability and ...
Determinants of
medium-term blood pressure variability
and the related risks of stroke and dementia.
Thesis submitted for degree of Doctor of Philosophy
Alastair Webb MA (Cantab) BMBCh (Oxon) MSc (Oxon) MRCP
Wadham College
Department of Clinical Neurosciences
University of Oxford
Trinity Term 2013

For Mum and Dad, for the love, life and opportunities you have given me,
and, above all, for Amanda, Joshua and Sophie,
who have been there for me through everything,
with love.
i
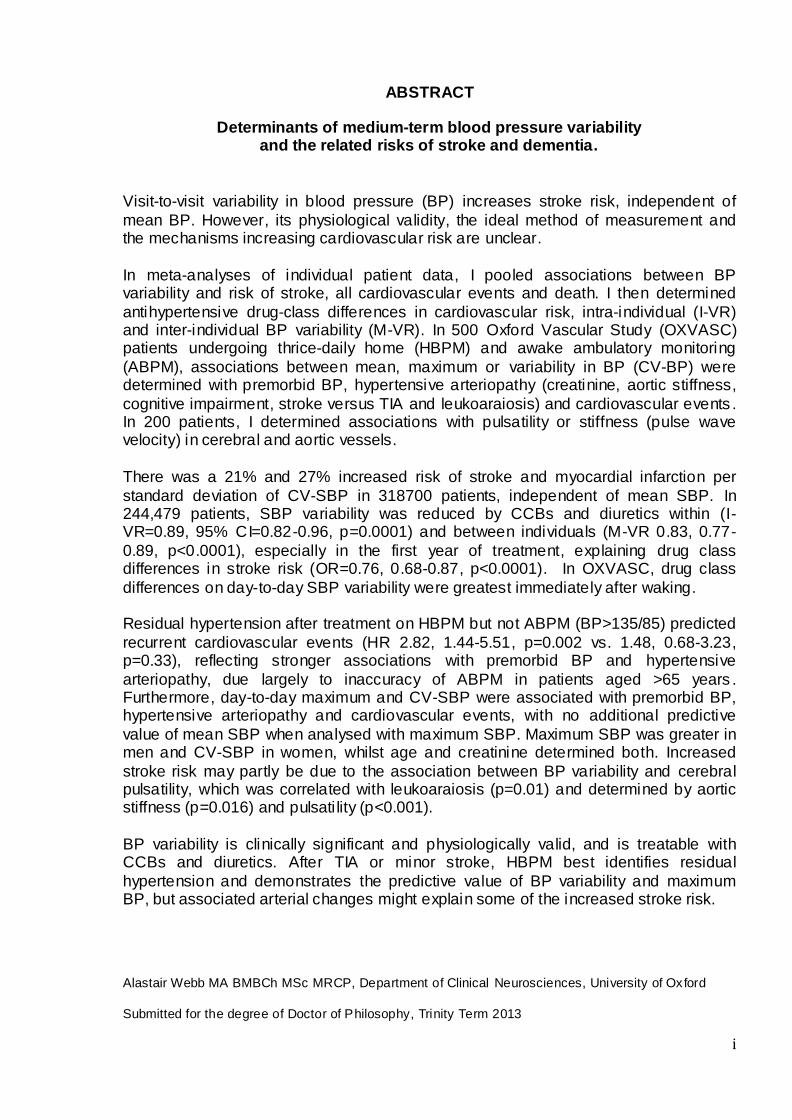
ABSTRACT
Determinants of medium-term blood pressure variability and the related risks of stroke and dementia.
Visit-to-visit variability in blood pressure (BP) increases stroke risk, independent of
mean BP. However, its physiological validity, the ideal method of measurement and the mechanisms increasing cardiovascular risk are unclear.
In meta-analyses of individual patient data, I pooled associations between BP variability and risk of stroke, all cardiovascular events and death. I then determined
antihypertensive drug-class differences in cardiovascular risk, intra-individual (I-VR) and inter-individual BP variability (M-VR). In 500 Oxford Vascular Study (OXVASC) patients undergoing thrice-daily home (HBPM) and awake ambulatory monitoring
(ABPM), associations between mean, maximum or variability in BP (CV-BP) were determined with premorbid BP, hypertensive arteriopathy (creatinine, aortic stiffness,
cognitive impairment, stroke versus TIA and leukoaraiosis) and cardiovascular events . In 200 patients, I determined associations with pulsatility or stiffness (pulse wave velocity) in cerebral and aortic vessels.
There was a 21% and 27% increased risk of stroke and myocardial infarction per
standard deviation of CV-SBP in 318700 patients, independent of mean SBP. In 244,479 patients, SBP variability was reduced by CCBs and diuretics within (I-VR=0.89, 95% CI=0.82-0.96, p=0.0001) and between individuals (M-VR 0.83, 0.77-
0.89, p<0.0001), especially in the first year of treatment, explaining drug class differences in stroke risk (OR=0.76, 0.68-0.87, p<0.0001). In OXVASC, drug class
differences on day-to-day SBP variability were greatest immediately after waking. Residual hypertension after treatment on HBPM but not ABPM (BP>135/85) predicted
recurrent cardiovascular events (HR 2.82, 1.44-5.51, p=0.002 vs. 1.48, 0.68-3.23, p=0.33), reflecting stronger associations with premorbid BP and hypertensive
arteriopathy, due largely to inaccuracy of ABPM in patients aged >65 years . Furthermore, day-to-day maximum and CV-SBP were associated with premorbid BP, hypertensive arteriopathy and cardiovascular events, with no additional predictive
value of mean SBP when analysed with maximum SBP. Maximum SBP was greater in men and CV-SBP in women, whilst age and creatinine determined both. Increased
stroke risk may partly be due to the association between BP variability and cerebral pulsatility, which was correlated with leukoaraiosis (p=0.01) and determined by aortic stiffness (p=0.016) and pulsati lity (p<0.001).
BP variability is clinically significant and physiologically valid, and is treatable with CCBs and diuretics. After TIA or minor stroke, HBPM best identifies residual
hypertension and demonstrates the predictive value of BP variability and maximum BP, but associated arterial changes might explain some of the increased stroke risk.
Alastair Webb MA BMBCh MSc MRCP, Department of Clinical Neurosciences, University of Oxford
Submitted for the degree of Doctor of Philosophy, Trinity Term 2013
ii
Declarations
I certify that this thesis entitled ‘Determinants of medium-term variability in blood
pressure and the related risks of stroke and dementia’ was performed whilst I was a
fulltime postgraduate student at the University of Oxford.
I declare that this thesis is my own work. I personally performed the searches, the
majority of the collection of papers and the data extraction for the systematic reviews
incorporated in this thesis. The systematic reviews included in this thesis include
updates of systematic reviews that were published prior to the inception of this DPhil,
including those published as part of my MSc by research, but I have now used
individual patient data obtained from direct communication with trial authors . For the
past 2 years I have also been the physician responsible for the day-to-day running of
the blood pressure monitoring cohort described in chapters 5-8, monitoring BP
readings on a daily basis and treating patients. I reviewed, cleaned and analysed all
the data included in this thesis. I also designed, carried out, developed the analysis
programs and analysed data for the physiological assessments included in the
physiological substudy in chapters 9-10, although MRI assessments were additionally
performed by a consultant neuroradiologist (W Kuker) and a Stroke Prevention
Research Unit clinical fellow specializing in this area (L Li) . I was supported in the
statistical approaches and analyses by my supervisor, Prof Rothwell, and the
statisticians associated with the group, Ziyah Mehta and Sally Howard. Finally, this
thesis was drafted in its entirety by myself, but extensively reviewed by my supervisor,
Prof Rothwell. Sections of this thesis have been published in peer-reviewed scientific
journals as stated below, but have not been used in the application for or submission
of any other degree.

iii
Acknowledgements
I would like to thank all the members of the Stroke Prevention Research Unit for their
time and support during this DPhil, including Jean Brooks for her endless efforts
gathering the papers included in the systematic reviews and my colleagues who have
contributed to the BP monitoring study by caring for the patients, providing blood
pressure monitors and collecting and cleaning data, particularly those responsible for
the daily managing of the study including Emma, Maria, Jo, Sarah and Nicki, but most
importantly I would like to thank Fiona Cuthbertson and Michelle Wilson, without who m
it would all have fallen apart. For their support in carrying out the physiological
assessments I would like to thank Jonathan Diesch and the staff of the Cardiovascular
Clinical Research Facility.
Finally, I would like to thank Prof Peter Rothwell, my supervisor, both for giving me this
tremendous opportunity to be involved in such interesting and important research, but
also for being a fantastic supervisor, giving me an extraordinary amount of time,
attention, advice and training throughout this time.
iv
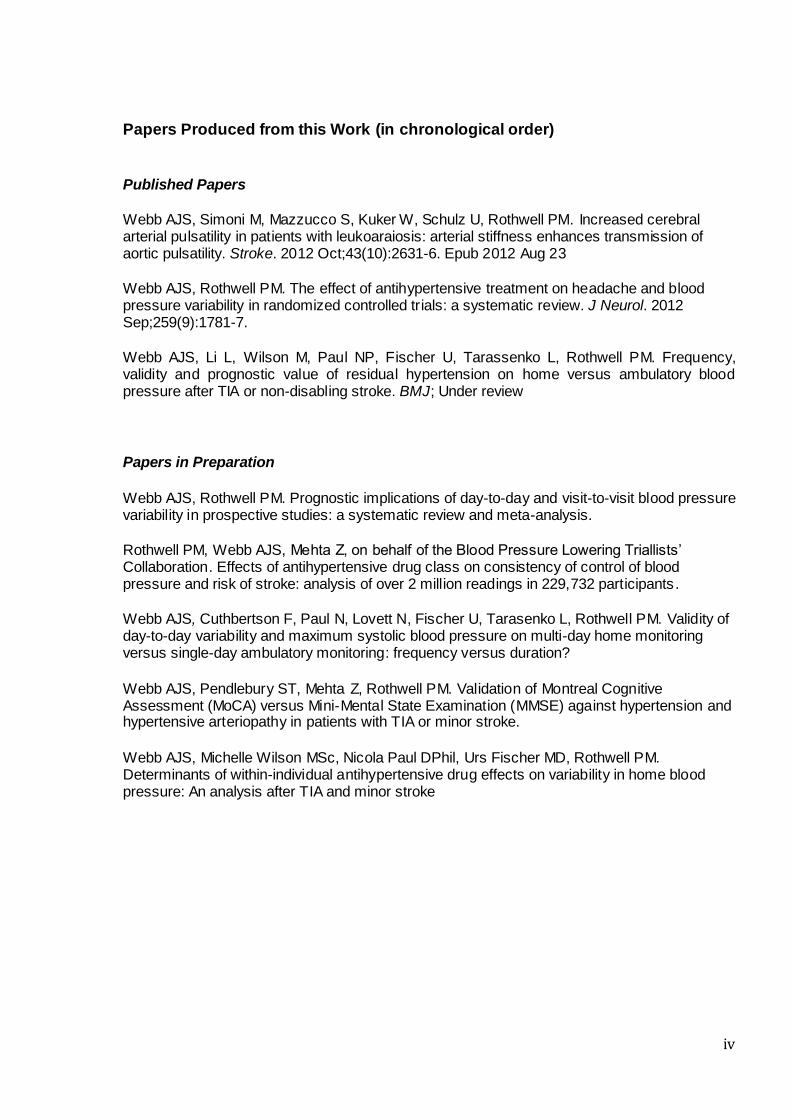
Papers Produced from this Work (in chronological order)
Published Papers
Webb AJS, Simoni M, Mazzucco S, Kuker W, Schulz U, Rothwell PM. Increased cerebral arterial pulsatility in patients with leukoaraiosis: arterial stiffness enhances transmission of aortic pulsatility. Stroke. 2012 Oct;43(10):2631-6. Epub 2012 Aug 23
Webb AJS, Rothwell PM. The effect of antihypertensive treatment on headache and blood pressure variability in randomized controlled trials: a systematic review. J Neurol. 2012 Sep;259(9):1781-7.
Webb AJS, Li L, Wilson M, Paul NP, Fischer U, Tarassenko L, Rothwell PM. Frequency, validity and prognostic value of residual hypertension on home versus ambulatory blood pressure after TIA or non-disabling stroke. BMJ; Under review
Papers in Preparation
Webb AJS, Rothwell PM. Prognostic implications of day-to-day and visit-to-visit blood pressure variability in prospective studies: a systematic review and meta-analysis.
Rothwell PM, Webb AJS, Mehta Z, on behalf of the Blood Pressure Lowering Triallists’ Collaboration. Effects of antihypertensive drug class on consistency of control of blood pressure and risk of stroke: analysis of over 2 million readings in 229,732 participants.
Webb AJS, Cuthbertson F, Paul N, Lovett N, Fischer U, Tarasenko L, Rothwell PM. Validity of day-to-day variability and maximum systolic blood pressure on multi-day home monitoring versus single-day ambulatory monitoring: frequency versus duration?
Webb AJS, Pendlebury ST, Mehta Z, Rothwell PM. Validation of Montreal Cognitive Assessment (MoCA) versus Mini-Mental State Examination (MMSE) against hypertension and hypertensive arteriopathy in patients with TIA or minor stroke.
Webb AJS, Michelle Wilson MSc, Nicola Paul DPhil, Urs Fischer MD, Rothwell PM. Determinants of within-individual antihypertensive drug effects on variability in home blood pressure: An analysis after TIA and minor stroke
v
Presentations
Webb AJS, Simoni M, Mazzucco S, Kuker W, Schulz U, Rothwell PM. Increased cerebral arterial pulsatility in patients with leukoaraiosis: arterial stiffness enhances transmission of aortic pulsatility. European Stroke Conference 2012.
Webb AJS, Rothwell PM. The effect of antihypertensive treatment on headache and blood pressure variability in randomized controlled trials: a systematic review. European Stroke Conference 2012 and Association of British Neurologists 2012.
Webb AJS, Rothwell PM. Blood pressure variability in patients with recent TIA or minor stroke: visit-to-visit office measures versus Bluetooth home monitoring versus 24-hour ABPM. European Stroke Conference 2012.
Webb AJS, Li L, Wilson M, Paul NP, Fischer U, Tarassenko L, Rothwell PM. Frequency, validity and prognostic value of residual hypertension on home versus ambulatory blood pressure after TIA or non-disabling stroke. European Stroke Conference 2013 and Association of British Neurologists 2013.
Webb AJS, Rothwell PM. Clinical and physiological validity of maximum systolic BP: home versus ambulatory monitoring. European Stroke Conference 2013.
vi
TABLE OF CONTENTS
Abstract i Declarations ii Acknowledgements iii List of publications iv Table of contents vi List of appendices x Table of tables xi Table of figures xiv
CHAPTER 1 Introduction
1.1 Stroke and Hypertension 2
1.1.1 The burden of stroke and hypertension 1.1.2 The pathophysiology of hypertension and stroke 1.1.3 A potential new risk factor
1.2 The Epidemiology of Hypertension 3
1.2.1 Hypertension as a risk factor for cardiovascular disease 1.2.2 Usual blood pressure 1.2.3 The importance of systolic blood pressure
1.3 The treatment of hypertension 9
1.3.3 The efficacy of blood pressure reduction 1.3.2 Differences between blood–pressure lowering drug classes 1.3.3 Current guidelines on the management of hypertension
1.4 Short-term blood pressure variability 13
1.4.1 Diurnal blood pressure variability 1.4.2 Situational blood pressure variability
1.5 Visit-to-visit blood pressure variability 15
1.5.1 Previous evidence for the importance of visit-to-visit variability 1.5.2 Visit-to-visit variability as a new, independent risk factor for stroke 1.5.3 Randomised treatment reduces visit-to-visit variability and stroke risk
1.6 Conclusions and Aims 21 1.7 References 23
CHAPTER 2 Prognostic implications of medium-term variability in blood pressure in prospective studies: systematic review and meta-analysis
2.1 Summary 29 2.2 Introduction 30 2.3 Methods 31
2.3.1 Search strategy and data collection 2.3.2 Statistical analysis
2.4 Findings 32
2.4.1 Search results 2.4.2 Relationships between BP variability and risk of stroke 2.4.3 Relationships between BP variability and risk of myocardial infarction 2.4.4 Relationships between BP variability and risk of cardiovascular death 2.4.5 Effect of temporal separation of exposure and outcome periods 2.4.6 Sources of heterogeneity 2.4.7 Relevant studies not included in meta-analysis
2.5 Discussion 45 2.6 References 48
vii
CHAPTER 3 Effects of antihypertensive drug class on consistency of control of blood pressure and risk of stroke: analysis of over 2 million readings in 244,479 participants
3.1 Summary 52 3.2 Introduction 53 3.3 Methods 54
3.3.1 Data collection 3.3.2 Statistical analysis 3.3.3 Meta-analysis by drug-class 3.3.4 Expanded meta-analysis of drug-class effects on G-VR
3.4 Findings 59
3.4.1 Drug class effects on cardiovascular outcomes 3.4.2 Within-individual variability in BP 3.4.3 Between-individual variability in BP 3.4.4 Expanded meta-analysis of effects on group variability 3.4.5 Determinants of drug class effects on G-VR 3.4.6 Effect of duration of treatment
3.5 Discussion 70 3.6 References 74
CHAPTER 4 Effects of antihypertensive treatment on headache and blood pressure
variability
4.1 Summary 76 4.2 Introduction 77 4.3 Methods 78
4.3.1 Search strategy
4.3.2 Analysis 4.4 Findings 79
4.4.1 Data collection 4.4.2 Effect of drug class on the incidence of headache versus placebo 4.4.3 Effect of drug class on the incidence of headache versus other drugs 4.4.4 Effect of drug class on blood pressure variability
4.5 Discussion 84 4.6 References 88
CHAPTER 5 Frequency, validity and prognostic value of residual hypertension: home
versus ambulatory blood pressure after TIA or non-disabling stroke
5.1 Summary 91 5.2 Introduction 92 5.3 Methods 93
5.3.1 Study population 5.3.2 Procedures 5.3.3 Analysis 5.3.4 Statistical analysis
5.4 Findings 97
5.4.1 Study population 5.4.2 Associations with markers of hypertensive arteriopathy 5.4.3 Associations with premorbid blood pressure 5.4.4 Prediction of the risk of cardiovascular events 5.4.5 Effect of age 5.4.6 Effect of duration of monitoring
5.5 Discussion 108 5.6 References 112
viii
CHAPTER 6 Validity of day-to-day variability and maximum SBP on multi-day home versus single-day ambulatory monitoring: frequency versus duration?
6.1 Summary 115 6.2 Introduction 116 6.3 Methods 117
6.3.1 Procedures 6.3.2 Analysis 6.3.3 Statistical analysis
6.4 Findings 120
6.4.1 Study population 6.4.2 Association between variability and maximum BP with clinical characteristics 6.4.3 Clinical determinants of variability and maximum SBP 6.4.4 Distribution of variability and maximum SBP by age and gender 6.4.5 Associations of premorbid variability and maximum BP with ABPM and HBPM
6.5 Discussion 133 6.6 References 137 CHAPTER 7 Validation of the Montreal Cognitive Assessment (MoCA) versus Mini-
Mental State Examination (MMSE) against hypertension and hypertensive arteriopathy in patients with TIA or minor stroke
7.1 Summary 140 7.2 Introduction 141 7.3 Methods 142
7.3.1 Procedures 7.3.2 Analysis 7.3.3 Statistical analysis
7.4 Findings 144
7.4.1 Study population 7.4.2 Associations of home SBP with MOCA versus MMSE scores 7.4.3 Associations of premorbid SBP with MOCA versus MMSE scores 7.4.4 Associations of hypertensive arteriopathy with MOCA versus MMSE scores 7.4.5 Relationship between cognitive subdomains and mean or maximum BP 7.4.6 Associations of variability and maximum SBPM with hypertensive arteriopathy 7.4.7 Predictive value of variability and maximum BP for cardiovascular events
7.5 Discussion 154 7.6 References 158
CHAPTER 8 Effects of antihypertensive drug classes and their combination on within-
individual day-to-day variability in home blood pressure
8.1 Summary 161 8.2 Introduction 162 8.3 Methods 163
8.3.1 Study population 8.3.2 Analysis 8.3.3 Statistical analysis
8.4 Findings 165
8.4.1 Study population 8.4.2 Baseline characteristics 8.4.3 Unadjusted drug class effects on global SBP variability 8.4.4 Adjusted drug class effects on global SBP variability 8.4.5 Differences in drug class effects by time of day
8.5 Discussion 172 8.6 References 176
ix
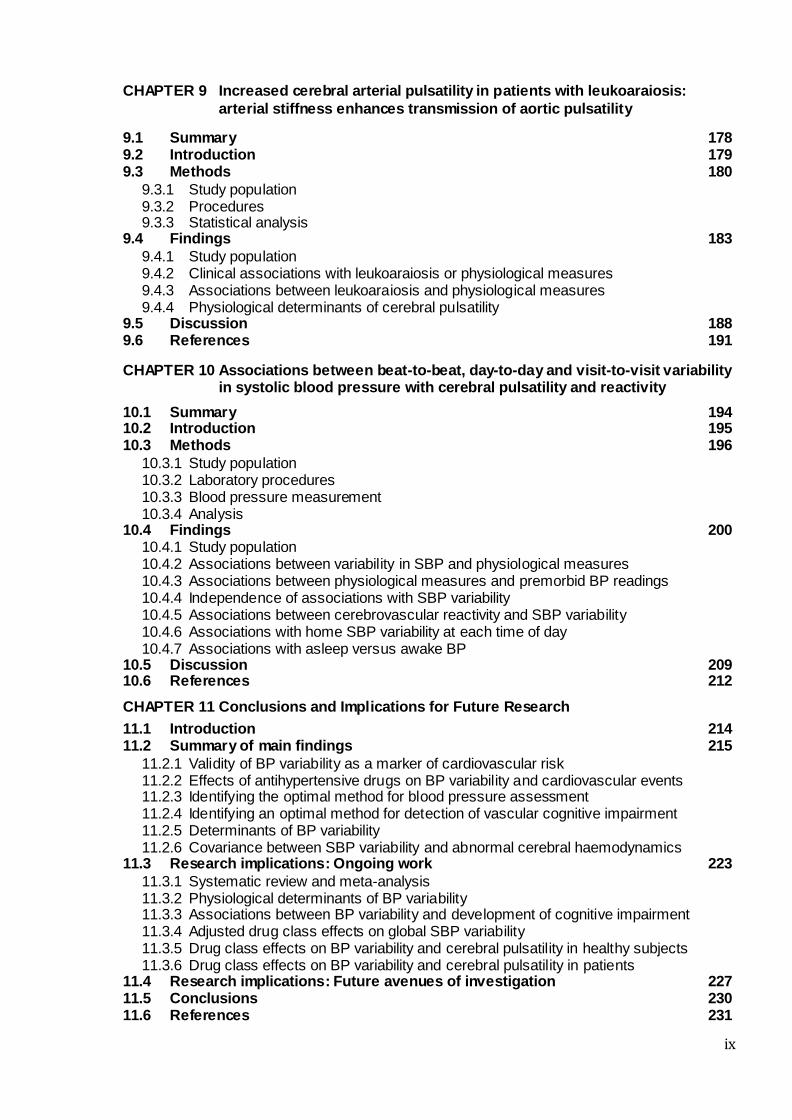
CHAPTER 9 Increased cerebral arterial pulsatility in patients with leukoaraiosis:
arterial stiffness enhances transmission of aortic pulsatility
9.1 Summary 178 9.2 Introduction 179 9.3 Methods 180
9.3.1 Study population 9.3.2 Procedures 9.3.3 Statistical analysis
9.4 Findings 183
9.4.1 Study population 9.4.2 Clinical associations with leukoaraiosis or physiological measures 9.4.3 Associations between leukoaraiosis and physiological measures 9.4.4 Physiological determinants of cerebral pulsatility
9.5 Discussion 188 9.6 References 191
CHAPTER 10 Associations between beat-to-beat, day-to-day and visit-to-visit variability in systolic blood pressure with cerebral pulsatility and reactivity
10.1 Summary 194 10.2 Introduction 195 10.3 Methods 196
10.3.1 Study population 10.3.2 Laboratory procedures 10.3.3 Blood pressure measurement 10.3.4 Analysis
10.4 Findings 200 10.4.1 Study population 10.4.2 Associations between variability in SBP and physiological measures 10.4.3 Associations between physiological measures and premorbid BP readings 10.4.4 Independence of associations with SBP variability 10.4.5 Associations between cerebrovascular reactivity and SBP variability 10.4.6 Associations with home SBP variability at each time of day 10.4.7 Associations with asleep versus awake BP
10.5 Discussion 209 10.6 References 212
CHAPTER 11 Conclusions and Implications for Future Research
11.1 Introduction 214 11.2 Summary of main findings 215
11.2.1 Validity of BP variability as a marker of cardiovascular risk 11.2.2 Effects of antihypertensive drugs on BP variability and cardiovascular events 11.2.3 Identifying the optimal method for blood pressure assessment 11.2.4 Identifying an optimal method for detection of vascular cognitive impairment 11.2.5 Determinants of BP variability 11.2.6 Covariance between SBP variability and abnormal cerebral haemodynamics
11.3 Research implications: Ongoing work 223
11.3.1 Systematic review and meta-analysis 11.3.2 Physiological determinants of BP variability 11.3.3 Associations between BP variability and development of cognitive impairment 11.3.4 Adjusted drug class effects on global SBP variability 11.3.5 Drug class effects on BP variability and cerebral pulsatility in healthy subjects 11.3.6 Drug class effects on BP variability and cerebral pulsatility in patients
11.4 Research implications: Future avenues of investigation 227 11.5 Conclusions 230 11.6 References 231
x
LIST OF APPENDICES
Appendix 1 Glossary of abbreviations 233
Appendix 2 Characteristics of trials providing individual patient data 235
Appendix 3 Medication use during follow-up in trials with individual patient data. 242
Appendix 4 Additional trials included in meta-analysis of G-VR 244
Appendix 5 Protocol: A study of the association between blood pressure variability, blood 270 pressure control and clinical outcomes in patients with transient ischaemic
attack or strokes Appendix 6 Protocol: A pilot study into the relationship between differences in variability in 278
systolic blood pressure, blood pressure control mechanisms and cerebrovascular autoregulation
Appendix 7 Protocol: A physiological study to determine relationships between changes in 290
variability in systolic blood pressure, arterial stiffness, aortic blood pressure and cerebrovascular pulsatility
xi
Table of Tables
Table Table title Page
2.1 Details of studies included in systematic review 33 2.2
Pooled estimates of the relationship between coefficient of variation of SBP
and DBP and risk of stroke, myocardial infarction and cardiovascular death, with exposure and outcome periods temporally separated.
40
2.3
Pooled estimates of the relationship between CV of SBP and risk of stroke, myocardial infarction and cardiovascular death, for all trials and trials in patients with prior renal disease, cerebrovascular disease or diabetes
43
3.1 Characteristics of included trials 55
3.2
Results of fixed and random effects meta-analyses comparing incidence of major cardiovascular outcomes in patients randomised to drug classes that reduce SBP variability compared to other drug classes
60
3.3
Results of fixed and random effects meta-analyses comparing drug class effects on incidence of stroke, stratified by effects during the first year of
treatment compared to after the first year of treatment
69
5.1
Population characteristics in patients undergoing home blood pressure
monitoring (HBPM) and undergoing ambulatory monitoring (ABPM)
98
5.2
Relationships between mean SBP on 7 days of Home (HBPM) monitoring vs.
24-hour ambulatory (ABPM) monitoring with premorbid SBP, markers of hypertensive arteriopathy and cerebral leukoaraiosis
100
5.3
Relationships between mean diastolic BP on 7 days of Home (HBPM) monitoring vs. 24-hour ambulatory (ABPM) monitoring with premorbid DBP, markers of hypertensive arteriopathy and cerebral leukoaraiosis
101
5.4
Relationships between mean SBP on 7 days of home (HBPM) monitoring vs. 24-hour ambulatory (ABPM) monitoring with premorbid SBP, markers of
hypertensive arteriopathy and cerebral leukoaraiosis, in patients over versus under 65 years of age
103
5.5
Accuracy of home versus ambulatory blood pressure monitoring for identification of premorbid hypertension
105
5.6
Hazard ratios for the risk of each event for either hypertensive versus normotensive patients or per 10mmHg increase in SBP, defined by either home or ambulatory blood pressure monitoring
107
6.1
Associations between variability and maximum SBP and DBP on premorbid, home (HBPM) and ambulatory (ABPM) blood pressure monitoring
121
6.2
Relationships between clinical characteristics and all blood pressure indices in multivariate general linear models
122
6.3
Unadjusted relationships between clinical characteristics and SBP variability on premorbid, home and ambulatory blood pressure readings
124
6.4
Unadjusted relationships between clinical characteristics and minimum or maximum systolic blood pressure on premorbid, home and ambulatory blood
pressure readings
125
6.5
Relationships between variability in SBP or maximum SBP and markers of hypertensive arteriopathy and premorbid hypertension, according to duration
of monitoring
128
xii
6.6
Hazard ratios for the risk of each event per 10mmHg increase in maximum
SBP or 1% increase in CV-SBP, defined by ABPM or different periods of home monitoring
130
6.7
Relative strength of association between mean, maximum and variability in SBP with hypertensive arteriopathy, cardiovascular events and all -cause mortality
132
7.1
Clinical characteristics of patients according to severity of cognitive impairment, as defined by the MOCA
145
7.2
Differences in mean and maximum SBP on home, ambulatory and premorbid readings, in patients with different degrees of cognitive impairment defined
by MMSE versus MOCA
147
7.3
Differences in mean and maximum DBP on home, ambulatory and premorbid
readings, in patients with different degrees of cognitive impairment defined by MMSE versus MOCA
148
7.4
Differences in mean and maximum SBP on home readings at different times of day between different degrees of cognitive impairment defined by MMSE versus MOCA
149
7.5
Risk of lower cognitive scores on the MOCA or MMSE with increased markers of hypertensive arteriopathy
150
7.6
Unadjusted risk of having a lower score on each subdivision of the MOCA and MMSE per 10mmHg increase in mean SBP
152
7.7
Risk of having a lower score on each subdivision of the MOCA and MMSE per 10mmHg increase in mean SBP, adjusted for age and gender.
153
8.1
Characteristics of individuals starting a drug or increasing the dose for each drug class
165
8.2
Differences in baseline systolic BP and SBP variability and percentage change in each measure 8 days after starting or increasing the dose of each
class of antihypertensive drug
166
8.3
Differences in baseline diastolic BP and DBP variability and percentage
change in each measure 8 days after starting or increasing the dose of each class of antihypertensive drug
167
8.4
Effect of drug class allocation on change in variability in SBP, adjusted for major cardiovascular risk factors and demographic characteristics
169
8.5
Effect of drug class allocation on change in variability in SBP, adjusted for major cardiovascular risk factors and demographic characteristics
170
9.1
Demographic characteristics of patients according to severity of leukoaraiosis
183
9.2
Relationships between physiological measures and demographic characteristics
184
9.3
Associations of severity of leukoaraiosis and middle cerebral artery pulsatility in multivariate models including demographic and physiological variables
187
10.1 Population characteristics 200
10.2
Associations between measures of blood pressure variability and determinants of cerebral pulsatility
202
xiii
10.3
Associations between premorbid blood pressure measures, cerebral
pulsatility, cerebral reactivity and determinants of cerebral pulsatility
203
10.4
Associations between measures of cerebrovascular reactivity to CO2 with
SBP variability on home and beat-to-beat readings and with mean velocity and pulsatility of cerebral blood flow
205
10.5
Associations between day-to-day variability in SBP at each time of day with cerebral pulsatility, cerebrovascular reactivity and determinants of cerebral pulsatility
206
10.6
Associations between awake or asleep mean BP, and the difference between them, with physiological measures
208
11.1 Summary of conclusions 215
11.2 Implications for clinical practice 222 11.3 Outstanding research i ssues 228
xiv
Table of Figures
Figure Figure Title Page
1.1
Annual incidence of cardiovascular events at Framingham after 18 years of follow up.
5
1.2
Mortality rate in each decade of age versus usual blood pressure at the start of the decade for Stroke and Ischaemic heart disease
7
1.3
Relative risk reduction following randomisation to each class of antihypertensive drug compared to placebo for coronary heart disease and stroke
10
1.4
Hazard ratios for risk of any subsequent stroke by deciles of SD SBP based in the UK-TIA trial, with the first decile as the reference category
17
1.5
Distribution of patients in the two treatment groups in ASCOT -BPLA according to deciles of mean, SD and VIM of SBP and the association of
each of these variables with risk of stroke and risk of coronary events
18
1.6
Pooled estimates of within-trial comparisons between drug classes at
follow-up as the ratio of variances or the difference in percentage change in coefficient of variation compared to baseline
20
2.1
Forest plot of the relationship between CV-SBP and risk of stroke, adjusted for age, gender and mean SBP
36
2.2
Funnel plots for adjusted hazard ratios for the risk of stroke, myocardial infarction and cardiovascular death, per SD increase in CV-SBP
37
2.3
Forest plot of the relationship between CV-SBP and risk of myocardial infarction, adjusted for age, gender and mean SBP
38
2.4
Forest plot of the relationship between CV-SBP and risk of cardiovascular death, adjusted for age, gender and mean SBP
39
2.5
Estimates of the fully adjusted relationship between CV-SBP and risk of stroke, stratified by baseline age or SBP, pooled by random effects meta -analysis
42
3.1
Effect of treatment allocation on within-individual variability of SBP (I-VR) and inter-individual variation in group mean SBP (M-VR) pooled by random-
effects meta-analysis
61
3.2
Pooled analyses of within-trial differences in group variation in SBP for
each drug class versus either placebo, each other drug class, or all other drug classes combined
63
3.3
Pooled analyses of within-trial differences in group variation in DBP for each drug class versus either placebo, each other drug class, or all other drug classes combined
64
3.4
Relationship between meta-analyses of effect of randomised treatment allocation on G-VR (ratio of variances of group SBP on follow-up) from
crossover-design trials versus parallel-group design trials
65
3.5
Random-effects meta-analysis of the effect of randomisation to each class
of antihypertensive compared to all others on variability in SBP, stratified by the relative half-life of the drugs compared
66
xv
3.6
Random effects meta-analysis of the effect of randomisation to drug classes reducing variability in SBP compared to drug classes increasing
variability in SBP, stratified by patient characteristics at baseline
67
3.7
Effect of randomisation to each class of antihypertensive on variability in
SBP at different timepoints after randomisation
68
4.1
Effect of class of antihypertensive agent on incidence of headache
compared to other antihypertensive classes or placebo
80
4.2
Effect of each dihydropyridine calcium channel blocker on incidence of
headache compared to other antihypertensive classes or placebo
82
4.3
Relationship between variability in systolic blood pressure and incidence of
headache in all trials reporting both measures, according to drug class
83
5.1
Relationship between systolic and diastolic blood pressure on ambulatory
(ABPM) and either 1 day or 7 days of home (HBPM) blood pressure monitoring
97
5.2
Receiver operator characteristic curves for identification of premorbid hypertension by mean SBP on HBPM vs. ABPM, stratified by age
105
5.3
Kaplan-Meier curves of cardiovascular events occurring after blood pressure monitoring, by hypertensive status defined by either HBPM or ABPM
106
6.1
Relationship between systolic or diastolic blood pressure measures with age and gender
126
6.2
Relationship between systolic blood pressure measures with age and gender at each time of day on HBPM
127
8.1
Percentage change in variability in systolic blood pressure after starting or increasing the dose of each class of drug
168
8.2
Differences between change in variability or maximum SBP after initiation of drugs associated with lower SBP variability, higher SBP variability or a
combination
171
9.1
Relationship between severity of leukoaraiosis and stiffness or pulsatility in
the aorta and middle cerebral artery
185
9.2
Associations between middle cerebral artery pulsatility index (MCA-PI) and
aortic pulse wave velocity, MCA transit time, aortic pulse pressure and aortic diastolic blood pressure.
186
10.1
Differences in home and beat-to-beat blood pressure variability by tertile of middle cerebral artery mean velocity and pulsatility index
201
10.2
Differences in home and beat-to-beat blood pressure variability by tertile of middle cerebral artery reactivity to breath holding or hyperventilation
204
11.1
Random-effects meta-analysis of the effects of randomisation to different classes of antihypertensive medications in comparison to all other classes on the incidence of patient reported fatigue
224
11.2
Strength of association between variations in multiband BOLD MRI signal and arterial pulsations in blood pressure
226
1
CHAPTER ONE
Introduction
1.1 Stroke and Hypertension 2
1.1.1 The burden of stroke and hypertension 2
1.1.2 The pathophysiology of hypertension and stroke 2
1.1.3 A potential new risk factor 3
1.2 The epidemiology of hypertension 3
1.2.1 Hypertension as a risk factor for cardiovascular disease 3
1.2.2 Usual blood pressure 5
1.2.3 The importance of systolic blood pressure 8
1.3 The treatment of hypertension 9
1.3.1 The efficacy of blood pressure reduction 9
1.3.2 Differences between blood–pressure lowering drug classes 10
1.3.3 Current guidelines on the management of hypertension 12
1.4 Short term blood pressure variability 13
1.4.1 Diurnal blood pressure variability 13
1.4.2 Situational blood pressure variability 14
1.5 Visit-to-visit blood pressure variability 15
1.5.1 Previous evidence for the importance of visit-to-visit variability 15
1.5.2 Visit-to-visit variability as a new, independent risk factor for stroke 16
1.5.3 Randomised treatment reduces visit-to-visit variability and stroke risk 17
1.6 Conclusions and Aims 21
1.7 References 23
2
1.1 Stroke and Hypertension
1.1.1 The burden of stroke and hypertension
Stroke is the leading cause of morbidity in the United Kingdom and the third leading
cause of death. Approximately 1,200,000 people are living with the consequences of stroke,
with 150,000 new strokes per year,1 including 56,0002 fatal events. It costs the National
Health Service approximately 6% of its total budget3 in direct costs, and is a major cause of
dementia.4 As result, its prevention and treatment as part of the National Stroke Strategy5
forms a major part of the National Service Framework for Older People.6
Hypertension is one of the most prevalent diseases worldwide and the strongest
modifiable risk factor for stroke. It affected over a quarter of the world’s population in 2000
and is set to rise to approximately 29% of the population by 2025, affecting 1.56 billion
people.7, 8 A mean systolic blood pressure (SBP) >115mmHg explains 50-60% of the
worldwide population attributable risk of stroke9-11 and an increment of 20mmHg SBP
doubles the risk of stroke between 40-69 years of age.9 Randomisation to a treatment
which reduces mean SBP results in a significant reduction in cardiovascular events with a
5-6mmHg decrease in diastolic pressure resulting in a 33-50% reduction in stroke and a 4-
22% reduction in acute coronary events.12 Nonetheless, only approximately 50% of patients
with hypertension receive treatment in both the UK13 and the rest of the world,14 resulting in
a significant excess burden of cerebrovascular disease.15
1.1.2 The pathophysiology of hypertension and stroke
The pathophysiological relationship between hypertension and stroke is complex.
Firstly, hypertension causes accelerated atherosclerosis, contributing to the pathogenesis
of large artery disease;16 secondly, it causes hypertensive and ischaemic heart disease
resulting in atrial fibrillation17 and post-infarction mural thrombosis, with subsequent
cardioembolic stroke; thirdly it is associated with arteriosclerosis, lipohyalinosis and the
3
development of leukoaraiosis, lacunar strokes and vascular dementia.18 A strong
relationship between small vessel disease and hypertension has been suggested by
hospital-based cohort studies, although these studies probably overestimate this
relationship when population based cohorts are also included.19 Nonetheless, there are
clear relationships between hypertension and all aetiological subtypes of stroke.
1.1.3 A potential new risk factor
Professor Peter Rothwell recently demonstrated that medium-term systolic blood
pressure variability from one clinic visit to another (visit-to-visit variability) and the maximum
blood pressure recorded are strongly predictive of the subsequent risk of stroke,
independent of mean SBP.20, 21 Both variability in SBP and risk of stroke were reduced by
amlodipine, a calcium channel blocker, and increased by atenolol, a beta-blocker.22 This
represents a major shift in our understanding of hypertension and its treatment, although
only the latest in the long line of paradigm shifts which have characterised hypertension
research. This newly identified risk factor was initially only thoroughly investigated by one
group, and although other groups have since confirmed its importance, it still creates more
questions than answers, both in terms of its validity, its pathophysiological basis and its
relevance to clinical practice. However, before these questions can even be framed, it is
necessary to understand how this finding fits into our overall understanding of hypertension.
1.2 The Epidemiology of Hypertension
1.2.1 Hypertension as a risk factor for cardiovascular disease
Systolic blood pressure, measured by palpation, was the first measureable index of
blood pressure following its discovery by Rev Stephen Hales,23 until Riva-Rocci developed
his sphygmomanometer.24 This invention allowed Korotkoff to hear five transitions in blood
pressure on auscultation of a partially occluded brachial artery, so identifying the diastolic
pressure.25 Diastolic blood pressure then dominated clinical practice, even though there
was no specific evidence that it was more closely associated with cardiovascular outcomes
4
than any other index. This probably reflected the clinical experience of practicing physicians
in treating malignant hypertension and its complications in younger patients, such as that
which took the life of Franklin Roosevelt.26 The clinical benefits of lowering diastolic blood
pressure were then confirmed in trials of patients with malignant hypertension, before any
reliable evidence existed that the chronic treatment of blood pressure reduced
cardiovascular disease, reinforcing the prevailing view that diastolic blood pressure was of
primary importance.27, 28
The first epidemiological evidence that chronically elevated blood pressure was
associated with cardiovascular events and mortality arose from actuarial29 and industrial
data.30 These findings were soon confirmed in a series of prospective observational
studies.31-34 The five most comparable of these studies were combined in the first major
attempt to combine observational data measuring the association between risk factors and
cardiovascular outcomes, the Epidemiology Pooling Project,35 which demonstrated a
strong, continuous relationship between diastolic or systolic blood pressure and the
incidence of cardiovascular events and mortality, with approximately twice the risk of
coronary events for patients in the top quintile of either diastolic or systolic BP compared to
the bottom quintile. However, although this reported an ‘almost identical’ relationship with
diastolic or systolic BP, it was commonly misinterpreted as demonstrating a stronger
relationship with DBP.36 This propagated the view that DBP alone provided sufficient
information to base both clinical decision-making and further research upon. This is shown
by its use as the sole blood pressure inclusion criterion in the early randomised controlled
trials of antihypertensive treatment,37-40 and as the most commonly reported intermediate
outcome measure, often without reporting of SBP. Such was the dominance of DBP that
systolic blood pressure did not appear in the Joint National Committee’s guidelines on the
diagnosis and management of hypertension until 1993. 41
5
1.2.2 Usual blood pressure
Although there had been extensive research into the relationship between blood
pressure and cardiovascular disease, a precise quantification of the relationship between
diastolic blood pressure and cardiovascular events was only reached in 1990 with the
concept of ‘Usual’ blood pressure. 12, 42 This population-based statistical measurement uses
the ‘regression dilution ratio’ to adjust the risk relationship between measured blood
pressure and cardiovascular events for the effect of regression to the mean. This
systematic bias occurs when patients at the extremes of a distribution tend to have blood
pressures closer to the population mean at follow up, independent of intervention, resulting
in an under-estimation of the risk of subsequent cardiovascular events for a given blood
pressure. Using this technique, it has been shown that there is a continuous relationship
between average diastolic or systolic blood pressure and vascular mortality,9 coronary
artery disease,9, 42 stroke,9, 42 heart failure,43 peripheral artery disease44 and end-stage
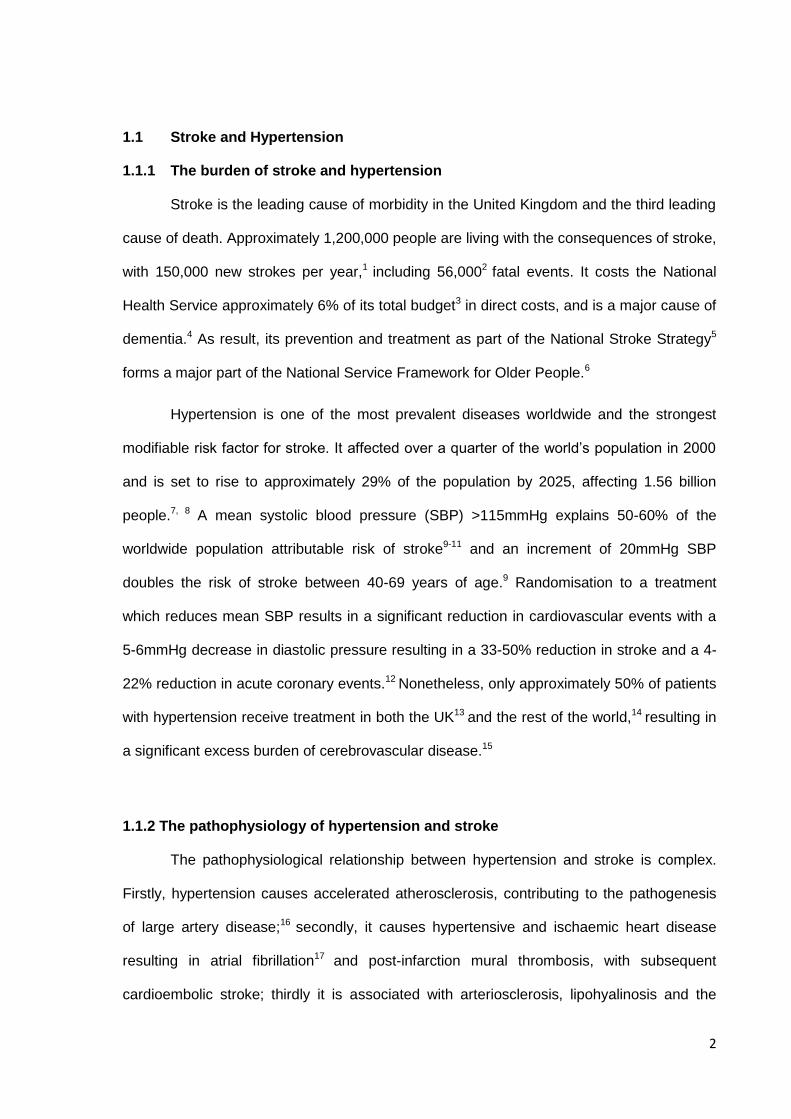
Figure 1.1 Annual incidence of cardiovascular events at Framingham after 18 years of follow up. Data is presented by level of diastolic or systolic blood pressure, pooled for men and women. Derived from Anderson et al.
34
6
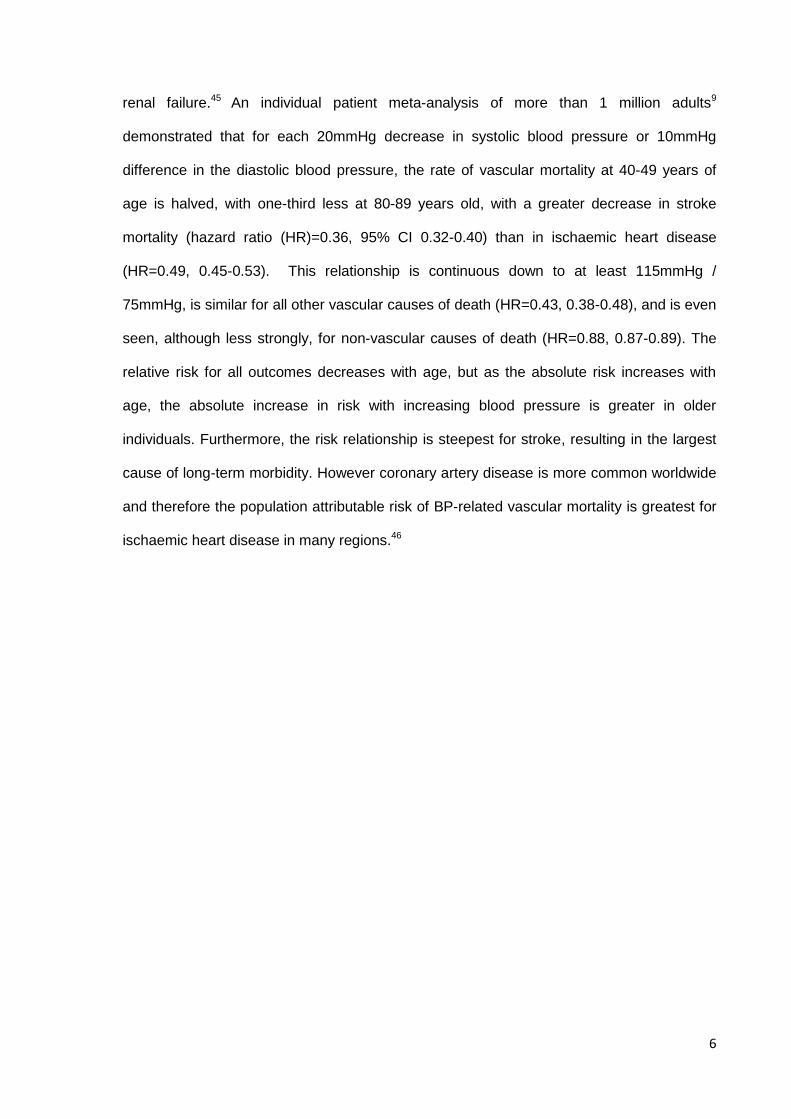
renal failure.45 An individual patient meta-analysis of more than 1 million adults9
demonstrated that for each 20mmHg decrease in systolic blood pressure or 10mmHg
difference in the diastolic blood pressure, the rate of vascular mortality at 40-49 years of
age is halved, with one-third less at 80-89 years old, with a greater decrease in stroke
mortality (hazard ratio (HR)=0.36, 95% CI 0.32-0.40) than in ischaemic heart disease
(HR=0.49, 0.45-0.53). This relationship is continuous down to at least 115mmHg /
75mmHg, is similar for all other vascular causes of death (HR=0.43, 0.38-0.48), and is even
seen, although less strongly, for non-vascular causes of death (HR=0.88, 0.87-0.89). The
relative risk for all outcomes decreases with age, but as the absolute risk increases with
age, the absolute increase in risk with increasing blood pressure is greater in older
individuals. Furthermore, the risk relationship is steepest for stroke, resulting in the largest
cause of long-term morbidity. However coronary artery disease is more common worldwide
and therefore the population attributable risk of BP-related vascular mortality is greatest for
ischaemic heart disease in many regions.46
7
2)
1)
Figure 1.2 Mortality rate in each decade of age versus usual blood pressure at the start of the decade for 1) Stroke and 2) Ischaemic heart disease. Derived from Lewington et al.
9
8
1.2.3 The importance of systolic blood pressure
Belief in the primary importance of DBP persisted until the mid-1990s, with the
earliest derivations of ‘Usual’ blood pressure being based solely upon DBP.12, 42 This was
probably due to the influence of the Epidemiology Pooling Project,35 clinical teaching and
the impact of the early randomised clinical trials of antihypertensive drugs, recruitment to
which was almost entirely based upon diastolic blood pressure. This trial criterion resulted
from the FDA only requiring drug companies to show a reduction in DBP, not SBP.
However, even as early as 1971 the Framingham study had demonstrated that systolic
blood pressure was more informative for predicting coronary artery disease risk than
diastolic blood pressure in a specified population.47 Stamler et al. then demonstrated the
importance of SBP across the entire US population,48 and a number of studies in elderly
populations have since demonstrated an inverse relationship between diastolic blood
pressure and cardiovascular outcomes for any given systolic blood pressure.49-51 The most
precise estimate available, from the Prospective Collaborative Study Group, showed that
diastolic and systolic BP were equally informative in the prediction of stroke and coronary
artery disease, although this analysis was dominated by studies in younger individuals.9
Overall, these studies reflect the fact that DBP falls with age whilst SBP rises, causing an
increase in the prevalence of isolated systolic hypertension.49, 52 Systolic hypertension is
therefore the most prevalent form in this highest risk group, resulting in a greater
proportional burden of disease due to systolic hypertension than diastolic hypertension.
This has led to a number of trials in patients with isolated systolic hypertension,53, 54 that
have demonstrated that the treatment of isolated systolic hypertension >160mmHg still has
significant benefits with a 13% reduction in total mortality, a 23% reduction in coronary
events and a 30% reduction in stroke,51 with similar effects even in the very elderly.55
9
1.3 The treatment of hypertension
1.3.1 The efficacy of blood pressure reduction
The earliest trials of blood-pressure lowering drugs demonstrated that the acute
control of blood pressure in the setting of malignant hypertension provided significant
reductions in mortality, renal failure and heart failure.56-59 However doubts persisted about
whether chronic control of less severe hypertension would be of benefit, especially in
patients with established cerebrovascular disease due to concerns that a reduction in blood
pressure would impair cerebral perfusion. The first small, randomised controlled trials
demonstrated that new blood pressure lowering therapies such as chlorothiazide28 or
pronethanol60 were safe. Then a series of trials from the Veterans Administration
demonstrated a relative risk reduction in all cardiovascular events of >90% for active
treatment of patients with a diastolic blood pressure >115mmHg,38, 39 and 73% for patients
with a DBP 90-114mmHg, with similar effects in stroke survivors.40 This started 30 years of
intensive investigation of antihypertensive agents versus placebo in a wide range of clinical
circumstances, from the first Australian National Blood Pressure study61 through to the
MRC trials in mild hypertension, 62 and the elderly,63 amongst others,64, 65 all demonstrating
a significant reduction in cardiovascular risk from the reduction of average blood pressure in
a wide range of patients, with a greater reduction with more aggressive treatment.66, 67
Pooled analyses of these trials confirmed the relationship demonstrated by the
observational studies described above, with randomisation to a treatment which lowers
DBP by 5-6mmHg reducing incidence of stroke by 35-40% and coronary artery disease by
20-25%.12, 68
The early trials focused on diuretics and beta-blockers in comparison to placebo,
demonstrating the efficacy of blood pressure lowering at different levels of baseline blood
pressure,69 in men and women,70 in isolated systolic hypertension,53 in patients with
10
diabetes,71 and for many other demographic characteristics. Across all patient groups,
blood pressure lowering was shown to be efficacious in the reduction of subsequent
cardiovascular events, including in the secondary prevention of stroke, with a 24%
reduction in the risk of recurrent stroke across all trials72 and a 43% reduction in the risk of
recurrent stroke following randomisation to a combination of perindopril and indapamide in
particular.73 Whether to reduce blood pressure below 130/80 is still debated, with
proponents for and against the existence of a J-shaped curve. Nonetheless, virtually all
trials have demonstrated a continuous reduction in the subsequent risk of stroke with
lowering blood pressure, without an apparent threshold below which there is no benefit.
This is in contrast to coronary artery disease in which some trials suggest an increased
mortality at lower BP levels,74-76 but recent trials such as Cardio-SIS77 demonstrated that
treating to a target below 130/80 in hypertensive people is still associated with further
reductions in mortality (HR=0.50, 0.31-0.79).
1.3.2 Differences between blood–pressure lowering drug classes
Differences in the incidence of cardiovascular outcomes between drug classes are
less clear than their absolute effectiveness in lowering blood pressure. Given the proven
efficacy of blood pressure lowering treatment, it became unethical to carry out further
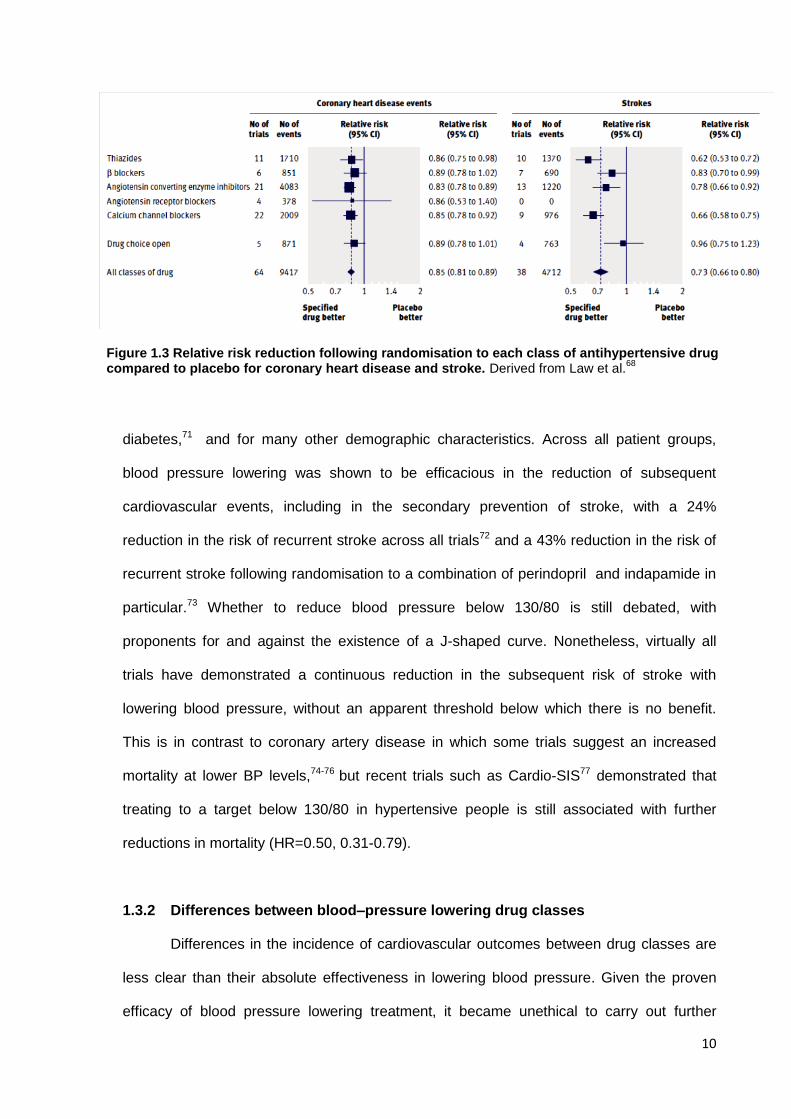
Figure 1.3 Relative risk reduction following randomisation to each class of antihypertensive drug compared to placebo for coronary heart disease and stroke. Derived from Law et al.
68
11
placebo-controlled trials. Therefore the 1990s and 2000s were dominated by trials
comparing different drug regimens, and specifically comparing newer agents such as
angiotensin converting enzyme inhibitors (ACEI), angiotensin-receptor blockers (ARBs) or
calcium channel blockers (CCBs) with diuretics or beta-blockers. The majority of these
trials, such as STOP-2,54 did not demonstrate major differences between the newer and
older agents and a number of meta-analyses have demonstrated no difference or only
small differences between drug classes in effects on cardiovascular outcomes (figure
1.3).68, 69, 78 Unfortunately, most studies allow a high rate of add-on use of drugs from other
classes, obscuring drug class differences. Despite this, a number of trials have shown
specific differences between agents which are not explained on the basis of blood-pressure
lowering alone. These include the marked difference in the risk of stroke between
amlodipine+/-perindopril and atenolol+/-bendroflumethiazide in the ASCOT-BPLA trial79
(combined endpoint HR=0.90, 0.79-1.02, stroke HR=0.77, 0.66-0.89).
Although relatively small, the differences seen in randomized trials result in frequent
class-effects. In comparison to other agents, in most trials calcium channel blockers show
an average 10% greater reduction in the subsequent risk of stroke, 68, 69 although there is
an increase in the subsequent risk of heart failure. Similarly, angiotensin receptor blockers
may show a greater reduction in the subsequent risk of stroke, independent of their effects
on mean BP, but results have been inconsistent between trials with the effect being non-
significant in meta-analyses.68, 72 In contrast, beta-blockers are superior to other agents in
the secondary prevention of ischaemic heart disease, particularly in the first three years
after a myocardial infarction,68, 80 but are less effective in the primary prevention of stroke,
so much so that they are no longer indicated as first-line treatment for hypertension.81, 82
12
1.3.3 Current guidelines on the management of hypertension
National guidelines from the Joint National Committee VII83 and the European
Societies Joint Task Force,46 and more locally from the National Institute for Clinical
Excellence (NICE)84 and the British Hypertension Society,85 have consolidated the huge
breadth of evidence on the treatment of hypertension into a set of consistent principles:
1. Treatment should be based on the demonstration of a persistently elevated
systolic or diastolic blood pressure on repeated measurements, as part of a
global assessment of cardiovascular risk;
2. Lifestyle interventions such as exercise, alcohol and salt reduction are a vital
part of management, and may be sufficient in mild hypertension;
3. Patients should be treated to a target of <140/90, with some guidelines
advocating a target of <130/80 in high risk groups (stroke, diabetes, chronic
kidney disease);
4. Specific indications exist for the use of certain antihypertensive agents as first-
line agents;
5. In the absence of specific indications, treatment should be initiated with a
calcium channel blocker, ACEI (or ARB) or low-dose diuretic. There is minimal
difference between these agents and guidelines differ on the first choice, with
JNC VII advising a low-dose diuretic first, whilst NICE favour calcium channel
blockers in the elderly (or diuretics when CCBs are contraindicated) and ACEi in
younger patients, followed by addition of the alternative agent then diuretics.
Beta-blockers are no longer indicated as first line treatment and have now been
superseded by spironolactone as the fourth choice agent;
6. The majority of hypertensive patients will ultimately require treatment with more
than one class of blood-pressure lowering drug, and so combination therapy
may be appropriate as a first line treatment option.
13
1.4 Short-term blood pressure variability
Although the prognostic significance of diastolic or systolic blood pressure have
been more extensively investigated than almost any other patient characteristic, with well
over a million patients examined in prospective observational cohorts9 and more than
500,000 patients randomized to blood pressure lowering treatments,68, 69 the importance of
variations in blood pressure have largely been ignored. Although it was recognized as early
as 1931 that there are marked variations in blood pressure from one clinic visit to the next,
with greater fluctuations in higher risk patients,86 the prognostic significance of this measure
has not been systematically investigated. This is due, at least in part, to the greater
logistical challenges in both the measurement and statistical analysis of blood pressure
variability,87, 88 especially in the era preceding automated blood pressure measuring
devices. With the unequivocal demonstration of the importance of absolute measures of
blood pressure, it appears that any potential prognostic significance of blood pressure
variability was largely ignored in favour of the definition and treatment of absolute
hypertension. However, with the advent of automated monitoring blood pressure devices,
the investigation of short-term variation in blood pressure became possible, focusing
particularly on situational and diurnal variations in blood pressure.
1.4.1 Diurnal blood pressure variability
In 1988, O’Brien et al demonstrated that the absence of the normal 10-20% dip in
nocturnal blood pressure was associated with an increased risk of stroke.89 Further studies
confirmed that increases in the night-day blood pressure ratio, and either non-dipping or
extreme nocturnal dipping were associated with increased cardiovascular risk, independent
of average 24 hour blood pressure.90 Similarly, a greater surge in blood pressure in the
morning independent of the baseline level is associated with increased mortality and
cardiovascular events,91 and the pattern of the surge closely follows the increased risk of
stroke in this time period.92 Overall, variability across 24 hours93 or during the awake
14
period,94 independent of the absolute blood pressure level, are associated with an
increased risk of cardiovascular outcomes. However, the increase in risk for diurnal BP
variability is only small in comparison to the predictive value of the average 24 hour blood
pressure, contributing 1-10% of the risk of all cardiovascular outcomes.93
1.4.2 Situational blood pressure variability
The second advantage of automated, home blood pressure monitoring equipment
was the ability to assess situational differences in blood pressure. This has demonstrated
marked differences in individuals and populations between readings obtained in the clinic
and at home, with home monitoring significantly improving blood pressure control, and likely
therefore to have prognostic benefits.95, 96 It has allowed the demonstration of both white-
coat hypertension (a consistent elevation in blood pressure on clinic measurements
compared to home) and ‘masked’ hypertension (an elevation on home monitoring, not
detected on clinic measurements). The former of these was originally felt not to have
prognostic value, but long-term follow-up suggests that it is predictive of future
hypertension97 and mortality,98 whilst masked hypertension is a strong predictor of
cardiovascular risk.99 In addition, causes of transient increases in blood pressure are known
triggers of stroke100, 101 whilst orthostatic hypertension102, 103 and hypotension104 are both
predictive of increased vascular risk. ‘Post-stroke’ hypertension is a commonly recognized
phenomenon, but may actually represent the tail-end of a causative, pre-event hypertensive
peak in some patients. This is suggested by a review of premorbid blood pressures in the
OXVASC prospective cohort which demonstrated that 74% of patients had had at least one
higher reading in the past, and that BP level is greater after TIA than major stroke.105 This
evidence is consistent with the ‘cardiovascular reactivity’ hypothesis: subgroups of patients,
particularly those with hostile personality traits,106 have greater blood pressure responses to
situational stress and are at greater cardiovascular risk,107 potentially through acute
hypertension induced events.
15
1.5 Visit-to-visit blood pressure variability
Even though short-term variations in blood pressure have been known to provide
additional prognostic information for more than 20 years, variations in blood pressure from
one clinic visit to the next have been viewed as an obstacle to the accurate measurement of
the underlying mean systolic and diastolic blood pressure.108, 109 This is in spite of no
systematic analysis of the prognostic importance of visit-to-visit blood pressure variability,
coupled with a focus on the importance of the absolute blood pressure level. The aim of
blood pressure measurement has been to estimate a patient’s ‘usual’ or ‘true’ blood
pressure by taking the average of multiple measurements. This reflects an inappropriate
extrapolation of the concept of ‘Usual’ blood pressure, a statistically defined population
measure, to the individual. For example, the current European guidelines state that ‘Blood
pressure…should be obtained over several months to define the patient’s usual blood
pressure as accurately as possible,46 whilst the American Heart Association states
‘conventional readings…are a surrogate for a patient’s true blood pressure, which is
conceived as an average over long periods of time.110 This philosophy is epitomised by a
recent analysis of the PROGRESS trial which suggested that visit-to-visit blood pressure
variability is ‘noise’ masking detection of the ‘signal’ of true blood pressure to such an
extent that blood pressure monitoring should be reduced or stopped once treatment has
started.111
1.5.1 Previous evidence for the importance of visit-to-visit variability
In contrast to the prevailing view prior to March 2010, there was already evidence
that visit-to-visit variability in blood pressure may be independently predictive of
cardiovascular risk. Firstly, the statistical adjustment used in deriving the ‘Usual’ blood
pressure is partly dependent upon the extent of within-individual variability in blood
pressure. The greater the within-individual variability in BP, the greater the degree of
regression to the mean, the larger the statistical adjustment,88 and the greater is the
amplification of the risk relationship between ‘Usual’ blood pressure and cardiovascular risk.
16
Secondly, the predictive value of mean blood pressure falls with age, whilst the incidence of
systolic hypertension and stroke both increase with age,15 even though the benefits of
reduction of blood pressure in the elderly are maintained.51, 55 This may partly be due to the
increase in blood pressure variability with age or comorbidities.88, 112 Thirdly, patients with
prior cerebrovascular disease have greater visit-to-visit blood pressure variability.87, 88, 112
Fourthly, limited evidence has been published from one observational cohort that medium-
term blood pressure variability independently predicts the subsequent risk of cardiovascular
events.113, 114
1.5.2 Visit-to-visit variability as a new, independent risk factor for stroke
The importance of visit-to-visit blood pressure variability in predicting the
subsequent risk of stroke was demonstrated in a series of papers in the Lancet and Lancet
Neurology in March 2010.20-22 Prof Peter Rothwell presented analyses of five prospective
cohorts of patients with hypertension or previous TIA or stroke (from the UK-TIA,115 ESPS
2,116 Dutch-TIA117 and ASCOT-BPLA79 trials) and two randomized controlled trials in
hypertensive patients (ASCOT-BPLA79 and MRC-elderly63). In the five prospective cohorts,
there was a marked increase in the risk of stroke with increasing deciles of visit-to-visit
variability in blood pressure, measured as either standard deviation (SD), the coefficient of
variation (SD/mean) or other derived measures of variability, including variation
independent of the mean (VIM). In the UK-TIA cohort, there was a >6 fold increase in the
subsequent risk of stroke comparing the highest decile of SD with the lowest (HR=6.22,
95% CI 4.16-9.29), which was even greater when excluding patients with previous stroke
(HR=8.23, 5.51-12.30) or evidence of previous infarction on CT (HR=10.44, 6.64-16.38),
figure 1.6. The risk of stroke was most strongly predicted by the maximum blood pressure,
adjusted for mean SBP (HR=15.01, 6.56-34.38). This demonstrates the importance of
episodic hypertension, with patients with severe episodic hypertension (lowest SBP <140
and highest >180) being at greater risk than patients with stable hypertension (all readings
>140mmHg) even though they had a lower mean SBP.
17
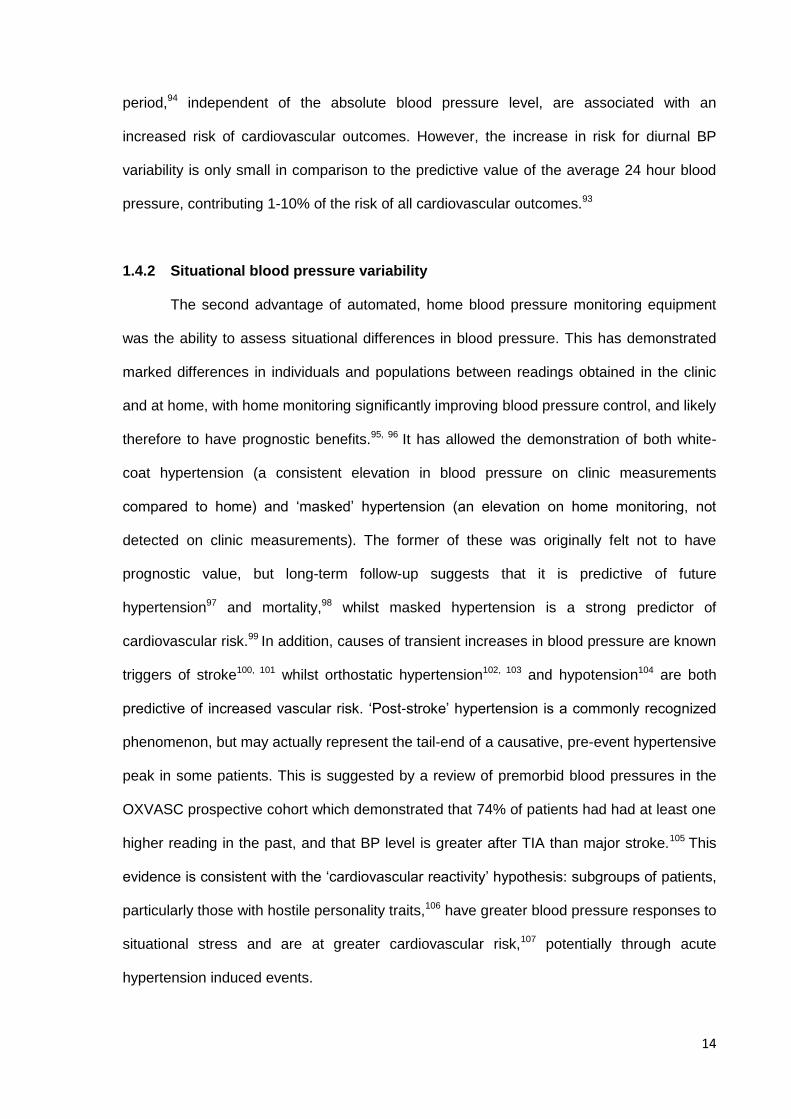
Visit-to-visit variability in SBP was a stronger predictor of the risk of stroke with
increasing precision of measurement (top decile of SD-SBP versus bottom decile in the UK-
TIA trial: 1-7 visits HR=6.22, 4.16-9.29; 1-10 visits HR=12.08, 7.40-19.72). The relationship
was seen across all five cohorts, and it persisted with adjustment for mean SBP, age, sex
and other baseline risk factors. Furthermore it was a stronger predictor of outcome than
short-term, SD of daytime SBP measured in the ASCOT-BPLA 24 hour ABPM substudy,
with only very weak predictive values for within-visit variability in SBP or the ‘white-coat’
effect. Finally, visit-to-visit variability was also a strong predictor of coronary events, heart
failure and angina, although not to the same extent as stroke.
1.5.3 Randomised treatment reduces visit-to-visit variability and stroke risk
ASCOT-BPLA randomised 19257 hypertensive patients aged 40-79 with 3 or more
additional cardiovascular risk factors to amlodipine with or without perindopril compared to
atenolol with or without bendroflumethiazide, resulting in a significantly lower visit-to-visit
variability in the amlodipine-based arm. Adjustment for differences in mean SBP alone
explained less than one third of the difference in the risk of stroke between the groups,
whilst adjustment for both mean SBP and SD-SBP explained all of the difference in
Figure 1.4 Hazard ratios for risk of any subsequent stroke by deciles of SD SBP based in the UK-TIA trial, with the first decile as the reference category. The left panel includes all patients. The panel on the right excludes patients with previous stroke. Derived from Rothwell et al.
20
18
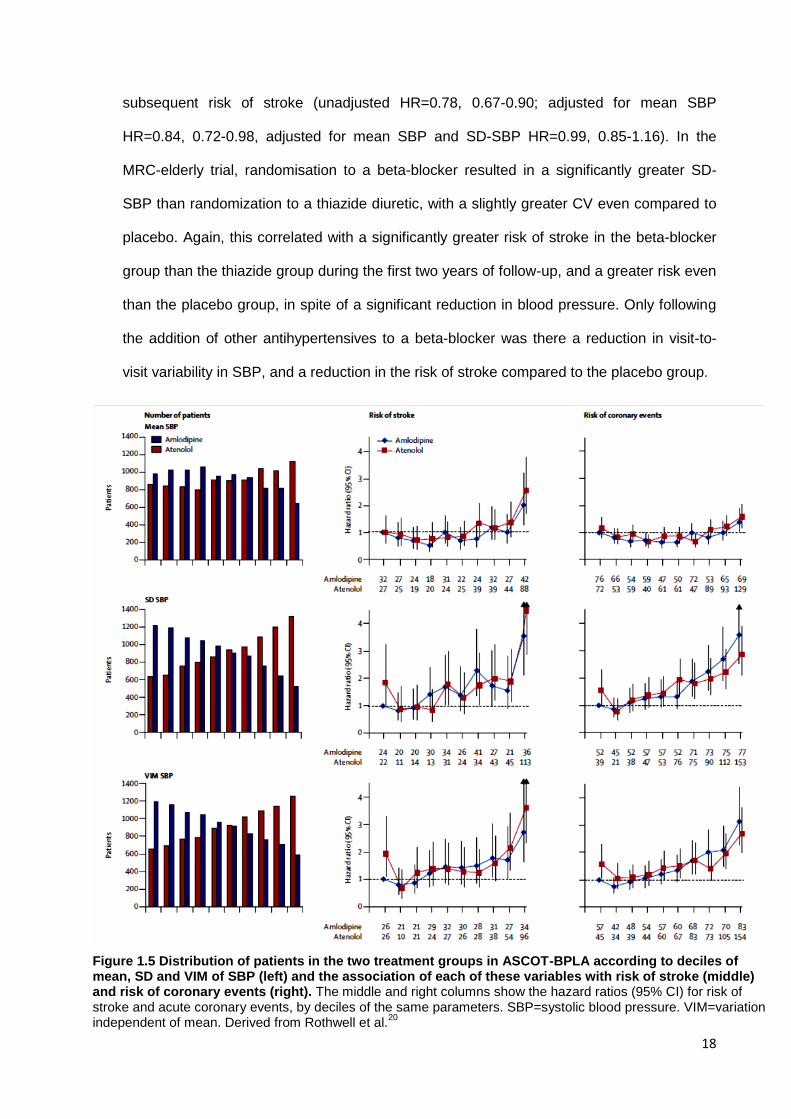
subsequent risk of stroke (unadjusted HR=0.78, 0.67-0.90; adjusted for mean SBP
HR=0.84, 0.72-0.98, adjusted for mean SBP and SD-SBP HR=0.99, 0.85-1.16). In the
MRC-elderly trial, randomisation to a beta-blocker resulted in a significantly greater SD-
SBP than randomization to a thiazide diuretic, with a slightly greater CV even compared to
placebo. Again, this correlated with a significantly greater risk of stroke in the beta-blocker
group than the thiazide group during the first two years of follow-up, and a greater risk even
than the placebo group, in spite of a significant reduction in blood pressure. Only following
the addition of other antihypertensives to a beta-blocker was there a reduction in visit-to-
visit variability in SBP, and a reduction in the risk of stroke compared to the placebo group.
Figure 1.5 Distribution of patients in the two treatment groups in ASCOT-BPLA according to deciles of mean, SD and VIM of SBP (left) and the association of each of these variables with risk of stroke (middle) and risk of coronary events (right). The middle and right columns show the hazard ratios (95% CI) for risk of stroke and acute coronary events, by deciles of the same parameters. SBP=systolic blood pressure. VIM=variation independent of mean. Derived from Rothwell et al.
20
19
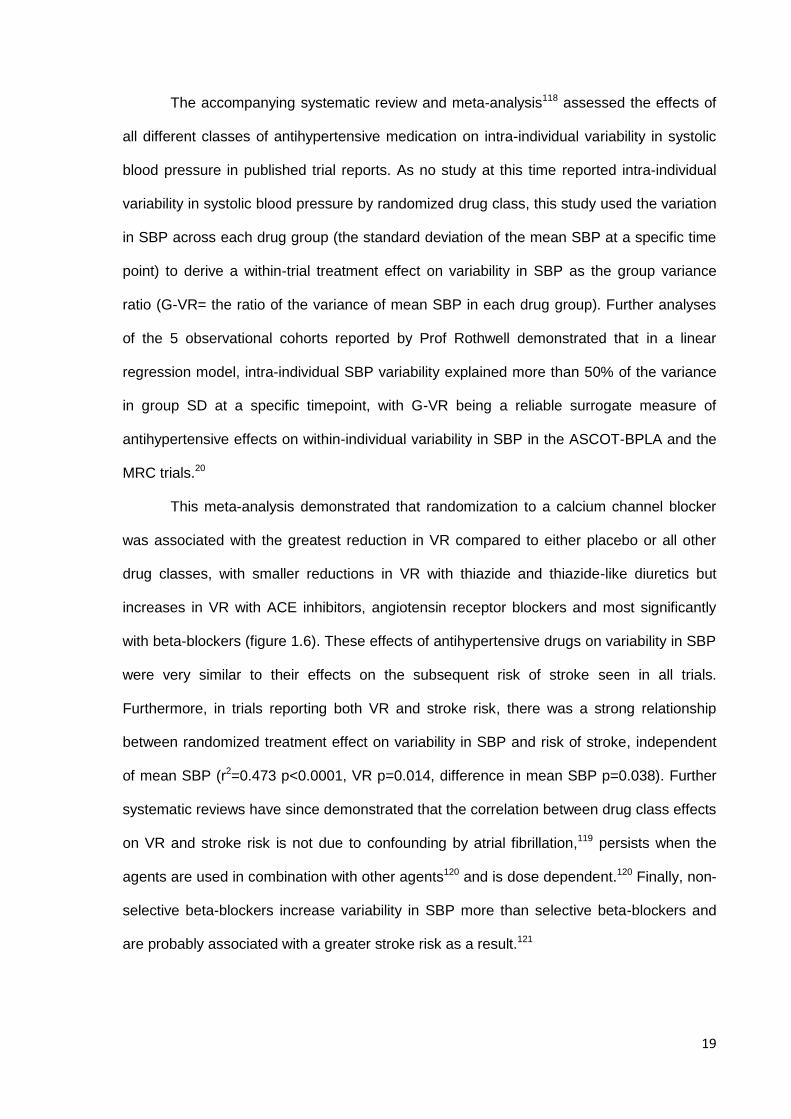
The accompanying systematic review and meta-analysis118 assessed the effects of
all different classes of antihypertensive medication on intra-individual variability in systolic
blood pressure in published trial reports. As no study at this time reported intra-individual
variability in systolic blood pressure by randomized drug class, this study used the variation
in SBP across each drug group (the standard deviation of the mean SBP at a specific time
point) to derive a within-trial treatment effect on variability in SBP as the group variance
ratio (G-VR= the ratio of the variance of mean SBP in each drug group). Further analyses
of the 5 observational cohorts reported by Prof Rothwell demonstrated that in a linear
regression model, intra-individual SBP variability explained more than 50% of the variance
in group SD at a specific timepoint, with G-VR being a reliable surrogate measure of
antihypertensive effects on within-individual variability in SBP in the ASCOT-BPLA and the
MRC trials.20
This meta-analysis demonstrated that randomization to a calcium channel blocker
was associated with the greatest reduction in VR compared to either placebo or all other
drug classes, with smaller reductions in VR with thiazide and thiazide-like diuretics but
increases in VR with ACE inhibitors, angiotensin receptor blockers and most significantly
with beta-blockers (figure 1.6). These effects of antihypertensive drugs on variability in SBP
were very similar to their effects on the subsequent risk of stroke seen in all trials.
Furthermore, in trials reporting both VR and stroke risk, there was a strong relationship
between randomized treatment effect on variability in SBP and risk of stroke, independent
of mean SBP (r2=0.473 p<0.0001, VR p=0.014, difference in mean SBP p=0.038). Further
systematic reviews have since demonstrated that the correlation between drug class effects
on VR and stroke risk is not due to confounding by atrial fibrillation,119 persists when the
agents are used in combination with other agents120 and is dose dependent.120 Finally, non-
selective beta-blockers increase variability in SBP more than selective beta-blockers and
are probably associated with a greater stroke risk as a result.121
20
Figure 1.6 Pooled estimates of within-trial comparisons between drug classes at follow-up as the ratio of variances or the difference in percentage change in coefficient of variation compared to baseline. Confidence limits and p-values calculated according to random-effects meta-analysis and sign test. Error bars are 95% CI. The number of trials included in each analysis and the number of patients included in those trials (N) are given. NB. The sign tests analysis excludes trials in which there VR was 1.00 or the %CV was 0, and so the number of trials listed is less than the total. Derived from Webb et al118
21
1.6 Conclusions and Aims
Medium-term, visit-to-visit variability in SBP was a strong predictor of the risk of
stroke independent of mean SBP in three cohorts of patients with previous TIA or stroke
and in both arms of the ASCOT randomized controlled trial including hypertensive patients
at an increased risk of cardiovascular events. In the ASCOT-BPLA and MRC-elderly
studies and all available trial reports, randomisation to a calcium channel blocker reduced
variability in SBP, as to a lesser extent did randomisation to a diuretic, whilst randomisation
to a renin-angiotensin system inhibitor or a beta-blocker increased variability in SBP. These
effects were associated with an increased risk of stroke.
Despite the robust nature of these findings a large number of questions remain. Are
these findings replicable in independent populations with differing characteristics? Are
antihypertensive effects on the surrogate measure of variability in SBP, the group variance
ratio, truly reflective of effects on intra-individual variability? What is the optimal method of
assessing blood pressure and blood pressure variability, particularly in the high-risk patients
with recent TIA or minor stroke? How is variability in SBP related to clinical characteristics,
hypertensive vascular disease and the risk of cardiovascular events? Is variability in SBP a
truly causative factor resulting in increased stroke risk, or is it confounded by another
strongly associated physiological change such as changes in the cerebral circulation?
Given the strong relationship between stroke and dementia, is BPV increased in patients
with cognitive decline? Which forms of BPV variability respond to treatment with different
antihypertensive medications?
Therefore this thesis aims to:
1. Confirm and validate the observation that medium-term blood pressure
variability is related to an increased risk of cardiovascular events in independent
populations with a wider range of underlying conditions;
22
2. Further characterise the effects of different classes of antihypertensive agent on
blood pressure variability and the related risk of stroke;
3. Determine the optimal method of assessing blood pressure variability;
4. Identify the clinical and physiological determinants of medium-term blood
pressure variability;
5. Assess whether medium-term variability may be related to a risk of stroke or
dementia through associated effects on cerebral haemodynamics;
6. Establish a large cohort of patients with extensive blood pressure monitoring
and physiological assessment for future determination of cardiovascular risk.
These aims will be addressed through a number of methods: through systematic
review and meta-analysis of published literature and meta-analysis of individual patient data
from randomized controlled trials; through an observational cohort study within the Oxford
Vascular Study population, incorporating home and ambulatory blood pressure monitoring
after TIA and minor stroke; through prospective assessment of multiple physiological
characteristics including cerebral haemodynamics in patients with BP monitoring and a
recent TIA or minor stroke.
Through these studies, I aim to clarify the effect of medium-term variability in
systolic blood pressure on the future risk of stroke, dementia and other cardiovascular
events, gain a greater understanding of the pathophysiological basis of this relationship and
more clearly delineate how it is affected by currently used antihypertensive medications.
23
1.7 References
1. Mant J, Wade D, Winner S. Health care needs assessment: the epidemiologically based need. Health care needs assessment: the epidemiologically based need. Oxford: Radcliffe Medical Press, 2004: 141-242.
2. Statistics OoN. Reducing brain damage: faster access to better stroke care. London: The Stationery Office, 2005.
3. Stroke care: reducing the burden of disease. London: The Stroke Association, 1998. 4. Pendlebury ST, Rothwell PM. Prevalence, incidence, and factors associated with pre-stroke and
post-stroke dementia: a systematic review and meta-analysis. Lancet Neurol 2009;8:1006-1018. 5. National stroke strategy. London: Department of Health, 2007. 6. Great Britain. Dept. of H. National Service Framework for older people: Great Britain,
Department of Health, 2001. 7. Lawes CM, Vander Hoorn S, Rodgers A. Global burden of blood-pressure-related disease,
2001. Lancet 2008;371:1513-1518. 8. Kearney PM, Whelton M, Reynolds K, Muntner P, Whelton PK, He J. Global burden of
hypertension: analysis of worldwide data. Lancet 2005;365:217-223. 9. Lewington S, Clarke R, Qizilbash N, Peto R, Collins R. Age-specific relevance of usual blood
pressure to vascular mortality: a meta-analysis of individual data for one million adults in 61 prospective studies. Lancet 2002;360:1903-1913.
10. Kengne AP, Patel A, Barzi F, et al. Systolic blood pressure, diabetes and the risk of cardiovascular diseases in the Asia-Pacific region. J Hypertens 2007;25:1205-1213.
11. O'Donnell MJ, Xavier D, Liu L, et al. Risk factors for ischaemic and intracerebral haemorrhagic stroke in 22 countries (the INTERSTROKE study): a case-control study. Lancet 2010;376:112-123.
12. Collins R, Peto R, MacMahon S, et al. Blood pressure, stroke, and coronary heart disease. Part 2, Short-term reductions in blood pressure: overview of randomised drug trials in their epidemiological context. Lancet 1990;335:827-838.
13. Falaschetti E, Chaudhury M, Mindell J, Poulter N. Continued improvement in hypertension management in England: results from the Health Survey for England 2006. Hypertension 2009;53:480-486.
14. Esposti LD, Di Martino M, Saragoni S, et al. Pharmacoeconomics of antihypertensive drug treatment: an analysis of how long patients remain on various antihypertensive therapies. J Clin Hypertens (Greenwich) 2004;6:76-84.
15. Rothwell PM, Coull AJ, Giles MF, et al. Change in stroke incidence, mortality, case-fatality, severity, and risk factors in Oxfordshire, UK from 1981 to 2004 (Oxford Vascular Study). Lancet 2004;363:1925-1933.
16. Lovett JK, Howard SC, Rothwell PM. Pulse pressure is independently associated with carotid plaque ulceration. J Hypertens 2003;21:1669-1676.
17. Kannel WB, Abbott RD, Savage DD, McNamara PM. Epidemiologic features of chronic atrial fibrillation: the Framingham study. N Engl J Med 1982;306:1018-1022.
18. Schulz UG, Rothwell PM. Differences in vascular risk factors between etiological subtypes of ischemic stroke: importance of population-based studies. Stroke 2003;34:2050-2059.
19. Jackson C, Sudlow C. Are Lacunar Strokes Really Different?: A Systematic Review of Differences in Risk Factor Profiles Between Lacunar and Nonlacunar Infarcts. Stroke 2005;36:891-901.
20. Rothwell PM, Howard SC, Dolan E, et al. Prognostic significance of visit-to-visit variability, maximum systolic blood pressure, and episodic hypertension. Lancet 2010;375:895-905.
21. Rothwell PM. Limitations of the usual blood-pressure hypothesis and importance of variability, instability, and episodic hypertension. Lancet 2010;375:938-948.
22. Rothwell PM, Howard SC, Dolan E, et al. Effects of beta blockers and calcium-channel blockers on within-individual variability in blood pressure and risk of stroke. Lancet Neurol 2010;9:469-480.
23. Hales S. Haemostaticks: Statical Essays. London: Innys & Manby, 1733. 24. Riva-Rocci R. 'Un nuova sfigmomamnometro'. Gazdetto Medical di Torino 1896;47:50-51. 25. Korotkoff N. On methods of studying blood pressure. Bulletin of the Imperial Academiy of
Medicine 1905;11. 26. Bruenn HG. Clinical notes on the illness and death of President Franklin D. Roosevelt. Ann
Intern Med 1970;72:579-591. 27. Moyer JH. The treatment of hypertensive emergencies. Minn Med 1958;41:301-316.
24
28. Hall R, Owen SG. The hypotensive effect of chlorothiazide. Lancet 1959;1:129-130. 29. Actuaries So. Build and Blood Pressure Study. Chicago1959. 30. Stamler J, Rhomberg P, Schoenberger JA, et al. Multivariate analysis of the relationship of
seven variables to blood pressure: findings of the Chicago Heart Association Detection Project in Industry, 1967-1972. J Chronic Dis 1975;28:527-548.
31. Kannel WB. The role of lipids and blood pressure in the development of coronary heart disease. The Framingham study. G Ital Cardiol 1974;4:123-137.
32. Kagan A, Harris BR, Winkelstein W, Jr., et al. Epidemiologic studies of coronary heart disease and stroke in Japanese men living in Japan, Hawaii and California: demographic, physical, dietary and biochemical characteristics. J Chronic Dis 1974;27:345-364.
33. Dyer AR. An analysis of the relationship of systolic blood pressure, serum cholesterol, and smoking to 14-year mortality in the Chicago Peoples Gas Company Study- II. Coronary and cardiovascular-renal mortality in two competing risk models. J Chronic Dis 1975;28:571-578.
34. Anderson TW. Re-examination of some of the Framingham blood-pressure data. Lancet 1978;2:1139-1141.
35. Group' PPR. Relationship of blood pressure, serum cholesterol, smoking habit, relative weight and ECG abnormalities to incidence of major coronary events: final report of the pooling project. The pooling project research group. J Chronic Dis 1978;31:201-306.
36. Black HR. The paradigm has shifted to systolic blood pressure. J Hum Hypertens 2004;18 Suppl 2:S3-7.
37. Comparison of propranolol and hydrochlorothiazide for the initial treatment of hypertension. II. Results of long-term therapy. Veterans Administration Cooperative Study Group on Antihypertensive Agents. JAMA 1982;248:2004-2011.
38. Effects of treatment on morbidity in hypertension. Results in patients with diastolic blood pressures averaging 115 through 129 mm Hg. JAMA 1967;202:1028-1034.
39. Effects of treatment on morbidity in hypertension. II. Results in patients with diastolic blood pressure averaging 90 through 114 mm Hg. JAMA 1970;213:1143-1152.
40. Carter AB. Hypotensive therapy in stroke survivors. Lancet 1970;1:485-489. 41. The fifth report of the Joint National Committee on Detection, Evaluation, and Treatment of High
Blood Pressure (JNC V). Arch Intern Med 1993;153:154-183. 42. MacMahon S, Peto R, Cutler J, et al. Blood pressure, stroke, and coronary heart disease. Part
1, Prolonged differences in blood pressure: prospective observational studies corrected for the regression dilution bias. Lancet 1990;335:765-774.
43. Levy D, Larson MG, Vasan RS, Kannel WB, Ho KK. The progression from hypertension to congestive heart failure. JAMA 1996;275:1557-1562.
44. Criqui MH, Langer RD, Fronek A, et al. Mortality over a period of 10 years in patients with peripheral arterial disease. N Engl J Med 1992;326:381-386.
45. Klag MJ, Whelton PK, Randall BL, et al. Blood pressure and end-stage renal disease in men. N Engl J Med 1996;334:13-18.
46. Mancia G, De Backer G, Dominiczak A, et al. 2007 Guidelines for the management of arterial hypertension: The Task Force for the Management of Arterial Hypertension of the European Society of Hypertension (ESH) and of the European Society of Cardiology (ESC). Eur Heart J 2007;28:1462-1536.
47. Kannel WB, Gordon T, Schwartz MJ. Systolic versus diastolic blood pressure and risk of coronary heart disease. The Framingham study. Am J Cardiol 1971;27:335-346.
48. Stamler J, Stamler R, Neaton JD. Blood pressure, systolic and diastolic, and cardiovascular risks. US population data. Arch Intern Med 1993;153:598-615.
49. Franklin SS. Ageing and hypertension: the assessment of blood pressure indices in predicting coronary heart disease. J Hypertens Suppl 1999;17:S29-36.
50. Benetos A, Zureik M, Morcet J, et al. A decrease in diastolic blood pressure combined with an increase in systolic blood pressure is associated with a higher cardiovascular mortality in men. J Am Coll Cardiol 2000;35:673-680.
51. Staessen JA, Gasowski J, Wang JG, et al. Risks of untreated and treated isolated systolic hypertension in the elderly: meta-analysis of outcome trials. Lancet 2000;355:865-872.
52. Franklin SS, Khan SA, Wong ND, Larson MG, Levy D. Is pulse pressure useful in predicting risk for coronary heart Disease? The Framingham heart study. Circulation 1999;100:354-360.
53. Prevention of stroke by antihypertensive drug treatment in older persons with isolated systolic hypertension. Final results of the Systolic Hypertension in the Elderly Program (SHEP). SHEP Cooperative Research Group. JAMA 1991;265:3255-3264.
54. Hansson L. Results of the STOP-Hypertension-2 Trial. Blood Pressure 2000;9:17-20.
25
55. Beckett NS, Peters R, Fletcher AE, et al. Treatment of hypertension in patients 80 years of age or older. N Engl J Med 2008;358:1887-1898.
56. Moyer JH, Heider C, Pevey K, Ford RV. The effect of treatment on the vascular deterioration associated with hypertension, with particular emphasis on renal function. Am J Med 1958;24:177-192.
57. Perry HM, Jr., Schroeder HA. The effect of treatment on mortality rates in severe hypertension; a comparison of medical and surgical regimens. AMA Arch Intern Med 1958;102:418-425.
58. Harington M, Kincaid-Smith P, Mc MJ. Results of treatment in malignant hypertension: a seven-year experience in 94 cases. Br Med J 1959;2:969-980.
59. Farmer RG, Gifford RW, Jr., Hines EA, Jr. Effect of medical treatment of severe hypertension. A follow-up study of 161 patients with group 3 and group 4 hypertension. Arch Intern Med 1963;112:118-128.
60. Prichard BN. Hypotensive Action of Pronethalol. Br Med J 1964;1:1227-1228. 61. Carney S, Morgan T, Wilson M, Matthews G, Roberts R. Sodium restriction and thiazide
diuretics in the treatment of hypertension. Med J Aust 1975;1:803-807. 62. MRC trial of treatment of mild hypertension: principal results. Medical Research Council
Working Party. Br Med J (Clin Res Ed) 1985;291:97-104. 63. Medical Research Council trial of treatment of hypertension in older adults: principal results.
MRC Working Party. Bmj 1992;304:405-412. 64. Cardiovascular risk and risk factors in a randomized trial of treatment based on the beta-blocker
oxprenolol: the International Prospective Primary Prevention Study in Hypertension (IPPPSH). The IPPPSH Collaborative Group. J Hypertens 1985;3:379-392.
65. Amery A, Birkenhager W, Brixko P, et al. Mortality and morbidity results from the European Working Party on High Blood Pressure in the Elderly trial. Lancet 1985;1:1349-1354.
66. Hansson L, Zanchetti A, Carruthers S, et al. Effects of intensive blood-pressure lowering and low-dose aspirin in patients with hypertension: principal results of the Hypertension Optimal Treatment (HOT) randomised trial. The Lancet 1998;351:1755-1762.
67. Effect of stepped care treatment on the incidence of myocardial infarction and angina pectoris. 5-Year findings of the hypertension detection and follow-up program. Hypertension 1984;6:I198-206.
68. Law MR, Morris JK, Wald NJ. Use of blood pressure lowering drugs in the prevention of cardiovascular disease: meta-analysis of 147 randomised trials in the context of expectations from prospective epidemiological studies. Bmj 2009;338:b1665-b1665.
69. Turnbull F. Effects of different blood-pressure-lowering regimens on major cardiovascular events: results of prospectively-designed overviews of randomised trials. Lancet 2003;362:1527-1535.
70. Gueyffier F, Boutitie F, Boissel JP, et al. Effect of antihypertensive drug treatment on cardiovascular outcomes in women and men. A meta-analysis of individual patient data from randomized, controlled trials. The INDANA Investigators. Ann Intern Med 1997;126:761-767.
71. Turnbull F, Neal B, Algert C, et al. Effects of different blood pressure-lowering regimens on major cardiovascular events in individuals with and without diabetes mellitus: results of prospectively designed overviews of randomized trials. Arch Intern Med 2005;165:1410-1419.
72. Rashid P. Blood Pressure Reduction and Secondary Prevention of Stroke and Other Vascular Events: A Systematic Review. Stroke 2003;34:2741-2748.
73. Randomised trial of a perindopril-based blood-pressure-lowering regimen among 6,105 individuals with previous stroke or transient ischaemic attack. Lancet 2001;358:1033-1041.
74. Berl T. Impact of Achieved Blood Pressure on Cardiovascular Outcomes in the Irbesartan Diabetic Nephropathy Trial. Journal of the American Society of Nephrology 2005;16:2170-2179.
75. Boutitie F, Gueyffier F, Pocock S, Fagard R, Boissel JP. J-shaped relationship between blood pressure and mortality in hypertensive patients: new insights from a meta-analysis of individual-patient data. Ann Intern Med 2002;136:438-448.
76. Sleight P, Redon J, Verdecchia P, et al. Prognostic value of blood pressure in patients with high vascular risk in the Ongoing Telmisartan Alone and in combination with Ramipril Global Endpoint Trial study. J Hypertens 2009;27:1360-1369.
77. Verdecchia P, Staessen JA, Angeli F, et al. Usual versus tight control of systolic blood pressure in non-diabetic patients with hypertension (Cardio-Sis): an open-label randomised trial. Lancet 2009;374:525-533.
78. Psaty BM, Lumley T, Furberg CD, et al. Health Outcomes Associated With Various Antihypertensive Therapies Used as First-Line Agents: A Network Meta-analysis. JAMA: The Journal of the American Medical Association 2003;289:2534-2544.
26
79. Dahlof B, Sever P, Poulter N, et al. Prevention of cardiovascular events with an antihypertensive regimen of amlodipine adding perindopril as required versus atenolol adding bendroflumethiazide as required, in the Anglo-Scandinavian Cardiac Outcomes Trial-Blood Pressure Lowering Arm (ASCOT-BPLA): a multicentre randomised controlled trial. The Lancet 2005;366:895-906.
80. Freemantle N, Cleland J, Young P, Mason J, Harrison J. beta Blockade after myocardial infarction: systematic review and meta regression analysis. Bmj 1999;318:1730-1737.
81. Lindholm LH, Carlberg B, Samuelsson O. Should β blockers remain first choice in the treatment of primary hypertension? A meta-analysis. The Lancet 2005;366:1545-1553.
82. Wiysonge CS, Bradley H, Mayosi BM, et al. Beta-blockers for hypertension. Cochrane Db Syst Rev 2007:-.
83. Chobanian AV, Bakris GL, Black HR, et al. Seventh report of the Joint National Committee on Prevention, Detection, Evaluation, and Treatment of High Blood Pressure. Hypertension 2003;42:1206-1252.
84. Sever P. New hypertension guidelines from the National Institute for Health and Clinical Excellence and the British Hypertension Society. J Renin Angiotensin Aldosterone Syst 2006;7:61-63.
85. Williams B, Poulter NR, Brown MJ, et al. British Hypertension Society guidelines for hypertension management 2004 (BHS-IV): summary. Bmj 2004;328:634-640.
86. Ayman D. Essential Hypertension: The diastolic blood pressure: its variability. Arch Int Med 1931;48:8.
87. Howard SC, Rothwell PM. Reproducibility of measures of visit-to-visit variability in blood pressure after transient ischaemic attack or minor stroke. Cerebrovasc Dis 2009;28:331-340.
88. Howard SC, Rothwell PM. Regression dilution of systolic and diastolic blood pressure in patients with established cerebrovascular disease. J Clin Epidemiol 2003;56:1084-1091.
89. O'Brien E, Sheridan J, O'Malley K. Dippers and non-dippers. Lancet 1988;2:397. 90. Hansen TW, Li Y, Boggia J, Thijs L, Richart T, Staessen JA. Predictive role of the nighttime
blood pressure. Hypertension 2011;57:3-10. 91. Li Y, Thijs L, Hansen TW, et al. Prognostic Value of the Morning Blood Pressure Surge in 5645
Subjects From 8 Populations. Hypertension 2010;55:1040-1048. 92. Kario K, Shimada K, Pickering TG. Clinical implication of morning blood pressure surge in
hypertension. J Cardiovasc Pharmacol 2003;42 Suppl 1:S87-91. 93. Hansen TW, Thijs L, Li Y, et al. Prognostic Value of Reading-to-Reading Blood Pressure
Variability Over 24 Hours in 8938 Subjects From 11 Populations. Hypertension 2010;55:1049-1057.
94. Pierdomenico SD, Di Nicola M, Esposito AL, et al. Prognostic Value of Different Indices of Blood Pressure Variability in Hypertensive Patients. American Journal of Hypertension 2009;22:842-847.
95. Alborzi P, Patel N, Agarwal R. Home blood pressures are of greater prognostic value than hemodialysis unit recordings. Clin J Am Soc Nephrol 2007;2:1228-1234.
96. Agarwal R, Bills JE, Hecht TJ, Light RP. Role of home blood pressure monitoring in overcoming therapeutic inertia and improving hypertension control: a systematic review and meta-analysis. Hypertension 2011;57:29-38.
97. Yatsuya H, Folsom AR, Alonso A, Gottesman RF, Rose KM. Postural changes in blood pressure and incidence of ischemic stroke subtypes: the ARIC study. Hypertension 2011;57:167-173.
98. Mancia G, Facchetti R, Bombelli M, Grassi G, Sega R. Long-term risk of mortality associated with selective and combined elevation in office, home, and ambulatory blood pressure. Hypertension 2006;47:846-853.
99. Pickering TG, Eguchi K, Kario K. Masked hypertension: a review. Hypertens Res 2007;30:479-488.
100. Koton S, Tanne D, Bornstein NM, Green MS. Triggering risk factors for ischemic stroke: a case-crossover study. Neurology 2004;63:2006-2010.
101. Brotman DJ, Golden SH, Wittstein IS. The cardiovascular toll of stress. Lancet 2007;370:1089-1100.
102. Kario K. Orthostatic hypertension: a measure of blood pressure variation for predicting cardiovascular risk. Circ J 2009;73:1002-1007.
103. Fessel J, Robertson D. Orthostatic hypertension: when pressor reflexes overcompensate. Nat Clin Pract Nephrol 2006;2:424-431.
27
104. Hossain M, Ooi WL, Lipsitz LA. Intra-individual postural blood pressure variability and stroke in elderly nursing home residents. J Clin Epidemiol 2001;54:488-494.
105. Fischer U, Bull L, Silver L, Mehta Z, Rothwell P. Acute phase blood pressure variability and stroke in relation to pre-morbid levels: a population based study. Cerebrovasc Dis 2009;27:1.
106. Pavek K, Taube A. Personality characteristics influencing determinacy of day and night blood pressure and heart rate. Blood Press 2009;18:30-35.
107. Chida Y, Steptoe A. Greater Cardiovascular Responses to Laboratory Mental Stress Are Associated With Poor Subsequent Cardiovascular Risk Status: A Meta-Analysis of Prospective Evidence. Hypertension 2010;55:1026-1032.
108. Klungel OH, de Boer A, Paes AH, Nagelkerke NJ, Seidell JC, Bakker A. Estimating the prevalence of hypertension corrected for the effect of within-person variability in blood pressure. J Clin Epidemiol 2000;53:1158-1163.
109. Turner MJ, van Schalkwyk JM. Blood pressure variability causes spurious identification of hypertension in clinical studies: a computer simulation study. Am J Hypertens 2008;21:85-91.
110. Pickering TG, Hall JE, Appel LJ, et al. Recommendations for blood pressure measurement in humans and experimental animals: part 1: blood pressure measurement in humans: a statement for professionals from the Subcommittee of Professional and Public Education of the American Heart Association Council on High Blood Pressure Research. Circulation 2005;111:697-716.
111. Keenan K, Hayen A, Neal BC, Irwig L. Long term monitoring in patients receiving treatment to lower blood pressure: analysis of data from placebo controlled randomised controlled trial. Bmj 2009;338:b1492.
112. Cuffe RL, Howard SC, Algra A, Warlow CP, Rothwell PM. Medium-term variability of blood pressure and potential underdiagnosis of hypertension in patients with previous transient ischemic attack or minor stroke. Stroke 2006;37:2776-2783.
113. Kikuya M, Hozawa A, Ohokubo T, et al. Prognostic significance of blood pressure and heart rate variabilities: the Ohasama study. Hypertension 2000;36:901-906.
114. Kikuya M, Ohkubo T, Metoki H, et al. Day-by-day variability of blood pressure and heart rate at home as a novel predictor of prognosis: the Ohasama study. Hypertension 2008;52:1045-1050.
115. Farrell B, Godwin J, Richards S, Warlow C. The United Kingdom transient ischaemic attack (UK-TIA) aspirin trial: final results. J Neurol Neurosurg Psychiatry 1991;54:1044-1054.
116. The European Stroke Prevention Study (ESPS). Principal end-points. The ESPS Group. Lancet 1987;2:1351-1354.
117. A comparison of two doses of aspirin (30 mg vs 283 mg a day) in patients after a transient ischemic attack or minor ischemic stroke. The Dutch TIA Trial Study Group. N Engl J Med 1991;325:1261-1266.
118. Webb AJ, Fischer U, Mehta Z, Rothwell PM. Effects of antihypertensive-drug class on interindividual variation in blood pressure and risk of stroke: a systematic review and meta-analysis. Lancet 2010;375:906-915.
119. Webb AJ, Rothwell PM. Blood pressure variability and risk of new-onset atrial fibrillation: a systematic review of randomized trials of antihypertensive drugs. Stroke 2010;41:2091-2093.
120. Webb AJ, Rothwell PM. Effect of dose and combination of antihypertensives on interindividual blood pressure variability: a systematic review. Stroke 2011;42:2860-2865.
121. Webb AJ, Fischer U, Rothwell PM. Effects of beta-blocker selectivity on blood pressure variability and stroke: a systematic review. Neurology 2011;77:731-737.
28
CHAPTER TWO
Prognostic implications of medium-term variability in
blood pressure in prospective studies:
systematic review and meta-analysis
2.1 Summary 29
2.2 Introduction 30
2.3 Methods 31
2.3.1 Search Strategy and Data Collection 31
2.3.2 Statistical Analysis 31
2.4 Findings 32
2.4.1 Search Results 32
2.4.2 Relationships between BP variability and Risk of Stroke 36
2.4.3 Relationships between BP variability and Risk of Myocardial Infarction 38
2.4.4 Relationships between BP variability and Risk of Cardiovascular Death 39
2.4.5 Effect of temporal separation of exposure and outcome periods 41
2.4.6 Sources of heterogeneity 41
2.4.7 Relevant studies not included in meta-analysis 44
2.5 Discussion 45
2.6 References 48
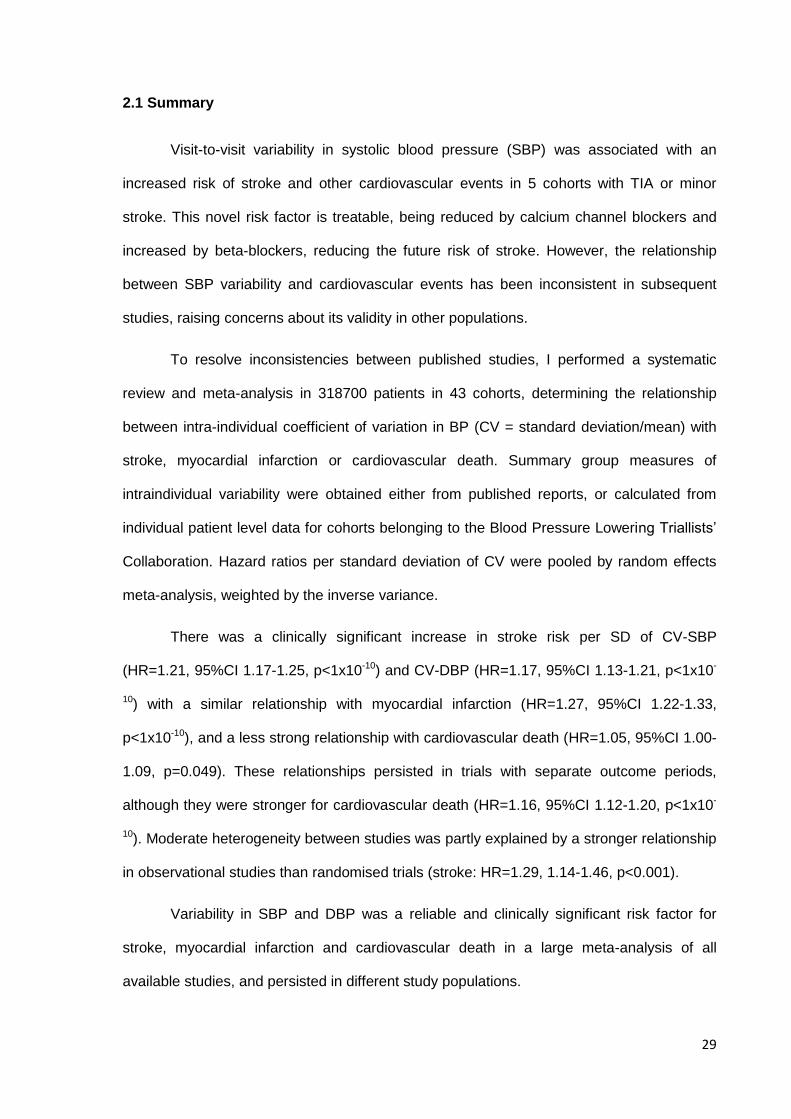
29
2.1 Summary
Visit-to-visit variability in systolic blood pressure (SBP) was associated with an
increased risk of stroke and other cardiovascular events in 5 cohorts with TIA or minor
stroke. This novel risk factor is treatable, being reduced by calcium channel blockers and
increased by beta-blockers, reducing the future risk of stroke. However, the relationship
between SBP variability and cardiovascular events has been inconsistent in subsequent
studies, raising concerns about its validity in other populations.
To resolve inconsistencies between published studies, I performed a systematic
review and meta-analysis in 318700 patients in 43 cohorts, determining the relationship
between intra-individual coefficient of variation in BP (CV = standard deviation/mean) with
stroke, myocardial infarction or cardiovascular death. Summary group measures of
intraindividual variability were obtained either from published reports, or calculated from
individual patient level data for cohorts belonging to the Blood Pressure Lowering Triallists’
Collaboration. Hazard ratios per standard deviation of CV were pooled by random effects
meta-analysis, weighted by the inverse variance.
There was a clinically significant increase in stroke risk per SD of CV-SBP
(HR=1.21, 95%CI 1.17-1.25, p<1x10⁻¹⁰) and CV-DBP (HR=1.17, 95%CI 1.13-1.21, p<1x10-
10) with a similar relationship with myocardial infarction (HR=1.27, 95%CI 1.22-1.33,
p<1x10⁻¹⁰), and a less strong relationship with cardiovascular death (HR=1.05, 95%CI 1.00-
1.09, p=0.049). These relationships persisted in trials with separate outcome periods,
although they were stronger for cardiovascular death (HR=1.16, 95%CI 1.12-1.20, p<1x10-
10). Moderate heterogeneity between studies was partly explained by a stronger relationship
in observational studies than randomised trials (stroke: HR=1.29, 1.14-1.46, p<0.001).
Variability in SBP and DBP was a reliable and clinically significant risk factor for
stroke, myocardial infarction and cardiovascular death in a large meta-analysis of all
available studies, and persisted in different study populations.
30
2.2 Introduction
As described in chapter 1, visit-to-visit variability in blood pressure (BP) and
episodic hypertension in clinic were associated with an increased risk of stroke or all
cardiovascular events, independent of mean BP in 5 cohorts of patients with
cerebrovascular disease or hypertension.1, 2 In the ASCOT-BPLA study, visit-to-visit
variability was reduced by calcium channel blockers but increased with beta-blockers,
explaining differences in stroke risk that were not explained by differences in mean SBP.3, 4
A number of studies have subsequently found a similar association between variability in
blood pressure and cardiovascular events5 or death6 in multiple populations, using both
home7 and clinic blood pressure measures to estimate blood pressure variability from day-
to-day or visit-to-visit. However, the results of these studies have been inconsistent, due to
variation in methods, populations, outcomes and the small size of some studies.8, 9
Despite strong associations in the five original cohorts, the clinical importance of
variability in blood pressure has been questioned due to a number of concerns: doubts that
it truly predicts future cardiovascular events, independent of mean SBP;10 doubts that it is a
reliable marker of a pathophysiological abnormality, particularly compared to awake
ambulatory blood pressure variability; and doubts that the magnitude of the relationship is
clinically significant.11 Furthermore, it has been proposed that the relationship only exists in
patients receiving antihypertensives12 and that differences between agents are explained by
drug half-life or compliance.13 However, as a novel, treatable risk factor for stroke it offers
the potential for immediate clinically important reductions in stroke risk as well as a target
for future research and interventions.
Therefore I carried out a systematic review and meta-analysis to derive an unbiased
estimate of the predictive value of variability in blood pressure for cardiovascular events.
31
2.3 Methods
2.3.1 Search Strategy and Data Collection
I searched Medline and EMBASE between inception and January 1st 2013 with the
terms (blood pressure OR hypertension OR BP) AND (office OR clinic OR visit-to-visit OR
"visit to visit" OR home) AND (variability OR repeatability). Non-English language papers
were included. Reference lists of identified reviews and corresponding webtables were
searched. Secondly, studies were identified by personal communication with authors and
the BP Lowering Triallists’ Collaboration (BPLTC). Data from all included reports was
extracted prior to analysis and studies were assessed for quality by explicit criteria.
Studies reporting an association between any eligible measure of blood pressure
variability (day-to-day variability on home monitoring or visit-to-visit variability on at least 3
consecutive clinic readings) and either cardiovascular death (CV-death), stroke or
myocardial infarction were included, with all-cause mortality used as a surrogate for CV-
death where CV-death was not reported. Studies reporting chronic cerebral ischaemia were
included in the systematic review, but not in the meta-analysis. Available data was
extracted from studies reporting an estimate of effect size (HR, Hazard Ratio; OR, Odds
Ratio) and its precision (standard error or confidence interval) per standard deviation (SD),
coefficient of variation (CV) or variation independent of the mean (VIM) of systolic or
diastolic BP. Summary group measures of intraindividual variability were obtained either
from published reports, or calculated from individual patient level data for BPLTC cohorts.
2.3.2 Statistical Analysis
For each cardiovascular outcome, HRs or ORs were pooled by both fixed (FE) and
random-effects (RE) meta-analysis, weighted by the inverse variance, with significance of
heterogeneity assessed by Cochran’s Q and its magnitude by the I2 statistic. Where
available, the effect size was scaled to the reported population SD of that measure of BP
variability for that study, or when available, to the average population SD across all studies.
Only equivalent effect sizes (HRs or Ors) for equivalent measures of BP variability (SD, CV
32
or VIM) were pooled for each cardiovascular outcome, unadjusted and adjusted for age,
gender and mean SBP or DBP where available. For the purposes of meta-analysis, hazard
ratios, odds ratios and relative risks were deemed to be equivalent, although hazard ratio
was used in preference.
Sensitivity analyses were performed for specific subgroups: studies reporting
variability in BP during an exposure period that was temporally separated from the outcome
period; studies reporting SD-SBP/DBP; for randomised controlled trials versus
observational studies; and stratifying studies by age, baseline SBP and disease state. The
presence of publication and reporting bias was assessed with funnel plots.
All analyses were performed in Matlab R2012a, Microsoft Excel 2010 and IBM SPSS 20.
2.4 Findings
2.4.1 Search Results
Data was available for 318700 patients from 43 cohorts identified by multiple
methods. Firstly, the electronic search identified 858 citations, of which 173 abstracts and
68 potentially eligible papers were reviewed in full. Of these, 21 studies fulfilled criteria for
inclusion in the systematic review whilst 12 studies (13 cohorts including two arms to
ASCOT-BPLA)2 could be included in the meta-analyses (table 2.1). Of the cohorts included
in the meta-analysis, 11 reported outcomes as a function of standard deviation (SD) and 10
reported outcomes as a function of coefficient of variation (CV) or an equivalent measure.
Outcome data was available for 9 studies for all-cause mortality, 7 studies for
cardiovascular mortality, 7 studies for myocardial infarction and 8 studies for stroke risk,
with the other studies reporting only the risk of a composite measure of cardiovascular
disease. Secondly, results from 28 studies included in the Blood Pressure Lowering
Trialists’ Collaboration were obtained following direct communication with the authors.
These 28 studies were all large randomised controlled trials in different patient groups,
reporting CV death, stroke and myocardial infarction.
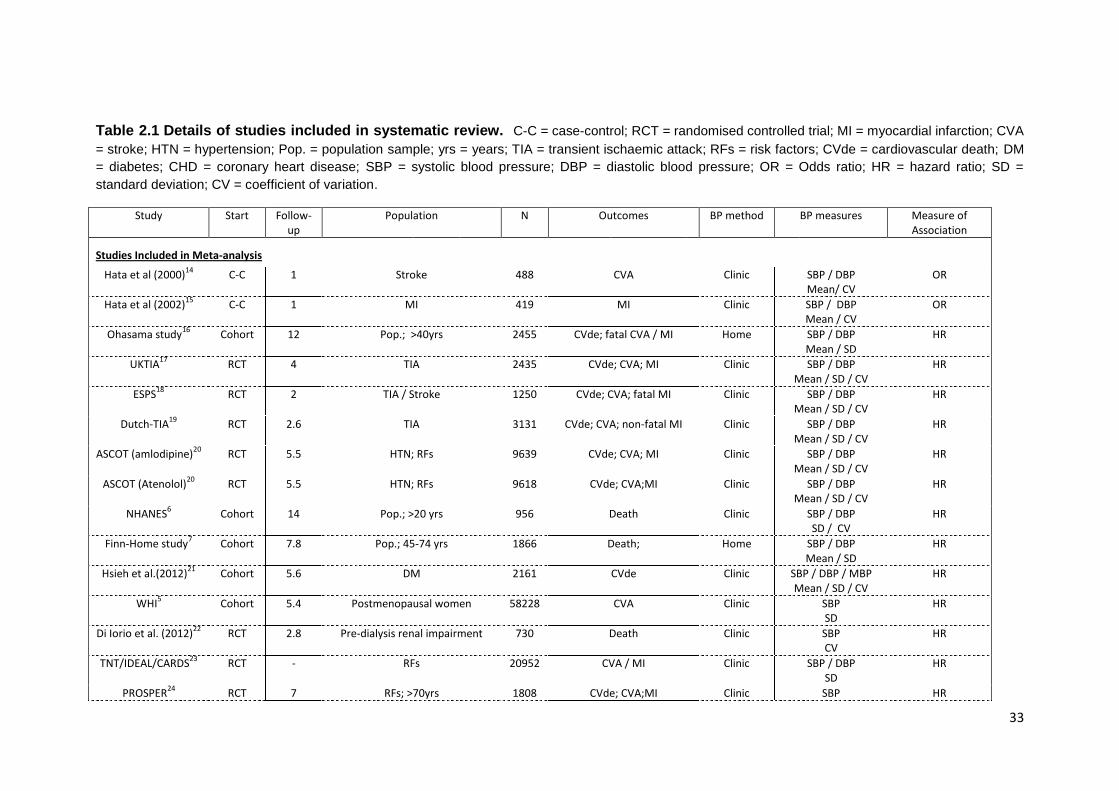
33
Table 2.1 Details of studies included in systematic review. C-C = case-control; RCT = randomised controlled trial; MI = myocardial infarction; CVA
= stroke; HTN = hypertension; Pop. = population sample; yrs = years; TIA = transient ischaemic attack; RFs = risk factors; CVde = cardiovascular death; DM
= diabetes; CHD = coronary heart disease; SBP = systolic blood pressure; DBP = diastolic blood pressure; OR = Odds ratio; HR = hazard ratio; SD =
standard deviation; CV = coefficient of variation.
Study Start Follow-up
Population N Outcomes BP method BP measures Measure of Association
Studies Included in Meta-analysis
Hata et al (2000)14
C-C 1 Stroke 488 CVA Clinic SBP / DBP Mean/ CV
OR
Hata et al (2002)15
C-C 1 MI 419 MI Clinic SBP / DBP Mean / CV
OR
Ohasama study16
Cohort 12 Pop.; >40yrs 2455 CVde; fatal CVA / MI Home SBP / DBP Mean / SD
HR
UKTIA17
RCT 4 TIA 2435 CVde; CVA; MI Clinic SBP / DBP Mean / SD / CV
HR
ESPS18
RCT 2 TIA / Stroke 1250 CVde; CVA; fatal MI Clinic SBP / DBP Mean / SD / CV
HR
Dutch-TIA19
RCT 2.6 TIA 3131 CVde; CVA; non-fatal MI Clinic SBP / DBP Mean / SD / CV
HR
ASCOT (amlodipine)20
RCT 5.5 HTN; RFs 9639 CVde; CVA; MI Clinic SBP / DBP Mean / SD / CV
HR
ASCOT (Atenolol)20
RCT 5.5 HTN; RFs 9618 CVde; CVA;MI Clinic SBP / DBP Mean / SD / CV
HR
NHANES6 Cohort 14 Pop.; >20 yrs 956 Death Clinic SBP / DBP
SD / CV HR
Finn-Home study7 Cohort 7.8 Pop.; 45-74 yrs 1866 Death; Home SBP / DBP
Mean / SD HR
Hsieh et al.(2012)21
Cohort 5.6 DM 2161 CVde Clinic SBP / DBP / MBP Mean / SD / CV
HR
WHI5 Cohort 5.4 Postmenopausal women 58228 CVA Clinic SBP
SD HR
Di Iorio et al. (2012)22
RCT 2.8 Pre-dialysis renal impairment 730 Death Clinic SBP CV
HR
TNT/IDEAL/CARDS23
RCT - RFs 20952 CVA / MI Clinic SBP / DBP SD
HR
PROSPER24
RCT 7 RFs; >70yrs 1808 CVde; CVA;MI Clinic SBP HR
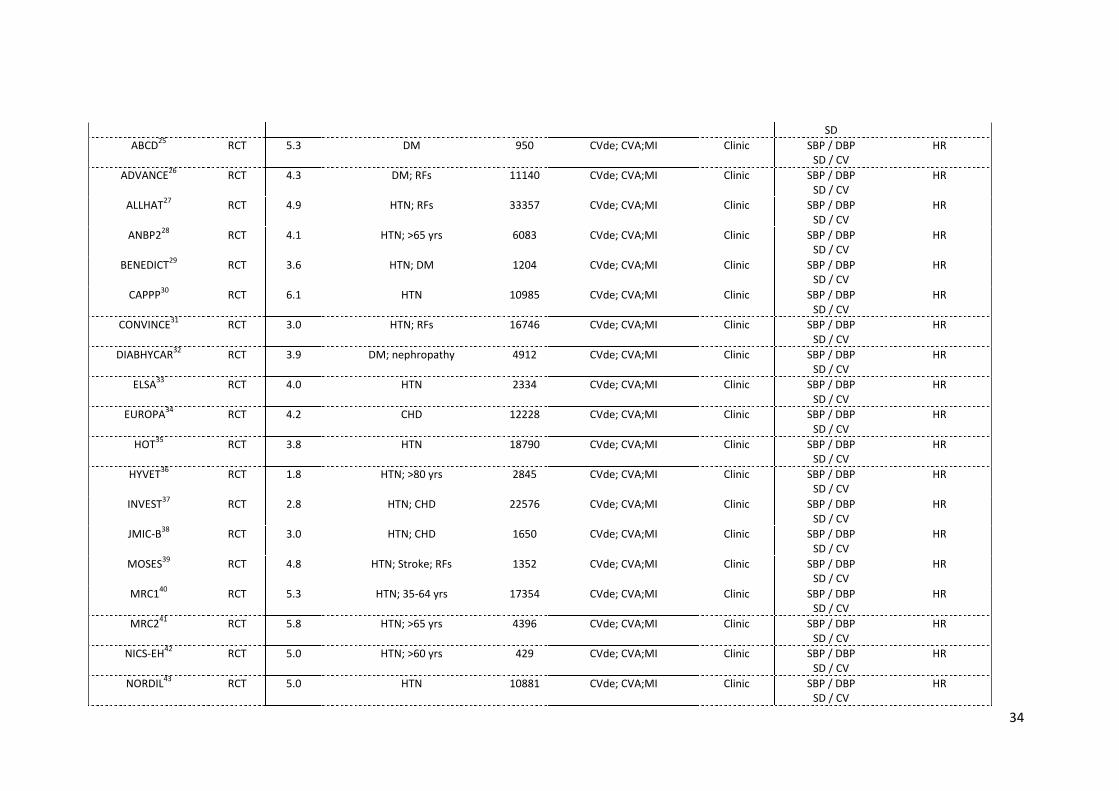
34
SD
ABCD25
RCT 5.3 DM 950 CVde; CVA;MI Clinic SBP / DBP SD / CV
HR
ADVANCE26
RCT 4.3 DM; RFs 11140 CVde; CVA;MI Clinic SBP / DBP SD / CV
HR
ALLHAT27
RCT 4.9 HTN; RFs 33357 CVde; CVA;MI Clinic SBP / DBP SD / CV
HR
ANBP228
RCT 4.1 HTN; >65 yrs 6083 CVde; CVA;MI Clinic SBP / DBP SD / CV
HR
BENEDICT29
RCT 3.6 HTN; DM 1204
CVde; CVA;MI Clinic SBP / DBP SD / CV
HR
CAPPP30
RCT 6.1 HTN 10985 CVde; CVA;MI Clinic SBP / DBP SD / CV
HR
CONVINCE31
RCT 3.0 HTN; RFs 16746 CVde; CVA;MI Clinic SBP / DBP SD / CV
HR
DIABHYCAR32
RCT 3.9 DM; nephropathy 4912 CVde; CVA;MI Clinic SBP / DBP SD / CV
HR
ELSA33
RCT 4.0 HTN 2334 CVde; CVA;MI Clinic SBP / DBP SD / CV
HR
EUROPA34
RCT 4.2 CHD 12228 CVde; CVA;MI Clinic SBP / DBP SD / CV
HR
HOT35
RCT 3.8 HTN 18790 CVde; CVA;MI Clinic SBP / DBP SD / CV
HR
HYVET36
RCT 1.8 HTN; >80 yrs 2845 CVde; CVA;MI Clinic SBP / DBP SD / CV
HR
INVEST37
RCT 2.8 HTN; CHD 22576 CVde; CVA;MI Clinic SBP / DBP SD / CV
HR
JMIC-B38
RCT 3.0 HTN; CHD 1650 CVde; CVA;MI Clinic SBP / DBP SD / CV
HR
MOSES39
RCT 4.8 HTN; Stroke; RFs 1352 CVde; CVA;MI Clinic SBP / DBP SD / CV
HR
MRC140
RCT 5.3 HTN; 35-64 yrs 17354
CVde; CVA;MI Clinic SBP / DBP SD / CV
HR
MRC241
RCT 5.8 HTN; >65 yrs 4396
CVde; CVA;MI Clinic SBP / DBP SD / CV
HR
NICS-EH42
RCT 5.0 HTN; >60 yrs 429 CVde; CVA;MI Clinic SBP / DBP SD / CV
HR
NORDIL43
RCT 5.0 HTN 10881 CVde; CVA;MI Clinic SBP / DBP SD / CV
HR
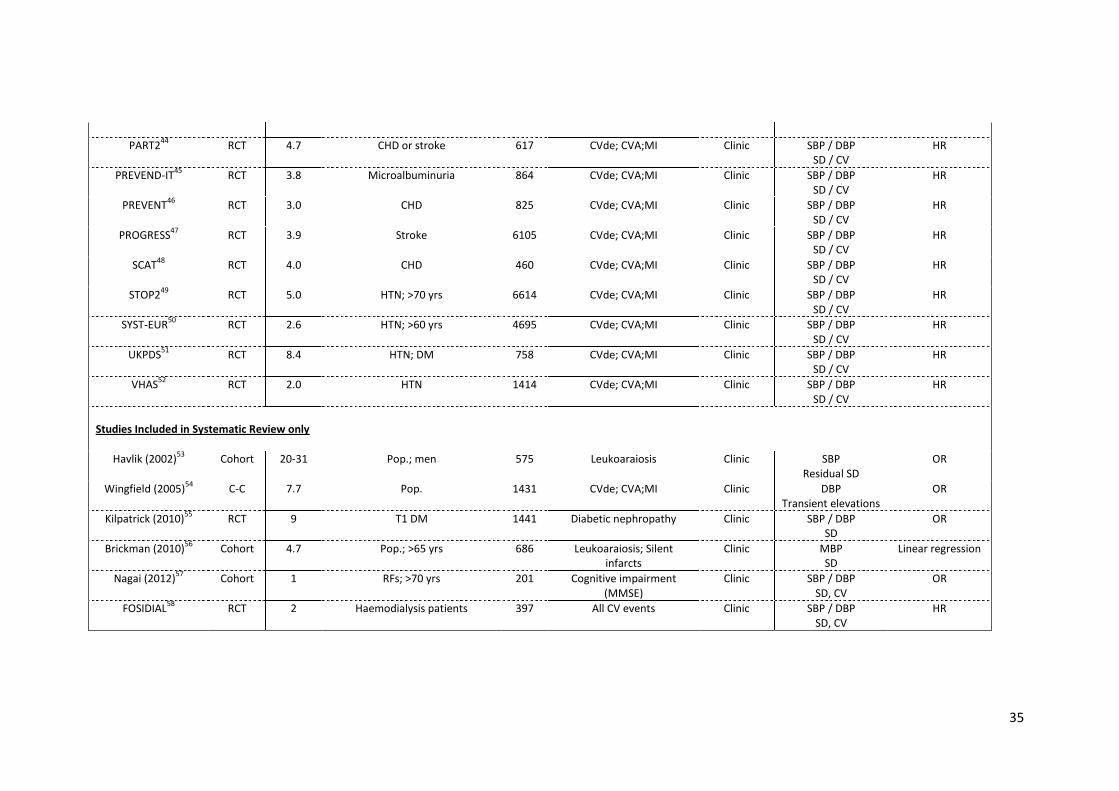
35
PART244
RCT 4.7 CHD or stroke 617 CVde; CVA;MI Clinic SBP / DBP SD / CV
HR
PREVEND-IT45
RCT 3.8 Microalbuminuria 864 CVde; CVA;MI Clinic SBP / DBP SD / CV
HR
PREVENT46
RCT 3.0 CHD 825 CVde; CVA;MI Clinic SBP / DBP SD / CV
HR
PROGRESS47
RCT 3.9 Stroke 6105 CVde; CVA;MI Clinic SBP / DBP SD / CV
HR
SCAT48
RCT 4.0 CHD 460 CVde; CVA;MI Clinic SBP / DBP SD / CV
HR
STOP249
RCT 5.0 HTN; >70 yrs 6614 CVde; CVA;MI Clinic SBP / DBP SD / CV
HR
SYST-EUR50
RCT 2.6 HTN; >60 yrs 4695 CVde; CVA;MI Clinic SBP / DBP SD / CV
HR
UKPDS51
RCT 8.4 HTN; DM 758 CVde; CVA;MI Clinic SBP / DBP SD / CV
HR
VHAS52
RCT 2.0 HTN 1414 CVde; CVA;MI Clinic SBP / DBP SD / CV
HR
Studies Included in Systematic Review only
Havlik (2002)53
Cohort 20-31 Pop.; men 575 Leukoaraiosis Clinic SBP Residual SD
OR
Wingfield (2005)54
C-C 7.7 Pop. 1431 CVde; CVA;MI Clinic DBP Transient elevations
OR
Kilpatrick (2010)55
RCT 9 T1 DM 1441 Diabetic nephropathy Clinic SBP / DBP SD
OR
Brickman (2010)56
Cohort 4.7 Pop.; >65 yrs 686 Leukoaraiosis; Silent infarcts
Clinic MBP SD
Linear regression
Nagai (2012)57
Cohort 1 RFs; >70 yrs 201 Cognitive impairment (MMSE)
Clinic SBP / DBP SD, CV
OR
FOSIDIAL58
RCT 2 Haemodialysis patients 397 All CV events Clinic SBP / DBP SD, CV
HR
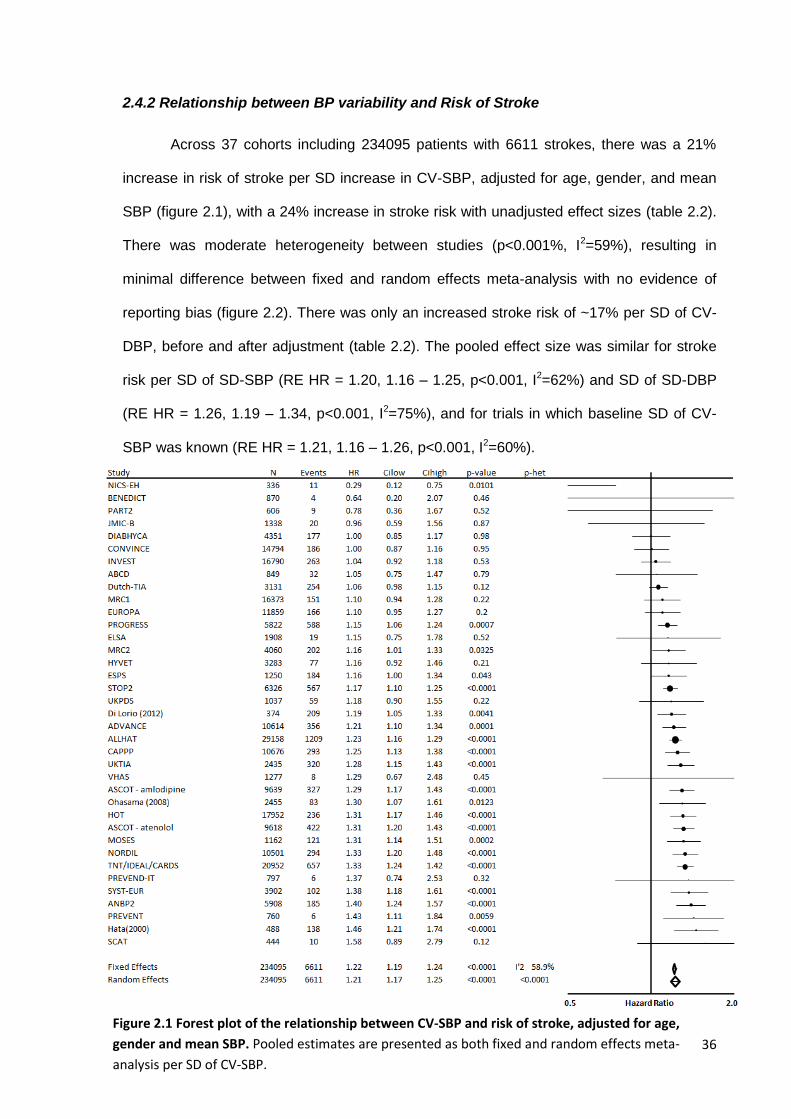
36
2.4.2 Relationship between BP variability and Risk of Stroke
Across 37 cohorts including 234095 patients with 6611 strokes, there was a 21%
increase in risk of stroke per SD increase in CV-SBP, adjusted for age, gender, and mean
SBP (figure 2.1), with a 24% increase in stroke risk with unadjusted effect sizes (table 2.2).
There was moderate heterogeneity between studies (p<0.001%, I2=59%), resulting in
minimal difference between fixed and random effects meta-analysis with no evidence of
reporting bias (figure 2.2). There was only an increased stroke risk of ~17% per SD of CV-
DBP, before and after adjustment (table 2.2). The pooled effect size was similar for stroke
risk per SD of SD-SBP (RE HR = 1.20, 1.16 – 1.25, p<0.001, I2=62%) and SD of SD-DBP
(RE HR = 1.26, 1.19 – 1.34, p<0.001, I2=75%), and for trials in which baseline SD of CV-
SBP was known (RE HR = 1.21, 1.16 – 1.26, p<0.001, I2=60%).
Figure 2.1 Forest plot of the relationship between CV-SBP and risk of stroke, adjusted for age,
gender and mean SBP. Pooled estimates are presented as both fixed and random effects meta-
analysis per SD of CV-SBP.
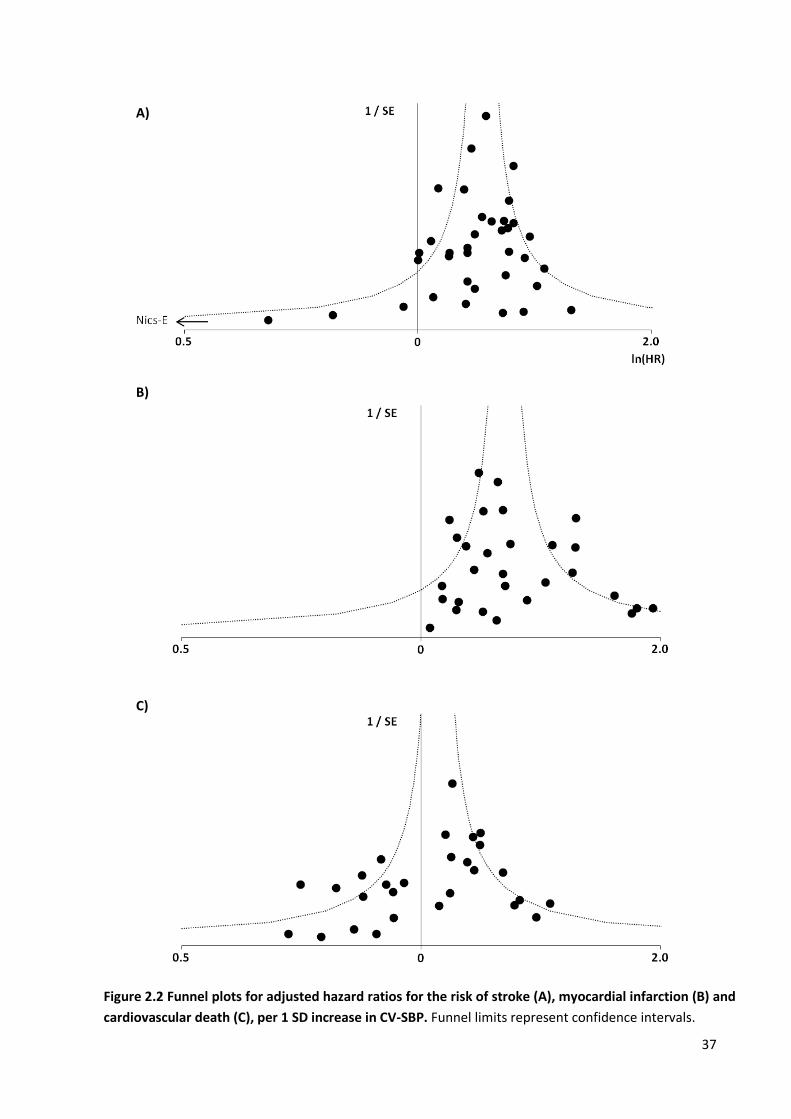
37
A)
B)
C)
Figure 2.2 Funnel plots for adjusted hazard ratios for the risk of stroke (A), myocardial infarction (B) and
cardiovascular death (C), per 1 SD increase in CV-SBP. Funnel limits represent confidence intervals.
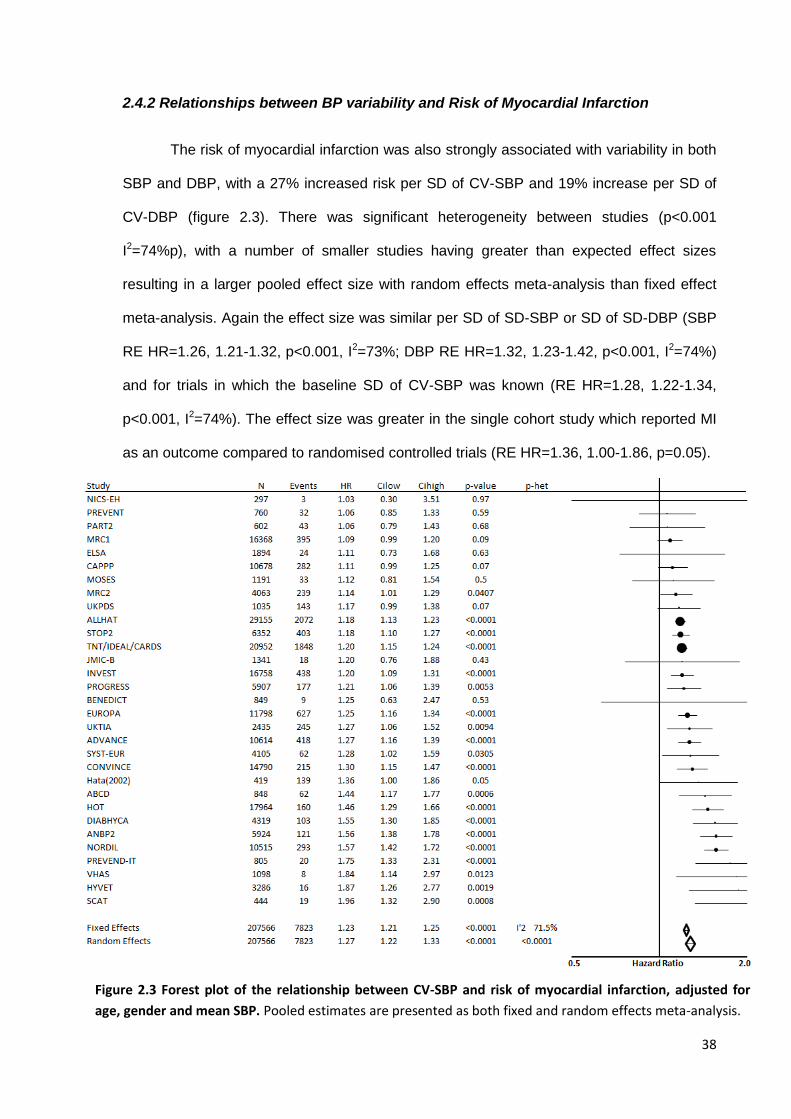
38
2.4.2 Relationships between BP variability and Risk of Myocardial Infarction
The risk of myocardial infarction was also strongly associated with variability in both
SBP and DBP, with a 27% increased risk per SD of CV-SBP and 19% increase per SD of
CV-DBP (figure 2.3). There was significant heterogeneity between studies (p<0.001
I2=74%p), with a number of smaller studies having greater than expected effect sizes
resulting in a larger pooled effect size with random effects meta-analysis than fixed effect
meta-analysis. Again the effect size was similar per SD of SD-SBP or SD of SD-DBP (SBP
RE HR=1.26, 1.21-1.32, p<0.001, I2=73%; DBP RE HR=1.32, 1.23-1.42, p<0.001, I2=74%)
and for trials in which the baseline SD of CV-SBP was known (RE HR=1.28, 1.22-1.34,
p<0.001, I2=74%). The effect size was greater in the single cohort study which reported MI
as an outcome compared to randomised controlled trials (RE HR=1.36, 1.00-1.86, p=0.05).
Figure 2.3 Forest plot of the relationship between CV-SBP and risk of myocardial infarction, adjusted for
age, gender and mean SBP. Pooled estimates are presented as both fixed and random effects meta-analysis.
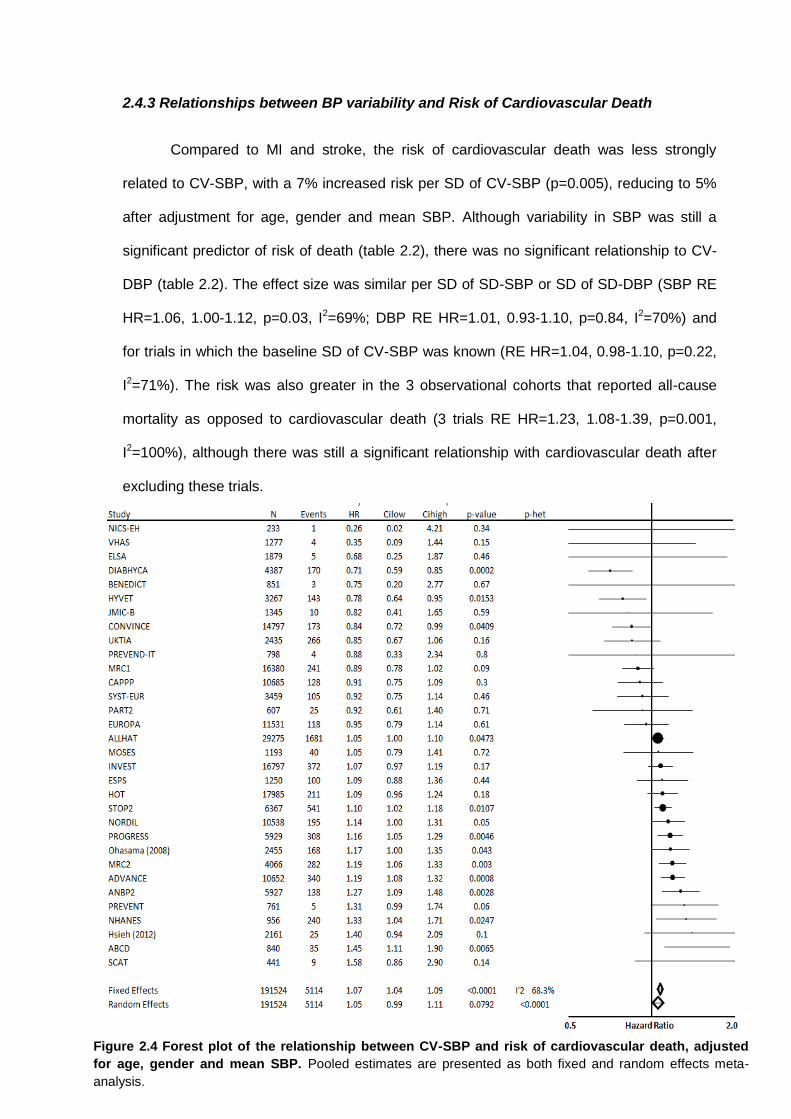
39
2.4.3 Relationships between BP variability and Risk of Cardiovascular Death
Compared to MI and stroke, the risk of cardiovascular death was less strongly
related to CV-SBP, with a 7% increased risk per SD of CV-SBP (p=0.005), reducing to 5%
after adjustment for age, gender and mean SBP. Although variability in SBP was still a
significant predictor of risk of death (table 2.2), there was no significant relationship to CV-
DBP (table 2.2). The effect size was similar per SD of SD-SBP or SD of SD-DBP (SBP RE
HR=1.06, 1.00-1.12, p=0.03, I2=69%; DBP RE HR=1.01, 0.93-1.10, p=0.84, I2=70%) and
for trials in which the baseline SD of CV-SBP was known (RE HR=1.04, 0.98-1.10, p=0.22,
I2=71%). The risk was also greater in the 3 observational cohorts that reported all-cause
mortality as opposed to cardiovascular death (3 trials RE HR=1.23, 1.08-1.39, p=0.001,
I2=100%), although there was still a significant relationship with cardiovascular death after
excluding these trials.
Figure 2.4 Forest plot of the relationship between CV-SBP and risk of cardiovascular death, adjusted
for age, gender and mean SBP. Pooled estimates are presented as both fixed and random effects meta-
analysis.
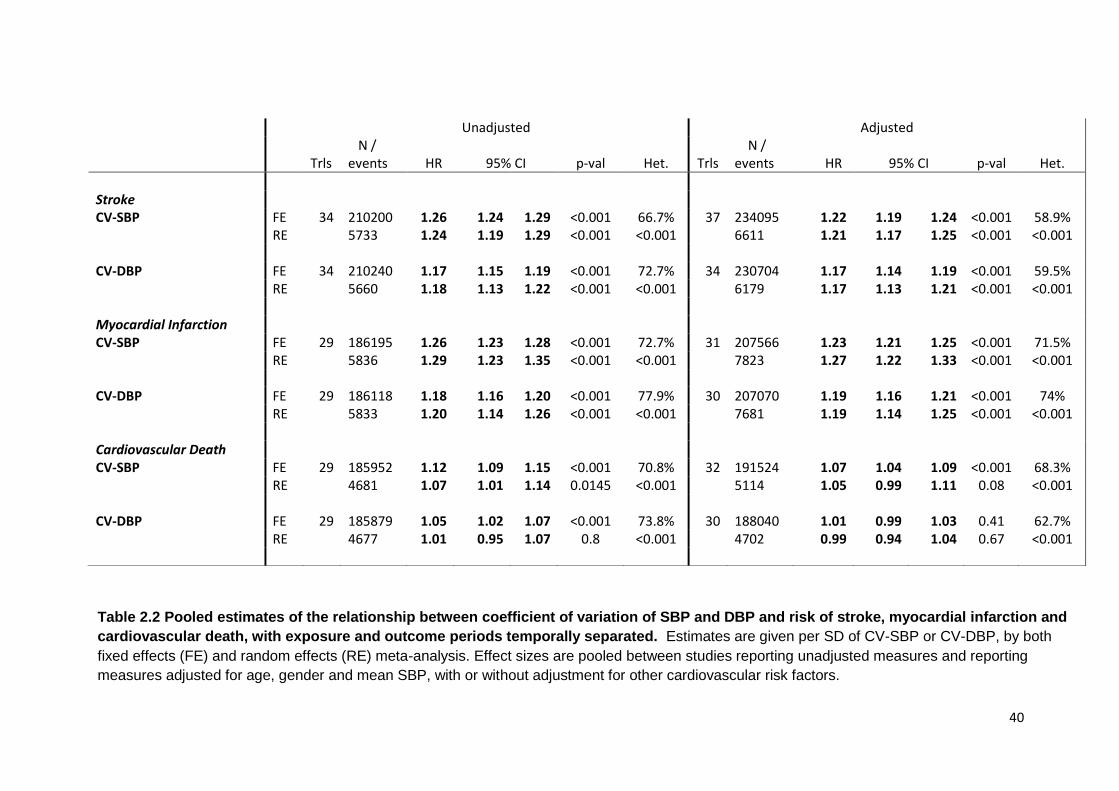
40
Unadjusted Adjusted
Trls N / events
HR
95% CI
p-val
Het.
Trls
N / events
HR
95% CI
p-val
Het.
Stroke CV-SBP FE 34 210200 1.26 1.24 1.29 <0.001 66.7% 37 234095 1.22 1.19 1.24 <0.001 58.9% RE 5733 1.24 1.19 1.29 <0.001 <0.001 6611 1.21 1.17 1.25 <0.001 <0.001 CV-DBP FE 34 210240 1.17 1.15 1.19 <0.001 72.7% 34 230704 1.17 1.14 1.19 <0.001 59.5% RE 5660 1.18 1.13 1.22 <0.001 <0.001 6179 1.17 1.13 1.21 <0.001 <0.001 Myocardial Infarction CV-SBP FE 29 186195 1.26 1.23 1.28 <0.001 72.7% 31 207566 1.23 1.21 1.25 <0.001 71.5% RE 5836 1.29 1.23 1.35 <0.001 <0.001 7823 1.27 1.22 1.33 <0.001 <0.001 CV-DBP FE 29 186118 1.18 1.16 1.20 <0.001 77.9% 30 207070 1.19 1.16 1.21 <0.001 74% RE 5833 1.20 1.14 1.26 <0.001 <0.001 7681 1.19 1.14 1.25 <0.001 <0.001 Cardiovascular Death CV-SBP FE 29 185952 1.12 1.09 1.15 <0.001 70.8% 32 191524 1.07 1.04 1.09 <0.001 68.3% RE 4681 1.07 1.01 1.14 0.0145 <0.001 5114 1.05 0.99 1.11 0.08 <0.001 CV-DBP FE 29 185879 1.05 1.02 1.07 <0.001 73.8% 30 188040 1.01 0.99 1.03 0.41 62.7% RE 4677 1.01 0.95 1.07 0.8 <0.001 4702 0.99 0.94 1.04 0.67 <0.001
Table 2.2 Pooled estimates of the relationship between coefficient of variation of SBP and DBP and risk of stroke, myocardial infarction and
cardiovascular death, with exposure and outcome periods temporally separated. Estimates are given per SD of CV-SBP or CV-DBP, by both
fixed effects (FE) and random effects (RE) meta-analysis. Effect sizes are pooled between studies reporting unadjusted measures and reporting
measures adjusted for age, gender and mean SBP, with or without adjustment for other cardiovascular risk factors.
41
2.4.4 Effect of temporal separation of exposure and outcome periods
The relationship between variability in SBP and the risk of stroke was slightly
attenuated when the exposure and outcome periods were separated in time, particularly for
the risk of myocardial infarction, to a 10% increase in risk per SD of CV-SBP or CV-DBP.
However unlike stroke or MI, the relationship with cardiovascular death was stronger in
trials separating the exposure and outcome periods (CV-SBP HR=1.16, 1.12-1.20,
p<0.0001) (table 2.2).
2.4.5 Sources of heterogeneity
There was moderate heterogeneity between trials reporting the relationship between
blood pressure variability and risk of stroke, MI or CV-death. For all outcomes this was
partly explained by study type, with observational cohort studies demonstrating a stronger
association with the risk of stroke than randomised controlled trials (HR=1.29, 1.14-1.46,
p<0.001, 3 studies). However, differences in the clinical characteristics of the populations
studied in each trial also explained some of the heterogeneity between trials. Stratifying
studies by mean age of the population demonstrated no significant difference in the
relationship between CV-SBP and risk of stroke or cardiovascular death (table 2.4), but
there was an increased predictive value of CV-SBP for risk of MI with increasing age. In
contrast, risk of stroke and MI were greatest in studies with mean baseline SBP >160 but
there was a trend to a decreasing risk of CV death per SD increase in CV-SBP with
increasing baseline SBP (figure 2.5).
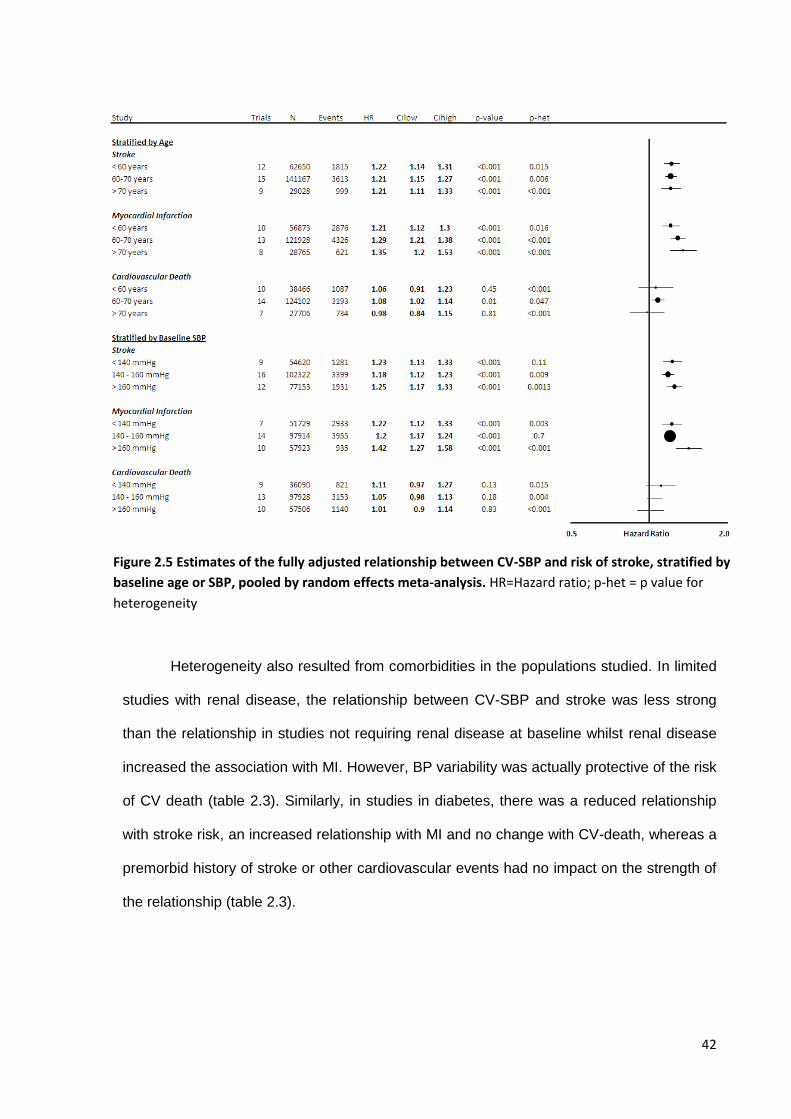
42
Heterogeneity also resulted from comorbidities in the populations studied. In limited
studies with renal disease, the relationship between CV-SBP and stroke was less strong
than the relationship in studies not requiring renal disease at baseline whilst renal disease
increased the association with MI. However, BP variability was actually protective of the risk
of CV death (table 2.3). Similarly, in studies in diabetes, there was a reduced relationship
with stroke risk, an increased relationship with MI and no change with CV-death, whereas a
premorbid history of stroke or other cardiovascular events had no impact on the strength of
the relationship (table 2.3).
Figure 2.5 Estimates of the fully adjusted relationship between CV-SBP and risk of stroke, stratified by
baseline age or SBP, pooled by random effects meta-analysis. HR=Hazard ratio; p-het = p value for
heterogeneity
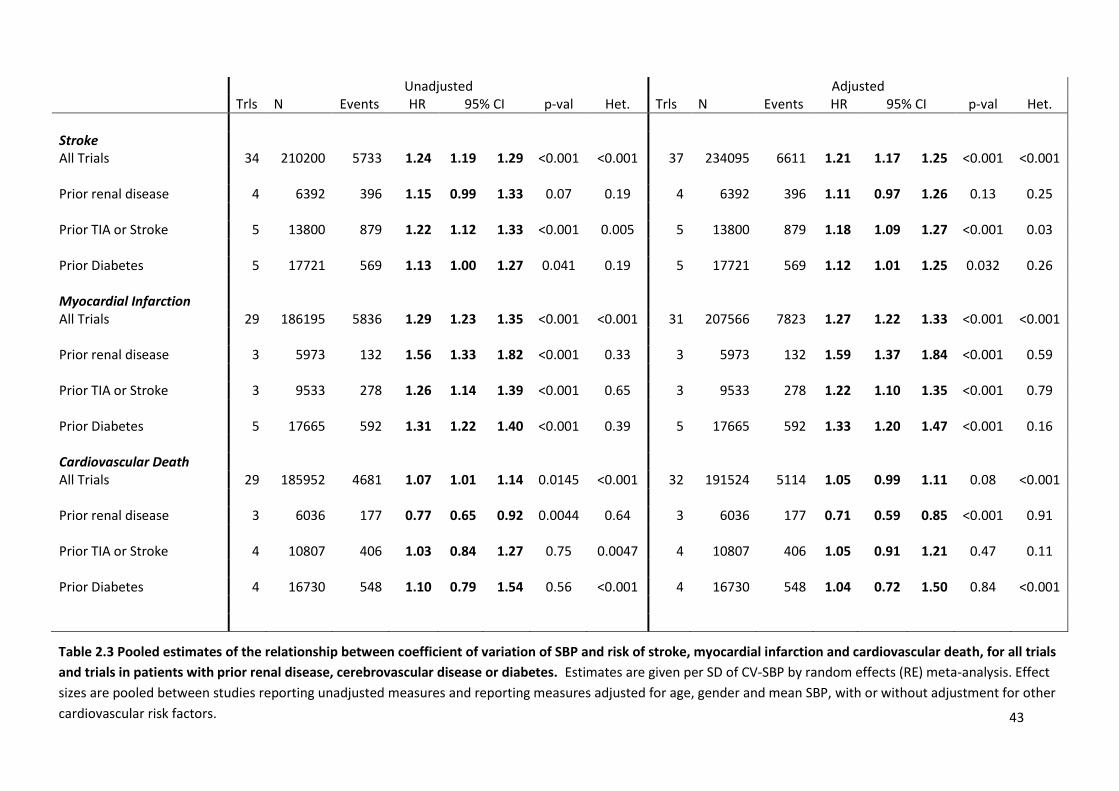
43
Unadjusted Adjusted Trls N Events HR 95% CI p-val Het. Trls N Events HR 95% CI p-val Het.
Stroke All Trials 34 210200 5733 1.24 1.19 1.29 <0.001 <0.001 37 234095 6611 1.21 1.17 1.25 <0.001 <0.001 Prior renal disease 4 6392 396 1.15 0.99 1.33 0.07 0.19 4 6392 396 1.11 0.97 1.26 0.13 0.25 Prior TIA or Stroke 5 13800 879 1.22 1.12 1.33 <0.001 0.005 5 13800 879 1.18 1.09 1.27 <0.001 0.03 Prior Diabetes 5 17721 569 1.13 1.00 1.27 0.041 0.19 5 17721 569 1.12 1.01 1.25 0.032 0.26 Myocardial Infarction All Trials 29 186195 5836 1.29 1.23 1.35 <0.001 <0.001 31 207566 7823 1.27 1.22 1.33 <0.001 <0.001 Prior renal disease 3 5973 132 1.56 1.33 1.82 <0.001 0.33 3 5973 132 1.59 1.37 1.84 <0.001 0.59 Prior TIA or Stroke 3 9533 278 1.26 1.14 1.39 <0.001 0.65 3 9533 278 1.22 1.10 1.35 <0.001 0.79 Prior Diabetes 5 17665 592 1.31 1.22 1.40 <0.001 0.39 5 17665 592 1.33 1.20 1.47 <0.001 0.16 Cardiovascular Death All Trials 29 185952 4681 1.07 1.01 1.14 0.0145 <0.001 32 191524 5114 1.05 0.99 1.11 0.08 <0.001 Prior renal disease 3 6036 177 0.77 0.65 0.92 0.0044 0.64 3 6036 177 0.71 0.59 0.85 <0.001 0.91 Prior TIA or Stroke 4 10807 406 1.03 0.84 1.27 0.75 0.0047 4 10807 406 1.05 0.91 1.21 0.47 0.11 Prior Diabetes 4 16730 548 1.10 0.79 1.54 0.56 <0.001 4 16730 548 1.04 0.72 1.50 0.84 <0.001
Table 2.3 Pooled estimates of the relationship between coefficient of variation of SBP and risk of stroke, myocardial infarction and cardiovascular death, for all trials
and trials in patients with prior renal disease, cerebrovascular disease or diabetes. Estimates are given per SD of CV-SBP by random effects (RE) meta-analysis. Effect
sizes are pooled between studies reporting unadjusted measures and reporting measures adjusted for age, gender and mean SBP, with or without adjustment for other
cardiovascular risk factors.
44
2.4.5 Relevant studies not included in meta-analysis
In studies not fulfilling the inclusion criteria but reporting the risk of cardiovascular
events, there was an increased risk of cardiovascular mortality, diabetes or stroke in male
patients with a transient elevation of diastolic blood pressure compared to normotensive
patients (CV mortality OR: 1.59 p=0.06; Stroke OR 15.9 p=0.03; diabetes OR=7.5 p=0.04).54
In haemodialysis patients in the FOSIDIAL study, cardiovascular events were significantly
associated with systolic BP variability (HR per 1% CV=1.49, 1.15-1.93, p<0.0001).58 In
contrast to these studies, a report from the ELSA study reported no significant association
between visit-to-visit variability in SBP and cardiovascular events but did not report any
numerical association.8 However, data from the Blood Pressure Lowering Trialist’s
collaboration demonstrated that there was an association in this study, but that it failed to
reach significance due to its small size (figure 2.1).
A number of studies reported relationships between blood pressure variability and
markers of leukoaraiosis. In the Honolulu-Asia Aging study including 575 Japanese-
American men, greater systolic blood pressure variability over three clinic visits between
1965 and 1974 was associated with an increased risk of white matter lesions on MRI
between 1994 and 1996 comparing the top quintile of SBP variability with the bottom quintile
(OR=2.2 95%CI 1.10-4.79), independent of mean SBP which was not associated with white
matter disease (OR 1.01 0.9-1.02).53 Chronic cerebrovascular disease was also increased in
patients with increased variability in mean BP in a mixed ethnicity North American
population, with an increase in white matter hyperterintensities (p=0.0017) and silent infarcts
(p=0.004) across four groups with increasing mean MBP and SD.56 Similarly, there was an
increase in the incidence of cerebral microbleeds with increasing variability in blood pressure
in a Chinese cohort (OR per 5mmHg SD-SBP: 1.34, 1.01-2.7, p=0.046), particularly in more
hypertensive locations,59 and an increase in cognitive impairment with increasing BP
variability in a Japanese cohort of elderly patients with increased cardiovascular risk (MMSE
<25 OR per 1% CV-SBP=1.60 p1.20-2.1).57
45
2.5 Discussion
Variability in systolic and diastolic BP was associated with the risk of stroke or
myocardial infarction in 318700 patients in 43 cohorts, with a clinically significant >20%
increased risk per SD increase in variability in SBP. There was a weaker but significant
association with cardiovascular death, which was stronger in studies separating the BP
measurement and outcome periods. These relationships were consistent across subgroups
and study types, with or without adjustment for age, gender and mean BP. In addition,
multiple reports identified a relationship between SBP variability and leukoaraiosis.
The validity of the relationship between BP variability and cardiovascular events has
been questioned, partly due to negative findings in small studies8 and studies with
inappropriate methods of assessing within-individual variability in BP.11 This is in contrast to
large studies reporting significant associations in disparate populations,5-7, 16 although these
studies may be prone to residual confounding or reporting bias. This large meta-analysis of
>300000 patients is prone to neither of these problems: it is well-powered; it incorporates a
wide-range of patients in multiple settings; all studies used reliable measures of BP
variability; there was no evidence of reporting or publication bias; it allowed for unadjusted
analysis and adjustment for the most important confounders. In particular, effects were
consistent between study type, patient characteristics and premorbid diseases.
Given the large number of studies, there was heterogeneity affecting most analyses.
This heterogeneity was moderate for the primary analysis of stroke risk but was greater for
pooled estimates of the relationship with cardiovascular death and myocardial infarction.
However, it is apparent from the forest plots that this resulted primarily from a small number
of events in small studies, with 11 strokes in NICS-E contributing more heterogeneity to the
stroke meta-analysis than any other study. There was little heterogeneity amongst larger
studies and similar results in sensitivity analyses, suggesting that this heterogeneity had little
effect on the magnitude or reliability of the pooled effect sizes.
46
Although the heterogeneity is unlikely to affect the pooled estimates, it is still
informative. Firstly, the relationships were stronger in observational cohorts than randomised
controlled trials, possibly due to strict entry criteria for most RCTs that limit variability in
blood pressure and so result in an underestimation of the pooled effect.4 Importantly, the
strong relationship in population based studies suggests that the relationship between BP
variability and cardiovascular events is not restricted to patients already receiving
antihypertensive medications but is present in largely untreated populations, and is therefore
unlikely to be explained solely by drug half-life or compliance.6, 13 Secondly, within-study
adjustment for age, gender and mean SBP reduced heterogeneity between studies. Thirdly,
there was a trend to stronger associations between BP variability and myocardial infarction
in older individuals with higher baseline SBP, with the opposite pattern for cardiovascular
death, although these differences were small. This may suggest a dissociation between the
mechanism of death and myocardial infarction. Finally, renal disease appeared to reduce the
strength of the association with stroke and increase it with MI. These discrepancies between
studies were largely small, and except for renal disease and cardiovascular death, still
resulted in significant associations between BP variability and outcome. However, they
provide potential avenues of investigation to explain the mechanisms underlying the
relationships between BP variability and cardiovascular events.
A greater than 20% increase in the risk of stroke or MI per SD of CV-SBP or DBP
after adjustment for age, gender and mean SBP is clinically significant and is the most
reliable current estimate of the relationship between BP variability and cardiovascular
events. Across the entire population, the range of BP variability therefore reflects a
significant burden of potentially preventable cardiovascular morbidity. Furthermore, as the
relationship between blood pressure variability and stroke risk appears to be non-linear,1
there is likely to be an even greater excess risk in the highest decile of the population. The
association with cardiovascular death was weaker than stroke or MI, at least when BP
variability was determined concurrently with outcomes. However, in studies in which
47
measurement of BP variability preceded the outcome period, the strength of association was
significantly stronger, suggesting a longer-term causative relationship between BP variability
and death.
Despite a large number of studies with extensive adjustment for potential
confounders, this systematic review has some limitations. Firstly, most of the cohorts
included were from randomised controlled trials, with strict entry criteria that may result in
underestimation of associations between BP variability and cardiovascular events.
Furthermore, most patients included in RCTs, even in the placebo arm, receive treatment
with antihypertensive medications. However, if treatment reduced BP variability then the
most likely effect of including patients would be to reduce the relationship with BP variability,
potentially explaining the stronger relationship in observational studies. Secondly, despite
the persistent relationship in studies separating the measurement and outcome periods, this
study cannot definitively demonstrate causality due to the observational nature of the
included studies. Causality would only be proven by interventions that solely reduced BP
variability and then resulted in a reduction in cardiovascular events, consistent with our
meta-analysis of antihypertensive medication effects on BP variability.4 Finally, there was a
large variation in the outcomes and measures of BP variability reported by different trials,
limiting which trials could be combined in meta-analysis. However, there were adequate
trials to combine relationships for each measure and outcome.
In conclusion, variability in systolic and diastolic blood pressure is significantly
associated with stroke, myocardial infarction and cardiovascular death, independently of age
and mean BP. The relationship is clinically significant with >20% increased risk per SD of BP
variability, providing an opportunity to significantly reduce the risk of cardiovascular events
through appropriate choice of antihypertensives.

48
2.6 References
1. Rothwell PM. Limitations of the usual blood-pressure hypothesis and importance of variability, instability, and episodic hypertension. Lancet 2010;375:938-948.
2. Rothwell PM, Howard SC, Dolan E, et al. Prognostic significance of visit-to-visit variability, maximum systolic blood pressure, and episodic hypertension. Lancet 2010;375:895-905.
3. Rothwell PM, Howard SC, Dolan E, et al. Effects of beta blockers and calcium-channel blockers on within-individual variability in blood pressure and risk of stroke. Lancet Neurol 2010;9:469-480.
4. Webb AJ, Fischer U, Mehta Z, Rothwell PM. Effects of antihypertensive-drug class on interindividual variation in blood pressure and risk of stroke: a systematic review and meta-analysis. Lancet 2010;375:906-915.
5. Shimbo D, Newman JD, Aragaki AK, et al. Association between annual visit-to-visit blood pressure variability and stroke in postmenopausal women: data from the Women's Health Initiative. Hypertension 2012;60:625-630.
6. Muntner P, Shimbo D, Tonelli M, Reynolds K, Arnett DK, Oparil S. The Relationship Between Visit-to-Visit Variability in Systolic Blood Pressure and All-Cause Mortality in the General Population: Findings From NHANES III, 1988 to 1994. Hypertension 2011.
7. Johansson JK, Niiranen TJ, Puukka PJ, Jula AM. Prognostic Value of the Variability in Home-Measured Blood Pressure and Heart Rate: The Finn-Home Study. Hypertension 2012.
8. Mancia G, Facchetti R, Parati G, Zanchetti A. Visit-to-visit blood pressure variability, carotid atherosclerosis, and cardiovascular events in the European Lacidipine Study on Atherosclerosis. Circulation 2012;126:569-578.
9. Eguchi K, Hoshide S, Schwartz JE, Shimada K, Kario K. Visit-to-visit and ambulatory blood pressure variability as predictors of incident cardiovascular events in patients with hypertension. Am J Hypertens 2012;25:962-968.
10. Asayama K, Kikuya M, Schutte R, et al. Home blood pressure variability as cardiovascular risk factor in the population of Ohasama. Hypertension 2013;61:61-69.
11. Schutte R, Thijs L, Liu YP, et al. Within-subject blood pressure level--not variability--predicts fatal and nonfatal outcomes in a general population. Hypertension 2012;60:1138-1147.
12. Kostis J.B. SJE, Cabrera J., Cosgrove N.M., Pressel S., Davis B.R. . Visit-to-visit variability of systolic blood pressure predicts outcomes mainly in the active treatment group rather than the placebo group in the systolic hypertension in the elderly program: Pathophysiologic implications. . Journal of the American College of Cardiology 2013;61
13. Muntner P, Levitan EB, Joyce C, et al. Association Between Antihypertensive Medication Adherence and Visit-to-Visit Variability of Blood Pressure. J Clin Hypertens (Greenwich) 2013;15:112-117.
14. Hata Y, Kimura Y, Muratani H, et al. Office blood pressure variability as a predictor of brain infarction in elderly hypertensive patients. Hypertens Res 2000;23:553-560.
15. Hata Y, Muratani H, Kimura Y, et al. Office blood pressure variability as a predictor of acute myocardial infarction in elderly patients receiving antihypertensive therapy. J Hum Hypertens 2002;16:141-146.
16. Kikuya M, Ohkubo T, Metoki H, et al. Day-by-day variability of blood pressure and heart rate at home as a novel predictor of prognosis: the Ohasama study. Hypertension 2008;52:1045-1050.
17. Farrell B, Godwin J, Richards S, Warlow C. The United Kingdom transient ischaemic attack (UK-TIA) aspirin trial: final results. J Neurol Neurosurg Psychiatry 1991;54:1044-1054.
18. The European Stroke Prevention Study (ESPS). Principal end-points. The ESPS Group. Lancet 1987;2:1351-1354.
19. Trial of secondary prevention with atenolol after transient ischemic attack or nondisabling ischemic stroke. The Dutch TIA Trial Study Group. Stroke 1993;24:543-548.
20. Dahlof B, Sever P, Poulter N, et al. Prevention of cardiovascular events with an antihypertensive regimen of amlodipine adding perindopril as required versus atenolol adding bendroflumethiazide as required, in the Anglo-Scandinavian Cardiac Outcomes Trial-Blood Pressure Lowering Arm (ASCOT-BPLA): a multicentre randomised controlled trial. The Lancet 2005;366:895-906.
21. Hsieh YT, Tu ST, Cho TJ, Chang SJ, Chen JF, Hsieh MC. Visit-to-visit variability in blood pressure strongly predicts all-cause mortality in patients with type 2 diabetes: a 5.5-year prospective analysis. Eur J Clin Invest 2012;42:245-253.
22. Di Iorio B, Pota A, Sirico ML, et al. Blood pressure variability and outcomes in chronic kidney disease. Nephrol Dial Transplant 2012;27:4404-4410.
49
23. Deedwania P.C. DDA, Breazna A., Wun C.C., Pedersen T., Colhoun H.M., Neil A., Hitman G. . The effect of visit-to-visit variability in blood pressure on stroke and coronary events in the TNT, IDEAL and CARDS trials. . European Heart Journal 2012;33:1.
24. Poortvliet RK, Ford I, Lloyd SM, et al. Blood pressure variability and cardiovascular risk in the PROspective Study of Pravastatin in the Elderly at Risk (PROSPER). PLoS One 2012;7:e52438.
25. Estacio RO, Jeffers BW, Gifford N, Schrier RW. Effect of blood pressure control on diabetic microvascular complications in patients with hypertension and type 2 diabetes. Diabetes Care 2000;23 Suppl 2:B54-64.
26. Zoungas S, de Galan BE, Ninomiya T, et al. Combined Effects of Routine Blood Pressure Lowering and Intensive Glucose Control on Macrovascular and Microvascular Outcomes in Patients With Type 2 Diabetes: New results from the ADVANCE trial. Diabetes Care 2009;32:2068-2074.
27. Diuretic Versus -Blocker as First-Step Antihypertensive Therapy: Final Results From the Antihypertensive and Lipid-Lowering Treatment to Prevent Heart Attack Trial (ALLHAT). Hypertension 2003;42:239-246.
28. Wing LM, Reid CM, Ryan P, et al. A comparison of outcomes with angiotensin-converting--enzyme inhibitors and diuretics for hypertension in the elderly. N Engl J Med 2003;348:583-592.
29. Ruggenenti P, Fassi A, Ilieva AP, et al. Preventing microalbuminuria in type 2 diabetes. N Engl J Med 2004;351:1941-1951.
30. Hansson L, Lindholm LH, Niskanen L, et al. Effect of angiotensin-converting-enzyme inhibition compared with conventional therapy on cardiovascular morbidity and mortality in hypertension: the Captopril Prevention Project (CAPPP) randomised trial. The Lancet 1999;353:611-616.
31. Black HR. Principal Results of the Controlled Onset Verapamil Investigation of Cardiovascular End Points (CONVINCE) Trial. JAMA: The Journal of the American Medical Association 2003;289:2073-2082.
32. Marre M. Effects of low dose ramipril on cardiovascular and renal outcomes in patients with type 2 diabetes and raised excretion of urinary albumin: randomised, double blind, placebo controlled trial (the DIABHYCAR study). Bmj 2004;328:495-490.
33. Zanchetti A. Calcium Antagonist Lacidipine Slows Down Progression of Asymptomatic Carotid Atherosclerosis: Principal Results of the European Lacidipine Study on Atherosclerosis (ELSA), a Randomized, Double-Blind, Long-Term Trial. Circulation 2002;106:2422-2427.
34. Efficacy of perindopril in reduction of cardiovascular events among patients with stable coronary artery disease: randomised, double-blind, placebo-controlled, multicentre trial (the EUROPA study). The Lancet 2003;362:782-788.
35. Hansson L, Zanchetti A, Carruthers S, et al. Effects of intensive blood-pressure lowering and low-dose aspirin in patients with hypertension: principal results of the Hypertension Optimal Treatment (HOT) randomised trial. The Lancet 1998;351:1755-1762.
36. Peters R, Beckett N, Forette F, et al. Incident dementia and blood pressure lowering in the Hypertension in the Very Elderly Trial cognitive function assessment (HYVET-COG): a double-blind, placebo controlled trial. Lancet Neurol 2008;7:683-689.
37. Pepine CJ. A Calcium Antagonist vs a Non-Calcium Antagonist Hypertension Treatment Strategy for Patients With Coronary Artery Disease: The International Verapamil-Trandolapril Study (INVEST): A Randomized Controlled Trial. JAMA: The Journal of the American Medical Association 2003;290:2805-2816.
38. Yui Y, Sumiyoshi T, Kodama K, et al. Comparison of nifedipine retard with angiotensin converting enzyme inhibitors in Japanese hypertensive patients with coronary artery disease: the Japan Multicenter Investigation for Cardiovascular Diseases-B (JMIC-B) randomized trial. Hypertens Res 2004;27:181-191.
39. Schrader J, Luders S, Kulschewski A, et al. Morbidity and Mortality After Stroke, Eprosartan Compared With Nitrendipine for Secondary Prevention: Principal Results of a Prospective Randomized Controlled Study (MOSES). Stroke 2005;36:1218-1224.
40. MRC trial of treatment of mild hypertension: principal results. Medical Research Council Working Party. Br Med J (Clin Res Ed) 1985;291:97-104.
41. Medical Research Council trial of treatment of hypertension in older adults: principal results. MRC Working Party. Bmj 1992;304:405-412.
42. Randomized double-blind comparison of a calcium antagonist and a diuretic in elderly hypertensives. National Intervention Cooperative Study in Elderly Hypertensives Study Group. Hypertension 1999;34:1129-1133.
50
43. Hansson L, Hedner T, Lundjohansen P, et al. Randomised trial of effects of calcium antagonists compared with diuretics and ?-blockers on cardiovascular morbidity and mortality in hypertension: the Nordic Diltiazem (NORDIL) study. The Lancet 2000;356:359-365.
44. MacMahon S, Sharpe N, Gamble G, et al. Randomized, placebo-controlled trial of the angiotensin-converting enzyme inhibitor, ramipril, in patients with coronary or other occlusive arterial disease. PART-2 Collaborative Research Group. Prevention of Atherosclerosis with Ramipril. J Am Coll Cardiol 2000;36:438-443.
45. Brouwers FP, Asselbergs FW, Hillege HL, et al. Long-term effects of fosinopril and pravastatin on cardiovascular events in subjects with microalbuminuria:Ten years of follow-up of Prevention of Renal and Vascular End-stage Disease Intervention Trial (PREVEND IT). Am Heart J 2011;161:1171-1178.
46. Pitt B, Poole-Wilson PA, Segal R, et al. Effect of losartan compared with captopril on mortality in patients with symptomatic heart failure: randomised trial--the Losartan Heart Failure Survival Study ELITE II. Lancet 2000;355:1582-1587.
47. Randomised trial of a perindopril-based blood-pressure-lowering regimen among 6,105 individuals with previous stroke or transient ischaemic attack. Lancet 2001;358:1033-1041.
48. Giorgi G, Legramante JM, Fioravanti G, Paies G, Legramante A. A comparative study of doxazosin versus atenolol in mild-to-moderate hypertension. Am Heart J 1988;116:1801-1805.
49. Hansson L, Lindholm L, Ekbom T, et al. Randomised trial of old and new antihypertensive drugs in elderly patients: cardiovascular mortality and morbidity the Swedish Trial in Old Patients with Hypertension-2 study. The Lancet 1999;354:1751-1756.
50. Staessen J, Fagard R, Thijs L, et al. Randomised double-blind comparison of placebo and active treatment for older patients with isolated systolic hypertension. The Lancet 1997;350:757-764.
51. Efficacy of atenolol and captopril in reducing risk of macrovascular and microvascular complications in type 2 diabetes: UKPDS 39. UK Prospective Diabetes Study Group. Bmj 1998;317:713-720.
52. Zanchetti A, Rosei EA, Dal Palu C, Leonetti G, Magnani B, Pessina A. The Verapamil in Hypertension and Atherosclerosis Study (VHAS): results of long-term randomized treatment with either verapamil or chlorthalidone on carotid intima-media thickness. J Hypertens 1998;16:1667-1676.
53. Havlik RJ, Foley DJ, Sayer B, Masaki K, White L, Launer LJ. Variability in midlife systolic blood pressure is related to late-life brain white matter lesions: the Honolulu-Asia Aging study. Stroke 2002;33:26-30.
54. Wingfield D, Grodzicki T, Palmer AJ, Wells F, Bulpitt CJ. Transiently elevated diastolic blood pressure is associated with a gender-dependent effect on cardiovascular risk. J Hum Hypertens 2005;19:347-354.
55. Kilpatrick ES, Rigby AS, Atkin SL. The role of blood pressure variability in the development of nephropathy in type 1 diabetes. Diabetes Care 2010;33:2442-2447.
56. Brickman AM, Reitz C, Luchsinger JA, et al. Long-term blood pressure fluctuation and cerebrovascular disease in an elderly cohort. Arch Neurol 2010;67:564-569.
57. Nagai M, Hoshide S, Ishikawa J, Shimada K, Kario K. Visit-to-visit blood pressure variations: New independent determinants for carotid artery measures in the elderly at high risk of cardiovascular disease. J Am Soc Hypertens 2011;5:184-192.
58. Rossignol P, Cridlig J, Lehert P, Kessler M, Zannad F. Visit-to-visit blood pressure variability is a strong predictor of cardiovascular events in hemodialysis: insights from FOSIDIAL. Hypertension 2012;60:339-346.
59. Liu W, Liu R, Sun W, et al. Different impacts of blood pressure variability on the progression of cerebral microbleeds and white matter lesions. Stroke 2012;43:2916-2922.
51
CHAPTER THREE
Effects of antihypertensive drug class on consistency of
control of blood pressure and risk of stroke:
analysis of over 2 million readings in 244,479 participants
3.1 Summary 52
3.2 Introduction 53
3.3 Methods 54
3.3.1 Data Collection 54
3.3.2 Statistical Analysis 55
3.3.3 Meta-analyses by drug-class 57
3.3.4 Expanded meta-analysis of drug-class effects on group BP variability 57
3.4 Findings 59
3.4.1 Drug class effects on cardiovascular outcomes 59
3.4.2 Within-individual variability in BP 59
3.4.3 Between-individual variability in mean SBP 62
3.4.4 Expanded meta-analysis of effects on group BP variability 62
3.4.5 Determinants of drug class effects on group BP variability 65
3.4.6 Effect of duration of treatment 68
3.5 Discussion 70
3.6 References 74
52
3.1 Summary
Inconsistent control of BP, manifest as visit-to-visit variability and episodic
hypertension, is a risk factor for stroke. I have previously shown that antihypertensive drug
classes differ in effects on the group distribution of BP but effects on stability of BP within
individuals and factors that alter the magnitude of these effects are poorly understood.
Using fixed and random-effects meta-analysis of individual patient data (IPD) from
32 trials (244,479 participants), I calculated antihypertensive effects on the consistency of
control of group mean BP (M-VR), the stability of control of BP from visit-to-visit within
individuals (I-VR), and updated analyses of effects on the group distribution of BP at follow-
up visits (G-VR). Differences between class effects on G-VR and stroke risk due to
treatment duration, half-life and patient characteristics were determined.
Effects of treatment on I-VR and M-VR (r2=0.90) explained effects on G-VR SBP
(p<0.00001). Compared with other classes, calcium channel blockers (CCB) reduced I-VR,
M-VR and G-VR (I-VR=0.89, 95% CI=0.82-0.96, p=0.0001; M-VR 0.83, 0.77-0.89, p<0.001;
G-VR 0.81, 0.75-0.87, p<0.001) and diuretics reduced I-VR (0.86, 0.76-0.97, p=0.02),
whereas I-VR, M-VR and G-VR were increased by ACE-inhibitors (1.15, 1.07-1.23,
p<0.0001; 1.16, 1.02-1.33, p=0.03; 1.12, 1.02-1.22, p=0.02) and beta-blockers (1.25, 1.08-
1.44, p=0.002; 1.17, 1.03-1.32, p=0.02; 1.25, 1.17-1.33, p=0.0001). Drug-class effects on
G-VR (309 trials; 292,883 participants) were independent of half-life and indication and
were greatest in the first year of follow-up (prior to add-on drugs), coinciding with the largest
differences in stroke risk (CCBs versus non-diuretic drugs: OR=0.74, 0.65-0.85, p<0.0001).
Antihypertensive drug-classes differ in stability of control of BP within individuals (I-
VR) and in consistency of control of mean BP between individuals (M-VR). Effects were
consistent for patient groups and drug half-life, but were attenuated with prolonged
treatment, probably due to the effect of add-on medications.
53
3.2 Introduction
Hypertension is a powerful independent risk factor for stroke and other vascular
events,1 and antihypertensive drugs are highly effective in their prevention.2, 3 If lowering of
blood pressure (BP) explains the benefits of antihypertensive drugs, it is likely that the
consistency of lowering within and between individuals will also be important. Indeed,
inconsistent control of BP, manifest as increased visit-to-visit variability in BP, high
maximum BP and episodic hypertension, has been shown to be an independent risk factor
for stroke,4, 5 even when control of mean SBP during follow-up is good.
Two recent reports suggested that antihypertensive drug classes differ in their
effects on variability in SBP, which correlated with differences in their effectiveness in
preventing stroke.6, 7 However, although one report showed differences in effects on within-
individual variability in BP using individual patient data from two large randomised
controlled trials (RCTs),7 the majority of the evidence was based on a meta-analysis of data
on effects of drug-class on the cross-sectional group distributions of BP during follow-up
rather than on temporal variation within individuals.6 Although the cross-sectional
distribution of BP may be a good measure of the overall consistency of control of BP at the
group level, it is a composite of two parameters that can only be measured with individual
patient data: within-individual visit-to-visit variability in BP and between-individual
differences in mean BP. To understand how current antihypertensive drugs differ in their
control of BP, and to design new drugs to improve control, it is important to understand the
determinants of consistency of control in individuals.
First, using all available individual patient data from RCTs of antihypertensive drugs,
I aimed to determine drug class effects on within-individual visit-to-visit variability (I-VR) in
BP, between-individual variation in control of mean BP (M-VR), and the resulting effect on
group variation in BP at specific follow-up visits (G-VR). Second, given that reporting of
group cross-sectional distribution of BP in trials of antihypertensive drugs eligible for my
previous meta-analysis was relatively poor,6, 8 I also aimed to update estimates of drug-
54
class effects on G-VR by more complete inclusion of trials in order to exclude any bias due
to selective reporting and to determine influences of drug half-life, indication for treatment,
and trial design (cross-over versus parallel group) on G-VR. Third, there are very high-rates
of protocol-driven use of add-on drugs of different classes during early follow-up visits in
many trials and Prof Rothwell previously observed that drug-class effects on variability in
BP (I-VR and G-VR) in the MRC trial based on the initial randomised comparison
diminished during follow-up.7 I therefore determined the time-course of effects on BP
variability during follow-up and related this to the time-course of effects on risk of stroke and
other vascular events.
3.3 Methods
3.3.1 Data collection
Given the limitations of de-novo searches of bibliographic databases in identifying
all eligible studies,9 I identified RCTs from published systematic reviews. I searched the
MEDLINE and Cochrane databases (1950 to week 1, July 2011) using combinations of the
following search terms: [meta(-)analysis] AND [antihypertensive agents OR blood-pressure
lowering].10 Non-English language papers were included. The reference lists of all identified
reviews and corresponding webtables were subsequently searched. For every trial fulfilling
the inclusion criteria (table 3.1), the main results paper was reviewed. If this report did not
fulfil the inclusion criteria, sub-studies were checked. A search for trials randomising >100
patients per treatment group for >1 year for the analysis of cardiovascular outcomes was
replicated by a second person (Urs Fischer).
No trial reported intra-individual variability in blood pressure except for the two
trials initially reported by Prof Rothwell.5 Prof Rothwell therefore contacted the principal
investigators of trials via the Blood Pressure Lowering Trialists’ Collaboration (BPLTC) or
directly if they were not involved in the BPLTC.11 The following data were requested for
each participant randomised in these trials: baseline clinical characteristics, all
measurements of systolic and diastolic blood pressure at baseline and at each follow-up
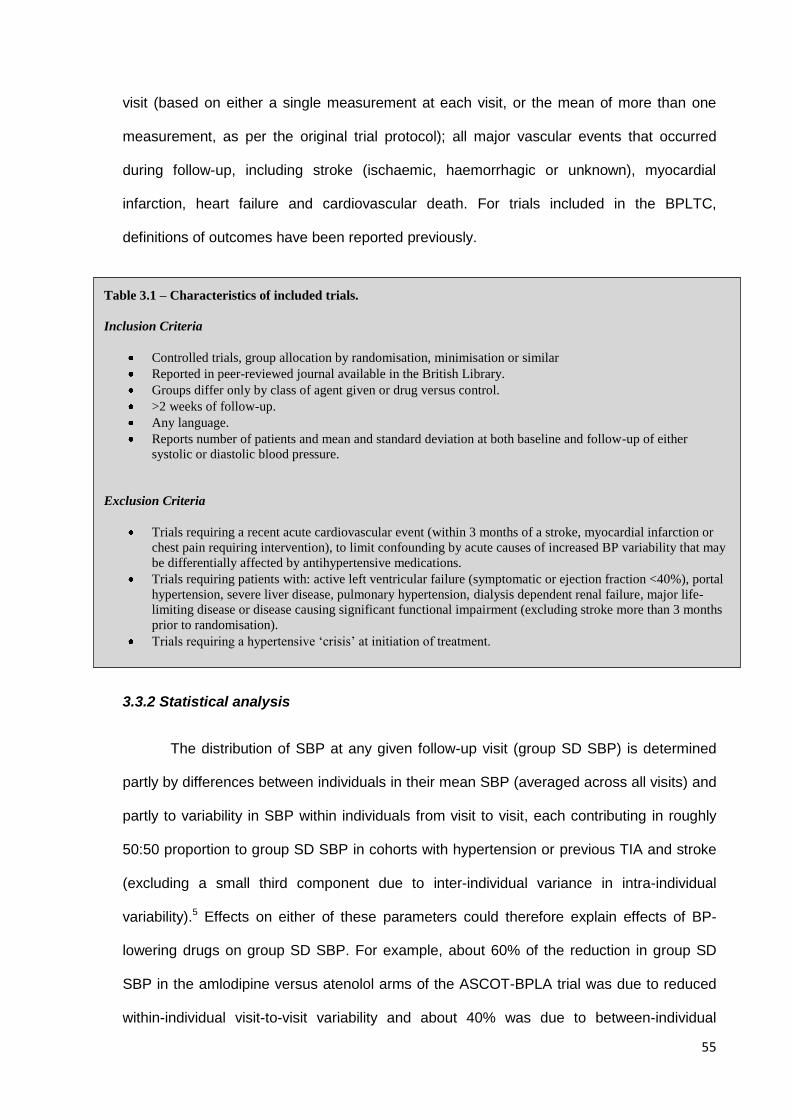
55
visit (based on either a single measurement at each visit, or the mean of more than one
measurement, as per the original trial protocol); all major vascular events that occurred
during follow-up, including stroke (ischaemic, haemorrhagic or unknown), myocardial
infarction, heart failure and cardiovascular death. For trials included in the BPLTC,
definitions of outcomes have been reported previously.
3.3.2 Statistical analysis
The distribution of SBP at any given follow-up visit (group SD SBP) is determined
partly by differences between individuals in their mean SBP (averaged across all visits) and
partly to variability in SBP within individuals from visit to visit, each contributing in roughly
50:50 proportion to group SD SBP in cohorts with hypertension or previous TIA and stroke
(excluding a small third component due to inter-individual variance in intra-individual
variability).5 Effects on either of these parameters could therefore explain effects of BP-
lowering drugs on group SD SBP. For example, about 60% of the reduction in group SD
SBP in the amlodipine versus atenolol arms of the ASCOT-BPLA trial was due to reduced
within-individual visit-to-visit variability and about 40% was due to between-individual
Table 3.1 – Characteristics of included trials.
Inclusion Criteria
Controlled trials, group allocation by randomisation, minimisation or similar
Reported in peer-reviewed journal available in the British Library.
Groups differ only by class of agent given or drug versus control.
>2 weeks of follow-up.
Any language.
Reports number of patients and mean and standard deviation at both baseline and follow-up of either
systolic or diastolic blood pressure.
Exclusion Criteria
Trials requiring a recent acute cardiovascular event (within 3 months of a stroke, myocardial infarction or
chest pain requiring intervention), to limit confounding by acute causes of increased BP variability that may
be differentially affected by antihypertensive medications.
Trials requiring patients with: active left ventricular failure (symptomatic or ejection fraction <40%), portal
hypertension, severe liver disease, pulmonary hypertension, dialysis dependent renal failure, major life-
limiting disease or disease causing significant functional impairment (excluding stroke more than 3 months
prior to randomisation).
Trials requiring a hypertensive ‘crisis’ at initiation of treatment.
56
variation in mean SBP.7 In this study, I determined the effects of randomised treatment on
group distribution of SBP and its two main component variables as follows:
1. The group distribution of SBP was expressed as the variance (SD2) of the distribution of
measurements taken at the follow-up visit closest to one year, to minimise the effects of
add-on drugs. For each trial, I determined the ratio of the variances (group variance
ratio; G-VR) between the different treatment groups. The 95% confidence interval of VR
was generated from the F-distribution, and then the standard error was estimated from
the logarithm of VR, assuming an approximately normal distribution given the large and
usually equal group sizes.12
2. Mean SBP within individuals was calculated from measurements at all follow-up visits
from 6 months onwards. Measurements taken at earlier follow-up visits were excluded
because of the systematic fall in BP in the early phases of the trials due to initiation of
treatment and dose titration. The effect of randomised treatment on the distribution of
mean BP was expressed as the ratio of the variances of the distributions in the different
treatment groups (mean variance ratio; M-VR). The confidence interval of I-VR was
calculated as for G-VR.
3. Within-individual visit-to-visit variability in BP was also calculated from measurements at
all follow-up visits from 6 months onwards. The effect of randomised treatment on within-
individual visit-to-visit variability in BP was calculated using the square of the mean SD-
BP for each treatment group, which was taken as the average within-individual variance
and compared between treatment groups as the natural logarithm of the ratio of the
within-individual variances (individual variance ratio; I-VR). The confidence interval of I-
VR was calculated as for G-VR.
Since the majority of trials randomised patients to an initial drug class but added
other drugs of different classes during later follow-up if initial control of BP was not optimal,
I-VR and M-VR were also determined for follow-up visits from 6-24 months only, in order to
57
reduce contamination by effects of other drug-classes. All analyses were done by
randomized treatment allocation on an intention-to-treat basis. The associations across all
trials between G-VR, I-VR and M-VR were explored by univariate correlation and by
multiple linear regression weighted by the size of the trial.
3.3.3 Meta-analyses by drug-class
Eight main drug-classes were defined as: placebo; dihydropyridine calcium channel
blockers (CCB); non-dihydropyridine calcium channel blockers (CCBND); thiazide and
thiazide-like (i.e. indapamide, xipamide and chlorthalidone) diuretics (Diuretic); angiotensin
converting enzyme inhibitors (ACE); beta-blockers (BB); angiotensin receptor blockers
(ARB); alpha-1 antagonists (AA).
I used random-effects meta-analysis (weighted by the inverse variance of G-VR) to
obtain pooled estimates of effects of drug-class on G-VR, I-VR, and M-VR SBP and DBP.
Analyses were done based on parameters derived from follow-up visits from 6-24 months
and from 6 months until the end of the trial. Sensitivity analyses were also done excluding
all measurements taken at follow-up visits after a major vascular event.
3.3.4 Expanded meta-analysis of drug-class effects on group BP variability
Having measured drug-class effects on M-VR and I-VR in the trials in which it was
available, and determined the degree to which G-VR is determined by these two measures
and therefore represents a global measure of consistency of blood pressure control, I
further explored drug-class effects by combining the unpublished data from the newly
available trials with the data from my previous systematic review.
Effects of treatment on variation in group BP were also quantified as G-VR at the
follow-up visit closest to one year and also as the difference in the percentage change in
coefficient of variation (SD/mean) from baseline. Pooled estimates and confidence intervals
of the difference between treatment groups in change in CV were obtained by bootstrap
methods.6 Parallel-group and crossover-design trials were analysed together.
58
To identify determinants of differences between antihypertensive drug classes on
consistency of control of SBP, a number of stratified meta-analyses of G-VR were
performed. Firstly, to assess the effect of duration of treatment, and therefore the impact of
add-on drugs, meta-analyses of G-VR and the risk of cardiovascular events were
performed for each year after randomisation, where this information was available.
Secondly, as drug half-life has been postulated as a cause of drug-class differences, meta-
analyses of G-VR were performed for studies including comparisons between each class
with drugs from other classes with shorter half lives or drugs from other classes with longer
half lives. Thirdly, meta-analyses of G-VR were performed stratified by age (<55, 55-65,
>65 years), baseline SBP (<140, 140-160, >160) or comorbidities.
All analyses were performed in SPSS 20.0 or Microsoft Excel 2007.
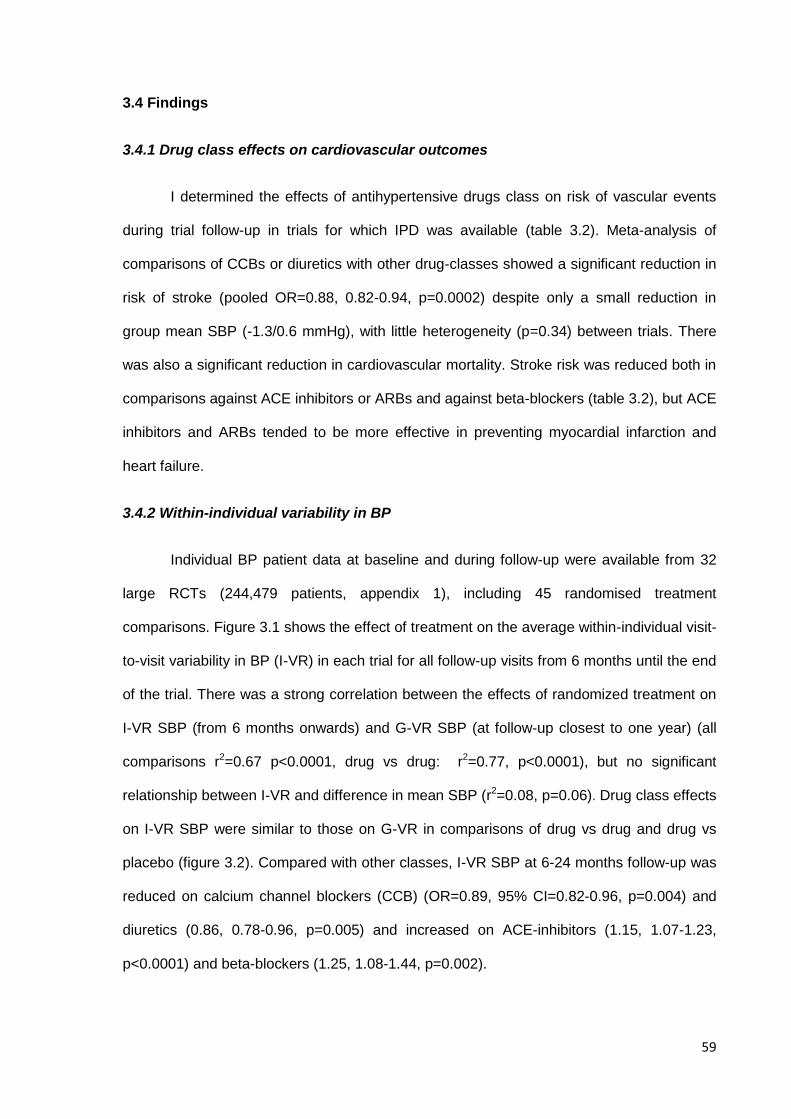
59
3.4 Findings
3.4.1 Drug class effects on cardiovascular outcomes
I determined the effects of antihypertensive drugs class on risk of vascular events
during trial follow-up in trials for which IPD was available (table 3.2). Meta-analysis of
comparisons of CCBs or diuretics with other drug-classes showed a significant reduction in
risk of stroke (pooled OR=0.88, 0.82-0.94, p=0.0002) despite only a small reduction in
group mean SBP (-1.3/0.6 mmHg), with little heterogeneity (p=0.34) between trials. There
was also a significant reduction in cardiovascular mortality. Stroke risk was reduced both in
comparisons against ACE inhibitors or ARBs and against beta-blockers (table 3.2), but ACE
inhibitors and ARBs tended to be more effective in preventing myocardial infarction and
heart failure.
3.4.2 Within-individual variability in BP
Individual BP patient data at baseline and during follow-up were available from 32
large RCTs (244,479 patients, appendix 1), including 45 randomised treatment
comparisons. Figure 3.1 shows the effect of treatment on the average within-individual visit-
to-visit variability in BP (I-VR) in each trial for all follow-up visits from 6 months until the end
of the trial. There was a strong correlation between the effects of randomized treatment on
I-VR SBP (from 6 months onwards) and G-VR SBP (at follow-up closest to one year) (all
comparisons r2=0.67 p<0.0001, drug vs drug: r2=0.77, p<0.0001), but no significant
relationship between I-VR and difference in mean SBP (r2=0.08, p=0.06). Drug class effects
on I-VR SBP were similar to those on G-VR in comparisons of drug vs drug and drug vs
placebo (figure 3.2). Compared with other classes, I-VR SBP at 6-24 months follow-up was
reduced on calcium channel blockers (CCB) (OR=0.89, 95% CI=0.82-0.96, p=0.004) and
diuretics (0.86, 0.78-0.96, p=0.005) and increased on ACE-inhibitors (1.15, 1.07-1.23,
p<0.0001) and beta-blockers (1.25, 1.08-1.44, p=0.002).
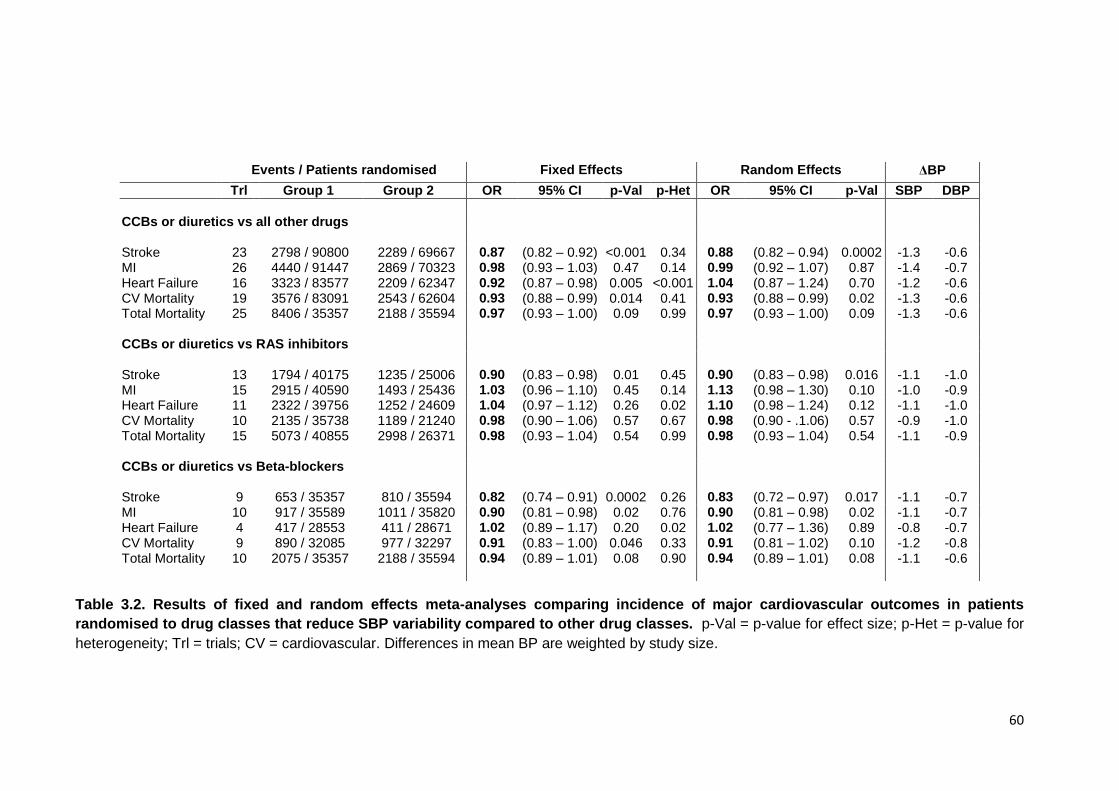
60
Table 3.2. Results of fixed and random effects meta-analyses comparing incidence of major cardiovascular outcomes in patients
randomised to drug classes that reduce SBP variability compared to other drug classes. p-Val = p-value for effect size; p-Het = p-value for
heterogeneity; Trl = trials; CV = cardiovascular. Differences in mean BP are weighted by study size.
Events / Patients randomised Fixed Effects Random Effects ΔBP
Trl Group 1 Group 2 OR 95% CI p-Val p-Het OR 95% CI p-Val SBP DBP
CCBs or diuretics vs all other drugs Stroke 23 2798 / 90800 2289 / 69667 0.87 (0.82 – 0.92) <0.001 0.34 0.88 (0.82 – 0.94) 0.0002 -1.3 -0.6 MI 26 4440 / 91447 2869 / 70323 0.98 (0.93 – 1.03) 0.47 0.14 0.99 (0.92 – 1.07) 0.87 -1.4 -0.7 Heart Failure 16 3323 / 83577 2209 / 62347 0.92 (0.87 – 0.98) 0.005 <0.001 1.04 (0.87 – 1.24) 0.70 -1.2 -0.6 CV Mortality 19 3576 / 83091 2543 / 62604 0.93 (0.88 – 0.99) 0.014 0.41 0.93 (0.88 – 0.99) 0.02 -1.3 -0.6 Total Mortality 25 8406 / 35357 2188 / 35594 0.97 (0.93 – 1.00) 0.09 0.99 0.97 (0.93 – 1.00) 0.09 -1.3 -0.6 CCBs or diuretics vs RAS inhibitors Stroke 13 1794 / 40175 1235 / 25006 0.90 (0.83 – 0.98) 0.01 0.45 0.90 (0.83 – 0.98) 0.016 -1.1 -1.0 MI 15 2915 / 40590 1493 / 25436 1.03 (0.96 – 1.10) 0.45 0.14 1.13 (0.98 – 1.30) 0.10 -1.0 -0.9 Heart Failure 11 2322 / 39756 1252 / 24609 1.04 (0.97 – 1.12) 0.26 0.02 1.10 (0.98 – 1.24) 0.12 -1.1 -1.0 CV Mortality 10 2135 / 35738 1189 / 21240 0.98 (0.90 – 1.06) 0.57 0.67 0.98 (0.90 - .1.06) 0.57 -0.9 -1.0 Total Mortality 15 5073 / 40855 2998 / 26371 0.98 (0.93 – 1.04) 0.54 0.99 0.98 (0.93 – 1.04) 0.54 -1.1 -0.9 CCBs or diuretics vs Beta-blockers Stroke 9 653 / 35357 810 / 35594 0.82 (0.74 – 0.91) 0.0002 0.26 0.83 (0.72 – 0.97) 0.017 -1.1 -0.7 MI 10 917 / 35589 1011 / 35820 0.90 (0.81 – 0.98) 0.02 0.76 0.90 (0.81 – 0.98) 0.02 -1.1 -0.7 Heart Failure 4 417 / 28553 411 / 28671 1.02 (0.89 – 1.17) 0.20 0.02 1.02 (0.77 – 1.36) 0.89 -0.8 -0.7 CV Mortality 9 890 / 32085 977 / 32297 0.91 (0.83 – 1.00) 0.046 0.33 0.91 (0.81 – 1.02) 0.10 -1.2 -0.8 Total Mortality 10 2075 / 35357 2188 / 35594 0.94 (0.89 – 1.01) 0.08 0.90 0.94 (0.89 – 1.01) 0.08 -1.1 -0.6
61
Figure 3.1. Effect of treatment allocation on within-individual variability of SBP (I-VR) and inter-individual variation in group mean SBP
(M-VR) pooled by random-effects meta-analysis. Analyses are based on measurements from 6 to 24 months.
n I-VR p-sig p-het M-VR p-sig p-het
Drug class vs all other drug classes
CCB 19 0.89 (0.82-0.96) 0.004 <0.001 0.83 (0.77-0.89) <0.001 <0.001
DIU 8 0.86 (0.76-0.97) 0.014 <0.001 1.01 (0.86-1.18) 0.94 <0.001
ARB 1 1.02 (0.88-1.19) 0.38 1.12 (0.96-1.31) 0.073
ACE 13 1.15 (1.07-1.23) <0.001 <0.001 1.16 (1.02-1.33) 0.026 <0.001
BB 7 1.25 (1.08-1.44) 0.002 <0.001 1.17 (1.03-1.32) 0.017 <0.001
Drug class vs placebo
CCB 3 0.89 (0.80-0.98) 0.022 0.26 0.70 (0.59-0.83) <0.0001 0.039
DIU 3 0.91 (0.73-1.13) 0.39 <0.001 0.82 (0.69-0.99) 0.037 <0.001
ACE 8 0.98 (0.92-1.03) 0.43 0.11 0.94 (0.89-1.00) 0.037 0.088
BB 4 1.13 (1.04-1.22) 0.005 0.087 0.91 (0.79-1.05) 0.21 <0.001
Drug class vs drug class
CCB vs BB 4 0.81 (0.66-1.00) 0.048 <0.001 0.77 (0.69-0.85) <0.001 <0.001
CCB vs ACE 8 0.84 (0.74-0.96) 0.01 <0.001 0.78 (0.65-0.93) 0.01 <0.001
CCB vs ARB 1 0.98 (0.84-1.14) 0.38 0.89 (0.76-1.04) 0.07
CCB vs DIU 4 0.99 (0.96-1.03) 0.65 0.53 0.95 (0.83-1.08) 0.40 <0.001
DIU vs BB 2 0.69 (0.65-0.73) <0.001 0.95 1.06 (1.01-1.12) 0.03 0.99
DIU vs ACE 2 0.85 (0.72-1.00) 0.049 <0.001 0.87 (0.62-1.22) 0.41 <0.001
ACE vs BB 1 1.06 (0.86-1.30) 0.29 0.89 (0.73-1.10) 0.14
1.5 1.5 1 0.5
Variance ratio (95% CI)
1 1.5 0.5
Variance ratio (95% CI)
62
3.4.3 Between-individual variability in mean SBP
Figure 3.1 also shows the effect of treatment on the average between-individual
variation in mean SBP (M-VR) in each trial. There was also a strong correlation between
the effects of randomized treatment on M-VR SBP and G-VR SBP (r2=0.80 p<0.0001, drug
vs drug: r2=0.78, p<0.0001), but no significant relationship between M-VR and difference in
mean SBP (r2=0.02, p=0.34). M-VR was reduced by CCBs (OR=0.83, 0.77-0.89, p<0.001)
and increased on ACE-inhibitors (1.16, 1.02-1.33, p=0.03) and beta-blockers (1.17, 1.03-
1.32, p=0.02), but was not reduced by diuretics.
Effects of randomised treatment on I-VR and M-VR were correlated (r2=0.41
p<0.0001, drug vs drug: r2=0.50, p<0.0001), reflecting the similarity in several drug-class
effects. However, the effects of treatment were independently associated with G-VR in a
combined model across all trials (I-VR - regression coefficients: I-VR = 0.411, p=0.004; M-
VR =0.68, p<0.0001), the two variables accounting for almost of all of the heterogeneity in
effect of randomised treatment on G-VR SBP (combined model: r2=0.90, p<0.0001), with
the small residual component being accounted for by between-individual variance in within-
individual visit-to-visit variability.
3.4.4 Expanded meta-analysis of effects on group BP variability
Addition of data on G-VR in BP from 32 new trials increased inclusion in my
systematic review from 32.1% to 63% of all patients randomised in eligible trials (Appendix
4). Meta-analysis of the effect of treatment showed clear drug-class effects on G-VR SBP
(figure 3.2) and G-VR DBP (figure 3.3). Compared with other drugs, G-VR SBP was
reduced by dihydropyridine or non-dihydropyridine CCBs and by diuretics but increased by
beta-blockers, ACEI and ARBs. Equivalent analyses of group CV SBP rather than group
SD SBP showed similar class effects (figure 3.2 and 3.3). The effects were similar in
parallel group trials and cross-over trials, but the magnitude of the effect was greater in
cross-over studies (figure 3.4), probably due to the lack of add-on medications.
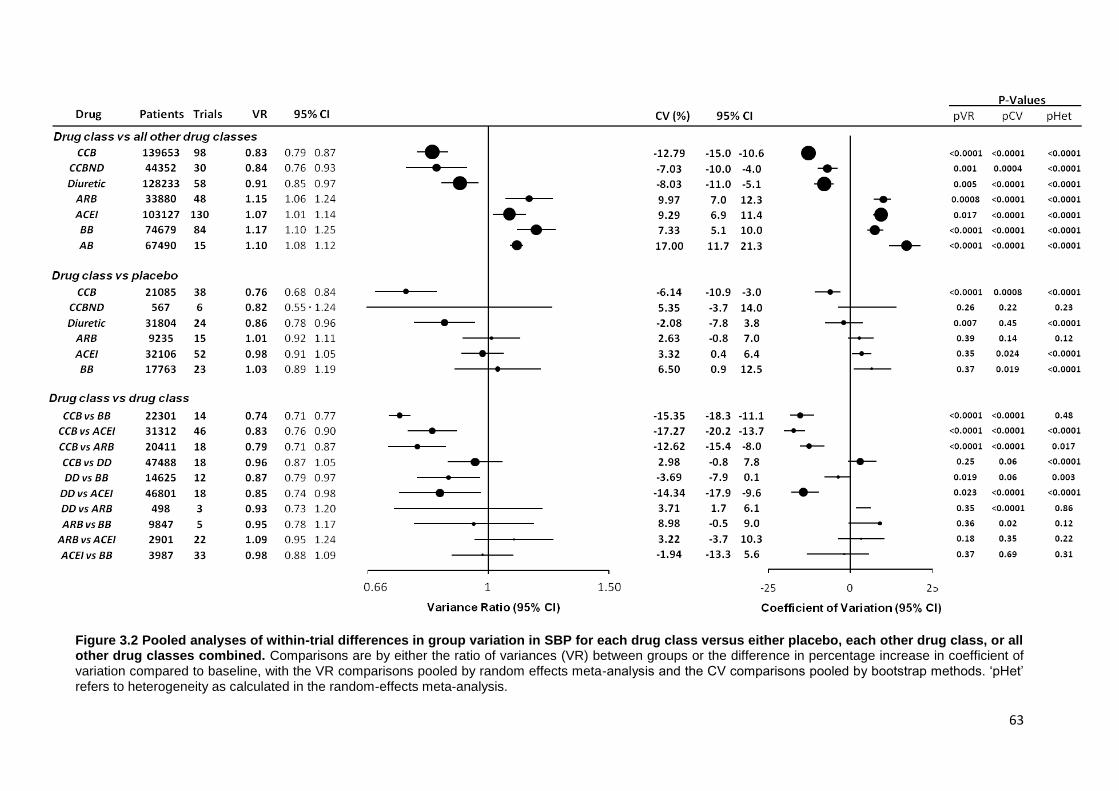
63
Figure 3.2 Pooled analyses of within-trial differences in group variation in SBP for each drug class versus either placebo, each other drug class, or all other drug classes combined. Comparisons are by either the ratio of variances (VR) between groups or the difference in percentage increase in coefficient of variation compared to baseline, with the VR comparisons pooled by random effects meta-analysis and the CV comparisons pooled by bootstrap methods. ‘pHet’ refers to heterogeneity as calculated in the random-effects meta-analysis.
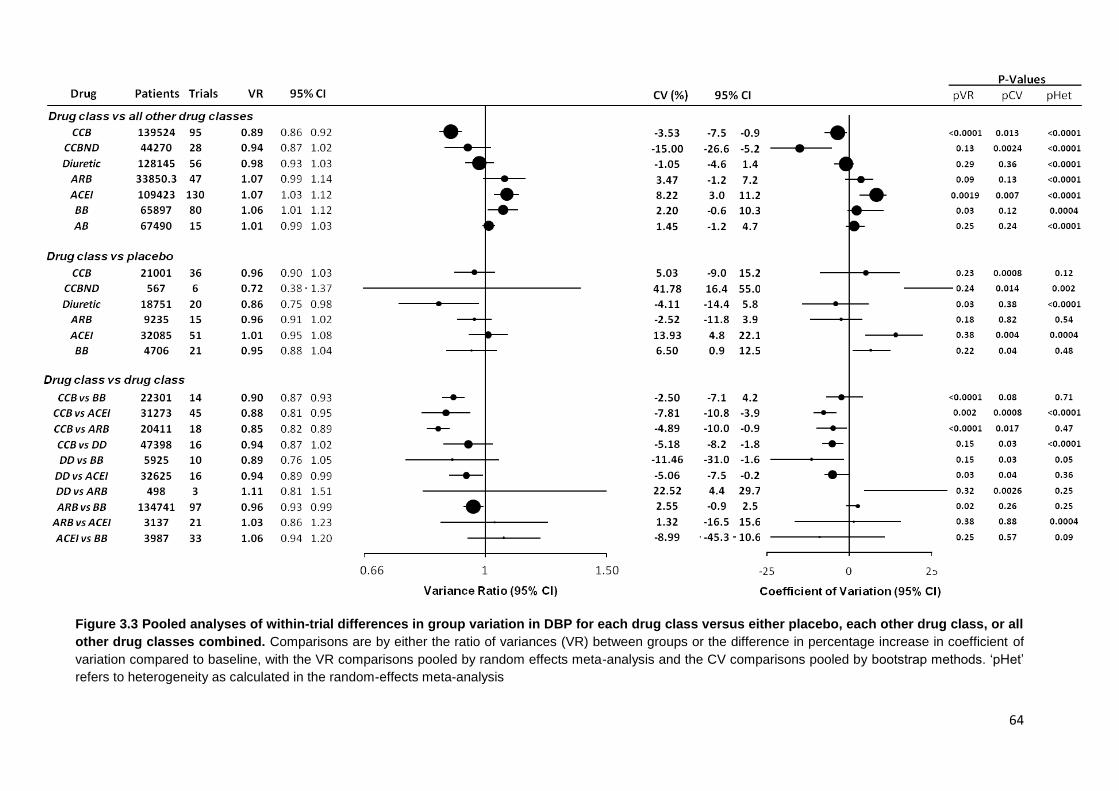
64
Figure 3.3 Pooled analyses of within-trial differences in group variation in DBP for each drug class versus either placebo, each other drug class, or all
other drug classes combined. Comparisons are by either the ratio of variances (VR) between groups or the difference in percentage increase in coefficient of
variation compared to baseline, with the VR comparisons pooled by random effects meta-analysis and the CV comparisons pooled by bootstrap methods. ‘pHet’
refers to heterogeneity as calculated in the random-effects meta-analysis
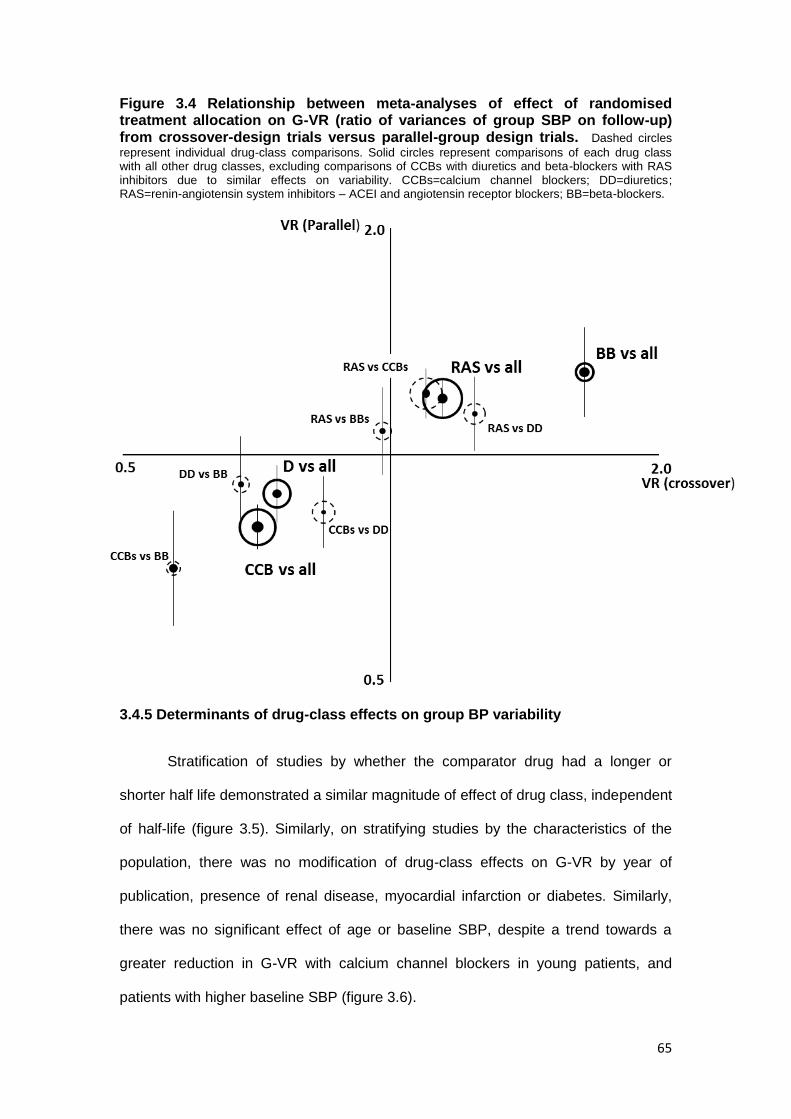
65
Figure 3.4 Relationship between meta-analyses of effect of randomised treatment allocation on G-VR (ratio of variances of group SBP on follow-up) from crossover-design trials versus parallel-group design trials. Dashed circles
represent individual drug-class comparisons. Solid circles represent comparisons of each drug class with all other drug classes, excluding comparisons of CCBs with diuretics and beta-blockers with RAS inhibitors due to similar effects on variability. CCBs=calcium channel blockers; DD=diuretics; RAS=renin-angiotensin system inhibitors – ACEI and angiotensin receptor blockers; BB=beta-blockers.
3.4.5 Determinants of drug-class effects on group BP variability
Stratification of studies by whether the comparator drug had a longer or
shorter half life demonstrated a similar magnitude of effect of drug class, independent
of half-life (figure 3.5). Similarly, on stratifying studies by the characteristics of the
population, there was no modification of drug-class effects on G-VR by year of
publication, presence of renal disease, myocardial infarction or diabetes. Similarly,
there was no significant effect of age or baseline SBP, despite a trend towards a
greater reduction in G-VR with calcium channel blockers in young patients, and
patients with higher baseline SBP (figure 3.6).
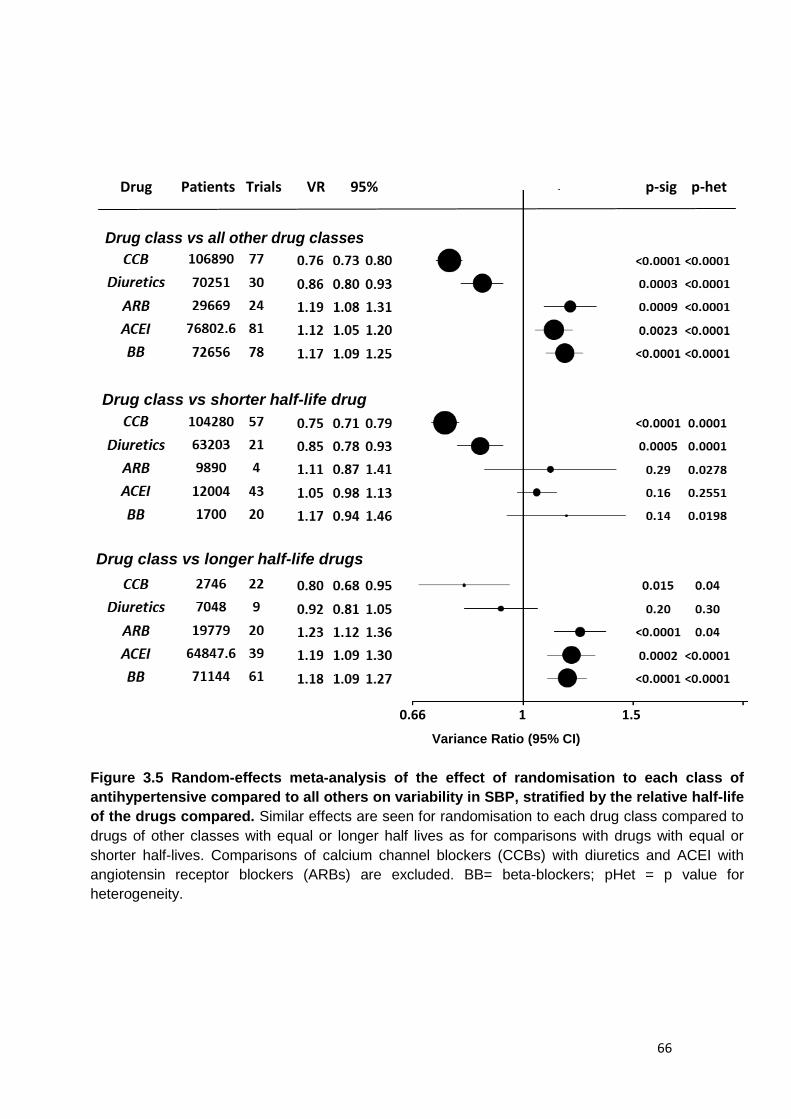
66
Drug class vs shorter half-life drugs
Drug Patients Trials VR 95% CI
Drug Patients Trials VR 95% p-sig p-het
Drug class vs all other drug classes
Drug class vs longer half-life drugs
0.66 1 1.5
Variance Ratio (95% CI)
Drug class vs shorter half-life drug
Figure 3.5 Random-effects meta-analysis of the effect of randomisation to each class of
antihypertensive compared to all others on variability in SBP, stratified by the relative half-life
of the drugs compared. Similar effects are seen for randomisation to each drug class compared to
drugs of other classes with equal or longer half lives as for comparisons with drugs with equal or
shorter half-lives. Comparisons of calcium channel blockers (CCBs) with diuretics and ACEI with
angiotensin receptor blockers (ARBs) are excluded. BB= beta-blockers; pHet = p value for
heterogeneity.
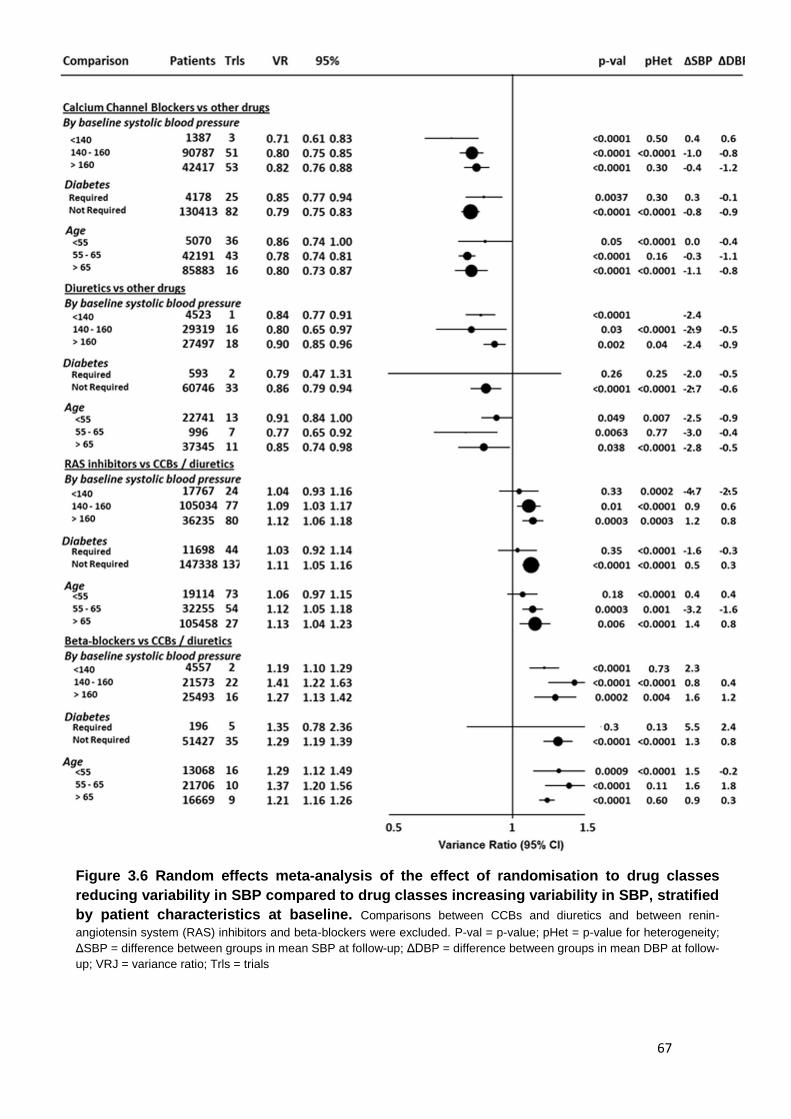
67
Figure 3.6 Random effects meta-analysis of the effect of randomisation to drug classes
reducing variability in SBP compared to drug classes increasing variability in SBP, stratified
by patient characteristics at baseline. Comparisons between CCBs and diuretics and between renin-
angiotensin system (RAS) inhibitors and beta-blockers were excluded. P-val = p-value; pHet = p-value for heterogeneity;
ΔSBP = difference between groups in mean SBP at follow-up; ΔDBP = difference between groups in mean DBP at follow-
up; VRJ = variance ratio; Trls = trials
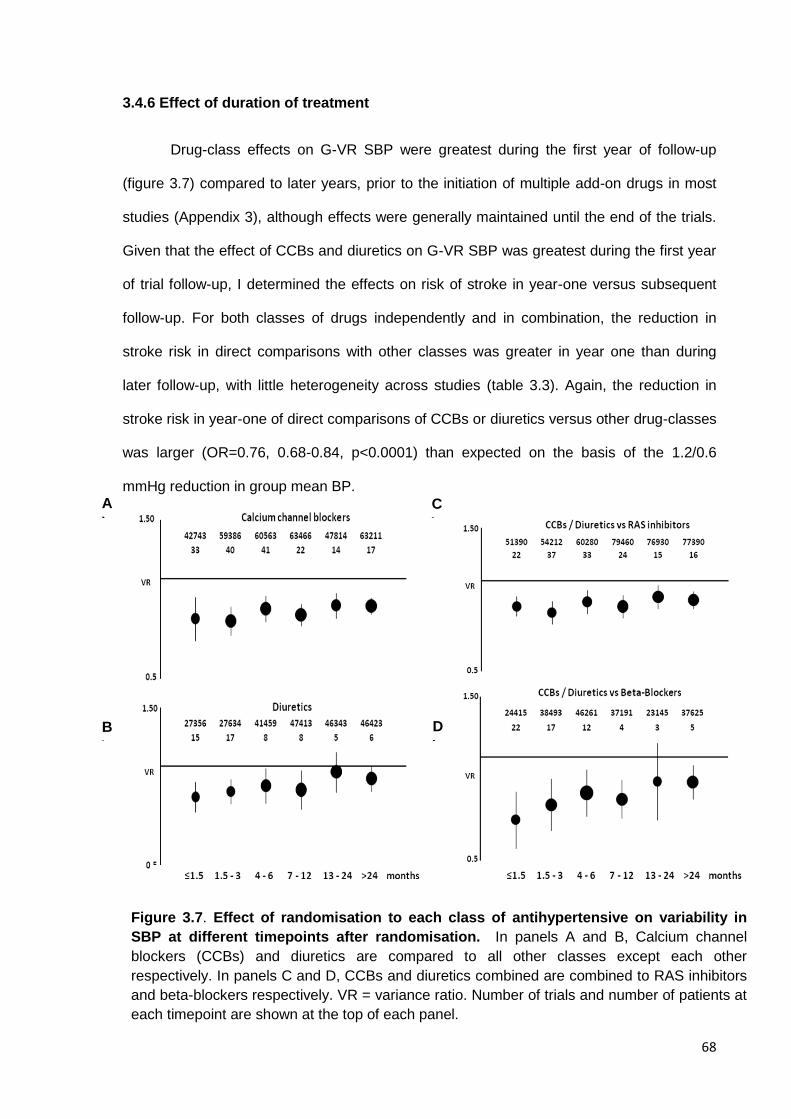
68
3.4.6 Effect of duration of treatment
Drug-class effects on G-VR SBP were greatest during the first year of follow-up
(figure 3.7) compared to later years, prior to the initiation of multiple add-on drugs in most
studies (Appendix 3), although effects were generally maintained until the end of the trials.
Given that the effect of CCBs and diuretics on G-VR SBP was greatest during the first year
of trial follow-up, I determined the effects on risk of stroke in year-one versus subsequent
follow-up. For both classes of drugs independently and in combination, the reduction in
stroke risk in direct comparisons with other classes was greater in year one than during
later follow-up, with little heterogeneity across studies (table 3.3). Again, the reduction in
stroke risk in year-one of direct comparisons of CCBs or diuretics versus other drug-classes
was larger (OR=0.76, 0.68-0.84, p<0.0001) than expected on the basis of the 1.2/0.6
mmHg reduction in group mean BP.
D
)
A
)
B
)
C
)
Figure 3.7. Effect of randomisation to each class of antihypertensive on variability in
SBP at different timepoints after randomisation. In panels A and B, Calcium channel
blockers (CCBs) and diuretics are compared to all other classes except each other
respectively. In panels C and D, CCBs and diuretics combined are combined to RAS inhibitors
and beta-blockers respectively. VR = variance ratio. Number of trials and number of patients at
each timepoint are shown at the top of each panel.
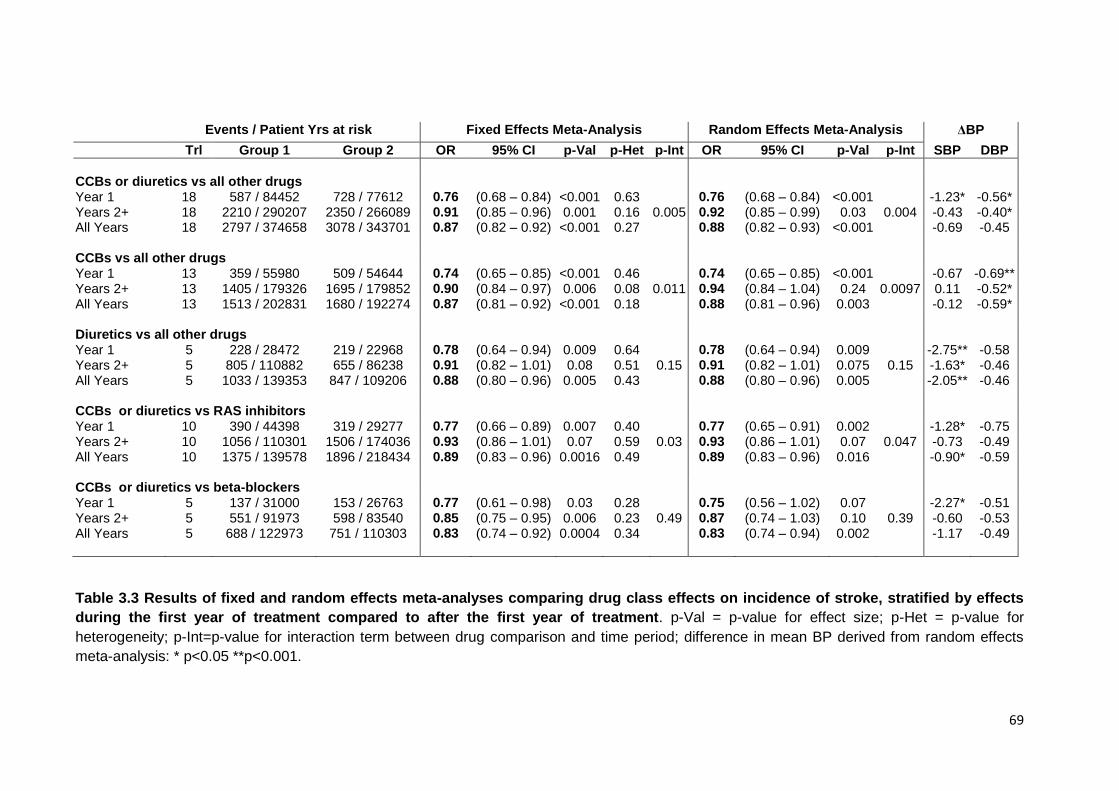
69
Events / Patient Yrs at risk Fixed Effects Meta-Analysis Random Effects Meta-Analysis ΔBP
Trl Group 1 Group 2 OR 95% CI p-Val p-Het p-Int OR 95% CI p-Val p-Int SBP DBP
CCBs or diuretics vs all other drugs Year 1 18 587 / 84452 728 / 77612 0.76 (0.68 – 0.84) <0.001 0.63 0.76 (0.68 – 0.84) <0.001 -1.23* -0.56* Years 2+ 18 2210 / 290207 2350 / 266089 0.91 (0.85 – 0.96) 0.001 0.16 0.005 0.92 (0.85 – 0.99) 0.03 0.004 -0.43 -0.40* All Years 18 2797 / 374658 3078 / 343701 0.87 (0.82 – 0.92) <0.001 0.27 0.88 (0.82 – 0.93) <0.001 -0.69 -0.45 CCBs vs all other drugs Year 1 13 359 / 55980 509 / 54644 0.74 (0.65 – 0.85) <0.001 0.46 0.74 (0.65 – 0.85) <0.001 -0.67 -0.69** Years 2+ 13 1405 / 179326 1695 / 179852 0.90 (0.84 – 0.97) 0.006 0.08 0.011 0.94 (0.84 – 1.04) 0.24 0.0097 0.11 -0.52* All Years 13 1513 / 202831 1680 / 192274 0.87 (0.81 – 0.92) <0.001 0.18 0.88 (0.81 – 0.96) 0.003 -0.12 -0.59* Diuretics vs all other drugs Year 1 5 228 / 28472 219 / 22968 0.78 (0.64 – 0.94) 0.009 0.64 0.78 (0.64 – 0.94) 0.009 -2.75** -0.58 Years 2+ 5 805 / 110882 655 / 86238 0.91 (0.82 – 1.01) 0.08 0.51 0.15 0.91 (0.82 – 1.01) 0.075 0.15 -1.63* -0.46 All Years 5 1033 / 139353 847 / 109206 0.88 (0.80 – 0.96) 0.005 0.43 0.88 (0.80 – 0.96) 0.005 -2.05** -0.46 CCBs or diuretics vs RAS inhibitors Year 1 10 390 / 44398 319 / 29277 0.77 (0.66 – 0.89) 0.007 0.40 0.77 (0.65 – 0.91) 0.002 -1.28* -0.75 Years 2+ 10 1056 / 110301 1506 / 174036 0.93 (0.86 – 1.01) 0.07 0.59 0.03 0.93 (0.86 – 1.01) 0.07 0.047 -0.73 -0.49 All Years 10 1375 / 139578 1896 / 218434 0.89 (0.83 – 0.96) 0.0016 0.49 0.89 (0.83 – 0.96) 0.016 -0.90* -0.59 CCBs or diuretics vs beta-blockers Year 1 5 137 / 31000 153 / 26763 0.77 (0.61 – 0.98) 0.03 0.28 0.75 (0.56 – 1.02) 0.07 -2.27* -0.51 Years 2+ 5 551 / 91973 598 / 83540 0.85 (0.75 – 0.95) 0.006 0.23 0.49 0.87 (0.74 – 1.03) 0.10 0.39 -0.60 -0.53 All Years 5 688 / 122973 751 / 110303 0.83 (0.74 – 0.92) 0.0004 0.34 0.83 (0.74 – 0.94) 0.002 -1.17 -0.49
Table 3.3 Results of fixed and random effects meta-analyses comparing drug class effects on incidence of stroke, stratified by effects
during the first year of treatment compared to after the first year of treatment. p-Val = p-value for effect size; p-Het = p-value for
heterogeneity; p-Int=p-value for interaction term between drug comparison and time period; difference in mean BP derived from random effects
meta-analysis: * p<0.05 **p<0.001.
70
3.5 Discussion
If it is worth lowering BP, it is presumably worth doing it consistently, but there have been few
studies of consistency of control of BP on antihypertensive drugs.13 Indeed, until recently no trial had
reported within-individual visit-to-visit variability in BP during follow-up by allocated treatment group.
In Chapter 2, I showed that increased visit-to-visit variability in SBP is a powerful risk factor for stroke.
Furthermore, in previous studies Prof Rothwell demonstrated that residual variability in SBP on
treatment has a poor prognosis despite good control of mean SBP,5 and I demonstrated that effects
of antihypertensive drugs on risk of stroke appeared to be due partly to effects on variability in SBP.6
I have now substantially extended these previous observations of drug-class effects on
variability in BP and risk of stroke. First, by adding new data on G-VR from 32 large trials (139,502
participants), I have increased inclusion from 32% to 64% of all patients randomised in eligible trials
and thereby reduced any inclusion bias and increased statistical power. I have then shown that drug-
class effects on G-VR were independent of drug half-life, indication for treatment, and baseline
clinical characteristics.
Second, building on previous observations of drug-class effects on I-VR in two trials, I have
confirmed that drug-classes differ in effects on consistency of control of BP within individuals (I-VR)
using IPD from 32 trials (244,479 patients), and showed that they also differ in the consistency of
control of mean BP (M-VR), resulting together in substantial differences between classes for group
variability in SBP (G-VR).
Finally, I showed that drug-class effects on G-VR were greatest in short-term cross-over trials
and that effects on consistency of control of BP and on stroke risk decreased in the same way during
follow-up in larger parallel group trials, as was found previously in the VALUE study of CCBs versus
ARBs, although the cause of this was not specifically addressed.14 Indeed, drug-class effects on
consistency of control of BP in large pragmatic parallel group design trials would be expected to be
rapidly diluted in this way by the substantial protocol-driven use of add-on drugs of different classes
during early follow-up. For example, in both INVEST15 and ASCOT-BPLA,16 an ACE inhibitor was
added in the CCB arms and a diuretic was added to the beta-blocker arms. The frequent
measurement of the BP-response to treatment during early follow-up and the low-threshold for
71
starting add-on drugs if any measurement is above target in many large trials does not necessarily
reflect how hypertension is managed in routine clinical practice. Although it is possible that some of
the observed diminution of the drug-class effects on consistency of control with increasing follow-up
was due in part to physiological adaptation, the class effects in cross-over trials and in the first year of
follow-up in the large parallel group trials are likely to provide the best estimates of effects of
monotherapy for hypertension in routine practice. Nevertheless, drug-class effects on consistency of
control of BP were still present at the end of trials and class-effects on stroke risk were present in
analyses including all follow-up.
Although the most important barriers to effective control of BP are still the widespread under-
diagnosis and under-treatment of hypertension,17, 18 these findings have significant clinical
implications. First, in relation to the choice of first-line BP-lowering drugs, I have shown that the
consistency of control of BP is better, on average, on CCBs and diuretics than on ACE inhibitors,
ARBs, or beta-blockers, and that this is associated with a reduced risk of stroke. CCBs and diuretics
were also associated with a lower risk of cardiovascular death, although this effect was mainly driven
by comparison with beta-blockers. ACE inhibitors and ARBs were less effective than CCBs and
diuretics in preventing stroke, but were at least as good in preventing myocardial infarction and heart
failure. It is likely therefore that the optimal first-line agent in treatment of hypertension will depend on
the relative risk of stroke versus coronary events in the particular population (the relative risk varies
several fold across the world)19 or individual. Second, these findings show that the development of
new BP-lowering drugs or new formulations should target consistency of control of BP as well as the
reduction in group mean BP. Third, combination of drugs in routine practice and the formulation of
fixed-dose combinations should also maximise consistency of control of BP. Fourth, contrary to some
recent recommendations,20 regular follow-up of patients on treatment for hypertension may be
justified in order to identify and treat inconsistent control of BP. Finally, reporting of future randomised
trials should include measures of within and between-individual consistency of control of BP as well
as data on group mean BP.
Previous analyses and guidelines on choice of BP-lowering drugs have highlighted possible
advantages of CCBs in preventing stroke, but have generally concluded that all classes of BP-
72
lowering drugs are similarly effective.3, 21 However, most previous meta-analyses of trials comparing
different drug-classes only determined effects of each drug-class versus all others combined (i.e.
included trials randomising to CCBs versus diuretics). By grouping drug-classes in relation to their
effects on consistency of control of BP, I have identified differences in effects on risk of stroke. For
diuretics, the greater reduction in stroke risk than with other classes will also have been partly
accounted for by the greater reduction in group mean BP, but this was not the case for CCBs.
Moreover, if class effects were explained by effects on group mean BP then they would also be
evident for heart failure and MI. Previous analyses have also not considered the possibility that drug-
class effects might decrease over time due to substantial use of add-on drugs of different classes,
obscuring specific drug class effects in previous meta-analyses.
These analyses do nevertheless have shortcomings. First, meta-analysis and interpretation of
within-trial comparisons of variability in BP is not straightforward.6 However, the previous finding that
group SD SBP at follow-up visits was attributable in roughly 50:50 proportion to within-individual visit-
to-visit variability (I-VR) and to between-individual variation in mean SBP (M-VR)6 has been borne
out. Second, the extent to which BP measured on clinic visits in clinical trials reflects overall day-to-
day control is uncertain. However, the same limitation applies to both mean BP and to variability, and
in chapter 2, within-individual variability in BP was a risk factor for stroke whether measured over a
few days at home, or over several clinic visits. Moreover, the same drug-class effects on visit-to-visit
variability in BP in the ASCOT-BPLA trial were also present for short-term variability on repeated
measurements during single clinic visits and in the large substudy of 24-hour ABPM.7 Third, more
research is required to understand the drug-class effects on M-VR. Also, by using IPD from many
trials I have been able to exclude potential artefacts, such as secondary changes in patterns of BP
following non-fatal events during early follow-up. Furthermore, by stratifying the meta-analysis of
drug-class effects on G-VR, I have demonstrated that effects are unlikely to significantly differ by
disease status or age of the population. Fourth, data from some large trials are still unavailable for the
meta-analysis of drug-class effects on G-VR. However, these are mainly trials of ACE inhibitors or
ARBs and inclusion of large trials of CCBs and diuretics is more complete. Finally, although the effect
of drug-class on consistency of control of BP was again correlated with effectiveness in prevention of
73
stroke, this is not proof of a causal link. However, if reducing mean BP reduces risk of stroke then it is
likely that reducing BP consistently will also be beneficial.
Chapters 2 and 3 present post hoc analyses of observational cohorts and randomised
controlled trials rather than prospective tests of the hypothesis that BP variability is related to the risk
of stroke and that its reduction by some antihypertensive drug classes results in a reduction in the
subsequent risk of stroke. This hypothesis would ideally be tested in new randomised trials but these
would require very large samples with >10,000 patients with prolonged follow-up. Even if these can
be carried out, such studies would primarily test the efficacy of different antihypertensive classes in
preventing cardiovascular events, with BP variability measured as a secondary measure, as no
intervention specifically reduces BP variability without other physiological effects. However, previous
studies have already compared the relative efficacy of antihypertensives in a wide-range of
populations, albeit without reference to BP varaibility. Therefore, given the large number of patients
included, the wide variety of studies and the fact that no study recognised BP variability as a
potentially important outcome at the beginning, these analyses are as reliable as can reasonably be
achieved to base management decisions upon, and the best evidence available in the absence of
new prospective studies. Therefore, in patients with increased BP variability or an increased risk of
stroke, and where there is no compelling indication for an alternative medication, then an
antihypertensive regimen containing a calcium channel blocker or a diuretic should be preferred to
reduce stroke risk.
In conclusion, antihypertensive drug-classes differ in consistency of control of BP within and
between individuals. In prevention of stroke in people with hypertension, we should aim for
stabilisation of BP as well as lowering of mean BP.

74
References
1. Lewington S, Clarke R, Qizilbash N, Peto R, Collins R. Age-specific relevance of usual blood pressure to
vascular mortality: a meta-analysis of individual data for one million adults in 61 prospective studies. Lancet 2002;360:1903-1913.
2. Collins R, Peto R, MacMahon S, et al. Blood pressure, stroke, and coronary heart disease. Part 2, Short-term reductions in blood pressure: overview of randomised drug trials in their epidemiological context. Lancet 1990;335:827-838.
3. Law MR, Morris JK, Wald NJ. Use of blood pressure lowering drugs in the prevention of cardiovascular disease: meta-analysis of 147 randomised trials in the context of expectations from prospective epidemiological studies. Bmj 2009;338:b1665-b1665.
4. Rothwell PM. Limitations of the usual blood-pressure hypothesis and importance of variability, instability, and episodic hypertension. Lancet 2010;375:938-948.
5. Rothwell PM, Howard SC, Dolan E, et al. Prognostic significance of visit-to-visit variability, maximum systolic blood pressure, and episodic hypertension. Lancet 2010;375:895-905.
6. Webb AJ, Fischer U, Mehta Z, Rothwell PM. Effects of antihypertensive-drug class on interindividual variation in blood pressure and risk of stroke: a systematic review and meta-analysis. Lancet 2010;375:906-915.
7. Rothwell PM, Howard SC, Dolan E, et al. Effects of beta blockers and calcium-channel blockers on within-individual variability in blood pressure and risk of stroke. Lancet Neurol 2010;9:469-480.
8. Webb AJ, Rothwell PM. Effect of dose and combination of antihypertensives on interindividual blood pressure variability: a systematic review. Stroke 2011;42:2860-2865.
9. Crumley ET, Wiebe N, Cramer K, Klassen TP, Hartling L. Which resources should be used to identify RCT/CCTs for systematic reviews: a systematic review. BMC Med Res Methodol 2005;5:24.
10. Moher D, Liberati A, Tetzlaff J, Altman DG. Preferred reporting items for systematic reviews and meta-analyses: the PRISMA statement. Bmj 2009;339:b2535.
11. Turnbull F. Effects of different blood-pressure-lowering regimens on major cardiovascular events: results of prospectively-designed overviews of randomised trials. Lancet 2003;362:1527-1535.
12. Shaffer J. Caution on the use of variance ratiors: a comment. Rev eDUC rES 1992;62:7. 13. Fischer U, Webb AJ, Howard SC, Rothwell PM. Reporting of consistency of blood pressure control in
randomized controlled trials of antihypertensive drugs: a systematic review of 1372 trial reports. J Hypertens 2012.
14. Julius S, Kjeldsen S, Weber M, et al. Outcomes in hypertensive patients at high cardiovascular risk treated with regimens based on valsartan or amlodipine: the VALUE randomised trial. The Lancet 2004;363:2022-2031.
15. Pepine CJ. A Calcium Antagonist vs a Non-Calcium Antagonist Hypertension Treatment Strategy for Patients With Coronary Artery Disease: The International Verapamil-Trandolapril Study (INVEST): A Randomized Controlled Trial. JAMA: The Journal of the American Medical Association 2003;290:2805-2816.
16. Dahlof B, Sever P, Poulter N, et al. Prevention of cardiovascular events with an antihypertensive regimen of amlodipine adding perindopril as required versus atenolol adding bendroflumethiazide as required, in the Anglo-Scandinavian Cardiac Outcomes Trial-Blood Pressure Lowering Arm (ASCOT-BPLA): a multicentre randomised controlled trial. The Lancet 2005;366:895-906.
17. Appleton SL, Neo C, Hill CL, Douglas KA, Adams RJ. Untreated hypertension: prevalence and patient factors and beliefs associated with under-treatment in a population sample. J Hum Hypertens 2012.
18. De Giusti M, Dito E, Pagliaro B, et al. A survey on blood pressure levels and hypertension control in a sample of the Italian general population. High blood pressure & cardiovascular prevention : the official journal of the Italian Society of Hypertension 2012;19:129-135.
19. Lozano R, Naghavi M, Foreman K, et al. Global and regional mortality from 235 causes of death for 20 age groups in 1990 and 2010: a systematic analysis for the Global Burden of Disease Study 2010. Lancet 2013;380:2095-2128.
20. Keenan K, Hayen A, Neal BC, Irwig L. Long term monitoring in patients receiving treatment to lower blood pressure: analysis of data from placebo controlled randomised controlled trial. Bmj 2009;338:b1492.
21. Psaty BM, Lumley T, Furberg CD, et al. Health Outcomes Associated With Various Antihypertensive Therapies Used as First-Line Agents: A Network Meta-analysis. JAMA: The Journal of the American Medical Association 2003;289:2534-2544.

75
CHAPTER FOUR
Effects of antihypertensive treatment on headache
and blood pressure variability
4.1 Summary 76
4.2 Introduction 77
4.3 Methods 78
4.3.1 Search Strategy 78
4.3.2 Analysis 79
4.4 Findings 79
4.4.1 Data collection 79
4.4.2 Effect of drug class on the incidence of headache versus placebo 80
4.4.3 Effect of drug class on the incidence of headache versus other drugs 81
4.4.4 Effect of drug class on blood pressure variability 82
4.5 Discussion 84
4.6 References 88
76
4.1 Summary
Antihypertensive drugs reduce headache but it is unclear whether there are
differences between drug-classes. Calcium channel blockers (CCBs) decrease variability in
systolic blood pressure (SBP) and stroke risk more than other classes, possibly due to
decreased vascular tone. If so, there might be a correlation between drug class effects on
variability in SBP and on headache. I determined antihypertensive class effects on
variability in SBP and headache during follow-up in a systematic review of randomised
controlled trials. I determined pooled estimates of treatment effect on group variability in BP
and on the odds ratio for headache (OR) by random-effects meta-analysis.
Antihypertensive drugs reduced the incidence of headache compared to placebo
(OR=0.75, 95%CI 0.69-0.82, p<0.0001, 198 comparisons, 43672 patients), but there was
significant heterogeneity between drug classes (p=0.0007) with a greater effect of beta-
blockers compared to placebo (VR=0.49, 0.33-0.68, p<0.0001, 16 trials) or all other drug
classes (OR=0.73, 0.62-0.85, p=0.0002, 49 trials) and a lack of effectiveness of CCBs (vs
placebo-OR=0.95, 0.79-1.15, 65 trials; vs other drugs-OR=1.19, 1.05-1.35, p=0.009, 101
trials). Drug class effects on headache were opposite to effects on variability in SBP (vs
other drugs: CCB-VR=0.81, 0.71-0.85, p<0.0001; beta-blocker VR=1.17, 1.07-1.28,
p<0.0001), but were unrelated to differences in mean SBP.
Antihypertensive drugs reduce headache but the effect differs between classes,
corresponding to their effects on variability in SBP and the risk of stroke. This may partly be
explained by consistent antihypertensive class effects on vascular tone in the peripheral
(variability) and cerebrovascular circulations (headache).
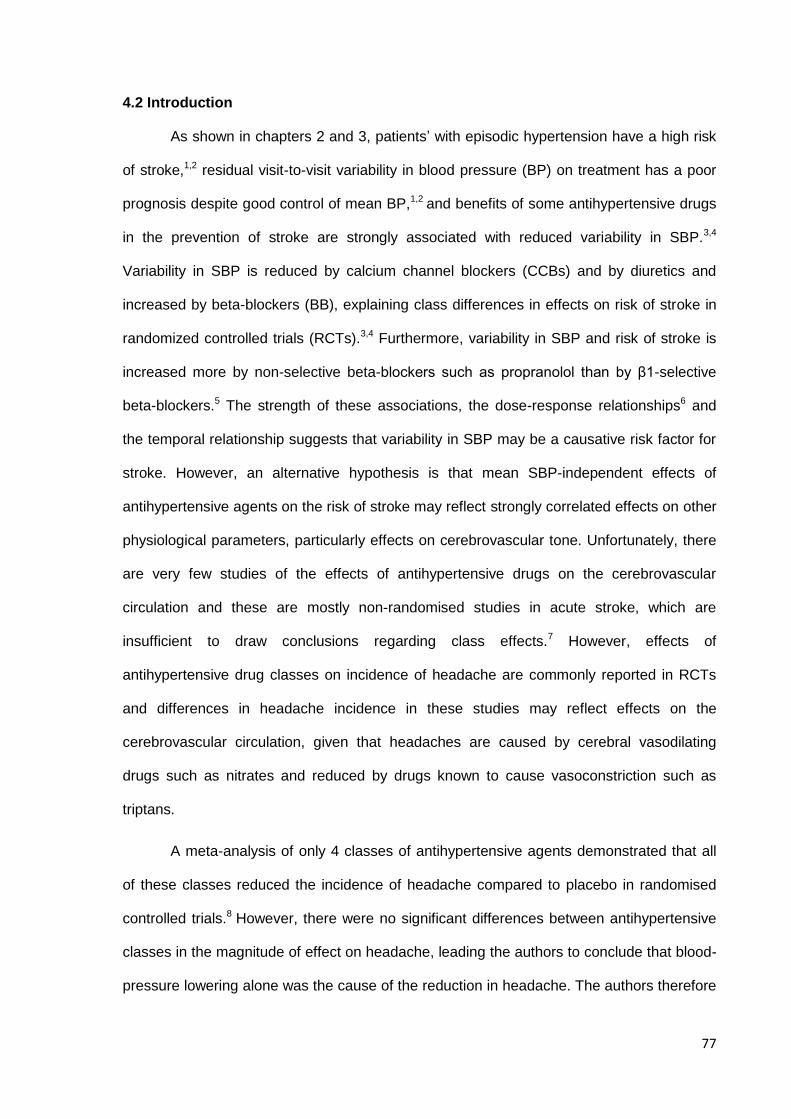
77
4.2 Introduction
As shown in chapters 2 and 3, patients’ with episodic hypertension have a high risk
of stroke,1,2 residual visit-to-visit variability in blood pressure (BP) on treatment has a poor
prognosis despite good control of mean BP,1,2 and benefits of some antihypertensive drugs
in the prevention of stroke are strongly associated with reduced variability in SBP.3,4
Variability in SBP is reduced by calcium channel blockers (CCBs) and by diuretics and
increased by beta-blockers (BB), explaining class differences in effects on risk of stroke in
randomized controlled trials (RCTs).3,4 Furthermore, variability in SBP and risk of stroke is
increased more by non-selective beta-blockers such as propranolol than by β1-selective
beta-blockers.5 The strength of these associations, the dose-response relationships6 and
the temporal relationship suggests that variability in SBP may be a causative risk factor for
stroke. However, an alternative hypothesis is that mean SBP-independent effects of
antihypertensive agents on the risk of stroke may reflect strongly correlated effects on other
physiological parameters, particularly effects on cerebrovascular tone. Unfortunately, there
are very few studies of the effects of antihypertensive drugs on the cerebrovascular
circulation and these are mostly non-randomised studies in acute stroke, which are
insufficient to draw conclusions regarding class effects.7 However, effects of
antihypertensive drug classes on incidence of headache are commonly reported in RCTs
and differences in headache incidence in these studies may reflect effects on the
cerebrovascular circulation, given that headaches are caused by cerebral vasodilating
drugs such as nitrates and reduced by drugs known to cause vasoconstriction such as
triptans.
A meta-analysis of only 4 classes of antihypertensive agents demonstrated that all
of these classes reduced the incidence of headache compared to placebo in randomised
controlled trials.8 However, there were no significant differences between antihypertensive
classes in the magnitude of effect on headache, leading the authors to conclude that blood-
pressure lowering alone was the cause of the reduction in headache. The authors therefore
78
suggested that hypertension might cause headache, although this was not consistent with
large observational studies.9 Furthermore, antihypertensive classes were not directly
compared with each other, the size of effect was only very weakly related to the degree of
blood pressure reduction and the authors did not examine the effect of calcium channel
blockers. Differences between antihypertensive classes on the incidence of headache
independent of the effect on mean SBP would challenge the conclusion that blood-pressure
lowering alone reduced the incidence of headache. Furthermore, if incidence of headache
was correlated with variability in SBP, drug-class effects on headache, variability in SBP
and risk of stroke might be partly explained by consistent effects on vascular tone in the
peripheral (variability) and cerebrovascular circulations (headache).
Therefore, I did a systematic review to determine the effect of all major classes of
antihypertensive drugs on the risk of headache compared to placebo and other drug
classes and to assess how these effects relate to effects on mean and variability in SBP.
4.3 Methods
4.3.1 Search Strategy
I searched the MEDLINE and Cochrane databases (1950 to week 1, July 2009)
using combinations of the following search terms: (“meta(-)analysis”) AND
(“antihypertensive” OR “blood(-) pressure lowering”) as described in chapter 3. Non-English
language papers were included. The reference lists of all identified reviews and
corresponding webtables were subsequently searched for trials randomising patients to one
antihypertensive drug compared to placebo or another antihypertensive class. In addition, a
secondary search was performed to identify trials comparing non-selective and selective
beta-blockers with the terms (Trial) AND ("blood-pressure lowering" OR "antihypertensive"
OR "blood pressure lowering") AND ("specific beta-blocker name"), where each beta-
blocker was searched for in turn. For every trial fulfilling the inclusion criteria the main
results paper was reviewed. The definition and frequency of headache and mean (SD) BP
at baseline and at all follow-up visits were extracted where reported for all patient groups.
79
4.3.2 Analysis
Within-trial differences between treatment groups in the incidence of headache were
compared by odds ratios (OR) whilst inter-individual variance (SD2) in SBP and DBP was
expressed as the ratio of the variances (VR). Pooled estimates were obtained by random
effects meta-analysis using Mantel-Haenszel methods weighted by the inverse variance. All
analyses were based upon the group allocated to the highest dose of each drug within each
trial, and the mean (SD) BP at the visit closest to 1 year of follow-up was used in all VR
analyses. Sensitivity analyses were performed for trials lasting 26 weeks or less, and for
trials reporting either new-onset or ‘possibly drug-related’ headaches. Trials reporting the
number of patients withdrawn due to headache without the total number of patients
experiencing headache were excluded.
Pooled analyses were performed for each drug class compared to either placebo or
to all other drug classes combined. The drug classes included were calcium channel
blockers (CCBs), ACE inhibitors (ACEI), angiotensin-receptor blockers (ARBs), beta-
blockers (BB) and diuretics (thiazide and thiazide-like). In further analyses, BBs were
subdivided into non-selective and β1-selective classes and CCBs were subdivided into
dihydropyridine and non-dihydropyridine classes. For each comparison, pooled estimates
were calculated by random effects meta-analysis of OR for headache, VR for SBP and DBP
and difference in mean SBP and DBP for all trials in which sufficient information was
presented. In addition, the difference in mean SBP and DBP weighted by trial size was
calculated.
4.4 Findings
4.4.1 Data collection
Trial reports were identified from the same 255 meta-analyses as described in
chapter 3, which generated 1858 citations to independent trials, resulting in 1372 eligible
trials after review of all abstracts and papers. Of these 1372 trials, there were 355
80
comparisons reporting the incidence of headache for patients randomised to one drug class
versus either placebo or another class, from 242 trial reports. In addition, there were 6
comparisons between non-selective and β1-selective beta-blockers from the additional
search. Of these 361 comparisons, 229 reported SBP at follow-up by treatment group and
77 reported SD-SBP, allowing meta-analysis of VR-SBP and difference in SBP. Across all
1372 trials, there were 361 within-trial comparisons between treatment groups from 293 trial
reports reporting SBP and SD-SBP at follow-up.
4.4.2 Effect of drug class on the incidence of headache versus placebo
Randomisation to any drug class compared to placebo was associated with a
decreased risk of headache during follow up in all studies (OR=0.75, 95% CI 0.69-0.82,
p<0.0001, p-heterogeneity=0.003, 198 comparisons, 36651 patients), including studies only
reporting new-onset or ‘drug-related’ headache (OR=0.79, 0.66-0.96, p=0.02, 55 comps,
11628 pts). There was significant heterogeneity across the five drug classes (χ2=21.3, df=5,
p=0.0007). Beta-blockers reduced the incidence of headache the most (OR=0.47, 0.33-
0.68, 16 comparisons, 1916 patients, p=0.0001) whilst CCBs did not significantly reduce
the incidence of headache (OR=0.95, 0.79-1.15, 65 comparisons, 9291 patients, p=0.35).
The other drug classes reduced headache to an intermediate degree (see figure 5.1) in
spite of similar reductions in mean SBP compared to CCBs and beta-blockers.
Figure 4.1 Effect of class of antihypertensive agent on incidence of headache compared to other antihypertensive classes or placebo. OR and reduction in mean SBP are pooled by random-effects meta-analysis, with 95% confidence intervals. Trls – trials; rSBP/rDBP - reduction in systolic or diastolic mean blood pressure.
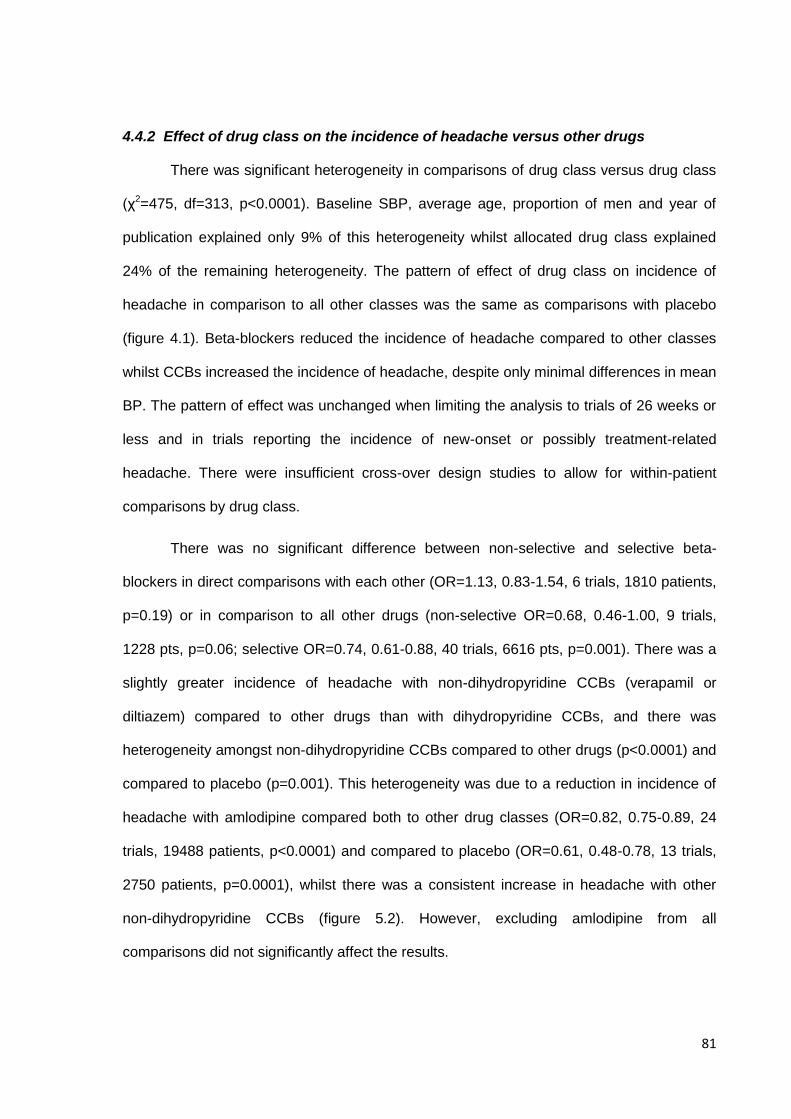
81
4.4.2 Effect of drug class on the incidence of headache versus other drugs
There was significant heterogeneity in comparisons of drug class versus drug class
(χ2=475, df=313, p<0.0001). Baseline SBP, average age, proportion of men and year of
publication explained only 9% of this heterogeneity whilst allocated drug class explained
24% of the remaining heterogeneity. The pattern of effect of drug class on incidence of
headache in comparison to all other classes was the same as comparisons with placebo
(figure 4.1). Beta-blockers reduced the incidence of headache compared to other classes
whilst CCBs increased the incidence of headache, despite only minimal differences in mean
BP. The pattern of effect was unchanged when limiting the analysis to trials of 26 weeks or
less and in trials reporting the incidence of new-onset or possibly treatment-related
headache. There were insufficient cross-over design studies to allow for within-patient
comparisons by drug class.
There was no significant difference between non-selective and selective beta-
blockers in direct comparisons with each other (OR=1.13, 0.83-1.54, 6 trials, 1810 patients,
p=0.19) or in comparison to all other drugs (non-selective OR=0.68, 0.46-1.00, 9 trials,
1228 pts, p=0.06; selective OR=0.74, 0.61-0.88, 40 trials, 6616 pts, p=0.001). There was a
slightly greater incidence of headache with non-dihydropyridine CCBs (verapamil or
diltiazem) compared to other drugs than with dihydropyridine CCBs, and there was
heterogeneity amongst non-dihydropyridine CCBs compared to other drugs (p<0.0001) and
compared to placebo (p=0.001). This heterogeneity was due to a reduction in incidence of
headache with amlodipine compared both to other drug classes (OR=0.82, 0.75-0.89, 24
trials, 19488 patients, p<0.0001) and compared to placebo (OR=0.61, 0.48-0.78, 13 trials,
2750 patients, p=0.0001), whilst there was a consistent increase in headache with other
non-dihydropyridine CCBs (figure 5.2). However, excluding amlodipine from all
comparisons did not significantly affect the results.
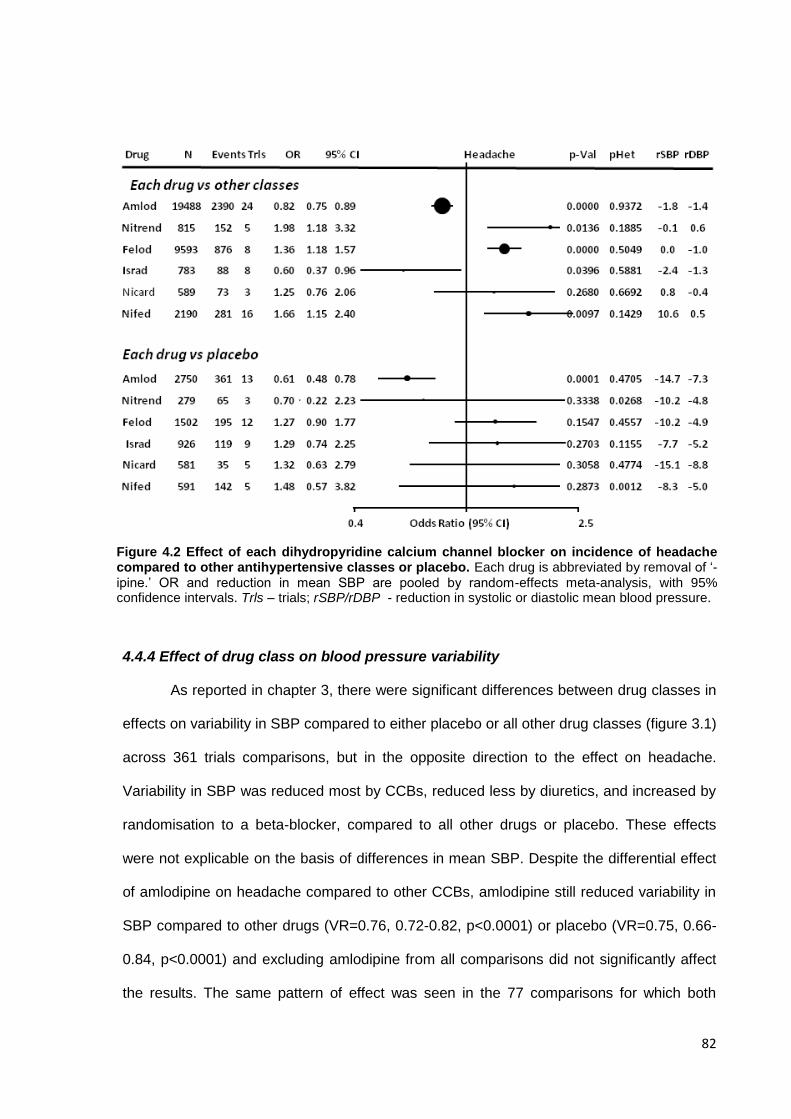
82
4.4.4 Effect of drug class on blood pressure variability
As reported in chapter 3, there were significant differences between drug classes in
effects on variability in SBP compared to either placebo or all other drug classes (figure 3.1)
across 361 trials comparisons, but in the opposite direction to the effect on headache.
Variability in SBP was reduced most by CCBs, reduced less by diuretics, and increased by
randomisation to a beta-blocker, compared to all other drugs or placebo. These effects
were not explicable on the basis of differences in mean SBP. Despite the differential effect
of amlodipine on headache compared to other CCBs, amlodipine still reduced variability in
SBP compared to other drugs (VR=0.76, 0.72-0.82, p<0.0001) or placebo (VR=0.75, 0.66-
0.84, p<0.0001) and excluding amlodipine from all comparisons did not significantly affect
the results. The same pattern of effect was seen in the 77 comparisons for which both
Figure 4.2 Effect of each dihydropyridine calcium channel blocker on incidence of headache compared to other antihypertensive classes or placebo. Each drug is abbreviated by removal of ‘-ipine.’ OR and reduction in mean SBP are pooled by random-effects meta-analysis, with 95% confidence intervals. Trls – trials; rSBP/rDBP - reduction in systolic or diastolic mean blood pressure.
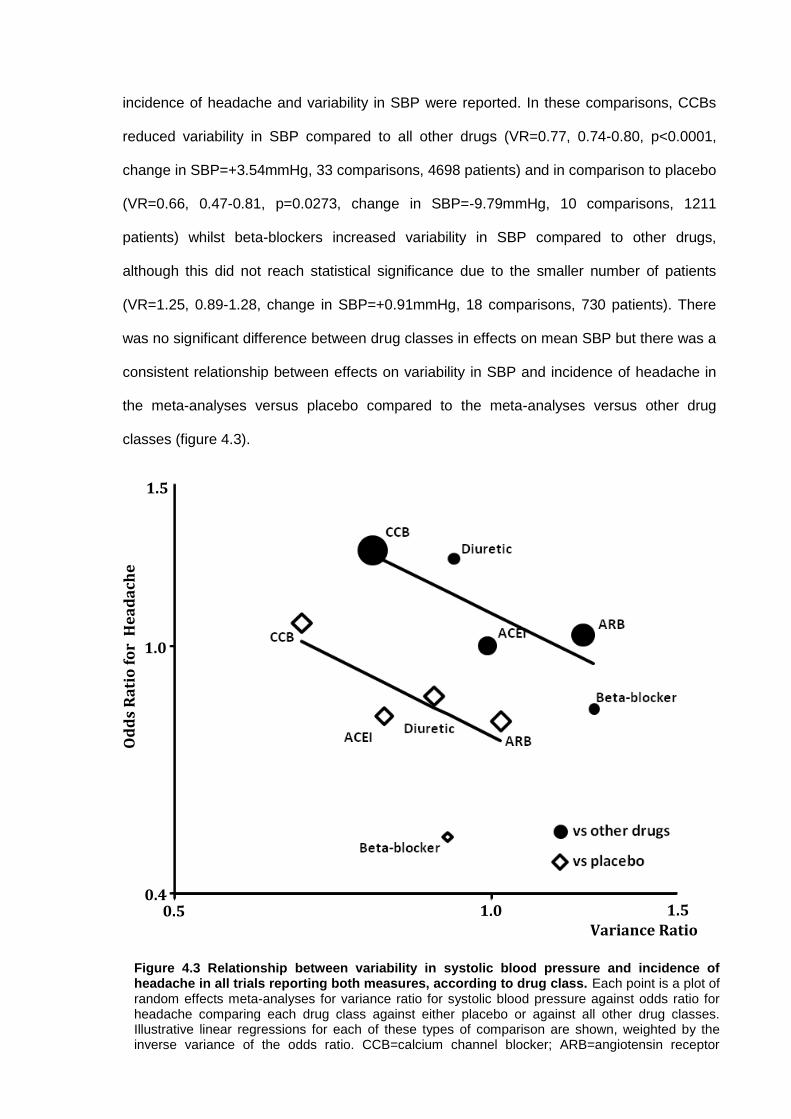
83
incidence of headache and variability in SBP were reported. In these comparisons, CCBs
reduced variability in SBP compared to all other drugs (VR=0.77, 0.74-0.80, p<0.0001,
change in SBP=+3.54mmHg, 33 comparisons, 4698 patients) and in comparison to placebo
(VR=0.66, 0.47-0.81, p=0.0273, change in SBP=-9.79mmHg, 10 comparisons, 1211
patients) whilst beta-blockers increased variability in SBP compared to other drugs,
although this did not reach statistical significance due to the smaller number of patients
(VR=1.25, 0.89-1.28, change in SBP=+0.91mmHg, 18 comparisons, 730 patients). There
was no significant difference between drug classes in effects on mean SBP but there was a
consistent relationship between effects on variability in SBP and incidence of headache in
the meta-analyses versus placebo compared to the meta-analyses versus other drug
classes (figure 4.3).
1.0
0.4 0.5 1.0 1.5
1.5
Variance Ratio
Od
ds
Ra
tio
fo
r H
ea
da
che
Figure 4.3 Relationship between variability in systolic blood pressure and incidence of headache in all trials reporting both measures, according to drug class. Each point is a plot of random effects meta-analyses for variance ratio for systolic blood pressure against odds ratio for headache comparing each drug class against either placebo or against all other drug classes. Illustrative linear regressions for each of these types of comparison are shown, weighted by the inverse variance of the odds ratio. CCB=calcium channel blocker; ARB=angiotensin receptor blocker; ACEI=angiotensin converting enzyme inhibitor.
84
4.5 Discussion
This is the largest meta-analysis of the occurrence of headache in RCTs of
antihypertensive medications, including 248 trials compared to only 94 trials in the largest
previous meta-analysis,8 and is the first meta-analysis to compare all antihypertensive drug
classes with each other. I showed that randomisation to antihypertensive medication
reduced the incidence of headache compared to placebo but there were significant
differences in the magnitude of effect between drug classes, independent of effects on
mean SBP. Beta-blockers reduced headache more than other classes both in comparison
to placebo and in comparisons with other classes, whilst CCBs did not reduce headache
compared to placebo and increased headache compared to other drug classes. These drug
class effects were not related to effects on mean SBP or DBP, but were opposite to the
effect of each drug class on inter-individual variability in SBP.
The existence of a causal relationship between hypertension and headache is
controversial, with observational studies producing conflicting results.9-12 It is clear that
some antihypertensive drugs are effective prophylactic agents in migraine, including beta-
blockers,13 non-dihydropyridine calcium channel blockers14 and angiotensin receptor
blockers.15 A recent meta-analysis demonstrated that four of the main antihypertensive
classes reduced the incidence of non-specific headache to a similar degree and concluded
that the reduction in systemic blood pressure was likely to be the primary mechanism.8
However, this study demonstrated significant heterogeneity between drug classes in their
effects on headache which could not be explained by differences in mean BP. Therefore,
although the effect of any antihypertensive drug compared to placebo suggests that the
lowering of blood pressure reduces headache, this study shows that the differences
between classes are equally important and correspond to effects on variability in SBP.
Headache is most frequent and variability in SBP is lowest with calcium channel blockers
whilst the opposite effect is seen wtih beta-blockers. This is consistent with a separate
publication of the effect of CCBs on headache from the previous meta-analysis reporting
85
the effect of the other four main drug classes.16 One possible explanation is that differences
in variability in SBP reflect effects on peripheral vascular tone and correlate with changes in
the cerebral circulation that may partly explain the resulting differences in incidence of
headache.
A change in cerebral perfusion due to alterations in cerebrovascular tone with beta-
blockers or calcium channel blockers might explain the relationship between the effects of
these drug classes on both blood pressure variability and the risk of stroke. A reduction in
cerebral perfusion with beta-blockers could convert subclinical ischaemia into a TIA or
ischaemia into infarction. However, cerebral perfusion is not a static entity, as suggested
by the episodic nature of both headache and cerebral ischaemia. The clinically significant
effects of these drugs on the risk of stroke are likely to occur at the extremes of the cerebral
autoregulation curve where cerebral perfusion is threatened by wide fluctuations in cerebral
activity and systemic blood pressure. Therefore, the systemic and cerebral actions of
calcium channel blockers may act synergistically by reducing both the occurrence of acute
hypertensive episodes and by reducing the resulting cerebral vasoconstriction during
severe hypertension which can cause distal ischaemia.17 However, effects of drug classes
on risk of stroke are unlikely to be solely explained by effects on cerebral perfusion, as
indicated by the primary relationship between blood pressure variability and risk of stroke,
independent of antihypertensive treatment.1,2
Unfortunately, the few small studies of the effects of antihypertensive medications
on the cerebral circulation have been of variable quality, used a wide variety of imaging
techniques or indices of cerebrovascular function and have included a wide range of patient
groups. As a result, it is impossible to draw firm conclusions about class effects, although in
most studies all drugs maintain cerebral perfusion whilst lowering blood pressure, including
studies with beta-blockers,18,19 CCBs,20,21 and especially ACEI19,22-23 and ARBs.20,24-25
However, there is some evidence that CCBs reduce cerebrovascular resistance more than
diuretics21 or ACEI27 but might occasionally cause excessive falls in cerebral blood flow,27,28
86
whilst beta-blockers are less effective than ACEI in maintaining cerebral perfusion
reserve.19 These findings would be consistent with the results of this meta-analysis but
there are insufficient studies to fully elucidate the effects of any specific class, or the overall
pattern of effects of these drugs on cerebrovascular haemodynamics.
This meta-analysis suggests that there are effects on headache that are not entirely
class specific. In particular, amlodipine reduced the incidence of headache, unlike other
CCBs, despite similar reductions in both mean SBP, variability in SBP and stroke risk.3 This
reduction in headache despite clear evidence of vasodilatation has been demonstrated in
earlier reports29 and is unlikely to reflect a lack of cerebral vasodilatation but may be due to
the much longer time to peak concentration with amlodipine than with other CCBs, allowing
sufficient time for autoregulation to prevent an excess of cerebrovascular dilatation.30 This
suggests that relatively rapid cerebral vasodilatation is required for the precipitation of
headache, which is consistent with it’s episodic nature, whilst the speed of onset of a drug
may be less relevant for the prevention of headache from other causes.
However, there are a number of limitations to this systematic review. Firstly, the
trials included in this meta-analysis did not address the effect of antihypertensive agents on
the incidence of headache in known headache sufferers. Secondly, no paper defined the
aetiology of the reported headaches or the frequency of headaches and too few papers
reported the relative severity of headache to allow for a meaningful analysis. Most
commonly, headache was defined as a side-effect, but the reduced incidence compared to
placebo suggests that antihypertensive drugs actually reduced the occurrence of primary
headaches. As such it is impossible to define whether the effects are specific to any
particular headache type, and it is feasible that the drug class specific effects on headache
are acting on a non-haemodynamic mechanism in specific headache types, for example
beta-blockers reducing cortical spreading depression, although the lack of a protective
effect of non-dihydropyridine CCBs suggests that the majority of the effect was on non-
migrainous headaches and the close correlation with BP variability does suggest a
87
haemodynamic process. Nonetheless, it is likely that some drug classes have both
haemodynamic effects on some headache types via effects on BP and cerebral perfusion
and non-haemodynamic effects on other headache types, such as migraine. Thirdly, there
were limited trials of longer duration reporting the incidence of headache. Therefore it is
possible that antihypertensive treatment has a relatively acute effect on headache which is
not sustained. Fourthly, I was unable to directly assess the effect of treatment on intra-
individual variability in SBP in trials also reporting headache incidence as it was not
available for any of these trials, but drug class effects on interindividual variability are the
same as drug class effects on intraindividual variability.3,5
One major implication of this finding is that any study that seeks to determine the
physiological determinants of blood pressure variability and how blood pressure variability
may result in an increased risk of stroke, also needs to determine any covariation in
changes in the cerebral circulation. For interventional tests, the effect of any intervention on
blood pressure variability also needs to determine the effect on the cerebral circulation. As
a result, extensive assessment of baseline cerebral perfusion, cerebral autoregulation and
cerebral reactivity to carbon dioxide are included in the Physiological Cohort study
described in chapters 9-10.
In conclusion, antihypertensive treatment reduces the incidence of headache
compared to placebo, but the magnitude of effect differs between drug-classes
independently of the magnitude of blood pressure reduction. These drug-class differences
correspond to their effects on variability in SBP, suggesting that some of the relationship
between antihypertensive drug-class effects on variability in SBP and effects on stroke risk
may be due to associated effects on the cerebral circulation.
88
4.6 References
1. Rothwell PM. Limitations of the usual BP hypothesis and importance of variability, instability, and episodic hypertension. Lancet 2010;375:938-948
2. Rothwell PM, Howard SC, Dolan E, O’Brien E, Dobson JE, Dahlof B et al. Prognostic significance of visit-to-visit variability, maximum systolic BP, and episodic hypertension. Lancet 2010;375:895-905.
3. Webb AJS, Fischer U, Mehta Z, Rothwell PM. Effects of antihypertensive-drug class on interindividual variation in BP and risk of stroke: a systematic review and meta-analysis. Lancet 2010;375:906-915.
4. Rothwell PM, Howard SC, Dolan E, O’Brien E, Dobson JR, Dahlof B et al; ASCOT-BPLA
and MRC Trial investigators. Effects of blockers and calcium-channel blockers on within-individual variability in BP and risk of stroke. Lancet Neurology 2010;9:469-480.
5. Webb AJS, Rothwell PM. Effect of β-blocker selectivity on blood pressure variability and stroke. Neurology. 2011; 77: 731-737 .
6. Webb AJS, Rothwell PM. Effect of dose and combination of antihypertensives on interindividual blood pressure variability: a systematic review. Stroke. 2011; 42: 2860-2865.
7. Sare GM, Greenagage C, Bath PM. High blood pressure in acute ischaemic stroke--broadening therapeutic horizons. Cerebrovasc Dis. 2009;27 Suppl 1:156-61
8. Law M, Morris JK, Jordan R, Wald M. Headaches and the treatment of blood pressure: results from a meta-analysis of 94 randomized placebo-controlled trials with 24,000 participants. Circulation 2005;112: 2301-2306.
9. Di Tullio M, Alli C, Avanzini F, Bettelli G, Colombo F, Devoto MA et al, for the Gruppo di Studio Sulla Pressione Arteriosa Nell’ Anziano. Prevalence of symptoms generally attributed to hypertension or its treatment: study on blood pressure in elderly outpatients (SPAA). J Hypertens. 1988; 6: S87–S90.
10. Weiss NS. Relation of high blood pressure to headache, epistaxis and selected other symptoms. NEJM 1972; 287: 631-633.
11. Kurszewski P, Bieniaszewski L, Neubauer J, Krupa-Wojciechowska B. Headache in patients with mild o moderate hypertension is generally not associated with simultaneous blood pressure elevation. J Hypertens. 2000; 18: 437-444.
12. Hagen K, Stovner JL, Vatten L, Holmen J, Zvart J-A, Bovim G. Blood pressure and risk of headache: a prospective study of 22685 adults in Norway. J Neurol Neurosurg Psychiatry 2002; 72: 463-466.
13. Linde K, Rossnagel K. Propranolol for migraine prophylaxis. Cochrane Database Systematic Rev 2004; 2: CD003225.
14. Solomon GD, Steel JG, Spaccavento LJ. Verapamil prophylaxis of migraine: a double-blind, placebo controlled trial. JAMA 1983; 250: 2500-2502.
15. Tronvik E, Stovner LJ, Helde G, Sand T, Bovim G. Prophylactic treatment of migraine with an angiotensin II receptor blocker: a randomised controlled trial. JAMA 2003; 289: 65-69.
16. Law MR, Morris JK, Wald NJ. Calcium channel blockers and headache (Letter). Br J Clin Pharm 2006; 63: 157-158.
17. Meyer JS, Waltz AG, Gotoh F. Pathogenesis of cerebral vasospasm in hypertensive encephalopathy. I. Effects of acute increase in intraluminal blood pressure on pial blood flow. Neurology 1960; 10: 735-744.
18. Troisi E, Attanasio A, Matteis M, Bragoni M, Monaldo BC, Caltagirone C, Silvestrini M. Cerebral hemodynamics in young hypertensive subjects and effects of atenolol treatment. J Neurol Sci 1998; 159: 115-119.
19. Pieniazek W, Dimitrow PP, Jasinski T. Comparison of the effect of perindopril and acebutolol on cerebral hemodynamics in hypertensive patients. Cardiovasc Drugs Ther 2001; 15: 63-67.
20. Hong KS, Kang DW, Bae HJ, Kim YK, Han MK, Park JM et al. Effect of cilnidipine vs losartan on cerebral blood flow in hypertensive patients with a history of ischemic stroke: a randomized controlled trial. Acta Neurol Scand 2010; 121: 51-57.
21. Semplicini A, Maresca A, Simonella C, Chierichetii F, Pauletto P, Meneghetti G et al. Cerebral perfusion in hypertensives with carotid artery stenosis: a comparative study of lacidipine and hydrochlorothiazide. Blood Press 2000; 9: 34-39.
22. Walters MR, Bolster A, Dyker AG, Lees KR. Effect of perindopril on cerebral and renal perfusion in stroke patients with carotid disease. Stroke 2001; 32: 473-478.
89
23. Hatazawa J, Shimosegawa E, Osaki Y, Ibaraki M, Oku N, Hasegawa S et al. Long-term angiotensin-converting enzyme inhibitor perindopril therapy improves cerebral perfusion reserve in patients with previous minor stroke. Stroke 2004; 35: 2117-2122.
24. Claassen JA, Levine BD, Zhang R. Cerebral vasomotor reactivity before and after blood pressure reduction in hypertensive patients. Am J Hypertens 2009; 22: 384-391.
25. Oku N, Kitagawa K, Imaizumi M, Takasawa M, Piao R, Kimura Y et al. Hemodynamic influences of losartan on the brain in hypertensive patients. Hypertens Res 2005; 28: 43-49.
26. Nazir FS, Overell JR, Bolster A, Hilditch TE, Reid JL, Lees KR. The effect of losartan on global and focal cerebral perfusion and on renal function in hypertensives in mild early ischaemic stroke. J Hypertens 2004; 22: 989-995.
27. Akopov SE, Simonian NA. Comparison of isradipine and enalapril effects on regional carotid circulation in patients with hypertension with unilateral internal carotid artery stenosis. J Cardiovasc Pharmacol 1997; 30: 562-570.
28. Lisk DR, Grotta JC, Lamki LM, Tran HD, Taylor JW, Molony DA, Barron BJ. Should hypertension be treated after acute stroke? A randomized controlled trial using single photon emission computed tomography. Arch Neurol 1993; 50: 855-862.
29. Osterloh IH. An update on the safety of amlodipine. J Cardiovasc Pharmacol 1991;17 Suppl 1: S65-68.
30. Waeber B, Borges ET, Christeler P, Guillaume-Gentil M, Hollenstein U, Mannhart M. Amlodipine compare to nitrendipine in hypertensive patients: the effects on toleration in relationship to the onset of action. Cardiology 1992; 80 Suppl 1: 46-53.
90
CHAPTER FIVE
Frequency, validity and prognostic value of residual
hypertension: home versus ambulatory blood pressure
after TIA or non-disabling stroke
5.1 Summary 91
5.2 Introduction 92
5.3 Methods 93
5.3.1 Study population 93
5.3.2 Procedures 94
5.3.3 Analysis 95
5.4 Findings 97
5.4.1 Study population 97
5.4.2 Leukoaraiosis 99
5.4.3 Aortic stiffness 102
5.4.4 Renal function 102
5.4.5 Diagnosis of stroke 102
5.4.6 Cognitive impairment 104
5.4.7 Premorbid hypertension 104
5.4.8 Risk of recurrent events 108
5.5 Discussion 108
5.6 References 112
91
5.1 Summary
Diagnosis of hypertension on the basis of BP measurements in clinic has been
questioned and most guidelines now recommend confirmation by ambulatory (ABPM) or
home (HBPM) monitoring, but recent NICE guidelines preferentially recommend ABPM.
However, there are no valid direct comparisons of HBPM and ABPM, and it is unclear
which method provides a more accurate measure of BP, a prerequisite for measuring blood
pressure variability. To validate HBPM versus ABPM, I compared residual hypertension on
HBPM and ABPM with 10 markers of hypertensive disease, including markers of
hypertensive arteriopathy, premorbid hypertension and cardiovascular events or death.
Among 500 consecutive patients recruited from a dedicated TIA/stroke clinic, mean
SBP on HBPM (3 readings, 3 times daily for 7 days) was more strongly associated than on
ABPM (difference p=0.016) with all markers of hypertensive arteriopathy (OR per 10mmHg
SBP: HBPM 1.47, 95% CI 1.28-1.68, p<0.001 vs ABPM OR 1.18, 1.02-1.36, p=0.03), and
individually with leukoaraiosis (1.34, 1.16-1.56, p<0.001 vs 1.03, 0.86-1.23, p=0.80), aortic
stiffness (r=0.21, p=0.01 vs r=0.04, p=0.67), creatinine (r=0.24, p<0.001 vs r=0.11,
p=0.012), stroke vs TIA (OR=1.34 , 1.15-1.56, p<0.001 vs 1.12 , 0.96-1.31, p=0.16) and
cognitive impairment (OR=1.41, 1.21-1.65, p<0.001 vs 1.12, 0.96-1.31, p=0.15), particularly
in patients >65 years. HBPM also better identified premorbid hypertension (area under
ROC curve: 0.73, 0.68-0.78 vs 0.60, 0.54-0.65, p-diff=0.0002), again mainly in patients >65
years (0.70, 0.62-0.77 vs 0.55, 0.47-0.63, p-diff=0.002). BP>135/85 predicted the risk of
recurrent events on HBPM but not on ABPM: stroke (OR=2.46, 1.01-6.02, p=0.049 vs 1.09,
0.42-2.83, p=0.86); all cardiovascular events (2.62, 1.25-5.48, p=0.011 vs 1.51, 0.69-3.30,
p=0.30); all cause death (2.65, 1.28-5.46, p=0.008 vs 1.67, 0.80-3.49, p=0.18).
In patients with TIA or non-disabling stroke, HBPM was more accurate than ABPM
at identifying hypertensive arteriopathy, premorbid hypertension and cardiovascular events
or death, probably due to the limitations of ABPM in patients >65 years, demonstrating its
greater validity in measurement of blood pressure and blood pressure variability.
92
5.2 Introduction
In chapters 1-3, I demonstrated that variability in clinic blood pressures was strongly
associated with the risk of recurrent cardiovascular events. However, repeated clinic
measures are an impractical method of assessing blood pressure variability. Home blood
pressure monitoring (HBPM) is an alternative, but there is little evidence for the prognostic
significance of variability on HBPM. Prior to using it to assess variability in blood pressure, it
is important to demonstrate that it is a reliable method of blood pressure measurement in
comparison to the currently accepted gold-standard.
In primary prevention, validity of diagnosis of hypertension on the basis of BP
measurements in clinic has been questioned and most guidelines now recommend
independent confirmation, ideally by awake ambulatory (ABPM) rather than home (HBPM)
monitoring, although 7 days of HBPM is recommended for screening and when ABPM is
not available.1-3 Recent cost-effectiveness analyses4 (and hence the new NICE guideline1)
also recommended ABPM during usual waking hours, but in the absence of comparative
studies based on hard clinical outcomes these were based on the assumption that ABPM
was an absolute gold standard, with 100% sensitivity and specificity for the identification of
clinically relevant hypertension.5 Irrespective of the validity of this assumption, reliability of
prediction of cardiovascular events would arguably be a better measure of clinical utility,
and the only two direct comparisons of ABPM versus HBPM6-7 in predicting the risk of
cardiovascular events did not demonstrate significant differences, even with HBPM limited
to three measurements of BP on one day. Moreover, the median age of participants in
previous studies comparing ABPM and HBPM was only about 50 years,6-10 whereas half of
new diagnoses of hypertension are now made over the age of 65 in developed countries.11
As well as the dearth of comparative studies of the utility of ABPM versus HBPM in
identifying hypertension at older ages, there are also no studies in a secondary prevention
setting. Given the very high absolute risks of recurrent vascular events in secondary
prevention, the older age, and the larger absolute benefits of antihypertensive treatment,12-

93
13 reliable diagnosis of hypertension is particularly important. In the case of TIA and stroke,
guidelines recommend BP-lowering in all patients with clinic BP>130/8014-16 but under-
treatment is substantial in all countries in which studies have been done18-24 and missed
hypertension is common, partly due to considerable visit-to-visit variability in BP.17 Indeed,
the high day-to-day variability in BP in this group of patients25 could reduce the reliability of
single-day assessment with ABPM. Current guidelines recommend a one-off clinic review of
patients one month after TIA or stroke in order to assess initial risk factor control, but do not
address how best to gauge BP control.26 I therefore studied mean SBP and DBP on awake
ABPM versus 7-day HBPM, as recommended by hypertension guidelines,1-3 one month
after TIA and stroke, and compared their pathological validity by correlation with
fivemarkers of physiological dysfunction associated with hypertensive end-organ damage
“hypertensive arteriopathy” (renal dysfunction,27 arterial stiffness,28 leukoaraiosis,29
diagnosis of stroke versus TIA and cognitive impairment30). We compared their clinical
validity by association with pre-existing hypertension (a prior diagnosis or mean BP>140/90
on last 20 primary care readings) and prediction of the risk of vascular events on follow-up,
stratifying analyses by age.
5.3 Methods
5.3.1 Study Population
Consecutive patients were recruited between April 2008 and January 2012 from the
Oxford Vascular Study (OXVASC)31 TIA and minor stroke clinic.32 The OXVASC population
consists of 92,728 individuals registered with 100 primary-care physicians in nine practices
in Oxfordshire, UK.31 All consenting patients with TIA or stroke underwent a standardised
medical history and examination, ECG and routine blood tests. Patients underwent a stroke
protocol MRI brain and contrast-enhanced MRA of the extracranial brain-supplying arteries
(or CT-brain and either a carotid Doppler ultrasound or CT-angiogram when MR imaging
was contraindicated), an echocardiogram and 5 days of ambulatory cardiac monitoring. All
patients were reviewed by a study physician, the diagnosis verified by the senior study
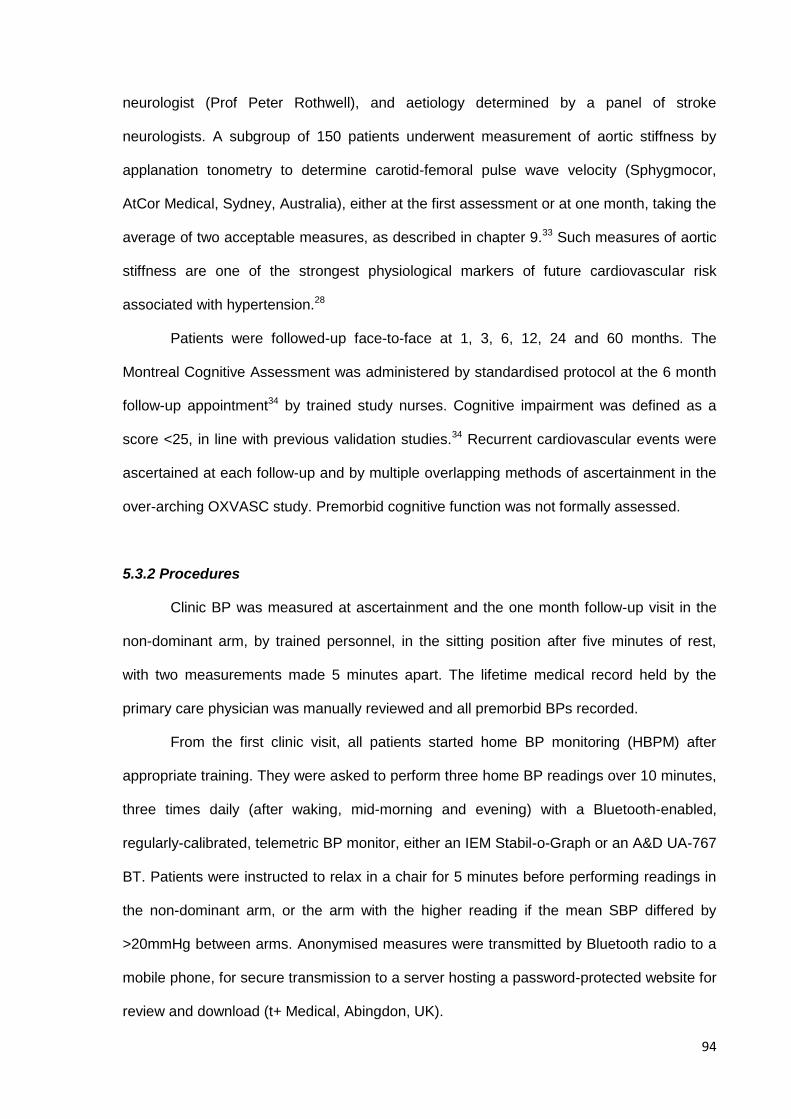
94
neurologist (Prof Peter Rothwell), and aetiology determined by a panel of stroke
neurologists. A subgroup of 150 patients underwent measurement of aortic stiffness by
applanation tonometry to determine carotid-femoral pulse wave velocity (Sphygmocor,
AtCor Medical, Sydney, Australia), either at the first assessment or at one month, taking the
average of two acceptable measures, as described in chapter 9.33 Such measures of aortic
stiffness are one of the strongest physiological markers of future cardiovascular risk
associated with hypertension.28
Patients were followed-up face-to-face at 1, 3, 6, 12, 24 and 60 months. The
Montreal Cognitive Assessment was administered by standardised protocol at the 6 month
follow-up appointment34 by trained study nurses. Cognitive impairment was defined as a
score <25, in line with previous validation studies.34 Recurrent cardiovascular events were
ascertained at each follow-up and by multiple overlapping methods of ascertainment in the
over-arching OXVASC study. Premorbid cognitive function was not formally assessed.
5.3.2 Procedures
Clinic BP was measured at ascertainment and the one month follow-up visit in the
non-dominant arm, by trained personnel, in the sitting position after five minutes of rest,
with two measurements made 5 minutes apart. The lifetime medical record held by the
primary care physician was manually reviewed and all premorbid BPs recorded.
From the first clinic visit, all patients started home BP monitoring (HBPM) after
appropriate training. They were asked to perform three home BP readings over 10 minutes,
three times daily (after waking, mid-morning and evening) with a Bluetooth-enabled,
regularly-calibrated, telemetric BP monitor, either an IEM Stabil-o-Graph or an A&D UA-767
BT. Patients were instructed to relax in a chair for 5 minutes before performing readings in
the non-dominant arm, or the arm with the higher reading if the mean SBP differed by
>20mmHg between arms. Anonymised measures were transmitted by Bluetooth radio to a
mobile phone, for secure transmission to a server hosting a password-protected website for
review and download (t+ Medical, Abingdon, UK).
95
The day before the one month follow-up visit, ambulatory BP monitoring (ABPM)
was performed at home with an A&D TM-2430 monitor in the non-dominant arm, fitted by a
trained study nurse. BP was measured at 30 minute intervals during the day and 60 minute
intervals at night. During a reading, patients were asked to sit down and refrain from
excessive activity and were asked to keep a diary of the day.
Patients continued home monitoring until at least the one month follow-up
appointment. Hypertension was treated as per current guidelines. Choice of
antihypertensive agent was tailored to the individual patient but usual first-line treatment
was a combination of perindopril arginine 5mg and indapamide 1.25mg, followed by
amlodipine 5mg, then amlodipine 10mg, with subsequent choices at the physician’s
discretion.
Leukoaraiosis on brain imaging was assessed on axial T2 MRI scans during routine
clinical review by a neuroradiologist (the Oxford scale), and categorised into none, mild,
moderate or severe. Scans were subsequently scored by trained observers according to a
modified version of the Blennow and Fazekas scales35 on CT and MRI, with scores
concatenated into the same 4 categories, as reported in previous OXVASC publications.36
These rapid and well validated assessment methods provide good statistical power and
accuracy with large datasets, such that the added precision of volumetric measurement is
not required, but are significantly more efficient to calculate than volumetric measures.
5.3.3 Analysis
Mean SBP and DBP for 7-day HBPM were derived from the 7 days prior to the one
month ABPM as recommended by guidelines,1-3 using the average of the last two readings
from each of the three daily sets. Equivalent values for one-day HBPM were derived on the
day prior to the ABPM. Mean awake SBP and DBP on ABPM were derived after automated
and manual exclusion of artefactual measurements according to predefined criteria.37 Mean
premorbid SBP and DBP were derived from the last 20 readings recorded in primary care,
with sensitivity analyses limited to the last 10 readings or all readings in the last five years.
96
Premorbid hypertension was defined as known hypertension reported by the patient,
treatment with antihypertensives to lower BP, a diagnosis of hypertension on the primary
care list of diagnoses or a mean premorbid SBP >140 or mean DBP >90.1 Sensitivity
analyses were performed with premorbid hypertension defined only by a mean premorbid
BP >140/90.
Mean SBP or DBP on ABPM and HBPM were correlated with the five measures of
hypertensive arteriopathy, using general linear models for continuous variables and by
logarithmic or ordinal regression for categorical variables, including all patients with
available data for each form of monitoring in all regressions estimating associations.
Arteriopathy was defined as: aortic pulse wave velocity >12m/s;3 creatinine >120mmol/dl;
MoCA score <25; stroke versus TIA; or moderate or severe leukoaraiosis. A composite
measure for hypertensive arteriopathy was also calculated based on the number of markers
present, excluding pulse wave velocity due to the smaller sub-population. All analyses were
stratified by age above or below 65 years. Accuracy of mean SBP on ABPM versus HBPM
was validated by receiver operator characteristic (ROC) curve analysis for identification of
premorbid hypertension (as defined above), stratified by age above or below 65 years.
The risks of stroke, cardiovascular events (TIA, stroke, myocardial infarction, other
acute vascular events or cardiovascular death) and all-cause mortality were determined by
Kaplan-Meier curves and Cox Regression for residual hypertension (defined as above) on
ABPM versus HBPM, or a 10mmHg increase in mean SBP, with and without adjustment for
age, gender, diabetes, smoking, family history, hyperlipidaemia and atrial fibrillation. Due to
the small number of outcome events, stroke was not subdivided into haemorrhagic versus
ischaemic stroke, or into subtypes of ischaemic stroke. Associations with hypertensive
arteriopathy were determined in all patients with available data for each type of monitoring
whilst analyses identifying a limited number of events (premorbid hypertension or
cardiovascular events) were only performed in patients undergoing both ABPM and HBPM.
97
5.4 Findings
5.4.1 Study Population
Of 520 consecutive patients consenting to BP monitoring, 500 (96%) complied with
the protocol (2 died and 18 had poor compliance or withdrew consent) and had adequate 7-
day readings prior to the one month follow-up. 459 (92%) also had ABPM (2 moved out of
the study area before 1 month, 7 were too unwell or died, 8 had inadequate readings and
32 refused ABPM). Consistent with previous reports,38 mean BP on clinic measurements at
one month was 4 / 1 mmHg higher than on ABPM and was 8 / 1 mmHg higher than on
HBPM (table 5.1). However, the SBP distribution was wider on HBPM than ABPM or clinic
BP, resulting in similar numbers of patients with residual hypertension (BP>135/85): 107
(20%) patients on HBPM and 124 (23%) patients with ABPM, with 148 (28%) identified by
HBPM when using a lower threshold (BP >130/85). There was only moderate correlation
between mean SBP and DBP on ABPM with 1 day or 7 days of HBPM (figure 5.1), and
relatively weak agreement for the diagnosis of residual hypertension at one month in all
patients (kappa=0.40, 0.30-0.50), in patients previously known to be hypertensive
(kappa=0.41, 0.29-0.52) and in patients aged ≥65 years (kappa=0.43, 0.31-0.55).
Figure 5.1. Relationship between systolic and diastolic blood pressure on ambulatory (ABPM) and
either 1 day or 7 days of home (HBPM) blood pressure monitoring. r2 and p values are derived from
linear regression.
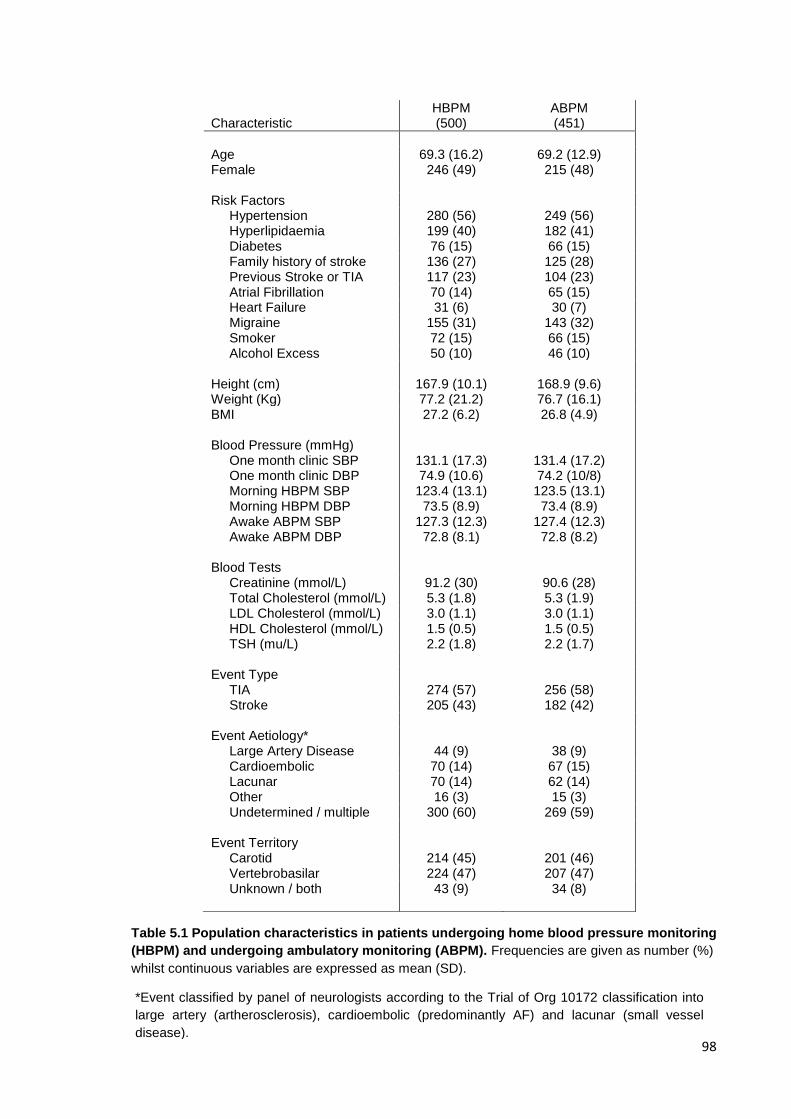
98
Characteristic HBPM (500)
ABPM (451)
Age 69.3 (16.2) 69.2 (12.9) Female 246 (49) 215 (48) Risk Factors Hypertension 280 (56) 249 (56) Hyperlipidaemia 199 (40) 182 (41) Diabetes 76 (15) 66 (15) Family history of stroke 136 (27) 125 (28) Previous Stroke or TIA 117 (23) 104 (23) Atrial Fibrillation 70 (14) 65 (15) Heart Failure 31 (6) 30 (7) Migraine 155 (31) 143 (32) Smoker 72 (15) 66 (15) Alcohol Excess 50 (10) 46 (10) Height (cm) 167.9 (10.1) 168.9 (9.6) Weight (Kg) 77.2 (21.2) 76.7 (16.1) BMI 27.2 (6.2) 26.8 (4.9) Blood Pressure (mmHg) One month clinic SBP One month clinic DBP
131.1 (17.3) 74.9 (10.6)
131.4 (17.2) 74.2 (10/8)
Morning HBPM SBP Morning HBPM DBP Awake ABPM SBP Awake ABPM DBP Blood Tests
123.4 (13.1) 73.5 (8.9)
127.3 (12.3) 72.8 (8.1)
123.5 (13.1) 73.4 (8.9)
127.4 (12.3) 72.8 (8.2)
Creatinine (mmol/L) 91.2 (30) 90.6 (28) Total Cholesterol (mmol/L) 5.3 (1.8) 5.3 (1.9) LDL Cholesterol (mmol/L) 3.0 (1.1) 3.0 (1.1) HDL Cholesterol (mmol/L) 1.5 (0.5) 1.5 (0.5) TSH (mu/L) 2.2 (1.8) 2.2 (1.7) Event Type TIA 274 (57) 256 (58) Stroke 205 (43) 182 (42) Event Aetiology* Large Artery Disease 44 (9) 38 (9) Cardioembolic 70 (14) 67 (15) Lacunar 70 (14) 62 (14) Other 16 (3) 15 (3) Undetermined / multiple 300 (60) 269 (59) Event Territory Carotid
214 (45)
201 (46)
Vertebrobasilar 224 (47) 207 (47) Unknown / both 43 (9) 34 (8)
Table 5.1 Population characteristics in patients undergoing home blood pressure monitoring
(HBPM) and undergoing ambulatory monitoring (ABPM). Frequencies are given as number (%)
whilst continuous variables are expressed as mean (SD).
*Event classified by panel of neurologists according to the Trial of Org 10172 classification into
large artery (artherosclerosis), cardioembolic (predominantly AF) and lacunar (small vessel
disease).
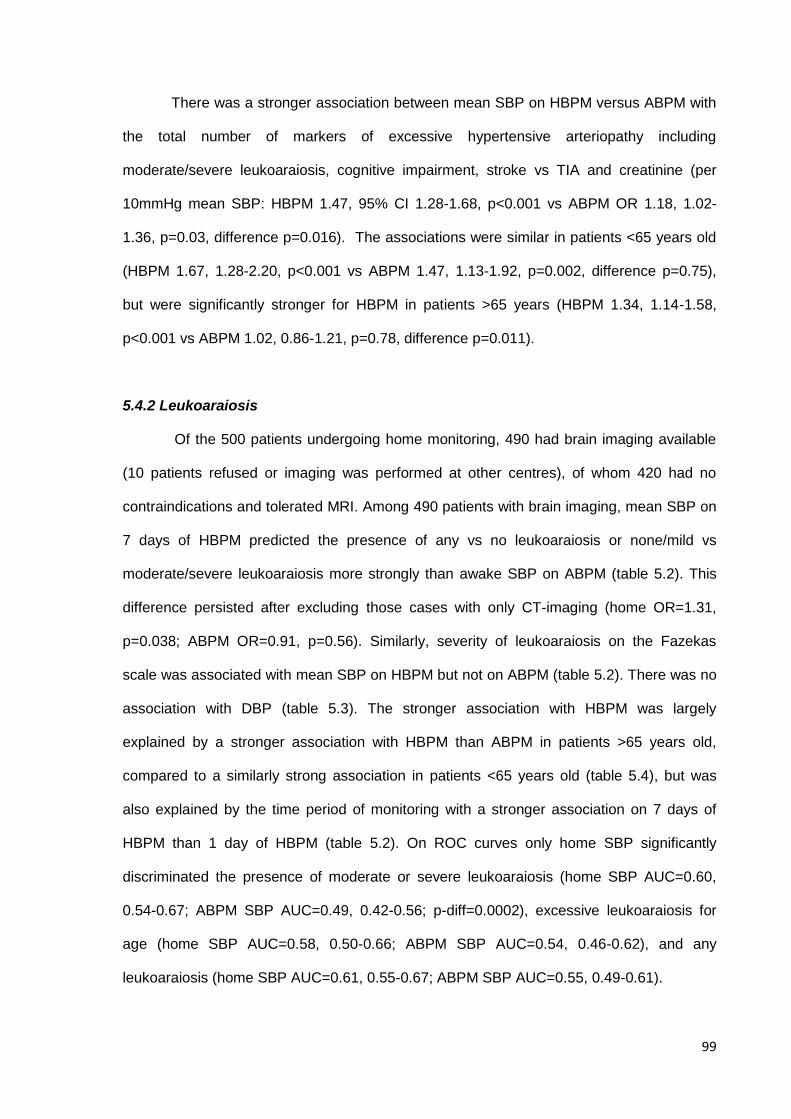
99
There was a stronger association between mean SBP on HBPM versus ABPM with
the total number of markers of excessive hypertensive arteriopathy including
moderate/severe leukoaraiosis, cognitive impairment, stroke vs TIA and creatinine (per
10mmHg mean SBP: HBPM 1.47, 95% CI 1.28-1.68, p<0.001 vs ABPM OR 1.18, 1.02-
1.36, p=0.03, difference p=0.016). The associations were similar in patients <65 years old
(HBPM 1.67, 1.28-2.20, p<0.001 vs ABPM 1.47, 1.13-1.92, p=0.002, difference p=0.75),
but were significantly stronger for HBPM in patients >65 years (HBPM 1.34, 1.14-1.58,
p<0.001 vs ABPM 1.02, 0.86-1.21, p=0.78, difference p=0.011).
5.4.2 Leukoaraiosis
Of the 500 patients undergoing home monitoring, 490 had brain imaging available
(10 patients refused or imaging was performed at other centres), of whom 420 had no
contraindications and tolerated MRI. Among 490 patients with brain imaging, mean SBP on
7 days of HBPM predicted the presence of any vs no leukoaraiosis or none/mild vs
moderate/severe leukoaraiosis more strongly than awake SBP on ABPM (table 5.2). This
difference persisted after excluding those cases with only CT-imaging (home OR=1.31,
p=0.038; ABPM OR=0.91, p=0.56). Similarly, severity of leukoaraiosis on the Fazekas
scale was associated with mean SBP on HBPM but not on ABPM (table 5.2). There was no
association with DBP (table 5.3). The stronger association with HBPM was largely
explained by a stronger association with HBPM than ABPM in patients >65 years old,
compared to a similarly strong association in patients <65 years old (table 5.4), but was
also explained by the time period of monitoring with a stronger association on 7 days of
HBPM than 1 day of HBPM (table 5.2). On ROC curves only home SBP significantly
discriminated the presence of moderate or severe leukoaraiosis (home SBP AUC=0.60,
0.54-0.67; ABPM SBP AUC=0.49, 0.42-0.56; p-diff=0.0002), excessive leukoaraiosis for
age (home SBP AUC=0.58, 0.50-0.66; ABPM SBP AUC=0.54, 0.46-0.62), and any
leukoaraiosis (home SBP AUC=0.61, 0.55-0.67; ABPM SBP AUC=0.55, 0.49-0.61).
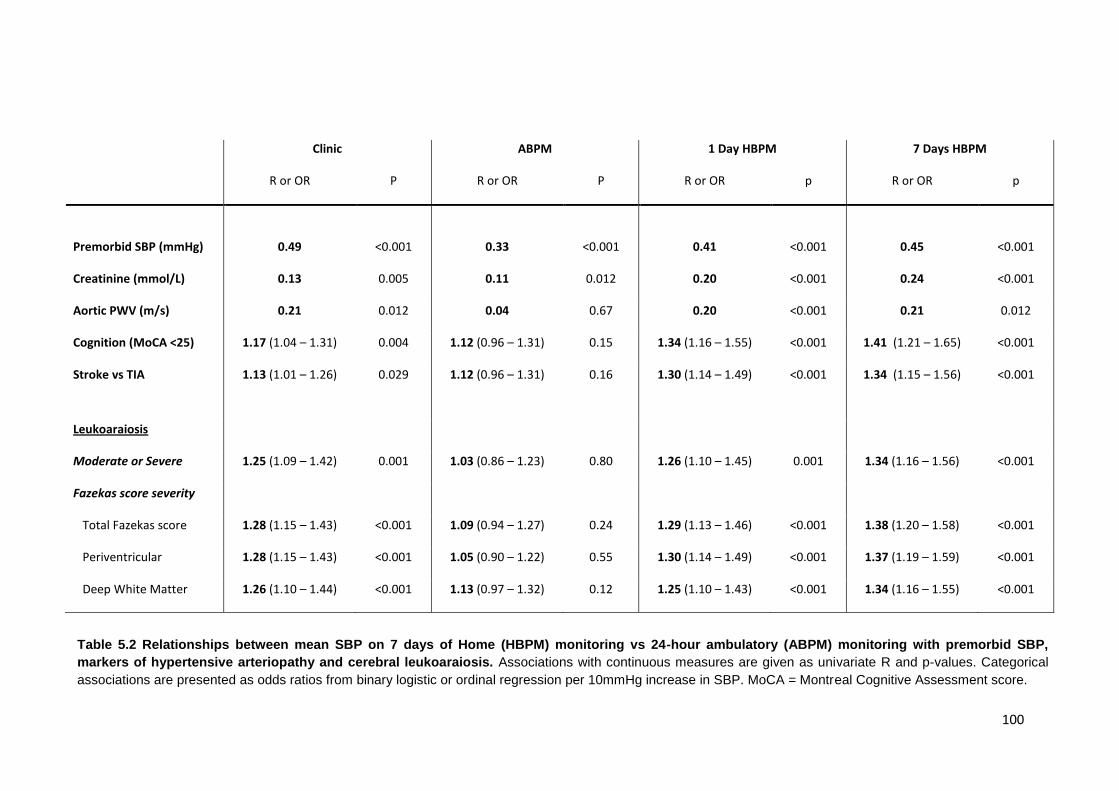
100
Clinic ABPM 1 Day HBPM 7 Days HBPM
R or OR P R or OR P R or OR p R or OR p
Premorbid SBP (mmHg) 0.49 <0.001 0.33 <0.001 0.41 <0.001 0.45 <0.001
Creatinine (mmol/L) 0.13 0.005 0.11 0.012 0.20 <0.001 0.24 <0.001
Aortic PWV (m/s) 0.21 0.012 0.04 0.67 0.20 <0.001 0.21 0.012
Cognition (MoCA <25) 1.17 (1.04 – 1.31) 0.004 1.12 (0.96 – 1.31) 0.15 1.34 (1.16 – 1.55) <0.001 1.41 (1.21 – 1.65) <0.001
Stroke vs TIA
1.13 (1.01 – 1.26) 0.029 1.12 (0.96 – 1.31) 0.16 1.30 (1.14 – 1.49) <0.001 1.34 (1.15 – 1.56) <0.001
Leukoaraiosis
Moderate or Severe 1.25 (1.09 – 1.42) 0.001 1.03 (0.86 – 1.23) 0.80 1.26 (1.10 – 1.45) 0.001 1.34 (1.16 – 1.56) <0.001
Fazekas score severity
Total Fazekas score 1.28 (1.15 – 1.43) <0.001 1.09 (0.94 – 1.27) 0.24 1.29 (1.13 – 1.46) <0.001 1.38 (1.20 – 1.58) <0.001
Periventricular 1.28 (1.15 – 1.43) <0.001 1.05 (0.90 – 1.22) 0.55 1.30 (1.14 – 1.49) <0.001 1.37 (1.19 – 1.59) <0.001
Deep White Matter 1.26 (1.10 – 1.44) <0.001 1.13 (0.97 – 1.32) 0.12 1.25 (1.10 – 1.43) <0.001 1.34 (1.16 – 1.55) <0.001
Table 5.2 Relationships between mean SBP on 7 days of Home (HBPM) monitoring vs 24-hour ambulatory (ABPM) monitoring with premorbid SBP,
markers of hypertensive arteriopathy and cerebral leukoaraiosis. Associations with continuous measures are given as univariate R and p-values. Categorical
associations are presented as odds ratios from binary logistic or ordinal regression per 10mmHg increase in SBP. MoCA = Montreal Cognitive Assessment score.
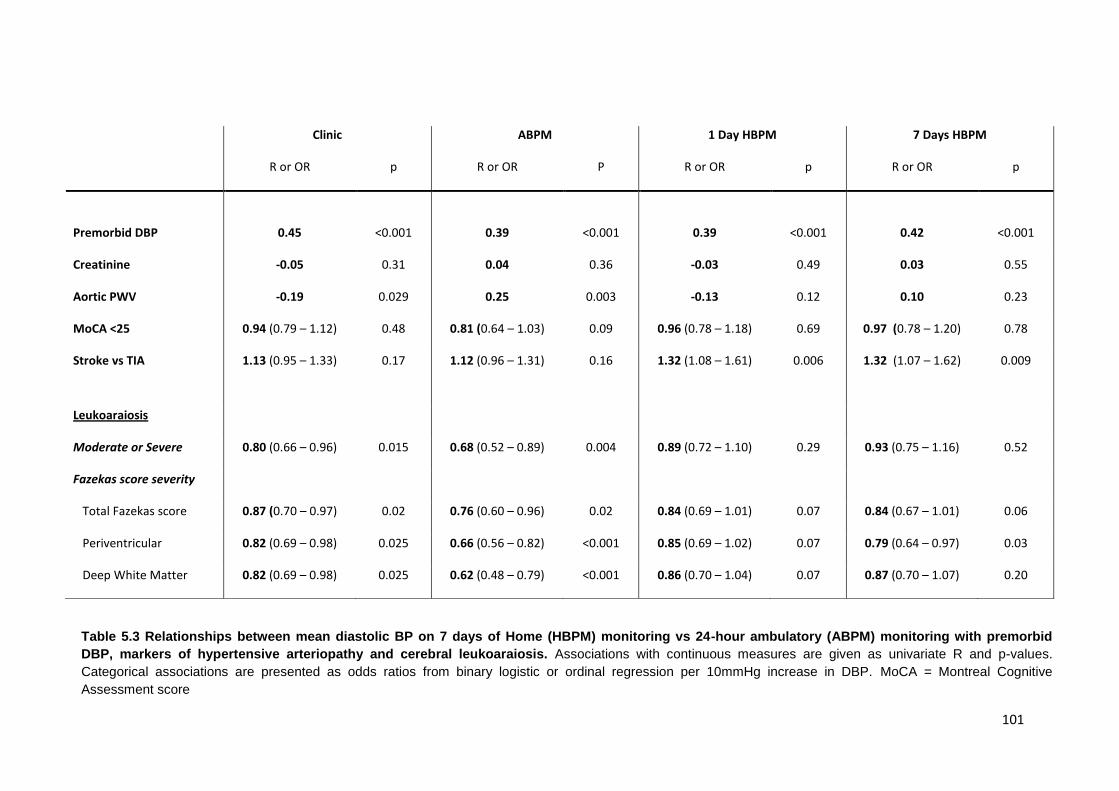
101
Clinic ABPM 1 Day HBPM 7 Days HBPM
R or OR p R or OR P R or OR p R or OR p
Premorbid DBP 0.45 <0.001 0.39 <0.001 0.39 <0.001 0.42 <0.001
Creatinine -0.05 0.31 0.04 0.36 -0.03 0.49 0.03 0.55
Aortic PWV -0.19 0.029 0.25 0.003 -0.13 0.12 0.10 0.23
MoCA <25 0.94 (0.79 – 1.12) 0.48 0.81 (0.64 – 1.03) 0.09 0.96 (0.78 – 1.18) 0.69 0.97 (0.78 – 1.20) 0.78
Stroke vs TIA
1.13 (0.95 – 1.33) 0.17 1.12 (0.96 – 1.31) 0.16 1.32 (1.08 – 1.61) 0.006 1.32 (1.07 – 1.62) 0.009
Leukoaraiosis
Moderate or Severe 0.80 (0.66 – 0.96) 0.015 0.68 (0.52 – 0.89) 0.004 0.89 (0.72 – 1.10) 0.29 0.93 (0.75 – 1.16) 0.52
Fazekas score severity
Total Fazekas score 0.87 (0.70 – 0.97) 0.02 0.76 (0.60 – 0.96) 0.02 0.84 (0.69 – 1.01) 0.07 0.84 (0.67 – 1.01) 0.06
Periventricular 0.82 (0.69 – 0.98) 0.025 0.66 (0.56 – 0.82) <0.001 0.85 (0.69 – 1.02) 0.07 0.79 (0.64 – 0.97) 0.03
Deep White Matter 0.82 (0.69 – 0.98) 0.025 0.62 (0.48 – 0.79) <0.001 0.86 (0.70 – 1.04) 0.07 0.87 (0.70 – 1.07) 0.20
Table 5.3 Relationships between mean diastolic BP on 7 days of Home (HBPM) monitoring vs 24-hour ambulatory (ABPM) monitoring with premorbid
DBP, markers of hypertensive arteriopathy and cerebral leukoaraiosis. Associations with continuous measures are given as univariate R and p-values.
Categorical associations are presented as odds ratios from binary logistic or ordinal regression per 10mmHg increase in DBP. MoCA = Montreal Cognitive
Assessment score
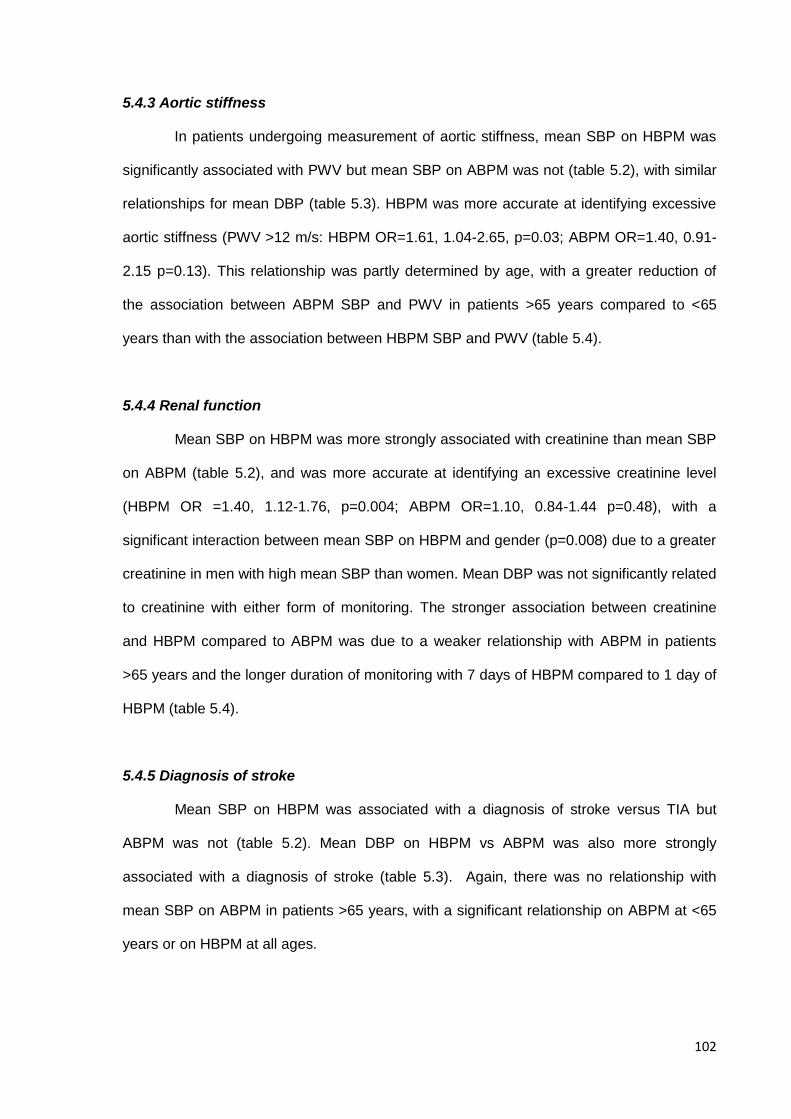
102
5.4.3 Aortic stiffness
In patients undergoing measurement of aortic stiffness, mean SBP on HBPM was
significantly associated with PWV but mean SBP on ABPM was not (table 5.2), with similar
relationships for mean DBP (table 5.3). HBPM was more accurate at identifying excessive
aortic stiffness (PWV >12 m/s: HBPM OR=1.61, 1.04-2.65, p=0.03; ABPM OR=1.40, 0.91-
2.15 p=0.13). This relationship was partly determined by age, with a greater reduction of
the association between ABPM SBP and PWV in patients >65 years compared to <65
years than with the association between HBPM SBP and PWV (table 5.4).
5.4.4 Renal function
Mean SBP on HBPM was more strongly associated with creatinine than mean SBP
on ABPM (table 5.2), and was more accurate at identifying an excessive creatinine level
(HBPM OR =1.40, 1.12-1.76, p=0.004; ABPM OR=1.10, 0.84-1.44 p=0.48), with a
significant interaction between mean SBP on HBPM and gender (p=0.008) due to a greater
creatinine in men with high mean SBP than women. Mean DBP was not significantly related
to creatinine with either form of monitoring. The stronger association between creatinine
and HBPM compared to ABPM was due to a weaker relationship with ABPM in patients
>65 years and the longer duration of monitoring with 7 days of HBPM compared to 1 day of
HBPM (table 5.4).
5.4.5 Diagnosis of stroke
Mean SBP on HBPM was associated with a diagnosis of stroke versus TIA but
ABPM was not (table 5.2). Mean DBP on HBPM vs ABPM was also more strongly
associated with a diagnosis of stroke (table 5.3). Again, there was no relationship with
mean SBP on ABPM in patients >65 years, with a significant relationship on ABPM at <65
years or on HBPM at all ages.
103
Clinic ABPM 1 Day HBPM 7 Days HBPM
R or OR P R or OR P R or OR P R or OR p
Premorbid SBP (mmHg)
< 65 years
> 65 years
0.62
0.44
<0.001
<0.001
0.59
0.23
<0.001
<0.001
0.33
0.32
0.014
<0.001
0.54
0.37
<0.001
<0.001
Creatinine (mmol/L)
< 65 years
> 65 years
0.14
0.09
0.08
0.10
0.16
0.11
0.043
0.07
0.14
0.18
0.065
0.001
0.17
0.21
0.024
<0.001
Aortic PWV (m/s)
< 65 years
> 65 years
0.31
0.17
0.02
0.12
0.17
0.04
0.20
0.71
0.33
0.15
0.014
0.17
0.35
0.17
0.007
0.13
Cognition (MoCA <25)
< 65 years
> 65 years
1.62 (1.24 – 2.11)
1.02 (0.90 – 1.16)
<0.001
0.76
1.48 (1.07 – 2.06)
1.04 (0.86 – 1.24)
0.017
0.71
1.29 (0.97 – 1.71)
1.27 (1.07 – 1.52)
0.08
0.006
1.36 (1.00 – 1.86)
1.34 (1.11 – 1.61)
0.05
0.002
Stroke vs TIA
< 65 years
> 65 years
1.24 (1.00 – 1.53)
1.10 (0.97 – 1.25)
0.049
0.16
1.37 (1.02 – 1.83)
1.02 (0.85 – 1.23)
0.037
0.82
1.47 (1.13 – 1.92)
1.25 (1.07 – 1.47)
0.004
0.006
1.56 (1.16 – 2.08)
1.28 (1.08 – 1.53)
0.003
0.005
Mod/Sev Leukoaraiosis
< 65 years
> 65 years
1.38 (0.98 – 1.95)
1.15 (0.99 – 1.34)
0.07
0.07
0.95 (0.60 – 1.50)
1.10 (0.88 – 1.36)
0.82
0.41
1.43 (0.99 – 2.07)
1.14 (0.97 – 1.33)
0.56
0.10
1.62 (1.04 – 2.53)
1.17 (0.97 – 1.42)
0.031
0.11
Fazekas Score
< 65 years
> 65 years
1.39 (1.12 – 1.72)
1.16 (1.02 – 1.33)
<0.001
0.023
1.11 (0.85 – 1.44)
1.20 (1.00 – 1.45)
0.46
0.76
1.21 (0.94 – 1.54)
1.21 (1.03 – 1.41)
0.14
0.017
1.25 (0.95 – 1.64)
1.30 (1.10 – 1.54)
0.11
0.002
Table 5.4 Relationships between mean SBP on 7 days of Home (HBPM) monitoring vs 24-hour ambulatory (ABPM) monitoring with premorbid SBP,
markers of hypertensive arteriopathy and cerebral leukoaraiosis, in patients over versus under 65 years of age. Associations with continuous measures are
given as univariate R and p-values. Categorical associations are presented as odds ratios from binary logistic or ordinal regression per 10mmHg increase in SBP.
MoCA = Montreal Cognitive Assessment score.
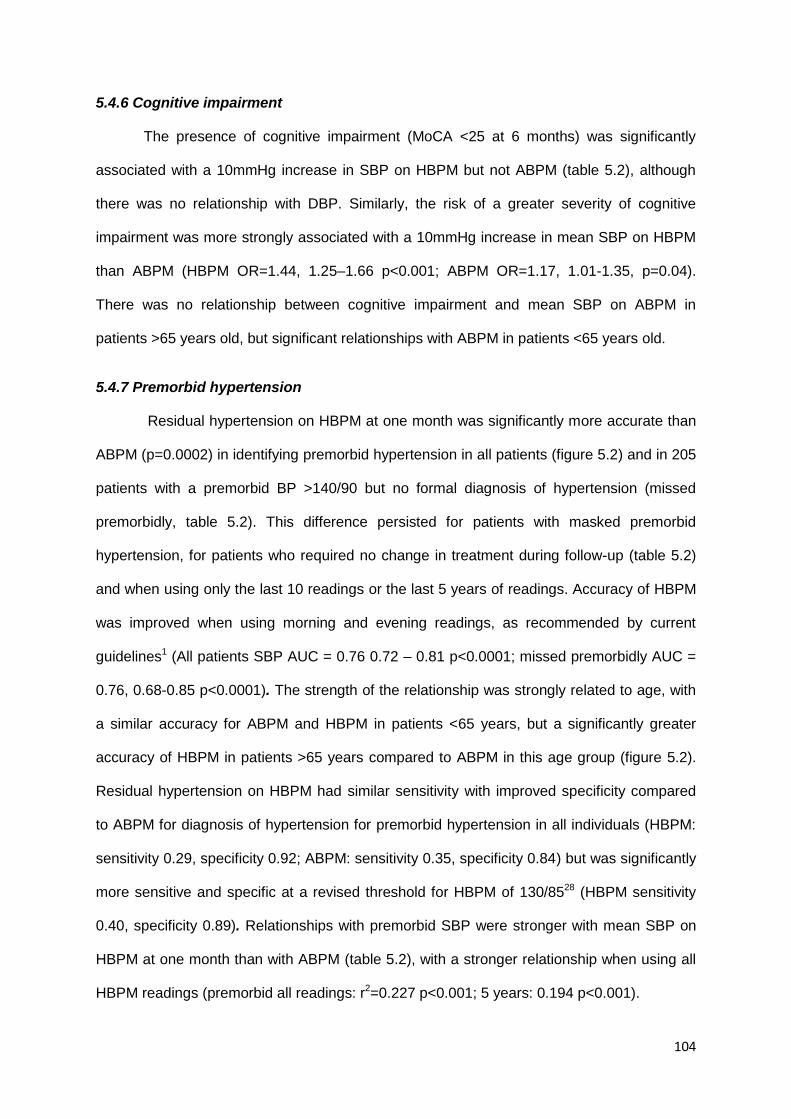
104
5.4.6 Cognitive impairment
The presence of cognitive impairment (MoCA <25 at 6 months) was significantly
associated with a 10mmHg increase in SBP on HBPM but not ABPM (table 5.2), although
there was no relationship with DBP. Similarly, the risk of a greater severity of cognitive
impairment was more strongly associated with a 10mmHg increase in mean SBP on HBPM
than ABPM (HBPM OR=1.44, 1.25–1.66 p<0.001; ABPM OR=1.17, 1.01-1.35, p=0.04).
There was no relationship between cognitive impairment and mean SBP on ABPM in
patients >65 years old, but significant relationships with ABPM in patients <65 years old.
5.4.7 Premorbid hypertension
Residual hypertension on HBPM at one month was significantly more accurate than
ABPM (p=0.0002) in identifying premorbid hypertension in all patients (figure 5.2) and in 205
patients with a premorbid BP >140/90 but no formal diagnosis of hypertension (missed
premorbidly, table 5.2). This difference persisted for patients with masked premorbid
hypertension, for patients who required no change in treatment during follow-up (table 5.2)
and when using only the last 10 readings or the last 5 years of readings. Accuracy of HBPM
was improved when using morning and evening readings, as recommended by current
guidelines1 (All patients SBP AUC = 0.76 0.72 – 0.81 p<0.0001; missed premorbidly AUC =
0.76, 0.68-0.85 p<0.0001). The strength of the relationship was strongly related to age, with
a similar accuracy for ABPM and HBPM in patients <65 years, but a significantly greater
accuracy of HBPM in patients >65 years compared to ABPM in this age group (figure 5.2).
Residual hypertension on HBPM had similar sensitivity with improved specificity compared
to ABPM for diagnosis of hypertension for premorbid hypertension in all individuals (HBPM:
sensitivity 0.29, specificity 0.92; ABPM: sensitivity 0.35, specificity 0.84) but was significantly
more sensitive and specific at a revised threshold for HBPM of 130/8528 (HBPM sensitivity
0.40, specificity 0.89). Relationships with premorbid SBP were stronger with mean SBP on
HBPM at one month than with ABPM (table 5.2), with a stronger relationship when using all
HBPM readings (premorbid all readings: r2=0.227 p<0.001; 5 years: 0.194 p<0.001).
105
Home BP ABPM
AUC (95%CI) p-value AUC (95%CI) p-value p-diff
Any hypertension
All definitions
Prior diagnosis
By premorbid BP
0.732 (0.68 - 0.78)
0.681 (0.63 - 0.73)
0.698 (0.65 - 0.755)
<0.0001
<0.0001
<0.0001
0.595 (0.54 - 0.65)
0.583 (0.53 - 0.64)
0.632 (0.58 - 0.69)
0.002
0.002
<0.0001
0.0002
0.008
0.04
Missed hypertension
Missed premorbidly
Missed in clinic
0.754 (0.66 - 0.85)
0.921 (0.85 – 0.99)
<0.0001
<0.0001
0.586 (0.48 - 0.69)
0.603 (0.39 - 0.82)
0.12
0.49
0.01
0.003
Masked Hypertension 0.798 (0.66 - 0.93) <0.0001 0.741 (0.61 - 0.88) 0.001 0.28
No change in treatment 0.639 (0.51 - 0.77) 0.04 0.549 (0.41 - 0.69) 0.46 0.18
Figure 5.2. Receiver operator characteristic curves for identification of premorbid hypertension by mean
SBP on HBPM vs ABPM, stratified by age. Premorbid hypertension is defined as hypertension reported by the
patient or listed in the primary care record, on treatment for hypertension or mean premorbid SBP >140 or DBP
>90. Results are stratified by age above or below 65 years old.
≤ 65 years old > 65 years old
1 - Specificity 1 - Specificity
Sen
siti
vity
All premorbid hypertension
A) B)
Table 5.5. Accuracy of home versus ambulatory blood pressure monitoring for identification of
premorbid hypertension. Area under the receiver operating characteristic curve is reported for the presence of
premorbid hypertension, defined by the most recent 20 readings before their cerebrovascular event. Missed
hypertension refers to an elevated premorbid mean BP which had not resulted in a diagnosis or treatment for
hypertension, either premorbidly or after the initial clinic assessment. Masked hypertension refers to all patients
with an elevated mean BP premorbidly who were normotensive in clinic.
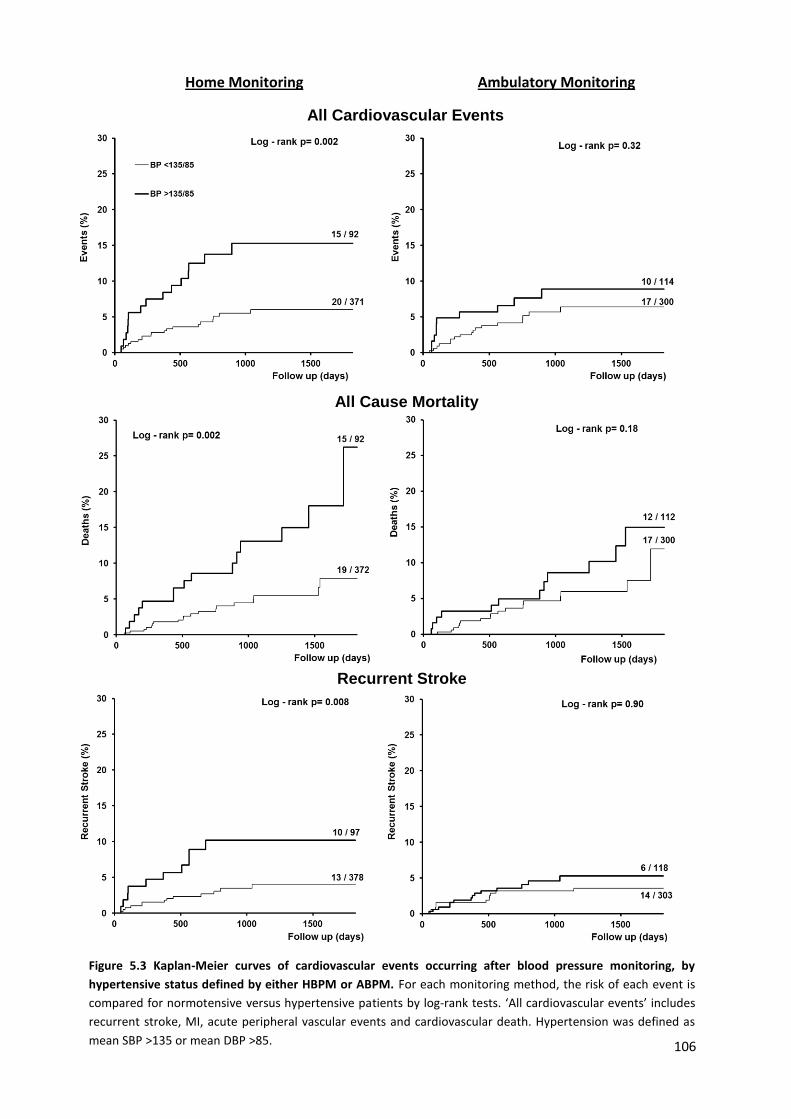
106
Home Monitoring Ambulatory Monitoring
Recurrent Stroke
All Cardiovascular Events
All Cause Mortality
Figure 5.3 Kaplan-Meier curves of cardiovascular events occurring after blood pressure monitoring, by
hypertensive status defined by either HBPM or ABPM. For each monitoring method, the risk of each event is
compared for normotensive versus hypertensive patients by log-rank tests. ‘All cardiovascular events’ includes
recurrent stroke, MI, acute peripheral vascular events and cardiovascular death. Hypertension was defined as
mean SBP >135 or mean DBP >85.
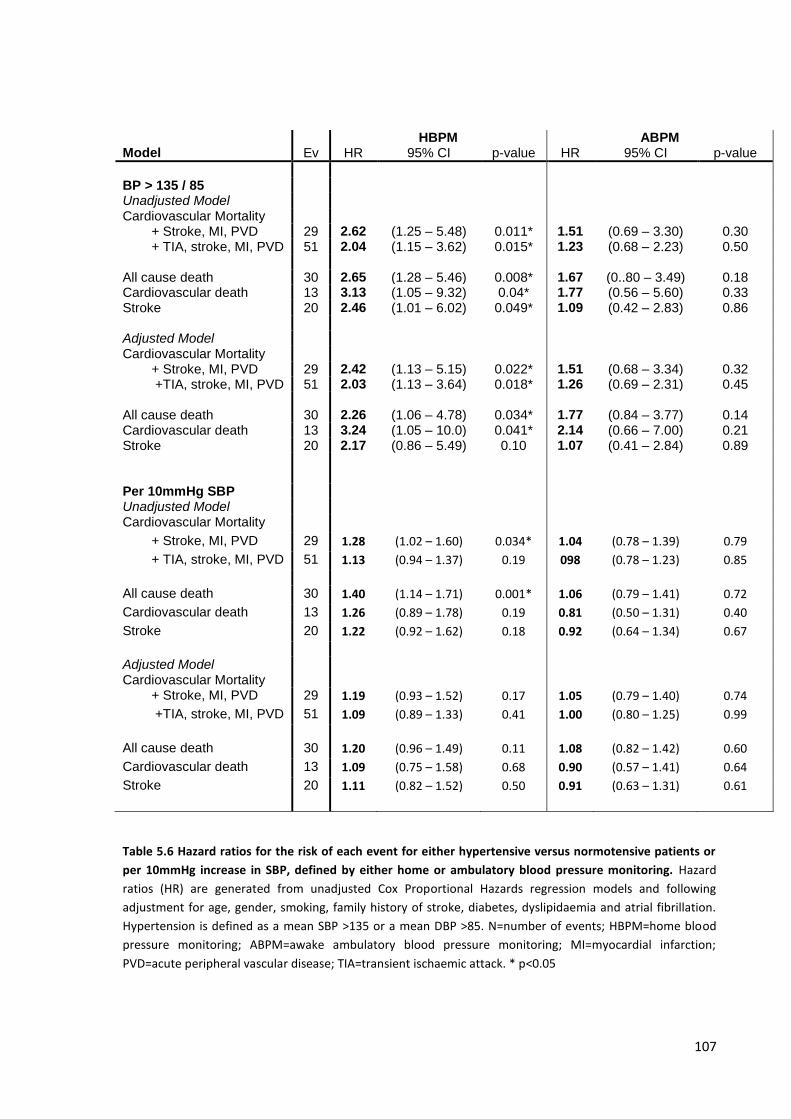
107
Table 5.6 Hazard ratios for the risk of each event for either hypertensive versus normotensive patients or
per 10mmHg increase in SBP, defined by either home or ambulatory blood pressure monitoring. Hazard
ratios (HR) are generated from unadjusted Cox Proportional Hazards regression models and following
adjustment for age, gender, smoking, family history of stroke, diabetes, dyslipidaemia and atrial fibrillation.
Hypertension is defined as a mean SBP >135 or a mean DBP >85. N=number of events; HBPM=home blood
pressure monitoring; ABPM=awake ambulatory blood pressure monitoring; MI=myocardial infarction;
PVD=acute peripheral vascular disease; TIA=transient ischaemic attack. * p<0.05
HBPM ABPM Model Ev HR 95% CI p-value HR 95% CI p-value
BP > 135 / 85 Unadjusted Model Cardiovascular Mortality
+ Stroke, MI, PVD 29 2.62 (1.25 – 5.48) 0.011* 1.51 (0.69 – 3.30) 0.30 + TIA, stroke, MI, PVD 51 2.04 (1.15 – 3.62) 0.015* 1.23 (0.68 – 2.23) 0.50
All cause death 30 2.65 (1.28 – 5.46) 0.008* 1.67 (0..80 – 3.49) 0.18 Cardiovascular death 13 3.13 (1.05 – 9.32) 0.04* 1.77 (0.56 – 5.60) 0.33 Stroke 20 2.46 (1.01 – 6.02) 0.049* 1.09 (0.42 – 2.83) 0.86 Adjusted Model Cardiovascular Mortality
+ Stroke, MI, PVD 29 2.42 (1.13 – 5.15) 0.022* 1.51 (0.68 – 3.34) 0.32 +TIA, stroke, MI, PVD 51 2.03 (1.13 – 3.64) 0.018* 1.26 (0.69 – 2.31) 0.45
All cause death 30 2.26 (1.06 – 4.78) 0.034* 1.77 (0.84 – 3.77) 0.14 Cardiovascular death 13 3.24 (1.05 – 10.0) 0.041* 2.14 (0.66 – 7.00) 0.21 Stroke 20 2.17 (0.86 – 5.49) 0.10 1.07 (0.41 – 2.84) 0.89
Per 10mmHg SBP Unadjusted Model Cardiovascular Mortality
+ Stroke, MI, PVD 29 1.28 (1.02 – 1.60) 0.034* 1.04 (0.78 – 1.39) 0.79
+ TIA, stroke, MI, PVD 51 1.13 (0.94 – 1.37) 0.19 098 (0.78 – 1.23) 0.85
All cause death 30 1.40 (1.14 – 1.71) 0.001* 1.06 (0.79 – 1.41) 0.72
Cardiovascular death 13 1.26 (0.89 – 1.78) 0.19 0.81 (0.50 – 1.31) 0.40
Stroke 20 1.22 (0.92 – 1.62) 0.18 0.92 (0.64 – 1.34) 0.67
Adjusted Model Cardiovascular Mortality
+ Stroke, MI, PVD 29 1.19 (0.93 – 1.52) 0.17 1.05 (0.79 – 1.40) 0.74
+TIA, stroke, MI, PVD 51 1.09 (0.89 – 1.33) 0.41 1.00 (0.80 – 1.25) 0.99
All cause death 30 1.20 (0.96 – 1.49) 0.11 1.08 (0.82 – 1.42) 0.60
Cardiovascular death 13 1.09 (0.75 – 1.58) 0.68 0.90 (0.57 – 1.41) 0.64
Stroke 20 1.11 (0.82 – 1.52) 0.50 0.91 (0.63 – 1.31) 0.61
108
5.5.8 Risk of Recurrent Events
Hypertension (BP >135/85) defined by HBPM vs ABPM was significantly more
predictive of a composite of cardiovascular events and cardiovascular death (figure 5.3 and
table 5.5). Specifically, a diagnosis of hypertension on HBPM or a 10mmHg increase in
SBP was more predictive of the risk of each of all cardiovascular events, stroke,
cardiovascular death and all-cause death than the equivalent measures on ABPM.
Although the predictive value of a diagnosis of hypertension on ABPM was not significant, it
was still more predictive than a diagnosis of hypertension on clinic blood pressure at 1
month (risk of stroke, MI, PVD or CV death: ABPM HR=1.48, 0.68-3.62 vs clinic HR=1.27,
0.56 – 2.92). Again, accuracy of home SBP in predicting risk of stroke was related to
duration of monitoring (risk of stroke, MI, PVD or CV death: 1 day HBPM HR=1.27, 1.05-
1.54; 7 days HBPM OR=1.32, 1.08-1.61; all measures 1.40, 1.14-1.72).
5.6 Discussion
Mean SBP on 7 days of HBPM was more strongly related than mean awake SBP on
ABPM with five markers of hypertensive arteriopathy, premorbid hypertension, and risk of
recurrent events, due mainly to weak associations for ABPM in patients aged ≥65 years of
age, although the superiority of HBPM over ABPM was also partly explained by the longer
time-period of monitoring. Despite an active treatment policy, approximately 20% of patients
still had residual hypertension on 7-day HBPM, with 43% of all recurrent cardiovascular
events occurring in this group.
Although the large difference in predictive value between ABPM and HBPM in this
population is in contrast to previous studies,6-7 the only previous large study directly
comparing prognostic value of HBPM and ABPM was carried out in a primary prevention
setting in participants with a mean age of 50 years and using only a single day of HBPM.6
The different findings may reflect the difference in age of the study populations and the fact
that I used 7 days of monitoring, as is now recommended in current guidelines,1,3 but the
109
physiological validity of HBPM compared to ABPM is supported by the stronger association
with cardiovascular risk factors (creatinine, aortic stiffness) and functionally important
sequelae of hypertension (leukoaraiosis, more prolonged neurological deficit and cognitive
impairment). The greater accuracy of longer duration of monitoring may reflect both
correction for day-to-day variability in blood pressure,17,39 which increases substantially with
age,17 and may allow for greater habituation to testing, reducing both artefactual readings
and limiting the pressor response to BP monitoring which can affect up to the first 10 hours
of ABPM measurements.40-41
This study used a number of methods to validate SBP on HBPM and ABPM
including a practical gold standard (future cardiovascular risk) and historic hypertension,
providing a diagnosis of hypertension independently of this study. It also used five markers
of “hypertensive arteriopathy,” physiological and clinical disease markers known to be
associated with a history of hypertension. However, all five markers are complex
phenotypes with a number of potential causes not necessarily related to hypertension. For
example, leukoaraiosis was historically defined by pathological changes in arterioles and
capillaries in the brain including lipohyalinosis, vessel rarefraction and fibrinoid necrosis.42
However, it is now defined by a heterogeneous pattern of T2 hyperintensities on MRI scans
which are associated with hypertension at the population level,29 but can be seen in
conditions that are not associated with hypertension, such as cerebral amyloid angiopathy,
which has a prevalence between 7-70% in different cohorts, increasing with age.43-44 All five
markers of hypertensive arteriopathy have multifactorial causes, but replicating the
epidemiological associations with hypertension still provides a validation of ABPM and
HBPM SBP, as any association reproduced should reflect hypertension-dependent disease
rather than be confounded by alternative causes of each marker of hypertensive
arteriopathy.
These findings have a number of clinical implications. First, HBPM appears to be
more accurate than clinic BP (the current standard after TIA and stroke)14-16 in identifying
110
clinically relevant residual hypertension after initial assessment, investigation and treatment
in patients with recent minor cerebrovascular events. Furthermore, it is likely that HBPM
would be a more cost-effective option after TIA and stroke, as a recent cost-effectiveness
analysis estimated that the cost of diagnosis per patient for HBPM and ABPM were £39 and
£53 respectively. This analysis found ABPM to be more cost-effective than HBPM only
because it assumed that ABPM was more accurate, however sensitivity analyses
demonstrated a greater cost-effectiveness of HBPM when it was assumed to have at least
equivalent accuracy, as in our study. Second, residual hypertension on HBPM was
common despite intensive monitoring and optimised treatment, identifying a large subgroup
who are at-risk yet potentially treatable. Incidence of residual hypertension was not greater
on HBPM than on ABPM but HBPM classified patients more accurately into at risk groups.
Nonetheless, ABPM still had an equal or greater prognostic value compared to clinic BP.
Third, these results cast doubt on recent cost-effectiveness analyses5 and associated
guidelines.1 In contrast to my findings, these had to assume that differences between
HBPM and ABPM simply reflected inaccuracy of HBPM, due to the dearth of direct
comparisons of the prognostic value of ABPM versus HBPM in the primary prevention
setting. As well as being cheaper,4 HBPM probably increases patient awareness of their
condition and the factors that exacerbate it, although it doesn’t provide information about
nocturnal BP. It may therefore be prudent to do similar studies to this in the primary
prevention setting to validate recent guidelines. Fourth, since the vast majority of new
diagnoses of hypertension are now made in patients >50 years old and current guidelines
recommend ABPM-based diagnosis at all ages, limited accuracy of ABPM in older age
groups is likely to have important clinical and public health implications.
This study does have limitations. Firstly, it was carried out in a high-risk,
cerebrovascular disease population which clearly limits generalizability. However, in the
absence of similar data in other clinical settings, my findings may be of some more general
use. Secondly, I studied HBPM and ABPM performed after 1 month of active treatment,
111
which may limit applicability to newly presenting patients. However, clinical guidelines in
patients with TIA and stroke specifically recommend assessment of risk factor control one
month after initiation of treatment.25 Thirdly, there were significant differences in mean BP
level on HBPM versus ABPM. However, this is consistent with previous studies38 and a
similar number of patients had residual hypertension on HBPM and ABPM, demonstrating
the improved re-classification of patients through the use of HBPM. Fourthly, despite the
significant predictive value of residual hypertension on HBPM, there were a relatively small
number of clinical outcome events (n=51). However, the stronger associations with
hypertensive arteriopathy on HBPM versus ABPM were reliably demonstrated in all 500
patients, consistent with differences in prognostic value. In addition, for associations with
specific outcomes (cardiovascular events or premorbid hypertension), analyses were
limited to patients undergoing both ABPM and HBPM to prevent confounding due to the
small numbers of events. Finally, the longer duration of HBPM may result in greater
habituation to HBPM compared to ABPM, with fewer artefactual elevations in BP due to a
reduced startle or anxiety-related pressor response. It is possible that 7-day ABPM would
perform as well as HBPM, even if a single awake ABPM is based on BP readings made
approximately the same number of times as our 7-day HBPM.
In summary, in this chapter I have demonstrated that residual hypertension on
HBPM at one month after a TIA or minor stroke was more strongly associated with
premorbid hypertensive disease and was the best predictor of the risk of recurrent
cardiovascular events compared to currently recommended methods including awake
ABPM or clinic BP, due probably to greater validity in older patients and to the longer
duration of monitoring, although further research is required to determine the relative
predictive value of nocturnal ABPM. These results suggest that greater use of HBPM in
secondary prevention of cerebrovascular disease will have significant efficacy and cost-
effective benefits in reducing cardiovascular events, and highlight the need for more
research to validate recent guidelines on diagnosis of hypertension in primary prevention.1-3
112
5.7 References
1. National Institute for Health and Clinical Excellence. The clinical management of primary hypertension in adults: clinical guideline 127. NICE; 2011
2. Pickering TG, Miller, NH, Ogedegbe G. Call to Action on Use and Reimbursement for Home Blood Pressure Monitoring: Executive Summary: A Joint Scientific Statement From the American Heart Association, American Society of Hypertension, and Preventive Cardiovascular Nurses Association. Hypertension 2008; 52: 1-9.
3. Mansia G, De Backer G, Dominiczak A, et al.; European Society of Hypertension; European Society of Cardiology. 2007 ESH-ESC Guidelines for the management of arterial hypertension: the task force for the management of arterial hypertension of the European Society of Hypertension (ESH) and of the European Society of Cardiology (ESC). Blood Press 2007; 16: 135-232.
4. Lovibond K, Jowett S, Barton P, et al. Cost-effectiveness of options for the diagnosis of high blood pressure in primary care: a modelling study. Lancet 2011; 378: 1219-30.
5. J Hodgkinson, J Mant, U Martin, Guo B, Hobbs FD, Deeks JJ, et al. Relative effectiveness of clinic and home blood pressure monitoring compared with ambulatory blood pressure monitoring in diagnosis of hypertension: systematic review. BMJ 2011; 342: d3621
6. Fagard RH, Van Den Broeke C, de Cort P. Prognostic significance of blood pressure measured in the office, at home and during ambulatory monitoring in older patients in general practice. Journal of Human Hypertension 2005; 19:801-07.
7. Sega R, Facchetti R, Bombelli M, Cesana G, Corrao G, Grassi G, Mancia G. Prognostic value of ambulatory and home blood pressures compared with office blood pressure in the general population: follow-up results from the Pressioni Arteriose Monitorate e Loro Associazioni (PAMELA) study. Circulation 2005; 111:1777-83
8. Bayo J, Cos FX, Roca C, Dalfo A, Martin-Baranera MM, Albert B. Home blood pressure self-monitoring: diagnostic performance in white-coat hypertension. Blood Pressure Monit 2006; 11:47-52
9. Den Hond E, Celis H, Fagard R, Keary L, Leeman M, O’Brien E, et al. Self-measured versus ambulatory blood pressure in the diagnosis of hypertension. J Hypertens 2003; 21: 717-22
10. Stergiou GS, Skeva II, Baibas NM, Kalkana CB, Roussias LG, Mountokalakis TD. Diagnosis of hypertension using home or ambulatory blood pressure monitoring: comparison with the conventional strategy based on repeated clinic blood pressure measurements. J Hypertens 2000; 18: 1745-51
11. Robitaille C, Dai S, Waters C, Loukine L, Bancej C, Quach S, et al. Diagnosed hypertension in Canada: incidence, prevalence and associated mortality. CMAJ 2012; 184: E49-56
12. PROGRESS Collaborative Group et al. Randomised trial of a perindopril-based blood-pressure lowering regimen among 6105 individuals with previous stroke or transient ischaemic attack. Lancet 2001; 358: 1033-41.
13. PATS Collaborating Group. Post-stroke antihypertensive treatment study: A preliminary result. Chin Med J 1995; 108: 710-17.
14. Intercollegiate Stroke Working Party. National clinical guideline for stroke, 4th edition. London: Royal College of Physicians, 2012.
15. Furie KL, Kasner SE, Adams RJ, Albers GW, Bush RL, Fagan SC et al. Guidelines for the prevention of stroke in patients with stroke or transient ischaemic attack: A guideline for healthcare professionals from the American Heart Association/American Stroke Association. Stroke 2011: 42: 227-76.
16. The European Stroke Organization (ESO) Executive Committe. Guidelines for management of ischaemic stroke and transient ischaemic attack. ESO 2008.
17. Rothwell PM, Howard SC, Dolan E, O’Brien E, Dobson JE, Dahlof B, et al. Prognostic significance of visit-to-visit variability, maximum systolic BP, and episodic hypertension. Lancet 2010; 375: 895-905.
18. Glader EL, Sjölander M, Eriksson M, Lundberg M. Persistent use of secondary preventive drugs declines rapidly during the first 2 years after stroke. Stroke 2010; 41: 397-401
19. FV. Compliance with antihypertensive treatment. Clin Exp Hypertens. 1996; 18: 463-72 20. Elliott WJ. What factors contribute to the inadequate control of elevated blood pressure? J
Clin Hypertens (Greenwich) 2008; 10: 20-26. 21. Kettani FZ, Dragomir A, Cote R, Roy L, Bérard A, Blais L, et al. Impact of better adherence
to antihypertensive agents on cerebrovascular disease for primary prevention. Stroke 2009; 40: 213-20
http://www.ncbi.nlm.nih.gov/pubmed?term=Dominiczak%20A%5BAuthor%5D&cauthor=true&cauthor_uid=17846925
http://www.ncbi.nlm.nih.gov/pubmed?term=European%20Society%20of%20Cardiology%5BCorporate%20Author%5D
http://www.ncbi.nlm.nih.gov/pubmed?term=European%20Society%20of%20Cardiology%5BCorporate%20Author%5D
113
22. Mazzaglia G, Ambrosioni E, Alacqua M, Filippi A, Sessa E, Immordino V, et al. Adherence to antihypertensive medications and cardiovascular morbidity among newly diagnosed hypertensive patients. Circulation 2009; 120: 1598-1605
23. Feldman R, Bacher M, Campbell N, Drover A, Chockalingam A. Adherence to pharmacologic management of hypertension. Can J Public Health 1998; 89: I16-I18
24. Schroeder K, Fahey T, Ebrahim S. How can we improve adherence to blood pressure-lowering medication in ambulatory care? Systematic review of randomized controlled trials. Arch Intern Med 2004; 164: 722-32
25. Department of Health, UK. National Stroke Strategy. London: DH. 2007. 26. Cuff e RL, Howard SC, Algra A, Warlow CP, Rothwell PM. Medium-term variability of BP and
potential underdiagnosis of hypertension in patients with previous transient ischemic attack or minor stroke. Stroke 2006; 37: 2776–83.
27. Udani SM, Kovner JL. Effect of blood pressure lowering on markers of kidney disease progression. Curr Hypertens Rep 2009; 11: 368-74.
28. Vlachopoulos C, Aznaouridis K, Stefanadis C. Prediction of cardiovascular events and all-cause mortality with arterial stiffness: a systematic review and meta-analysis. J Am Coll Cardiol 2010; 55: 1318-27.
29. Khan U, Porteous L, Hassan A, Markus HS. Risk factor profile of cerebral small vessel disease and its subtypes. JNNP 2007; 78: 702-6.
30. Qiu C, Winblad B, Fratiglioni L. The age-dependent relation of blood pressure to cognitive function and dementia. Lancet Neurol 2005; 4: 487-499.
31. P M Rothwell, A J Coull, M F Giles, S C Howard, L E Silver, L M Bull, et al., for the Oxford Vascular Study. Change in stroke incidence, mortality, case-fatality, severity, and risk factors in Oxfordshire, UK from 1981 to 2004 (Oxford Vascular Study). Lancet 2004; 363: 1925–33
32. Rothwell PM, Giles MF, Chandratheva A, Marquardt L, Geraghty O, Redgrave JN et al. Effect of urgent treatment of transient ischaemic attack and minor stroke on early recurrent stroke (EXPRESS study). Lancet 2007; 370: 1432–42
33. Webb AJ, Simoni M, Mazzucco S, Kuker W, Schulz U, Rothwell PM. Increased cerebral arterial pulsatility in patients with leukoaraiosis: arterial stiffness enhances transmission of aortic pulsatility. Stroke 2012; 43: 2631-6.
34. Pendlebury ST, Cuthbertson FC, Welch SJ, Mehta Z, Rothwell PM. Underestimation of cognitive impairment by Mini-Mental State Examination versus the Montreal Cognitive Assessment in patients with transient ischaemic attack and stroke. Stroke 2010; 41: 1290-3.
35. Pantoni L, Simoni M, Pracucci G, Schmidt R, Barkhof F, Inzitari D. Visual rating scales for age-related white matter changes leukoaraiosis): can the heterogeneity be reduced? Stroke 2002; 33: 2827–33.
36. Simoni M, Li L, Paul NL, Gruter BE, Schulz UG, Kuker W, Rothwell PM. Age- and sex-specific rates of leukoaraiosis in TIA and stroke patients. Neurology 2012; 79: 1215-22.
37. Casadei R, Parati G, Pomidossi G, Gropelli A, Trazzi S, Di Rienzo M, Mancia G. 24-Hour blood pressure monitoring: evaluation of Spacelabs 5300 monitor by comparison with intra-arterial blood pressure recording in ambulant subjects. J Hypertens 1988; 6: 797-803.
38. Niiranen TJ, Asayama K, Thijs L, Johansson JK, Ohkubo T, Kikuya M, et al. for the International Database of HOme blood pressure in relation to Cardiovascular Outcome Investigators. e-Driven Thresholds for Home Blood Pressure Measurement Hypertension 2013; 61: 27-34.
39. Warren RE, Marshall T, Padfield PL, Chrubaski S. Variability of office, 24-hour ambulatory, and self-monitored blood pressure measurements. Br J Gen Pract 2010; 60: 675-80.
40. Calvo C. Hermida RC, Ayala DE, Lopez JE, Fernandez JR, Dominguez MJ, et al. The ‘ABPM effect’ gradually decreases but does not disappear in successive sessions of ambulatory monitoring. J Hypertens 2003; 21: 2265-73.
41. Hermida RC, Calvo C, Ayala DE, Fernandez JR, Ruilope LM, Lopez JE. Evaluation of the extent and duration of the “ABPM Effect” in hypertensive patients. J Am Coll Card. 2002; 40 (4):710-717.
42. Fisher CM. The arterial lesions underlying lacunes. Acta Neuropathol (Berl) 1968; 12: 1–15. 43. Tanskanen M, Mäkelä M, Myllykangas L, Notkola IL, Polvikoski T, Sulkava R, Kalimo H,
Paetau A. Prevalence and severity of cerebral amyloid angiopathy: a population-based study on very elderly Finns (Vantaa 85+). Neuropathol Appl Neurobiol. 2012; 38(4):329-36
44. Matthews FE, Brayne C, Lowe J, McKeith I, Wharton SB, Ince P. Epidemiological pathology of dementia: attributable-risks at death in the Medical Research Council Cognitive Function and Ageing Study. PLoS Med. 2009; 6(11):e1000180.
http://www.ncbi.nlm.nih.gov/pubmed?term=Stefanadis%20C%5BAuthor%5D&cauthor=true&cauthor_uid=20338492
http://www.ncbi.nlm.nih.gov/pubmed?term=Johansson%20JK%5BAuthor%5D&cauthor=true&cauthor_uid=23129700
114
CHAPTER SIX
Validity of day-to-day variability and maximum systolic blood
pressure on multi-day home versus single-day ambulatory
monitoring: frequency versus duration?
6.1 Summary 115
6.2 Introduction 116
6.3 Methods 117
6.3.1 Procedures 117
6.3.2 Analysis 118
6.3.3 Statistical analysis 119
6.4 Findings 120
6.4.1 Study population 120
6.4.2 Association between variability and maximum BP with clinical characteristics 121
6.4.3 Clinical determinants of variability and maximum SBP 123
6.4.4 Distribution of variability and maximum SBP by age and gender 123
6.4.5 Associations of premorbid variability and maximum BP with ABPM and HBPM 127
6.4.6 Associations of variability and maximum SBP with hypertensive arteriopathy 129
6.4.7 Predictive value of variability and maximum BP for cardiovascular events 129
6.4.8 Relative predictive values of mean, maximum and variability in SBP 131
6.5 Discussion 133
6.6 References 137
115
6.1 Summary
Blood pressure variability and maximum BP predict stroke independently of mean
BP on clinic visit-to-visit and home day-to-day monitoring (HBPM), but not on 24-hr
ambulatory monitoring (ABPM), but their physiological and clinical validity are questioned.
Therefore I determined the validity of variability and maximum SBP on HBPM versus
ABPM.
Among 500 consecutive patients with TIA or minor stroke (Oxford Vascular Study),
the coefficient of variation (CV=standard deviation / mean) and maximum SBP on 1 month
home monitoring (3 readings, 3 times daily) versus awake ABPM at 1 month were more
strongly associated with clinical characteristics (CV: r2=0.201 p<0.001 vs 0.07 p=0.001;
max: 0.167 p<0.001 vs 0.03 p=0.47), 20 pre-event BP readings (CV: r=0.14 p=0.003 vs
0.06 p=0.24; max: 0.43 p<0.001 vs 0.12 p=0.02), and hypertensive arteriopathy
(leukoaraiosis: CV OR=1.32 p<0.001 vs 1.04 p=0.12; Max: 1.27 p<0.001 vs 1.02 p=0.58).
Max and CV SBP on HBPM versus ABPM were stronger predictors of all-cause mortality
(per 10mmHg: 1.22, 1.04-1.43 vs 1.04, 0.87-1.25; per 1%CV: 1.22, 1.02-1.46 vs 0.99, 0.92-
1.12), and cardiovascular events (max: 1.21, 1.03-1.43 vs 1.12, 0.95-1.32). Associations
were stronger for All-days vs 7-day vs 1-day HBPM (CV-SBP: risk factors r2: 0.20 vs 0.13
vs 0.09; leukoaraiosis: 1.32 vs 1.20 vs 1.10; cardiovascular events: 1.14 vs 1.11 vs 0.97).
CV and max SBP were stronger predictors than mean SBP (mortality: CV 1.71 p=0.001;
max 1.78 p<0.001; mean 1.53 p=0.003; CV events: CV 1.39 p=0.045; Max 1.61 p=0.002;
Mean 1.47 p=0.009).
The validity of day-to-day variability and maximum SBP on HBPM compared to
ABPM was demonstrated by stronger associations with clinical characteristics, hypertensive
arteriopathy and cardiovascular events, due in part to duration of monitoring.
116
6.2 Introduction
Awake systolic blood pressure (SBP) variability on ABPM predicts the future risk of
cardiovascular events,1, 2 is associated with clinical characteristics3, 4 and identifies
physiologically-determined blood pressure pathology such as the ‘morning surge’.5
Unfortunately, despite the greater predictive value of mean BP on ABPM compared to clinic
readings, awake SBP variability on ABPM has a relatively weak predictive value1 and a lack
of variability-specific treatment options has limited its translation into clinical practice.
Furthermore, maximum blood pressure attained on ABPM has not been specifically
investigated in a large prospective study.
In contrast to variability and maximum BP on ABPM, episodic hypertension,
maximum SBP and visit-to-visit variability in SBP in clinic6, 7 were strong predictors of
incident and recurrent cardiovascular events in 5 large cohorts.8 Compared to atenolol-
based regimens, treatment with an amlodipine-based regimen in ASCOT-BPLA or a
thiazide diuretic in the MRC-2 study8 reduced variability and maximum SBP and hence
stroke risk, with similar drug effects in meta-analyses of all published studies.9-11 The
prognostic significance of visit-to-visit variability in SBP has subsequently been
independently confirmed2,12,13 but only one report has demonstrated a strong relationship
between maximum SBP and end-organ damage compared to mean SBP,14 and no reports
have addressed the relationship with cardiovascular events.
Recent guidelines have not identified variability and maximum SBP as treatment
targets,15-17 partly because their validity as a marker of physiologically determined
pathology is doubted, with poor medication adherence and measurement artefact cited as
likely explanations for their clinical effects.18 ABPM remains the recommended method of
assessing blood pressure, despite a lack of comparative evidence as described in chapter
5,15 and the assumed physiological precision of ABPM in charting an individual’s diurnal BP
variation results in its continued use to assess SBP variability.19 However, single-day ABPM
has limitations: it cannot assess day-to-day SBP variability, which may have an
independent physiological basis; short-term sampling with ABPM is more likely to miss
117
significant episodic peaks occurring less frequently than daily; and ABPM may be more
prone to measurement artefacts due to less time to habituate to readings.20, 21
Therefore, in a high-risk population with TIA or minor stroke I compared the clinical
and physiological validity of variability in SBP and maximum SBP on 1 month of day-to-day
home versus single-day ABPM readings by comparison with clinical characteristics,
premorbid readings, markers of hypertensive arteriopathy and the risk of clinical events and
determined to what extent these relationships depended on duration of monitoring.
6.3 Methods
6.3.1 Procedures
This analysis was carried out in the same population as that studied in Chapter 5,
with consecutive patients recruited between April 2008 and January 2012 from the Oxford
Vascular Study’s (OXVASC)22 TIA and minor stroke clinic, usually within twenty-four hours
of referral.23 Again, clinic BP was measured at ascertainment and the one month follow-up
visit in the non-dominant arm, by trained personnel, in the sitting position after five minutes
of rest, with two measurements made 5 minutes apart. From the ascertainment visit, or the
earliest opportunity after discharge, all patients performed sets of three home BP readings
(HBPM), three times daily (on waking, mid-morning at ~10-11am and before sleep) with a
Bluetooth-enabled, regularly-calibrated, telemetric BP monitor. At the 1 month follow-up
visit, awake ambulatory measurements (ABPM) were performed with an A&D TM-2430
monitor in the non-dominant arm, fitted by a trained study nurse, at 30 minute intervals
during the day and 60 minute intervals at night.
Patients were asked to continue home monitoring until at least the one month
follow-up appointment. Mean BP was treated to a target of <130/80 on home monitoring or
mean ABPM, except in the minority of patients with haemodynamically significant stenosis
(bilateral carotid stenosis >70% or end-artery stenosis >70%) when targets were
determined on an individual basis. Choice of antihypertensive agent was tailored to the
individual patient but usual first-line treatment was a combination of perindopril arginine
118
5mg and indapamide 1.25mg, followed by amlodipine 5mg, then amlodipine 10mg, with
subsequent choices at the physician’s discretion.
For this analysis, markers of hypertensive arteriopathy included creatinine (mmol/L),
a diagnosis of stroke vs TIA, aortic stiffness (PWV=pulse wave velocity, m/s) and cerebral
white matter disease (leukoaraiosis). Associations between BP variability and cognitive
impairment are complex and prone to effects of reverse causation, and therefore were not
assessed. Carotid-femoral PWV was assessed in a subgroup of 150 patients by
applanation tonometry (Sphygmocor, AtCor Medical, Sydney, Australia), either at the acute
assessment or at one month, taking the average of two acceptable measures (SD<2).
Leukoaraiosis was assessed on axial T2 scans, scored according to a modified version of
the Fazekas scale24 by experienced observers (M Simoni/L Li) and on the simple 4 point
Oxford scale: ‘None’, ‘Mild,’ ‘Moderate’ or ‘Severe’ (see chapter 5). This score was then
dichotomised into either the presence or absence of advanced leukoaraiosis (moderate or
severe versus mild or none).
Recurrent cardiovascular events were identified by multiple overlapping methods of
ascertainment,22 including face-to-face interviews to identify symptoms consistent with
either a TIA, stroke, myocardial infarction or acute peripheral vascular event at each follow-
up. Where possible, all patients with potential recurrent events were reviewed by a study
physician and subsequently discussed with the principal investigator (PR) and a panel of
stroke neurologists and physicians for verification of diagnosis and aetiological
classification.
6.3.2 Analysis
In contrast to chapter 5, which aimed to compare the validity of HBPM and ABPM as
recommended by current guidelines, in this analysis the aim was to derive the best
available estimates of BP variability and maximum SBP. Therefore, home SBP and DBP
were derived from all readings acquired from 7 days after the recruitment visit (to reduce
acute treatment effects) until readings were not performed on at least 3 days of the week,
119
the monitor was returned or 90 days had elapsed, with the average of the last two readings
of each BP cluster used to derive BP indices. Analyses were performed using all readings,
or the 7 days or 1 day of readings just prior to the ABPM. As in chapter 5, SBP and DBP on
ABPM were derived for awake readings following automated and manual exclusion of
artefactual measurements according to predefined criteria,25 whilst premorbid SBP and
DBP were derived from up to the last 20 readings recorded in the lifetime primary care
record. For each method of measurement, mean, minimum and maximum SBP and DBP
were derived, whilst variability in SBP and DBP was determined as the coefficient of
variation (CV =standard deviation / mean). On HBPM, CV was calculated as the residual
CV (rCV) about a 9 day moving average rather than the global mean to remove slow
variations in blood pressure due to changes in treatment. Finally, the frequency-dependent
variation in BP was measured from the power spectrum of all clusters, interpolated by a
cubic spline to a continuous sampling rate, for greater than weekly (<0.12 cycles / day),
weekly (0.12-0.25 cyc/day), day-to-day (0.25-0.75 cyc/day) and diurnal (0.75-1.2 cyc/day)
periods.
6.3.3 Statistical analysis
Gender differences in demographic characteristics were identified by chi-squared
tests for discrete variables and t-tests for continuous variables. Unadjusted differences in
BP indices between discrete patient groups were assessed by t-tests or ANOVA, whilst
univariate correlations with continuous demographic indices were measured by linear
regression. The overall strength of association between BP indices and all clinical
characteristics were determined by general linear models (GLM, SPSS sum of squares type
IV) including age, gender, BMI, atrial fibrillation (premorbid or diagnosed within 6 weeks of
the event), current smoking and history of myocardial infarction, diabetes, hyperlipidaemia,
cardiac failure or family history of stroke, with or without an interaction term between age
and gender. Secondly, the distribution of BP indices across the population was determined
by stratification into gender and 5 quintiles of age. Finally, relationships with premorbid
120
hypertension and markers of hypertensive arteriopathy were determined by linear
regression for continuous estimates, by binary logistic regression for dichotomous
measures (stroke vs TIA, advanced leukoaraiosis) and by ordinal regression (Fazekas
score, total markers of hypertensive arteriopathy).
The risk of recurrent cardiovascular events per 10mmHg increase in maximum SBP
or 1% increase in CV-SBP on ABPM or HBPM was assessed by Cox Proportional Hazards
Regression to determine Hazard Ratios (HR), unadjusted and adjusted for age, gender,
diabetes, smoking, family history and hyperlipidaemia. Recurrent events identified included
probable or definite stroke, myocardial infarction, acute peripheral vascular events (ruptured
abdominal aortic aneurysm or acute limb ischaemia), cardiovascular death or death of any
cause. A composite outcome measure included TIA, stroke, myocardial infarction, acute
peripheral vascular events and cardiovascular death.
6.4 Findings
6.4.1 Study population
This analysis was performed in the same 500 patients investigated in chapter 5.
Patient characteristics are shown in table 5.1. As expected, there were strong associations
between mean, minimum and maximum SBP within each BP measurement method and
significant associations for these measures between BP measurement methods, but CV
SBP was not correlated with mean SBP, whilst maximum SBP was correlated with both CV-
SBP and mean SBP (table 6.1).
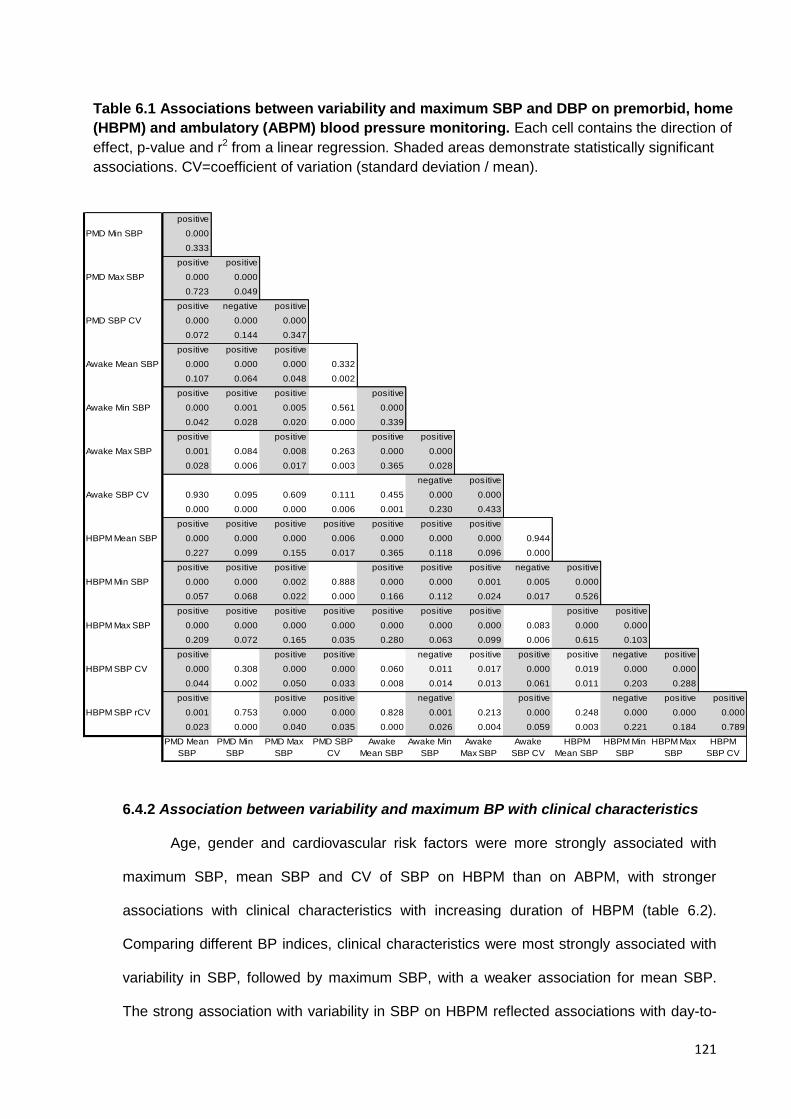
121
6.4.2 Association between variability and maximum BP with clinical characteristics
Age, gender and cardiovascular risk factors were more strongly associated with
maximum SBP, mean SBP and CV of SBP on HBPM than on ABPM, with stronger
associations with clinical characteristics with increasing duration of HBPM (table 6.2).
Comparing different BP indices, clinical characteristics were most strongly associated with
variability in SBP, followed by maximum SBP, with a weaker association for mean SBP.
The strong association with variability in SBP on HBPM reflected associations with day-to-
positive
PMD Min SBP 0.000
0.333
positive positive
PMD Max SBP 0.000 0.000
0.723 0.049
positive negative positive
PMD SBP CV 0.000 0.000 0.000
0.072 0.144 0.347
positive positive positive
Awake Mean SBP 0.000 0.000 0.000 0.332
0.107 0.064 0.048 0.002
positive positive positive positive
Awake Min SBP 0.000 0.001 0.005 0.561 0.000
0.042 0.028 0.020 0.000 0.339
positive positive positive positive
Awake Max SBP 0.001 0.084 0.008 0.263 0.000 0.000
0.028 0.006 0.017 0.003 0.365 0.028
negative positive
Awake SBP CV 0.930 0.095 0.609 0.111 0.455 0.000 0.000
0.000 0.000 0.000 0.006 0.001 0.230 0.433
positive positive positive positive positive positive positive
HBPM Mean SBP 0.000 0.000 0.000 0.006 0.000 0.000 0.000 0.944
0.227 0.099 0.155 0.017 0.365 0.118 0.096 0.000
positive positive positive positive positive positive negative positive
HBPM Min SBP 0.000 0.000 0.002 0.888 0.000 0.000 0.001 0.005 0.000
0.057 0.068 0.022 0.000 0.166 0.112 0.024 0.017 0.526
positive positive positive positive positive positive positive positive positive
HBPM Max SBP 0.000 0.000 0.000 0.000 0.000 0.000 0.000 0.083 0.000 0.000
0.209 0.072 0.165 0.035 0.280 0.063 0.099 0.006 0.615 0.103
positive positive positive negative positive positive positive negative positive
HBPM SBP CV 0.000 0.308 0.000 0.000 0.060 0.011 0.017 0.000 0.019 0.000 0.000
0.044 0.002 0.050 0.033 0.008 0.014 0.013 0.061 0.011 0.203 0.288
positive positive positive negative positive negative positive positive
HBPM SBP rCV 0.001 0.753 0.000 0.000 0.828 0.001 0.213 0.000 0.248 0.000 0.000 0.000
0.023 0.000 0.040 0.035 0.000 0.026 0.004 0.059 0.003 0.221 0.184 0.789
PMD Mean
SBP
PMD Min
SBP
PMD Max
SBP
PMD SBP
CV
Awake
Mean SBP
Awake Min
SBP
Awake
Max SBP
Awake
SBP CV
HBPM
Mean SBP
HBPM Min
SBP
HBPM Max
SBP
HBPM
SBP CV
Table 6.1 Associations between variability and maximum SBP and DBP on premorbid, home
(HBPM) and ambulatory (ABPM) blood pressure monitoring. Each cell contains the direction of
effect, p-value and r2 from a linear regression. Shaded areas demonstrate statistically significant
associations. CV=coefficient of variation (standard deviation / mean).
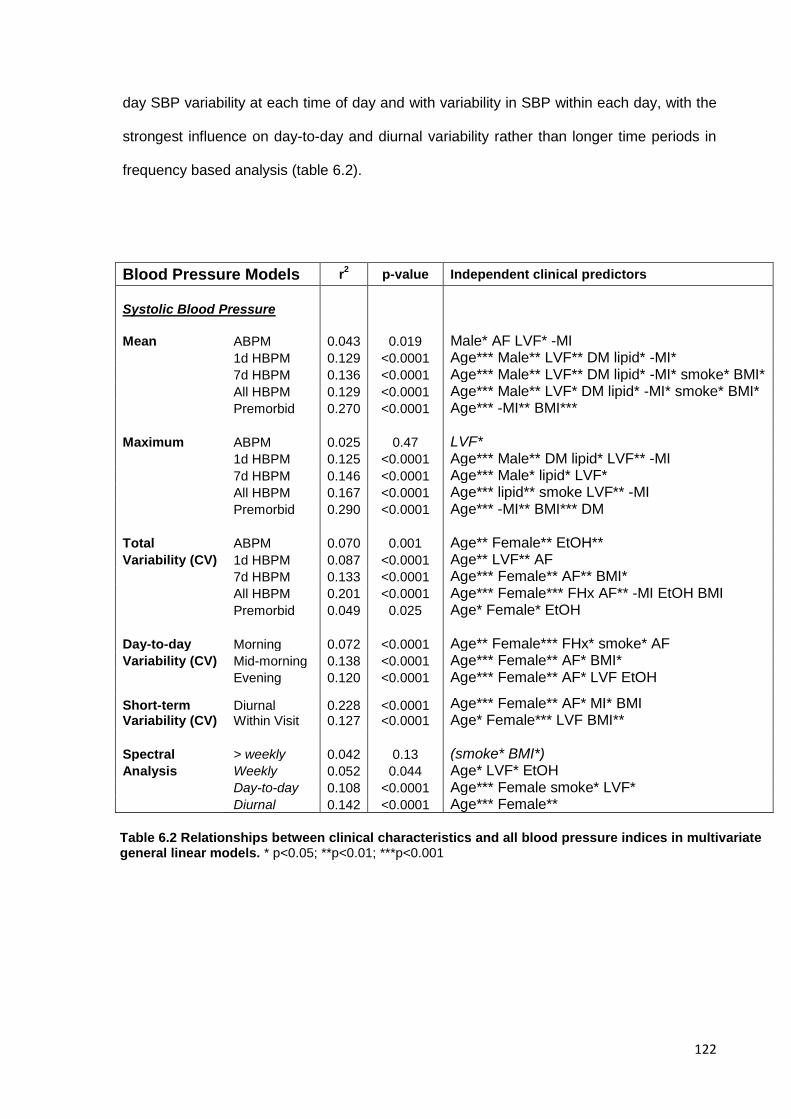
122
day SBP variability at each time of day and with variability in SBP within each day, with the
strongest influence on day-to-day and diurnal variability rather than longer time periods in
frequency based analysis (table 6.2).
Blood Pressure Models r2
p-value Independent clinical predictors
Systolic Blood Pressure
Mean ABPM 0.043 0.019 Male* AF LVF* -MI 1d HBPM 0.129 <0.0001 Age*** Male** LVF** DM lipid* -MI* 7d HBPM 0.136 <0.0001 Age*** Male** LVF** DM lipid* -MI* smoke* BMI* All HBPM 0.129 <0.0001 Age*** Male** LVF* DM lipid* -MI* smoke* BMI* Premorbid 0.270 <0.0001 Age*** -MI** BMI*** Maximum ABPM 0.025 0.47 LVF* 1d HBPM 0.125 <0.0001 Age*** Male** DM lipid* LVF** -MI 7d HBPM 0.146 <0.0001 Age*** Male* lipid* LVF* All HBPM 0.167 <0.0001 Age*** lipid** smoke LVF** -MI Premorbid 0.290 <0.0001 Age*** -MI** BMI*** DM Total ABPM 0.070 0.001 Age** Female** EtOH** Variability (CV) 1d HBPM 0.087 <0.0001 Age** LVF** AF 7d HBPM 0.133 <0.0001 Age*** Female** AF** BMI* All HBPM 0.201 <0.0001 Age*** Female*** FHx AF** -MI EtOH BMI Premorbid 0.049 0.025 Age* Female* EtOH Day-to-day Morning 0.072 <0.0001 Age** Female*** FHx* smoke* AF Variability (CV) Mid-morning 0.138 <0.0001 Age*** Female** AF* BMI* Evening 0.120 <0.0001 Age*** Female** AF* LVF EtOH
Short-term Variability (CV)
Diurnal Within Visit
0.228 0.127
<0.0001 <0.0001
Age*** Female** AF* MI* BMI Age* Female*** LVF BMI**
Spectral > weekly 0.042 0.13 (smoke* BMI*) Analysis Weekly 0.052 0.044 Age* LVF* EtOH Day-to-day 0.108 <0.0001 Age*** Female smoke* LVF* Diurnal 0.142 <0.0001 Age*** Female**
Table 6.2 Relationships between clinical characteristics and all blood pressure indices in multivariate general linear models. * p<0.05; **p<0.01; ***p<0.001
123
6.4.3 Clinical determinants of variability and maximum SBP
Age was the strongest determinant of both maximum SBP and DBP and variability
in SBP and DBP on home and premorbid readings in univariate analyses (table 6.3) and in
multivariate models (table 6.2). However, although age was associated with variability in
SBP on ABPM, it was not associated with mean or maximum SBP on ABPM. Gender was
the next strongest predictor of all BP indices, but male gender was associated with a
greater mean and maximum SBP, whilst female gender predicted greater variability in SBP.
In addition to age and gender, AF determined day-to-day variability in SBP, whilst heart
failure was a strong predictor of maximum SBP.
6.4.4 Distribution of variability and maximum SBP by age and gender
Given the strong relationship with age and gender, BP indices were determined
stratified by gender and quintiles of age (figure 6.1). For HBPM and premorbid visit-to-visit
readings, this demonstrated a well defined increase with age for maximum SBP and
variability in SBP for both genders, but with greater variability in SBP in women at every
age. This was predominantly due to a greater age-associated increase in maximum SBP
compared to the increase in mean and minimum SBP, although with a greater increase in
women than men. However, the relationship between age and variability in SBP or
maximum SBP was less well defined on ABPM, especially for women, with an excess
variability in younger women compared to men (figure 6.1). Mean, minimum and maximum
DBP fell with increasing age with no significant difference between genders (figure 6.1). In
contrast, variability in DBP increased with age as for SBP but this trend was better defined
on HBPM and premorbid visit-to-visit variability than ABPM, again with a non-significant
increase in variability in the youngest women compared to men on both ABPM and HBPM.
Day-to-day readings after waking, mid-morning and in the evening demonstrated variations
in maximum blood pressure that were similar to analyses using all timepoints (figure 6.2).
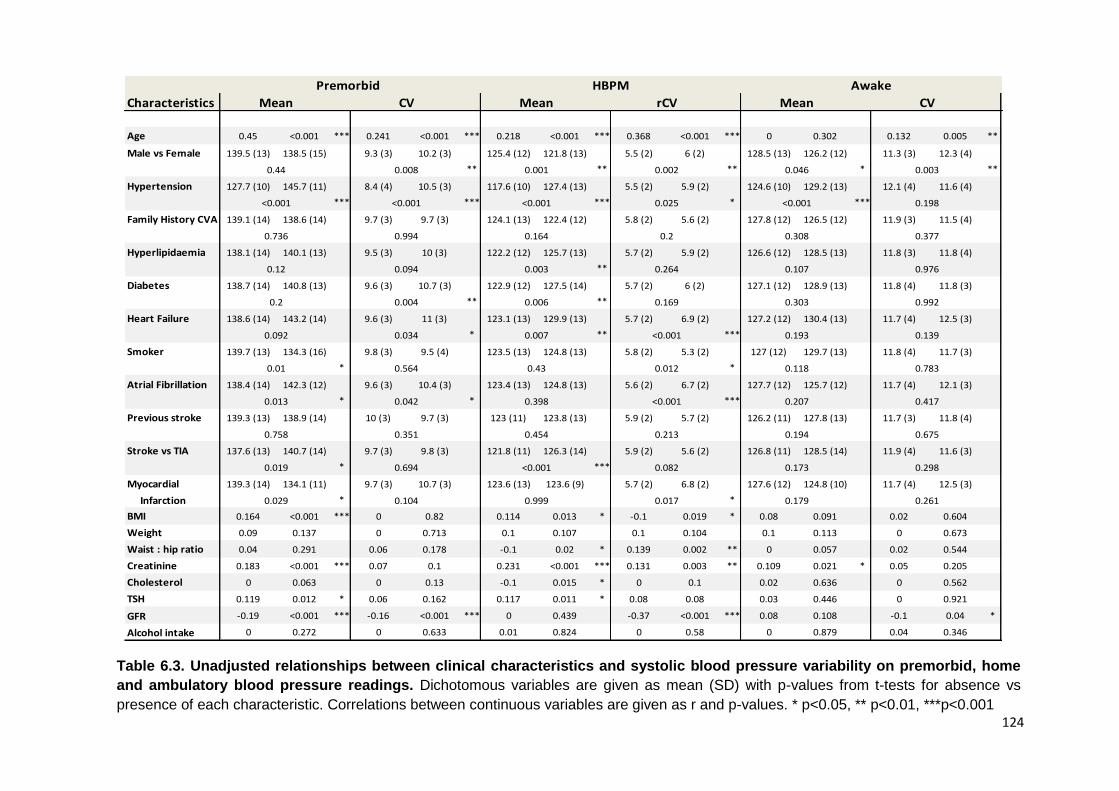
124
Characteristics
Age 0.45 <0.001 *** 0.241 <0.001 *** 0.218 <0.001 *** 0.368 <0.001 *** 0 0.302 0.132 0.005 ** 0.248 <0.001 *** 0.05 0.235
Male vs Female 139.5 (13) 138.5 (15) 9.3 (3) 10.2 (3) 125.4 (12) 121.8 (13) 5.5 (2) 6 (2) 128.5 (13) 126.2 (12) 11.3 (3) 12.3 (4) 114 (15) 114.5 (15) 9.9 (6) 9 (6)
** ** ** * **
Hypertension 127.7 (10) 145.7 (11) 8.4 (4) 10.5 (3) 117.6 (10) 127.4 (13) 5.5 (2) 5.9 (2) 124.6 (10) 129.2 (13) 12.1 (4) 11.6 (4) 109.3 (12) 117.4 (16) 9.6 (6) 9.4 (6)
*** *** *** * *** ***
Family History CVA 139.1 (14) 138.6 (14) 9.7 (3) 9.7 (3) 124.1 (13) 122.4 (12) 5.8 (2) 5.6 (2) 127.8 (12) 126.5 (12) 11.9 (3) 11.5 (4) 114.4 (15) 113.8 (15) 9.1 (6) 10.6 (7)
*
Hyperlipidaemia 138.1 (14) 140.1 (13) 9.5 (3) 10 (3) 122.2 (12) 125.7 (13) 5.7 (2) 5.9 (2) 126.6 (12) 128.5 (13) 11.8 (3) 11.8 (4) 112.9 (14) 116.2 (16) 9.4 (6) 9.6 (6)
** *
Diabetes 138.7 (14) 140.8 (13) 9.6 (3) 10.7 (3) 122.9 (12) 127.5 (14) 5.7 (2) 6 (2) 127.1 (12) 128.9 (13) 11.8 (4) 11.8 (3) 113.4 (14) 118.8 (17) 9.5 (6) 9.4 (8)
** ** *
Heart Failure 138.6 (14) 143.2 (14) 9.6 (3) 11 (3) 123.1 (13) 129.9 (13) 5.7 (2) 6.9 (2) 127.2 (12) 130.4 (13) 11.7 (4) 12.5 (3) 113.5 (15) 124.5 (17) 9.4 (6) 11.5 (6)
* ** *** ** *
Smoker 139.7 (13) 134.3 (16) 9.8 (3) 9.5 (4) 123.5 (13) 124.8 (13) 5.8 (2) 5.3 (2) 127 (12) 129.7 (13) 11.8 (4) 11.7 (3) 114.5 (15) 112.2 (17) 9.5 (6) 9.5 (6)
* *
Atrial Fibrillation 138.4 (14) 142.3 (12) 9.6 (3) 10.4 (3) 123.4 (13) 124.8 (13) 5.6 (2) 6.7 (2) 127.7 (12) 125.7 (12) 11.7 (4) 12.1 (3) 114.1 (15) 114.7 (17) 9.5 (6) 9.7 (5)
* * ***
Previous stroke 139.3 (13) 138.9 (14) 10 (3) 9.7 (3) 123 (11) 123.8 (13) 5.9 (2) 5.7 (2) 126.2 (11) 127.8 (13) 11.7 (3) 11.8 (4) 112.9 (14) 114.6 (15) 9.2 (6) 9.6 (6)
Stroke vs TIA 137.6 (13) 140.7 (14) 9.7 (3) 9.8 (3) 121.8 (11) 126.3 (14) 5.9 (2) 5.6 (2) 126.8 (11) 128.5 (14) 11.9 (4) 11.6 (3) 113.3 (14) 115.8 (16) 9.8 (6) 9.6 (6)
* ***
Myocardial 139.3 (14) 134.1 (11) 9.7 (3) 10.7 (3) 123.6 (13) 123.6 (9) 5.7 (2) 6.8 (2) 127.6 (12) 124.8 (10) 11.7 (4) 12.5 (3) 114.3 (15) 113.4 (11) 9.4 (6) 10.2 (7)
Infarction * *
BMI 0.164 <0.001 *** 0 0.82 0.114 0.013 * -0.1 0.019 * 0.08 0.091 0.02 0.604 0.05 0.27 0 0.787
Weight 0.09 0.137 0 0.713 0.1 0.107 0.1 0.104 0.1 0.113 0 0.673 0.19 0.309 0 0.382
Waist : hip ratio 0.04 0.291 0.06 0.178 -0.1 0.02 * 0.139 0.002 ** 0 0.057 0.02 0.544 0 0.143 0.01 0.669
Creatinine 0.183 <0.001 *** 0.07 0.1 0.231 <0.001 *** 0.131 0.003 ** 0.109 0.021 * 0.05 0.205 0.19 <0.001 *** 0.02 0.526
Cholesterol 0 0.063 0 0.13 -0.1 0.015 * 0 0.1 0.02 0.636 0 0.562 0 0.117 0.03 0.368
TSH 0.119 0.012 * 0.06 0.162 0.117 0.011 * 0.08 0.08 0.03 0.446 0 0.921 0.106 0.032 * 0.01 0.693
GFR -0.19 <0.001 *** -0.16 <0.001 *** 0 0.439 -0.37 <0.001 *** 0.08 0.108 -0.1 0.04 * -0.22 <0.001 *** 0 0.924
Alcohol intake 0 0.272 0 0.633 0.01 0.824 0 0.58 0 0.879 0.04 0.346 -0.14 0.003 ** 0 0.172
0.768
0.852
0.29
Asleep
0.528
Mean
0.703
<0.001
0.703
0.027
0.019
0.002 0.048
0.918
0.758
0.503
CV
0.087
0.774
0.021
0.139
0.783
0.417
0.675
0.769
0.822
0.283
0.09
0.72
0.298
0.261
0.092 0.034 0.007 <0.001 0.193
0.01 0.564 0.43 0.012 0.118
0.019 0.694 <0.001 0.082 0.173
0.003
0.198
0.377
0.976
0.992
0.758 0.351 0.454 0.213 0.194
0.013 0.042 0.398 <0.001 0.207
0.029 0.104 0.999 0.017 0.179
0.2 0.004 0.006 0.169 0.303
0.12 0.094 0.003 0.264 0.107
0.736 0.994 0.164 0.2 0.308
<0.001 <0.001 <0.001 0.025 <0.001
0.44 0.008 0.001 0.002 0.046
Premorbid HBPM Awake
Mean CV Mean rCV Mean CV
Table 6.3. Unadjusted relationships between clinical characteristics and systolic blood pressure variability on premorbid, home
and ambulatory blood pressure readings. Dichotomous variables are given as mean (SD) with p-values from t-tests for absence vs
presence of each characteristic. Correlations between continuous variables are given as r and p-values. * p<0.05, ** p<0.01, ***p<0.001
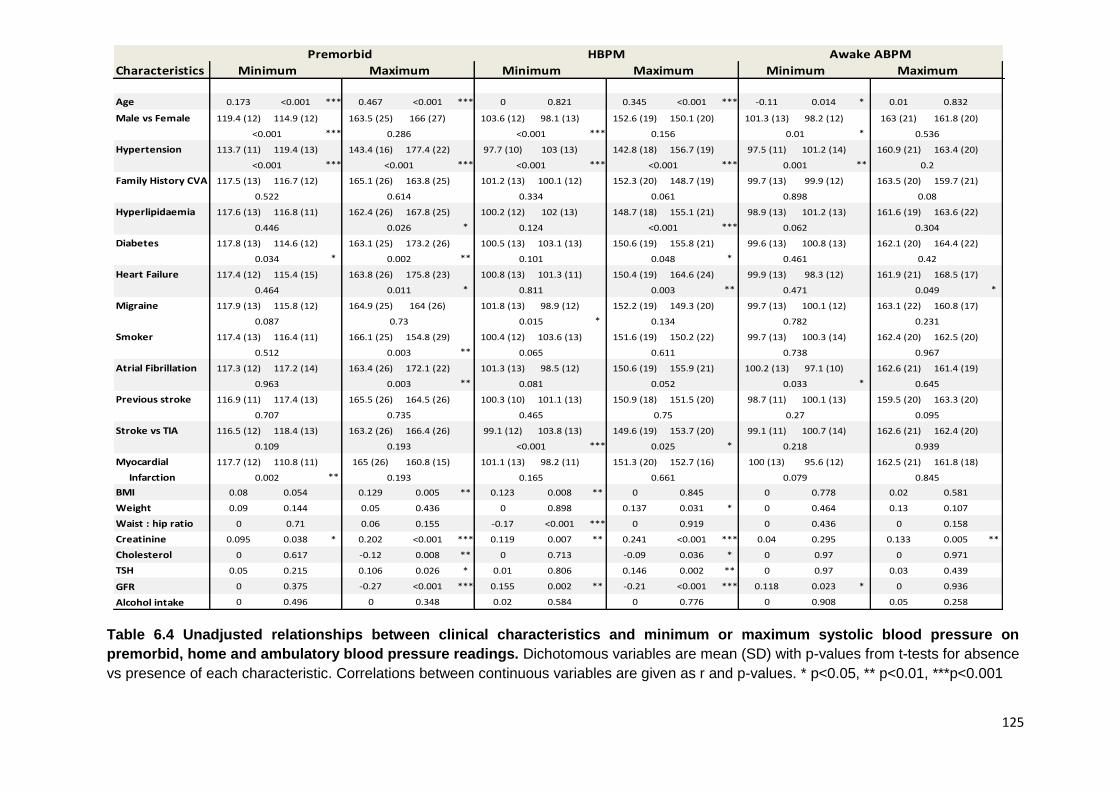
125
Characteristics
Age 0.173 <0.001 *** 0.467 <0.001 *** 0 0.821 0.345 <0.001 *** -0.11 0.014 * 0.01 0.832 0.03 0.466 0.236 <0.001 ***
Male vs Female 119.4 (12) 114.9 (12) 163.5 (25) 166 (27) 103.6 (12) 98.1 (13) 152.6 (19) 150.1 (20) 101.3 (13) 98.2 (12) 163 (21) 161.8 (20) 80.8 (37) 76.9 (41) 135.6 (20) 135.8 (20)
*** *** *
Hypertension 113.7 (11) 119.4 (13) 143.4 (16) 177.4 (22) 97.7 (10) 103 (13) 142.8 (18) 156.7 (19) 97.5 (11) 101.2 (14) 160.9 (21) 163.4 (20) 79.2 (35) 78.8 (42) 129.9 (18) 139.5 (21)
*** *** *** *** ** ***
Family History CVA 117.5 (13) 116.7 (12) 165.1 (26) 163.8 (25) 101.2 (13) 100.1 (12) 152.3 (20) 148.7 (19) 99.7 (13) 99.9 (12) 163.5 (20) 159.7 (21) 78.4 (40) 80.4 (37) 135.1 (20) 137.3 (20)
Hyperlipidaemia 117.6 (13) 116.8 (11) 162.4 (26) 167.8 (25) 100.2 (12) 102 (13) 148.7 (18) 155.1 (21) 98.9 (13) 101.2 (13) 161.6 (19) 163.6 (22) 77.7 (39) 80.6 (40) 133.6 (19) 138.8 (21)
* *** *
Diabetes 117.8 (13) 114.6 (12) 163.1 (25) 173.2 (26) 100.5 (13) 103.1 (13) 150.6 (19) 155.8 (21) 99.6 (13) 100.8 (13) 162.1 (20) 164.4 (22) 79.3 (38) 77.1 (44) 134.6 (20) 142 (21)
* ** * *
Heart Failure 117.4 (12) 115.4 (15) 163.8 (26) 175.8 (23) 100.8 (13) 101.3 (11) 150.4 (19) 164.6 (24) 99.9 (13) 98.3 (12) 161.9 (21) 168.5 (17) 77.9 (39) 97.7 (32) 134.8 (20) 148.3 (17)
* ** * ** ***
Migraine 117.9 (13) 115.8 (12) 164.9 (25) 164 (26) 101.8 (13) 98.9 (12) 152.2 (19) 149.3 (20) 99.7 (13) 100.1 (12) 163.1 (22) 160.8 (17) 77.8 (40) 81.3 (37) 135.9 (20) 135.2 (21)
*
Smoker 117.4 (13) 116.4 (11) 166.1 (25) 154.8 (29) 100.4 (12) 103.6 (13) 151.6 (19) 150.2 (22) 99.7 (13) 100.3 (14) 162.4 (20) 162.5 (20) 79.5 (39) 78.3 (40) 136 (20) 133.7 (21)
**
Atrial Fibrillation 117.3 (12) 117.2 (14) 163.4 (26) 172.1 (22) 101.3 (13) 98.5 (12) 150.6 (19) 155.9 (21) 100.2 (13) 97.1 (10) 162.6 (21) 161.4 (19) 78.4 (39) 82.1 (38) 135.9 (20) 134.5 (19)
** *
Previous stroke 116.9 (11) 117.4 (13) 165.5 (26) 164.5 (26) 100.3 (10) 101.1 (13) 150.9 (18) 151.5 (20) 98.7 (11) 100.1 (13) 159.5 (20) 163.3 (20) 74.9 (40) 80.2 (39) 133.9 (21) 136.3 (20)
Stroke vs TIA 116.5 (12) 118.4 (13) 163.2 (26) 166.4 (26) 99.1 (12) 103.8 (13) 149.6 (19) 153.7 (20) 99.1 (11) 100.7 (14) 162.6 (21) 162.4 (20) 82.7 (35) 80.1 (40) 133.8 (19) 138.3 (21)
*** * *
Myocardial 117.7 (12) 110.8 (11) 165 (26) 160.8 (15) 101.1 (13) 98.2 (11) 151.3 (20) 152.7 (16) 100 (13) 95.6 (12) 162.5 (21) 161.8 (18) 79.1 (39) 75.4 (39) 135.7 (20) 136.5 (16)
Infarction **
BMI 0.08 0.054 0.129 0.005 ** 0.123 0.008 ** 0 0.845 0 0.778 0.02 0.581 0 0.325 0.07 0.119
Weight 0.09 0.144 0.05 0.436 0 0.898 0.137 0.031 * 0 0.464 0.13 0.107 0 0.892 0.19 0.545
Waist : hip ratio 0 0.71 0.06 0.155 -0.17 <0.001 *** 0 0.919 0 0.436 0 0.158 0 0.843 0 0.21
Creatinine 0.095 0.038 * 0.202 <0.001 *** 0.119 0.007 ** 0.241 <0.001 *** 0.04 0.295 0.133 0.005 ** 0 0.939 0.192 <0.001 ***
Cholesterol 0 0.617 -0.12 0.008 ** 0 0.713 -0.09 0.036 * 0 0.97 0 0.971 0 0.741 0 0.652
TSH 0.05 0.215 0.106 0.026 * 0.01 0.806 0.146 0.002 ** 0 0.97 0.03 0.439 0 0.888 0.11 0.026 *
GFR 0 0.375 -0.27 <0.001 *** 0.155 0.002 ** -0.21 <0.001 *** 0.118 0.023 * 0 0.936 0 0.617 -0.18 <0.001 ***
Alcohol intake 0 0.496 0 0.348 0.02 0.584 0 0.776 0 0.908 0.05 0.258 -0.09 0.026 * -0.1 0.029 *
Premorbid HBPM Awake ABPM Asleep ABPM
Minimum Maximum Minimum Maximum Minimum
<0.001 0.286 <0.001 0.156 0.01
<0.001 <0.001 <0.001 <0.001 0.001
0.522 0.614 0.334 0.061 0.898
0.134 0.782
0.446 0.026 0.124 <0.001 0.062
0.034 0.002 0.101 0.048 0.461
0.002 0.193 0.165 0.661 0.079
0.963 0.003 0.081 0.052 0.033
0.707 0.735 0.465 0.75 0.27
Maximum
0.536
0.2
0.08
0.304
0.42
0.109 0.193 <0.001 0.025 0.218
0.512 0.003 0.065 0.611 0.738
0.464 0.011 0.811 0.003 0.471
0.087 0.73 0.015
0.435
0.19
0.448
0.607
0.939
0.845
0.049
0.231
0.967
0.645
0.095
0.022
0.801
Minimum
0.25
0.899
0.593
0.409
0.666
0.002
0.325
<0.001
0.707
0.405
0.589
0.305
Maximum
0.929
<0.001
0.305
0.01
0.01
0.797
Table 6.4 Unadjusted relationships between clinical characteristics and minimum or maximum systolic blood pressure on
premorbid, home and ambulatory blood pressure readings. Dichotomous variables are mean (SD) with p-values from t-tests for absence
vs presence of each characteristic. Correlations between continuous variables are given as r and p-values. * p<0.05, ** p<0.01, ***p<0.001
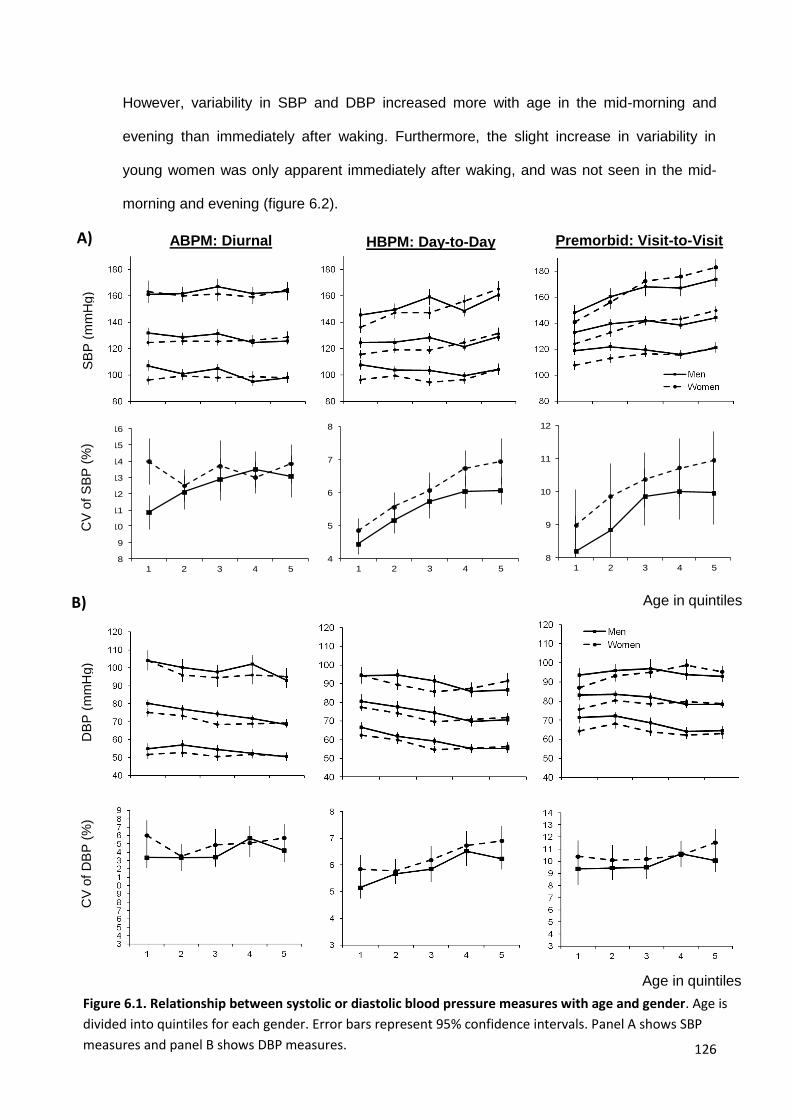
126
However, variability in SBP and DBP increased more with age in the mid-morning and
evening than immediately after waking. Furthermore, the slight increase in variability in
young women was only apparent immediately after waking, and was not seen in the mid-
morning and evening (figure 6.2).
Figure 6.1. Relationship between systolic or diastolic blood pressure measures with age and gender. Age is
divided into quintiles for each gender. Error bars represent 95% confidence intervals. Panel A shows SBP
measures and panel B shows DBP measures.
4
5
6
7
8
1 2 3 4 5
8
9
10
11
12
13
14
15
16
1 2 3 4 5
8
9
10
11
12
1 2 3 4 5
8
9
10
11
12
13
14
15
16
1 2 3 4 5
4
5
6
7
8
1 2 3 4 5
8
9
10
11
12
13
14
15
16
1 2 3 4 5
8
9
10
11
12
1 2 3 4 5
8
9
10
11
12
13
14
15
16
1 2 3 4 5
Age in quintiles
SB
P (
mm
Hg)
Max
Min
Mean
Premorbid: Visit-to-Visit HBPM: Day-to-Day ABPM: Diurnal
CV
of
SB
P (
%)
A)
Age in quintiles
DB
P (
mm
Hg)
CV
of
DB
P (
%)
B)
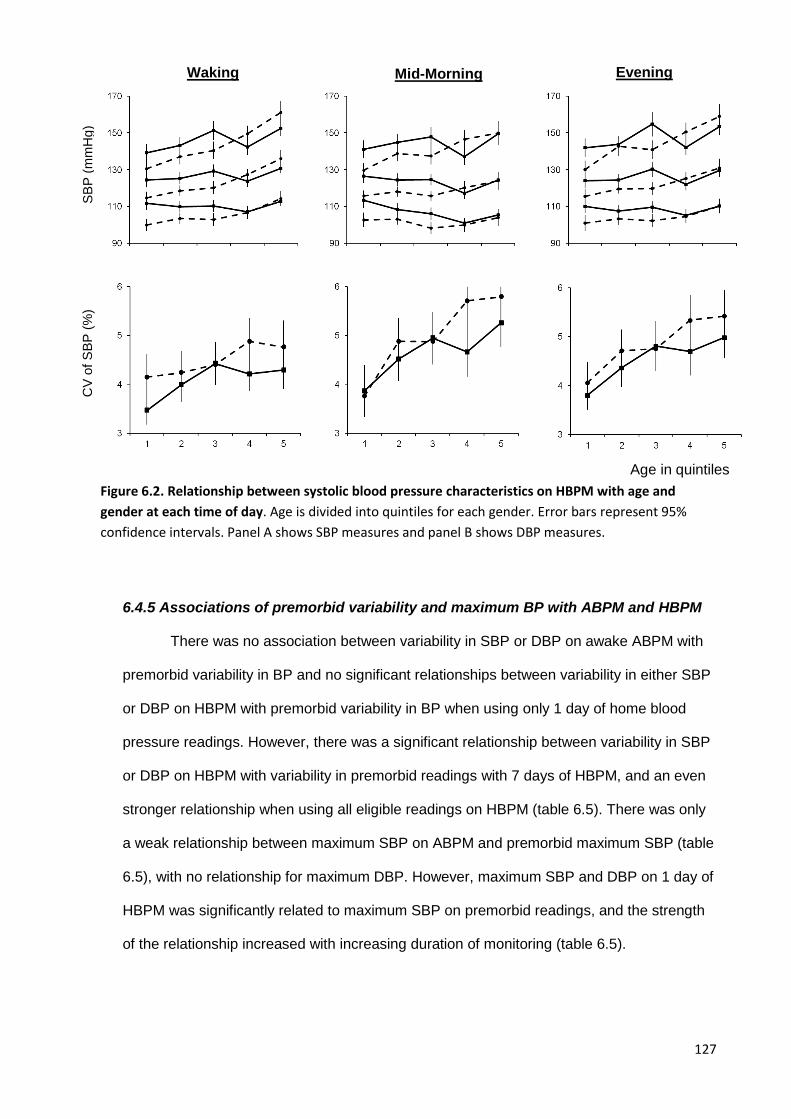
127
6.4.5 Associations of premorbid variability and maximum BP with ABPM and HBPM
There was no association between variability in SBP or DBP on awake ABPM with
premorbid variability in BP and no significant relationships between variability in either SBP
or DBP on HBPM with premorbid variability in BP when using only 1 day of home blood
pressure readings. However, there was a significant relationship between variability in SBP
or DBP on HBPM with variability in premorbid readings with 7 days of HBPM, and an even
stronger relationship when using all eligible readings on HBPM (table 6.5). There was only
a weak relationship between maximum SBP on ABPM and premorbid maximum SBP (table
6.5), with no relationship for maximum DBP. However, maximum SBP and DBP on 1 day of
HBPM was significantly related to maximum SBP on premorbid readings, and the strength
of the relationship increased with increasing duration of monitoring (table 6.5).
SB
P (
mm
Hg)
CV
of
SB
P (
%)
Evening Mid-Morning Waking
Age in quintiles
Figure 6.2. Relationship between systolic blood pressure characteristics on HBPM with age and
gender at each time of day. Age is divided into quintiles for each gender. Error bars represent 95%
confidence intervals. Panel A shows SBP measures and panel B shows DBP measures.
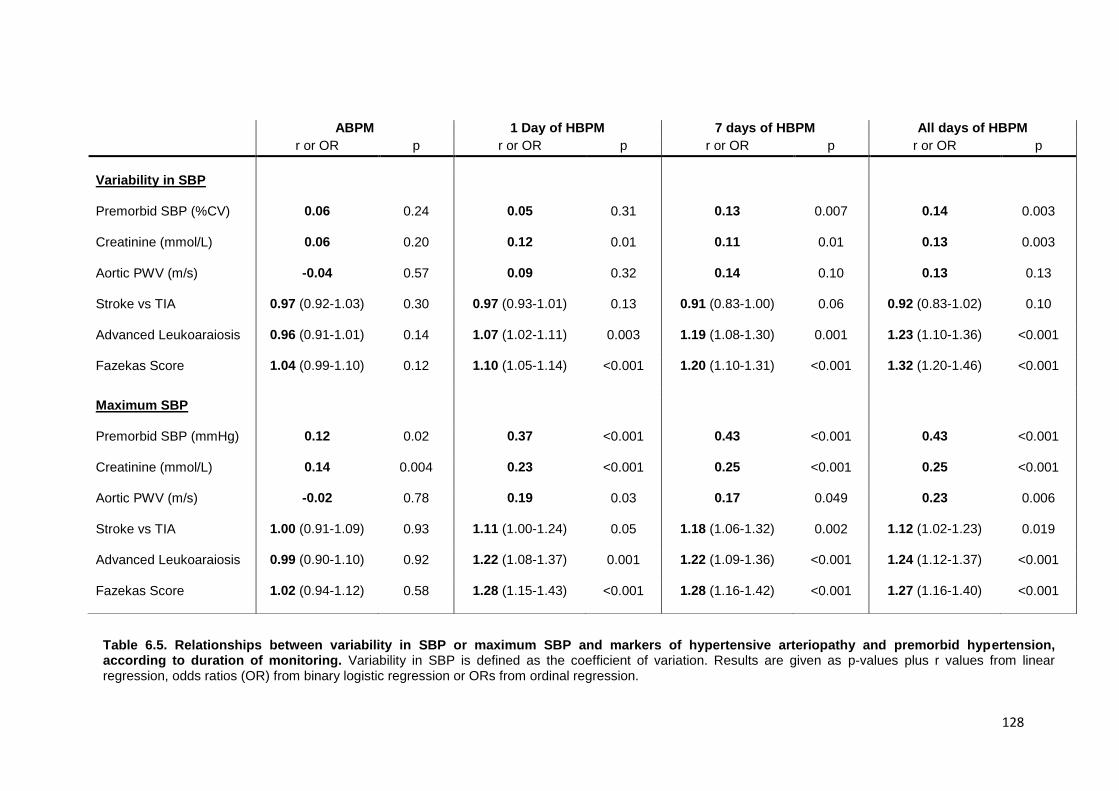
128
ABPM 1 Day of HBPM 7 days of HBPM All days of HBPM
r or OR p r or OR p r or OR p r or OR p
Variability in SBP
Premorbid SBP (%CV) 0.06 0.24 0.05 0.31 0.13 0.007 0.14 0.003
Creatinine (mmol/L) 0.06 0.20 0.12 0.01 0.11 0.01 0.13 0.003
Aortic PWV (m/s) -0.04 0.57 0.09 0.32 0.14 0.10 0.13 0.13
Stroke vs TIA 0.97 (0.92-1.03) 0.30 0.97 (0.93-1.01) 0.13 0.91 (0.83-1.00) 0.06 0.92 (0.83-1.02) 0.10
Advanced Leukoaraiosis 0.96 (0.91-1.01) 0.14 1.07 (1.02-1.11) 0.003 1.19 (1.08-1.30) 0.001 1.23 (1.10-1.36) <0.001
Fazekas Score 1.04 (0.99-1.10) 0.12 1.10 (1.05-1.14) <0.001 1.20 (1.10-1.31) <0.001 1.32 (1.20-1.46) <0.001
Maximum SBP
Premorbid SBP (mmHg) 0.12 0.02 0.37 <0.001 0.43 <0.001 0.43 <0.001
Creatinine (mmol/L) 0.14 0.004 0.23 <0.001 0.25 <0.001 0.25 <0.001
Aortic PWV (m/s) -0.02 0.78 0.19 0.03 0.17 0.049 0.23 0.006
Stroke vs TIA 1.00 (0.91-1.09) 0.93 1.11 (1.00-1.24) 0.05 1.18 (1.06-1.32) 0.002 1.12 (1.02-1.23) 0.019
Advanced Leukoaraiosis 0.99 (0.90-1.10) 0.92 1.22 (1.08-1.37) 0.001 1.22 (1.09-1.36) <0.001 1.24 (1.12-1.37) <0.001
Fazekas Score 1.02 (0.94-1.12) 0.58 1.28 (1.15-1.43) <0.001 1.28 (1.16-1.42) <0.001 1.27 (1.16-1.40) <0.001
Table 6.5. Relationships between variability in SBP or maximum SBP and markers of hypertensive arteriopathy and premorbid hypertension, according to duration of monitoring. Variability in SBP is defined as the coefficient of variation. Results are given as p-values plus r values from linear regression, odds ratios (OR) from binary logistic regression or ORs from ordinal regression.
129
6.4.6 Associations of variability and maximum SBP with hypertensive arteriopathy
There was no significant association between variability in SBP on ABPM with any
marker of hypertensive arteriopathy (table 3), only a weak association between maximum
SBP on ABPM with creatinine, and no association between maximum SBP on ABPM and
either aortic stiffness, a diagnosis of stroke or leukoaraiosis. In contrast, with all HBPM
readings, variability in SBP was significantly associated with creatinine and severity of
leukoaraiosis, whilst maximum SBP was associated with all markers of hypertensive
arteriopathy, including aortic stiffness, creatinine, stroke and severity of leukoaraiosis.
Furthermore, the strength of the association between either variability or maximum SBP on
HBPM with markers of hypertensive arteriopathy was stronger with more than 1 day of
monitoring compared to only a single day of monitoring, with further increases in the
strength of association between variability in SBP on HBPM with leukoaraiosis with all
readings compared to 7 days of monitoring. Results were similar for variability of DBP.
6.4.7 Predictive value of variability and maximum BP for cardiovascular events
Maximum SBP and variability in SBP on ABPM or a single day of HBPM did not
predict the risk of recurrent cardiovascular events (table 6.6). However, longer periods of
HBPM increased the predictive value of both maximum SBP and variability in SBP on
HBPM with maximum SBP significantly predicting the risk of all cause death and the risk of
a composite of cardiovascular events before and after adjustment for age, gender and
cardiovascular risk factors. Variability in SBP also predicted the risk of all-cause death or all
cardiovascular events, but after adjustment, only the association with all cause death
remained. With increasing duration of monitoring, there was a systematic increase in the
strength of the relationship between CV-SBP and all events, and between maximum SBP
and the risk of stroke. For non-stroke events, although the effect of increased duration of
monitoring on the strength of association between maximum SBP and outcomes was less
clear, the risk of all outcomes was higher when estimated with all days of monitoring
compared to 7 days of monitoring.
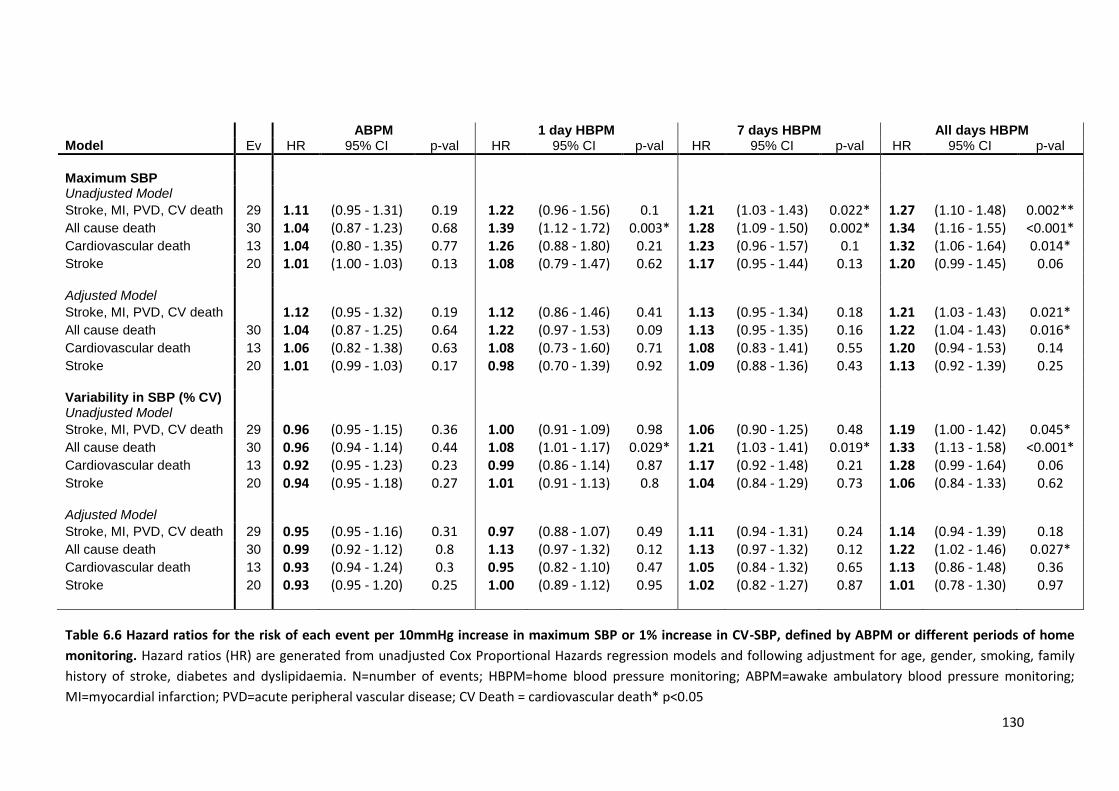
130
ABPM 1 day HBPM 7 days HBPM All days HBPM Model Ev HR 95% CI p-val HR 95% CI p-val HR 95% CI p-val HR 95% CI p-val
Maximum SBP Unadjusted Model
Stroke, MI, PVD, CV death 29 1.11 (0.95 - 1.31) 0.19 1.22 (0.96 - 1.56) 0.1 1.21 (1.03 - 1.43) 0.022* 1.27 (1.10 - 1.48) 0.002** All cause death 30 1.04 (0.87 - 1.23) 0.68 1.39 (1.12 - 1.72) 0.003* 1.28 (1.09 - 1.50) 0.002* 1.34 (1.16 - 1.55) <0.001* Cardiovascular death 13 1.04 (0.80 - 1.35) 0.77 1.26 (0.88 - 1.80) 0.21 1.23 (0.96 - 1.57) 0.1 1.32 (1.06 - 1.64) 0.014* Stroke 20 1.01 (1.00 - 1.03) 0.13 1.08 (0.79 - 1.47) 0.62 1.17 (0.95 - 1.44) 0.13 1.20 (0.99 - 1.45) 0.06 Adjusted Model
Stroke, MI, PVD, CV death 1.12 (0.95 - 1.32) 0.19 1.12 (0.86 - 1.46) 0.41 1.13 (0.95 - 1.34) 0.18 1.21 (1.03 - 1.43) 0.021* All cause death 30 1.04 (0.87 - 1.25) 0.64 1.22 (0.97 - 1.53) 0.09 1.13 (0.95 - 1.35) 0.16 1.22 (1.04 - 1.43) 0.016* Cardiovascular death 13 1.06 (0.82 - 1.38) 0.63 1.08 (0.73 - 1.60) 0.71 1.08 (0.83 - 1.41) 0.55 1.20 (0.94 - 1.53) 0.14 Stroke 20 1.01 (0.99 - 1.03) 0.17 0.98 (0.70 - 1.39) 0.92 1.09 (0.88 - 1.36) 0.43 1.13 (0.92 - 1.39) 0.25 Variability in SBP (% CV) Unadjusted Model
Stroke, MI, PVD, CV death 29 0.96 (0.95 - 1.15) 0.36 1.00 (0.91 - 1.09) 0.98 1.06 (0.90 - 1.25) 0.48 1.19 (1.00 - 1.42) 0.045* All cause death 30 0.96 (0.94 - 1.14) 0.44 1.08 (1.01 - 1.17) 0.029* 1.21 (1.03 - 1.41) 0.019* 1.33 (1.13 - 1.58) <0.001* Cardiovascular death 13 0.92 (0.95 - 1.23) 0.23 0.99 (0.86 - 1.14) 0.87 1.17 (0.92 - 1.48) 0.21 1.28 (0.99 - 1.64) 0.06 Stroke 20 0.94 (0.95 - 1.18) 0.27 1.01 (0.91 - 1.13) 0.8 1.04 (0.84 - 1.29) 0.73 1.06 (0.84 - 1.33) 0.62 Adjusted Model
Stroke, MI, PVD, CV death 29 0.95 (0.95 - 1.16) 0.31 0.97 (0.88 - 1.07) 0.49 1.11 (0.94 - 1.31) 0.24 1.14 (0.94 - 1.39) 0.18 All cause death 30 0.99 (0.92 - 1.12) 0.8 1.13 (0.97 - 1.32) 0.12 1.13 (0.97 - 1.32) 0.12 1.22 (1.02 - 1.46) 0.027* Cardiovascular death 13 0.93 (0.94 - 1.24) 0.3 0.95 (0.82 - 1.10) 0.47 1.05 (0.84 - 1.32) 0.65 1.13 (0.86 - 1.48) 0.36 Stroke 20 0.93 (0.95 - 1.20) 0.25 1.00 (0.89 - 1.12) 0.95 1.02 (0.82 - 1.27) 0.87 1.01 (0.78 - 1.30) 0.97
Table 6.6 Hazard ratios for the risk of each event per 10mmHg increase in maximum SBP or 1% increase in CV-SBP, defined by ABPM or different periods of home
monitoring. Hazard ratios (HR) are generated from unadjusted Cox Proportional Hazards regression models and following adjustment for age, gender, smoking, family
history of stroke, diabetes and dyslipidaemia. N=number of events; HBPM=home blood pressure monitoring; ABPM=awake ambulatory blood pressure monitoring;
MI=myocardial infarction; PVD=acute peripheral vascular disease; CV Death = cardiovascular death* p<0.05
131
6.4.8 Relative predictive values of mean, maximum and variability in SBP
Per standard deviation of the population, maximum SBP on HBPM was more
strongly associated with creatinine, leukoaraiosis, all cardiovascular events and all-cause
mortality than mean SBP in univariate models (table 6.7). Furthermore, adjusting maximum
SBP for mean SBP resulted in minimal attenuation of the relationship between maximum
SBP and each outcome, but after adjusting mean SBP for maximum SBP, there was no
relationship between mean SBP and markers of hypertensive arteriopathy or the risk of
cardiovascular events. In univariate models, variability in SBP was slightly less strongly
associated than mean SBP with creatinine, aortic stiffness or the risk of all cardiovascular
events but was more strongly associated with leukoaraiosis and all cause mortality.
However, mean SBP and variability in SBP were largely independent of each other, with
minimal attenuation of these relationships after mutual adjustment (table 6.7).
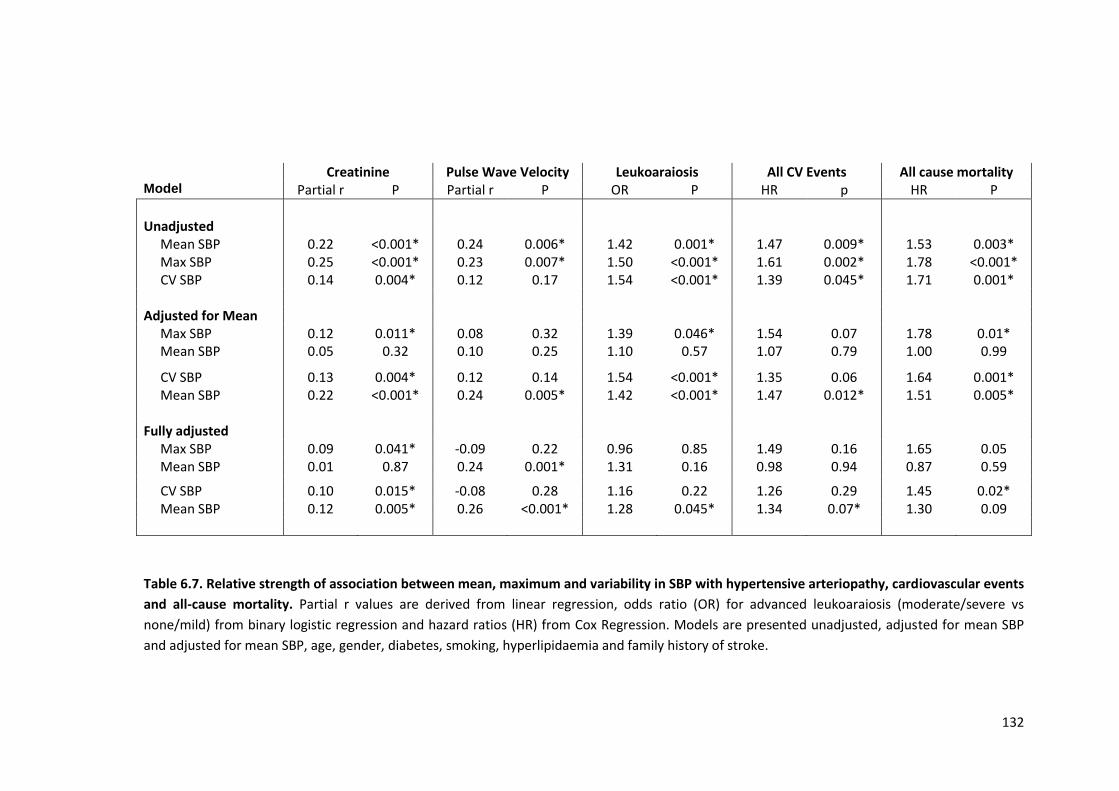
132
Creatinine Pulse Wave Velocity Leukoaraiosis All CV Events All cause mortality Model Partial r P Partial r P OR P HR p HR P
Unadjusted Mean SBP Max SBP CV SBP
0.22 0.25 0.14
<0.001* <0.001* 0.004*
0.24 0.23 0.12
0.006* 0.007*
0.17
1.42 1.50 1.54
0.001* <0.001* <0.001*
1.47 1.61 1.39
0.009* 0.002* 0.045*
1.53 1.78 1.71
0.003* <0.001* 0.001*
Adjusted for Mean Max SBP 0.12 0.011* 0.08 0.32 1.39 0.046* 1.54 0.07 1.78 0.01* Mean SBP 0.05 0.32 0.10 0.25 1.10 0.57 1.07 0.79 1.00 0.99
CV SBP 0.13 0.004* 0.12 0.14 1.54 <0.001* 1.35 0.06 1.64 0.001* Mean SBP 0.22 <0.001* 0.24 0.005* 1.42 <0.001* 1.47 0.012* 1.51 0.005* Fully adjusted Max SBP 0.09 0.041* -0.09 0.22 0.96 0.85 1.49 0.16 1.65 0.05 Mean SBP 0.01 0.87 0.24 0.001* 1.31 0.16 0.98 0.94 0.87 0.59
CV SBP 0.10 0.015* -0.08 0.28 1.16 0.22 1.26 0.29 1.45 0.02* Mean SBP 0.12 0.005* 0.26 <0.001* 1.28 0.045* 1.34 0.07* 1.30 0.09
Table 6.7. Relative strength of association between mean, maximum and variability in SBP with hypertensive arteriopathy, cardiovascular events
and all-cause mortality. Partial r values are derived from linear regression, odds ratio (OR) for advanced leukoaraiosis (moderate/severe vs
none/mild) from binary logistic regression and hazard ratios (HR) from Cox Regression. Models are presented unadjusted, adjusted for mean SBP
and adjusted for mean SBP, age, gender, diabetes, smoking, hyperlipidaemia and family history of stroke.
133
6.5 Discussion
Variability and maximum SBP on HBPM were strongly associated with clinical
characteristics, premorbid visit-to-visit BP readings, markers of hypertensive arteriopathy
and the risk of recurrent cardiovascular events and all cause mortality, with stronger
associations for maximum SBP than mean SBP and independent associations for variability
and mean SBP. Variability and maximum SBP on ABPM did not demonstrate any of these
associations. Although variability and maximum SBP on only 1 day of HBPM was
associated with hypertensive arteriopathy, the predictive value of both variability in SBP and
maximum SBP significantly increased with longer periods of monitoring.
Despite a long history of investigation,25 the weak predictive value of variability in
SBP on ABPM1 and the lack of specific treatment options has prevented SBP variability
from being widely recognised as an independent marker of cardiovascular risk until it was
demonstrated that there was an increased risk of stroke and cardiovascular events
associated with increased visit-to-visit BP variability and maximum SBP in clinic,6 and that
specific antihypertensive classes reduced variability in SBP and hence stroke risk.8, 11
However, clinic blood pressure provides a less accurate estimate of mean BP than ABPM26
whereas ABPM provides a measure of physiologically-determined diurnal variation in BP,
resulting in doubts about the greater physiological, and therefore clinical, relevance of visit-
to-visit BP variability. The effect on clinical outcomes has been ascribed to medication
adherence18 or demographic confounders resulting in measurement artefact, such as the
association between age and the white coat effect.27 Despite multiple subsequent
demonstrations of the clinical relevance of variability in SBP on both clinic2, 12 and home
monitoring,28, 29 independent of mean SBP and clinical characteristics, day-to-day home and
visit-to-visit clinic variability in SBP are still not recognised as independent risk factors or
treatment targets.15, 16 Furthermore, although maximum SBP was an even stronger
predictor of stroke risk than either mean SBP or variability in SBP in the original reports,6 it
has received little attention compared to variability in SBP,14 perhaps due to the perception
134
that maximum episodic clinic hypertension reflects the white coat response rather than a
physiologically-determined, recognised marker of cardiovascular risk.
In this population, the strong associations between variability and maximum SBP
with clinical characteristics and markers of hypertensive arteriopathy demonstrate that such
fluctuations in SBP reflect underlying physiological differences between individuals. This
cannot be explained on the basis of adherence to medication given the similar associations
with age and the opposite associations for gender, and is unlikely to reflect clinically
irrelevant artefacts of BP measurement given the strong relationship with markers of
hypertensive end-organ damage including creatinine and leukoaraiosis. Instead,
fluctuations in SBP appear to reflect pathophysiological differences between individuals,
either partly due to underlying hypertensive arteriopathy or possibly causing it. Furthermore,
the associations with clinical characteristics were stronger for variability and maximum SBP
than mean SBP. Finally, in assessing clinical risk, which is the most important measure of
clinical validity, variability in SBP and mean SBP were independently associated with all
outcomes, whilst maximum SBP was more strongly associated with outcomes than mean
SBP, such that there was no association between mean SBP and outcomes after
adjustment for max SBP, compared to minimal attenuation of the relationship between max
SBP and outcomes after adjustment for mean SBP. As max SBP is also associated with
CV-SBP, it suggests that max SBP provides a composite measure capturing all the relevant
prognostic information given by mean SBP plus some of the prognostic information given
by CV-SBP.
The weak associations for variability and maximum SBP on ABPM with clinical
characteristics, premorbid BP readings and markers of hypertensive arteriopathy are
consistent with the weak predictive value of variability on ABPM for the risk of
cardiovascular events in this study and in previous studies.1, 6 This may partly be explained
by the duration of monitoring, with longer periods of monitoring on HBPM increasing the
strength of association with clinical characteristics and hypertensive arteriopathy and
135
increasing the predictive value for recurrent cardiovascular events. However, maximum
SBP and variability in SBP on 1 day of HBPM were still more strongly associated with
clinical characteristics, hypertensive arteriopathy and the risk of all-cause mortality than
ABPM. Maximum SBP on ABPM in this population may be more likely to reflect artefactual
or clinically irrelevant elevations in SBP whilst variability in SBP on ABPM, which is
dominated by diurnal variation, may reflect alternative physiological mechanisms with less
physiological and clinical significance than day-to-day variability in SBP. This is consistent
with the poor performance of mean ABPM in identifying hypertensive arteriopathy and the
risk of cardiovascular events demonstrated in chapter 5, particularly due to inaccuracies in
the elderly, who have the greatest variability in blood pressure.
This analysis has a number of limitations. Firstly, ABPM was only performed at one
month, following initiation of therapy, whilst home monitoring was performed from the
recruitment visit. Nonetheless, associations between measures of maximum SBP or
variability in SBP were still stronger for 1 and 7 days of HBPM immediately prior to the
ABPM. Secondly, this study only looked at patients with recent cerebrovascular events
which limits its generalisability. This is also a strength of this study as it provides evidence
for the optimal method of assessing BP in high risk patients with recent cerebrovascular
events, but further research is needed to confirm that these findings can be extrapolated to
patients without TIA or stroke. Thirdly, there were relatively few cardiovascular events
during follow up in this population, which limited the sensitivity of the study to weaker
associations between BP measures and cardiovascular events. However, there were
significant relationships with longer periods of HBPM, and the relationships for hypertensive
arteriopathy, premorbid visit-to-visit CV and premorbid max SBP with BP measures on
HBPM are consistent with previous findings with visit-to-visit variability. Fourthly, as
discussed in more detail in chapter 5, all measures of hypertensive arteriopathy reflect
complex phenotypes with causes not related to hypertension. However, the associations
136
demonstrated between SBP and each of these measures does by definition reflect that
component of each marker that is hypertension related.
Variability and maximum SBP are associated with each other. However, variability
also captures features of blood pressure behaviour that maximum SBP does not, such as
consistently larger diurnal or day-to-day fluctuations or significant dips in blood pressure.
The complementary information they provide may therefore provide insights into the
mechanisms underlying their relationship with stroke, with episodic elevations potentially
directly causing stroke by exceeding the limits of cerebral autoregulation, whilst chronic
fluctuations or dips may result in episodic hypoperfusion or else arterial changes ultimately
resulting in an increased risk of stroke.
For clinical practice, this study demonstrates the usefulness of HBPM in assessing
variability and maximum SBP. Specifically, these measures appear to be more accurate
than awake SBP on ABPM, with greater clinical and physiological significance, but are also
complementary to ABPM, which is currently the gold-standard method for assessing mean
SBP in guidelines and is likely to be valid in younger patients (chapter 5). Furthermore,
ABPM allows for the assessment of nocturnal blood pressure which has independent
prognostic significance.30-32 However, HBPM allows for more prolonged monitoring which
improves its prognostic value and allows for initiation of treatment with rapid and accurate
monitoring of response, including treatments designed to reduce BP variability. Further
research is required to determine the effects of drug treatment on HBPM, and to identify
which patients are most likely to benefit from a specific intervention. This is dealt with in
chapter 8.
In conclusion, variability in SBP and maximum SBP on HBPM were physiologically
and clinically valid markers of hypertensive arteriopathy and cardiovascular risk, but their
measurement was significantly improved by more prolonged monitoring. ABPM did not give
a valid estimate of either measure.
137
6.6 References
1. Stolarz-Skrzypek K, Thijs L, Richart T, et al. Blood pressure variability in relation to outcome in the International Database of Ambulatory blood pressure in relation to Cardiovascular Outcome. Hypertens Res 2010;33:757-766.
2. Eguchi K, Hoshide S, Schwartz JE, Shimada K, Kario K. Visit-to-visit and ambulatory blood pressure variability as predictors of incident cardiovascular events in patients with hypertension. Am J Hypertens 2012;25:962-968.
3. Kawai T, Ohishi M, Kamide K, et al. Differences between daytime and nighttime blood pressure variability regarding systemic atherosclerotic change and renal function. Hypertens Res 2013;36:232-239.
4. Zuern CS, Rizas KD, Eick C, et al. Effects of Renal Sympathetic Denervation on 24-hour Blood Pressure Variability. Front Physiol 2012;3:134.
5. Kario K. Morning surge in blood pressure and cardiovascular risk: evidence and perspectives. Hypertension 2010;56:765-773.
6. Rothwell PM, Howard SC, Dolan E, et al. Prognostic significance of visit-to-visit variability, maximum systolic blood pressure, and episodic hypertension. Lancet 2010;375:895-905.
7. Rothwell PM. Limitations of the usual blood-pressure hypothesis and importance of variability, instability, and episodic hypertension. Lancet 2010;375:938-948.
8. Rothwell PM, Howard SC, Dolan E, et al. Effects of beta blockers and calcium-channel blockers on within-individual variability in blood pressure and risk of stroke. Lancet Neurol 2010;9:469-480.
9. Webb AJ, Rothwell PM. Effect of dose and combination of antihypertensives on interindividual blood pressure variability: a systematic review. Stroke 2011;42:2860-2865.
10. Webb AJ, Fischer U, Rothwell PM. Effects of beta-blocker selectivity on blood pressure variability and stroke: a systematic review. Neurology 2011;77:731-737.
11. Webb AJ, Fischer U, Mehta Z, Rothwell PM. Effects of antihypertensive-drug class on interindividual variation in blood pressure and risk of stroke: a systematic review and meta-analysis. Lancet 2010;375:906-915.
12. Muntner P, Shimbo D, Tonelli M, Reynolds K, Arnett DK, Oparil S. The Relationship Between Visit-to-Visit Variability in Systolic Blood Pressure and All-Cause Mortality in the General Population: Findings From NHANES III, 1988 to 1994. Hypertension 2011.
13. Shimbo D, Newman JD, Aragaki AK, et al. Association between annual visit-to-visit blood pressure variability and stroke in postmenopausal women: data from the Women's Health Initiative. Hypertension 2012;60:625-630.
14. Matsui Y, Ishikawa J, Eguchi K, Shibasaki S, Shimada K, Kario K. Maximum Value of Home Blood Pressure: A Novel Indicator of Target Organ Damage in Hypertension. Hypertension 2011.
15. Excellence NIfHaC. The clinical management of primary hypertension in adults: clinical guideline 127. NICE 2011.
16. Chobanian AV, Bakris GL, Black HR, et al. The Seventh Report of the Joint National Committee on Prevention, Detection, Evaluation, and Treatment of High Blood Pressure: the JNC 7 report. JAMA 2003;289:2560-2572.
17. Parati G, Stergiou GS, Asmar R, et al. European Society of Hypertension practice guidelines for home blood pressure monitoring. J Hum Hypertens 2010;24:779-785.
18. Muntner P, Levitan EB, Joyce C, et al. Association Between Antihypertensive Medication Adherence and Visit-to-Visit Variability of Blood Pressure. J Clin Hypertens (Greenwich) 2013;15:112-117.
19. Boggia J, Thijs L, Li Y, et al. Risk stratification by 24-hour ambulatory blood pressure and estimated glomerular filtration rate in 5322 subjects from 11 populations. Hypertension 2013;61:18-26.
20. Calvo C, Hermida RC, Ayala DE, et al. The 'ABPM effect' gradually decreases but does not disappear in successive sessions of ambulatory monitoring. J Hypertens 2003;21:2265-2273.
21. Hermida RC, Calvo C, Ayala DE, Fernandez JR, Ruilope LM, Lopez JE. Evaluation of the extent and duration of the "ABPM effect" in hypertensive patients. J Am Coll Cardiol 2002;40:710-717.
22. Rothwell PM, Coull AJ, Giles MF, et al. Change in stroke incidence, mortality, case-fatality, severity, and risk factors in Oxfordshire, UK from 1981 to 2004 (Oxford Vascular Study). Lancet 2004;363:1925-1933.
138
23. Rothwell PM, Giles MF, Chandratheva A, et al. Effect of urgent treatment of transient ischaemic attack and minor stroke on early recurrent stroke (EXPRESS study): a prospective population-based sequential comparison. Lancet 2007;370:1432-1442.
24. Pantoni L, Simoni M, Pracucci G, Schmidt R, Barkhof F, Inzitari D. Visual rating scales for age-related white matter changes (leukoaraiosis): can the heterogeneity be reduced? Stroke 2002;33:2827-2833.
25. Casadei R, Parati G, Pomidossi G, et al. 24-hour blood pressure monitoring: evaluation of Spacelabs 5300 monitor by comparison with intra-arterial blood pressure recording in ambulant subjects. J Hypertens 1988;6:797-803.
26. Bjorklund K, Lind L, Zethelius B, Berglund L, Lithell H. Prognostic significance of 24-h ambulatory blood pressure characteristics for cardiovascular morbidity in a population of elderly men. J Hypertens 2004;22:1691-1697.
27. Hond ED, Celis H, Fagard R, et al. Self-measured versus ambulatory blood pressure in the diagnosis of hypertension. J Hypertens 2003;21:717-722.
28. Johansson JK, Niiranen TJ, Puukka PJ, Jula AM. Prognostic Value of the Variability in Home-Measured Blood Pressure and Heart Rate: The Finn-Home Study. Hypertension 2012.
29. Kikuya M, Ohkubo T, Metoki H, et al. Day-by-day variability of blood pressure and heart rate at home as a novel predictor of prognosis: the Ohasama study. Hypertension 2008;52:1045-1050.
30. Fagard RH, Thijs L, Staessen JA, Clement DL, De Buyzere ML, De Bacquer DA. Prognostic significance of ambulatory blood pressure in hypertensive patients with history of cardiovascular disease. Blood Press Monit 2008;13:325-332.
31. Ingelsson E, Bjorklund-Bodegard K, Lind L, Arnlov J, Sundstrom J. Diurnal blood pressure pattern and risk of congestive heart failure. JAMA 2006;295:2859-2866.
32. Mesquita-Bastos J, Bertoquini S, Polonia J. Cardiovascular prognostic value of ambulatory blood pressure monitoring in a Portuguese hypertensive population followed up for 8.2 years. Blood Press Monit 2010;15:240-246.
139
CHAPTER SEVEN
Validation of the Montreal Cognitive Assessment (MoCA) versus
Mini-Mental State Examination (MMSE) against hypertension and
hypertensive arteriopathy in patients with TIA or minor stroke
7.1 Summary 140
7.2 Introduction 141
7.3 Methods 142
7.3.1 Procedures 142
7.3.2 Analysis 143
7.4 Findings 144
7.4.1 Population characteristics 144
7.4.2 Associations of home SBP with MoCA versus MMSE scores 145
7.4.3 Associations of premorbid SBP with MoCA versus MMSE scores 146
7.4.4 Associations of hypertensive arteriopathy with MoCA versus MMSE scores 150
7.4.5 Relationship between cognitive subdomains and mean or maximum BP 151
7.5 Discussion 154
7.6 References 158
140
7.1 Summary
To measure associations between cognitive impairment and SBP variability, a
sensitive measure of vascular cognitive impairment is required. In previous studies, more
patients are impaired on the Montreal Cognitive Assessment compared to the Mini-Mental
State Examination (Significant vs Mild vs No impairment: MMSE<23, 23-26, ≥27; MoCA <20,
20-24, ≥25)), yet all major trials of antihypertensive medications have used the MMSE.
Therefore, to validate the cognitive impairment detected by the MoCA, I measured the
relationships between hypertension and hypertensive arteriopathy with global and
subdomain cognitive dysfunction on the MoCA versus MMSE.
In 463 patients with TIA or minor stroke undergoing home BP monitoring, 45% had
cognitive impairment on the MoCA vs 28% on the MMSE (p<0.001). Mean SBP was
progressively greater for significant vs mild vs no cognitive impairment on the MoCA but not
the MMSE for premorbid readings (MoCA 143 mmHg vs 140 vs 135, p<0.001; MMSE 139 vs
142 vs 137 p=0.68) and HBPM (MoCA 130 vs 125 vs 122, p<0.001; MMSE 127 vs 125 vs
123 p=0.19), whilst low MoCA vs MMSE scores were also more strongly associated with
hypertensive arteriopathy (OR: creatinine 3.99, 2.06-7.73 vs 2.16, 1.08-4.33; stroke vs TIA
1.53, 1.06-2.19 vs 1.23, 0.81-1.85; aortic stiffness 1.09, 0.97-1.22 vs 0.97, 0.85-1.11;
advanced leukoaraiosis 2.09, 1.42-3.06 vs 1.34, 0.87-2.07). Mean SBP was more strongly
associated with impairment in all cognitive sub-domains on the MoCA vs MMSE, with the
greatest difference in visuo-spatial dysfunction (ORs per 10mmHg: visuo-spatial 1.29 vs
1.05; attention 1.18 vs 1.07; language 1.22 vs 0.91; naming 1.07 vs 0.86). 16% of uniquely
explained variation in the total MoCA score was determined by visuo-spatial / executive tests
compared to 8% with the MMSE score.
The MoCA identified more patients with hypertension-associated cognitive
impairment than the MMSE, due largely to effects on sub-domains associated with vascular
cognitive impairment. Therefore future observational studies and RCTs assessing the effect
of consistency of control of BP should use the MoCA.
141
7.2 Introduction
Vascular cognitive impairment probably results from both chronic ischaemic injury
associated with small vessel disease (leukoaraiosis)1 and from acute cerebrovascular
events, particularly recurrent events and events occurring in individuals with reduced
cerebrovascular reserve.2 Hypertension is the strongest risk factor for both acute
cerebrovascular events3-5 and for the development of leukoaraiosis,6 explaining the strong
epidemiological association between hypertension and cognitive impairment.7 However,
randomised controlled trials of antihypertensive medications in both primary prevention8-10
and secondary prevention of cerebrovascular disease11, 12 have failed to demonstrate
consistent reductions in cognitive decline despite reductions in blood pressure. This may be
due to an association between progression of vascular cognitive impairment and low BP or
BP variability as opposed to mean BP, but alternatively it may result from the use of the
MMSE to assess cognitive status, which may be insensitive to the pattern of cognitive
decline associated with hypertension and cerebrovascular disease.13 Furthermore, given
limitations of the MMSE, a sensitive test for vascular cognitive impairment is a prerequisite to
investigate the relationship between variability in SBP and cognitive impairment.
Recent studies have demonstrated a greater sensitivity for apparent cognitive
impairment with the Montreal Cognitive Assessment (MoCA) versus the Mini-Mental State
Examination (MMSE),14-16 particularly in patients with recent cerebrovascular events,17 at
least partly due to the visuo-executive components of the MoCA.13 There are many
alternative cognitive tests available, but the MOCA is an efficient test, easy to perform in
clinic, and has been validated in cerebrovascular disease against formal neuropsychological
testing.13,17 Although the MOCA excludes some important tests of vascular-type cognitive
dysfunction such as processing speed, it captures a broad range of cognitive domains in a
highly efficient manner, vital for use in a large, complex epidemiological study with many
forms of assessment. However, previous studies have validated impairment on the MoCA
and MMSE against more extended cognitive tests using shared methodology, rather than
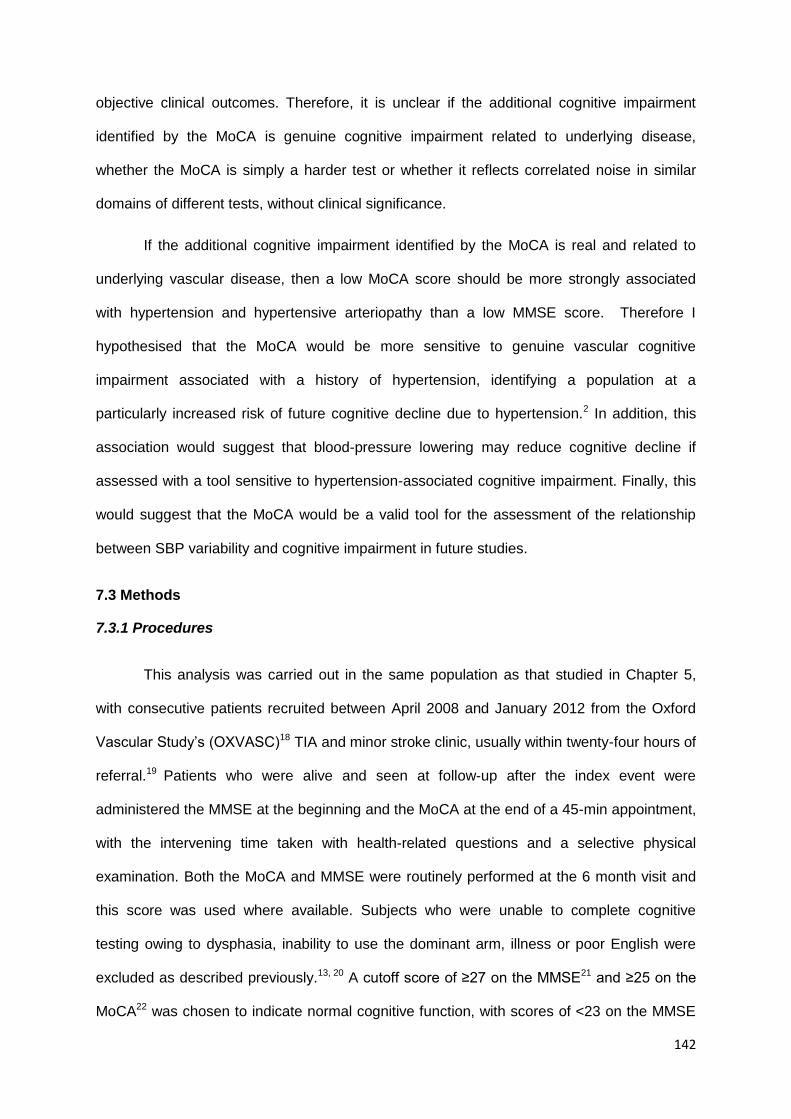
142
objective clinical outcomes. Therefore, it is unclear if the additional cognitive impairment
identified by the MoCA is genuine cognitive impairment related to underlying disease,
whether the MoCA is simply a harder test or whether it reflects correlated noise in similar
domains of different tests, without clinical significance.
If the additional cognitive impairment identified by the MoCA is real and related to
underlying vascular disease, then a low MoCA score should be more strongly associated
with hypertension and hypertensive arteriopathy than a low MMSE score. Therefore I
hypothesised that the MoCA would be more sensitive to genuine vascular cognitive
impairment associated with a history of hypertension, identifying a population at a
particularly increased risk of future cognitive decline due to hypertension.2 In addition, this
association would suggest that blood-pressure lowering may reduce cognitive decline if
assessed with a tool sensitive to hypertension-associated cognitive impairment. Finally, this
would suggest that the MoCA would be a valid tool for the assessment of the relationship
between SBP variability and cognitive impairment in future studies.
7.3 Methods
7.3.1 Procedures
This analysis was carried out in the same population as that studied in Chapter 5,
with consecutive patients recruited between April 2008 and January 2012 from the Oxford
Vascular Study’s (OXVASC)18 TIA and minor stroke clinic, usually within twenty-four hours of
referral.19 Patients who were alive and seen at follow-up after the index event were
administered the MMSE at the beginning and the MoCA at the end of a 45-min appointment,
with the intervening time taken with health-related questions and a selective physical
examination. Both the MoCA and MMSE were routinely performed at the 6 month visit and
this score was used where available. Subjects who were unable to complete cognitive
testing owing to dysphasia, inability to use the dominant arm, illness or poor English were
excluded as described previously.13, 20 A cutoff score of ≥27 on the MMSE21 and ≥25 on the
MoCA22 was chosen to indicate normal cognitive function, with scores of <23 on the MMSE
143
and <20 on the MoCA taken to indicate significant cognitive impairment likely to impair
function (an additional point being added to the total MoCA score for patients with ≤12 years
of education), according to recommendations from memory clinics22 and cerebrovascular
cohorts.23 Premorbid cognitive function was not formally assessed as the same group of
patients were tested with both the MoCA and MMSE. Therefore, this is unlikely to confound
any differences between the tests. Futhermore, pre-event cognitive dysfunction is also a
valid substrate to compare these tests, and is equally important as post-event dysfunction..
As described in chapters 5-6, clinic BP was measured at ascertainment and the one
month follow-up visit in the non-dominant arm. Up to 20 readings were used for
determination of premorbid blood pressure, whilst at the 1 month follow-up visit, awake
ambulatory measurements (ABPM) were performed with an A&D TM-2430 monitor in the
non-dominant arm, fitted by a trained study nurse, at 30 minutes intervals during the day and
60 minute intervals at night. Home blood pressure monitoring (HBPM) and treatment of
hypertension were the same as described in chapter 5. The same subgroup of 150 patients
underwent measurement of aortic stiffness by applanation tonometry to determine carotid-
femoral pulse wave velocity (cfPWV Sphygmocor, AtCor Medical, Sydney, Australia), and
leukoaraiosis was also assessed as in chapters 5 and 6, taking ‘advanced leukoaraiosis’
(moderate/severe vs none/mild) and Fazekas score as the primary measures of severity.
7.3.2 Analysis
Mean and maximum SBP and DBP on home monitoring were used as the primary
blood pressure indices to validate the cognitive scores. These were derived from the last 2
readings at each timepoint, including all clusters of readings from 7 days after the initial
assessment. Mean and maximum SBP and DBP on ABPM were derived for awake ABPM
readings following automated and manual exclusion of artefactual measurements according
to predefined criteria.24 Mean premorbid SBP and DBP were derived from the last 20 years
recorded in the primary care record, from readings in the five years prior to the notification
event and from readings 5-10 years prior to this event.
144
Given the negatively skewed distribution of total and subscores on the MMSE and
MoCA, all scores were categorised as ‘None’, ‘Mild’ or ‘Significant’ cognitive impairment
according to the criteria defined above. Relationships with discrete variables were
determined by chi-squared tests whilst relationships with continuous demographic and blood
pressure measures were determined by ANOVA across severity categories, with post-hoc
comparisons of ‘Significant cognitive impairment’ vs ‘None’ (Tukey). Secondly, prediction of
level of cognitive impairment by markers of hypertensive arteriopathy, leukoaraiosis and
demographic characteristics was determined by ordinal regression. Sensitivity analyses
were performed using only scores recorded at 6 months. All analyses were done for
univariate associations and after adjustment for age and gender.
7.4 Findings
7.4.1 Population characteristics
Of the 520 patients consenting to BP monitoring, 492 (95%) had eligible MMSEs,
with eligible MoCAs in 463 of these patients (94%). Of the 463 patients included in the
primary analyses, 452 (98%) performed HBPM, 427 (92%) had at least 3 premorbid blood
pressures recorded and 422 (91%) had an ABPM at 1 month. There were a median of 31
(22-71) days of HBPM with 2.9 BPs recorded at each timepoint and a median of 15 (6-31)
premorbid BPs per patient.
More patients had at least mild cognitive impairment on the MoCA versus the MMSE
(45% vs 28%, p<0.001) or had significant cognitive impairment (14.3% vs 6.7%, p<0.001)
despite lower diagnostic thresholds with the MoCA and similar associations with
demographic characteristics (table 7.1). Patients with significant cognitive impairment
according to either definition were still able to perform home BP monitoring, although
cognitively impaired patients recorded slightly fewer readings than non-cognitively impaired
patients (number of home BPs: significantly impaired vs not: MoCA 102 vs 119, p=0.12;
MMSE 92 vs 119, p=0.08).
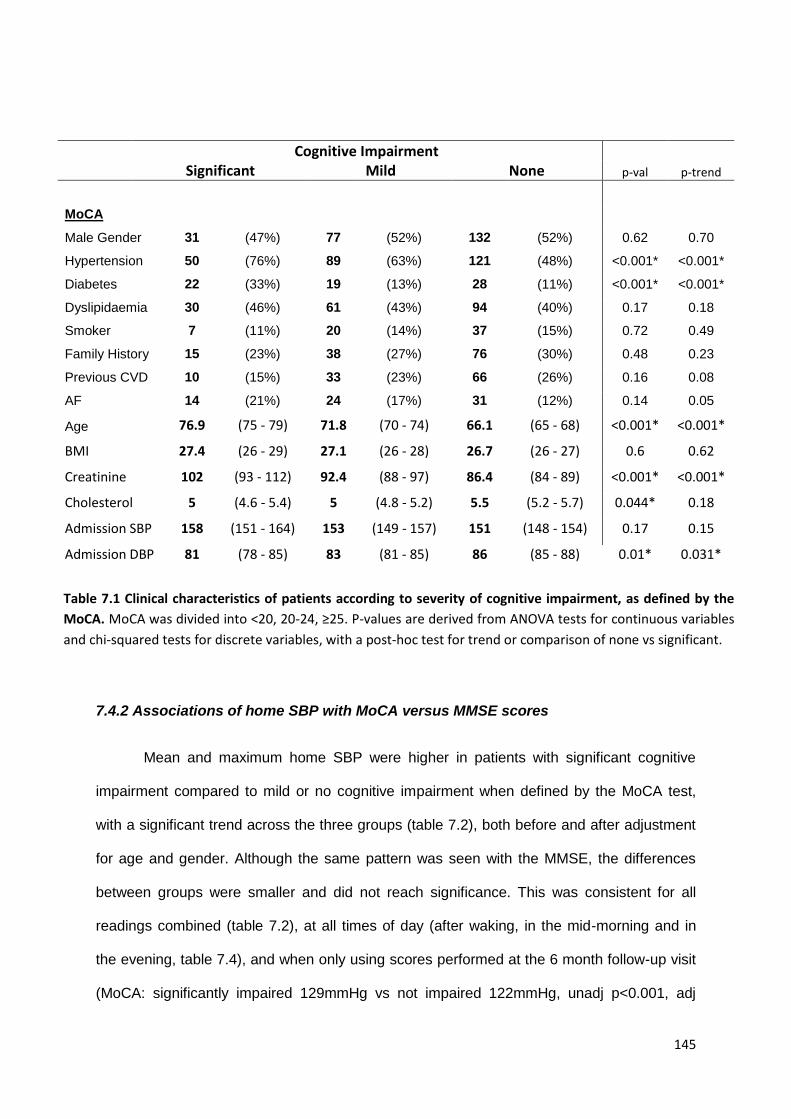
145
7.4.2 Associations of home SBP with MoCA versus MMSE scores
Mean and maximum home SBP were higher in patients with significant cognitive
impairment compared to mild or no cognitive impairment when defined by the MoCA test,
with a significant trend across the three groups (table 7.2), both before and after adjustment
for age and gender. Although the same pattern was seen with the MMSE, the differences
between groups were smaller and did not reach significance. This was consistent for all
readings combined (table 7.2), at all times of day (after waking, in the mid-morning and in
the evening, table 7.4), and when only using scores performed at the 6 month follow-up visit
(MoCA: significantly impaired 129mmHg vs not impaired 122mmHg, unadj p<0.001, adj
Cognitive Impairment
Significant Mild None p-val p-trend
MoCA
Male Gender 31 (47%) 77 (52%) 132 (52%) 0.62 0.70
Hypertension 50 (76%) 89 (63%) 121 (48%) <0.001* <0.001*
Diabetes 22 (33%) 19 (13%) 28 (11%) <0.001* <0.001*
Dyslipidaemia 30 (46%) 61 (43%) 94 (40%) 0.17 0.18
Smoker 7 (11%) 20 (14%) 37 (15%) 0.72 0.49
Family History 15 (23%) 38 (27%) 76 (30%) 0.48 0.23
Previous CVD 10 (15%) 33 (23%) 66 (26%) 0.16 0.08
AF 14 (21%) 24 (17%) 31 (12%) 0.14 0.05
Age 76.9 (75 - 79) 71.8 (70 - 74) 66.1 (65 - 68) <0.001* <0.001*
BMI 27.4 (26 - 29) 27.1 (26 - 28) 26.7 (26 - 27) 0.6 0.62
Creatinine 102 (93 - 112) 92.4 (88 - 97) 86.4 (84 - 89) <0.001* <0.001*
Cholesterol 5 (4.6 - 5.4) 5 (4.8 - 5.2) 5.5 (5.2 - 5.7) 0.044* 0.18
Admission SBP 158 (151 - 164) 153 (149 - 157) 151 (148 - 154) 0.17 0.15
Admission DBP 81 (78 - 85) 83 (81 - 85) 86 (85 - 88) 0.01* 0.031*
Table 7.1 Clinical characteristics of patients according to severity of cognitive impairment, as defined by the
MoCA. MoCA was divided into <20, 20-24, ≥25. P-values are derived from ANOVA tests for continuous variables
and chi-squared tests for discrete variables, with a post-hoc test for trend or comparison of none vs significant.
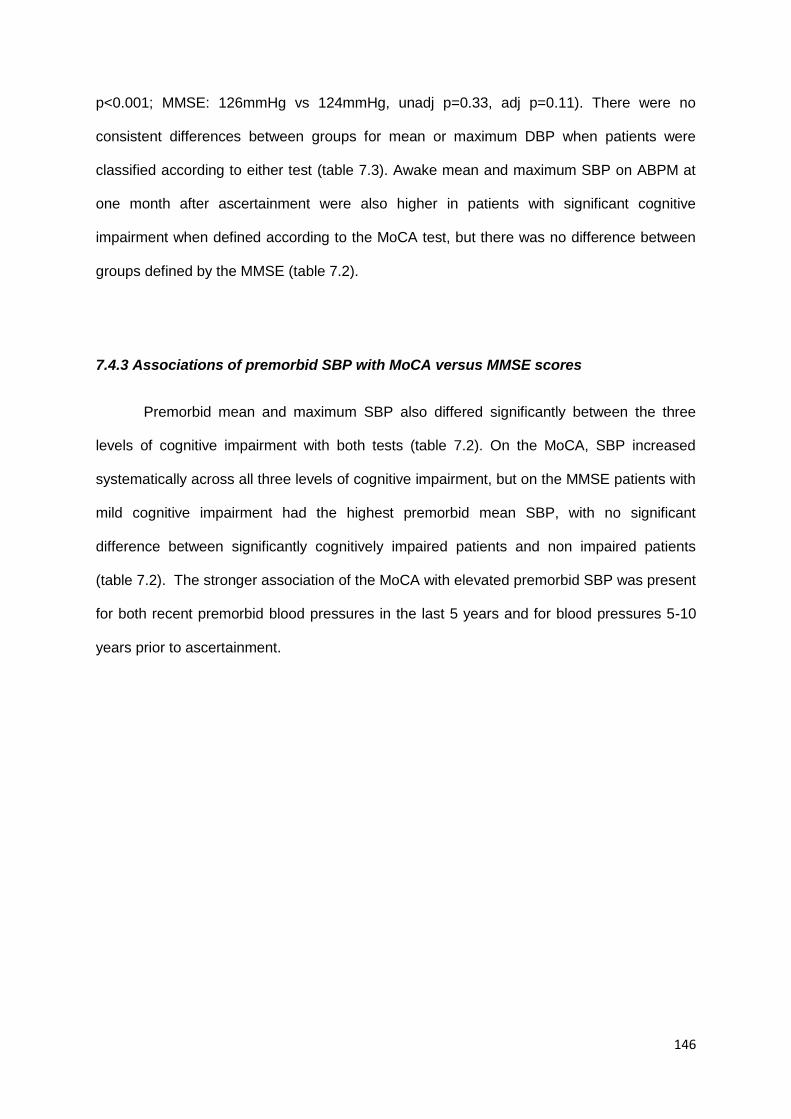
146
p<0.001; MMSE: 126mmHg vs 124mmHg, unadj p=0.33, adj p=0.11). There were no
consistent differences between groups for mean or maximum DBP when patients were
classified according to either test (table 7.3). Awake mean and maximum SBP on ABPM at
one month after ascertainment were also higher in patients with significant cognitive
impairment when defined according to the MoCA test, but there was no difference between
groups defined by the MMSE (table 7.2).
7.4.3 Associations of premorbid SBP with MoCA versus MMSE scores
Premorbid mean and maximum SBP also differed significantly between the three
levels of cognitive impairment with both tests (table 7.2). On the MoCA, SBP increased
systematically across all three levels of cognitive impairment, but on the MMSE patients with
mild cognitive impairment had the highest premorbid mean SBP, with no significant
difference between significantly cognitively impaired patients and non impaired patients
(table 7.2). The stronger association of the MoCA with elevated premorbid SBP was present
for both recent premorbid blood pressures in the last 5 years and for blood pressures 5-10
years prior to ascertainment.
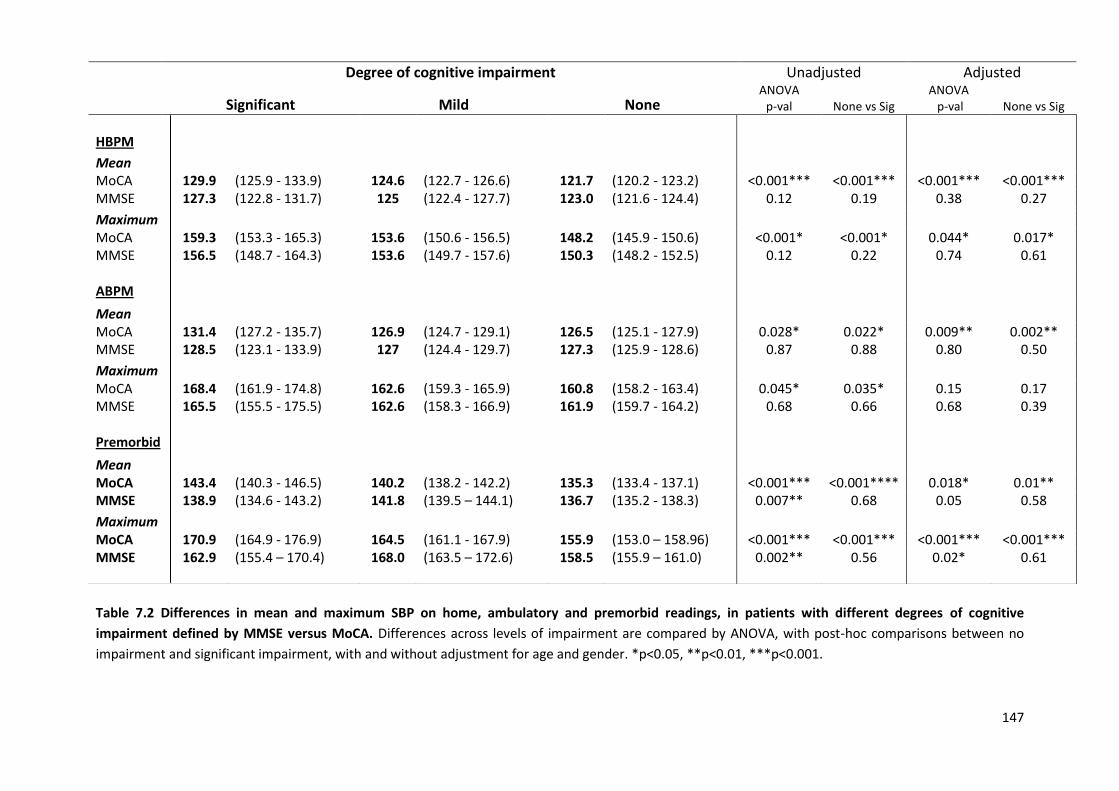
147
Table 7.2 Differences in mean and maximum SBP on home, ambulatory and premorbid readings, in patients with different degrees of cognitive
impairment defined by MMSE versus MoCA. Differences across levels of impairment are compared by ANOVA, with post-hoc comparisons between no
impairment and significant impairment, with and without adjustment for age and gender. *p<0.05, **p<0.01, ***p<0.001.
Degree of cognitive impairment Unadjusted Adjusted
Significant Mild None ANOVA
p-val None vs Sig ANOVA p-val None vs Sig
HBPM
Mean
MoCA 129.9 (125.9 - 133.9) 124.6 (122.7 - 126.6) 121.7 (120.2 - 123.2) <0.001*** <0.001*** <0.001*** <0.001*** MMSE 127.3 (122.8 - 131.7) 125 (122.4 - 127.7) 123.0 (121.6 - 124.4) 0.12 0.19 0.38 0.27
Maximum MoCA 159.3 (153.3 - 165.3) 153.6 (150.6 - 156.5) 148.2 (145.9 - 150.6) <0.001* <0.001* 0.044* 0.017* MMSE 156.5 (148.7 - 164.3) 153.6 (149.7 - 157.6) 150.3 (148.2 - 152.5) 0.12 0.22 0.74 0.61 ABPM
Mean
MoCA 131.4 (127.2 - 135.7) 126.9 (124.7 - 129.1) 126.5 (125.1 - 127.9) 0.028* 0.022* 0.009** 0.002** MMSE 128.5 (123.1 - 133.9) 127 (124.4 - 129.7) 127.3 (125.9 - 128.6) 0.87 0.88 0.80 0.50
Maximum
MoCA 168.4 (161.9 - 174.8) 162.6 (159.3 - 165.9) 160.8 (158.2 - 163.4) 0.045* 0.035* 0.15 0.17 MMSE 165.5 (155.5 - 175.5) 162.6 (158.3 - 166.9) 161.9 (159.7 - 164.2) 0.68 0.66 0.68 0.39 Premorbid
Mean
MoCA 143.4 (140.3 - 146.5) 140.2 (138.2 - 142.2) 135.3 (133.4 - 137.1) <0.001*** <0.001**** 0.018* 0.01** MMSE 138.9 (134.6 - 143.2) 141.8 (139.5 – 144.1) 136.7 (135.2 - 138.3) 0.007** 0.68 0.05 0.58
Maximum
MoCA 170.9 (164.9 - 176.9) 164.5 (161.1 - 167.9) 155.9 (153.0 – 158.96) <0.001*** <0.001*** <0.001*** <0.001*** MMSE 162.9 (155.4 – 170.4) 168.0 (163.5 – 172.6) 158.5 (155.9 – 161.0) 0.002** 0.56 0.02* 0.61
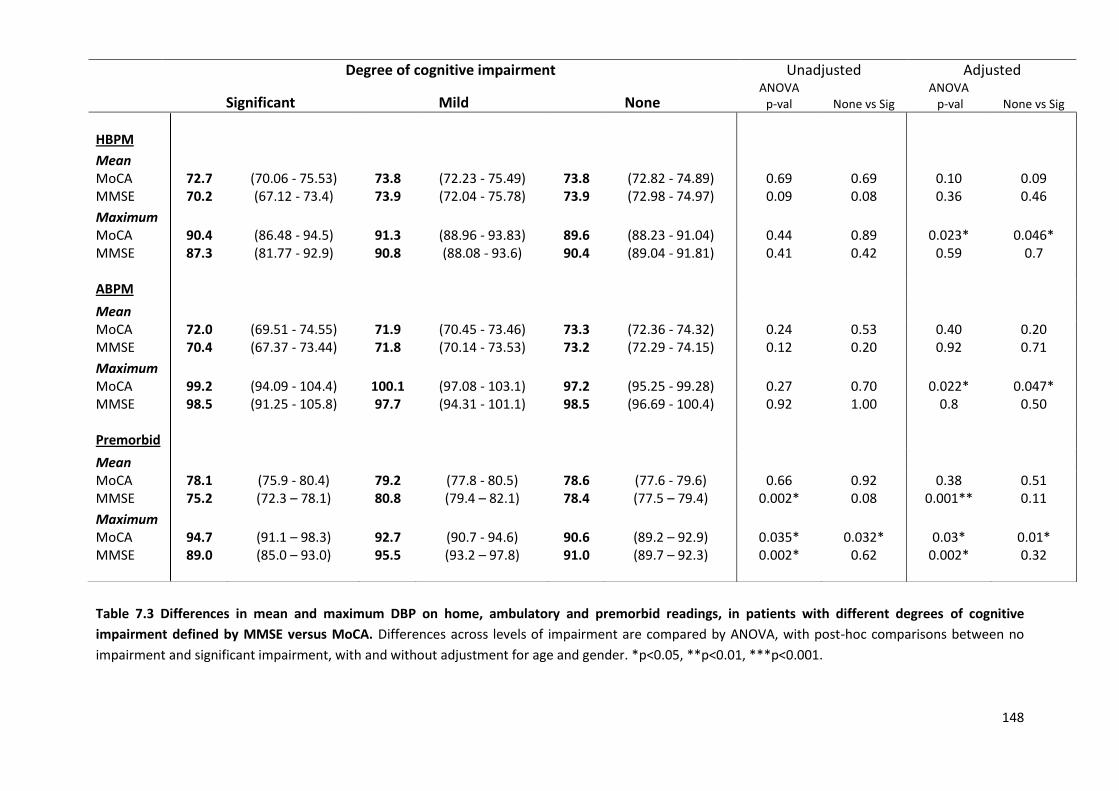
148
Table 7.3 Differences in mean and maximum DBP on home, ambulatory and premorbid readings, in patients with different degrees of cognitive
impairment defined by MMSE versus MoCA. Differences across levels of impairment are compared by ANOVA, with post-hoc comparisons between no
impairment and significant impairment, with and without adjustment for age and gender. *p<0.05, **p<0.01, ***p<0.001.
Degree of cognitive impairment Unadjusted Adjusted
Significant Mild None ANOVA
p-val None vs Sig ANOVA p-val None vs Sig
HBPM
Mean
MoCA 72.7 (70.06 - 75.53) 73.8 (72.23 - 75.49) 73.8 (72.82 - 74.89) 0.69 0.69 0.10 0.09 MMSE 70.2 (67.12 - 73.4) 73.9 (72.04 - 75.78) 73.9 (72.98 - 74.97) 0.09 0.08 0.36 0.46
Maximum MoCA 90.4 (86.48 - 94.5) 91.3 (88.96 - 93.83) 89.6 (88.23 - 91.04) 0.44 0.89 0.023* 0.046* MMSE 87.3 (81.77 - 92.9) 90.8 (88.08 - 93.6) 90.4 (89.04 - 91.81) 0.41 0.42 0.59 0.7 ABPM
Mean
MoCA 72.0 (69.51 - 74.55) 71.9 (70.45 - 73.46) 73.3 (72.36 - 74.32) 0.24 0.53 0.40 0.20 MMSE 70.4 (67.37 - 73.44) 71.8 (70.14 - 73.53) 73.2 (72.29 - 74.15) 0.12 0.20 0.92 0.71
Maximum
MoCA 99.2 (94.09 - 104.4) 100.1 (97.08 - 103.1) 97.2 (95.25 - 99.28) 0.27 0.70 0.022* 0.047* MMSE 98.5 (91.25 - 105.8) 97.7 (94.31 - 101.1) 98.5 (96.69 - 100.4) 0.92 1.00 0.8 0.50 Premorbid
Mean
MoCA 78.1 (75.9 - 80.4) 79.2 (77.8 - 80.5) 78.6 (77.6 - 79.6) 0.66 0.92 0.38 0.51 MMSE 75.2 (72.3 – 78.1) 80.8 (79.4 – 82.1) 78.4 (77.5 – 79.4) 0.002* 0.08 0.001** 0.11
Maximum
MoCA 94.7 (91.1 – 98.3) 92.7 (90.7 - 94.6) 90.6 (89.2 – 92.9) 0.035* 0.032* 0.03* 0.01* MMSE 89.0 (85.0 – 93.0) 95.5 (93.2 – 97.8) 91.0 (89.7 – 92.3) 0.002* 0.62 0.002* 0.32
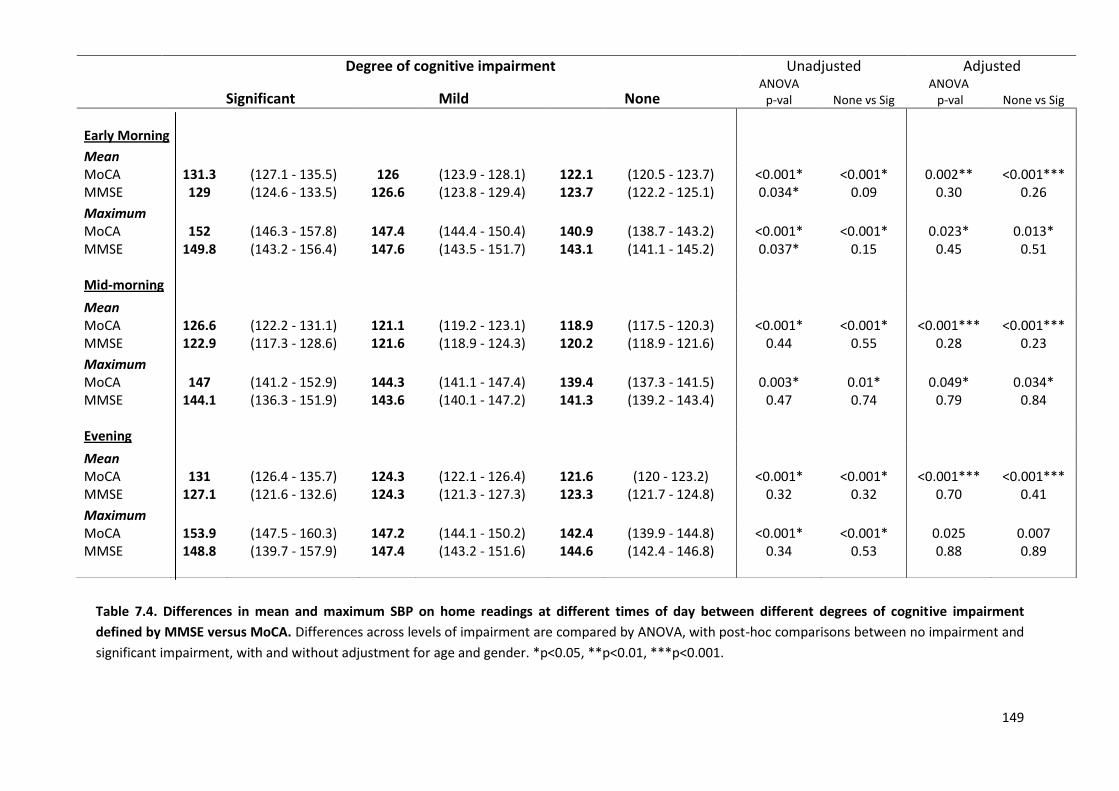
149
Table 7.4. Differences in mean and maximum SBP on home readings at different times of day between different degrees of cognitive impairment
defined by MMSE versus MoCA. Differences across levels of impairment are compared by ANOVA, with post-hoc comparisons between no impairment and
significant impairment, with and without adjustment for age and gender. *p<0.05, **p<0.01, ***p<0.001.
Degree of cognitive impairment Unadjusted Adjusted
Significant Mild None ANOVA
p-val None vs Sig ANOVA p-val None vs Sig
Early Morning
Mean
MoCA 131.3 (127.1 - 135.5) 126 (123.9 - 128.1) 122.1 (120.5 - 123.7) <0.001* <0.001* 0.002** <0.001*** MMSE 129 (124.6 - 133.5) 126.6 (123.8 - 129.4) 123.7 (122.2 - 125.1) 0.034* 0.09 0.30 0.26
Maximum MoCA 152 (146.3 - 157.8) 147.4 (144.4 - 150.4) 140.9 (138.7 - 143.2) <0.001* <0.001* 0.023* 0.013* MMSE 149.8 (143.2 - 156.4) 147.6 (143.5 - 151.7) 143.1 (141.1 - 145.2) 0.037* 0.15 0.45 0.51 Mid-morning
Mean
MoCA 126.6 (122.2 - 131.1) 121.1 (119.2 - 123.1) 118.9 (117.5 - 120.3) <0.001* <0.001* <0.001*** <0.001*** MMSE 122.9 (117.3 - 128.6) 121.6 (118.9 - 124.3) 120.2 (118.9 - 121.6) 0.44 0.55 0.28 0.23
Maximum
MoCA 147 (141.2 - 152.9) 144.3 (141.1 - 147.4) 139.4 (137.3 - 141.5) 0.003* 0.01* 0.049* 0.034* MMSE 144.1 (136.3 - 151.9) 143.6 (140.1 - 147.2) 141.3 (139.2 - 143.4) 0.47 0.74 0.79 0.84 Evening
Mean
MoCA 131 (126.4 - 135.7) 124.3 (122.1 - 126.4) 121.6 (120 - 123.2) <0.001* <0.001* <0.001*** <0.001*** MMSE 127.1 (121.6 - 132.6) 124.3 (121.3 - 127.3) 123.3 (121.7 - 124.8) 0.32 0.32 0.70 0.41
Maximum
MoCA 153.9 (147.5 - 160.3) 147.2 (144.1 - 150.2) 142.4 (139.9 - 144.8) <0.001* <0.001* 0.025 0.007 MMSE 148.8 (139.7 - 157.9) 147.4 (143.2 - 151.6) 144.6 (142.4 - 146.8) 0.34 0.53 0.88 0.89
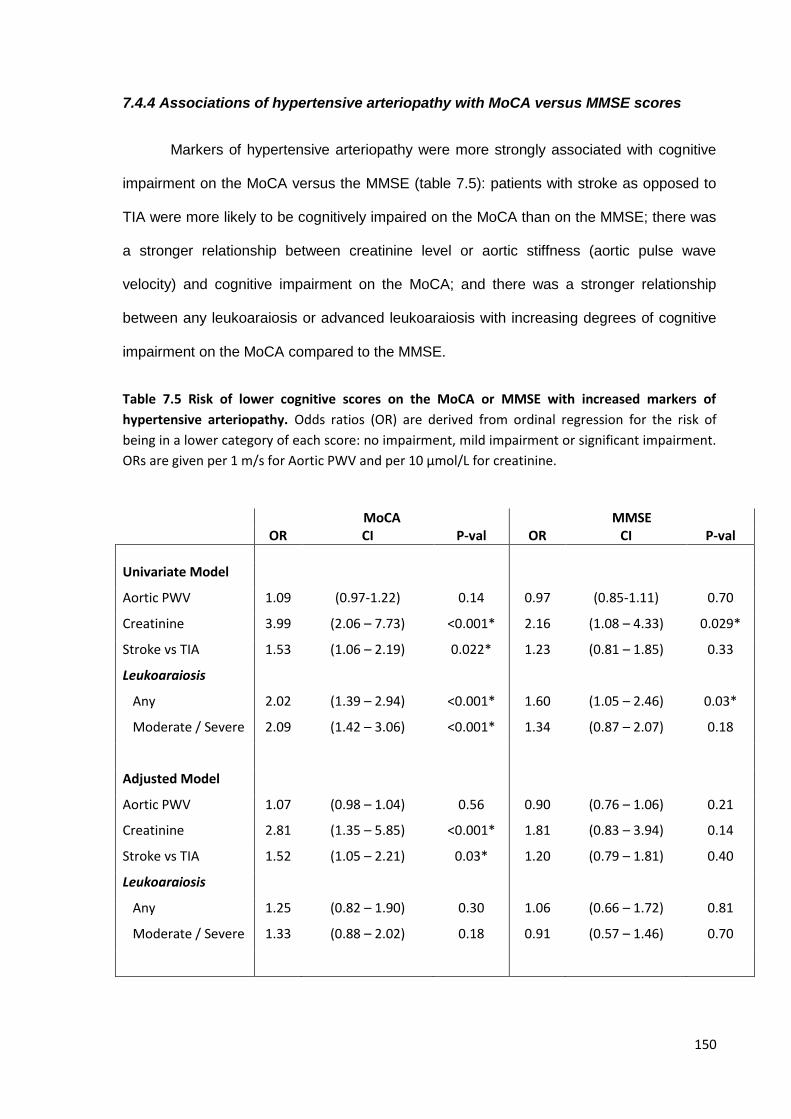
150
7.4.4 Associations of hypertensive arteriopathy with MoCA versus MMSE scores
Markers of hypertensive arteriopathy were more strongly associated with cognitive
impairment on the MoCA versus the MMSE (table 7.5): patients with stroke as opposed to
TIA were more likely to be cognitively impaired on the MoCA than on the MMSE; there was
a stronger relationship between creatinine level or aortic stiffness (aortic pulse wave
velocity) and cognitive impairment on the MoCA; and there was a stronger relationship
between any leukoaraiosis or advanced leukoaraiosis with increasing degrees of cognitive
impairment on the MoCA compared to the MMSE.
Table 7.5 Risk of lower cognitive scores on the MoCA or MMSE with increased markers of
hypertensive arteriopathy. Odds ratios (OR) are derived from ordinal regression for the risk of
being in a lower category of each score: no impairment, mild impairment or significant impairment.
ORs are given per 1 m/s for Aortic PWV and per 10 μmol/L for creatinine.
MoCA MMSE OR CI P-val OR CI P-val
Univariate Model
Aortic PWV 1.09 (0.97-1.22) 0.14 0.97 (0.85-1.11) 0.70
Creatinine 3.99 (2.06 – 7.73) <0.001* 2.16 (1.08 – 4.33) 0.029*
Stroke vs TIA 1.53 (1.06 – 2.19) 0.022* 1.23 (0.81 – 1.85) 0.33
Leukoaraiosis
Any
Moderate / Severe
2.02
2.09
(1.39 – 2.94)
(1.42 – 3.06)
<0.001*
<0.001*
1.60
1.34
(1.05 – 2.46)
(0.87 – 2.07)
0.03*
0.18
Adjusted Model
Aortic PWV 1.07 (0.98 – 1.04) 0.56 0.90 (0.76 – 1.06) 0.21
Creatinine 2.81 (1.35 – 5.85) <0.001* 1.81 (0.83 – 3.94) 0.14
Stroke vs TIA 1.52 (1.05 – 2.21) 0.03* 1.20 (0.79 – 1.81) 0.40
Leukoaraiosis
Any
Moderate / Severe
1.25
1.33
(0.82 – 1.90)
(0.88 – 2.02)
0.30
0.18
1.06
0.91
(0.66 – 1.72)
(0.57 – 1.46)
0.81
0.70
151
7.4.5 Relationship between cognitive subdomains and mean or maximum BP
The visuo-spatial / executive sub-domain of the MoCA test was the domain most
strongly associated with mean SBP on HBPM and premorbid readings, with and without
adjustment for age and gender, with a 29% increased chance of having a lower score for
each 10mmHg increase in SBP. Mean SBP was also a significant predictor of a lower score
on attentional and language tasks before and after adjustment for age and gender (table
7.6 and 7.7). There were univariate associations between mean SBP and scores for
naming and recall (webtable 7.6), but these were not present after adjustment for age and
gender. Drawing inter-locking pentagons, the only visuo-spatial / executive test on the
MMSE, was also strongly associated with mean SBP on HBPM (table 7.6), with and without
adjustment, but there were only weak univariate associations with recall and orientation
scores and no associations with language or naming scores (tables 7.6 and 7.7).
Each subdomain of the MoCA test was more strongly associated with mean SBP
than the equivalent subdomain on the MMSE, except for orientation. This partly reflected a
ceiling effect with the MMSE, with more patients achieving full marks in each domain except
for attention: visuo-spatial (MMSE 84% vs MoCA 37.6%, p<0.001); language (91.4% vs
37.1%, p<0.001); naming (98.5% vs 82.3%, p<0.001); recall (52.9% vs 13%, p<0.001);
orientation (74.7% vs 79.7%, p<0.001); attention (54.2% vs 51.6%, p=0.34). In addition to
stronger relationships within each cognitive domain, the visuo-spatial domain determined a
greater proportion of the inter-individual variance in total score with the MoCA compared to
the MMSE (15.6% vs 8.1% of total variance uniquely explained by sub-domains), with recall
and attention scores being the next most important contributors (MoCA: recall 35.6%;
attention 15%, MMSE: recall 34.7%; attention 57%). Despite contributing a third of the total
MMSE score, orientation only contributed 12% of uniquely explained variance in the total
score.
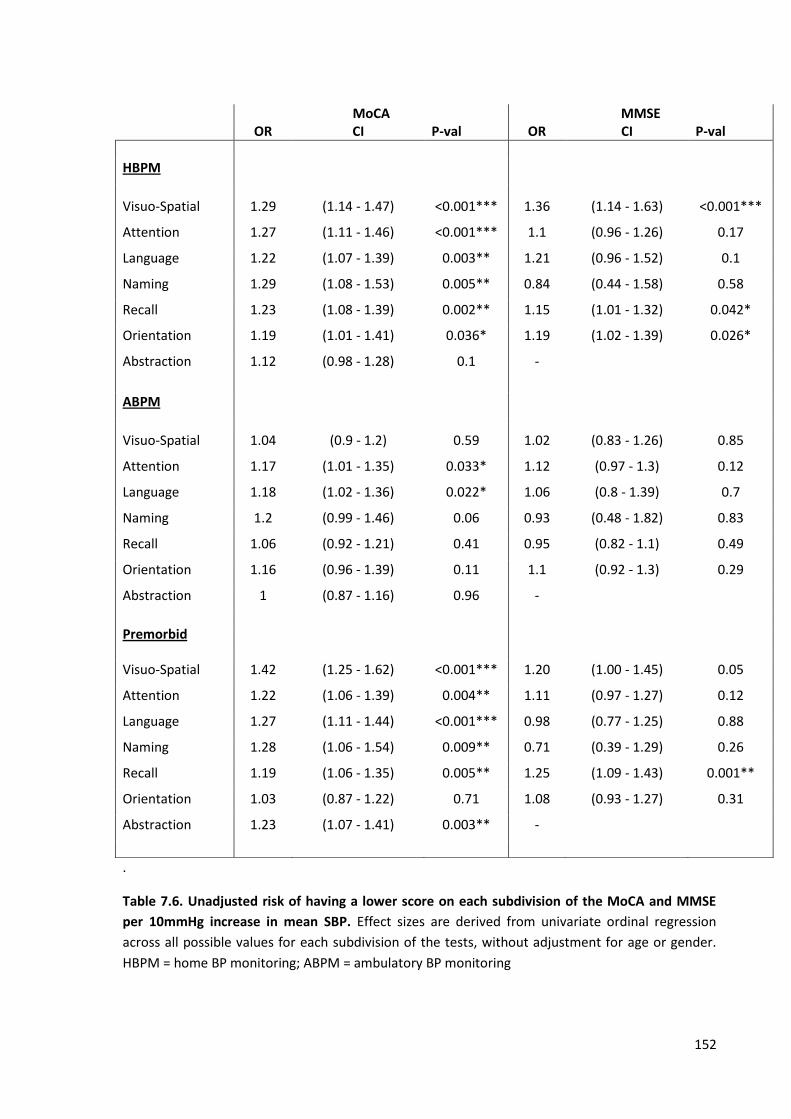
152
.
Table 7.6. Unadjusted risk of having a lower score on each subdivision of the MoCA and MMSE
per 10mmHg increase in mean SBP. Effect sizes are derived from univariate ordinal regression
across all possible values for each subdivision of the tests, without adjustment for age or gender.
HBPM = home BP monitoring; ABPM = ambulatory BP monitoring
MoCA MMSE OR CI P-val OR CI P-val
HBPM
Visuo-Spatial 1.29 (1.14 - 1.47) <0.001*** 1.36 (1.14 - 1.63) <0.001***
Attention 1.27 (1.11 - 1.46) <0.001*** 1.1 (0.96 - 1.26) 0.17
Language 1.22 (1.07 - 1.39) 0.003** 1.21 (0.96 - 1.52) 0.1
Naming 1.29 (1.08 - 1.53) 0.005** 0.84 (0.44 - 1.58) 0.58
Recall 1.23 (1.08 - 1.39) 0.002** 1.15 (1.01 - 1.32) 0.042*
Orientation 1.19 (1.01 - 1.41) 0.036* 1.19 (1.02 - 1.39) 0.026*
Abstraction 1.12 (0.98 - 1.28) 0.1 -
ABPM
Visuo-Spatial 1.04 (0.9 - 1.2) 0.59 1.02 (0.83 - 1.26) 0.85
Attention 1.17 (1.01 - 1.35) 0.033* 1.12 (0.97 - 1.3) 0.12
Language 1.18 (1.02 - 1.36) 0.022* 1.06 (0.8 - 1.39) 0.7
Naming 1.2 (0.99 - 1.46) 0.06 0.93 (0.48 - 1.82) 0.83
Recall 1.06 (0.92 - 1.21) 0.41 0.95 (0.82 - 1.1) 0.49
Orientation 1.16 (0.96 - 1.39) 0.11 1.1 (0.92 - 1.3) 0.29
Abstraction 1 (0.87 - 1.16) 0.96 -
Premorbid
Visuo-Spatial 1.42 (1.25 - 1.62) <0.001*** 1.20 (1.00 - 1.45) 0.05
Attention 1.22 (1.06 - 1.39) 0.004** 1.11 (0.97 - 1.27) 0.12
Language 1.27 (1.11 - 1.44) <0.001*** 0.98 (0.77 - 1.25) 0.88
Naming 1.28 (1.06 - 1.54) 0.009** 0.71 (0.39 - 1.29) 0.26
Recall 1.19 (1.06 - 1.35) 0.005** 1.25 (1.09 - 1.43) 0.001**
Orientation 1.03 (0.87 - 1.22) 0.71 1.08 (0.93 - 1.27) 0.31
Abstraction 1.23 (1.07 - 1.41) 0.003** -
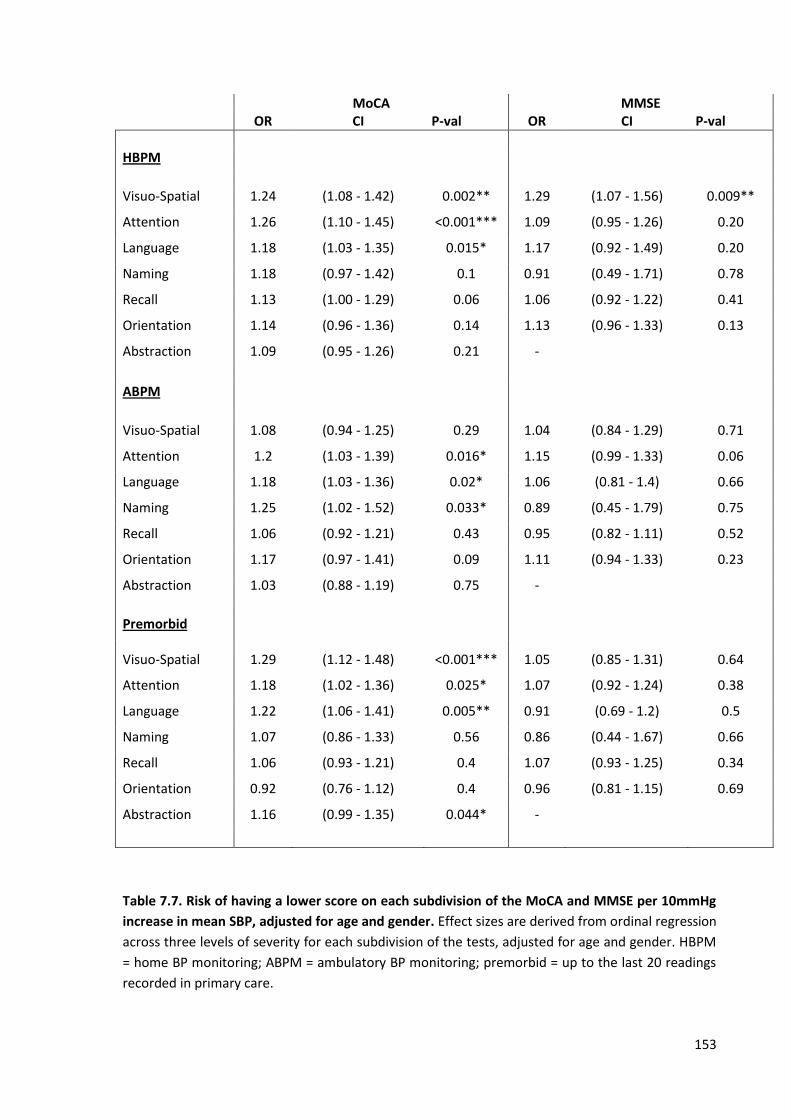
153
MoCA MMSE OR CI P-val OR CI P-val
HBPM
Visuo-Spatial 1.24 (1.08 - 1.42) 0.002** 1.29 (1.07 - 1.56) 0.009**
Attention 1.26 (1.10 - 1.45) <0.001*** 1.09 (0.95 - 1.26) 0.20
Language 1.18 (1.03 - 1.35) 0.015* 1.17 (0.92 - 1.49) 0.20
Naming 1.18 (0.97 - 1.42) 0.1 0.91 (0.49 - 1.71) 0.78
Recall 1.13 (1.00 - 1.29) 0.06 1.06 (0.92 - 1.22) 0.41
Orientation 1.14 (0.96 - 1.36) 0.14 1.13 (0.96 - 1.33) 0.13
Abstraction 1.09 (0.95 - 1.26) 0.21 -
ABPM
Visuo-Spatial 1.08 (0.94 - 1.25) 0.29 1.04 (0.84 - 1.29) 0.71
Attention 1.2 (1.03 - 1.39) 0.016* 1.15 (0.99 - 1.33) 0.06
Language 1.18 (1.03 - 1.36) 0.02* 1.06 (0.81 - 1.4) 0.66
Naming 1.25 (1.02 - 1.52) 0.033* 0.89 (0.45 - 1.79) 0.75
Recall 1.06 (0.92 - 1.21) 0.43 0.95 (0.82 - 1.11) 0.52
Orientation 1.17 (0.97 - 1.41) 0.09 1.11 (0.94 - 1.33) 0.23
Abstraction 1.03 (0.88 - 1.19) 0.75 -
Premorbid
Visuo-Spatial 1.29 (1.12 - 1.48) <0.001*** 1.05 (0.85 - 1.31) 0.64
Attention 1.18 (1.02 - 1.36) 0.025* 1.07 (0.92 - 1.24) 0.38
Language 1.22 (1.06 - 1.41) 0.005** 0.91 (0.69 - 1.2) 0.5
Naming 1.07 (0.86 - 1.33) 0.56 0.86 (0.44 - 1.67) 0.66
Recall 1.06 (0.93 - 1.21) 0.4 1.07 (0.93 - 1.25) 0.34
Orientation 0.92 (0.76 - 1.12) 0.4 0.96 (0.81 - 1.15) 0.69
Abstraction 1.16 (0.99 - 1.35) 0.044* -
Table 7.7. Risk of having a lower score on each subdivision of the MoCA and MMSE per 10mmHg
increase in mean SBP, adjusted for age and gender. Effect sizes are derived from ordinal regression
across three levels of severity for each subdivision of the tests, adjusted for age and gender. HBPM
= home BP monitoring; ABPM = ambulatory BP monitoring; premorbid = up to the last 20 readings
recorded in primary care.
154
7.5 Discussion
Cognitive impairment after TIA or non-disabling stroke was strongly associated with
hypertensive arteriopathy and an elevated mean or maximum SBP on post-event home BP
monitoring, ABPM and on premorbid blood pressure readings, including readings more than
5 years prior to the initial cerebrovascular event. The MoCA test was significantly more
sensitive than the MMSE for hypertension-associated cognitive impairment due to stronger
associations within all cognitive sub-domains and a greater contribution of visuo-spatial /
executive tests to the total MoCA score.
Dementia affects 5-7% of people ≥60 years old worldwide,25 costing EU-15
countries approximately $189 billion per year,26 and is set to double every 20 years to affect
approximately 115 million people by 2050.25 However, there is currently no effective
treatment for the prevention of either the onset or progression of cognitive impairment. Of
multiple risk factors that are associated with dementia, hypertension7 and cerebrovascular
disease2 are particularly strongly associated and are the most readily modifiable risk factors
for the prevention of future cognitive decline. Unfortunately randomised controlled trials of
blood-pressure lowering medications have produced mixed results. In the Syst-Eur trial,8
randomisation to a nitrendipine based regimen reduced the future risk of cognitive decline
compared to placebo, but this has not been consistently replicated in studies with other
classes of antihypertensive medications in either primary prevention9, 10, 27 or secondary
prevention of cerebrovascular disease,11, 12 and meta-analyses have produced inconsistent
results.9, 28 However, these trials have predominantly used the MMSE in assessing
cognitive function even though the MMSE is insensitive to abnormalities in visuo-executive
functions which are preferentially affected in vascular cognitive impairment,13 and cause a
significant burden of functional impairment and death.29
In previous observational studies, the MoCA test defined more patients as being
cognitively impaired than the MMSE in populations with cerebrovascular disease,20
Alzheimer’s,14, 15 and Parkinson’s disease,16 and had a greater sensitivity for cognitive
155
impairment defined by a gold-standard neuropsychological battery in cerebrovascular
disease.23 However, these studies only showed differences in the number of patients
achieving a specific score or differences in associations with extended psychological
batteries using similar measurement methods. In contrast, this study demonstrated a strong
physiological association between premorbid hypertension or hypertensive arteriopathy, the
most important risk factor for cerebrovascular disease, and the cognitive impairment
identified by the MoCA test compared to the MMSE, thus suggesting a clinically relevant
organic basis. Indeed the similar mean SBP 5-10 versus 0-5 years prior to the event,
suggests that hypertension might precede and potentially cause the additional cognitive
impairment identified by the MoCA.
The improved sensitivity for hypertension-associated cognitive impairment with the
MoCA test was present for a wide range of cognitive domains due to a ceiling effect for
most of the tests on the MMSE. However, the strongest association was with visuo-spatial
/executive function which contributed more to variation in the overall MoCA score than the
MMSE score, resulting in the greater overall sensitivity for vascular-type cognitive
impairment, such as is associated with hypertension6 and cerebrovascular disease.29
Hypertension has been strongly associated with both chronic small vessel disease6 and a
risk of future cognitive decline in longitudinal studies.7 Therefore, this study shows that the
failure of trials to demonstrate improvements in cognitive dysfunction with blood pressure
reduction may partly result from the low sensitivity of the MMSE for hypertension-
associated, vascular-type cognitive impairment, due to under-representation of visuo-spatial
/ executive functions on the MMSE. It also suggests that use of the MoCA should be more
effective at detecting clinically important reductions in cognitive decline following blood
pressure reduction.
The MoCA test may also identify those patients with the greatest potential for
cognitive benefit from blood pressure lowering. After a stroke, cognitive dysfunction can
result either from the effects of the cerebrovascular event itself,2 from associated chronic
156
small vessel disease,29 from recurrent events2 or from a combination of these, with severe
cognitive decline occurring in patients with acute events on the background of decreased
cognitive reserve. Therefore, cognitive impairment on the MoCA may identify patients at a
particularly increased risk of future cognitive decline due to both progression of chronic
cognitive impairment and the risk of recurrent cerebrovascular events. In this group,
hypertension is a significant, treatable risk factor with the potential to prevent cognitive
decline at an earlier stage than cognitive impairment identified on the MMSE. Trials in this
population may be more sensitive to benefits of blood pressure lowering treatment, which
has previously been difficult to demonstrate in larger primary prevention populations.
Finally, the greater validity and sensitivity of the MoCA in comparison to the MMSE
for vascular type cognitive impairment demonstrated in this study also suggests that it will
be a better test for assessing any association between cognitive impairment and variability
in blood pressure. Specifically, the strong association with subdomains related to vascular
dementia may help to discriminate whether BP variability is likely to be a causative factor in
the progression of vascular cognitive impairment as opposed to a marker of global cognitive
dysfunction, with increased BP variability due to greater inaccuracies in measurement.
These associations are currently being investigated in the ongoing blood pressure
monitoring study with the benefit of more prolonged follow-up.
This analysis has limitations. Firstly, the population studied included relatively
healthy patients with cerebrovascular disease as they needed to be able to perform home
blood pressure monitoring. This excluded patients with severe dementia or major stroke
with significant residual cognitive impairment. However, this is the ideal population in whom
strategies to prevent cognitive decline are likely to bring the greatest benefits. Secondly, as
mentioned, there was insufficient follow-up to determine whether the MoCA test had a
greater sensitivity for progression of hypertension-associated cognitive impairment. Thirdly,
premorbid blood pressure readings were not available in some patients, but these were
largely young patients without any cognitive impairment. Fourthly, MoCA tests were only
157
performed from 6 months after the clinical event. However, this demonstrates the chronic
nature of the association once the cognitive effects of the acute event have passed.30
Fifthly, we used only one marker of cerebral small vessel disease(hyperintensities on T2
weighted imaging), and did not assess associations between dysfunction on the MoCA and
other markers of cerebrovascular injuries known to be associated with both hypertension
and dementia, such as dilated perivascular spaces and cerebral microbleeds.31 Although it
will be important to determine the relevance of dilated perivascular spaces and cerebral
microbleeds to vascular cognitive impairment in the OXVASC population and to determine
the importance of hypertension given associations between BP variability and
microbleeds,32 we used the best established marker of cerebral small vessel disease to
validate the cognitive tests as the precise relationships between the more novel markers
and cognitive impairment are not as well defined.
In conclusion, the MoCA identifies more hypertension-associated cognitive
impairment than the MMSE in patients with a history of TIA and non-disabling stroke,
implying a pathophysiologically relevant basis for differences between the scores. This
results from a greater sensitivity with the MoCA to hypertension-associated cognitive
impairment across multiple cognitive domains, particularly due to its greater emphasis on
visuo-spatial / executive function. The MoCA test may identify a cohort of patients at a
particularly increased risk of future cognitive decline in whom targeted blood pressure
lowering treatment may be of specific benefit, and is likely to be the optimal test for
determining associations between cognitive impairment and blood pressure variability. The
poor sensitivity of the MMSE to hypertension-associated cognitive impairment may explain
the apparent lack of efficacy of antihypertensive medications in preventing cognitive decline
in randomised controlled trials.
158
7.6 References
1. Verdelho A, Madureira S, Moleiro C, et al. White matter changes and diabetes predict cognitive decline in the elderly: the LADIS study. Neurology 2010;75:160-167. 2. Pendlebury ST, Rothwell PM. Prevalence, incidence, and factors associated with pre-stroke and post-stroke dementia: a systematic review and meta-analysis. Lancet Neurol 2009;8:1006-1018. 3. MacMahon S, Peto R, Cutler J, et al. Blood pressure, stroke, and coronary heart disease. Part 1, Prolonged differences in blood pressure: prospective observational studies corrected for the regression dilution bias. Lancet 1990;335:765-774. 4. Lewington S, Clarke R, Qizilbash N, Peto R, Collins R. Age-specific relevance of usual blood pressure to vascular mortality: a meta-analysis of individual data for one million adults in 61 prospective studies. Lancet 2002;360:1903-1913. 5. Rothwell PM, Giles MF, Flossmann E, et al. A simple score (ABCD) to identify individuals at high early risk of stroke after transient ischaemic attack. Lancet 2005;366:29-36. 6. Khan U, Porteous L, Hassan A, Markus HS. Risk factor profile of cerebral small vessel disease and its subtypes. J Neurol Neurosurg Psychiatry 2007;78:702-706. 7. Qiu C, Winblad B, Fratiglioni L. The age-dependent relation of blood pressure to cognitive function and dementia. Lancet Neurol 2005;4:487-499. 8. Forette F, Seux ML, Staessen JA, et al. Prevention of dementia in randomised double-blind placebo-controlled Systolic Hypertension in Europe (Syst-Eur) trial. Lancet 1998;352:1347-1351. 9. Peters R, Beckett N, Forette F, et al. Incident dementia and blood pressure lowering in the Hypertension in the Very Elderly Trial cognitive function assessment (HYVET-COG): a double-blind, placebo controlled trial. Lancet Neurol 2008;7:683-689. 10. Di Bari M, Pahor M, Franse LV, et al. Dementia and disability outcomes in large hypertension trials: lessons learned from the systolic hypertension in the elderly program (SHEP) trial. Am J Epidemiol 2001;153:72-78. 11. Tzourio C, Anderson C, Chapman N, et al. Effects of blood pressure lowering with perindopril and indapamide therapy on dementia and cognitive decline in patients with cerebrovascular disease. Arch Intern Med 2003;163:1069-1075. 12. Diener H-C, Sacco RL, Yusuf S, et al. Effects of aspirin plus extended-release dipyridamole versus clopidogrel and telmisartan on disability and cognitive function after recurrent stroke in patients with ischaemic stroke in the Prevention Regimen for Effectively Avoiding Second Strokes (PRoFESS) trial: a double-blind, active and placebo-controlled study. The Lancet Neurology 2008;7:875-884. 13. Pendlebury ST, Markwick A, de Jager CA, Zamboni G, Wilcock GK, Rothwell PM. Differences in cognitive profile between TIA, stroke and elderly memory research subjects: a comparison of the MMSE and MoCA. Cerebrovasc Dis 2012;34:48-54. 14. Nazem S, Siderowf AD, Duda JE, et al. Montreal cognitive assessment performance in patients with Parkinson's disease with "normal" global cognition according to mini-mental state examination score. J Am Geriatr Soc 2009;57:304-308. 15. Smith T, Gildeh N, Holmes C. The Montreal Cognitive Assessment: validity and utility in a memory clinic setting. Canadian journal of psychiatry Revue canadienne de psychiatrie 2007;52:329-332. 16. Nasreddine ZS, Phillips NA, Bedirian V, et al. The Montreal Cognitive Assessment, MoCA: a brief screening tool for mild cognitive impairment. J Am Geriatr Soc 2005;53:695-699. 17. Pendlebury ST, Cuthbertson FC, Welch SJ, Mehta Z, Rothwell PM. Underestimation of cognitive impairment by mini-mental state examination versus the montreal cognitive assessment in patients with transient ischemic attack and stroke: a population-based study. Stroke 2010;41:1290-1293.
159
18. Rothwell PM, Coull AJ, Silver LE, et al. Population-based study of event-rate, incidence, case fatality, and mortality for all acute vascular events in all arterial territories (Oxford Vascular Study). Lancet 2005;366:1773-1783. 19. Rothwell PM, Giles MF, Chandratheva A, et al. Effect of urgent treatment of transient ischaemic attack and minor stroke on early recurrent stroke (EXPRESS study): a prospective population-based sequential comparison. Lancet 2007;370:1432-1442. 20. Pendlebury ST, Rothwell PM. Risk of recurrent stroke, other vascular events and dementia after transient ischaemic attack and stroke. Cerebrovasc Dis 2009;27 Suppl 3:1-11. 21. Tombaugh TN, McIntyre NJ. The mini-mental state examination: a comprehensive review. J Am Geriatr Soc 1992;40:922-935. 22. Damian AM, Jacobson SA, Hentz JG, et al. The Montreal Cognitive Assessment and the mini-mental state examination as screening instruments for cognitive impairment: item analyses and threshold scores. Dement Geriatr Cogn Disord 2011;31:126-131. 23. Pendlebury ST, Mariz J, Bull L, Mehta Z, Rothwell PM. MoCA, ACE-R, and MMSE versus the National Institute of Neurological Disorders and Stroke-Canadian Stroke Network Vascular Cognitive Impairment Harmonization Standards Neuropsychological Battery after TIA and stroke. Stroke 2012;43:464-469. 24. Casadei R, Parati G, Pomidossi G, et al. 24-hour blood pressure monitoring: evaluation of Spacelabs 5300 monitor by comparison with intra-arterial blood pressure recording in ambulant subjects. J Hypertens 1988;6:797-803. 25. Prince M, Bryce R, Albanese E, Wimo A, Ribeiro W, Ferri CP. The global prevalence of dementia: a systematic review and metaanalysis. Alzheimer's & dementia : the journal of the Alzheimer's Association 2013;9:63-75 e62. 26. Luengo-Fernandez R, Leal J, Gray AM. Cost of dementia in the pre-enlargement countries of the European Union. J Alzheimers Dis 2011;27:187-196. 27. Skoog I, Lithell H, Hansson L, et al. Effect of Baseline Cognitive Function and Antihypertensive Treatment on Cognitive and Cardiovascular Outcomes: Study on COgnition and Prognosis in the Elderly (SCOPE). American Journal of Hypertension 2005;18:1052-1059. 28. Mcguiness B, Todd S, Passmore P, Bullock R. Blood pressure lowering in patients without prior cerebrovascular disease for prevention of cognitive impairment and dementia (Review). Cochrane Db Syst Rev 2009. 29. Inzitari D, Pracucci G, Poggesi A, et al. Changes in white matter as determinant of global functional decline in older independent outpatients: three year follow-up of LADIS (leukoaraiosis and disability) study cohort. Bmj 2009;339:b2477. 30. Pendlebury ST, Wadling S, Silver LE, Mehta Z, Rothwell PM. Transient cognitive impairment in TIA and minor stroke. Stroke 2011;42:3116-3121. 31. Wardlaw JM, Smith EE, Biessels GJ, Cordonnier C, Fazekas F, Frayne R, Lindley RI et al. Neuroimaging standards for research into small vessel disease and its contribution to ageing and neurodegeneration. Lancet Neurol 2013; 12: 822-838. 32. Liu W, Liu R, Sun W, Peng Q, Zhang W, Xu E, Cheng Y, Ding M, Li Y, Hong Z, Wu J, Zeng J, Yao C, Huang Y; CASISP Study Group. Different impacts of blood pressure variability on the progression of cerebral microbleeds and white matter lesions. Stroke. 2012;43:2916-22
160
CHAPTER EIGHT
Effects of antihypertensive drug classes and their
combination on within-individual day-to-day variability in
home blood pressure
8.1 Summary 161
8.2 Introduction 162
8.3 Methods 163
8.3.1 Study population 163
8.3.2 Analysis 163
8.3.3 Statistical analysis 164
8.4 Findings 165
8.4.1 Study population 165
8.4.2 Baseline characteristics 166
8.4.3 Unadjusted drug class effects on global SBP variability 167
8.4.4 Adjusted drug class effects on global SBP variability 168
8.4.5 Differences in drug class effects by time of day 171
8.5 Discussion 172
8.6 References 176
161
8.1 Summary
In all available RCTs in Chapter 4, intra-individual visit-to-visit variability in systolic
blood pressure (SBP) was reduced by calcium channel blockers (CCBs) or diuretics
compared to beta-blockers or renin-angiotensin system inhibitors (RASi). I determined if
class effects were manifest on home day-to-day SBP variability between each time of day
or on diurnal variability.
I analysed the effect of addition or increases in dose of classes of antihypertensive
drugs on BP variability on home monitoring (HBPM) in the OXVASC population. Patients
were treated with drugs associated with low SBP variability (CCBs or diuretics), with high
SBP variability (predominantly RASi) or with a combination of a RASi and a diuretic, at the
physician’s discretion. Differences in change in variability (CV) from 3-10 days before to 8-
15 days after starting or increasing drug dose were compared by general linear models.
Among 288 eligible interventions in 500 patients, SBP variability was reduced by a
low variability vs combination vs high variability treatment regimen (-4.0 vs 6.9 vs 7.8%,
p=0.015), due to a greater reduction in max SBP (-4.6 vs -1.0 vs -1.0%, p=0.001), with no
differences in effect on mean or minimum SBP. This resulted from differences in early
morning CV-SBP (3.6 vs 17.0 vs 38.3 p=0.002), which was dependent on differences in
max SBP (-4.8 vs -2.0 vs -0.7, p=0.001), with no differences between mid-morning readings
(p=0.29), evening readings (p=0.65) or within-day (p=0.92).
Consistent with effects on clinic SBP, CCBs and diuretics reduced home day-to-day
SBP variability compared to RASi. Addition of a diuretic to a RASi limited the excess
increase in SBP variability. Differences in SBP variability and maximum SBP resulted from
drug-class differences after waking rather than on mid-morning or evening SBP.
162
8.2 Introduction
Visit-to-visit variability in SBP predicts the occurrence of new and recurrent stroke,
all-cause mortality and cardiovascular mortality, as demonstrated in chapter 2. It is reduced
by randomisation to treatment regimens based on calcium channel blockers (CCB) or
diuretics compared to beta-blockers or renin-angiotensin system inhibitors (RASi) (chapter
3), explaining effects on stroke risk and other cardiovascular events.1-3 Drug effects on SBP
variability were seen in a wide-range of patients and persist when used in combination,
although this has only been shown with group inter-individual rather than intra-individual
SBP variability.4 Despite these studies, the mechanisms underlying these drug effects are
unclear. Furthermore, the studies discussed in chapter 3 only assessed effects of
antihypertensive medications on variability in clinic or ambulatory blood pressure whereas
mean SBP, maximum SBP and variability in SBP on self-measured home blood pressure
are more strongly associated with hypertension, hypertensive arteriopathy and future
cardiovascular events (chapters 5-6).
The diurnal variation in risk of stroke is similar to the diurnal variation in blood
pressure, with the highest risk of stroke in the early morning during the post-waking
morning surge in blood pressure.5 Differences in drug effects on SBP variability at different
times of day may therefore provide alternative explanations for the greater efficacy of CCBs
and diuretics at preventing stroke: either by consistently reducing diurnal variation in blood
pressure or by limiting episodic peaks in blood pressure at different times of day. For
example, as the morning surge in SBP is highly variable within individuals from day to day,6
limiting excessive surges would reduce day-to-day variability.
Therefore, given that the overall effects of these drug classes have been reliably
documented in RCTs, I explored the effect of different classes of antihypertensive drugs,
and the effect of the combination of a RASI with a diuretic, on SBP variability on HBPM,
including effects on diurnal variability and day-to-day variability at each time of day.
163
8.3 Methods
8.3.1 Study Population
As in chapters 5-7, consecutive patients were recruited between April 2008 and
January 2012 from the Oxford Vascular Study’s (OXVASC)7 TIA and minor stroke clinic,
usually within twenty-four hours of referral.8 From the ascertainment visit, or the earliest
opportunity after discharge, all patients performed sets of three home BP readings (HBPM),
three times daily (on waking, mid-morning at ~10-11am and before sleep) with a Bluetooth-
enabled, regularly-calibrated, telemetric BP monitor.
Patients continued home monitoring until at least the one month follow-up
appointment, if tolerated, but could continue to achieve adequate BP control. Mean BP was
treated to a target of <130/80 on home monitoring, except in the minority of patients with a
haemodynamically significant stenosis (bilateral carotid stenosis >70% or severe end-artery
stenosis) when targets were determined on an individual basis. Patients were usually
treated in clinic, or after at least 1 week of home BP monitoring, most commonly following
the clinic policy of a combination of perindopril arginine 5mg and indapamide 1.25mg, with
subsequent addition of amlodipine 5mg before dose escalation.This regimen could be
altered by the treating physician, most commonly due to their current medications, or
occasionally due to the degree of hypertension or BP variability. Therefore, there is a risk of
bias due to interactions with current medications or selection bias with CCBs being more
likely to be given to people with variable BP, resulting in greater regression to the mean.
However, this study did not set out to prove the effects of these drugs on BP variability, but
to test whether their known effects can be replicated with HBPM and to understand these
effects in greater detail.
8.3.2 Analysis
Analyses were performed with baseline home readings acquired from 3-10 days
prior to starting or increasing the dose of a drug compared to follow-up readings acquired
from 8-15 days after the intervention, to minimise the immediate effect of drug increases.
164
For each time period, the mean, minimum and maximum SBP and DBP were derived from
the average of the last two readings of each cluster of three readings at a specific time of
day. Diurnal variability in SBP was measured as the coefficient of variation of the cluster
averages for each day (standard deviation of three timepoints / mean). Day-to-day
variability in SBP and DBP was measured as the residual CV about a moving average over
5 days (to remove the influence of mean BP and any trend in BP) for the mean of all
clusters and the mean of clusters at each time of day. All follow-up measures were then
expressed as a percentage change compared to the baseline period. Eligible medication
changes were identified as any initiation or dose increase with at least 7 days of BP
monitoring data prior to the drug change, and a minimum of 10 days after. Increases in
treatment (starting or increasing dose) were classified into drugs associated with low
variability in SBP in RCTs (CCBs or diuretics); drugs associated with high variability in SBP
(RASi or beta-blockers), or a combination of a drug from each group. Secondly, treatment
increases were classified into CCBs, diuretics, RASi or combinations of RASi and diuretic.
8.3.3 Statistical analysis
Unadjusted differences in BP indices between intervention groups were assessed
by t-tests or ANOVA. Univariate correlations with continuous demographic indices were
measured by linear regression and differences between groups in frequency of discrete
variables were compared by chi-squared tests. Multivariate general linear models (SPSS
sum of squares type IV) were derived for the change in each SBP or DBP index from
baseline with independent variables including drug class allocation, age, gender, atrial
fibrillation (premorbid or diagnosed within 6 weeks of the event), creatinine, current smoking
and a history of hypertension, diabetes, hyperlipidaemia, or family history of stroke. A
second model included these variables plus baseline mean SBP and baseline CV.
All analyses were performed with Matlab R2012a, Microsoft Excel 2010 and IBM SPSS 20.
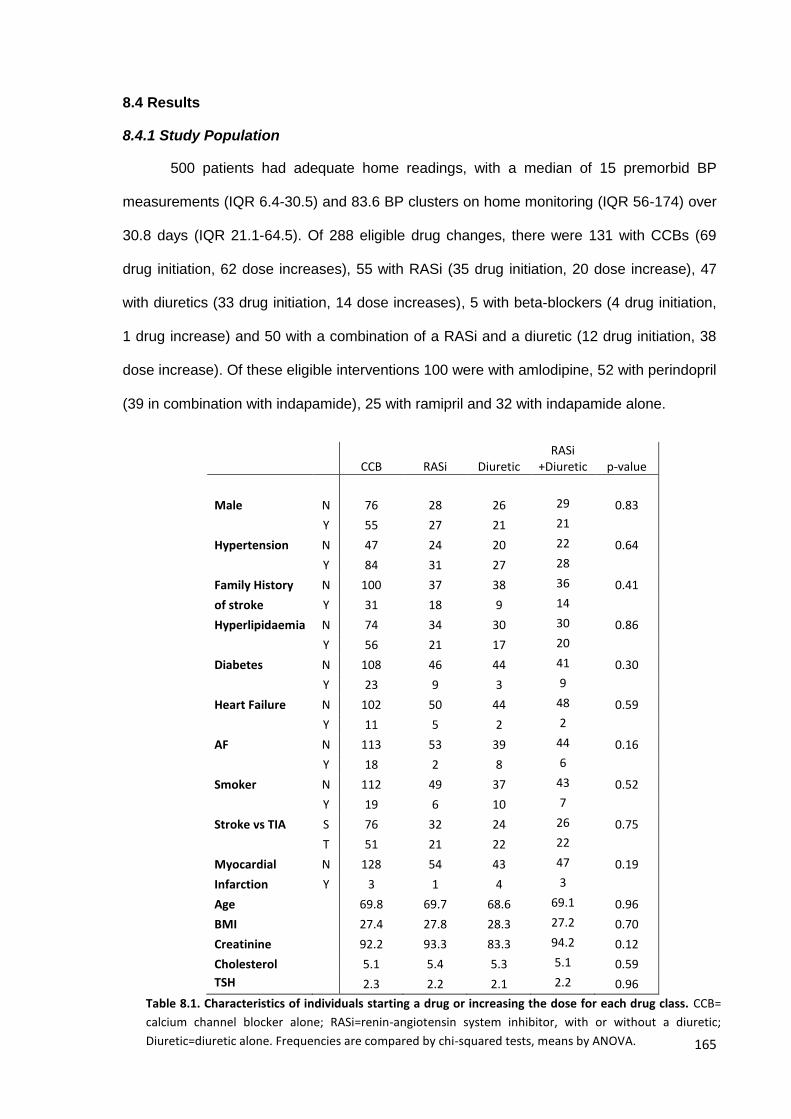
165
8.4 Results
8.4.1 Study Population
500 patients had adequate home readings, with a median of 15 premorbid BP
measurements (IQR 6.4-30.5) and 83.6 BP clusters on home monitoring (IQR 56-174) over
30.8 days (IQR 21.1-64.5). Of 288 eligible drug changes, there were 131 with CCBs (69
drug initiation, 62 dose increases), 55 with RASi (35 drug initiation, 20 dose increase), 47
with diuretics (33 drug initiation, 14 dose increases), 5 with beta-blockers (4 drug initiation,
1 drug increase) and 50 with a combination of a RASi and a diuretic (12 drug initiation, 38
dose increase). Of these eligible interventions 100 were with amlodipine, 52 with perindopril
(39 in combination with indapamide), 25 with ramipril and 32 with indapamide alone.
CCB RASi Diuretic
RASi +Diuretic p-value
Male N 76 28 26 29 0.83
Y 55 27 21 21
Hypertension N 47 24 20 22 0.64
Y 84 31 27 28
Family History N 100 37 38 36 0.41
of stroke Y 31 18 9 14
Hyperlipidaemia N 74 34 30 30 0.86
Y 56 21 17 20
Diabetes N 108 46 44 41 0.30
Y 23 9 3 9
Heart Failure N 102 50 44 48 0.59
Y 11 5 2 2
AF N 113 53 39 44 0.16
Y 18 2 8 6
Smoker N 112 49 37 43 0.52
Y 19 6 10 7
Stroke vs TIA S 76 32 24 26 0.75
T 51 21 22 22
Myocardial N 128 54 43 47 0.19
Infarction Y 3 1 4 3
Age
69.8 69.7 68.6 69.1 0.96
BMI
27.4 27.8 28.3 27.2 0.70
Creatinine
92.2 93.3 83.3 94.2 0.12
Cholesterol
5.1 5.4 5.3 5.1 0.59
TSH
2.3 2.2 2.1 2.2 0.96
Table 8.1. Characteristics of individuals starting a drug or increasing the dose for each drug class. CCB=
calcium channel blocker alone; RASi=renin-angiotensin system inhibitor, with or without a diuretic;
Diuretic=diuretic alone. Frequencies are compared by chi-squared tests, means by ANOVA.
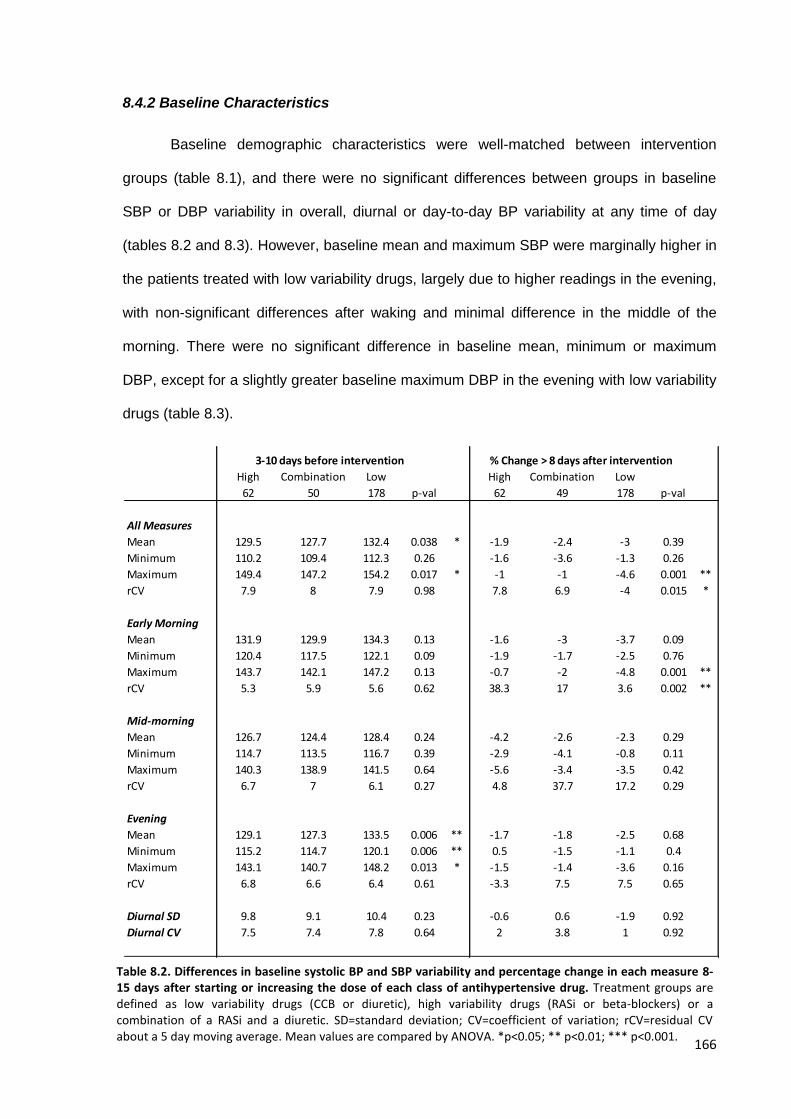
166
8.4.2 Baseline Characteristics
Baseline demographic characteristics were well-matched between intervention
groups (table 8.1), and there were no significant differences between groups in baseline
SBP or DBP variability in overall, diurnal or day-to-day BP variability at any time of day
(tables 8.2 and 8.3). However, baseline mean and maximum SBP were marginally higher in
the patients treated with low variability drugs, largely due to higher readings in the evening,
with non-significant differences after waking and minimal difference in the middle of the
morning. There were no significant difference in baseline mean, minimum or maximum
DBP, except for a slightly greater baseline maximum DBP in the evening with low variability
drugs (table 8.3).
High Combination Low High Combination Low
62 50 178 p-val 62 49 178 p-val
All Measures
Mean 129.5 127.7 132.4 0.038 * -1.9 -2.4 -3 0.39
Minimum 110.2 109.4 112.3 0.26 -1.6 -3.6 -1.3 0.26
Maximum 149.4 147.2 154.2 0.017 * -1 -1 -4.6 0.001 **
rCV 7.9 8 7.9 0.98 7.8 6.9 -4 0.015 *
Early Morning
Mean 131.9 129.9 134.3 0.13 -1.6 -3 -3.7 0.09
Minimum 120.4 117.5 122.1 0.09 -1.9 -1.7 -2.5 0.76
Maximum 143.7 142.1 147.2 0.13 -0.7 -2 -4.8 0.001 **
rCV 5.3 5.9 5.6 0.62 38.3 17 3.6 0.002 **
Mid-morning
Mean 126.7 124.4 128.4 0.24 -4.2 -2.6 -2.3 0.29
Minimum 114.7 113.5 116.7 0.39 -2.9 -4.1 -0.8 0.11
Maximum 140.3 138.9 141.5 0.64 -5.6 -3.4 -3.5 0.42
rCV 6.7 7 6.1 0.27 4.8 37.7 17.2 0.29
Evening
Mean 129.1 127.3 133.5 0.006 ** -1.7 -1.8 -2.5 0.68
Minimum 115.2 114.7 120.1 0.006 ** 0.5 -1.5 -1.1 0.4
Maximum 143.1 140.7 148.2 0.013 * -1.5 -1.4 -3.6 0.16
rCV 6.8 6.6 6.4 0.61 -3.3 7.5 7.5 0.65
Diurnal SD 9.8 9.1 10.4 0.23 -0.6 0.6 -1.9 0.92
Diurnal CV 7.5 7.4 7.8 0.64 2 3.8 1 0.92
3-10 days before intervention % Change > 8 days after intervention
Table 8.2. Differences in baseline systolic BP and SBP variability and percentage change in each measure 8-15 days after starting or increasing the dose of each class of antihypertensive drug. Treatment groups are defined as low variability drugs (CCB or diuretic), high variability drugs (RASi or beta-blockers) or a combination of a RASi and a diuretic. SD=standard deviation; CV=coefficient of variation; rCV=residual CV about a 5 day moving average. Mean values are compared by ANOVA. *p<0.05; ** p<0.01; *** p<0.001.
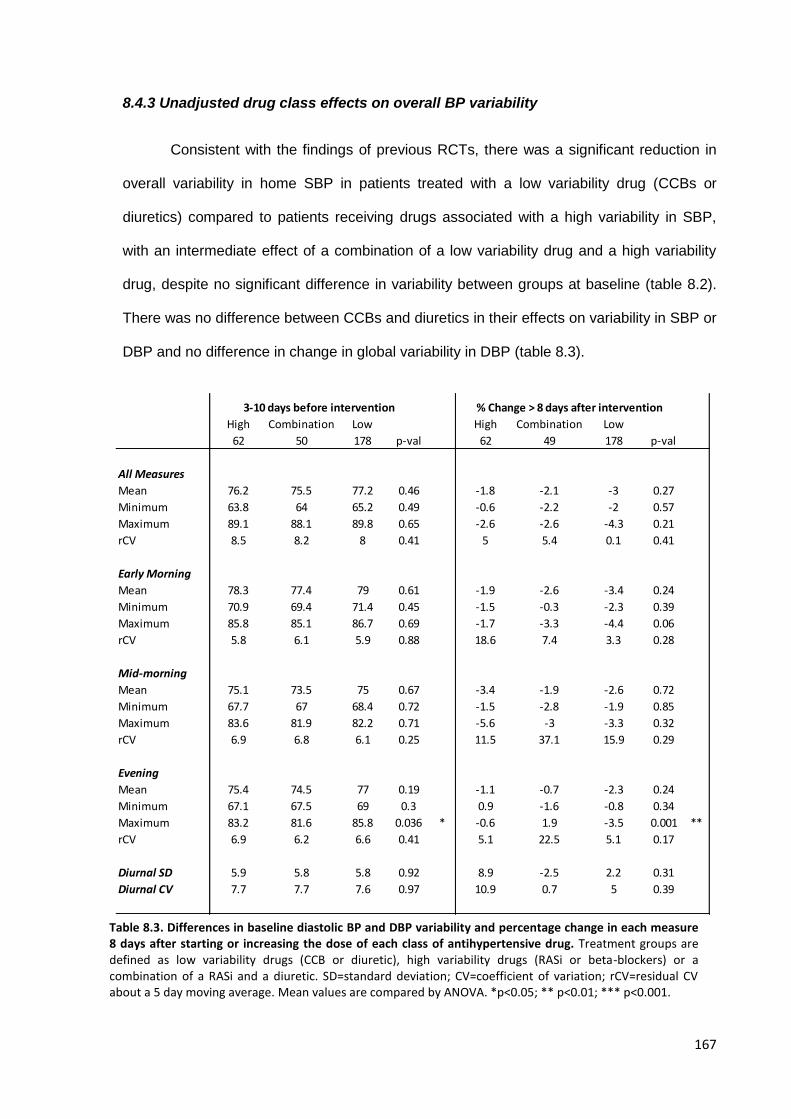
167
8.4.3 Unadjusted drug class effects on overall BP variability
Consistent with the findings of previous RCTs, there was a significant reduction in
overall variability in home SBP in patients treated with a low variability drug (CCBs or
diuretics) compared to patients receiving drugs associated with a high variability in SBP,
with an intermediate effect of a combination of a low variability drug and a high variability
drug, despite no significant difference in variability between groups at baseline (table 8.2).
There was no difference between CCBs and diuretics in their effects on variability in SBP or
DBP and no difference in change in global variability in DBP (table 8.3).
High Combination Low High Combination Low
62 50 178 p-val 62 49 178 p-val
All Measures
Mean 76.2 75.5 77.2 0.46 -1.8 -2.1 -3 0.27
Minimum 63.8 64 65.2 0.49 -0.6 -2.2 -2 0.57
Maximum 89.1 88.1 89.8 0.65 -2.6 -2.6 -4.3 0.21
rCV 8.5 8.2 8 0.41 5 5.4 0.1 0.41
Early Morning
Mean 78.3 77.4 79 0.61 -1.9 -2.6 -3.4 0.24
Minimum 70.9 69.4 71.4 0.45 -1.5 -0.3 -2.3 0.39
Maximum 85.8 85.1 86.7 0.69 -1.7 -3.3 -4.4 0.06
rCV 5.8 6.1 5.9 0.88 18.6 7.4 3.3 0.28
Mid-morning
Mean 75.1 73.5 75 0.67 -3.4 -1.9 -2.6 0.72
Minimum 67.7 67 68.4 0.72 -1.5 -2.8 -1.9 0.85
Maximum 83.6 81.9 82.2 0.71 -5.6 -3 -3.3 0.32
rCV 6.9 6.8 6.1 0.25 11.5 37.1 15.9 0.29
Evening
Mean 75.4 74.5 77 0.19 -1.1 -0.7 -2.3 0.24
Minimum 67.1 67.5 69 0.3 0.9 -1.6 -0.8 0.34
Maximum 83.2 81.6 85.8 0.036 * -0.6 1.9 -3.5 0.001 **
rCV 6.9 6.2 6.6 0.41 5.1 22.5 5.1 0.17
Diurnal SD 5.9 5.8 5.8 0.92 8.9 -2.5 2.2 0.31
Diurnal CV 7.7 7.7 7.6 0.97 10.9 0.7 5 0.39
3-10 days before intervention % Change > 8 days after intervention
Table 8.3. Differences in baseline diastolic BP and DBP variability and percentage change in each measure 8 days after starting or increasing the dose of each class of antihypertensive drug. Treatment groups are defined as low variability drugs (CCB or diuretic), high variability drugs (RASi or beta-blockers) or a combination of a RASi and a diuretic. SD=standard deviation; CV=coefficient of variation; rCV=residual CV about a 5 day moving average. Mean values are compared by ANOVA. *p<0.05; ** p<0.01; *** p<0.001.
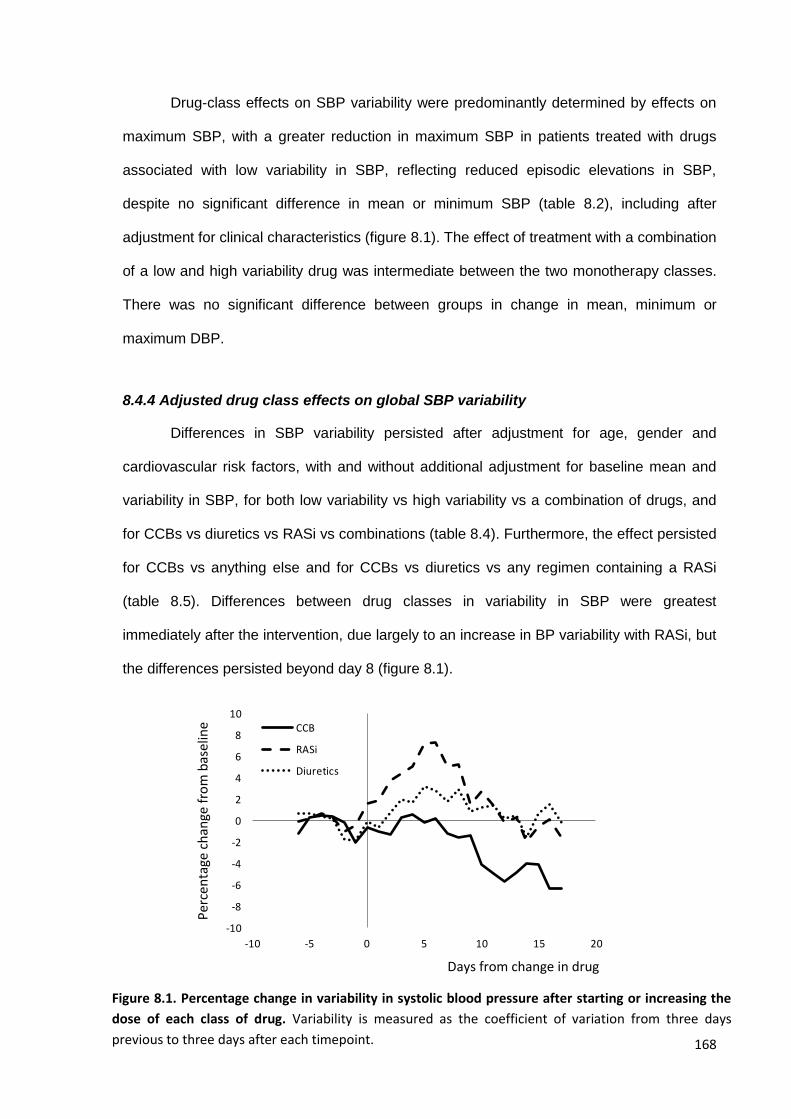
168
Drug-class effects on SBP variability were predominantly determined by effects on
maximum SBP, with a greater reduction in maximum SBP in patients treated with drugs
associated with low variability in SBP, reflecting reduced episodic elevations in SBP,
despite no significant difference in mean or minimum SBP (table 8.2), including after
adjustment for clinical characteristics (figure 8.1). The effect of treatment with a combination
of a low and high variability drug was intermediate between the two monotherapy classes.
There was no significant difference between groups in change in mean, minimum or
maximum DBP.
8.4.4 Adjusted drug class effects on global SBP variability
Differences in SBP variability persisted after adjustment for age, gender and
cardiovascular risk factors, with and without additional adjustment for baseline mean and
variability in SBP, for both low variability vs high variability vs a combination of drugs, and
for CCBs vs diuretics vs RASi vs combinations (table 8.4). Furthermore, the effect persisted
for CCBs vs anything else and for CCBs vs diuretics vs any regimen containing a RASi
(table 8.5). Differences between drug classes in variability in SBP were greatest
immediately after the intervention, due largely to an increase in BP variability with RASi, but
the differences persisted beyond day 8 (figure 8.1).
-10
-8
-6
-4
-2
0
2
4
6
8
10
-10 -5 0 5 10 15 20
CCB
RASi
Diuretics
Per
cen
tage
ch
ange
fro
m b
asel
ine
Days from change in drug
Figure 8.1. Percentage change in variability in systolic blood pressure after starting or increasing the
dose of each class of drug. Variability is measured as the coefficient of variation from three days
previous to three days after each timepoint.
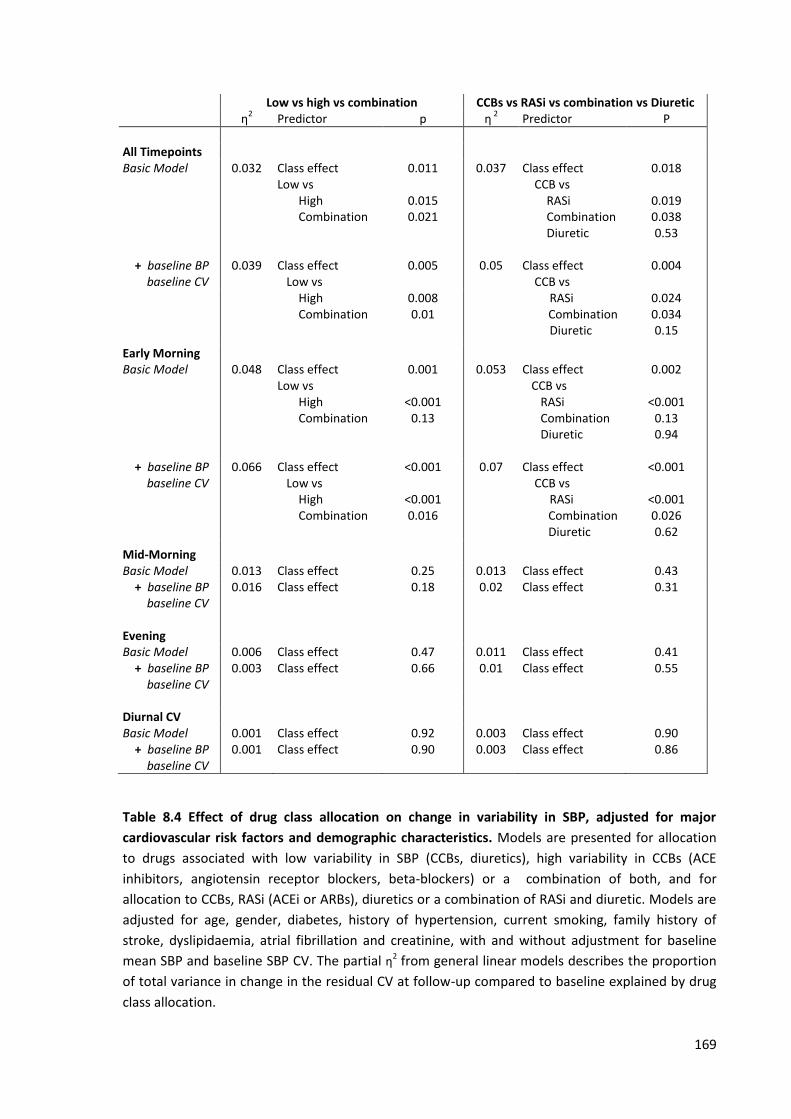
169
Low vs high vs combination CCBs vs RASi vs combination vs Diuretic η
2 Predictor p
η
2 Predictor P
All Timepoints Basic Model 0.032 Class effect
Low vs High Combination
0.011
0.015 0.021
0.037 Class effect CCB vs RASi Combination Diuretic
0.018
0.019 0.038 0.53
+ baseline BP baseline CV
0.039 Class effect Low vs
0.005 0.05 Class effect CCB vs
0.004
High Combination
0.008 0.01
RASi Combination
Diuretic
0.024 0.034 0.15
Early Morning Basic Model 0.048 Class effect
Low vs High Combination
0.001
<0.001 0.13
0.053 Class effect CCB vs RASi Combination Diuretic
0.002
<0.001 0.13 0.94
+ baseline BP baseline CV
0.066 Class effect Low vs High Combination
<0.001
<0.001 0.016
0.07 Class effect CCB vs RASi
Combination Diuretic
<0.001
<0.001 0.026 0.62
Mid-Morning
Basic Model 0.013 Class effect 0.25 0.013 Class effect 0.43 + baseline BP baseline CV
0.016 Class effect 0.18 0.02 Class effect 0.31
Evening
Basic Model 0.006 Class effect 0.47 0.011 Class effect 0.41 + baseline BP baseline CV
0.003 Class effect 0.66 0.01 Class effect 0.55
Diurnal CV Basic Model 0.001 Class effect 0.92 0.003 Class effect 0.90 + baseline BP baseline CV
0.001 Class effect 0.90 0.003 Class effect 0.86
Table 8.4 Effect of drug class allocation on change in variability in SBP, adjusted for major
cardiovascular risk factors and demographic characteristics. Models are presented for allocation
to drugs associated with low variability in SBP (CCBs, diuretics), high variability in CCBs (ACE
inhibitors, angiotensin receptor blockers, beta-blockers) or a combination of both, and for
allocation to CCBs, RASi (ACEi or ARBs), diuretics or a combination of RASi and diuretic. Models are
adjusted for age, gender, diabetes, history of hypertension, current smoking, family history of
stroke, dyslipidaemia, atrial fibrillation and creatinine, with and without adjustment for baseline
mean SBP and baseline SBP CV. The partial η2 from general linear models describes the proportion
of total variance in change in the residual CV at follow-up compared to baseline explained by drug
class allocation.
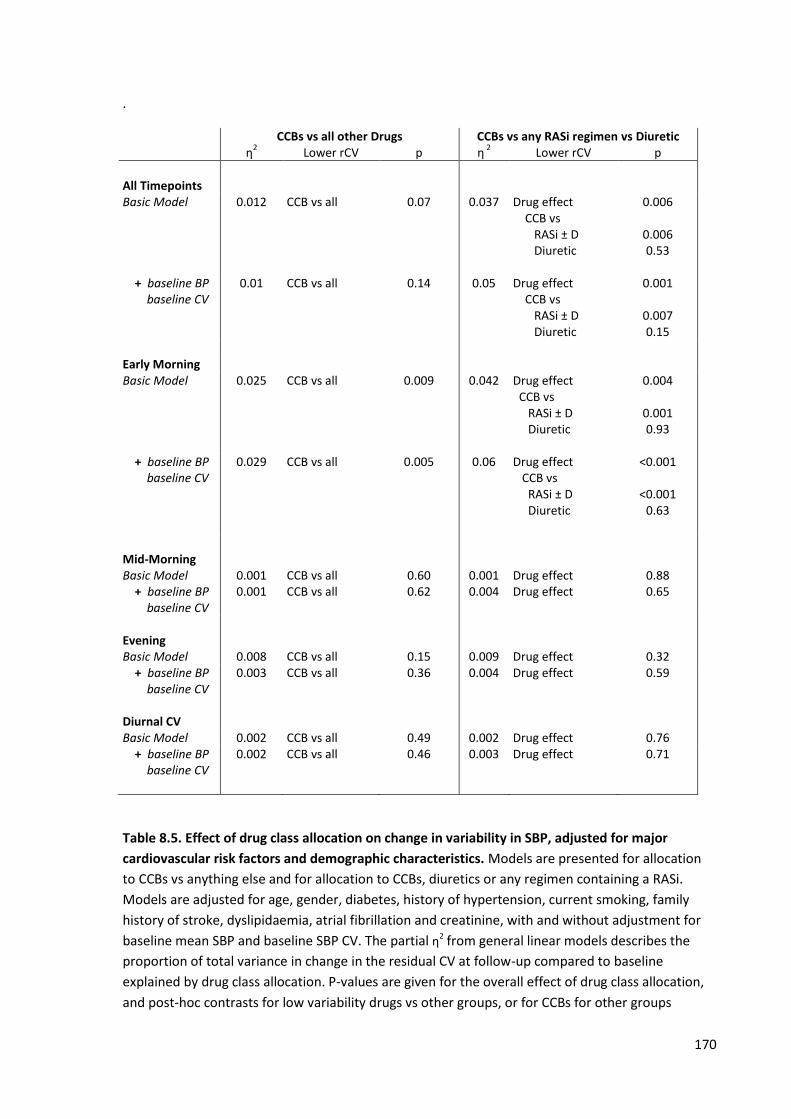
170
.
CCBs vs all other Drugs CCBs vs any RASi regimen vs Diuretic η
2 Lower rCV p
η
2 Lower rCV
p
All Timepoints Basic Model 0.012 CCB vs all 0.07 0.037 Drug effect
CCB vs RASi ± D Diuretic
0.006
0.006 0.53
+ baseline BP baseline CV
0.01 CCB vs all
0.14 0.05 Drug effect CCB vs
0.001
RASi ± D Diuretic
0.007 0.15
Early Morning Basic Model 0.025 CCB vs all 0.009 0.042 Drug effect
CCB vs RASi ± D Diuretic
0.004
0.001 0.93
+ baseline BP baseline CV
0.029 CCB vs all
0.005 0.06 Drug effect CCB vs RASi ± D Diuretic
<0.001
<0.001 0.63
Mid-Morning
Basic Model 0.001 CCB vs all 0.60 0.001 Drug effect 0.88 + baseline BP baseline CV
0.001 CCB vs all 0.62 0.004 Drug effect 0.65
Evening
Basic Model 0.008 CCB vs all 0.15 0.009 Drug effect 0.32 + baseline BP baseline CV
0.003 CCB vs all 0.36 0.004 Drug effect 0.59
Diurnal CV Basic Model 0.002 CCB vs all 0.49 0.002 Drug effect 0.76 + baseline BP baseline CV
0.002 CCB vs all 0.46 0.003 Drug effect 0.71
Table 8.5. Effect of drug class allocation on change in variability in SBP, adjusted for major
cardiovascular risk factors and demographic characteristics. Models are presented for allocation
to CCBs vs anything else and for allocation to CCBs, diuretics or any regimen containing a RASi.
Models are adjusted for age, gender, diabetes, history of hypertension, current smoking, family
history of stroke, dyslipidaemia, atrial fibrillation and creatinine, with and without adjustment for
baseline mean SBP and baseline SBP CV. The partial η2 from general linear models describes the
proportion of total variance in change in the residual CV at follow-up compared to baseline
explained by drug class allocation. P-values are given for the overall effect of drug class allocation,
and post-hoc contrasts for low variability drugs vs other groups, or for CCBs for other groups

171
8.4.5 Differences in drug class effects by time of day
The significant differences between drug groups in reduction in global variability in
SBP were primarily dependent upon significant differences in day-to-day variability in SBP
in the early morning, with a significant increase in patients treated with RASi, no significant
change in patients treated with CCBs or diuretics and an intermediate effect of treatment
with a combination of the two classes (table 8.2). There was no significant difference
between groups in change in day-to-day variability in SBP in the middle of the morning or in
the evening, and no difference between groups in change in diurnal variability. Again, the
differences between drug groups in day-to-day SBP variability immediately after waking
persisted after adjustment for age, gender and cardiovascular risk factors, and also
persisted after additional adjustment for baseline mean SBP and baseline variability in SBP.
All Timepoints Early Morning A)
B)
Figure 8.2. Differences between change in variability or maximum SBP after initiation of drugs
associated with lower SBP variability, higher SBP variability or a combination. Results are mean
percentage change in maximum SBP or residual coefficient of variation (RCV) in SBP for days 8-15 after
starting or increasing each treatment compared to 3-10 days before the intervention, after adjustment.
Error bars represent confidence intervals. A) Changes in SBP variability; B) Changes in maximum SBP.
172
Similar to the effect on global variability in SBP, the differences between groups in
day-to-day SBP variability after waking was associated with a significant reduction in
maximum SBP after waking in the CCB and diuretic groups, with much less reduction in the
group treated with RASi alone (table 8.2) and an intermediate effect of treatment with a
combination therapy. There was no difference in change in mean or minimum SBP between
groups, despite a higher mean SBP at baseline in the group treated with low variability
drugs. In the middle of the morning and the evening, there was no difference in change in
mean, minimum or maximum SBP between groups, despite greater baseline measures in
patients treated with low variability drugs in all groups. Again there was no difference in any
measure between groups in mean, minimum, maximum or day-to-day variability in DBP at
any time of day except for slightly greater reductions in maximum DBP in patients treated
with CCBs or diuretics compared to RASi in the middle of the morning and the evening.
8.5 Discussion
After TIA or non-disabling stroke, CCBs and diuretics reduced self-measured, day-
to-day SBP variability relative to an increase in variability with RAS inhibitors, consistent
with the effects of these drugs on visit-to-visit clinic variability in the primary prevention of
stroke in large randomised controlled trials (chapters 2-3). Drug-class effects persisted
when used in combinations, with a combination of low and high variability drugs resulting in
an intermediate effect on variability in SBP, despite similar effects on mean SBP. These
effects were seen with day-to-day variability early in the morning, but not at other times of
day or for diurnal variability within a day. They resulted from a significantly greater reduction
in maximum SBP after waking, with no differences between drugs in reduction of mean
SBP at any time of day.
CCBs and diuretics reduced visit-to-visit variability in SBP compared to beta-
blockers in the large ASCOT-BPLA and MRC trials,2 and also reduced variability in SBP in
comparison with both beta-blockers and RASi in the meta-analysis of all published studies
173
(chapter 3). In these trials, the effects on SBP variability explained the difference in stroke
risk between treatment arms that was not explained by differences in mean SBP alone.
However, these trials were primary prevention studies. Therefore, this is the first study to
demonstrate differences in drug class effects on change in intra-individual variability in SBP
in the secondary prevention of cerebrovascular disease. The consistent effect on variability
in SBP in this secondary prevention study therefore supports the hypothesis that the
benefits of CCBs and diuretics in the primary of prevention of stroke may also be present
for the secondary prevention of stroke.
This is also the first study to demonstrate these drug class effects on self-measured
home blood pressure. This indicates a common mechanism underlying variability in SBP on
visit-to-visit readings and home blood pressure readings, consisted with the similarity
between the predictive value of SBP variability in clinic and at home (chapter 2). This
supports the validity of home BP monitoring as an appropriate method for the assessment
of blood pressure and demonstrates that home monitoring can be used to measure
changes in BP variability in response to drug treatment, unlike ambulatory monitoring.
This study also furthers our understanding of the mechanism of the effect of drug
classes on SBP variability as it is the first study to demonstrate effects on day-to-day
variability in SBP at different times of day. The benefit of CCBs or diuretics compared to
RASi immediately after waking were not seen at later times of day or for diurnal variability in
SBP. Furthermore, there was a strong effect of CCBs and diuretics on maximum SBP after
waking, but no difference in mean or minimum SBP after waking, or maximum SBP at other
times of day. This is consistent with the stronger relationship between clinical
characteristics and SBP variability in the morning compared to later times of day (chapter
6). This implies that the most important effect of CCBs or diuretics on SBP variability results
from limiting episodic peaks in SBP immediately after waking, which is consistent with
evidence showing a greater prognostic significance of morning day-to-day variability in SBP
compared to the evening.9 This probably demonstrates an important effect on the morning
174
surge in blood pressure, which is predictive of future cardiovascular events,10 and the timing
of which matches the increased risk of stroke in the morning compared to later in the day.5
Specifically, as there was no difference in mean diurnal variability, the effect probably
results from limiting episodic, day-to-day variations in the post-waking surge. This cannot
be explained by drug half-life as although amlodipine has a longer half-life, the half life of
indapamide and the active metabolite of perindopril, perindoprilat, are very similar at ~17
hours. Furthermore, any differences in half-life would cause a consistent difference in
diurnal CV rather than limit episodic differences from day-to-day which are more likely to be
due to underlying physiological processes.
Finally, this study demonstrated that the combination of a RASi and indapamide
resulted in an intermediate effect on day-to-day SBP variability compared to RASi or
diuretics alone. This is consistent with a previous meta-analysis of RCTs4 which used inter-
individual SBP variability as an indirect measure of intra-individual SBP variability.
Therefore, we can be confident that in patients with increased SBP variability on a RASi,
the addition of a diuretic will limit variability in SBP, although potentially not as much as
stopping the RASi. Furthermore, as the effect of CCBs was present despite a high rate of
prior use of RASi, this is very likely to be true for the use of CCBs as well.
There are limitations to this study. Firstly, patients received antihypertensive drugs
at the non-randomised discretion of the treating physician. However, the unbiased effect of
each drug class on intra-individual variability in SBP has already been demonstrated in
large randomised trials. Therefore, the primary aim of this study was to investigate the
effects of antihypertensive treatment on SBP variability at different times of day rather than
prove the existence of an effect on SBP variability. Furthermore, despite the lack of
randomisation, the groups were very well balanced for clinical characteristics and there
were no significant differences between treatment groups in baseline variability in SBP over
any timeframe and no difference in change in mean SBP at follow-up. The second limitation
of the study is that it was performed in patients with acute TIA or minor stroke. However,
175
this group of patients are at the highest risk of recurrent stroke, and currently there is only
limited evidence of the effect of antihypertensives on SBP variability in secondary
prevention, unlike studies in primary prevention.3 Therefore this is the optimal group in
whom to identify therapeutic targets and methods of monitoring of BP variability in order to
reduce the risk of recurrent stroke. Nonetheless, the findings of this study at different times
of day ideally need replication in primary prevention populations. Thirdly, diurnal variability
was only measured at three timepoints in each day rather than using ambulatory blood
pressure monitoring. However, repeated ABPM is impractical for the assessment of a
response to treatment and by monitoring daily there were up to 7 estimates of diurnal
variability at baseline and follow-up for each individual, producing at least as reliable an
estimate as a single day of ambulatory readings.11 Finally, all readings were taken in a
relaxed sitting position at home, which may not accurately reflect real-life blood pressure
behaviour. However, this is true of most blood pressure studies, including all studies
demonstrating a prognostic benefit from antihypertensive treatment, and limits the
occurrence of measurement artefact that is commonly seen with ambulatory readings.12, 13
In summary, CCBs and diuretics reduced self-measured, home blood pressure
variability in the secondary prevention of cerebrovascular events compared to RASi, due
largely to a reduction in day-to-day variability and maximum SBP after waking. These
effects persisted when used in combinations. This supports the use of these drugs in the
secondary prevention of patients with cerebrovascular disease, particularly in patients with
increased BP variability or excessive morning surges in SBP, and supports the use of home
BP monitoring as a method of monitoring the response to SBP variability directed
treatment.
176
8.6 References
1. Rothwell PM, Howard SC, Dolan E, et al. Prognostic significance of visit-to-visit variability, maximum systolic blood pressure, and episodic hypertension. Lancet 2010;375:895-905.
2. Rothwell PM, Howard SC, Dolan E, et al. Effects of beta blockers and calcium-channel blockers on within-individual variability in blood pressure and risk of stroke. Lancet Neurol 2010;9:469-480.
3. Webb AJ, Fischer U, Mehta Z, Rothwell PM. Effects of antihypertensive-drug class on interindividual variation in blood pressure and risk of stroke: a systematic review and meta-analysis. Lancet 2010;375:906-915.
4. Webb AJ, Rothwell PM. Effect of dose and combination of antihypertensives on interindividual blood pressure variability: a systematic review. Stroke 2011;42:2860-2865.
5. Kario K, Pickering TG, Umeda Y, et al. Morning surge in blood pressure as a predictor of silent and clinical cerebrovascular disease in elderly hypertensives: a prospective study. Circulation 2003;107:1401-1406.
6. Wizner B, Dechering DG, Thijs L, et al. Short-term and long-term repeatability of the morning blood pressure in older patients with isolated systolic hypertension. J Hypertens 2008;26:1328-1335.
7. Rothwell PM, Coull AJ, Giles MF, et al. Change in stroke incidence, mortality, case-fatality, severity, and risk factors in Oxfordshire, UK from 1981 to 2004 (Oxford Vascular Study). Lancet 2004;363:1925-1933.
8. Rothwell PM, Giles MF, Chandratheva A, et al. Effect of urgent treatment of transient ischaemic attack and minor stroke on early recurrent stroke (EXPRESS study): a prospective population-based sequential comparison. Lancet 2007;370:1432-1442.
9. Johansson JK, Niiranen TJ, Puukka PJ, Jula AM. Prognostic Value of the Variability in Home-Measured Blood Pressure and Heart Rate: The Finn-Home Study. Hypertension 2012.
10. Li Y, Thijs L, Hansen TW, et al. Prognostic Value of the Morning Blood Pressure Surge in 5645 Subjects From 8 Populations. Hypertension 2010;55:1040-1048.
11. Warren RE, Marshall T, Padfield PL, Chrubasik S. Variability of office, 24-hour ambulatory, and self-monitored blood pressure measurements. Br J Gen Pract 2010;60:675-680.
12. Casadei R, Parati G, Pomidossi G, et al. 24-hour blood pressure monitoring: evaluation of Spacelabs 5300 monitor by comparison with intra-arterial blood pressure recording in ambulant subjects. J Hypertens 1988;6:797-803.
13. Hermida RC, Calvo C, Ayala DE, Fernandez JR, Ruilope LM, Lopez JE. Evaluation of the extent and duration of the "ABPM effect" in hypertensive patients. J Am Coll Cardiol 2002;40:710-717.
177
CHAPTER NINE
Increased cerebral arterial pulsatility
in patients with leukoaraiosis:
arterial stiffness enhances transmission of aortic pulsatility
9.1 Summary 178
9.2 Introduction 179
9.3 Methods 180
9.3.1 Study population 180
9.3.2 Procedures 181
9.3.3 Statistical analysis 182
9.4 Findings 183
9.4.1 Study population 183
9.4.2 Clinical associations with leukoaraiosis or physiological measures 184
9.4.3 Associations between leukoaraiosis and physiological measures 185
9.4.4 Physiological determinants of cerebral pulsatility 186
9.5 Discussion 188
9.6 References 191
178
9.1 Summary
Small vessel stroke associated with leukoaraiosis may be particularly associated
with blood pressure variability, but this relationship may depend upon associated changes
in cerebral perfusion. One current hypothesis states that arterial stiffening reduces
dampening of the arterial waveform and hence increases pulsatility of cerebral blood flow,
damaging small vessels. To test this hypothesis as a precursor to measuring associations
with BP variability, I determined associations between leukoaraiosis and aortic and middle
cerebral artery stiffness and pulsatility. Patients were recruited from the Oxford Vascular
Study within 6 weeks of a TIA or minor stroke. Leukoaraiosis was categorised on MRI by
two independent observers with the Fazekas and ARWMC scales. MCA stiffness (transit
time: MCA-TT) and pulsatility (Gosling’s index: MCA-PI) were measured with transcranial
ultrasound, and aortic pulse wave velocity (ao-PWV) and aortic systolic, diastolic and pulse
pressure (SBP, DBP, PP) by applanation tonometry (Sphygmocor).
In 100 patients, MCA-PI was significantly greater in patients with leukoaraiosis (0.91
vs 0.73, p<0.0001). Severity of leukoaraiosis was associated with MCA-PI and aortic PWV
(Fazekas: χ2=0.39, MCA-PI p=0.01, ao-PWV p=0.06; ARWMC: χ2=0.38, MCA-PI p=0.015;
ao-PWV p=0.026) for periventricular and deep white matter lesions, independent of aortic
SBP, DBP and PP and MCA-TT. In a multivariate model (r2=0.68, p<0.0001), MCA-PI was
independently associated with aortic-PWV (p=0.016) and aortic-PP (p<0.0001) and
inversely associated with aortic-DBP (p<0.0001) and MCA-TT (p=0.001).
MCA pulsatility was the strongest physiological correlate of leukoaraiosis,
independent of age, and was dependent upon aortic-DBP and PP and aortic and MCA
stiffness, supporting the hypothesis that large artery stiffening results in increased arterial
pulsatility, with transmission to the cerebral small vessels resulting in leukoaraiosis.
179
9.2 Introduction
Small vessel stroke associated with leukoaraiosis is the most likely stroke subtype
to be dependent on blood pressure variability. If blood pressure variability is associated with
stroke due to associated changes in cerebral perfusion, as indicated by the correlation
between antihypertensive effects on headache and effects on blood pressure variability
described in chapter 4, then the relationship between leukoaraiosis and cerebral perfusion
may be key. However, the pathogenesis of small vessel disease and any relationship with
haemodynamic changes in the cerebral circulation is poorly understood. Therefore, in order
to understand whether the relationship between blood pressure variability and stroke risk
may be confounded by changes in the cerebral circulation we must first understand whether
small vessel disease is related to cerebral and systemic haemodynamic factors. Therefore I
investigated how chronic small vessel disease (leukoaraiosis) is dependent upon cerebral
haemodynamic measures, and how these relate to the changes in the systemic circulation.
In addition to improving our understanding of whether stroke and changes in the
cerebral circulation are associated with changes in blood pressure variability, a better
understanding of the pathogenesis of leukoaraiosis has significant potential health benefits
in itself. Prevention of premature leukoaraiosis by treating the underlying causes in middle
age may reduce the risk of stroke1 and dementia,2 and other consequences of cerebral
small vessel disease.3, 4 However, the relative importance of haemodynamic factors as
opposed to a primary microangiopathy5 in the development of leukoaraiosis is unclear and
associations with age, hypertension and diabetes are consistent with both processes.6
Previous studies have suggested a relationship between increased middle cerebral artery
(MCA) pulsatility measured by transcranial Doppler ultrasound (TCD) and leukoaraiosis or
lacunar infarction in patients with hypertension7 and diabetes,8 although not necessarily
independent of age. However, increased cerebral pulsatility has often been interpreted as a
consequence of small vessel disease due to changes in downstream resistance,9 rather
than as a causal factor related to increased central arterial stiffness and reduced damping
180
of the cerebral arterial waveform.10 Yet the cerebral circulation appears to be specifically
adapted to dampen the arterial waveform11 and increased aortic stiffness has been
associated with leukoaraiosis,12 lacunar stroke,13 and cerebral pulsatility.10 However, these
relationships all strongly covary with age and are susceptible to residual confounding.
Previous studies have not measured leukoaraiosis, aortic pulse wave velocity (PWV) and
middle cerebral pulsatility optimally in the same patient group and no study has also
measured aortic pulsatility and middle cerebral artery stiffness, key components of the
hypothesised mechanism in which increased aortic pulsatility is transmitted via stiff large
vessels to the cerebral microvasculature.
Therefore I performed the first study assessing the dependence of leukoaraiosis on
arterial stiffness and pulsatility in both the aorta and middle cerebral artery in patients with
recent TIA or minor stroke, to assess the degree to which leukoaraiosis depends
independently on each of these measures, after adjustment for significant clinical features,
particularly age. Understanding these relationships is a necessary prerequisite for further
studies looking at the relationship between systemic and cerebral physiological changes
associated with blood pressure variability (chapter 10).
9.3 Methods
9.3.1 Study population
Consecutive consenting and eligible participants within 6 weeks of a TIA or minor
stroke (NIHSS<5) were recruited to a physiological substudy of the Oxford Vascular Study
(OXVASC)14 between January and December 2011 from the acute TIA and stroke clinic
associated with the study. Participants were excluded if they were under 18 years, unable
to have an MRI scan, cognitively impaired (MMSE<23), pregnant or had had a recent
myocardial infarction (<1 month), unstable angina, heart failure (NYHA 3-4 or ejection
fraction <40%) or untreated severe bilateral carotid stenosis (>70%) or occlusion. The study
was approved by the Oxfordshire Research Ethics Committee.
181
9.3.2 Procedures
MRI scans were performed during the acute clinical assessment on a 3T MRI
system (Siemens Magnetom Verio) according to a standardised protocol using vendor-
designed sequences. The protocol comprised T2-weighted TSE and FLAIR sequences,
diffusion and susceptibility-weighted images, a T1-weighted spin-echo 2D sequence post
contrast application as well as a time-of-flight MRA of the intracranial vessels and a contrast
enhanced MRA of the large neck arteries.
All axial T2 scans were scored according to a modified version of the Fazekas15
scale by an experienced observer (M Simoni) blinded to clinical and physiological data, as
this score is the simplest, most commonly used and well-validated semi-quantitative score
for leukoaraiosis. Scans were also graded by the ARWMC16 score to demonstrate the
consistency of the results. Finally, leukoaraiosis was also independently scored by a
consultant neuroradiologist (W Kuker), who was not blinded to the patient’s clinical details,
on a simple 4 point scale: ‘None’, ‘Mild,’ ‘Moderate’ or ‘Severe’ relative to the patient’s age
(Oxford scale). For comparison, the Fazekas and ARWMC scores were also categorised
into four approximately equally sized groups (Fazekas: none 0, mild 1, moderate 2, severe
≥3; ARWMC: none 0, mild 1-3, moderate 4-9, severe ≥10).
Physiological tests were performed at rest in a quiet, dimly-lit, temperature-
controlled room (21-230C). Applanation tonometry (Sphygmocor, AtCor Medical, Sydney,
Australia) was used to measure carotid-femoral pulse wave velocity (aortic-PWV), aortic
augmentation index and central aortic systolic, diastolic and pulse pressure (ao-SBP, ao-
DBP, ao-PP),17 calibrated to the average of 3 brachial blood pressures measured supine
after at least 10 minutes rest. TCD (Doppler Box, Compumedics DWL, Singen, Germany)
was performed with a handheld 2MHz probe at the temporal bone window on the same side
as carotid applanation. The waveform envelope was acquired at 100Hz simultaneously with
ECG and blood pressure at 200Hz (Finometer, Finapres Medical Systems, The
Netherlands), via a Powerlab 8/30 with LabChart Pro software (ADInstruments, USA). The
182
MCA was insonated at 50mm, or if this was not adequate, at the depth giving the optimal
waveform. Data were exported to Matlab R2010a for calculation of mean MCA transit time
(MCA-TT) measured from the QRS complex to the foot of at least 7 beats as identified by
intersecting tangents.18 All waveforms were visually inspected and beats corrupted by
artefact were excluded. MCA-PWV was calculated as the distance between the sternal
notch and the temporal bone window divided by MCA-TT.19 MCA pulsatility was calculated
as Gosling’s pulsatility index (MCA-PI= (systolic CBFV-diastolic CBFV) / mean CBFV). All
physiological tests were performed by one investigator (Alastair Webb).
9.3.3 Statistical analysis
Kappa statistics were derived to assess inter-rater agreement for assessment of
leukoaraiosis with the Oxford score, and agreement of severity of leukoaraiosis between
the Fazekas and ARWMC scales. Differences between patient groups in continuous
variables were assessed by t-tests or ANOVA, with tests for linear trend for severity of
leukoaraiosis, whilst differences in frequencies were compared by chi-squared tests.
Univariate relationships between continuous variables were assessed by linear regression.
Multivariate predictors of continuous physiological outcome variables were determined by
general linear models but due to the non-normal, positively skewed distribution of the semi-
quantitative scores for leukoaraiosis, relationships between leukoaraiosis severity and
either clinical or physiological measures were assessed with ordinal regression.
Relationships were assessed with and without adjustment for age and gender and also
adjusted for additional cardiovascular risk factors including: history of hypertension, stroke,
hypercholesterolaemia, current smoking, family history of stroke, diabetes, height, and
brachial systolic and diastolic BP.
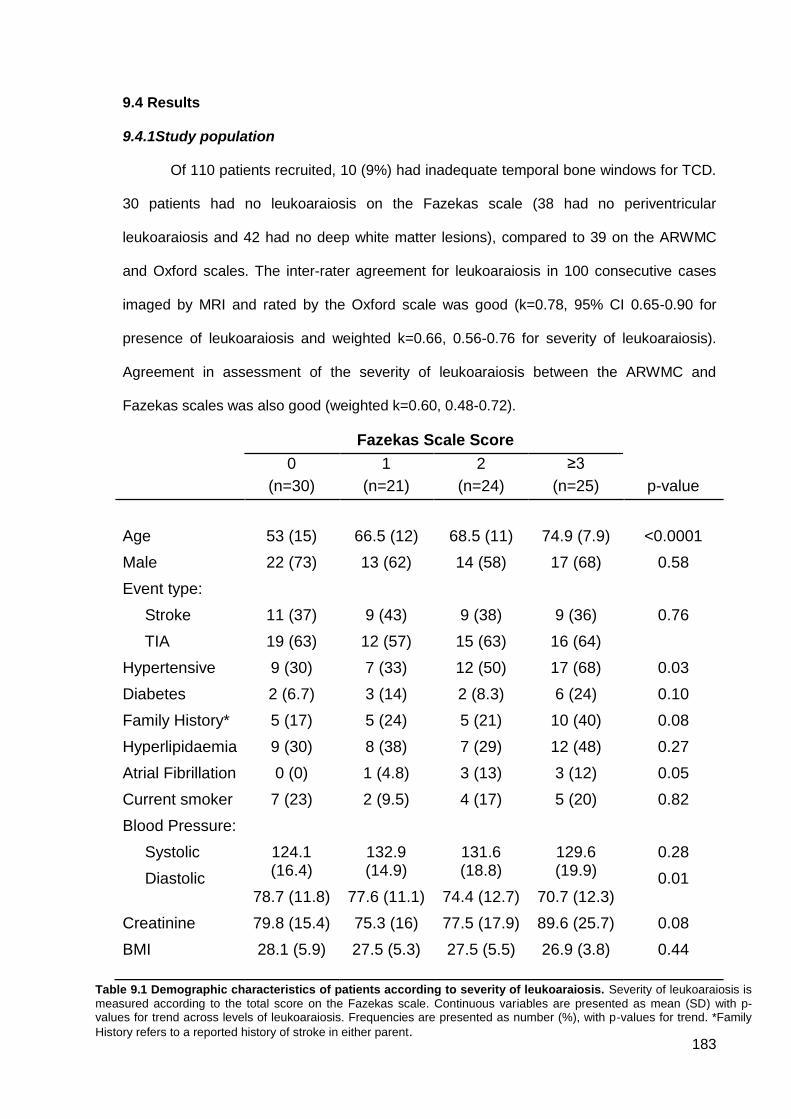
183
9.4 Results
9.4.1Study population
Of 110 patients recruited, 10 (9%) had inadequate temporal bone windows for TCD.
30 patients had no leukoaraiosis on the Fazekas scale (38 had no periventricular
leukoaraiosis and 42 had no deep white matter lesions), compared to 39 on the ARWMC
and Oxford scales. The inter-rater agreement for leukoaraiosis in 100 consecutive cases
imaged by MRI and rated by the Oxford scale was good (k=0.78, 95% CI 0.65-0.90 for
presence of leukoaraiosis and weighted k=0.66, 0.56-0.76 for severity of leukoaraiosis).
Agreement in assessment of the severity of leukoaraiosis between the ARWMC and
Fazekas scales was also good (weighted k=0.60, 0.48-0.72).
Fazekas Scale Score
0
(n=30)
1
(n=21)
2
(n=24)
≥3
(n=25)
p-value
Age
53 (15)
66.5 (12)
68.5 (11)
74.9 (7.9)
<0.0001
Male 22 (73) 13 (62) 14 (58) 17 (68) 0.58
Event type:
Stroke
TIA
11 (37)
19 (63)
9 (43)
12 (57)
9 (38)
15 (63)
9 (36)
16 (64)
0.76
Hypertensive 9 (30) 7 (33) 12 (50) 17 (68) 0.03
Diabetes 2 (6.7) 3 (14) 2 (8.3) 6 (24) 0.10
Family History* 5 (17) 5 (24) 5 (21) 10 (40) 0.08
Hyperlipidaemia 9 (30) 8 (38) 7 (29) 12 (48) 0.27
Atrial Fibrillation 0 (0) 1 (4.8) 3 (13) 3 (12) 0.05
Current smoker 7 (23) 2 (9.5) 4 (17) 5 (20) 0.82
Blood Pressure:
Systolic
Diastolic
124.1 (16.4)
78.7 (11.8)
132.9 (14.9)
77.6 (11.1)
131.6 (18.8)
74.4 (12.7)
129.6 (19.9)
70.7 (12.3)
0.28
0.01
Creatinine 79.8 (15.4) 75.3 (16) 77.5 (17.9) 89.6 (25.7) 0.08
BMI 28.1 (5.9) 27.5 (5.3) 27.5 (5.5) 26.9 (3.8) 0.44
Table 9.1 Demographic characteristics of patients according to severity of leukoaraiosis. Severity of leukoaraiosis is
measured according to the total score on the Fazekas scale. Continuous variables are presented as mean (SD) with p-values for trend across levels of leukoaraiosis. Frequencies are presented as number (%), with p-values for trend. *Family
History refers to a reported history of stroke in either parent.
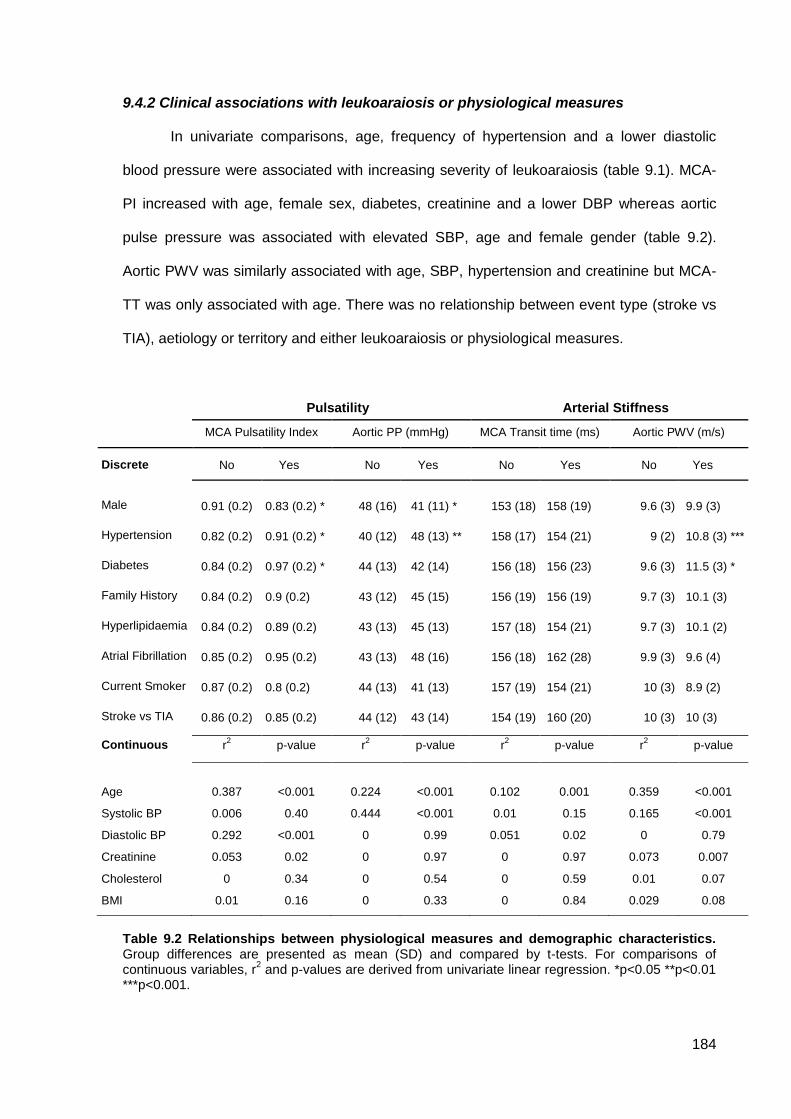
184
9.4.2 Clinical associations with leukoaraiosis or physiological measures
In univariate comparisons, age, frequency of hypertension and a lower diastolic
blood pressure were associated with increasing severity of leukoaraiosis (table 9.1). MCA-
PI increased with age, female sex, diabetes, creatinine and a lower DBP whereas aortic
pulse pressure was associated with elevated SBP, age and female gender (table 9.2).
Aortic PWV was similarly associated with age, SBP, hypertension and creatinine but MCA-
TT was only associated with age. There was no relationship between event type (stroke vs
TIA), aetiology or territory and either leukoaraiosis or physiological measures.
Pulsatility Arterial Stiffness
MCA Pulsatility Index Aortic PP (mmHg) MCA Transit time (ms) Aortic PWV (m/s)
Discrete No Yes No Yes No Yes No Yes
Male 0.91 (0.2) 0.83 (0.2) * 48 (16) 41 (11) * 153 (18) 158 (19) 9.6 (3) 9.9 (3)
Hypertension 0.82 (0.2) 0.91 (0.2) * 40 (12) 48 (13) ** 158 (17) 154 (21) 9 (2) 10.8 (3) ***
Diabetes 0.84 (0.2) 0.97 (0.2) * 44 (13) 42 (14) 156 (18) 156 (23) 9.6 (3) 11.5 (3) *
Family History 0.84 (0.2) 0.9 (0.2) 43 (12) 45 (15) 156 (19) 156 (19) 9.7 (3) 10.1 (3)
Hyperlipidaemia 0.84 (0.2) 0.89 (0.2) 43 (13) 45 (13) 157 (18) 154 (21) 9.7 (3) 10.1 (2)
Atrial Fibrillation 0.85 (0.2) 0.95 (0.2) 43 (13) 48 (16) 156 (18) 162 (28) 9.9 (3) 9.6 (4)
Current Smoker 0.87 (0.2) 0.8 (0.2) 44 (13) 41 (13) 157 (19) 154 (21) 10 (3) 8.9 (2)
Stroke vs TIA 0.86 (0.2) 0.85 (0.2) 44 (12) 43 (14) 154 (19) 160 (20) 10 (3) 10 (3)
Continuous r2
p-value r2
p-value r2
p-value r2
p-value
Age 0.387 <0.001 0.224 <0.001 0.102 0.001 0.359 <0.001
Systolic BP 0.006 0.40 0.444 <0.001 0.01 0.15 0.165 <0.001
Diastolic BP 0.292 <0.001 0 0.99 0.051 0.02 0 0.79
Creatinine 0.053 0.02 0 0.97 0 0.97 0.073 0.007
Cholesterol 0 0.34 0 0.54 0 0.59 0.01 0.07
BMI 0.01 0.16 0 0.33 0 0.84 0.029 0.08
Table 9.2 Relationships between physiological measures and demographic characteristics. Group differences are presented as mean (SD) and compared by t-tests. For comparisons of continuous variables, r
2 and p-values are derived from univariate linear regression. *p<0.05 **p<0.01
***p<0.001.
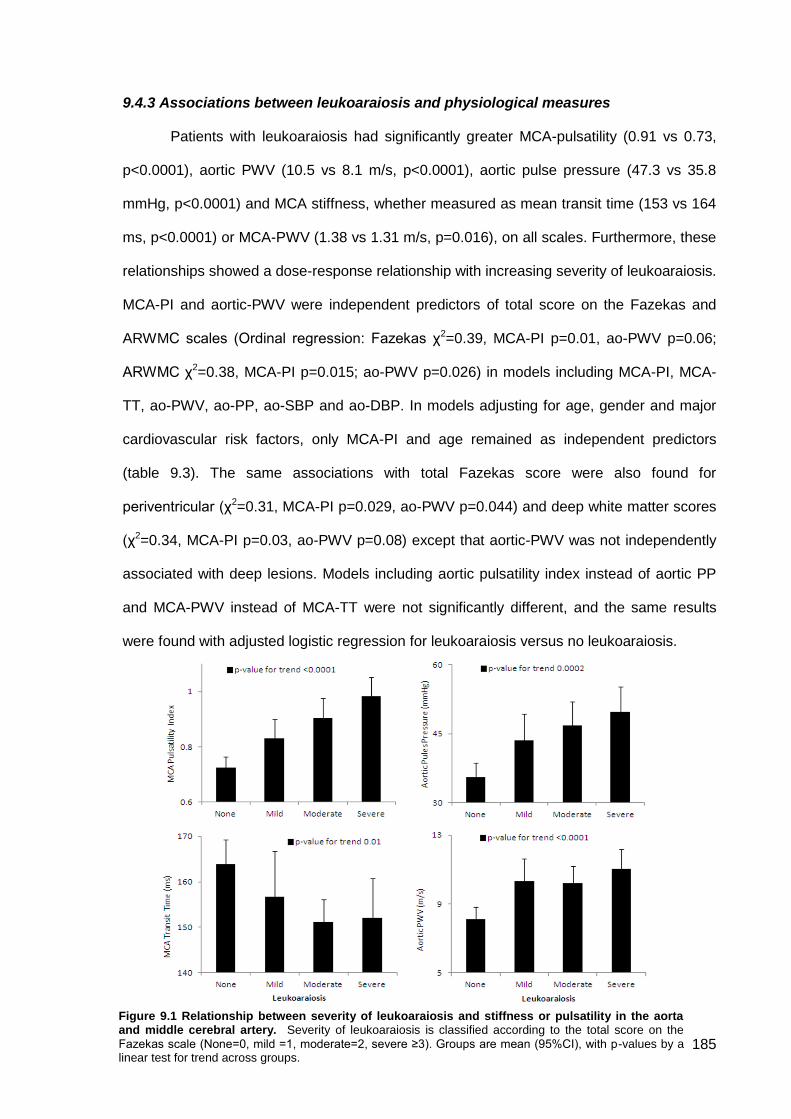
185
9.4.3 Associations between leukoaraiosis and physiological measures
Patients with leukoaraiosis had significantly greater MCA-pulsatility (0.91 vs 0.73,
p<0.0001), aortic PWV (10.5 vs 8.1 m/s, p<0.0001), aortic pulse pressure (47.3 vs 35.8
mmHg, p<0.0001) and MCA stiffness, whether measured as mean transit time (153 vs 164
ms, p<0.0001) or MCA-PWV (1.38 vs 1.31 m/s, p=0.016), on all scales. Furthermore, these
relationships showed a dose-response relationship with increasing severity of leukoaraiosis.
MCA-PI and aortic-PWV were independent predictors of total score on the Fazekas and
ARWMC scales (Ordinal regression: Fazekas χ2=0.39, MCA-PI p=0.01, ao-PWV p=0.06;
ARWMC χ2=0.38, MCA-PI p=0.015; ao-PWV p=0.026) in models including MCA-PI, MCA-
TT, ao-PWV, ao-PP, ao-SBP and ao-DBP. In models adjusting for age, gender and major
cardiovascular risk factors, only MCA-PI and age remained as independent predictors
(table 9.3). The same associations with total Fazekas score were also found for
periventricular (χ2=0.31, MCA-PI p=0.029, ao-PWV p=0.044) and deep white matter scores
(χ2=0.34, MCA-PI p=0.03, ao-PWV p=0.08) except that aortic-PWV was not independently
associated with deep lesions. Models including aortic pulsatility index instead of aortic PP
and MCA-PWV instead of MCA-TT were not significantly different, and the same results
were found with adjusted logistic regression for leukoaraiosis versus no leukoaraiosis.
Figure 9.1 Relationship between severity of leukoaraiosis and stiffness or pulsatility in the aorta and middle cerebral artery. Severity of leukoaraiosis is classified according to the total score on the
Fazekas scale (None=0, mild =1, moderate=2, severe ≥3). Groups are mean (95%CI), with p-values by a linear test for trend across groups.
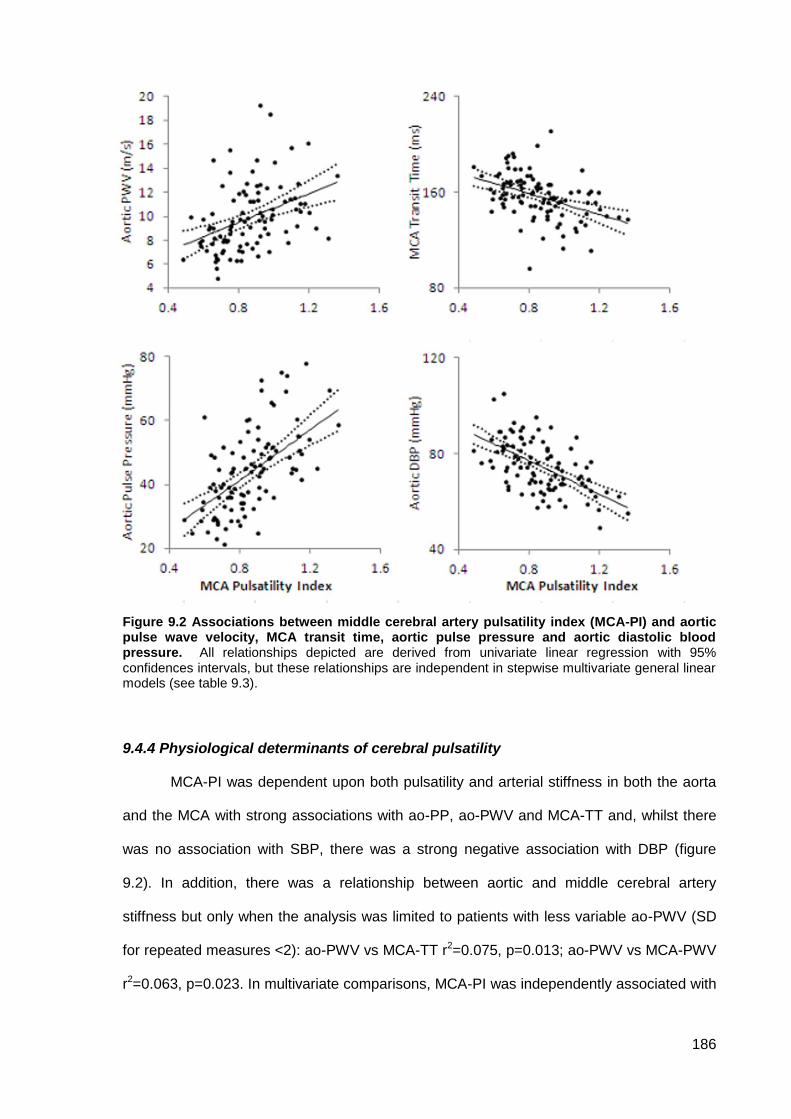
186
Figure 9.2 Associations between middle cerebral artery pulsatility index (MCA-PI) and aortic pulse wave velocity, MCA transit time, aortic pulse pressure and aortic diastolic blood pressure. All relationships depicted are derived from univariate linear regression with 95% confidences intervals, but these relationships are independent in stepwise multivariate general linear models (see table 9.3).
9.4.4 Physiological determinants of cerebral pulsatility
MCA-PI was dependent upon both pulsatility and arterial stiffness in both the aorta
and the MCA with strong associations with ao-PP, ao-PWV and MCA-TT and, whilst there
was no association with SBP, there was a strong negative association with DBP (figure
9.2). In addition, there was a relationship between aortic and middle cerebral artery
stiffness but only when the analysis was limited to patients with less variable ao-PWV (SD
for repeated measures <2): ao-PWV vs MCA-TT r2=0.075, p=0.013; ao-PWV vs MCA-PWV
r2=0.063, p=0.023. In multivariate comparisons, MCA-PI was independently associated with
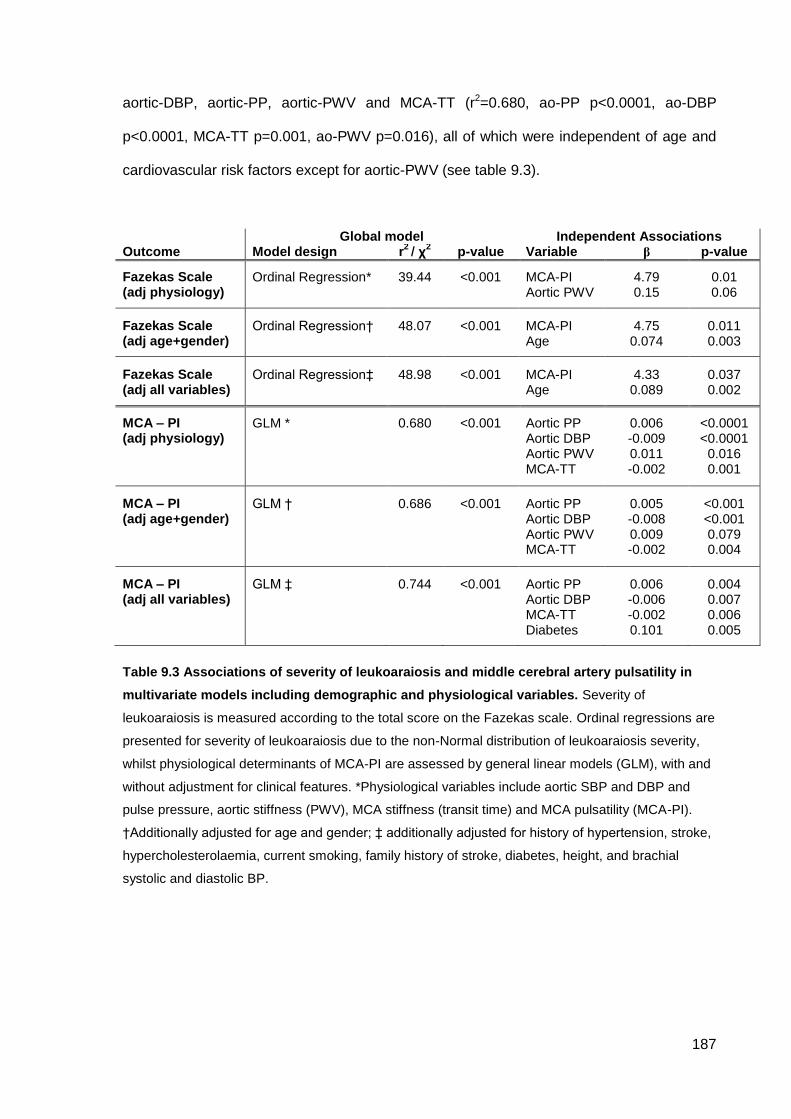
187
aortic-DBP, aortic-PP, aortic-PWV and MCA-TT (r2=0.680, ao-PP p<0.0001, ao-DBP
p<0.0001, MCA-TT p=0.001, ao-PWV p=0.016), all of which were independent of age and
cardiovascular risk factors except for aortic-PWV (see table 9.3).
Global model Independent Associations Outcome Model design r
2 / χ
2 p-value Variable β p-value
Fazekas Scale (adj physiology)
Ordinal Regression* 39.44 <0.001 MCA-PI Aortic PWV
4.79 0.15
0.01 0.06
Fazekas Scale (adj age+gender)
Ordinal Regression† 48.07 <0.001 MCA-PI Age
4.75 0.074
0.011 0.003
Fazekas Scale (adj all variables)
Ordinal Regression‡ 48.98 <0.001 MCA-PI Age
4.33 0.089
0.037 0.002
MCA – PI (adj physiology)
GLM * 0.680 <0.001 Aortic PP Aortic DBP Aortic PWV MCA-TT
0.006 -0.009 0.011 -0.002
<0.0001 <0.0001
0.016 0.001
MCA – PI (adj age+gender)
GLM †
0.686
<0.001
Aortic PP Aortic DBP Aortic PWV MCA-TT
0.005 -0.008 0.009 -0.002
<0.001 <0.001 0.079 0.004
MCA – PI (adj all variables)
GLM ‡
0.744
<0.001
Aortic PP Aortic DBP MCA-TT Diabetes
0.006 -0.006 -0.002 0.101
0.004 0.007 0.006 0.005
Table 9.3 Associations of severity of leukoaraiosis and middle cerebral artery pulsatility in
multivariate models including demographic and physiological variables. Severity of
leukoaraiosis is measured according to the total score on the Fazekas scale. Ordinal regressions are
presented for severity of leukoaraiosis due to the non-Normal distribution of leukoaraiosis severity,
whilst physiological determinants of MCA-PI are assessed by general linear models (GLM), with and
without adjustment for clinical features. *Physiological variables include aortic SBP and DBP and
pulse pressure, aortic stiffness (PWV), MCA stiffness (transit time) and MCA pulsatility (MCA-PI).
†Additionally adjusted for age and gender; ‡ additionally adjusted for history of hypertension, stroke,
hypercholesterolaemia, current smoking, family history of stroke, diabetes, height, and brachial
systolic and diastolic BP.
188
9.5 Discussion
This study demonstrates a significant relationship between MCA pulsatility and the
presence and severity of leukoaraiosis in a cohort of patients with recent TIA and minor
stroke, with similar results for both periventricular and deep white matter disease. This
relationship was independent of age and other physiological measures, and was
significantly stronger than the association between leukoaraiosis and aortic stiffness or
aortic pulsatility. The very strong association (r2>0.6) of MCA-PI with aortic pulsatility,
diastolic BP, aortic stiffness and MCA stiffness, further suggests that MCA-PI is mainly
dependent upon these measures, rather than on distal small vessel resistance.
Leukoaraiosis is strongly associated with cognitive impairment,1, 2 an increased risk
of stroke,1 increased morbidity as a result of stroke20, 21 and increased mortality.1 However,
it is unclear whether leukoaraiosis has a predominantly ischaemic aetiology due to either
chronic ischaemia22, 23 or incomplete episodic infarction, or whether it represents a primary
microangiopathy that directly causes both leukoaraiosis and the associated physiological
changes.5, 24 Whilst both hypotheses could explain the clinical associations, the former
hypothesis is supported by studies showing a relationship between the anatomical
distribution of leukoaraiosis and lower cerebral blood flow22 or cerebrovascular reactivity,25
whilst the latter hypothesis is supported by independent genetic associations with
leukoaraiosis,26 superficially similar white matter disease in CADASIL27 and COL4A1
mutations28 and the demonstration of increased blood-brain barrier permeability in patients
with leukoaraiosis, both in lesions and in normal appearing white matter.5, 24 However,
ultimately it is likely that these two mechanisms are not mutually exclusive.
Mine is the first study to assess the association of leukoaraiosis with stiffness and
pulsatility in both the aorta and cerebral arteries in one cohort. I demonstrated a
significantly stronger association of leukoaraiosis with MCA-PI than with any other
physiological measure, despite similar associations with age, suggesting a more direct
pathophysiological relationship. In addition, this means that it is unlikely that differences in
189
leukoaraiosis and cerebral pulsatility are solely due to independent effects of age on the
brain. The very strong correlation of MCA-PI with aortic pulsatility and large artery stiffness
also suggests a causative pathophysiological relationship. Together these findings imply
that increased arterial stiffening causes increased transmission of enhanced aortic
pulsatility to the cerebral circulation, causing leukoaraiosis either due to alterations in
perfusion during diastole, due to increased endothelial shear stress or due to impaired
cerebral autoregulation of fluctuations in blood pressure. Previous studies demonstrating a
relationship between leukoaraiosis and either cerebral pulsatility7 or aortic stiffness12 have
only assessed one component of this mechanism and could not determine whether
increased cerebral pulsatility results from leukoaraiosis or whether arterial stiffening and
leukoaraiosis are only independent markers of age. However, the methods used in this
study detect associations rather than determine causation, and it is feasible that the inferred
direction of causation from aortic stiffness to cerebral pulsatility to leukoaraiosis is incorrect.
It is possible that there is reverse causation with leukoaraiosis reflecting a systemic
arteriopathy causing increased pulsatility and secondary stiffening of the aorta, although
this pathway would function in the opposite direction to the strengths of association. The
direction of causation could be more formally assessed with methods for causal inference,
including structural equation monitoring (where the direction of effect is formalized in a
testable set of assumptions), or propensity score matching (which seeks to match groups of
patients differing by the independent variable of interest by potential covariates), but these
methods are beyond the scope of this study.
This study has some limitations. First, it was a cross-sectional, observational study
and therefore it is possible that the physiological associations with leukoaraiosis are
confounded by a systemic primary microangiopathy, but this is unlikely given the strength of
the relationship between the physiological variables and MCA-PI. Nonetheless, larger
longitudinal studies will be required to confirm these findings. Second, the patients were
heterogeneous in both age and stroke aetiology. This resulted in an increased range of
190
leukoaraiosis, increasing the sensitivity of the study, but there were insufficient patients to
identify whether these associations differed by specific subgroups, particularly whether the
same associations applied to patients with lacunar and non-lacunar stroke. Finally, I did not
address whether there were coexistent changes in blood brain barrier permeability in this
patient group.
The strong association between leukoaraiosis and middle cerebral artery pulsatility
suggests that stroke risk is likely to be associated with cerebral haemodynamic factors,
whether cerebral pulsatility or potentially cerebral autoregulation or reactivity. This could
partly explain the relationship between blood pressure variability and stroke risk if there is a
similarly strong relationship between blood pressure variability and either cerebral
haemodynamics, or else the systemic physiological measures that cerebral pulsatility is
dependent upon including aortic stiffness or pulsatility (chapter 10).
Assessing the potential contribution of haemodynamic factors to the aetiology of
leukoaraiosis is important for guiding the development of interventions, especially as no
direct interventions exist to treat a primary microangiopathy. Current antihypertensive
medications may reduce cerebral arterial pulsatility, and this could potentially be part of the
explanation for differences between antihypertensive medications in the resultant risk of
stroke29 and cognitive impairment,30 possibly by effects on blood-pressure variability or
associated mechanisms. In addition, therapies directed at reducing aortic stiffness in
middle-age could delay the development of leukoaraiosis. Further research needs to
assess the longitudinal relationship between cerebral pulsatility and the development of
leukoaraiosis, and ideally test whether interventions which reduce cerebral pulsatility or
aortic stiffness also prevented development of leukoaraiosis (chapter 11).
In summary, leukoaraiosis is closely associated with cerebral arterial pulsatility,
which is strongly dependent upon aortic pulsatility and large artery stiffness. This is
consistent with the hypothesis that arterial stiffening results in increased aortic pulsatility
and its transmission to the cerebral circulation and may play a pathophysiological role in the
191
development of leukoaraiosis and its clinical sequelae. Ultimately, treatment aimed at
reducing arterial stiffness in middle age might be most effective in preventing stroke,
dementia and other consequences of cerebral small vessel disease.
10.6 References
1. Debette S, Markus HS. The clinical importance of white matter hyperintensities on brain
magnetic resonance imaging: Systematic review and meta-analysis. BMJ. 2010;341:c3666 2. Verdelho A, Madureira S, Moleiro C, Ferro JM, Santos CO, Erkinjuntti T, et al. White matter
changes and diabetes predict cognitive decline in the elderly: The ladis study. Neurology. 2010;75:160-167
3. Teodorczuk A, Firbank MJ, Pantoni L, Poggesi A, Erkinjuntti T, Wallin A, et al. Relationship between baseline white-matter changes and development of late-life depressive symptoms: 3-year results from the ladis study. Psychol Med. 2010;40:603-610
4. Inzitari D, Pracucci G, Poggesi A, Carlucci G, Barkhof F, Chabriat H, et al. Changes in white matter as determinant of global functional decline in older independent outpatients: Three year follow-up of ladis (leukoaraiosis and disability) study cohort. Bmj. 2009;339:b2477
5. Wardlaw JM, Farrall A, Armitage PA, Carpenter T, Chappell F, Doubal F, et al. Changes in background blood-brain barrier integrity between lacunar and cortical ischemic stroke subtypes. Stroke. 2008;39:1327-1332
6. van Dijk EJ, Prins ND, Vrooman HA, Hofman A, Koudstaal PJ, Breteler MM. Progression of cerebral small vessel disease in relation to risk factors and cognitive consequences: Rotterdam scan study. Stroke. 2008;39:2712-2719
7. Sierra C, de la Sierra A, Chamorro A, Larrousse M, Domenech M, Coca A. Cerebral hemodynamics and silent cerebral white matter lesions in middle-aged essential hypertensive patients. Blood Press. 2004;13:304-309
8. Lee KY, Sohn YH, Baik JS, Kim GW, Kim JS. Arterial pulsatility as an index of cerebral microangiopathy in diabetes. Stroke. 2000;31:1111-1115
9. Kidwell CS, el-Saden S, Livshits Z, Martin NA, Glenn TC, Saver JL. Transcranial doppler pulsatility indices as a measure of diffuse small-vessel disease. J Neuroimaging. 2001;11:229-235
10. Kwater A, Gasowski J, Gryglewska B, Wizner B, Grodzicki T. Is blood flow in the middle cerebral artery determined by systemic arterial stiffness? Blood Press. 2009;18:130-134
11. Schubert T, Santini F, Stalder AF, Bock J, Meckel S, Bonati L, et al. Dampening of blood-flow pulsatility along the carotid siphon: Does form follow function? AJNR Am J Neuroradiol. 2011;32:1107-1112
12. Henskens LHG, Kroon AA, van Oostenbrugge RJ, Gronenschild EHBM, Fuss-Lejeune MMJJ, Hofman PAM, et al. Increased aortic pulse wave velocity is associated with silent cerebral small-vessel disease in hypertensive patients. Hypertension. 2008;52:1120-1126
13. Tuttolomondo A, Di Sciacca R, Di Raimondo D, Serio A, D'Aguanno G, Pinto A, et al. Arterial stiffness indexes in acute ischemic stroke: Relationship with stroke subtype. Atherosclerosis. 2010;211:187-194
14. Rothwell PM, Coull AJ, Giles MF, Howard SC, Silver LE, Bull LM, et al. Change in stroke incidence, mortality, case-fatality, severity, and risk factors in oxfordshire, uk from 1981 to 2004 (oxford vascular study). Lancet. 2004;363:1925-1933
15. Pantoni L, Simoni M, Pracucci G, Schmidt R, Barkhof F, Inzitari D. Visual rating scales for age-related white matter changes (leukoaraiosis): Can the heterogeneity be reduced? Stroke. 2002;33:2827-2833
16. Wahlund LO, Barkhof F, Fazekas F, Bronge L, Augustin M, Sjogren M, et al. A new rating scale for age-related white matter changes applicable to mri and ct. Stroke. 2001;32:1318-1322
17. Sharman JE, Lim R, Qasem AM, Coombes JS, Burgess MI, Franco J, et al. Validation of a generalized transfer function to noninvasively derive central blood pressure during exercise. Hypertension. 2006;47:1203-1208
192
18. Chiu YC, Arand PW, Shroff SG, Feldman T, Carroll JD. Determination of pulse wave velocities with computerized algorithms. Am Heart J. 1991;121:1460-1470
19. Gladdish S, Manawadu D, Banya W, Cameron J, Bulpitt CJ, Rajkumar C. Repeatability of non-invasive measurement of intracerebral pulse wave velocity using transcranial doppler. Clin Sci (Lond). 2005;108:433-439
20. Kissela B, Lindsell CJ, Kleindorfer D, Alwell K, Moomaw CJ, Woo D, et al. Clinical prediction of functional outcome after ischemic stroke: The surprising importance of periventricular white matter disease and race. Stroke. 2009;40:530-536
21. Baezner H, Blahak C, Poggesi A, Pantoni L, Inzitari D, Chabriat H, et al. Association of gait and balance disorders with age-related white matter changes: The ladis study. Neurology. 2008;70:935-942
22. Markus HS, Lythgoe DJ, Ostegaard L, O'Sullivan M, Williams SC. Reduced cerebral blood flow in white matter in ischaemic leukoaraiosis demonstrated using quantitative exogenous contrast based perfusion mri. J Neurol Neurosurg Psychiatry. 2000;69:48-53
23. O'Sullivan M, Lythgoe DJ, Pereira AC, Summers PE, Jarosz JM, Williams SC, et al. Patterns of cerebral blood flow reduction in patients with ischemic leukoaraiosis. Neurology. 2002;59:321-326
24. Topakian R, Barrick TR, Howe FA, Markus HS. Blood-brain barrier permeability is increased in normal-appearing white matter in patients with lacunar stroke and leucoaraiosis. J Neurol Neurosurg Psychiatry. 2010;81:192-197
25. Marstrand JR, Garde E, Rostrup E, Ring P, Rosenbaum S, Mortensen EL, et al. Cerebral perfusion and cerebrovascular reactivity are reduced in white matter hyperintensities. Stroke. 2002;33:972-976
26. Turner ST, Fornage M, Jack CR, Jr., Mosley TH, Knopman DS, Kardia SL, et al. Genomic susceptibility loci for brain atrophy, ventricular volume, and leukoaraiosis in hypertensive sibships. Arch Neurol. 2009;66:847-857
27. Joutel A, Corpechot C, Ducros A, Vahedi K, Chabriat H, Mouton P, et al. Notch3 mutations in cadasil, a hereditary adult-onset condition causing stroke and dementia. Nature. 1996;383:707-710
28. Lanfranconi S, Markus HS. Col4a1 mutations as a monogenic cause of cerebral small vessel disease: A systematic review. Stroke. 2010;41:e513-518
29. Rothwell PM, Howard SC, Dolan E, O'Brien E, Dobson JE, Dahlof B, et al. Prognostic significance of visit-to-visit variability, maximum systolic blood pressure, and episodic hypertension. Lancet. 2010;375:895-905
30. Webb AJ, Fischer U, Mehta Z, Rothwell PM. Effects of antihypertensive-drug class on interindividual variation in blood pressure and risk of stroke: A systematic review and meta-analysis. Lancet. 2010;375:906-915
31. Forette F, Seux ML, Staessen JA, Thijs L, Birkenhager WH, Babarskiene MR, et al. Prevention of dementia in randomised double-blind placebo-controlled systolic hypertension in europe (syst-eur) trial. Lancet. 1998;352:1347-1351
193
CHAPTER TEN
Associations between beat-to-beat, day-to-day and
visit-to-visit variability in systolic blood pressure
with cerebral pulsatility and reactivity
10.1 Summary 194
10.2 Introduction 195
10.3 Methods 196
10.3.1 Study population 196
10.3.2 Laboratory procedures 196
10.3.3 Blood pressure measurement 197
10.3.4 Analysis 198
10.4 Findings 200
10.4.1 Study population 200
10.4.2 Associations between variability in SBP and physiological measures 201
10.4.3 Associations between physiological measures and premorbid BP readings 203
10.4.4 Independence of associations with SBP variability 204
10.4.5 Associations between cerebrovascular reactivity and SBP variability 204
10.4.6 Associations with home SBP variability at each time of day 206
10.4.7 Associations with asleep versus awake BP 207
10.5 Discussion 209
10.6 References 212
194
10.1 Summary
Systolic blood pressure (SBP) variability is associated with an increased risk of
cardiovascular events (chapters 2+6) whilst cerebral pulsatility is associated with
leukoaraiosis and stroke (chapter 9). Moreover, drug-class dependent changes in SBP
variability were associated with incident headache, potentially reflecting changes in
cerebrovascular reactivity (chapter 4). Therefore I aimed to determine the relationships
between SBP variability and both cerebral pulsatility and reactivity.
Consecutive patients with TIA and non-disabling stroke were recruited from the
OXVASC clinic. The coefficient of variation (CV=standard deviation / mean) of SBP on 5
minutes beat-to-beat monitoring, awake ABPM and home blood pressure monitoring
(HBPM 3 measurements, 3 times daily) was related to middle cerebral artery pulsatility
(MCA-PI), aortic pulsatility (PP=pulse pressure) and aortic stiffness (PWV).
Cerebrovascular reactivity was determined by breath-holding (BHI) and hyperventilation.
In 177 of 200 eligible patients who had adequate TCD and beat-to-beat SBP
readings, SBP variability was associated with MCA-PI (beat-to-beat CV r=0.317 p<0.0001;
HBPM CV r=0.334 p<0.001), aortic PP (beat-to-beat 0.287 p<0.001; HBPM 0.277 p<0.001),
response to BHI (beat-to-beat r=-0.211 p=0.018; home r=-0.176 p=0.06) and response to
hyperventilation (bt-to-bt 0.228 p=0.04; home 0.295 p=0.018), whilst response to
hyperventilation was associated with cerebral pulsatility (r=0.271 p=0.025). Cerebral
pulsatility was related to daytime (r=0.269 p=0.001) and evening (r=0.274 p=0.0001) SBP
variability whilst response to hyperventilation was related to early morning SBP variability
(r=0.340 p=0.004).
SBP variability was associated with both cerebral pulsatility and reactivity,
potentially explaining, at least in part, the association with stroke risk. However,
mechanisms underlying the association between SBP variability with cerebral pulsatility and
reactivity may differ.
195
10.2 Introduction
Visit-to-visit variability in systolic blood pressure (SBP) and episodic hypertension in
clinic are associated with an increased risk of stroke and all cardiovascular events,
independent of mean BP (chapter 2). Furthermore, visit-to-visit SBP variability is reduced
by calcium channel blockers but increased with beta-blockers, potentially explaining
differences in stroke risk that are not explained by differences in mean SBP (chapters 3 and
8). The strong relationship between maximum blood pressure and stroke risk suggests that
acute elevations in blood pressure may underlie the relationship between SBP variability
and stroke risk,1 but an alternative possibility is that increased variability in blood pressure
either causes or is associated with an underlying chronic arteriopathy that results in an
increased risk of stroke by alternative mechanisms.2
As demonstrated in chapter 9, cerebral pulsatility is associated with leukoaraiosis.
Furthermore, cerebral pulsatility was dependent upon aortic pulsatility and arterial stiffness,
supporting the hypothesis that leukoaraiosis partly results from increased arterial stiffness
causing greater transmission of the pulsatile arterial waveform to the cerebral circulation,
and so potentially explaining some of the relationship between aortic stiffness and stroke
risk.3 Impairment of cerebral reactivity is also associated with an increased risk of stroke in
occlusive large artery disease,4 but few studies have assessed its contribution to recurrent
stroke risk in the absence of large artery disease. Therefore, in an extended cohort from the
same population based study, I determined whether variability in blood pressure from beat-
to-beat, day-to-day and visit-to-visit was associated with either increased cerebral pulsatility
or measures of cerebral reactivity.
196
10.3 Methods
10.3.1 Study population
This analysis was carried out in all eligible patients included in the physiological
substudy of the Oxford Vascular Study (OXVASC)5 who underwent transcranial doppler
ultrasound (TCD) performed between January 2011 and December 2012. Patients were
recruited from the acute TIA and stroke clinic associated with the study, as described in
chapter 9, but including additional patients in whom there was no MRI-based assessment of
leukoaraiosis. Participants were excluded if they were under 18 years, cognitively impaired
(MMSE<23), pregnant, had a recent myocardial infarction (<1 month), unstable angina,
heart failure (NYHA 3-4 or ejection fraction <40%), untreated severe bilateral carotid
stenosis (>70%) or occlusion, a condition likely to result in autonomic dysfunction or which
to confounded the test measures. Patients with atrial fibrillation (AF) were excluded from
this analysis as AF randomly increases SBP variability. The study was approved by the
Oxfordshire Research Ethics Committee.
10.3.2 Laboratory Procedures
Laboratory tests were performed at rest in a quiet, dimly-lit, temperature-controlled
room (21-230C). Applanation tonometry (Sphygmocor, AtCor Medical, Sydney, Australia)
was used to measure carotid-femoral pulse wave velocity (aoPWV) and central aortic
systolic, diastolic and pulse pressure (aoSBP, aoDBP, aoPP),6 calibrated to the average of
3 brachial blood pressures measured supine after at least 10 minutes rest. Transcranial
Doppler ultrasound (TCD, Doppler Box, Compumedics DWL, Singen, Germany) was
performed with a handheld 2MHz probe at the temporal bone window, on the same side as
carotid applanation tonometry, to determine middle cerebral artery velocities and pulsatility.
For carbon dioxide (CO2) reactivity testing, bilateral TCD monitoring was performed with
2MHz probes attached to a DiaMon headset. The waveform envelope was acquired at
100Hz simultaneously with ECG, blood pressure (Finometer, Finapres Medical Systems,
The Netherlands) and end tidal CO2 (EtCO2, Capnocheck Plus, Smiths Medical) at 200Hz,
197
acquired via a Powerlab 8/30 (ADInstruments, USA). The bifurcation into MCA and ACA
was identified and the MCA was insonated superficial to this, ideally at a depth between 50-
60mm. Data were exported to Matlab R2010a for calculation of mean MCA transit time
(MCA-TT) measured from the QRS complex to the foot of at least 7 beats as identified by
intersecting tangents.7 All waveforms were visually inspected and beats corrupted by
artefact were excluded. MCA-PWV was calculated as the distance between the sternal
notch and the temporal bone window divided by MCA-TT.8 MCA pulsatility was calculated
as Gosling’s pulsatility index (MCA-PI= (systolic CBFV-diastolic CBFV) / mean CBFV), and
Pourcelot’s resistive index (MCA-RI = (systolic CBFV-diastolic CBFV) / peak CBFV).
To determine cerebrovascular reactivity to carbon dioxide, participants were asked
to hold their breath for 30 seconds, with the quality of the breath-hold determined by
capnography. The breath-holding index (BHI) was calculated as: 100*((MCA velocity at end
of breath hold – MCA velocity at baseline) / MCA velocity at baseline) / duration of breath
hold. Patients with a rise in CO2 <5% on repeated trials were excluded. After 2 minutes
rest, patients were asked to hyperventilate for 30s at normal tidal volumes, replicating a
demonstration by the investigator. Tests of cerebrovascular reactivity were only introduced
after the initial study described in chapter 9, with breath-holding index introduced first,
followed by hyperventilation, once the protocol for dual-channel TCD monitoring was
established, and so there are relatively limited patients undergoing these tests.
10.3.3 Blood Pressure Measurement
Beat-to-beat variability in supine SBP was assessed for 5 minutes after 20 minutes
of supine rest (Finometer, Finapres Medical Systems) with readings calibrated to 2 supine
brachial blood pressure readings. Slow drifts in the recordings were removed by cubic
regression to improve stationarity. The lifetime medical record held by the primary care
physician was manually reviewed and all recorded premorbid BPs ascertained. From the
ascertainment visit, or the earliest opportunity after discharge, all patients performed sets of
three home BP readings (HBPM), three times daily (on waking, mid-morning and before
198
sleep) with a Bluetooth-enabled, regularly-calibrated, telemetric BP monitor, either an IEM
Stabil-o-Graph or an A&D UA-767 BT. Patients were instructed to relax in a chair for 5
minutes before performing readings in the non-dominant arm, or the arm with the higher
reading if the mean SBP differed by >20mmHg between arms, and were assessed at doing
so at ascertainment. Anonymised measures were transmitted by Bluetooth radio to a
mobile phone, for secure transmission to a server hosting a password-protected website for
review and download of readings (t+ Medical, Abingdon, UK). At the 1 month follow-up visit,
awake ambulatory measurements (ABPM) were performed with an A&D TM-2430 monitor
in the non-dominant arm, fitted by a trained study nurse, at 30 minutes intervals during the
day and 60 minute intervals at night.
Patients continued home monitoring until the one month follow-up appointment, if
tolerated, but could continue monitoring to achieve adequate BP control. Mean BP was
treated to a target of <130/80 on home monitoring or mean ABPM, except in the presence
of haemodynamically significant stenosis (bilateral carotid stenosis >70% or end-artery
stenosis >70%) when targets were determined on an individual basis. Choice of
antihypertensive agent was tailored to the individual patient but standard first-line treatment
was a combination of perindopril arginine 5mg and indapamide 1.25mg, followed by
amlodipine 5mg, then amlodipine 10mg, with subsequent choices at the physician’s
discretion.
10.3.4 Analysis
Analyses of home SBP variability used all home readings acquired from 7 days after
the recruitment visit (to reduce acute treatment or event effects) until readings were not
performed on at least 3 days of the week, the monitor was returned or 90 days had
elapsed, taking the average of the last two readings of each BP cluster. SBP and DBP on
ABPM were derived for awake readings following automated and manual exclusion of
artefactual measurements according to predefined criteria.9 Premorbid SBP and DBP were
derived from all readings recorded in the lifetime primary care record and from readings in
199
the five years prior to the notification event. SBP variability was defined as the coefficient of
variation (CV=100 * standard deviation / mean) for awake and premorbid readings, and as
residual CV about a moving average over 9 days for all home BP readings or for early
morning, mid-morning and evening separately.
Physiological predictors of variability in home, beat-to-beat or awake SBP variability
were determined by general linear models (GLM), unadjusted and adjusted for age and
gender. Physiological predictors of cerebral pulsatility were also assessed by GLMs with
and without variability in SBP to determine independence. Secondly, significant
physiological predictors were categorised into tertiles of the population and differences
across tertiles assessed by ANOVA.
All analyses were performed in Matlab R2010b, Microsoft Excel 2010 and IBM SPSS 20.0.
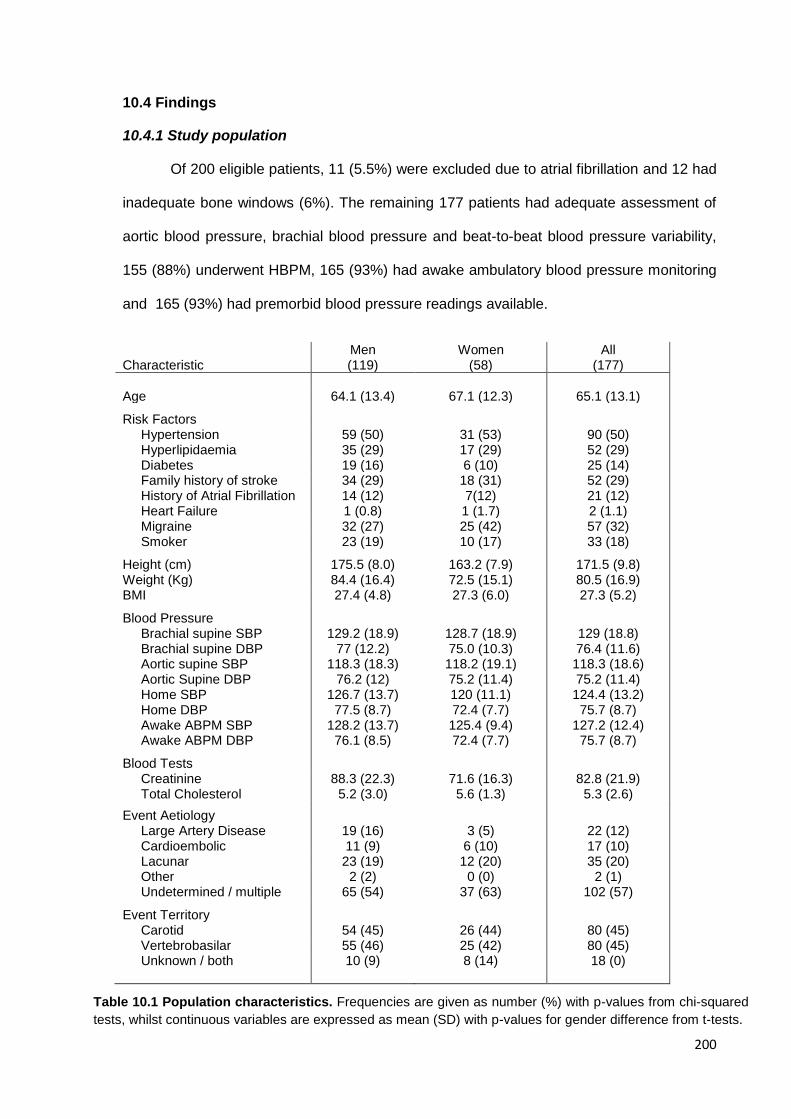
200
10.4 Findings
10.4.1 Study population
Of 200 eligible patients, 11 (5.5%) were excluded due to atrial fibrillation and 12 had
inadequate bone windows (6%). The remaining 177 patients had adequate assessment of
aortic blood pressure, brachial blood pressure and beat-to-beat blood pressure variability,
155 (88%) underwent HBPM, 165 (93%) had awake ambulatory blood pressure monitoring
and 165 (93%) had premorbid blood pressure readings available.
Characteristic Men (119)
Women (58)
All (177)
Age 64.1 (13.4) 67.1 (12.3) 65.1 (13.1)
Risk Factors Hypertension 59 (50) 31 (53) 90 (50) Hyperlipidaemia 35 (29) 17 (29) 52 (29) Diabetes 19 (16) 6 (10) 25 (14) Family history of stroke 34 (29) 18 (31) 52 (29) History of Atrial Fibrillation 14 (12) 7(12) 21 (12) Heart Failure 1 (0.8) 1 (1.7) 2 (1.1) Migraine 32 (27) 25 (42) 57 (32) Smoker 23 (19) 10 (17) 33 (18)
Height (cm) 175.5 (8.0) 163.2 (7.9) 171.5 (9.8) Weight (Kg) 84.4 (16.4) 72.5 (15.1) 80.5 (16.9) BMI 27.4 (4.8) 27.3 (6.0) 27.3 (5.2)
Blood Pressure Brachial supine SBP Brachial supine DBP
129.2 (18.9)
77 (12.2)
128.7 (18.9) 75.0 (10.3)
129 (18.8) 76.4 (11.6)
Aortic supine SBP Aortic Supine DBP Home SBP Home DBP Awake ABPM SBP Awake ABPM DBP
Blood Tests
118.3 (18.3) 76.2 (12)
126.7 (13.7) 77.5 (8.7)
128.2 (13.7) 76.1 (8.5)
118.2 (19.1) 75.2 (11.4) 120 (11.1) 72.4 (7.7) 125.4 (9.4) 72.4 (7.7)
118.3 (18.6) 75.2 (11.4) 124.4 (13.2) 75.7 (8.7)
127.2 (12.4) 75.7 (8.7)
Creatinine 88.3 (22.3) 71.6 (16.3) 82.8 (21.9) Total Cholesterol 5.2 (3.0) 5.6 (1.3) 5.3 (2.6)
Event Aetiology Large Artery Disease 19 (16) 3 (5) 22 (12) Cardioembolic 11 (9) 6 (10) 17 (10) Lacunar 23 (19) 12 (20) 35 (20) Other 2 (2) 0 (0) 2 (1) Undetermined / multiple 65 (54) 37 (63) 102 (57)
Event Territory Carotid
54 (45)
26 (44)
80 (45)
Vertebrobasilar 55 (46) 25 (42) 80 (45) Unknown / both 10 (9) 8 (14) 18 (0)
Table 10.1 Population characteristics. Frequencies are given as number (%) with p-values from chi-squared
tests, whilst continuous variables are expressed as mean (SD) with p-values for gender difference from t-tests.
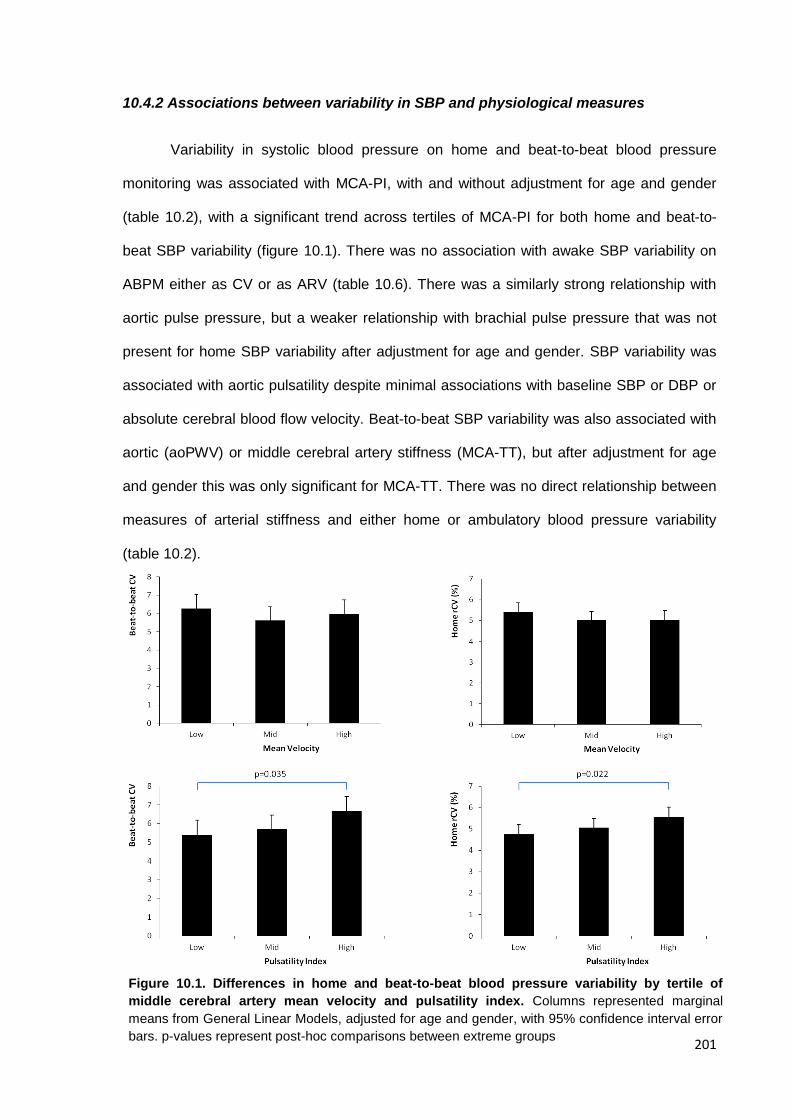
201
10.4.2 Associations between variability in SBP and physiological measures
Variability in systolic blood pressure on home and beat-to-beat blood pressure
monitoring was associated with MCA-PI, with and without adjustment for age and gender
(table 10.2), with a significant trend across tertiles of MCA-PI for both home and beat-to-
beat SBP variability (figure 10.1). There was no association with awake SBP variability on
ABPM either as CV or as ARV (table 10.6). There was a similarly strong relationship with
aortic pulse pressure, but a weaker relationship with brachial pulse pressure that was not
present for home SBP variability after adjustment for age and gender. SBP variability was
associated with aortic pulsatility despite minimal associations with baseline SBP or DBP or
absolute cerebral blood flow velocity. Beat-to-beat SBP variability was also associated with
aortic (aoPWV) or middle cerebral artery stiffness (MCA-TT), but after adjustment for age
and gender this was only significant for MCA-TT. There was no direct relationship between
measures of arterial stiffness and either home or ambulatory blood pressure variability
(table 10.2).
Figure 10.1. Differences in home and beat-to-beat blood pressure variability by tertile of
middle cerebral artery mean velocity and pulsatility index. Columns represented marginal
means from General Linear Models, adjusted for age and gender, with 95% confidence interval error
bars. p-values represent post-hoc comparisons between extreme groups
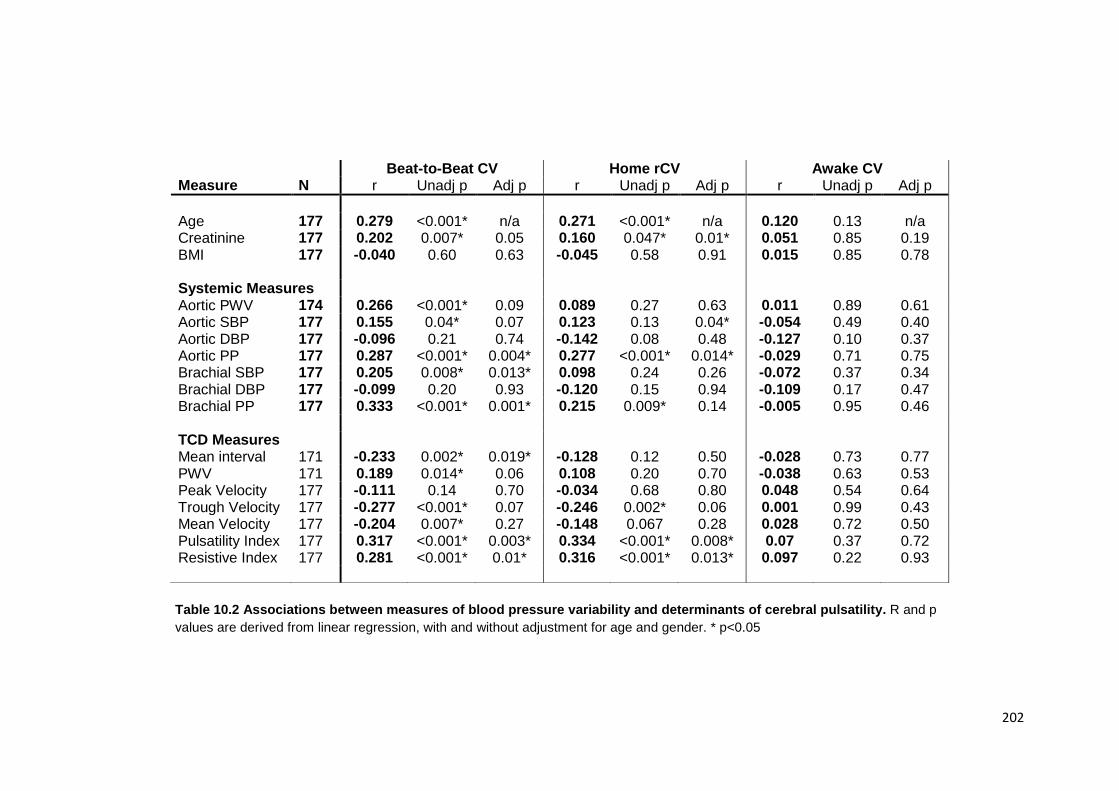
202
Beat-to-Beat CV Home rCV Awake CV Measure N r Unadj p Adj p r Unadj p Adj p r Unadj p Adj p
Age 177 0.279 <0.001* n/a 0.271 <0.001* n/a 0.120 0.13 n/a Creatinine 177 0.202 0.007* 0.05 0.160 0.047* 0.01* 0.051 0.85 0.19 BMI 177 -0.040 0.60 0.63 -0.045 0.58 0.91 0.015 0.85 0.78 Systemic Measures Aortic PWV 174 0.266 <0.001* 0.09 0.089 0.27 0.63 0.011 0.89 0.61 Aortic SBP 177 0.155 0.04* 0.07 0.123 0.13 0.04* -0.054 0.49 0.40 Aortic DBP 177 -0.096 0.21 0.74 -0.142 0.08 0.48 -0.127 0.10 0.37 Aortic PP 177 0.287 <0.001* 0.004* 0.277 <0.001* 0.014* -0.029 0.71 0.75 Brachial SBP 177 0.205 0.008* 0.013* 0.098 0.24 0.26 -0.072 0.37 0.34 Brachial DBP 177 -0.099 0.20 0.93 -0.120 0.15 0.94 -0.109 0.17 0.47 Brachial PP 177 0.333 <0.001* 0.001* 0.215 0.009* 0.14 -0.005 0.95 0.46 TCD Measures Mean interval 171 -0.233 0.002* 0.019* -0.128 0.12 0.50 -0.028 0.73 0.77 PWV 171 0.189 0.014* 0.06 0.108 0.20 0.70 -0.038 0.63 0.53 Peak Velocity 177 -0.111 0.14 0.70 -0.034 0.68 0.80 0.048 0.54 0.64 Trough Velocity 177 -0.277 <0.001* 0.07 -0.246 0.002* 0.06 0.001 0.99 0.43 Mean Velocity 177 -0.204 0.007* 0.27 -0.148 0.067 0.28 0.028 0.72 0.50 Pulsatility Index 177 0.317 <0.001* 0.003* 0.334 <0.001* 0.008* 0.07 0.37 0.72 Resistive Index 177 0.281 <0.001* 0.01* 0.316 <0.001* 0.013* 0.097 0.22 0.93
Table 10.2 Associations between measures of blood pressure variability and determinants of cerebral pulsatility. R and p
values are derived from linear regression, with and without adjustment for age and gender. * p<0.05
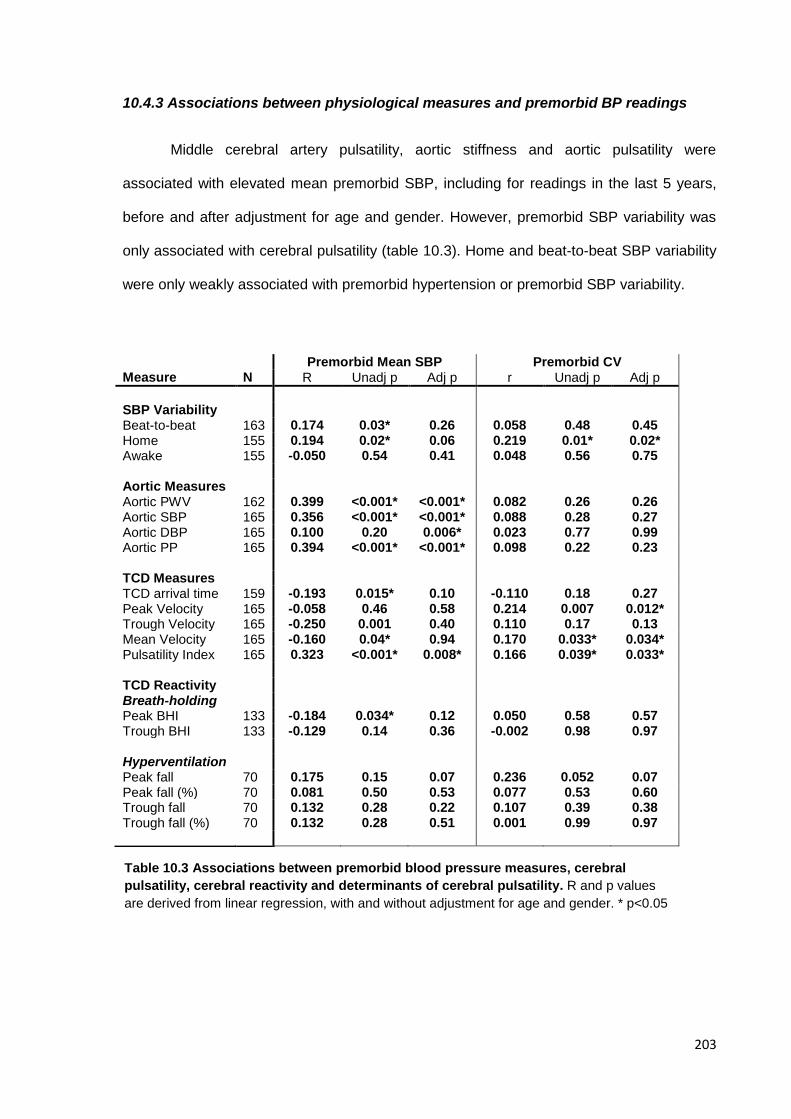
203
10.4.3 Associations between physiological measures and premorbid BP readings
Middle cerebral artery pulsatility, aortic stiffness and aortic pulsatility were
associated with elevated mean premorbid SBP, including for readings in the last 5 years,
before and after adjustment for age and gender. However, premorbid SBP variability was
only associated with cerebral pulsatility (table 10.3). Home and beat-to-beat SBP variability
were only weakly associated with premorbid hypertension or premorbid SBP variability.
Premorbid Mean SBP Premorbid CV Measure N R Unadj p Adj p r Unadj p Adj p
SBP Variability Beat-to-beat 163 0.174 0.03* 0.26 0.058 0.48 0.45 Home 155 0.194 0.02* 0.06 0.219 0.01* 0.02* Awake 155 -0.050 0.54 0.41 0.048 0.56 0.75 Aortic Measures Aortic PWV 162 0.399 <0.001* <0.001* 0.082 0.26 0.26 Aortic SBP 165 0.356 <0.001* <0.001* 0.088 0.28 0.27 Aortic DBP 165 0.100 0.20 0.006* 0.023 0.77 0.99 Aortic PP 165 0.394 <0.001* <0.001* 0.098 0.22 0.23 TCD Measures TCD arrival time 159 -0.193 0.015* 0.10 -0.110 0.18 0.27 Peak Velocity 165 -0.058 0.46 0.58 0.214 0.007 0.012* Trough Velocity 165 -0.250 0.001 0.40 0.110 0.17 0.13 Mean Velocity 165 -0.160 0.04* 0.94 0.170 0.033* 0.034* Pulsatility Index 165 0.323 <0.001* 0.008* 0.166 0.039* 0.033* TCD Reactivity Breath-holding Peak BHI 133 -0.184 0.034* 0.12 0.050 0.58 0.57 Trough BHI 133 -0.129 0.14 0.36 -0.002 0.98 0.97 Hyperventilation Peak fall 70 0.175 0.15 0.07 0.236 0.052 0.07 Peak fall (%) 70 0.081 0.50 0.53 0.077 0.53 0.60 Trough fall 70 0.132 0.28 0.22 0.107 0.39 0.38 Trough fall (%) 70 0.132 0.28 0.51 0.001 0.99 0.97
Table 10.3 Associations between premorbid blood pressure measures, cerebral
pulsatility, cerebral reactivity and determinants of cerebral pulsatility. R and p values
are derived from linear regression, with and without adjustment for age and gender. * p<0.05
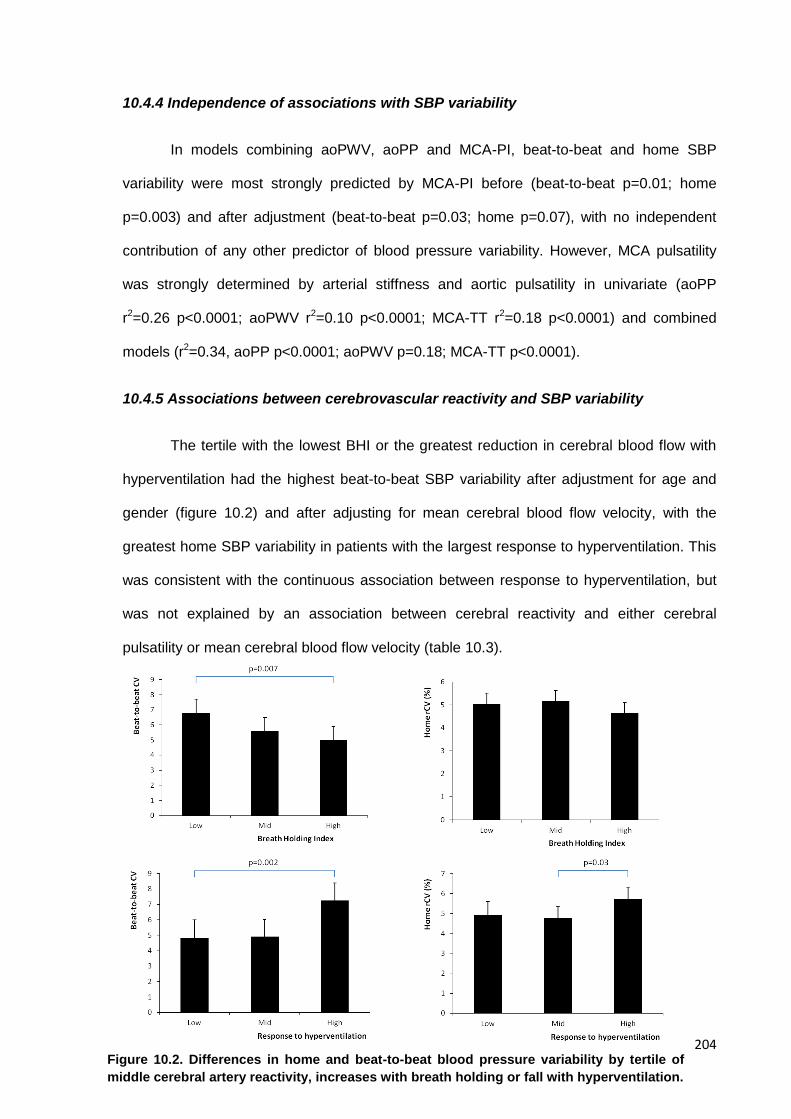
204
10.4.4 Independence of associations with SBP variability
In models combining aoPWV, aoPP and MCA-PI, beat-to-beat and home SBP
variability were most strongly predicted by MCA-PI before (beat-to-beat p=0.01; home
p=0.003) and after adjustment (beat-to-beat p=0.03; home p=0.07), with no independent
contribution of any other predictor of blood pressure variability. However, MCA pulsatility
was strongly determined by arterial stiffness and aortic pulsatility in univariate (aoPP
r2=0.26 p<0.0001; aoPWV r2=0.10 p<0.0001; MCA-TT r2=0.18 p<0.0001) and combined
models (r2=0.34, aoPP p<0.0001; aoPWV p=0.18; MCA-TT p<0.0001).
10.4.5 Associations between cerebrovascular reactivity and SBP variability
The tertile with the lowest BHI or the greatest reduction in cerebral blood flow with
hyperventilation had the highest beat-to-beat SBP variability after adjustment for age and
gender (figure 10.2) and after adjusting for mean cerebral blood flow velocity, with the
greatest home SBP variability in patients with the largest response to hyperventilation. This
was consistent with the continuous association between response to hyperventilation, but
was not explained by an association between cerebral reactivity and either cerebral
pulsatility or mean cerebral blood flow velocity (table 10.3).
Figure 10.2. Differences in home and beat-to-beat blood pressure variability by tertile of
middle cerebral artery reactivity, increases with breath holding or fall with hyperventilation.
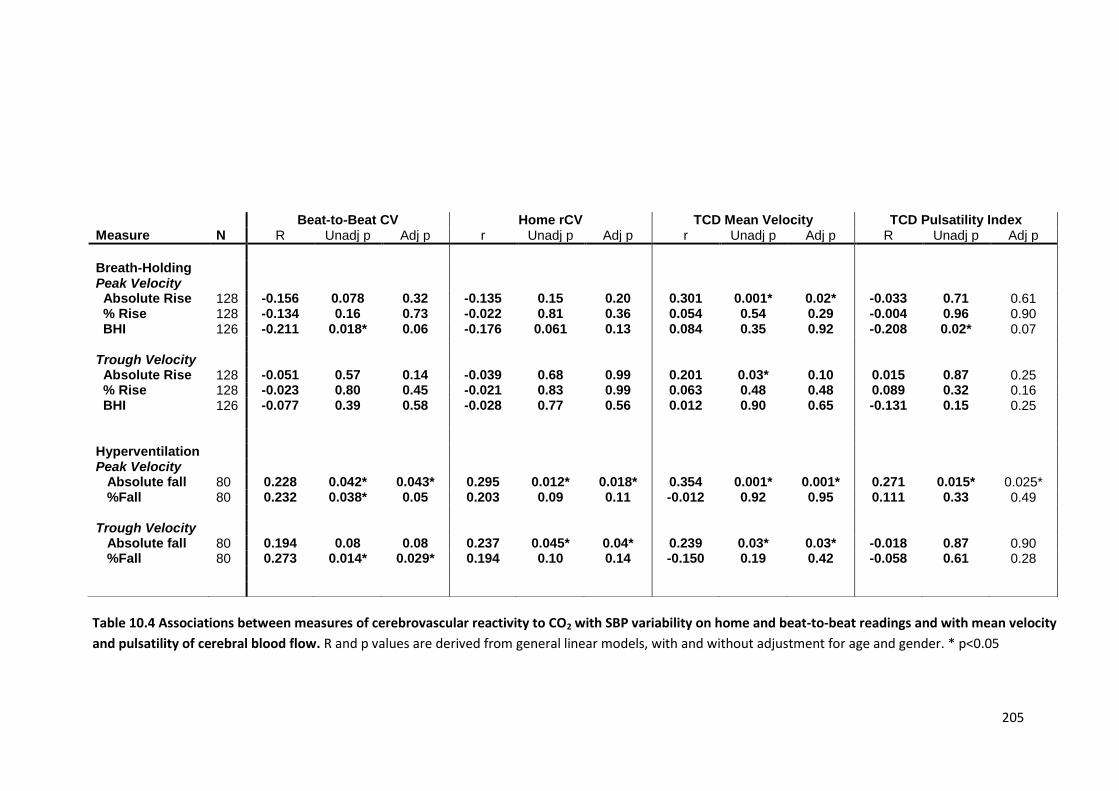
205
Beat-to-Beat CV Home rCV TCD Mean Velocity TCD Pulsatility Index Measure N R Unadj p Adj p r Unadj p Adj p r Unadj p Adj p R Unadj p Adj p
Breath-Holding Peak Velocity
Absolute Rise 128 -0.156 0.078 0.32 -0.135 0.15 0.20 0.301 0.001* 0.02* -0.033 0.71 0.61 % Rise 128 -0.134 0.16 0.73 -0.022 0.81 0.36 0.054 0.54 0.29 -0.004 0.96 0.90 BHI 126 -0.211 0.018* 0.06 -0.176 0.061 0.13 0.084 0.35 0.92 -0.208 0.02* 0.07 Trough Velocity Absolute Rise 128 -0.051 0.57 0.14 -0.039 0.68 0.99 0.201 0.03* 0.10 0.015 0.87 0.25 % Rise 128 -0.023 0.80 0.45 -0.021 0.83 0.99 0.063 0.48 0.48 0.089 0.32 0.16 BHI 126 -0.077 0.39 0.58 -0.028 0.77 0.56 0.012 0.90 0.65 -0.131 0.15 0.25 Hyperventilation Peak Velocity Absolute fall 80 0.228 0.042* 0.043* 0.295 0.012* 0.018* 0.354 0.001* 0.001* 0.271 0.015* 0.025* %Fall 80 0.232 0.038* 0.05 0.203 0.09 0.11 -0.012 0.92 0.95 0.111 0.33 0.49 Trough Velocity Absolute fall 80 0.194 0.08 0.08 0.237 0.045* 0.04* 0.239 0.03* 0.03* -0.018 0.87 0.90 %Fall 80 0.273 0.014* 0.029* 0.194 0.10 0.14 -0.150 0.19 0.42 -0.058 0.61 0.28
Table 10.4 Associations between measures of cerebrovascular reactivity to CO2 with SBP variability on home and beat-to-beat readings and with mean velocity
and pulsatility of cerebral blood flow. R and p values are derived from general linear models, with and without adjustment for age and gender. * p<0.05
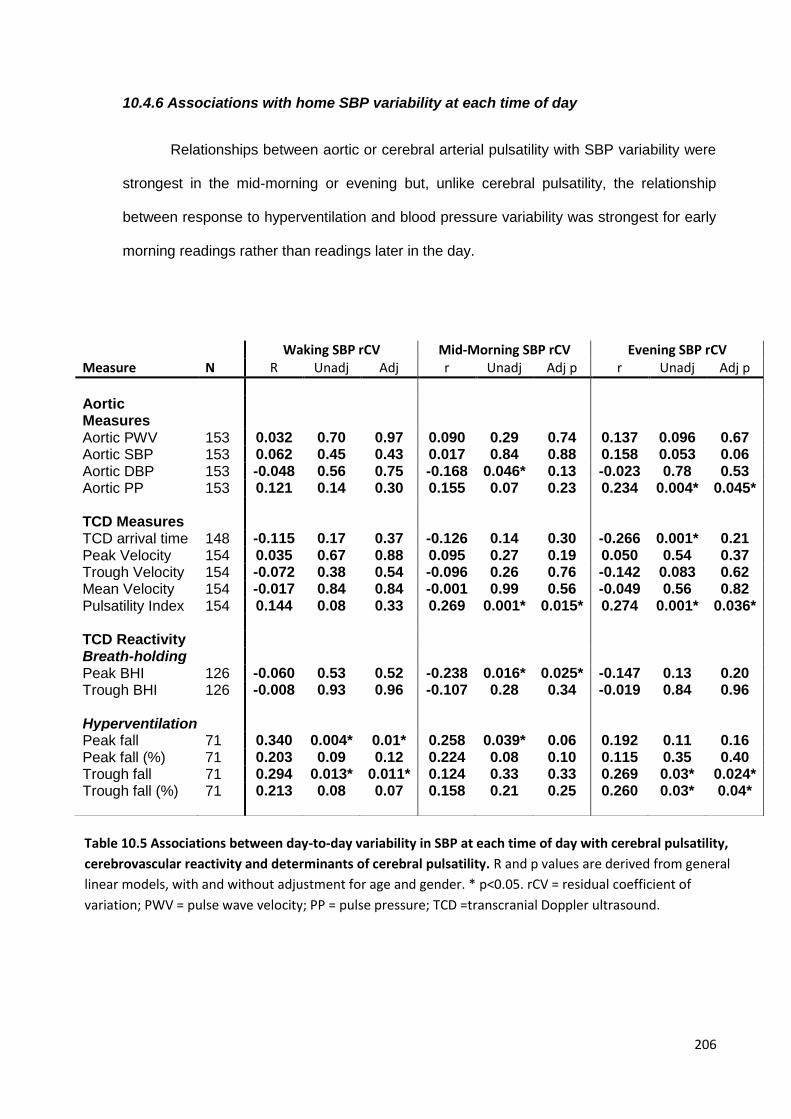
206
10.4.6 Associations with home SBP variability at each time of day
Relationships between aortic or cerebral arterial pulsatility with SBP variability were
strongest in the mid-morning or evening but, unlike cerebral pulsatility, the relationship
between response to hyperventilation and blood pressure variability was strongest for early
morning readings rather than readings later in the day.
Waking SBP rCV Mid-Morning SBP rCV Evening SBP rCV Measure N R Unadj Adj r Unadj Adj p r Unadj Adj p
Aortic Measures
Aortic PWV 153 0.032 0.70 0.97 0.090 0.29 0.74 0.137 0.096 0.67 Aortic SBP 153 0.062 0.45 0.43 0.017 0.84 0.88 0.158 0.053 0.06 Aortic DBP 153 -0.048 0.56 0.75 -0.168 0.046* 0.13 -0.023 0.78 0.53 Aortic PP 153 0.121 0.14 0.30 0.155 0.07 0.23 0.234 0.004* 0.045* TCD Measures TCD arrival time 148 -0.115 0.17 0.37 -0.126 0.14 0.30 -0.266 0.001* 0.21 Peak Velocity 154 0.035 0.67 0.88 0.095 0.27 0.19 0.050 0.54 0.37 Trough Velocity 154 -0.072 0.38 0.54 -0.096 0.26 0.76 -0.142 0.083 0.62 Mean Velocity 154 -0.017 0.84 0.84 -0.001 0.99 0.56 -0.049 0.56 0.82 Pulsatility Index 154 0.144 0.08 0.33 0.269 0.001* 0.015* 0.274 0.001* 0.036* TCD Reactivity Breath-holding Peak BHI 126 -0.060 0.53 0.52 -0.238 0.016* 0.025* -0.147 0.13 0.20 Trough BHI 126 -0.008 0.93 0.96 -0.107 0.28 0.34 -0.019 0.84 0.96 Hyperventilation Peak fall 71 0.340 0.004* 0.01* 0.258 0.039* 0.06 0.192 0.11 0.16 Peak fall (%) 71 0.203 0.09 0.12 0.224 0.08 0.10 0.115 0.35 0.40 Trough fall 71 0.294 0.013* 0.011* 0.124 0.33 0.33 0.269 0.03* 0.024* Trough fall (%) 71 0.213 0.08 0.07 0.158 0.21 0.25 0.260 0.03* 0.04*
Table 10.5 Associations between day-to-day variability in SBP at each time of day with cerebral pulsatility,
cerebrovascular reactivity and determinants of cerebral pulsatility. R and p values are derived from general
linear models, with and without adjustment for age and gender. * p<0.05. rCV = residual coefficient of
variation; PWV = pulse wave velocity; PP = pulse pressure; TCD =transcranial Doppler ultrasound.
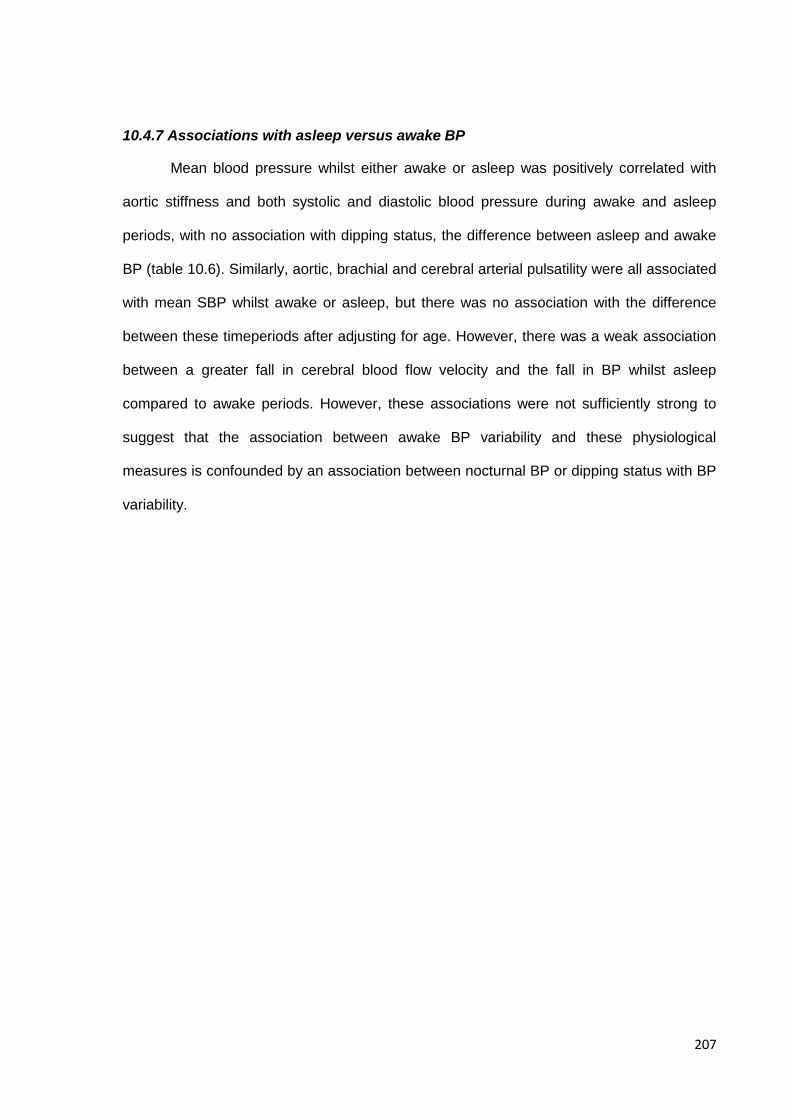
207
10.4.7 Associations with asleep versus awake BP
Mean blood pressure whilst either awake or asleep was positively correlated with
aortic stiffness and both systolic and diastolic blood pressure during awake and asleep
periods, with no association with dipping status, the difference between asleep and awake
BP (table 10.6). Similarly, aortic, brachial and cerebral arterial pulsatility were all associated
with mean SBP whilst awake or asleep, but there was no association with the difference
between these timeperiods after adjusting for age. However, there was a weak association
between a greater fall in cerebral blood flow velocity and the fall in BP whilst asleep
compared to awake periods. However, these associations were not sufficiently strong to
suggest that the association between awake BP variability and these physiological
measures is confounded by an association between nocturnal BP or dipping status with BP
variability.
208
Awake Mean SBP Asleep Mean SBP Awake – Asleep Mean SBP Awake ARV SBP Measure N R Unadj p Adj p r Unadj p Adj p r Unadj p Adj p R Unadj p Adj p
Age 165 -0.097 0.21 n/a 0.172 0.028* n/a -0.316 0* n/a 0.025 0.75 n/a
Creatinine 165 0.036 0.64 0.78 0.146 0.06 0.22 -0.157 0.045* 0.18 0.026 0.74 0.30
BMI 165 0.029 0.71 0.77 -0.034 0.67 0.76 0.079 0.32 0.42 0.008 0.92 0.92 Systemic Measures
Aortic PWV 165 0.141 0.07 0.005* 0.285 <0.001* 0.004* -0.232 0.003* 0.30 0.042 0.60 0.51
Aortic SBP 165 0.378 <0.001* <0.001* 0.241 0.002* 0.003* 0.038 0.63 0.43 0.082 0.30 0.29
Aortic DBP 165 0.287 <0.001* 0.001* 0.068 0.39 0.12 0.176 0.024* 0.28 0.004 0.96 0.70
Aortic PP 165 0.274 <0.001* <0.001* 0.267 0.001* 0.003* -0.088 0.26 0.80 0.106 0.18 0.23
Brachial SBP 165 0.415 <0.001* <0.001* 0.314 <0.001* <0.001* -0.006 0.94 0.89 0.126 0.12 0.12
Brachial DBP 165 0.297 <0.001* 0.001* 0.105 0.19 0.032* 0.145 0.07 0.68 0.023 0.77 0.60
Brachial PP 165 0.292 <0.001* <0.001* 0.316 <0.001* 0.003* -0.121 0.13 0.91 0.141 0.08 0.23 TCD Measures
Mean interval 165 -0.118 0.14 0.041* -0.244 0.002* 0.009* 0.222 0.005* 0.08 -0.027 0.73 0.91
PWV 165 -0.006 0.94 0.96 0.134 0.09 0.24 -0.207 0.009* 0.06 -0.065 0.42 0.47
Peak Velocity 165 0.115 0.14 0.11 0.034 0.67 0.27 0.067 0.4 0.97 0.164 0.036* 0.07
Trough Velocity 165 0.063 0.42 0.75 -0.096 0.22 0.99 0.188 0.016* 0.72 0.100 0.20 0.13
Mean Velocity 165 0.092 0.24 0.31 -0.036 0.65 0.57 0.137 0.08 0.81 0.141 0.07 0.08 Pulsatility
Pulsatility Index 177 0.076 0.33 0.03* 0.213 0.006* 0.04* -0.208 0.008* 0.44 0.065 0.41 0.66
Resistive Index 177 0.089 0.26 0.022* 0.208 0.008* 0.04* -0.189 0.016* 0.48 0.085 0.28 0.50 Breath-holding
BHI 128 -0.055 0.53 0.47 -0.035 0.69 0.95 0.037 0.67 0.96 -0.007 0.93 0.89
Absolute rise 128 -0.030 0.73 0.59 -0.100 0.25 0.36 0.152 0.08 0.26 0.056 0.52 0.47
Relative rise 128 -0.075 0.38 0.32 -0.105 0.22 0.33 0.091 0.29 0.52 -0.022 0.80 0.79 Hyperventilation
Absolute fall 74 0.205 0.08 0.08 -0.048 0.69 0.81 0.217 0.07 0.09 0.275 0.018* 0.03*
Relative fall (%) 74 0.239 0.04* 0.05 -0.081 0.49 0.42 0.279 0.017* 0.012* 0.147 0.22 0.26
Table 10.6 Associations between awake or asleep mean BP, and the difference between them, with physiological measures. R and p values are
derived from general linear models, with and without adjustment for age and gender. * p<0.05. ARV= absolute real variation.
209
10.5 Discussion
Variability in beat-to-beat and home SBP were strongly associated with cerebral and
aortic pulsatility, independent of age and gender, despite weak or absent relationships with
aortic SBP or DBP. Associations between SBP variability and arterial stiffness were partly
explicable by the relationship between cerebral pulsatility and arterial stiffness. Cerebral
reactivity was also associated with both beat-to-beat and home variability in SBP, but it was
associated particularly with day-to-day variability after waking whilst cerebral pulsatility was
associated with day-to-day variability in the mid-morning and evening.
This study demonstrates an association between two novel markers of
cerebrovascular risk. Visit-to-visit variability in SBP was a strong predictor of stroke and
other cerebrovascular events in multiple cohorts with cerebrovascular disease or high-risk
patients with hypertension (chapters 2 and 6). This risk was modifiable with calcium channel
blockers reducing blood pressure variability in comparison to beta-blockers and thereby
reduced the subsequent risk of stroke (chapter 3). However, the physiological mechanisms
relating SBP variability to stroke risk are unknown, and it is unclear which stroke types are
associated with BP variability, although effects on AF are unlikely to explain the
association.10 Unfortunately, there are currently too few patients with each stroke subtype to
reliably determine differences in BP variability in this study. Ideally, this question would best
be addressed by longitudinal effects of increased BP variability and recurrent stroke risk
comparing different events types or progression of leukoaraiosis, and this data should be
acquired within the ongoing OXVASC study. Potential hypotheses explaining this
association include: acute elevations in BP resulting directly in stroke; chronic fluctuations
or episodic peaks causing a chronic arteriopathy that increases the risk of stroke; or SBP
variability representing a secondary feature of an underlying arteriopathy that causes stroke
by an alternative mechanism. Alternatively, it is likely that more than one of these
mechanisms is involved. The second factor that has been a focus of recent research is the
physiological mechanisms underlying leukoaraiosis, with postulated theories including a
210
haemodynamic origin due to increased cerebral pulsatility (chapter 9) versus leukoaraiosis
as the cerebral manifestation of a systemic arteriopathy characterised by altered blood-
brain barrier permeability.11 In chapter 9, I demonstrated the relationship between
leukoaraiosis and cerebral pulsatility and the dependence of cerebral pulsatility on aortic
pulsatility and arterial stiffness, supporting the hypothesis that leukoaraiosis depends upon
increasing central aortic stiffness increasing transmission of the arterial waveform to the
cerebral circulation.
The association between cerebral pulsatility and SBP variability suggests that these
markers of increased cerebrovascular risk are part of an overlapping cardiovascular
phenotype. This has significant ramifications. Firstly, it is unlikely that cerebral pulsatility
causes SBP variability but both may be features of an underlying chronic arteriopathy, at
least in part. The relationship between premorbid mean and variability in SBP and both
cerebral pulsatility and SBP variability suggests that both mean hypertension and SBP
variability may play a role in the development of this arteriopathy. Secondly, although this
study demonstrates a clinically important relationship, the large amount of unexplained
variation in SBP variability implies that other mechanisms are also likely to be responsible
for the relationship between stroke and increased blood pressure variability beyond those
also responsible for increased cerebral pulsatility. These other mechanisms may also have
independent prognostic significance.
The association between cerebrovascular reactivity and blood pressure variability
may reflect an additional phenotype contributing to blood pressure variability, as
cerebrovascular reactivity was only weakly associated with cerebral pulsatility and was
associated with day-to-day SBP variability at different times of day to cerebral pulsatility. In
particular, patients with the smallest response to breath-holding or the largest response to
hyperventilation had the highest SBP variability independent of mean flow velocity,
suggesting greater basal cerebrovascular dilatation with reduced capacity for further
dilatation and a greater capacity for constriction. Abnormalities of cerebral reactivity may
211
also reflect a reduced capacity to compensate for acute fluctuations in systemic blood
pressure, resulting in a synergistic relationship between SBP variability and cerebral
reactivity increasing the risk of stroke.
This study has some limitations. Firstly, the cross-sectional nature of the study
prevents elucidation of the temporal pattern of the associations, and therefore it is difficult to
reach firm conclusions about the direction of causation, although the associations with
premorbid SBP and SBP variability imply a role for prior hypertension. Secondly, measures
of cerebrovascular reactivity were only introduced in this cohort after the study in chapter 9
was underway, and therefore the number of patients undergoing testing of cerebral
reactivity is relatively small, despite the significant relationships demonstrated. Thirdly,
there is currently inadequate follow-up to determine whether these potential measures of
cardiovascular risk are actually associated with recurrent cardiovascular events and
specifically whether the relationship between SBP variability and stroke risk could be
explained by its relationship with cerebral pulsatility. Finally, the degree of significance for
some of these tests is limited, and given the number of physiological measures assessed,
there is a risk that some of the more borderline significant results may reflect chance
occurrence rather than true association.
This study implies that abnormalities in the cerebral circulation are associated with
increased SBP variability and are likely to play a role in the relationship between SBP
variability and stroke risk. However, it is likely that multiple factors affect SBP variability and
these may also be responsible for the increase in stroke risk. The critical test is to
determine which factors are modifiable, and result in a reduction in risk. To achieve this, it
will be necessary to firstly identify which of the mechanisms responsible for increased
variability in SBP are responsible for the resulting risk of stroke, then to identify which are
modifiable by treatment with established treatments that reduce SBP variability and stroke
risk (such as CCBs) and finally to identify additional mechanisms which may be amenable
to alternative interventions. Indeed, this study raises a question as to whether CCBs reduce
212
cerebral pulsatility and reactivity relative to other antihypertensive classes, in association
with their effect on SBP variability. Nonetheless, prior to further studies, identification of
increased cerebral pulsatility on TCD implies that assessment of SBP variability may be
beneficial.
In conclusion, this study demonstrates significant, independent relationships
between beat-to-beat, day-to-day or premorbid visit-to-visit SBP variability with cerebral
pulsatility or reactivity to carbon dioxide. These may partly explain the association with the
risk of stroke and imply that leukoaraiosis and lacunar stroke may be particularly associated
with SBP variability compared to other stroke subtypes. Finally, it implies that cerebral
pulsatility is an important, novel and modifiable potential risk factor for stroke which may be
amenable to treatment with calcium channel blockers.
10.6 References
1. Rothwell PM, Howard SC, Dolan E, et al. Prognostic significance of visit-to-visit variability, maximum systolic blood pressure, and episodic hypertension. Lancet 2010;375:895-905.
2. Wardlaw JM, Smith C, Dichgans M. Mechanisms of sporadic cerebral small vessel disease: insights from neuroimaging. Lancet Neurol 2013;12:483-497.
3. Vlachopoulos C, Aznaouridis K, Stefanadis C. Prediction of cardiovascular events and all-cause mortality with arterial stiffness: a systematic review and meta-analysis. J Am Coll Cardiol 2010;55:1318-1327.
4. Conklin J, Fierstra J, Crawley AP, et al. Mapping white matter diffusion and cerebrovascular reactivity in carotid occlusive disease. Neurology 2011;77:431-438.
5. Rothwell PM, Coull AJ, Giles MF, et al. Change in stroke incidence, mortality, case-fatality, severity, and risk factors in Oxfordshire, UK from 1981 to 2004 (Oxford Vascular Study). Lancet 2004;363:1925-1933.
6. Sharman JE, Lim R, Qasem AM, et al. Validation of a generalized transfer function to noninvasively derive central blood pressure during exercise. Hypertension 2006;47:1203-1208.
7. Chiu YC, Arand PW, Shroff SG, Feldman T, Carroll JD. Determination of pulse wave velocities with computerized algorithms. Am Heart J 1991;121:1460-1470.
8. Gladdish S, Manawadu D, Banya W, Cameron J, Bulpitt CJ, Rajkumar C. Repeatability of non-invasive measurement of intracerebral pulse wave velocity using transcranial Doppler. Clin Sci (Lond) 2005;108:433-439.
9. Casadei R, Parati G, Pomidossi G, et al. 24-hour blood pressure monitoring: evaluation of Spacelabs 5300 monitor by comparison with intra-arterial blood pressure recording in ambulant subjects. J Hypertens 1988;6:797-803.
10. Webb AJ, Rothwell PM. Blood pressure variability and risk of new-onset atrial fibrillation: a systematic review of randomized trials of antihypertensive drugs. Stroke 2010;41:2091-2093.
11. Wardlaw JM, Doubal F, Armitage P, et al. Lacunar stroke is associated with diffuse blood-brain barrier dysfunction. Ann Neurol 2009;65:194-202.
12. Henskens LHG, Kroon AA, van Oostenbrugge RJ, et al. Increased Aortic Pulse Wave Velocity Is Associated With Silent Cerebral Small-Vessel Disease in Hypertensive Patients. Hypertension 2008;52:1120-1126.
13. Tuttolomondo A, Di Sciacca R, Di Raimondo D, et al. Arterial stiffness indexes in acute ischemic stroke: relationship with stroke subtype. Atherosclerosis 2010;211:187-194.
213
CHAPTER ELEVEN
Conclusions and Implications for Future Research
11.1 Introduction 214
11.2 Summary of main findings 215
11.2.1 Validity of BP variability as a marker of cardiovascular risk 216
11.2.2 Effects of antihypertensive drugs on BP variability and cardiovascular events 217
11.2.3 Identifying the optimal method for blood pressure assessment 218
11.2.4 Identifying an optimal method for detection of vascular cognitive impairment 219
11.2.5 Determinants of BP variability 221
11.2.6 Covariance between SBP variability and abnormal cerebral haemodynamics 222
11.3 Research implications: Ongoing work 223
11.3.1 Systematic review and meta-analysis 223
11.3.2 Physiological determinants of BP variability 224
11.3.3 Associations between BP variability and development of cognitive impairment 225
11.3.4 Associations between biomarkers and blood pressure variability 225
11.3.5 Drug class effects on BP variability and cerebral pulsatility in healthy subjects 226
11.3.6 Drug class effects on BP variability and cerebral pulsatility in patients 227
11.4 Research implications: Future avenues of investigation 227
11.4 Conclusions 230
11.6 References 231
214
11.1 Introduction
In this thesis I have addressed some of the outstanding questions that have arisen
from the demonstration that visit-to-visit blood pressure variability is associated with an
increased risk of stroke and that it is amenable to treatment by the use of specific
antihypertensive medications. Firstly, I have used clinical trial data to define and validate the
relationship between blood pressure variability and cardiovascular risk and to define the
effect of blood pressure lowering medications. Secondly, I have investigated a population of
patients performing home blood pressure monitoring (HBPM) after a TIA or minor stroke as
part of the population-based Oxford Vascular Study. Thirdly, I have established a
physiological study within this population to determine associations between BP variability
and other physiological markers of cardiovascular risk. Using these studies, I have
attempted to address the aims stated in chapter 1:
1. Confirm and validate the observation that medium-term blood pressure variability
is related to an increased risk of cardiovascular events;
2. Further characterize the effects of different classes of antihypertensive agent on
blood pressure variability and the related risk of stroke;
3. Determine the optimal method of assessing blood pressure variability;
4. Identify the clinical and physiological determinants of medium-term blood
pressure variability;
5. Assess whether medium-term variability may be related to a risk of stroke or
dementia through associated effects on cerebral haemodynamics;
6. Establish a cohort of patients with detailed blood pressure monitoring and
physiological assessment for future determination of cardiovascular risk.
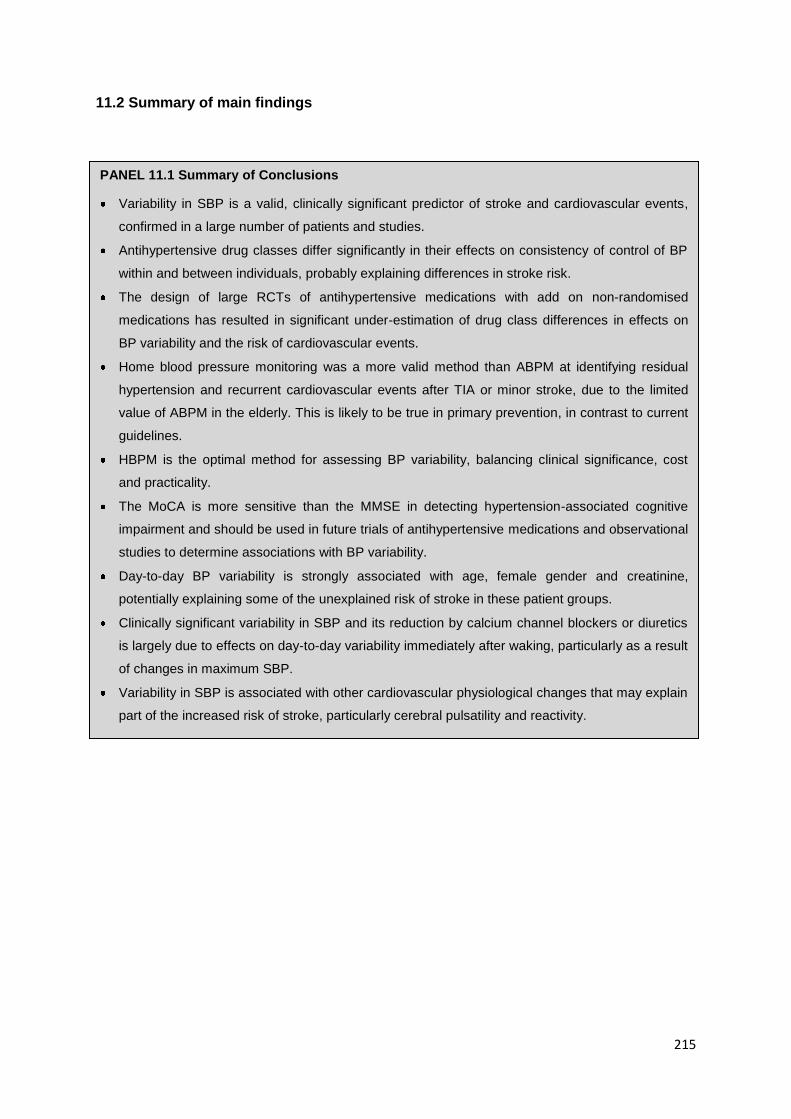
215
11.2 Summary of main findings
PANEL 11.1 Summary of Conclusions
Variability in SBP is a valid, clinically significant predictor of stroke and cardiovascular events,
confirmed in a large number of patients and studies.
Antihypertensive drug classes differ significantly in their effects on consistency of control of BP
within and between individuals, probably explaining differences in stroke risk.
The design of large RCTs of antihypertensive medications with add on non-randomised
medications has resulted in significant under-estimation of drug class differences in effects on
BP variability and the risk of cardiovascular events.
Home blood pressure monitoring was a more valid method than ABPM at identifying residual
hypertension and recurrent cardiovascular events after TIA or minor stroke, due to the limited
value of ABPM in the elderly. This is likely to be true in primary prevention, in contrast to current
guidelines.
HBPM is the optimal method for assessing BP variability, balancing clinical significance, cost
and practicality.
The MoCA is more sensitive than the MMSE in detecting hypertension-associated cognitive
impairment and should be used in future trials of antihypertensive medications and observational
studies to determine associations with BP variability.
Day-to-day BP variability is strongly associated with age, female gender and creatinine,
potentially explaining some of the unexplained risk of stroke in these patient groups.
Clinically significant variability in SBP and its reduction by calcium channel blockers or diuretics
is largely due to effects on day-to-day variability immediately after waking, particularly as a result
of changes in maximum SBP.
Variability in SBP is associated with other cardiovascular physiological changes that may explain
part of the increased risk of stroke, particularly cerebral pulsatility and reactivity.
216
11.2.1 Validity of BP variability as a marker of cardiovascular risk
In 318,700 patients from 43 independent cohorts (chapter 2), SBP variability was
associated with a clinically significant >20% increased risk of stroke and myocardial
infarction per standard deviation across the population, with a weaker association with
cardiovascular death, independent of mean SBP. The large size, broad population and
inclusion of extensive data from all trials within the Blood Pressure Lowering Trialists’
Collaboration reduces the likelihood of publication or reporting bias and represents the most
reliable estimate of the BP variability-associated risk of cardiovascular events that has yet
been performed. In the OXVASC study, a similar 30% increased risk of cardiovascular
events was found for SBP variability on HBPM after TIA and minor stroke, consistent with
the demonstration of its physiological validity by the strong association with hypertensive
arteriopathy and premorbid BP readings (chapter 6).
This demonstration of the statistical, physiological and clinical validity of variability in
SBP has resolved conflict between studies reporting inconsistent results for the association
with cardiovascular risk.1-6 It demonstrates that assessment of BP variability through
previous clinic readings or HBPM is an important component of cardiovascular risk
assessment and identifies patients at an increased risk of stroke in particular. In addition, it
suggests that in patients with cerebrovascular disease, active assessment of BP variability
after the initiation of treatment may identify a treatable population at an increased risk of
recurrent events. However, for BP variability to become part of routine clinical practice, more
precise definition of thresholds at which BP variability represents a significant increase in risk
and the degree to which BP variability improves risk stratification beyond currently accepted
models is required. Further clarification is required to determine which cardiovascular
outcomes are dependent upon BP variability, which patient groups are at the greatest risk
and which non-cardiovascular outcomes are associated with BP variability, such as
dementia.7, 8
217
11.2.2 Effects of antihypertensive drugs on BP variability and cardiovascular events
In 244,479 patients from 32 trials for which intra-individual BP variability was
available, randomisation to a CCB or diuretic versus a renin-angiotensin inhibitor (RASi) or
beta-blocker was associated with improved consistency of blood pressure control within
individuals and in group mean SBP between individuals (chapter 3). These effects were
probably attenuated by addition of drugs from other classes in RCTs, obscuring a greater
effect on BP variability during monotherapy treatment in the first year that may result in the
25% reduction in stroke risk for CCBs or diuretics versus other drugs during this period. This
was consistent across patient groups and was not determined by drug half-life. I replicated
these findings on HBPM after TIA or minor stroke in the OXVASC population (chapter 8),
further demonstrating that the effect was drug-class specific rather than determined by half-
life; that it was predominantly due to a reduction in day-to-day variability in the early morning,
potentially due to limiting the morning surge in blood pressure; and that the addition of a
diuretic to a RASi attenuated the resulting increase in BP variability.
This is the most comprehensive and reliable demonstration of the associated effects
of antihypertensive medications on BP variability and the risk of stroke, demonstrating that
the current design of RCTs with addition of non-randomised drug classes has obscured drug
class differences in effects on outcomes, resulting in large meta-analyses erroneously
concluding that drug class differences are clinically insignificant.9, 10 New guidelines should
take account of the benefit of CCBs and diuretics in populations at a high risk of stroke and
these drugs should be used preferentially unless specific contraindications exist, although
use of RASi is still likely to be beneficial when the risk of morbidity and mortality due to
coronary events is high. However, further research is required: to define thresholds for
specific treatment of BP variability; the optimal combination of drugs for treating mean and
variability in BP; determination of which other outcomes are reduced by BP-variability
directed therapy (cognition, renal impairment); and ideally confirmation of these results in a
prospectively designed RCT to definitively test the hypothesis in an appropriate population.
218
11.2.3 Identifying the optimal method for blood pressure assessment
HBPM was a more valid method of measuring mean SBP (chapter 5) and BP
variability (chapter 6) than ABPM, with stronger associations with premorbid BP readings, 5
markers of hypertensive arteriopathy and greater predictive value for recurrent
cardiovascular events, such that residual hypertension on HBPM after initial treatment was
associated with a 140% increased risk of cardiovascular events, independent of other major
risk factors. Its validity improved with longer duration of monitoring rather than increased
frequency of monitoring (chapter 5 and 6) whilst the limited validity of ABPM in the OXVASC
population was greater in patients >65 years of age (chapter 5). Furthermore, HBPM can be
used to determine the effects of treatment on BP variability (chapter The stronger
association between recurrent cardiovascular events and HBPM compared to ABPM
provides the best evidence for the greater clinical relevance of home SBP after TIA or minor
stroke, but mean and variability in SBP were also validated against physiological markers of
“hypertensive arteriopathy.” This concept was defined as measures known to be associated
with hypertension, and therefore replicating these associations with mean SBP on each
method would provide an additional validation of each BP measurement method. However,
all 5 markers of hypertensive arteriopathy reflect complex phenotypes with multiple causes
that may be independently associated with cardiovascular risk, for example creatinine is
strongly dependent on age, and increases with diabetes.11 Leukoaraisosis in particular is
commonly thought of as a marker of hypertensive disease, but the appearance on CT or
MRI scans is unlikely to represent a single process, with significant heterogeneity in white
matter hyperintensities (including confluent periventricular changes or demarcated deep
lesions), and in associated MRI findings such as dilated perivascular spaces and cerebral
microbleeds,12 whose aetiology may differ by location.13 Furthermore, there is significant
heterogeneity in the aetiology of leukoaraiosis, with multiple factors associated with
leukoaraiosis independent of hypertension, including age, diabetes, monogenic diseases
(CADASIL, CARASIL, COL4A1) and cerebral amyloid angiopathy.12 However, these
alternative causes of leukoaraiosis and the other markers of “hypertensive arteriopathy” are
219
very unlikely to confound the associations with SBP on HBPM or ABPM in this study, as any
hypertension-independent aetiological factor is by definition not associated with
hypertension. These results challenge current guidelines advocating the preferential use of
ABPM over HBPM to determine mean BP, due to assumed greater prognostic value and
cost-effectiveness.14 These guidelines are based almost entirely on studies in younger age
groups, and have had to assume superiority of ABPM due to the lack of studies directly
comparing ABPM and HBPM. As approximately 50% of all new diagnoses of hypertension
are made in patients >65 years old in developed nations,15 a large burden of preventable
hypertension-related disease is likely to be missed, and the use of ABPM is very unlikely to
be more cost-effective than HBPM in any age group, as this would require ABPM to be
significantly more predictive as it is more expensive. Therefore, current recommendations
should not result in wholesale purchase of ABPM machines in primary care, and research is
urgently required to confirm these findings in elderly patients and in primary prevention
studies to determine whether changes in current guidance are required. Future research
investigating BP variability in addition to mean BP should also use HBPM as it also provides
an assessment of BP variability; is simple to use; assesses multiple forms of day-to-day BP
variability; and can be used to determine response to treatment. This research needs to
define the optimal monitoring schedule, treatment thresholds for both mean and variability in
SBP and to assess whether patient-recorded as opposed to telemetric home BP monitoring
is equally valid.
11.2.4 Identifying an optimal method for detection of vascular cognitive impairment
The Montreal Cognitive Assessment (MoCA) detected more cognitively impaired
patients than the MMSE (chapter 7), and this additional burden of cognitive impairment was
associated with a current and premorbid history of hypertension and hypertensive
arteriopathy. This resulted from a greater sensitivity of the MoCA in multiple cognitive
domains, including a greater sensitivity to impairment in domains associated with vascular
disease, and a greater representation of these domains in the overall score.
220
Despite the sensitivity of the MoCA, it is not designed as a comprehensive test of
cognition as it was developed for undifferentiated mild cognitive impairment, with formal
neuropsychological testing still being the gold standard method. In particular, the MoCA
does not formally assess processing speed, and has relatively limited tests of planning and
executive function, with a stronger emphasis on visuo-spatial function. However, it is a rapid
test to perform, with a broader range of tests than the MMSE, which takes approximately the
same length of time to carry out, and was recommended by the National Institute of Health
for detection of vascular cognitive impairment. More detailed screening tests such as the
Addenbrooke’s Cognitive Examination are more unwieldy, and less practical for a large
volume epidemiological study in which multiple assessments are made at each follow up.
The greater sensitivity of the MoCA for hypertension-associated cognitive impairment
suggests that the MoCA should be used in clinical practice as well as future studies
assessing cognitive impairment after TIA or minor stroke and potentially in patients
presenting with cognitive impairment alone. In particular, the low sensitivity of the MMSE
may explain the lack of an effect of blood pressure lowering on cognitive decline in RCTs
which have predominantly used the MMSE. Furthermore, these analyses suggest that future
studies identifying the relationship between BP variability and cognitive decline should
determine the predictive value of BP variability on HBPM for longitudinal cognitive decline on
the MoCA in prospective observational studies, and the effect of BP variability-directed
therapy on the reduction in future cognitive decline in RCTs.
221
11.2.5 Determinants of BP variability
Age and female gender were the strongest clinical determinants of day-to-day BP
variability, along with atrial fibrillation, creatinine and aortic stiffness (chapter 6). Blood
pressure variability was predominantly associated with increased maximum blood pressure
rather than minimum or mean blood pressure, suggesting that it reflects episodic peaks in
blood pressure rather than troughs, particularly early in the morning, as reflected in the
greater effect of BP variability reducing medications in the early morning rather than later in
the day (chapter 8). Although maximum SBP was more strongly associated with male
gender and variability in SBP with female gender, both maximum and variability in SBP
increased more in women with increasing age than mean SBP, although with anomalously
higher variability in the youngest women compared to the youngest men.16
These associations may explain some of the unexplained increased risk of stroke in
these patients groups, including the excess risk of stroke relative to coronary disease in
elderly women compared to men,17 the risk of stroke associated with renal dysfunction18 and
the unexplained increased risk of stroke in young women. Furthermore, the demonstration
that BP variability in the early morning is particularly associated with cardiovascular risk and
hypertensive arteriopathy (chapter 6) and is more responsive to treatment with CCBs or
diuretics suggests that some of the risk relationship is due to episodic elevations in the
morning surge in blood pressure. Future research needs to address whether this results
from an association between day-to-day variability with either non- or reverse dipper
nocturnal blood pressure behaviour.19 Furthermore, in addition to the identified relationship
with arterial stiffness, further research is required to determine the physiological basis of
increased blood pressure variability in these patient groups in order to define treatment
options, determine how different antihypertensive medications reduce BP variability and to
define novel treatment targets.
222
11.2.6 Covariance between SBP variability and abnormal cerebral haemodynamics
Antihypertensive drug class effects on group BP variability in RCTs were inversely
associated with effects on the incidence of headache (chapter 4), suggesting that effects on
peripheral arterial tone may determine effects on BP variability whilst effects on central
arterial tone determine effects on stroke risk. Home BP variability was also associated with
cerebral pulsatility and cerebral reactivity (chapter 10), which could potentially explain the
relationship with the risk of stroke as cerebral pulsatility was strongly associated with
leukoaraiosis (chapter 9). Furthermore, cerebral pulsatility was dependent upon aortic
pulsatility and stiffness of the large conduit vessels, suggesting that leukoaraiosis and the
associated risk of stroke may result from increased transmission of the arterial waveform to
the brain via stiffer arteries.
These associations suggest that the relationship between BP variability and stroke
risk may partly be explained by associated changes in cerebral haemodynamics. These may
simply be correlated physiological abnormalities of an aging vascular system, but it is also
possible that they are both manifestations of an underlying systemic arteriopathy or that
alterations in cerebral haemodynamics result from chronic BP variability. Finally, it is feasible
Panel 11.2 Implications for clinical practice
Day-to-day and visit-to-visit variability in BP are independent risk factors for cardiovascular disease
in clinical practice, although further work to define treatment thresholds is required.
Assessment of BP variability can be used to identify patients at an increased risk of cardiovascular
events, particularly in patients with recent TIA or stroke.
In patients requiring treatment for hypertension, elevated BP variability favours the use of calcium
channel blockers or diuretics.
HBPM should be the method of choice for prospectively assessing BP variability and potentially for
formally diagnosing hypertension in place of ABPM, with at least 1 week of monitoring required.
The MoCA should be used in preference to the MMSE for detection of cognitive impairment in
patients after stroke or TIA.
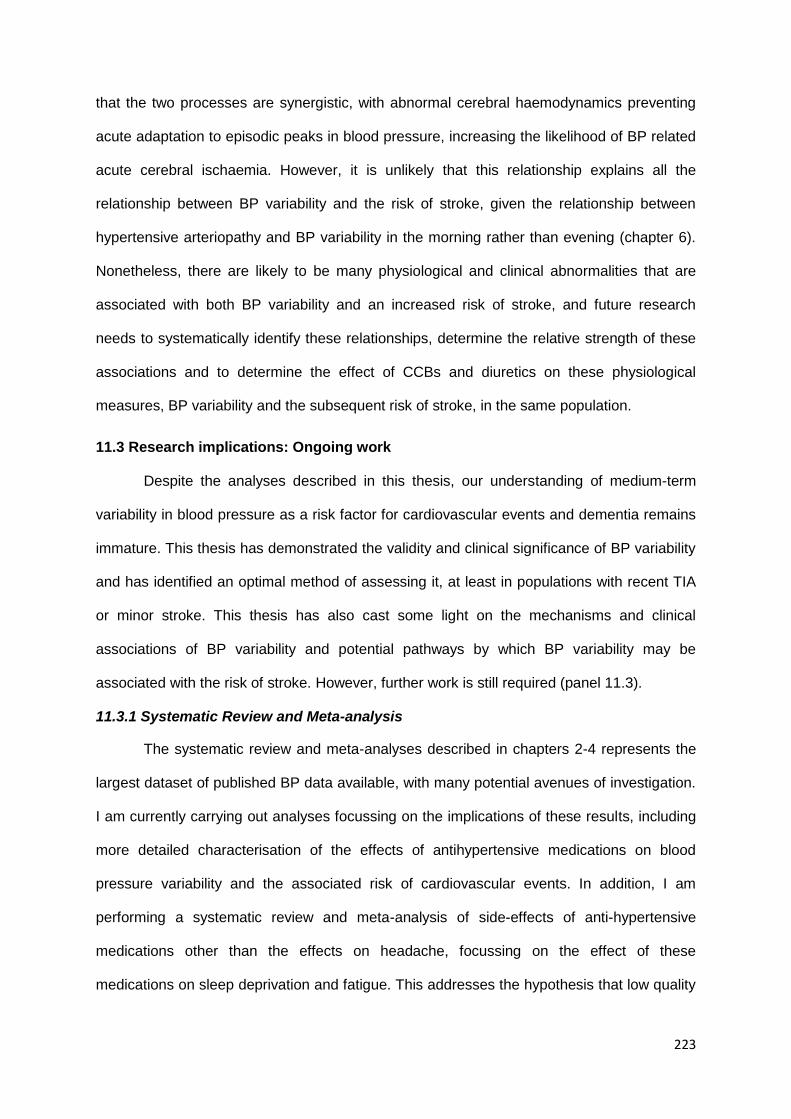
223
that the two processes are synergistic, with abnormal cerebral haemodynamics preventing
acute adaptation to episodic peaks in blood pressure, increasing the likelihood of BP related
acute cerebral ischaemia. However, it is unlikely that this relationship explains all the
relationship between BP variability and the risk of stroke, given the relationship between
hypertensive arteriopathy and BP variability in the morning rather than evening (chapter 6).
Nonetheless, there are likely to be many physiological and clinical abnormalities that are
associated with both BP variability and an increased risk of stroke, and future research
needs to systematically identify these relationships, determine the relative strength of these
associations and to determine the effect of CCBs and diuretics on these physiological
measures, BP variability and the subsequent risk of stroke, in the same population.
11.3 Research implications: Ongoing work
Despite the analyses described in this thesis, our understanding of medium-term
variability in blood pressure as a risk factor for cardiovascular events and dementia remains
immature. This thesis has demonstrated the validity and clinical significance of BP variability
and has identified an optimal method of assessing it, at least in populations with recent TIA
or minor stroke. This thesis has also cast some light on the mechanisms and clinical
associations of BP variability and potential pathways by which BP variability may be
associated with the risk of stroke. However, further work is still required (panel 11.3).
11.3.1 Systematic Review and Meta-analysis
The systematic review and meta-analyses described in chapters 2-4 represents the
largest dataset of published BP data available, with many potential avenues of investigation.
I am currently carrying out analyses focussing on the implications of these results, including
more detailed characterisation of the effects of antihypertensive medications on blood
pressure variability and the associated risk of cardiovascular events. In addition, I am
performing a systematic review and meta-analysis of side-effects of anti-hypertensive
medications other than the effects on headache, focussing on the effect of these
medications on sleep deprivation and fatigue. This addresses the hypothesis that low quality
224
sleep results in a greater nocturnal blood pressure due to sympathetic over-activity, loss of
the normal nocturnal dipping behaviour and a greater variability in the morning surge in
blood pressure, potentially explaining stronger association for BP variability after waking
versus later times of day (figure 11.1).
11.3.2 Physiological determinants of BP variability
The physiological substudy described in chapters 9-10 includes a number of tests in
addition to tests of short-term BP variability and cerebral blood flow. The other arm of this
study includes tests designed to identify physiological processes underlying BP variability.
These include tests of orthostatic blood pressure control, applanation tonometry to define
aortic BP parameters and arterial stiffness as described in chapter 9, measures of resting
state baroreceptor sensitivity and measures of cardiovascular reactivity to stress, including a
mental arithmetic test and the cold pressor test (appendix 5). Currently, this study has
recruited 280 participants and is aiming to recruit another 220 participants over the next 2
Figure 11.1 Random-effects meta-analysis of the effects of randomisation to different classes of
antihypertensive medications in comparison to all other classes on the incidence of patient reported fatigue.
Each comparison is between the named class with all other drug classes, excluding placebo. There is a
significant reduction in fatigue in patients randomised to CCBs, with an increase in fatigue in patients
randomised to beta-blockers, with the same pattern as that demonstrated for blood pressure variability.
225
years. This population of 500 patients, the majority of whom will also undergo ABPM and
HBPM, will allow a detailed characterisation of the physiological abnormalities responsible
for short-term, diurnal and day-to-day blood pressure variability in patients with
cerebrovascular disease. These patients will also continue to be followed up as part of the
OXVASC study so that the independent predictive value of each of these measures for the
risk of future cardiovascular events and cognitive decline can be determined.
11.3.3 Associations between BP variability and development of cognitive impairment
In chapter 7 I demonstrated that the MoCA was more sensitive than the MMSE for
hypertension-associated vascular cognitive impairment, with stronger associations with
hypertension for impairment in cognitive domains associated with vascular disease. The
majority of these patients have also undergone home blood pressure monitoring, ambulatory
blood pressure monitoring and have premorbid blood pressure readings available. I am
therefore analysing the cross-sectional association between blood pressure variability and
cognitive impairment on the MoCA in this patient group. However, given that patients with
significant cognitive impairment may forget to take medications and may have excessive
blood pressure responses to mild stress, it is impossible to determine in a cross-sectional
study whether increases in blood pressure variability are an artefact of underlying cognitive
impairment or manifestations of abnormal cardiovascular physiology, or whether BP
variability causes vascular cognitive impairment. With more prolonged follow-up and repeat
cognitive testing as part of OXVASC, it will possible to determine associations between BP
variability and progression of cognitive impairment, independent of baseline cognitive
impairment, and whether increased BP variability can predict the onset of cognitive
impairment in patients not previously known to be cognitively impaired.
11.3.4 Associations between biomarkers and blood pressure variability
Patients recruited to the OXVASC study provide blood samples for research
purposes, including for the measurement of biomarkers associated with an increased risk of
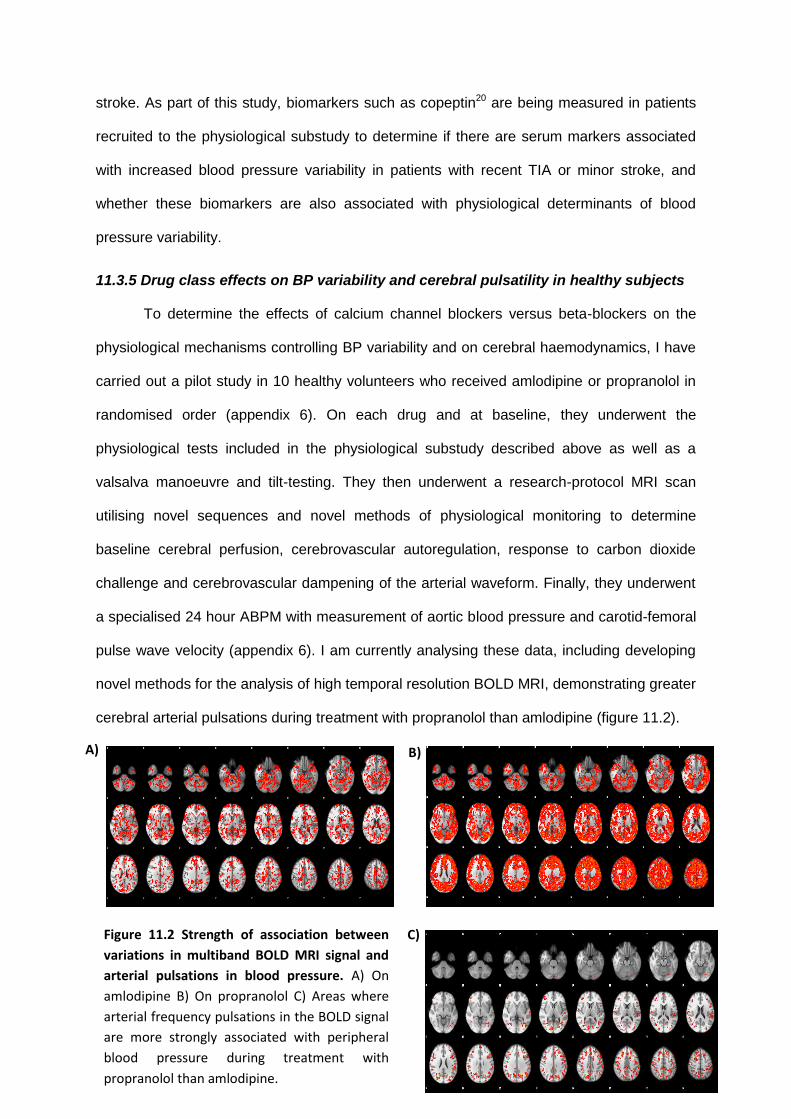
226
stroke. As part of this study, biomarkers such as copeptin20 are being measured in patients
recruited to the physiological substudy to determine if there are serum markers associated
with increased blood pressure variability in patients with recent TIA or minor stroke, and
whether these biomarkers are also associated with physiological determinants of blood
pressure variability.
11.3.5 Drug class effects on BP variability and cerebral pulsatility in healthy subjects
To determine the effects of calcium channel blockers versus beta-blockers on the
physiological mechanisms controlling BP variability and on cerebral haemodynamics, I have
carried out a pilot study in 10 healthy volunteers who received amlodipine or propranolol in
randomised order (appendix 6). On each drug and at baseline, they underwent the
physiological tests included in the physiological substudy described above as well as a
valsalva manoeuvre and tilt-testing. They then underwent a research-protocol MRI scan
utilising novel sequences and novel methods of physiological monitoring to determine
baseline cerebral perfusion, cerebrovascular autoregulation, response to carbon dioxide
challenge and cerebrovascular dampening of the arterial waveform. Finally, they underwent
a specialised 24 hour ABPM with measurement of aortic blood pressure and carotid-femoral
pulse wave velocity (appendix 6). I am currently analysing these data, including developing
novel methods for the analysis of high temporal resolution BOLD MRI, demonstrating greater
cerebral arterial pulsations during treatment with propranolol than amlodipine (figure 11.2).
C) Figure 11.2 Strength of association between
variations in multiband BOLD MRI signal and
arterial pulsations in blood pressure. A) On
amlodipine B) On propranolol C) Areas where
arterial frequency pulsations in the BOLD signal
are more strongly associated with peripheral
blood pressure during treatment with
propranolol than amlodipine.
A) B)
227
11.3.6 Drug class effects on BP variability and cerebral pulsatility in patients
As part of their routine clinical care, patients presenting to the OXVASC TIA or minor
stroke clinic continue to perform home blood pressure monitoring as described in chapter 5.
These patients are most commonly treated with a perindopril-based regimen or an
amlodipine-based regimen if requiring treatment for hypertension. Therefore, to measure the
association between changes in aortic and cerebral pulsatility with changes in home and
ambulatory blood pressure variability, I am currently applying for ethical approval for a study
randomising these patients to amlodipine or perindopril for one month, with measurement of
their cerebral haemodynamics by transcranial Doppler ultrasound, HBPM and a 24 hr ABPM
at baseline and one month (appendix 7).
11.4 Research implications: Future avenues of investigation
Many of the outstanding research questions listed in panel 11.3 are the focus of the
ongoing work described in section 11.3, but further research is still required, some of which
can be addressed with available data or ongoing studies within the Stroke Prevention
Research Unit, and some of which will require additional studies, resources and cooperation
with other groups.
The large dataset of individual RCT patient data that has been gathered through the
Blood Pressure Lowering Trialists’ Collaboration and through direct communication with
authors of other major RCTs is the best available resource to answer a number of questions.
Specifically, it will be possible to estimate treatment thresholds for BP variability that will
result in significant reductions in the subsequent risk of cardiovascular events. Furthermore,
it may be possible to use individual patient data to identify those patient groups who will
particularly benefit from BP variability directed therapy. Finally, it would be ideal to perform a
large, multicentre RCT to determine the effects of BP variability directed therapy strategies
on the risk of cardiovascular disease. The feasibility of such a study may be demonstrated
by the physiological pilot study described in 11.3.6. However, a future RCT within a
secondary prevention population with randomisation to amlodipine vs perindopril based
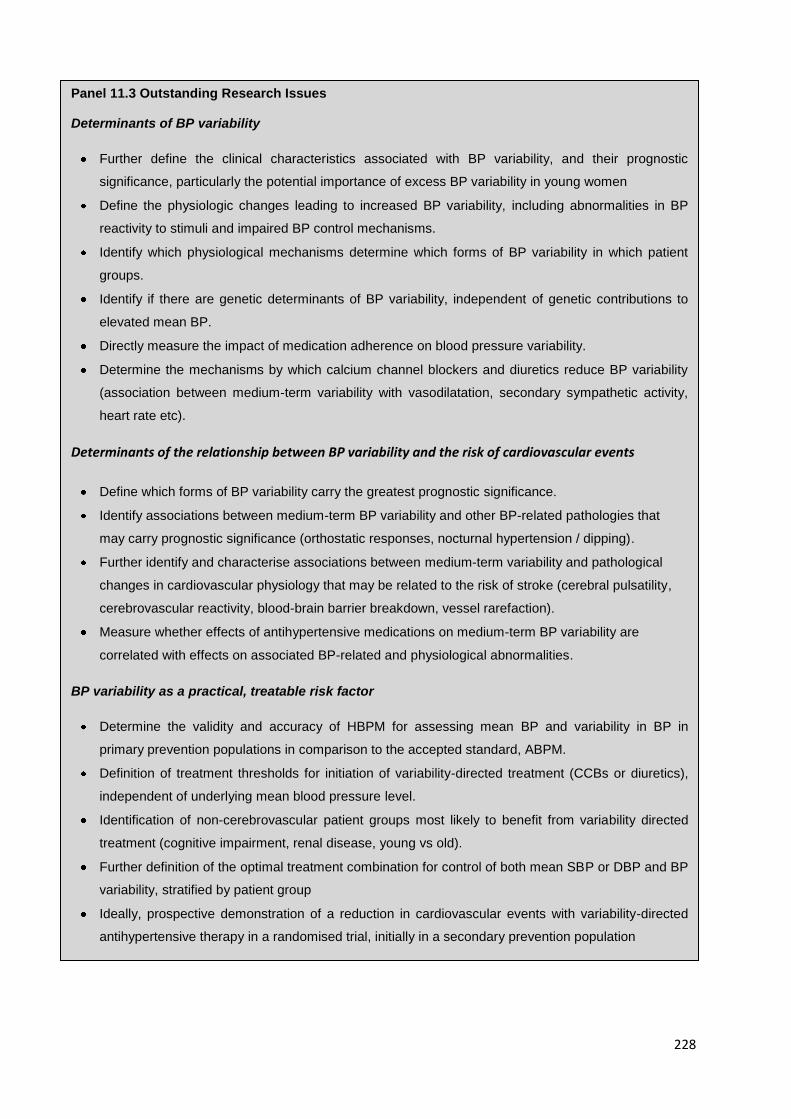
228
Panel 11.3 Outstanding Research Issues
Determinants of BP variability
Further define the clinical characteristics associated with BP variability, and their prognostic
significance, particularly the potential importance of excess BP variability in young women
Define the physiologic changes leading to increased BP variability, including abnormalities in BP
reactivity to stimuli and impaired BP control mechanisms.
Identify which physiological mechanisms determine which forms of BP variability in which patient
groups.
Identify if there are genetic determinants of BP variability, independent of genetic contributions to
elevated mean BP.
Directly measure the impact of medication adherence on blood pressure variability.
Determine the mechanisms by which calcium channel blockers and diuretics reduce BP variability
(association between medium-term variability with vasodilatation, secondary sympathetic activity,
heart rate etc).
Determinants of the relationship between BP variability and the risk of cardiovascular events
Define which forms of BP variability carry the greatest prognostic significance.
Identify associations between medium-term BP variability and other BP-related pathologies that
may carry prognostic significance (orthostatic responses, nocturnal hypertension / dipping).
Further identify and characterise associations between medium-term variability and pathological
changes in cardiovascular physiology that may be related to the risk of stroke (cerebral pulsatility,
cerebrovascular reactivity, blood-brain barrier breakdown, vessel rarefaction).
Measure whether effects of antihypertensive medications on medium-term BP variability are
correlated with effects on associated BP-related and physiological abnormalities.
BP variability as a practical, treatable risk factor
Determine the validity and accuracy of HBPM for assessing mean BP and variability in BP in
primary prevention populations in comparison to the accepted standard, ABPM.
Definition of treatment thresholds for initiation of variability-directed treatment (CCBs or diuretics),
independent of underlying mean blood pressure level.
Identification of non-cerebrovascular patient groups most likely to benefit from variability directed
treatment (cognitive impairment, renal disease, young vs old).
Further definition of the optimal treatment combination for control of both mean SBP or DBP and BP
variability, stratified by patient group
Ideally, prospective demonstration of a reduction in cardiovascular events with variability-directed
antihypertensive therapy in a randomised trial, initially in a secondary prevention population
229
regimens is the next step, followed by larger, multi-centre collaborative studies in primary
prevention populations.
As this dataset utilises data from RCTs, the included populations are selected and
trials often actively exclude patients with increased blood pressure variability. Therefore for a
reliable estimation of the risk relationship between BP variability and cardiovascular
outcomes, a collaboration of observational, population based studies of blood pressure
assessment in primary prevention would be the optimal dataset, ideally including HBPM and
ABPM. OXVASC represents one such study, but data from equivalent primary prevention
studies is not yet available, and will depend upon future collaboration with other groups.
Observational studies are also required to determine the relationship between BP variability
and other outcomes including cognitive dysfunction and renal impairment. Again,
associations with cognitive dysfunction are already being determined within OXVASC, and
within RCTs for which this information is available, but these findings will need confirmation
in independent populations, and particularly in patients presenting with mild cognitive
impairment and in primary prevention.
Prospective studies of physiological characteristics in patients undergoing HBPM and
ABPM will be required to further investigate the physiological determinants of BP variability;
to identify other physiological changes which are correlated with BP variability but not
directly related; and to measure how these relationships affect associations with
cardiovascular risk. The current OXVASC physiological cohort and the interventional study
described in 11.3.6 are starting to address these questions, but similar studies in primary
prevention populations would be beneficial. Ideally, these studies should test a wide range of
potential contributors to BP variability to determine the relative importance of different blood
pressure control mechanisms in different groups. However, this may need an unfeasibly
large study to assess the association between multiple physiological mechanisms, BP
variability and cardiovascular outcomes, particularly in younger patients with a low absolute
risk of cardiovascular events. Therefore, the results of the current OXVASC physiological
230
substudy will hopefully guide more focussed assessments to be performed in larger
populations. Finally, determination of the genetic contribution to blood pressure variability,
independent of mean SBP, could be assessed through genome wide association studies in
the first instance, although these have been relatively unsuccessful at identifying clinically
significant associations with mean BP.21
11.5 Conclusions
The findings of this thesis have confirmed the physiological and clinical significance
of BP variability from day-to-day and clinic visit-to-visit in primary prevention and secondary
prevention of cardiovascular events, particularly stroke. Furthermore, they have confirmed
the efficacy of calcium channel blockers and diuretics in reducing BP variability and the
associated risk of stroke. In addition, I have demonstrated that home BP monitoring is likely
to be the optimal method of assessing both mean BP and variability in BP, particularly in
elderly patients and patients with pre-existing cerebrovascular disease, and probably in all
patients. Similarly, I have provided evidence for the use of the MoCA in preference to the
MMSE for identification of vascular type dementia, and established that it is the optimal
method to determine associations between BP variability and the risk of hypertension
associated cognitive decline in OXVASC and other studies. Finally, I have identified clinical
and physiological associations of BP variability that are associated with increased BP
variability and may also explain its association with the risk of cardiovascular events.
These findings are reliable and demonstrate that BP variability is clinically significant.
BP variability should be an important part of cardiovascular risk assessment and should
affect treatment decisions in current clinical practice and in future guidance, particularly in
patients at an increased risk of cerebrovascular events. However, further research is
required to define thresholds at which BP variability directed treatment should be initiated,
the optimal treatment strategy and to identify the mechanisms responsible for BP variability
and its association with cardiovascular events. Many of these questions are being addressed
by ongoing research within the Stroke Prevention Research Unit.
231
11.6 References
1. Muntner P, Shimbo D, Tonelli M, Reynolds K, Arnett DK, Oparil S. The Relationship Between Visit-to-Visit Variability in Systolic Blood Pressure and All-Cause Mortality in the General Population: Findings From NHANES III, 1988 to 1994. Hypertension 2011. 2. Johansson JK, Niiranen TJ, Puukka PJ, Jula AM. Prognostic Value of the Variability in Home-Measured Blood Pressure and Heart Rate: The Finn-Home Study. Hypertension 2012. 3. Asayama K, Kikuya M, Schutte R, et al. Home blood pressure variability as cardiovascular risk factor in the population of Ohasama. Hypertension 2013;61:61-69. 4. Eguchi K, Hoshide S, Schwartz JE, Shimada K, Kario K. Visit-to-visit and ambulatory blood pressure variability as predictors of incident cardiovascular events in patients with hypertension. Am J Hypertens 2012;25:962-968. 5. Kikuya M, Ohkubo T, Metoki H, et al. Day-by-day variability of blood pressure and heart rate at home as a novel predictor of prognosis: the Ohasama study. Hypertension 2008;52:1045-1050. 6. Shimbo D, Newman JD, Aragaki AK, et al. Association between annual visit-to-visit blood pressure variability and stroke in postmenopausal women: data from the Women's Health Initiative. Hypertension 2012;60:625-630. 7. Kawai T, Ohishi M, Kamide K, et al. The impact of visit-to-visit variability in blood pressure on renal function. Hypertens Res 2012;35:239-243. 8. Liu W, Liu R, Sun W, et al. Different impacts of blood pressure variability on the progression of cerebral microbleeds and white matter lesions. Stroke 2012;43:2916-2922. 9. Law MR, Morris JK, Wald NJ. Use of blood pressure lowering drugs in the prevention of cardiovascular disease: meta-analysis of 147 randomised trials in the context of expectations from prospective epidemiological studies. Bmj 2009;338:b1665-b1665. 10. Psaty BM, Lumley T, Furberg CD, et al. Health Outcomes Associated With Various Antihypertensive Therapies Used as First-Line Agents: A Network Meta-analysis. JAMA: The Journal of the American Medical Association 2003;289:2534-2544. 11. Udani SM, Kovner JL. Effect of blood pressure lowering on markers of kidney disease progression. Curr Hypertens Rep 2009; 11: 368-74. 12. Wardlaw JM, Smith C, Dichgans M. Mechanisms of cerebral small vessel disease: insights from neuroimaging. Lancet Neurol. 2013; 12: 532 13. Charidimou A, Krishnan A, Werrring DJ, Jager HR. Cerebral microbleeds: a guide to detection and clinical relevance in different disease settings. Neuroradiology. 2013; 55: 655-674 14. Lovibond K, Jowett S, Barton P, et al. Cost-effectiveness of options for the diagnosis of high blood pressure in primary care: a modelling study. Lancet 2011;378:1219-1230. 15. Robitaille C, Dai S, Waters C, et al. Diagnosed hypertension in Canada: incidence, prevalence and associated mortality. CMAJ 2012;184:E49-56. 16. Kissela BM, Khoury JC, Alwell K, et al. Age at stroke: temporal trends in stroke incidence in a large, biracial population. Neurology 2012;79:1781-1787. 17. Rothwell PM, Coull AJ, Silver LE, et al. Population-based study of event-rate, incidence, case fatality, and mortality for all acute vascular events in all arterial territories (Oxford Vascular Study). Lancet 2005;366:1773-1783. 18. Sarnak MJ, Levey AS, Schoolwerth AC, et al. Kidney disease as a risk factor for development of cardiovascular disease: a statement from the American Heart Association Councils on Kidney in Cardiovascular Disease, High Blood Pressure Research, Clinical Cardiology, and Epidemiology and Prevention. Circulation 2003;108:2154-2169. 19. Dauphinot V, Barthelemy JC, Pichot V, et al. Autonomic activation during sleep and new-onset ambulatory hypertension in the elderly. Int J Cardiol 2012;155:155-159. 20. De Marchis GM, Katan M, Weck A, et al. Copeptin adds prognostic information after ischemic stroke: results from the CoRisk study. Neurology 2013;80:1278-1286. 21. Levy D, Ehret GB, Rice K, et al. Genome-wide association study of blood pressure and hypertension. Nat Genet 2009;41:677-687.
232
APPENDICES
1. Glossary of abbreviations 233
2. Characteristics of trials with available individual data 235
3. Medication use in trials with available individual data 242
4. References to trials included in meta-analysis of G-VR 244
5. Protocol for OXVASC physiological substudy 270
6. Protocol for randomised healthy volunteer drug study 278
7. Protocol for randomised patient drug study 290

233
APPENDIX ONE
Glossary of Abbreviations
ABPM Ambulatory blood pressure monitoring
ACEI Angiotensin converting enzyme inhibitor
AF Atrial fibrillation
ANOVA Analysis of Variance
ARB Angiotensin receptor blocker
ARWMC Age related white matter change scale
BB Beta-blocker
BHI Breath-holding index
BMI Body mass index
BOLD Blood oxygen level dependent (MRI)
BP Blood pressure
BPLTC Blood Pressure Lowering Triallists’ Collaboration
CBFV Cerebral blood flow velocity
CCB Calcium channel blocker
CCBND Non-dihydropyridine calcium channel blocker
CI Confidence interval
CV Coefficient of variation
DBP Diastolic blood pressure
FE Fixed effects (refers to meta-analysis)
GLM General linear model
G-VR Group variance ratio
HBPM Home blood pressure monitoring
HR Hazard ratio
IPD Individual patient data
IQR Inter-quartile range
I-VR Intra-individual variance ratio
Max Maximum
MCA Middle cerebral artery
MI Myocardial infarction
Min Minimum
MoCA Montreal Cognitive Assessment
MMSE Mini-Mental State Examination
MRI Magnetic resonance imaging
M-VR Mean SBP/DBP variance ratio
NICE National Institute of Clinical Excellence
234
NIHSS National Institute for Health Stroke Scale
NYHA New York Heart Association (scale)
OR Odds ratio
OXVASC Oxford Vascular Study
pHet p-value for heterogeneity
PI Pulsatility index (Gosling’s)
PP Pulse pressure
pVal p-value for primary comparison / association
PVD Peripheral vascular disease
PWV Pulse wave velocity
RAS (i) Renin angiotensin system inhibitor
rCV Residual coefficient of variation (usually about a moving average)
RCT Randomised controlled trial
RE Random effects (refers to meta-analysis)
ROC Receiver operator characeristic
SBP Systolic blood pressure
SD Standard deviation
TIA Transient ischaemic attack
TCD Transcranial Doppler ultrasound
TT Transit time
VR Variance ratio = SD2group1/SD2
group2
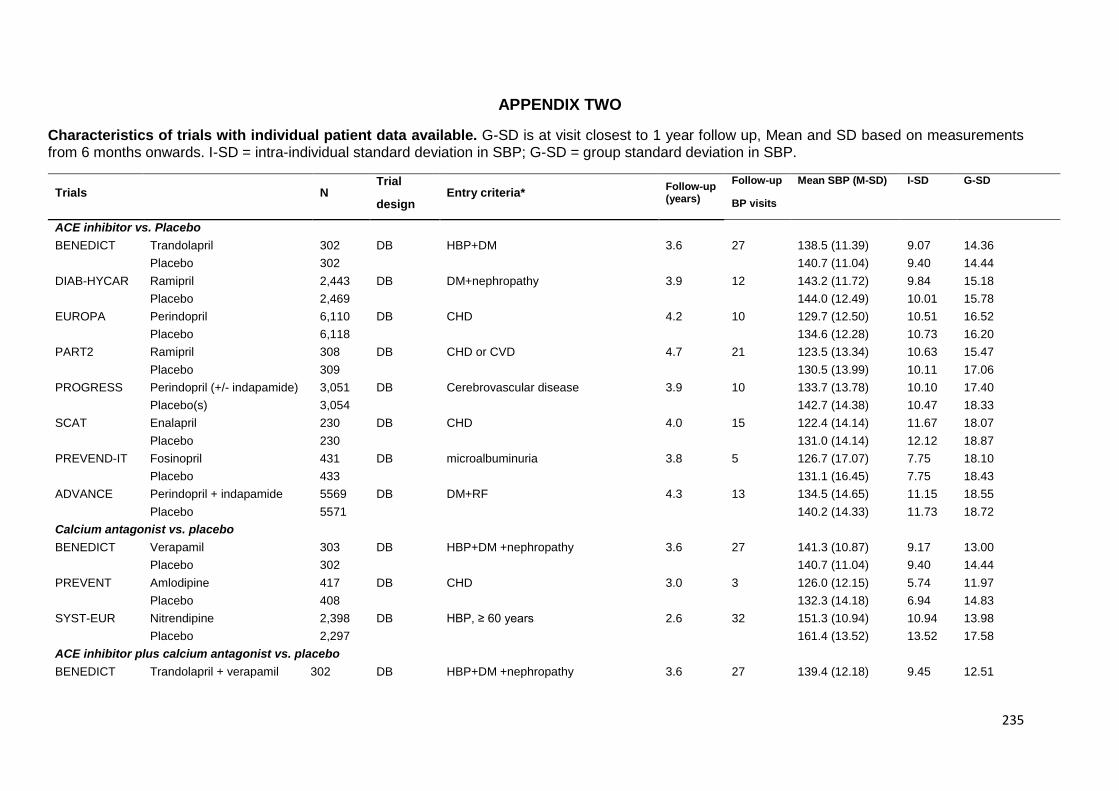
235
APPENDIX TWO
Characteristics of trials with individual patient data available. G-SD is at visit closest to 1 year follow up, Mean and SD based on measurements from 6 months onwards. I-SD = intra-individual standard deviation in SBP; G-SD = group standard deviation in SBP.
Trials N Trial
Entry criteria* Follow-up (years)
Follow-up Mean SBP (M-SD) I-SD G-SD
design BP visits
ACE inhibitor vs. Placebo
BENEDICT Trandolapril 302 DB HBP+DM 3.6 27 138.5 (11.39) 9.07 14.36
Placebo 302 140.7 (11.04) 9.40 14.44
DIAB-HYCAR Ramipril 2,443 DB DM+nephropathy 3.9 12 143.2 (11.72) 9.84 15.18
Placebo 2,469 144.0 (12.49) 10.01 15.78
EUROPA Perindopril 6,110 DB CHD 4.2 10 129.7 (12.50) 10.51 16.52
Placebo 6,118 134.6 (12.28) 10.73 16.20
PART2 Ramipril 308 DB CHD or CVD 4.7 21 123.5 (13.34) 10.63 15.47
Placebo 309 130.5 (13.99) 10.11 17.06
PROGRESS Perindopril (+/- indapamide) 3,051 DB Cerebrovascular disease 3.9 10 133.7 (13.78) 10.10 17.40
Placebo(s) 3,054 142.7 (14.38) 10.47 18.33
SCAT Enalapril 230 DB CHD 4.0 15 122.4 (14.14) 11.67 18.07
Placebo 230 131.0 (14.14) 12.12 18.87
PREVEND-IT Fosinopril 431 DB microalbuminuria 3.8 5 126.7 (17.07) 7.75 18.10
Placebo 433 131.1 (16.45) 7.75 18.43
ADVANCE Perindopril + indapamide 5569 DB DM+RF 4.3 13 134.5 (14.65) 11.15 18.55
Placebo 5571 140.2 (14.33) 11.73 18.72
Calcium antagonist vs. placebo
BENEDICT Verapamil 303 DB HBP+DM +nephropathy 3.6 27 141.3 (10.87) 9.17 13.00
Placebo 302 140.7 (11.04) 9.40 14.44
PREVENT Amlodipine 417 DB CHD 3.0 3 126.0 (12.15) 5.74 11.97
Placebo 408 132.3 (14.18) 6.94 14.83
SYST-EUR Nitrendipine 2,398 DB HBP, ≥ 60 years 2.6 32 151.3 (10.94) 10.94 13.98
Placebo 2,297 161.4 (13.52) 13.52 17.58
ACE inhibitor plus calcium antagonist vs. placebo
BENEDICT Trandolapril + verapamil 302 DB HBP+DM +nephropathy 3.6 27 139.4 (12.18) 9.45 12.51
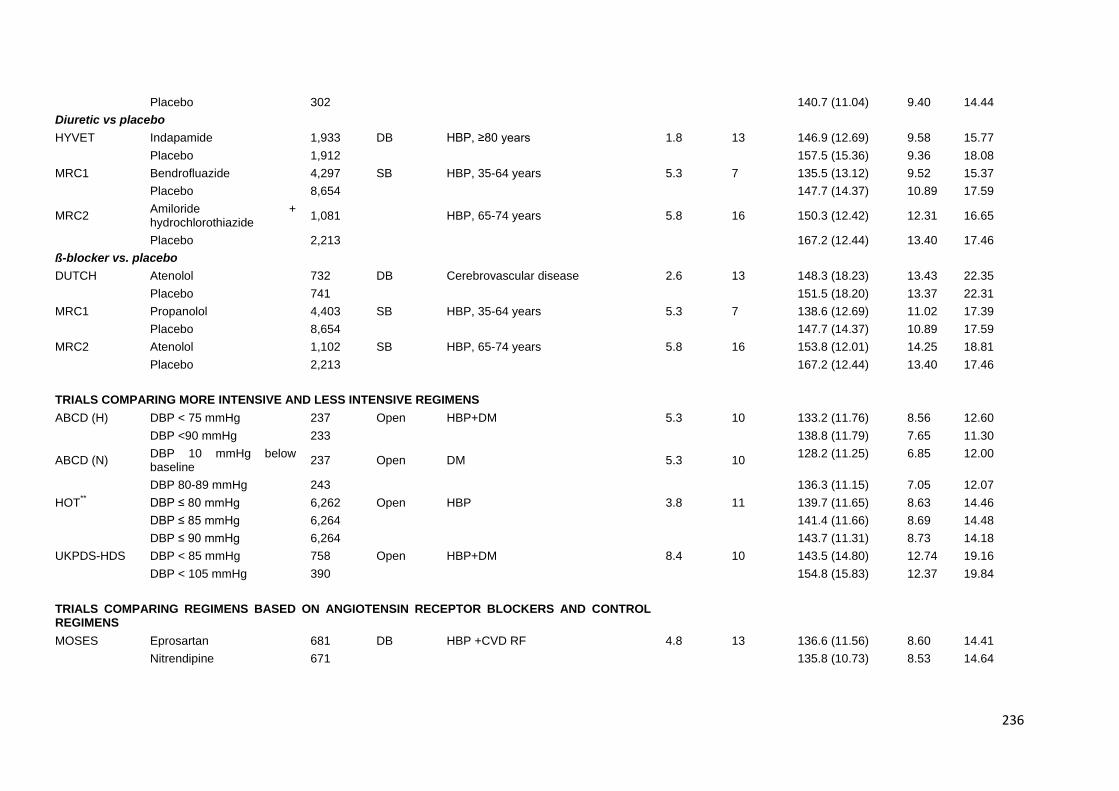
236
Placebo 302 140.7 (11.04) 9.40 14.44
Diuretic vs placebo
HYVET Indapamide 1,933 DB HBP, ≥80 years 1.8 13 146.9 (12.69) 9.58 15.77
Placebo 1,912 157.5 (15.36) 9.36 18.08
MRC1 Bendrofluazide 4,297 SB HBP, 35-64 years 5.3 7 135.5 (13.12) 9.52 15.37
Placebo 8,654 147.7 (14.37) 10.89 17.59
MRC2 Amiloride + hydrochlorothiazide
1,081 HBP, 65-74 years 5.8 16 150.3 (12.42) 12.31 16.65
Placebo 2,213 167.2 (12.44) 13.40 17.46
ß-blocker vs. placebo
DUTCH Atenolol 732 DB Cerebrovascular disease 2.6 13 148.3 (18.23) 13.43 22.35
Placebo 741 151.5 (18.20) 13.37 22.31
MRC1 Propanolol 4,403 SB HBP, 35-64 years 5.3 7 138.6 (12.69) 11.02 17.39
Placebo 8,654 147.7 (14.37) 10.89 17.59
MRC2 Atenolol 1,102 SB HBP, 65-74 years 5.8 16 153.8 (12.01) 14.25 18.81
Placebo 2,213 167.2 (12.44) 13.40 17.46
TRIALS COMPARING MORE INTENSIVE AND LESS INTENSIVE REGIMENS
ABCD (H) DBP < 75 mmHg 237 Open HBP+DM 5.3 10 133.2 (11.76) 8.56 12.60
DBP <90 mmHg 233 138.8 (11.79) 7.65 11.30
ABCD (N) DBP 10 mmHg below baseline
237 Open DM 5.3 10 128.2 (11.25) 6.85 12.00
DBP 80-89 mmHg 243 136.3 (11.15) 7.05 12.07
HOT** DBP ≤ 80 mmHg 6,262 Open HBP 3.8 11 139.7 (11.65) 8.63 14.46
DBP ≤ 85 mmHg 6,264 141.4 (11.66) 8.69 14.48
DBP ≤ 90 mmHg 6,264 143.7 (11.31) 8.73 14.18
UKPDS-HDS DBP < 85 mmHg 758 Open HBP+DM 8.4 10 143.5 (14.80) 12.74 19.16
DBP < 105 mmHg 390 154.8 (15.83) 12.37 19.84
TRIALS COMPARING REGIMENS BASED ON ANGIOTENSIN RECEPTOR BLOCKERS AND CONTROL REGIMENS
MOSES Eprosartan 681 DB HBP +CVD RF 4.8 13 136.6 (11.56) 8.60 14.41
Nitrendipine 671 135.8 (10.73) 8.53 14.64
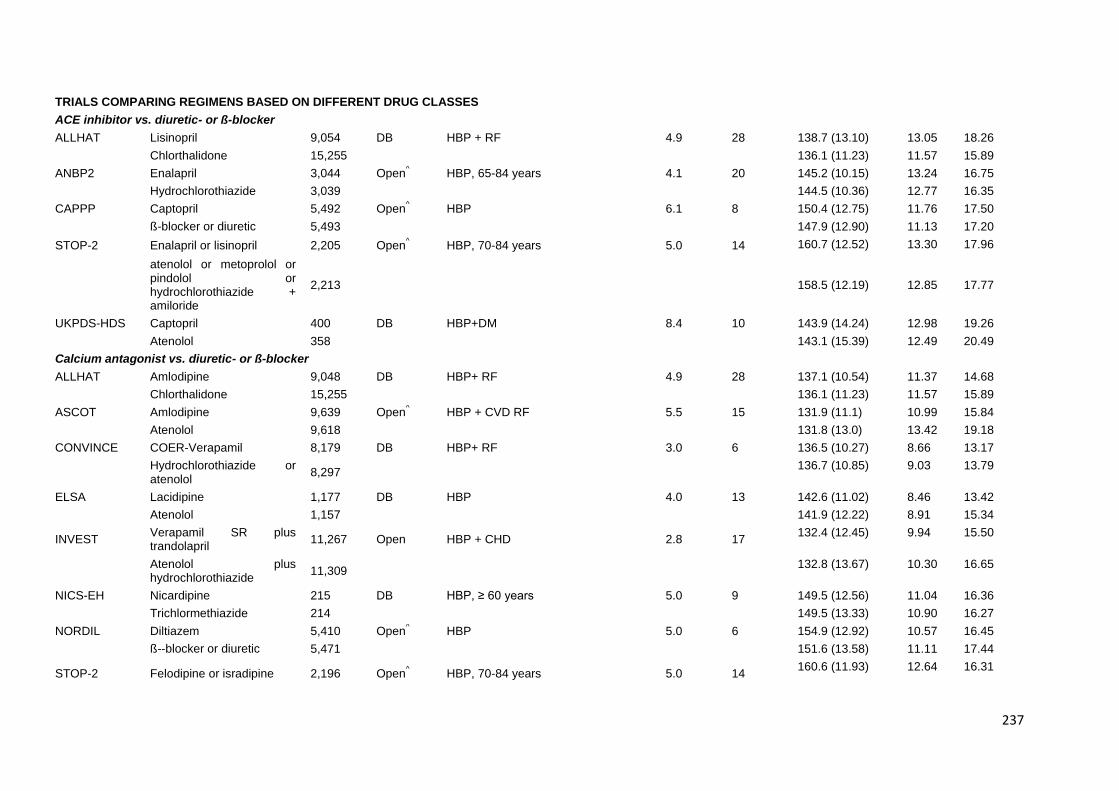
237
TRIALS COMPARING REGIMENS BASED ON DIFFERENT DRUG CLASSES
ACE inhibitor vs. diuretic- or ß-blocker
ALLHAT Lisinopril 9,054 DB HBP + RF 4.9 28 138.7 (13.10) 13.05 18.26
Chlorthalidone 15,255 136.1 (11.23) 11.57 15.89
ANBP2 Enalapril 3,044 Open^ HBP, 65-84 years 4.1 20 145.2 (10.15) 13.24 16.75
Hydrochlorothiazide 3,039 144.5 (10.36) 12.77 16.35
CAPPP Captopril 5,492 Open^ HBP 6.1 8 150.4 (12.75) 11.76 17.50
ß-blocker or diuretic 5,493 147.9 (12.90) 11.13 17.20
STOP-2 Enalapril or lisinopril 2,205 Open^ HBP, 70-84 years 5.0 14 160.7 (12.52) 13.30 17.96
atenolol or metoprolol or pindolol or hydrochlorothiazide + amiloride
2,213 158.5 (12.19) 12.85 17.77
UKPDS-HDS Captopril 400 DB HBP+DM 8.4 10 143.9 (14.24) 12.98 19.26
Atenolol 358 143.1 (15.39) 12.49 20.49
Calcium antagonist vs. diuretic- or ß-blocker
ALLHAT Amlodipine 9,048 DB HBP+ RF 4.9 28 137.1 (10.54) 11.37 14.68
Chlorthalidone 15,255 136.1 (11.23) 11.57 15.89
ASCOT Amlodipine 9,639 Open^ HBP + CVD RF 5.5 15 131.9 (11.1) 10.99 15.84
Atenolol 9,618 131.8 (13.0) 13.42 19.18
CONVINCE COER-Verapamil 8,179 DB HBP+ RF 3.0 6 136.5 (10.27) 8.66 13.17
Hydrochlorothiazide or atenolol
8,297 136.7 (10.85) 9.03 13.79
ELSA Lacidipine 1,177 DB HBP 4.0 13 142.6 (11.02) 8.46 13.42
Atenolol 1,157 141.9 (12.22) 8.91 15.34
INVEST Verapamil SR plus trandolapril
11,267 Open HBP + CHD 2.8 17 132.4 (12.45) 9.94 15.50
Atenolol plus hydrochlorothiazide
11,309 132.8 (13.67) 10.30 16.65
NICS-EH Nicardipine 215 DB HBP, ≥ 60 years 5.0 9 149.5 (12.56) 11.04 16.36
Trichlormethiazide 214 149.5 (13.33) 10.90 16.27
NORDIL Diltiazem 5,410 Open^ HBP 5.0 6 154.9 (12.92) 10.57 16.45
ß--blocker or diuretic 5,471 151.6 (13.58) 11.11 17.44
STOP-2 Felodipine or isradipine 2,196 Open^ HBP, 70-84 years 5.0 14
160.6 (11.93) 12.64 16.31
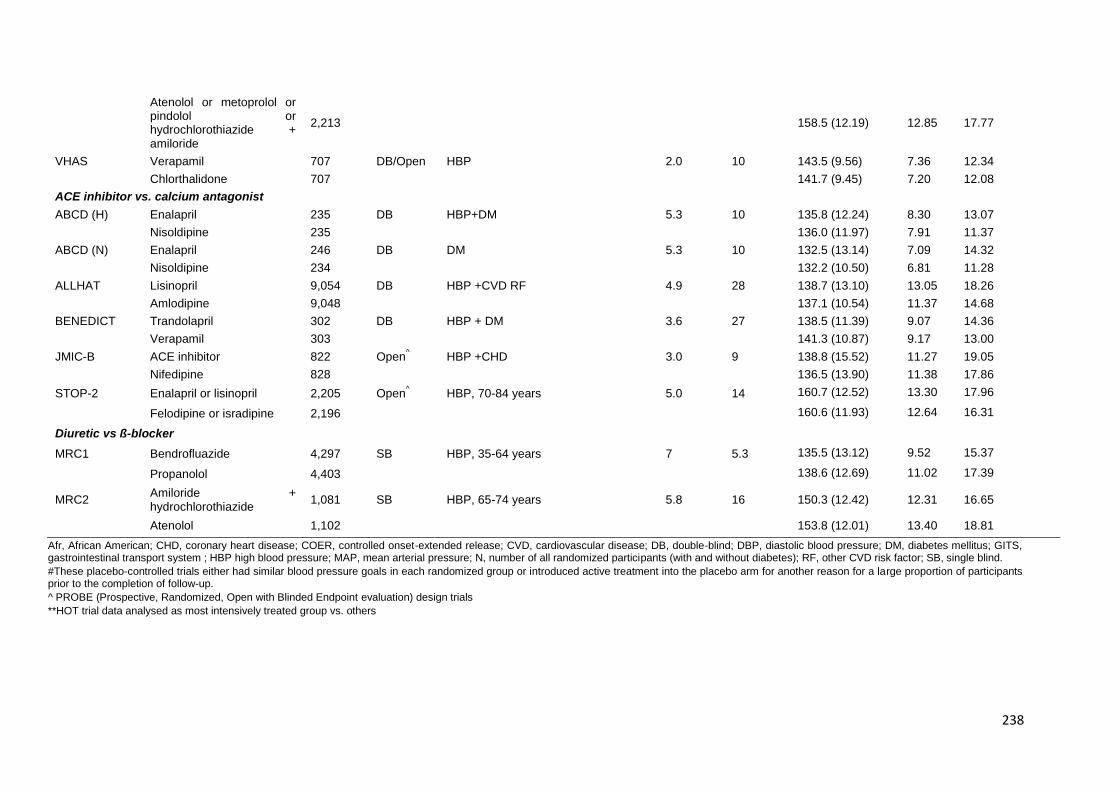
238
Atenolol or metoprolol or pindolol or hydrochlorothiazide + amiloride
2,213 158.5 (12.19) 12.85 17.77
VHAS Verapamil 707 DB/Open HBP 2.0 10 143.5 (9.56) 7.36 12.34
Chlorthalidone 707 141.7 (9.45) 7.20 12.08
ACE inhibitor vs. calcium antagonist
ABCD (H) Enalapril 235 DB HBP+DM 5.3 10 135.8 (12.24) 8.30 13.07
Nisoldipine 235 136.0 (11.97) 7.91 11.37
ABCD (N) Enalapril 246 DB DM 5.3 10 132.5 (13.14) 7.09 14.32
Nisoldipine 234 132.2 (10.50) 6.81 11.28
ALLHAT Lisinopril 9,054 DB HBP +CVD RF 4.9 28 138.7 (13.10) 13.05 18.26
Amlodipine 9,048 137.1 (10.54) 11.37 14.68
BENEDICT Trandolapril 302 DB HBP + DM 3.6 27 138.5 (11.39) 9.07 14.36
Verapamil 303 141.3 (10.87) 9.17 13.00
JMIC-B ACE inhibitor 822 Open^ HBP +CHD 3.0 9 138.8 (15.52) 11.27 19.05
Nifedipine 828 136.5 (13.90) 11.38 17.86
STOP-2 Enalapril or lisinopril 2,205 Open^ HBP, 70-84 years 5.0 14 160.7 (12.52) 13.30 17.96
Felodipine or isradipine 2,196 160.6 (11.93) 12.64 16.31
Diuretic vs ß-blocker
MRC1 Bendrofluazide 4,297 SB HBP, 35-64 years 7 5.3 135.5 (13.12) 9.52 15.37
Propanolol 4,403 138.6 (12.69) 11.02 17.39
MRC2 Amiloride + hydrochlorothiazide
1,081 SB HBP, 65-74 years 5.8 16 150.3 (12.42) 12.31 16.65
Atenolol 1,102 153.8 (12.01) 13.40 18.81
Afr, African American; CHD, coronary heart disease; COER, controlled onset-extended release; CVD, cardiovascular disease; DB, double-blind; DBP, diastolic blood pressure; DM, diabetes mellitus; GITS, gastrointestinal transport system ; HBP high blood pressure; MAP, mean arterial pressure; N, number of all randomized participants (with and without diabetes); RF, other CVD risk factor; SB, single blind.
#These placebo-controlled trials either had similar blood pressure goals in each randomized group or introduced active treatment into the placebo arm for another reason for a large proportion of participants prior to the completion of follow-up.
^ PROBE (Prospective, Randomized, Open with Blinded Endpoint evaluation) design trials
**HOT trial data analysed as most intensively treated group vs. others

239
Reference List
1. Wright JT, Agodoa LY, Contreras G, Greene T, Douglas JG, Lash J, Randall O, Rogers N, Smith MC, Massry S, for the African American Study of Kidney disease and hypertensive study group. Successful blood pressure control in the African American Study of Kidney disease and hypertension. Arch Inter Med.2002;162:1636-1643.
2. Estacio RO, Jeffers BW, Hiatt WR, Biggerstaff SL, Gifford N, Schrier RW. The effect of nisoldipine as compared with enalapril on cardiovascular outcomes in patients with non-insulin-dependent diabetes and hypertension. N Engl J Med.1998;338:645-52.
3. Bakris GL, Safafidis, PA, Weir MR, Dahlof B, Pitt B, Jamerson K, Valzquez EJ, Staikos-Byrne L, Kelly RY, Shi V, Chiang YT, Weber MA, for the ACCOMPLISH Trial investigators. Renal outcomes with different fixed-dose combination therapies in patients with hypertension at high risk for cardiovascular events (ACCOMPLISH): a prespecified secondary analysis of a randomised controlled trial. Lancet 2010: 375: 1173-1181.
4. Elliott HL, Meredith PA. Preferential benefits of nifedipine GITS in systolic hypertension and in combination with RAS blockade: further analysis of the ‘ACTION’ database in patients with angina. J Hum Hyper 2010: 1-8.
5. ADVANCE Collaborative Group. Effects of a fixed combination of perindopril and indapamide on macrovascular and microvascular outcomes in patients with type 2 diabetes mellitus (the ADVANCE trial): a randomised controlled trial. Lancet.2007;370:829-40.
6. The ALLHAT Officers and Coordinators for the ALLHAT Collaborative Research Group. Major cardiovascular events in hypertensive patients randomized to doxazosin vs chlorthalidone. The Antihypertensive and Lipid-Lowering treatment to prevent Heart Attack Trial (ALLHAT). JAMA.2000;283:1967-1975
7. The ALLHAT Officers and Coordinators for the ALLHAT Collaborative Research Group. Major outcome in high-risk hypertensive patients randomized to angiotensin-converting enzyme inhibitor or calcium channel blocker vs diuretic. The Antihypertensive and Lipid-Lowering treatment to prevent Heart Attack Trial (ALLHAT). JAMA.2002;288:2981-2997.
8. Wing LMH, Reid CM, Ryan PR, Beilin LJ, Brown MA, Jennings GLR, Johnston CI, McNeil JJ, MacDonald GJ, Marley JE, Morgan TO, West MJ, for the Second Australian National Blood Pressure Study Group. A comparison of outcomes with angiotensin-converting-enzyme inhibitors and diuretics for hypertension in the elderly. N Engl J Med.2003;348:583-92
9. Dahlöf B, Sever PS, Poulter NR, Wedel H, Beevers DG, Caulfield M, Collins R, Kjeldsen SE, Kirstinsson A, McInnes GT, Mehlsen J, Nieminen M, O’Brien E, Östergen J. Prevention of cardiovascular events with an antihypertensive regimen of amlodipine adding perindopril as required versus atenolol adding bendroflumethiazide as required, in the Anglo-Scandinavian Cardiac Outcomes Trial-Blood Pressure Lowering Arm (ASCOT-BPLA): a multicentre randomised controlled trial. Lancet.2005;366:895-906.
10. Ruggenenti P, Fassi A, Ilieva AP, Bruno S, Iliev IP, Brusegan V, Rubis N, Gherardi G, Arnoldi F, Ganeva M, Ene-Iordache B, Gaspari F, Perna A, Bossi A, Trevisan R, Dodesini AR, Remuzzi G, for the Bergamo Nephrologic Diabetes Complications Trial (BENEDICT) Investigators. Preventing microalbuminuria in type 2 diabetes. N Engl J Med.2004;351:1941-51.
11. Nissen SE, Tuzeu EM, Libby P, Thompson PD, Ghali M, Garza D, Berman L, Shi H, Buebendorf E, Topol EJ, for the Camelot investigators. Effect of antihypertensive agents on cardiovascular events in patients with coronary disease and normal blood pressure. JAMA.2004;292:2217-226.
12. Hansson L, Lindholm LH, Niskanen L, Lanke J, Hedner T, Nikalson A, Luomanmäki K, Dahlöf B, de Faire U, Mörlin C, Karlberg BE, Wester PO, Björck JE, for the Captopril Prevention Project (CAPPP) study group. Effect of angiotensin-converting-enzyme inhibition compared with conventional therapy on cardiovascular morbidity and mortality in hypertension: the Captopril Prevention Project (CAPPP) randomised trial. Lancet.1999;353:611-16.
13. Black HR, Elliott WJ, Grandits G, Grambsch G, Lucente, White WB, Neaton JD, Grimm RH, Hansson L, Lacourcière Y, Muller J, Sleight P, Weber MA, Williams G, Wittes J, Zanchetti A, Anders RJ, for the CONVINCE Research Group. Principal results of the Controlled Onset Verapamil Investigation of Cardiovascular End Points (CONVINCE) trial. JAMA.2003;289:2073-2082.
14. Marre M, Lièvre M, Chatellier G, Mann JF, Passa P, Ménard J, on behalf of the DIABHYCAR Study Investigators. Effects of low dose ramipril on cardiovascular and renal outcomes in patients with type 2 diabetes and raised excretion of urinary albumin: randomised, double blind, placebo controlled trial (the DIABHYCAR study). BMJ.2004;328:495-500.
15. Suzuki H, Kanno Y, for the Efficacy of Candesartan on Outcome in Saitama Trial (E-Cost) Group. Effects of candesartan on cardiovascular outcome in Japanese hypertensive patients. Hypertens res.2005;28:307-314.
16. Zanchetti A, Bond MG, Hennig M, Neiss A, Mancia G, Dal Palu C, Hansson L, Magnani B, Rahn KH, Reid JL, Rodicio J, Safar M, Eckes L, Rizzini P and on behalf of the ELSA investigators. Calcium antagonist lacidipine slows down progression of asymptomatic carotid atherosclerosis: principal results of the European Lacidipine Study on Atherosclerosis (ELSA), a randomized, double-blind, long-term trial. Circulation.2002;106:2422-2427.

240
17. The EURopean trial On Reduction of cardiac events with Perindopril in stable coronary Artery disease Investigators. Efficacy of perindopril in reduction of cardiovascular events among patients with stable coronary artery disease: randomised, double-blind, placebo-controlled, multi-centre trial (. Lancet.2003;362:782-88
18. Amery A, Brixko P, Clement D, De Schaepdryver A, Fagard R, Forte J, Henry JF, Leonetti G, O’Malley K, Strasser T, Birkenhäger W, Bulpitt C, Deruyttere M, Dollery C, Forette F, Hamdy R, Joossens JV, Lund-Johansen P, Petrie J, Tuomilheto J, Williams B. Mortality and morbidity results from the European Working Party on High blood pressure in the Elderly trial. Lancet.1985;15:1349-1354.
19. Liu L, Zhang Y, Liu G, Li W, Zhang X and Zanchetti A, for the FEVER Study Group. The Felodipine Event Reduction (FEVER) Study: a randomized long-term placebo-controlled trial in Chinese hypertensive patients. J Hypertens.2005;23:2157-2172.
20. Zannad F, Kessler M, Lehert P, Gruenfeld JP, Thuilliez C, Leizorovicz A, Lechat P, for the FOSIDAL investigators. Prevention of cardiovascular events in end-stage renal disease: results of a randomized trial of fosinopril and implications for future studies. Kidney International.2006;70:1318-1324
21. Wilhelmsen L, Berglund G, Elmfeldt D, Fitzsimons T, Holzgreve H, Hosie J, Hörnkvist PE, Pennert K, Tuomilheto J and Wedel H, on behalf of the Heart Attack Primary Prevention in Hypertension Trial Research Group. Beta-blocker versus diuretics in hypertensive men: main results from the HAPPHY trial. J of Hypertension.1985;3:379-392
22. Lonn E, Shaikholeslami R, Yi Qilong, Bosch J, Sullivan B, Tanser P, Magi A, Yusuf S. Effects of ramipril on left ventricular mass and function in cardiovascular patients with controlled blood pressure and with preserved left ventricular jection fraction. A substudy of the Heart Outcomes Prevention Evaluation (HOPE) trial. J Am Coll Card 2004: 43(12):2200-2206.
23. Hansson L, Zanchetti A, Carruthers G, Dahloef B, Elmfeldt D, Julius S, Ménard J, Rahn KH, Wedel H, Westerling S, for the HOT study group. Effects of intensive blood-pressure lowering and low-dose aspirin in patients with hypertension: principal results of the Hypertension Optimal Treatment (HOT) randomised trial. BMJ.1981;283:1151-3.
24. Beckett NS, Peters R, Fletcher AE, Staessen JA, Liu L, Dumitrascu D, Stoyanovsky V, Antikainen RL, Nikitin Y, Anderson C, Belhani A, Forette F, Rajkumar C, Thijs L, Banya W, Bulpitt CJ, for the HYVET study Group. Treatment of hypertension in patients 80 years of age or older. N Engl J Med. 2008;358:1887-1898.
25. Berl T, Hunsicker LG, Lewis JB, Pfeffer MA, Porush JG, Rouleau JL, Drury PL, Esmatjes E, Hricik D, Pohl M, Raz I, Vanhille P, Wiegmann TB, Wolfe BM, Locatelli F, Goldhaber SZ, Lewis EJ, for the Collaborative Study Group. Impact of achieved blood pressure on cardiovascular outcomes in the irbesartan diabetic nephropathy trial. J Am Soc Nephrol 2005: 16: 2170-2179.
26. Mancia G, Brown M, Castaigne, A, de Leeuq P, Palmer CR, Rosenthal T, Wagener G, Ruilope LM. Outcomes with nifedipine GITS or co-amilozide in hypertensive diabetics and nondiabetics in intervention as a goal in hypertension (INSIGHT). Hypertension 2003; 41: 431-436.
27. Lichtlen PR, Hugenholtz PG, Rafflenbeul W, Hecker H, Jost S, Deckers JW, on behalf of the INTACT group investigators. Retardation of angiographic progression of coronary artery disease by nifedipine. Results of the International Nifedipine Trial on Antiatherosclerotic Therapy (INTACT). Lancet.1990;335:1109-13
28. Pepine CJ, Handberg EM, Cooper-DeHoff RM, Marks RG, Kowey P, Messerli FH, Mancia G, Cangiano JL, Garcia-Barreto D, Keltai M, Erdine S, Bristol HA, Kolb HR, Bakris GL, Cohen JD, Parmley WW, for the Invest investigators. A calcium antagonist vs a non-calcium antagonist hypertension treatment strategy for patients with coronary artery disease. The International Verapamil-Trandolapril Study (INVEST): a randomized controlled trial. JAMA.2003:290:2805-2816.
29. The IPPPSH Collaborative Group. Cardiovascular risk and risk factors in a randomized trial of treatment based on the beta-blocker oxprenolol: The International Prospective Primary Prevention Study in Hypertension (IPPPSH). J of Hypertension.1985;3:379-392.
30. Yui Y, Sumiyoshi T, Kodama K, Hirayama A, Nonogi H, Kanmatsuse K, Origasa H, Iimura O, Ishii M, Saruta T, Arakawa K, Hosoda S, Kawai C, for the Japan Multicenter Investigation for Cardiovascular Diseases-B (JMIC-B). Comparison of nifedipine retard with angiotensin converting enzyme inhibitors in Japanese hypertensive patients with coronary artery disease: the Japan Multicentre Investigation for Cardiovascular diseases-B (JMIC-B). Hypertens Res.2004;27:181-191.
31. Kondo J, Sone T, Tsuboi H, Mukawa H, Morishima I, Uesugi M, Kono T, Kosaka T, Yoshida T, Numaguchi Y, Matsui H, Murohara T, Okumura K. Effects of low-dose angiotensin II receptor blocker candesartan on cardiovascular events in patients with coronary artery disease. Am Heart J.2003;146:e20
32. Dahlöf B, Devereux RB, Kjeldsen SE, Julius S, Beevers G, de Faire U, Fyhrquist F, Ibsen H, Kristiansson K, Lederballe-Pedersen O, Lindholm LH, Nieminen MS, Omvik P, Oparil S, Wedel H, for the LIFE study group. Cardiovascular morbidity and mortality in the Losartan Intervention For Endpoint reduction in hypertension study (LIFE): a randomised controlled trial against atenolol. JAMA.2002;288:1491-1498
33. Schrader J, Lüders S, Kulschewski A, Hammersen F, Plate K, Bergen J, Zidek W, Dominiak P, Diener HC, for the MOSES study group. Morbidity and mortality after stroke, eposartan compared with nitrendipine for secondary prevention. Principal results of a prospective randomized controlled trial (MOSES). Stroke.2005;36:1218-1226
34. MRC Working Party. Medical Research Council trial of treatment of hypertension in older adults: principal results. BMJ.1992;304:405-12.

241
35. National Intervention Cooperative Study in Elderly Hypertensives Study Group. Randomized double-blind comparison of a calcium antagonist and a diuretic in elderly hypertensives. Hypertension.1999;34:1129-1133..
36. Hansson L, Hedner T, Lund-Johansen P, Kjeldsen SE, Lindholm LH, Syvertsen JO, Lanke J, de Faire U, Dahlöf B, Karlberg BE, for the NORDIL study group. Randomised trial of effects of calcium antagonists compared with diuretics and β-blockers on cardiovascular morbidity and mortality in hypertension: the Nordic Diltiazem (NORDIL) study. Lancet.2000;356:359-65
37. MacMahon S, Sharpe N, Gamble G, Clague A, Mhurchu CN, Clark T, Hart H, Scott J, White H, for the PART-2 collaborative research group. Randomized, placebo-controlled trial of the angiotensin-converting-enzyme inhibitor, ramipril, in patients with coronary or other occlusive arterial disease. J Am Coll Cardiol.2000;36:438-443
38. PATS Collaborating Group. Post-stroke antihypertensive treatment study. A preliminary result. Chin Med J.1995;108:710-717 39. Asselbergs FW, Diercks GFH, Hillege HL, van Boven AJ, Janssen WMT, Voors AA, de Zeeuw D, de Jong PE, van Veldhuisen DJ, van Gilst WH, for the Prevention of
Renal and Vascular Endstage Disease Intervention Trial (PREVEND IT) investigators. Effects of fosinopril and pravastatin on cardiovascular events in subjects with microalbuminuria. Circulation.2004;110:2809-2816
40. Pitt B, Byington RP, Furberg CD, Hunnunghake DB, Mancini J, Miller ME, Riley W. Effect of amlodipine on the progression of atherosclerosis and the occurrence of clinical Events. PREVENT Circulation.2000;102:1503-1510
41. Bath PMW, Martin RH, Palesch Y, Cotton D, Yusuf S, Sacco R, Diener HC, Tomi D, Estol C, Roberts R, for the PROFESS study group. Stroke 2009: 40; 3541-3546.
42. PROGRESS Collaborative Group. Randomised trial of a perindopril-based blood-pressure-lowering regimen among 6105 individuals with previous stroke or transient ischaemic attack. Lancet.2001;358:1033-1041
43. Teo KK, Burton JR, Buller CE, Plante S, Catellier D, Dzavik V, Taylor D, Yokoyama S, Montague TJ. Long-term effects of cholesterol lowering and angiotensin-converting-enzyme inhibition on coronary artery atherosclerosis. The Simvastatin/Enalapril Coronary Atherosclerosis Trial (SCAT). Circulation.2000;102:1748-1754
44. Lithell H, Hansson L, Skoog I, Elmfeldt D, Hofman A, Olafsson B, Trenkwalder P, Zanchetti A, for the SCOPE study group. The Study on Cognition and Prognosis in the Elderly (SCOPE): principal results of a randomized double-blind intervention trial. J Hypertension.2003;21:875-886
45. SHEP Cooperative Research Group. Prevention of Stroke by antihypertensive drug treatment in older persons with isolated systolic hypertension. Final results of the Systolic Hypertension in the Elderly Program (SHEP). JAMA.1991;265:3255-3264
46. Lonn EM, Gerstein HC, Sheridan P, Smith S, Diaz R, Mohan V, Bosch J, Yusuf S, Dagenais GR, for the DREAM investigators. Effect of ramipril and or rosiglitazone on carotid intima-media thickness in people with impaired glucose tolerance or impaired fasting glucose. STARR (Study of Atherosclerosis with Ramipril and Rosiglitazone). J Am Coll Card 2009; 53(22): 2028-2035.
47. Dahlöf B, Lindholm LH, Hansson L, Schersten B, Ekbom T, Wester PO. Morbidity and mortality in the Swedish Trial in Old Patients with hypertension (STOP-Hypertension). Lancet.1991;338:1281-85
48. Hansson L, Lindholm LH, Ekbom T, Dahlöf B, Lanke J, Scherstén B, Wester PO, Hedner T, de Faire U, for the STOP-Hypertension-2 study group. Randomised trial of old and new antihypertensive drugs in elderly patients: cardiovascular mortality and morbidity the Swedish Trial in Old Patients with Hypertension-2 study. Lancet.1999;354:1751-56
49. Staessen JA, Fagard R, Thijs L, Celis H, Arabidze GG, Birkenhäger WH, Bulpitt CJ, de Leeuw PW, Dollery CT, Fletcher AE, Forette F, Leonetti G, Nachev C, O’Brien ET, Rosenfeld J, Rodicio JL, Tuomilheto J, Zanchetti A, for the Systolic Hypertension in Europe (Syst-Eur) trial investigators. Randomised double-blind comparison of placebo and active treatment for older patients with isolated systolic hypertension. Syst-Eur Lancet.1997;350:757-64
50. UK Prospective Diabetes Study Group. Tight blood pressure control and risk of macrovascular and microvascular complications in type 2 diabetes: UKPDS38. BMJ.1998;317:703-13.
51. UK Prospective Diabetes Study. Efficacy of atenolol and captopril in reducing risk of macrovascular and microvascular complications in type 2 diabetes: UKPDS 39. BMJ.1998;317:713-20
52. McFate Smith W. Treatment of mild hypertension. Results of a ten-year intervention trial. Cir Res. 1977;40:I98-I105 53. Julius S, Kjeldsen SE, Weber M, Brunner HR, Ekman S, Hansson L, Hua T, Laragh J, McInnes GT, Mitchell L, Plat F, Schork A, Smith B, Zanchetti A, for the VALUE trial
group. Outcomes in hypertensive patients at high cardiovascular risk treated with regimens based on valsartan or amlodipine: the VALUE randomised trial. Lancet.2004;363:2022-2031
54. Rosei EA, Dal Palu C, Leonetti G, Magnani B, Pessina A, Zanchetti A on behalf of the VHAS Investigators. Clinical results of the Verapamil in Hypertension and Atherosclerosis Study. Journal of Hypertension.1997;15:1337-1344
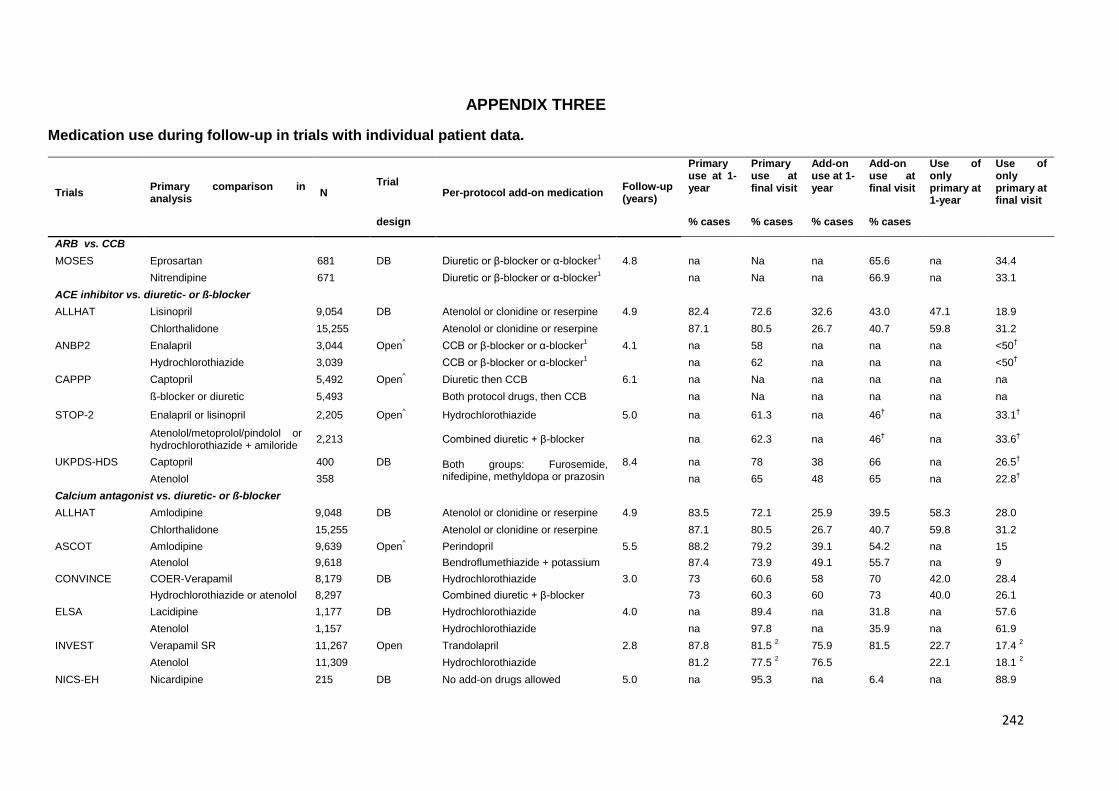
242
APPENDIX THREE
Medication use during follow-up in trials with individual patient data.
Trials Primary comparison in analysis
N Trial
Per-protocol add-on medication Follow-up (years)
Primary use at 1-year
Primary use at final visit
Add-on use at 1-year
Add-on use at final visit
Use of only primary at 1-year
Use of only primary at final visit
design % cases % cases % cases % cases
ARB vs. CCB
MOSES Eprosartan 681 DB Diuretic or β-blocker or α-blocker1 4.8 na Na na 65.6 na 34.4
Nitrendipine 671 Diuretic or β-blocker or α-blocker1 na Na na 66.9 na 33.1
ACE inhibitor vs. diuretic- or ß-blocker
ALLHAT Lisinopril 9,054 DB Atenolol or clonidine or reserpine 4.9 82.4 72.6 32.6 43.0 47.1 18.9
Chlorthalidone 15,255 Atenolol or clonidine or reserpine 87.1 80.5 26.7 40.7 59.8 31.2
ANBP2 Enalapril 3,044 Open^ CCB or β-blocker or α-blocker
1 4.1 na 58 na na na <50
†
Hydrochlorothiazide 3,039 CCB or β-blocker or α-blocker1 na 62 na na na <50
†
CAPPP Captopril 5,492 Open^ Diuretic then CCB 6.1 na Na na na na na
ß-blocker or diuretic 5,493 Both protocol drugs, then CCB na Na na na na na
STOP-2 Enalapril or lisinopril 2,205 Open^ Hydrochlorothiazide 5.0 na 61.3 na 46
† na 33.1
†
Atenolol/metoprolol/pindolol or hydrochlorothiazide + amiloride
2,213 Combined diuretic + β-blocker na 62.3 na 46†
na 33.6†
UKPDS-HDS Captopril 400 DB Both groups: Furosemide, nifedipine, methyldopa or prazosin
8.4 na 78 38 66 na 26.5†
Atenolol 358 na 65 48 65 na 22.8†
Calcium antagonist vs. diuretic- or ß-blocker
ALLHAT Amlodipine 9,048 DB Atenolol or clonidine or reserpine 4.9 83.5 72.1 25.9 39.5 58.3 28.0
Chlorthalidone 15,255 Atenolol or clonidine or reserpine 87.1 80.5 26.7 40.7 59.8 31.2
ASCOT Amlodipine 9,639 Open^ Perindopril 5.5 88.2 79.2 39.1 54.2 na 15
Atenolol 9,618 Bendroflumethiazide + potassium 87.4 73.9 49.1 55.7 na 9
CONVINCE COER-Verapamil 8,179 DB Hydrochlorothiazide 3.0 73 60.6 58 70 42.0 28.4
Hydrochlorothiazide or atenolol 8,297 Combined diuretic + β-blocker 73 60.3 60 73 40.0 26.1
ELSA Lacidipine 1,177 DB Hydrochlorothiazide 4.0 na 89.4 na 31.8 na 57.6
Atenolol 1,157 Hydrochlorothiazide na 97.8 na 35.9 na 61.9
INVEST Verapamil SR 11,267 Open Trandolapril 2.8 87.8 81.5 2 75.9 81.5 22.7 17.4
2
Atenolol 11,309 Hydrochlorothiazide 81.2 77.5 2 76.5 22.1 18.1
2
NICS-EH Nicardipine 215 DB No add-on drugs allowed 5.0 na 95.3 na 6.4 na 88.9

243
Trichlormethiazide 214 No add-on drugs allowed na 95.9 na 5.7 na 89.2
NORDIL Diltiazem 5,410 Open^ ACEI then diuretic or α-blocker 5.0 na 77 na 44 na 50
ß--blocker or diuretic 5,471 Both drugs then ACEI or α-blocker na 93 na 47 na 49
STOP-2 Felodipine or isradipine 2,196 Open^ β-blocker 5.0 na 66.2 na 46
† na 35.7
†
Atenolol/metoprolol/pindolol or hydrochlorothiazide + amiloride
2,213 Combined diuretic + β-blocker na 62.3 na 46†
na 33.6†
VHAS Verapamil 707 DB/Open Captopril 2.0 na 66.7 na 34.2 na 44.1
Chlorthalidone 707 Captopril na 65.0 na 38.4 na 38.8
ACE inhibitor vs. calcium antagonist
ABCD (H) Enalapril 235 DB Metoprolol or hydrochlorothiazide1
5.3 na 35.6 na >50% na na
Nisoldipine 235 Metoprolol or hydrochlorothiazide1 na 42.7 na >50% na na
ABCD (N) Enalapril 246 DB Metoprolol or hydrochlorothiazide1
5.3 na Na na na na na
Nisoldipine 234 Metoprolol or hydrochlorothiazide1 na Na na na na na
ALLHAT Lisinopril 9,054 DB Atenolol or clonidine or reserpine 4.9 82.4 72.6 32.6 43.0 47.1 18.9
Amlodipine 9,048 Atenolol or clonidine or reserpine 4.9 83.5 72.1 25.9 39.5 58.3 28.0
BENEDICT Trandolapril 302 DB Both groups: diuretics then α- or β- blockers, then minoxidil or CCBs
3.6 na Na na 64.1 na na
Verapamil 303 na Na na 62 na na
JMIC-B ACE inhibitor 822 Open^ α-blocker or β-blocker 3.0 na 76 na 34.1
† na 41.9
†
Nifedipine 828 α-blocker or β-blocker na 81 na 31.1† na 49.9
†
STOP-2 Enalapril or lisinopril 2,205 Open^ Hydrochlorothiazide 5.0 na 61.3 na 46
† na 33.1
†
Felodipine or isradipine 2,196 Open^ β-blocker 5.0 na 66.2 na 46
† na 35.7
†
Diuretic vs ß-blocker
MRC1 Bendrofluazide 4,297 SB Methyldopa 7 81† 62 18 29 63
† 33
Propanolol 4,403 Methyldopa or guanethidine 84† 59 10 22 74
† 37
MRC2 Amiloride + hydrochlorothiazide
1,081 SB Atenolol then nifedipine 5.8 na 52 na 38 na <50%†
Atenolol 1,102 Amiloride + hydrochlorothiazide then nifedipine
na 37 na 52 na <37%†
1 Recommended, but open to physician discretion
2 Results at 2-year follow-up visit.
3 Estimated from published report
na= not available; CCBs = dihydropyridine CCBs; ACEI = angiotensin converting enzyme inhibitors
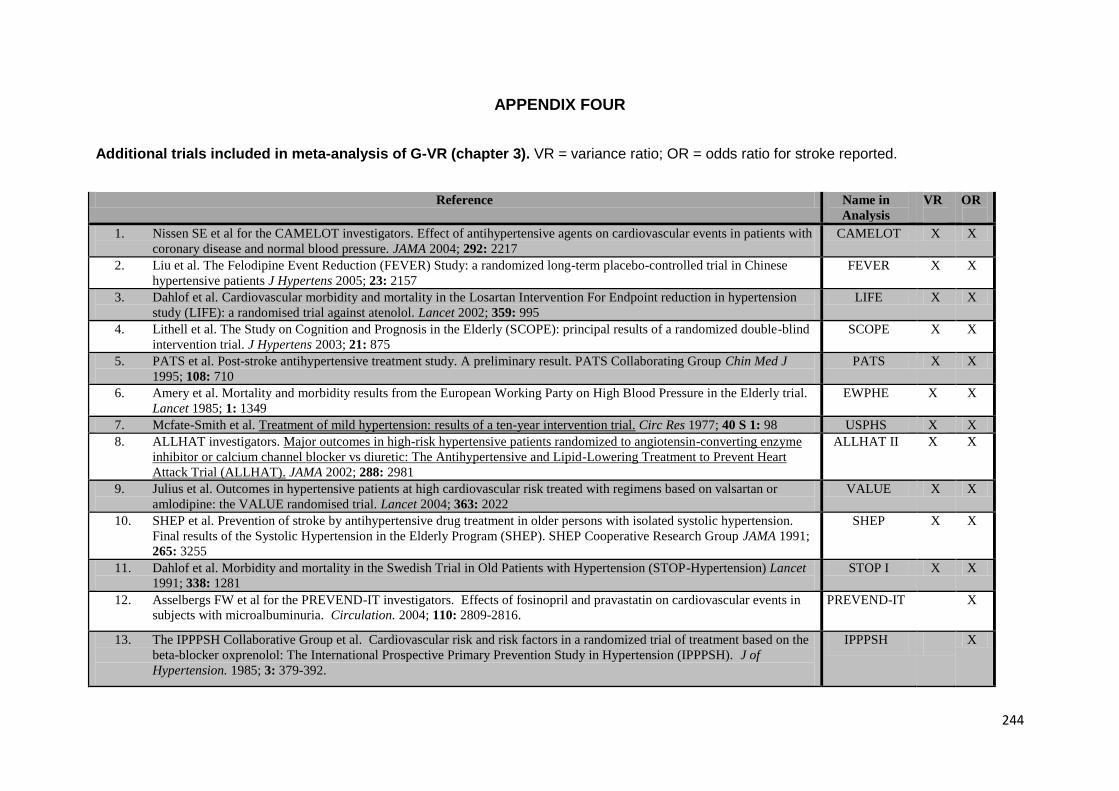
244
APPENDIX FOUR
Additional trials included in meta-analysis of G-VR (chapter 3). VR = variance ratio; OR = odds ratio for stroke reported.
Reference Name in
Analysis
VR
OR
1. Nissen SE et al for the CAMELOT investigators. Effect of antihypertensive agents on cardiovascular events in patients with
coronary disease and normal blood pressure. JAMA 2004; 292: 2217
CAMELOT X X
2. Liu et al. The Felodipine Event Reduction (FEVER) Study: a randomized long-term placebo-controlled trial in Chinese
hypertensive patients J Hypertens 2005; 23: 2157
FEVER X X
3. Dahlof et al. Cardiovascular morbidity and mortality in the Losartan Intervention For Endpoint reduction in hypertension
study (LIFE): a randomised trial against atenolol. Lancet 2002; 359: 995
LIFE X X
4. Lithell et al. The Study on Cognition and Prognosis in the Elderly (SCOPE): principal results of a randomized double-blind
intervention trial. J Hypertens 2003; 21: 875
SCOPE X X
5. PATS et al. Post-stroke antihypertensive treatment study. A preliminary result. PATS Collaborating Group Chin Med J
1995; 108: 710
PATS X X
6. Amery et al. Mortality and morbidity results from the European Working Party on High Blood Pressure in the Elderly trial.
Lancet 1985; 1: 1349
EWPHE X X
7. Mcfate-Smith et al. Treatment of mild hypertension: results of a ten-year intervention trial. Circ Res 1977; 40 S 1: 98 USPHS X X
8. ALLHAT investigators. Major outcomes in high-risk hypertensive patients randomized to angiotensin-converting enzyme
inhibitor or calcium channel blocker vs diuretic: The Antihypertensive and Lipid-Lowering Treatment to Prevent Heart
Attack Trial (ALLHAT). JAMA 2002; 288: 2981
ALLHAT II X X
9. Julius et al. Outcomes in hypertensive patients at high cardiovascular risk treated with regimens based on valsartan or
amlodipine: the VALUE randomised trial. Lancet 2004; 363: 2022
VALUE X X
10. SHEP et al. Prevention of stroke by antihypertensive drug treatment in older persons with isolated systolic hypertension.
Final results of the Systolic Hypertension in the Elderly Program (SHEP). SHEP Cooperative Research Group JAMA 1991;
265: 3255
SHEP X X
11. Dahlof et al. Morbidity and mortality in the Swedish Trial in Old Patients with Hypertension (STOP-Hypertension) Lancet
1991; 338: 1281
STOP I X X
12. Asselbergs FW et al for the PREVEND-IT investigators. Effects of fosinopril and pravastatin on cardiovascular events in
subjects with microalbuminuria. Circulation. 2004; 110: 2809-2816.
PREVEND-IT X
13. The IPPPSH Collaborative Group et al. Cardiovascular risk and risk factors in a randomized trial of treatment based on the
beta-blocker oxprenolol: The International Prospective Primary Prevention Study in Hypertension (IPPPSH). J of
Hypertension. 1985; 3: 379-392.
IPPPSH X
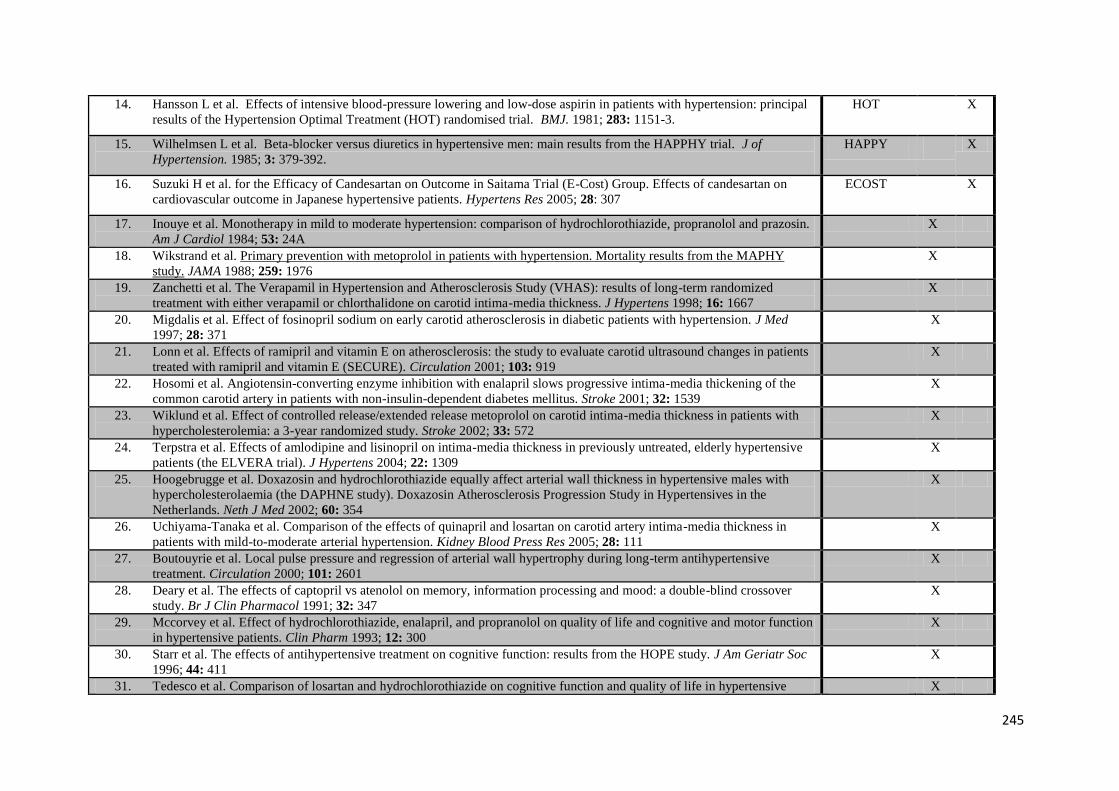
245
14. Hansson L et al. Effects of intensive blood-pressure lowering and low-dose aspirin in patients with hypertension: principal
results of the Hypertension Optimal Treatment (HOT) randomised trial. BMJ. 1981; 283: 1151-3.
HOT X
15. Wilhelmsen L et al. Beta-blocker versus diuretics in hypertensive men: main results from the HAPPHY trial. J of
Hypertension. 1985; 3: 379-392.
HAPPY X
16. Suzuki H et al. for the Efficacy of Candesartan on Outcome in Saitama Trial (E-Cost) Group. Effects of candesartan on
cardiovascular outcome in Japanese hypertensive patients. Hypertens Res 2005; 28: 307
ECOST X
17. Inouye et al. Monotherapy in mild to moderate hypertension: comparison of hydrochlorothiazide, propranolol and prazosin.
Am J Cardiol 1984; 53: 24A
X
18. Wikstrand et al. Primary prevention with metoprolol in patients with hypertension. Mortality results from the MAPHY
study. JAMA 1988; 259: 1976
X
19. Zanchetti et al. The Verapamil in Hypertension and Atherosclerosis Study (VHAS): results of long-term randomized
treatment with either verapamil or chlorthalidone on carotid intima-media thickness. J Hypertens 1998; 16: 1667
X
20. Migdalis et al. Effect of fosinopril sodium on early carotid atherosclerosis in diabetic patients with hypertension. J Med
1997; 28: 371
X
21. Lonn et al. Effects of ramipril and vitamin E on atherosclerosis: the study to evaluate carotid ultrasound changes in patients
treated with ramipril and vitamin E (SECURE). Circulation 2001; 103: 919
X
22. Hosomi et al. Angiotensin-converting enzyme inhibition with enalapril slows progressive intima-media thickening of the
common carotid artery in patients with non-insulin-dependent diabetes mellitus. Stroke 2001; 32: 1539
X
23. Wiklund et al. Effect of controlled release/extended release metoprolol on carotid intima-media thickness in patients with
hypercholesterolemia: a 3-year randomized study. Stroke 2002; 33: 572
X
24. Terpstra et al. Effects of amlodipine and lisinopril on intima-media thickness in previously untreated, elderly hypertensive
patients (the ELVERA trial). J Hypertens 2004; 22: 1309
X
25. Hoogebrugge et al. Doxazosin and hydrochlorothiazide equally affect arterial wall thickness in hypertensive males with
hypercholesterolaemia (the DAPHNE study). Doxazosin Atherosclerosis Progression Study in Hypertensives in the
Netherlands. Neth J Med 2002; 60: 354
X
26. Uchiyama-Tanaka et al. Comparison of the effects of quinapril and losartan on carotid artery intima-media thickness in
patients with mild-to-moderate arterial hypertension. Kidney Blood Press Res 2005; 28: 111
X
27. Boutouyrie et al. Local pulse pressure and regression of arterial wall hypertrophy during long-term antihypertensive
treatment. Circulation 2000; 101: 2601
X
28. Deary et al. The effects of captopril vs atenolol on memory, information processing and mood: a double-blind crossover
study. Br J Clin Pharmacol 1991; 32: 347
X
29. Mccorvey et al. Effect of hydrochlorothiazide, enalapril, and propranolol on quality of life and cognitive and motor function
in hypertensive patients. Clin Pharm 1993; 12: 300
X
30. Starr et al. The effects of antihypertensive treatment on cognitive function: results from the HOPE study. J Am Geriatr Soc
1996; 44: 411
X
31. Tedesco et al. Comparison of losartan and hydrochlorothiazide on cognitive function and quality of life in hypertensive X
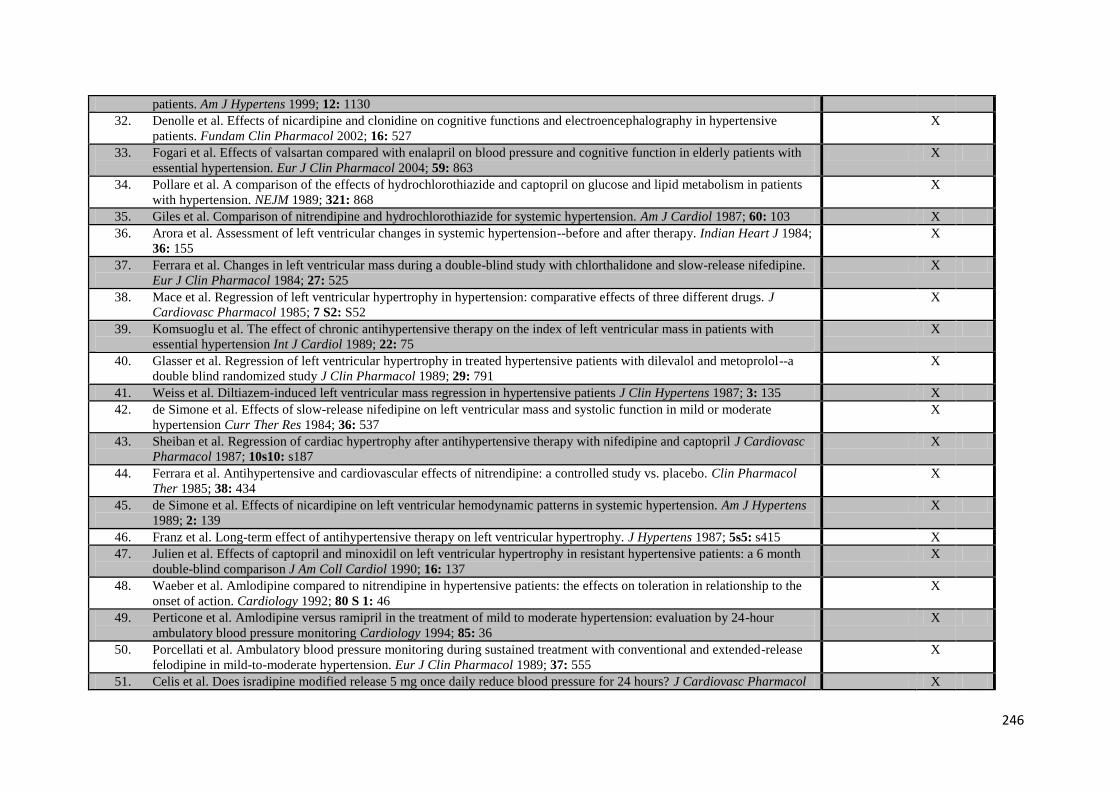
246
patients. Am J Hypertens 1999; 12: 1130
32. Denolle et al. Effects of nicardipine and clonidine on cognitive functions and electroencephalography in hypertensive
patients. Fundam Clin Pharmacol 2002; 16: 527
X
33. Fogari et al. Effects of valsartan compared with enalapril on blood pressure and cognitive function in elderly patients with
essential hypertension. Eur J Clin Pharmacol 2004; 59: 863
X
34. Pollare et al. A comparison of the effects of hydrochlorothiazide and captopril on glucose and lipid metabolism in patients
with hypertension. NEJM 1989; 321: 868
X
35. Giles et al. Comparison of nitrendipine and hydrochlorothiazide for systemic hypertension. Am J Cardiol 1987; 60: 103 X
36. Arora et al. Assessment of left ventricular changes in systemic hypertension--before and after therapy. Indian Heart J 1984;
36: 155
X
37. Ferrara et al. Changes in left ventricular mass during a double-blind study with chlorthalidone and slow-release nifedipine.
Eur J Clin Pharmacol 1984; 27: 525
X
38. Mace et al. Regression of left ventricular hypertrophy in hypertension: comparative effects of three different drugs. J
Cardiovasc Pharmacol 1985; 7 S2: S52
X
39. Komsuoglu et al. The effect of chronic antihypertensive therapy on the index of left ventricular mass in patients with
essential hypertension Int J Cardiol 1989; 22: 75
X
40. Glasser et al. Regression of left ventricular hypertrophy in treated hypertensive patients with dilevalol and metoprolol--a
double blind randomized study J Clin Pharmacol 1989; 29: 791
X
41. Weiss et al. Diltiazem-induced left ventricular mass regression in hypertensive patients J Clin Hypertens 1987; 3: 135 X
42. de Simone et al. Effects of slow-release nifedipine on left ventricular mass and systolic function in mild or moderate
hypertension Curr Ther Res 1984; 36: 537
X
43. Sheiban et al. Regression of cardiac hypertrophy after antihypertensive therapy with nifedipine and captopril J Cardiovasc
Pharmacol 1987; 10s10: s187
X
44. Ferrara et al. Antihypertensive and cardiovascular effects of nitrendipine: a controlled study vs. placebo. Clin Pharmacol
Ther 1985; 38: 434
X
45. de Simone et al. Effects of nicardipine on left ventricular hemodynamic patterns in systemic hypertension. Am J Hypertens
1989; 2: 139
X
46. Franz et al. Long-term effect of antihypertensive therapy on left ventricular hypertrophy. J Hypertens 1987; 5s5: s415 X
47. Julien et al. Effects of captopril and minoxidil on left ventricular hypertrophy in resistant hypertensive patients: a 6 month
double-blind comparison J Am Coll Cardiol 1990; 16: 137
X
48. Waeber et al. Amlodipine compared to nitrendipine in hypertensive patients: the effects on toleration in relationship to the
onset of action. Cardiology 1992; 80 S 1: 46
X
49. Perticone et al. Amlodipine versus ramipril in the treatment of mild to moderate hypertension: evaluation by 24-hour
ambulatory blood pressure monitoring Cardiology 1994; 85: 36
X
50. Porcellati et al. Ambulatory blood pressure monitoring during sustained treatment with conventional and extended-release
felodipine in mild-to-moderate hypertension. Eur J Clin Pharmacol 1989; 37: 555
X
51. Celis et al. Does isradipine modified release 5 mg once daily reduce blood pressure for 24 hours? J Cardiovasc Pharmacol X
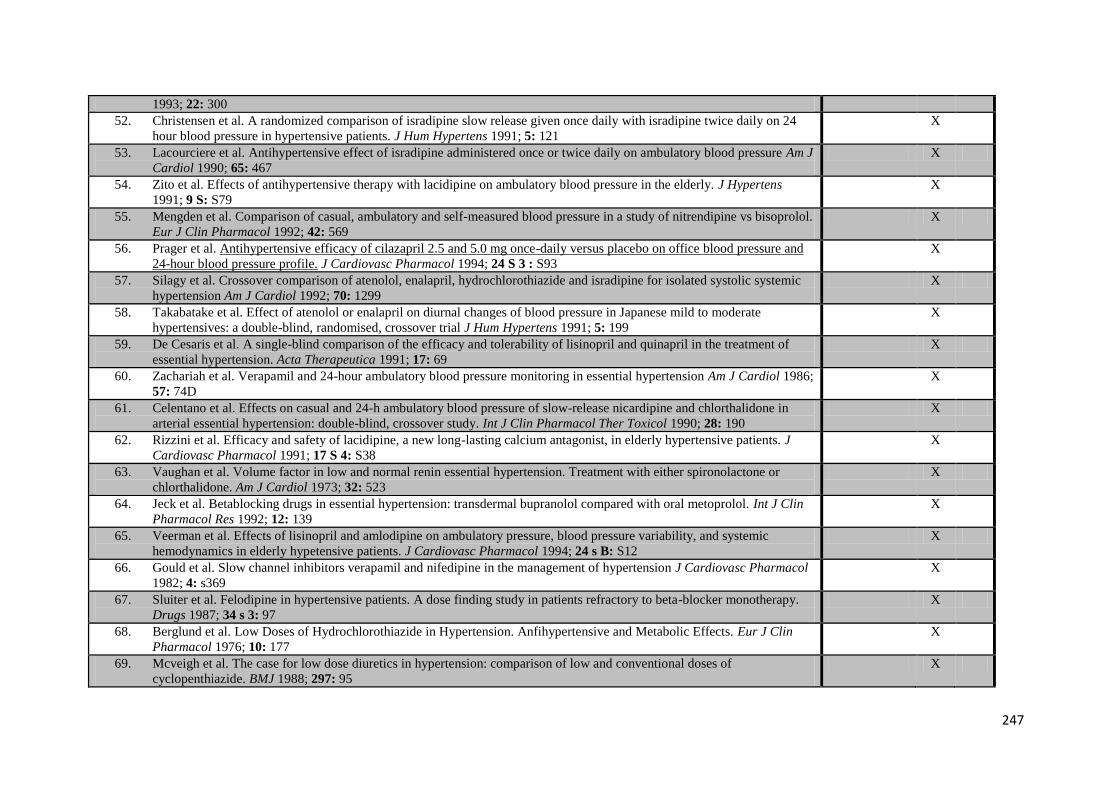
247
1993; 22: 300
52. Christensen et al. A randomized comparison of isradipine slow release given once daily with isradipine twice daily on 24
hour blood pressure in hypertensive patients. J Hum Hypertens 1991; 5: 121
X
53. Lacourciere et al. Antihypertensive effect of isradipine administered once or twice daily on ambulatory blood pressure Am J
Cardiol 1990; 65: 467
X
54. Zito et al. Effects of antihypertensive therapy with lacidipine on ambulatory blood pressure in the elderly. J Hypertens
1991; 9 S: S79
X
55. Mengden et al. Comparison of casual, ambulatory and self-measured blood pressure in a study of nitrendipine vs bisoprolol.
Eur J Clin Pharmacol 1992; 42: 569
X
56. Prager et al. Antihypertensive efficacy of cilazapril 2.5 and 5.0 mg once-daily versus placebo on office blood pressure and
24-hour blood pressure profile. J Cardiovasc Pharmacol 1994; 24 S 3 : S93
X
57. Silagy et al. Crossover comparison of atenolol, enalapril, hydrochlorothiazide and isradipine for isolated systolic systemic
hypertension Am J Cardiol 1992; 70: 1299
X
58. Takabatake et al. Effect of atenolol or enalapril on diurnal changes of blood pressure in Japanese mild to moderate
hypertensives: a double-blind, randomised, crossover trial J Hum Hypertens 1991; 5: 199
X
59. De Cesaris et al. A single-blind comparison of the efficacy and tolerability of lisinopril and quinapril in the treatment of
essential hypertension. Acta Therapeutica 1991; 17: 69
X
60. Zachariah et al. Verapamil and 24-hour ambulatory blood pressure monitoring in essential hypertension Am J Cardiol 1986;
57: 74D
X
61. Celentano et al. Effects on casual and 24-h ambulatory blood pressure of slow-release nicardipine and chlorthalidone in
arterial essential hypertension: double-blind, crossover study. Int J Clin Pharmacol Ther Toxicol 1990; 28: 190
X
62. Rizzini et al. Efficacy and safety of lacidipine, a new long-lasting calcium antagonist, in elderly hypertensive patients. J
Cardiovasc Pharmacol 1991; 17 S 4: S38
X
63. Vaughan et al. Volume factor in low and normal renin essential hypertension. Treatment with either spironolactone or
chlorthalidone. Am J Cardiol 1973; 32: 523
X
64. Jeck et al. Betablocking drugs in essential hypertension: transdermal bupranolol compared with oral metoprolol. Int J Clin
Pharmacol Res 1992; 12: 139
X
65. Veerman et al. Effects of lisinopril and amlodipine on ambulatory pressure, blood pressure variability, and systemic
hemodynamics in elderly hypetensive patients. J Cardiovasc Pharmacol 1994; 24 s B: S12
X
66. Gould et al. Slow channel inhibitors verapamil and nifedipine in the management of hypertension J Cardiovasc Pharmacol
1982; 4: s369
X
67. Sluiter et al. Felodipine in hypertensive patients. A dose finding study in patients refractory to beta-blocker monotherapy.
Drugs 1987; 34 s 3: 97
X
68. Berglund et al. Low Doses of Hydrochlorothiazide in Hypertension. Anfihypertensive and Metabolic Effects. Eur J Clin
Pharmacol 1976; 10: 177
X
69. Mcveigh et al. The case for low dose diuretics in hypertension: comparison of low and conventional doses of
cyclopenthiazide. BMJ 1988; 297: 95
X
248
70. Kirpizidis et al. Comparative effects of fosinopril and nifedipine on regression of left ventricular hypertrophy in
hypertensive patients: a double-blind study Cardiovasc Drug Ther 1995; 9: 141
X
71. Mehlsen et al. Beneficial effect of isradipine on the development of left ventricular hypertrophy in mild hypertension. Am J
Hypertens 1993; 6: 95S
X
72. Vyssoulis et al. Effect of beta-blockade on exercise capacity in hypertensive subjects: a one-year double-blind study of
celiprolol and metoprolol Cardiovasc Drug Ther 1995; 9: 133
X
73. Wetzchewald et al. Regression of left ventricular hypertrophy during long-term antihypertensive treatment--a comparison
between felodipine and the combination of felodipine and metoprolol. J Intern Med 1992; 231: 303
X
74. Bielen et al. Comparison of the effects of isradipine and lisinopril on left ventricular structure and function in essential
hypertension Am J Cardiol 1992; 69: 1200
X
75. Agabiti-Rosei et al. Cardiovascular structural changes and calcium antagonist therapy in patients with hypertension. J
Cardiovasc Pharmacol 1994; 24 S A: S37
X
76. Gosse et al. Regression of left ventricular hypertrophy in hypertensive patients treated with indapamide SR 1.5 mg versus
enalapril 20 mg: the LIVE study. J Hypertens 2000; 18: 1465
X
77. Andersson et al. The antihypertensive effect and tolerability of candesartan cilexetil, a new generation angiotensin II
antagonist, in comparison with losartan Blood Press 1998; 7: 53
X
78. Fletcher et al. Quality of life on antihypertensive therapy: a randomized double-blind controlled trial of captopril and
atenolol. J Hypertens 1990; 8: 463
X
79. Gosse et al. Beta-blockers vs. angiotensin-converting enzyme inhibitors in hypertension: effects on left ventricular
hypertrophy J Cardiovasc Pharmacol 1990; 16 S 5: S145
X
80. Schneeweiss et al. The effect of cilazapril, 2.5 to 5.0 mg and hydrochlorothiazide, 25 to 50 mg, on diastolic cardiac function
was studied by echocardiography and radionuclide ventriculography, using a double-blind randomized parallel-group
design with a placebo run-in period, in 30 hypertensive patients.. J Hum Hypertens 1990; 4: 535
X
81. Leonetti et al. Comparison of the effects on blood pressure and left ventricular hypertrophy of lacidipine and
hydrochlorothiazide in hypertensive patients J Hypertens 1991; 9 S 3: S29
X
82. Wang et al. Comparison of the effects of nitrendipine and captopril on the regression of hypertensive left ventricular
hypertrophy. Chin Med J 1991; 104: 645
X
83. Carruthers et al. Comparative trial of doxazosin and atenolol on cardiovascular risk reduction in systemic hypertension. The
Alpha Beta Canada Trial Group Am J Cardiol 1993; 71: 575
X
84. Jansson et al. Effects of doxazosin and atenolol on the fibrinolytic system in patients with hypertension and elevated serum
cholesterol Eur J Clin Pharmacol 1991; 40: 321
X
85. Wessels et al. Double-blind comparison of doxazosin and enalapril in patients with mild or moderate essential hypertension.
Am Heart J 1991; 121: 299
X
86. Agabiti-Rosei et al. Evaluation of the Efficacy and Tolerability of Nebivolol versus Lisinopril in theTreatment of Essential
Arterial Hypertension: A Randomized, Multicentre, Double-blind Study Blood Press 2003; 12 s 1: 30
X
87. Grassi et al. Efficacy and tolerability profile of nebivolol vs atenolol in mild-to-moderate essential hypertension: results of a
double-blind randomized multicentre trial Blood Press 2003; S2: 35
X
249
88. Lacourciere et al. Comparative effects of a new cardioselective beta-blocker nebivolol and nifedipine sustained-release on
24-hour ambulatory blood pressure and plasma lipoproteins J Clin Pharmacol 1992; 32: 660
X
89. Tzemos et al. Nebivolol reverses endothelial dysfunction in essential hypertension: a randomized, double-blind, crossover
study. Circulation 2001; 104: 511
X
90. Celik et al. Comparative effects of nebivolol and metoprolol on oxidative stress, insulin resistance, plasma adiponectin and
soluble P-selectin levels in hypertensive patients J Hum Hypertens 2006; 24: 591
X
91. Ostergren et al. Quality of life in hypertensive patients treated with either carvedilol or enalapril Blood Press 1996; 5: 41 X
92. Boydak et al. A Randomised Comparison of the Effects of Nebivolol and Atenolol with and without Chlorthalidone on the
Sexual Function of Hypertensive Men Clin Drug Invest 2005; 25: 409
X
93. Ruggenenti et al. Preventing microalbuminuria in type 2 diabetes NEJM 2004; 351: 1941 X
94. Wright et al. Effect of blood pressure lowering and antihypertensive drug class on progression of hypertensive kidney
disease: results from the AASK trial. JAMA 2002; 288: 2421
X
95. Asselbergs et al. Effects of fosinopril and pravastatin on cardiovascular events in subjects with microalbuminuria
Circulation 2004; 110: 2809
X
96. Frei et al. Moxonidine and hydrochlorothiazide in combination: a synergistic antihypertensive effect J Cardiovasc
Pharmacol 1994; 24 s 1: S25
X
97. Hegner et al. Valsartan, a new angiotensin II antagonist for the treatment of essential hypertension: efficacy and safety
compared to hydrochlorothiazide Eur J Clin Pharmacol 1997; 52.3: 173
X
98. Dey et al. Comparison of nifedipine GITS and hydrochlorothiazide in the management of elderly patients with stage I-III
diastolic hypertension Am J Hypertens 1996; 9.6: 598
X
99. Fariello et al. Antihypertensive efficacy of urapidil versus hydrochlorothiazide alone in patients with mild to moderate
essential hypertension and of their combination in nonresponders to monotherapy. Drugs 1990; 40 s 4: 60
X
100. Kuo et al. Effect of indapamide SR in the treatment of hypertensive patients with type 2 diabetes Am J Hypertens 2003;
16.8: 623
X
101. Fogari et al. Effect of antihypertensive treatment with valsartan or atenolol on sexual activity and plasma testosterone in
hypertensive men Eur J Clin Pharmacol 2002; 58.3: 177
X
102. Cleophas et al. Quality of life before and during antihypertensive treatment: a comparative study of celiprolol and atenolol
Am J Ther 1997; 4.4: 117
X
103. Armentano et al. Mechanical vs intrinsic components in the improvement of brachial arterial compliance. Comparison of
the effects of atenolol versus ramipril in hypertensive patients Medicina (B Aires) 2001; 61 5.1: 535
X
104. Rorive et al. [Comparative study of the efficacy and tolerance of perindopril, a new converting enzyme inhibitor and of
atenolol, a beta blocker] Rev Med Liege (French) 1990; 45.2: 62
X
105. Baez et al. Antihypertensive effect of doxazosin in hypertensive patients: comparison with atenolol. Br J Clin Pharmacol
1986; 21 s 1: 63S
X
106. Dahlof et al. Efficacy and tolerability of losartan potassium and atenolol in patients with mild to moderate essential
hypertension Am J Hypertens 1995; 8.6: 578
X
107. Hakamaki et al. Metabolic effects of spirapril and atenolol: results from a randomized, long-term study Int J Clin X
250
Pharmacol Ther 1997; 35.6: 227
108. Corea et al. Valsartan, a new angiotensin II antagonist for the treatment of essential hypertension: a comparative study of
the efficacy and safety against amlodipine Clin Pharmacol Ther 1996; 60.3: 341
X
109. Leonetti et al. Effects of nilvadipine and amlodipine in patients with mild to moderate essential hypertension: a double
blind, prospective, randomised clinical trial Curr Med Res Opin 2005; 21.6: 951
X
110. Martina et al. Effects of losartan titrated to losartan/hydrochlorothiazide and amlodipine on blood pressure and peripheral
capillary microcirculation in patients with mild-to-moderate hypertension J Hum Hypertens 1998; 12.7: 473
X
111. Zanchetti et al. Efficacy, tolerability, and impact on quality of life of long-term treatment with manidipine or amlodipine in
patients with essential hypertension J Cardiovasc Pharmacol 2001; 38.4: 642
X
112. Delles et al. Direct comparison of the effects of valsartan and amlodipine on renal hemodynamics in human essential
hypertension Am J Hypertens 2003; 16.12: 1030
X
113. Dahlof et al. Main results of the losartan versus amlodipine (LOA) study on drug tolerability and psychological general
well-being. LOA Study Group J Hypertens 1997; 51.11: 1327
X
114. Fernandez-Andrade et al. Comparison of losartan and amlodipine in renally impaired hypertensive patients. Kidney Int
Suppl 1998; 68: S120
X
115. Grimm et al. Amlodipine versus chlorthalidone versus placebo in the treatment of stage I isolated systolic hypertension. Am
J Hypertens 2002; 15 1 pt 1: 31
X
116. Oparil et al. Efficacy, tolerability, and effects on quality of life of losartan, alone or with hydrochlorothiazide, versus
amlodipine, alone or with hydrochlorothiazide, in patients with essential hypertension Clin Ther 1996; 18.4: 608
X
117. Zannad et al. Double-blind, randomized, multicentre comparison of the effects of amlodipine and perindopril on 24 h
therapeutic coverage and beyond in patients with mild to moderate hypertension. General Physicians Investigators' Group. J
Hypertens 1999; 17.1: 137
X
118. Pandita-Gunawardena et al. Amlodipine lowers blood pressure without affecting cerebral blood flow as measured by single
photon emission computed tomography in elderly hypertensive subjects Age Ageing 1999; 28.5: 451
X
119. Rajzer et al. Effect of amlodipine, quinapril, and losartan on pulse wave velocity and plasma collagen markers in patients
with mild-to-moderate arterial hypertension Am J Hypertens 2003; 16.6: 439
X
120. Romito et al. Comparative effect of lercanidipine, felodipine, and nifedipine GITS on blood pressure and heart rate in
patients with mild to moderate arterial hypertension: the Lercanidipine in Adults (LEAD) Study. J Clin Hypertens 2003;
5.4: 249
X
121. Nielsen et al. Losartan reduces albuminuria in patients with essential hypertension. An enalapril controlled 3 months study.
Nephrol Dial Transplant 1997; 12 s 2: 19
X
122. Holwerda et al. Valsartan, a new angiotensin II antagonist for the treatment of essential hypertension: efficacy and safety
compared with placebo and enalapril J Hypertens 1996; 14.9: 1147
X
123. Martina et al. The effects of mibefradil and enalapril on 24-hour blood pressure control and left ventricular mass in patients
with mild to moderate hypertension: double-blind, randomized trial. J Cardiovasc Pharmacol 1999; 33.4: 647
X
124. Manolis et al. Effects of losartan and candesartan monotherapy and losartan/hydrochlorothiazide combination therapy in
patients with mild to moderate hypertension. Losartan Trial Investigators. Clin Ther 2000; 22.1: 1186
X
251
125. Mcinnes et al. The efficacy and tolerability of candesartan cilexetil in an elderly hypertensive population J Hum Hypertens
1997; 11 s 2: S75
X
126. Li et al. A comparison of initial treatment with losartan/HCTZ versus losartan monotherapy in Chinese patients with mild to
moderate essential hypertension. Int J Clin Pract 2003; 27.8: 673
X
127. Pool et al. Aliskiren, an orally effective renin inhibitor, provides antihypertensive efficacy alone and in combination with
val Am J Hypertens 2007; 20.1: 11
X
128. Coca et al. A multicenter, randomized, double-blind comparison of the efficacy and safety of irbesartan and enalapril in
adults with mild to moderate essential hypertension, as assessed by ambulatory blood pressure monitoring: the MAPAVEL
Study (Monitorización Ambulatoria Presión Arterial APROVEL). Clin THer 2002; 24.1: 126
X
129. Chiou et al. Randomized, double-blind comparison of irbesartan and enalapril for treatment of mild to moderate
hypertension. Zhonghua Yi Xue Za Zhi (Taipei) 2000; 63.5368
X
130. Sakata et al. Effects of losartan and its combination with quinapril on the cardiac sympathetic nervous system and
neurohormonal status in essential hypertension. J Hypertens 2002; 20.1: 103
X
131. Chanudet et al. Antihypertensive efficacy and tolerability of low-dose perindopril/indapamide combination compared with
losartan in the treatment of essential hypertension Int J Clin Pract 2001; 55.4: 233
X
132. Samra et al. Comparison of the efficacy, safety and tolerability of telmisartan with losartan in Indian patients with mild to
moderate hypertension: a pilot study J indian Med Assoc 2003; 101.5: 327
X
133. Conlin et al. A study of losartan, alone or with hydrochlorothiazide vs nifedipine GITS in elderly patients with diastolic
hypertension J Hum Hypertens 1998; 12.1: 693
X
134. Chan et al. Double-blind comparison of losartan, lisinopril, and metolazone in elderly hypertensive patients with previous
angiotensin-converting enzyme inhibitor-induced cough. J Clin Pharmacol 1997; 37.3: 253
X
135. Hung et al. Comparison of antihypertensive efficacy and tolerability of losartan and extended-release felodipine in patients
with mild to moderate hypertension J Formos Med Assoc 1999; 98.6: 403
X
136. Chung et al. Comparison of the efficacy and safety of losartan (50-100 mg) with the T-type calcium channel blocker
mibefradil (50-100 mg) in mild to moderate hypertension Fundam Clin Pharmacol 2000; 14.1: 31
X
137. Posma et al. Sustained-release diltiazem versus metoprolol in stable angina pectoris Eur Heart J 1989; 10: 923 X
138. Van Dijk et al. Diltiazem in comparison with metoprolol in stable angina pectoris. Eur Heart J 1988; 9: 1194 X
139. Bulpitt et al. Results of the pilot study for the Hypertension in the Very Elderly Trial J Hypertens 2003; 21: 2409 X
140. Viberti et al. Microalbuminuria reduction with valsartan in patients with type 2 diabetes mellitus: a blood pressure-
independent effect Circulation 2002; 106: 672
X
141. Gradman et al. Aliskiren, a novel orally effective renin inhibitor, provides dose-dependent antihypertensive efficacy and
placebo-like tolerability in hypertensive patients. Circulation 2005; 111: 1012
X
142. Pickering et al. Comparison of antihypertensive and hormonal effects of captopril and propranolol at rest and during
exercise Am J Cardiol 1982; 49: 1566
X
143. Weir et al. A noninferiority comparison of valsartan/hydrochlorothiazide combination versus amlodipine in black
hypertensives Hypertension 2005; 46: 508
X
144. Black et al. One-year study of felodipine or placebo for stage 1 isolated systolic hypertension. Hypertension 2001; 38: 1118 X
252
145. Fogari et al. Effect of benazepril addition to amlodipine on ankle oedema and subcutaneous tissue pressure in hypertensive
patients. J Hum Hypertens 2003; 17: 207
X
146. Holzgreve et al. Antihypertensive therapy with verapamil SR plus trandolapril versus atenolol plus chlorthalidone on
glycemic control. Am J Hypertens 2003; 16: 381
X
147. Taddei et al. Combination of lisinopril and nifedipine GITS increases blood pressure control compared with single drugs in
essential hypertensive patients. J Cardiovasc Pharmacol 2003; 44: 579
X
148. Fogari et al. Combined therapy with benazepril and amlodipine in the treatment of hypertension inadequately controlled by
an ACE inhibitor alone. J Cardiovasc Pharmacol 1997; 30: 497
X
149. Fogari et al. Fixed combination of benazepril and low-dose amlodipine in the treatment of mild to moderate essential
hypertension: evaluation by 24-hour noninvasive ambulatory blood pressure monitoring. J Cardiovasc Pharmacol 1997;
30: 176
X
150. Louis et al. Use of computerized neuropsychological tests (CANTAB) to assess cognitive effects of antihypertensive drugs
in the elderly. Cambridge Neuropsychological Test Automated Battery. J Hypertens 1999; 17: 1813
X
151. Perez-Stable et al. The effects of propranolol on cognitive function and quality of life: a randomized trial among patients
with diastolic hypertension. Am J Med 2000; 108: 359
X
152. Agardh et al. Greater reduction of urinary albumin excretion in hypertensive type II diabetic patients with incipient
nephropathy by lisinopril than by nifedipine. J Hum Hypertens 1996; 10: 185
X
153. Ahmad et al. Effect of 5-year enalapril therapy on progression of microalbuminuria and glomerular structural changes in
type 1 diabetic subjects. Diabetes Clin Res 2003; 60: 131
X
154. Ahmad et al. Effective postponement of diabetic nephropathy with enalapril in normotensive type 2 diabetic patients with
microalbuminuria. Diabetes Care 1997; 20: 1576
X
155. Aurell et al. Enalapril versus metoprolol in primary hypertension--effects on the glomerular filtration rate. Nephrol Dial
transplant 1997; 12: 2289
X
156. Bakris et al. Bakris Kidney Int 1998; 54: 1283 X
157. Bjorck et al. Renal protective effect of enalapril in diabetic nephropathy. BMJ 1992; 304: 339 X
158. Capek et al. Effects of captopril treatment versus placebo on renal function in type 2 diabetic patients with
microalbuminuria: a long-term study. Clin Invest 1994; 72: 961
X
159. Chan et al. Long-term effects of angiotensin-converting enzyme inhibition and metabolic control in hypertensive type 2
diabetic patients. Kidney Int 2000; 57: 590
X
160. Del Vecchio et al. Efficacy and tolerability of manidipine in the treatment of hypertension in patients with non-diabetic
chronic kidney disease without glomerular disease. Prospective, randomized, double-blind study of parallel groups in
comparison with enalapril. J Nephrol 2004; 17: 261
X
161. Fogari et al. Effects of amlodipine fosinopril combination on microalbuminuria in hypertensive type 2 diabetic patients. Am
J Hypertens 2002; 15: 1042
X
162. Fogari et al. Long-term effects of ramipril and nitrendipine on albuminuria in hypertensive patients with type II diabetes
and impaired renal function. J Hum Hypertens 1999; 13: 47
X
163. Hannedouche et al. Randomised controlled trial of enalapril and beta blockers in non-diabetic chronic renal failure. BMJ X
253
1994; 309: 833
164. Iino et al. Renoprotective effect of losartan in comparison to amlodipine in patients with chronic kidney disease and
hypertension--a report of the Japanese Losartan Therapy Intended for the Global Renal Protection in Hypertensive Patients
(JLIGHT) study. Hypertens Res 2004; 27: 21
X
165. Kopf et al. A double-blind trial of perindopril and nitrendipine in incipient diabetic nephropathy. Diabetes Nutr Metab
2001; 14: 245
X
166. Kumagai et al. Amlodipine is comparable to angiotensin-converting enzyme inhibitor for long-term renoprotection in
hypertensive patients with renal dysfunction: a one-year, prospective, randomized study. Am J Hypertens 2000; 13: 980
X
167. Lacourciere et al. Long-term comparison of losartan and enalapril on kidney function in hypertensive type 2 diabetics with
early nephropathy. Hypertension 1993; 21: 786
X
168. Marre et al. Equivalence of indapamide SR and enalapril on microalbuminuria reduction in hypertensive patients with type
2 diabetes: the NESTOR Study. J Hypertens 2004; 22: 1613
X
169. Mosconi et al. Nitrendipine and enalapril improve albuminuria and glomerular filtration rate in non-insulin dependent
diabetes. Kidney Int Suppl 1996; 55: S91
X
170. Nakamura et al. Combination therapy of trandolapril and candesartan cilexetil reduces microalbuminuria and urinary
endothelin-1 excretion in patients with type 2 diabetes Clin Exp Nephrol 2002; 6: 135
X
171. Rudberg et al. Effect of angiotensin converting enzyme inhibitor or beta blocker on glomerular structural changes in young
microalbuminuric patients with Type I (insulin-dependent) diabetes mellitus. Diabetologia 1999; 42: 589
X
172. Shiba et al. Delapril versus manidipine in hypertensive therapy to halt the type-2-diabetes-mellitus-associated nephropathy.
Diabetes Res Clin Pract 2000; 47: 97
X
173. Siewert-Delle et al. Effects of intensified blood-pressure reduction on renal function and albumin excretion in primary
hypertension. Addition of felodipine or ramipril to long-term treatment with beta-blockade. Am J Hypertens 1995; 8: 113
X
174. Smith et al. Differential effects of calcium channel blockers on size selectivity of proteinuria in diabetic glomerulopathy.
Kidney Int 1998; 54: 889
X
175. Sorensen et al. Effects of nisoldipine and lisinopril on microvascular dysfunction in hypertensive Type I diabetes patients
with nephropathy Clin Sci (Lond) 1998; 98: 709
X
176. van Essen et al. Are angiotensin converting enzyme inhibitors superior to beta blockers in retarding progressive renal
function decline? Kidney Int Suppl 1997; 63: S58
X
177. Velussi et al. Effects of cilazapril and amlodipine on kidney function in hypertensive NIDDM patients. Diabetes 1996; 45:
216
X
178. Keleman et al. Exercise training combined with antihypertensive drug therapy. Effects on lipids, blood pressure, and left
ventricular mass. JAMA 1990; 263: 2766
X
179. Gosse et al. [Effects of verapamil and nifedipine on blood pressure during rest and exertion and on left ventricular
hypertrophy] Arch Mal Coeur (French) 1992; 85: 1249
X
180. Schobel et al. Treatment and post-treatment effects of alpha- versus beta-receptor blockers on left ventricular structure and
function in essential hypertension. Am Heart J 1996; 132: 1004
X
181. Fogari et al. Effects of lisinopril vs hydralazine on left ventricular hypertrophy and ambulatory blood pressure monitoring in X
254
essential hypertension. Eur Heart J 1995; 16: 1120
182. Middlemost et al. Effectiveness of enalapril in combination with low-dose hydrochlorothiazide versus enalapril alone for
mild to moderate systemic hypertension in black patients. Am J Cardiol 1994; 73: 1092
X
183. Henderson et al. Structural adaptation of the heart in borderline hypertensives in response to blood pressure lowering with
captopril. J Hypertens 1994; 12: 65
X
184. Gonzalez-Juanatey et al. [Effect of verapamil and nitrendipine on the left ventricular mass and function (systolic and
diastolic) in arterial hypertension] Rev Esp Cardiol 1994; 47: 375
X
185. Campese et al. Omapatrilat versus lisinopril: efficacy and neurohormonal profile in salt-sensitive hypertensive patients.
Hypertension 2001; 38: 1342
X
186. Mitchell et al. Omapatrilat reduces pulse pressure and proximal aortic stiffness in patients with systolic hypertension:
results of the conduit hemodynamics of omapatrilat international research study. Circulation 2002; 105: 2955
X
187. Bahena et al. Quinapril versus atenolol in the treatment of mild to moderate essential hypertension. Clin Ther 1992; 14: 527 X
188. Crepaldi et al. Hypertension and non-insulin-dependent diabetes. A comparison between an angiotensin-converting enzyme
inhibitor and a calcium antagonist. Acta Diabetologica 1995; 32.3: 203
X
189. Scognamiglio et al. Evaluation of the efficacy and tolerability of nitrendipine in reducing both pressure and left ventricular
mass in hypertensive type 2 diabetic patients. Diabetes Care 1997; 20.8: 1290
X
190. van de Ven et al. Prophylactic treatment of migraine with bisoprolol: a placebo-controlled study. Cephalalgia 1997; 17: 596 X
191. Erqteman et al. Beta blockade, diuretics, and salt restriction for the management of mild hypertension: a randomised double
blind trial. BMJ 1984; 289: 406
X
192. Verdecchia et al. Duration of the antihypertensive action of atenolol, enalapril and placebo: a randomized within-patient
study using ambulatory blood pressure monitoring. Int J Clin Pharmacol Ther 1988; 26: 570
X
193. Cilliers et al. Atenolol as primary therapy in previously untreated hypertensives and as an adjuvant to other therapy. A
South African Multicentre Study. S Afr Med J 1979; 55: 321
X
194. Trafford et al. A multi-centre, placebo controlled comparative study between 200 mg and 400 mg celiprolol in patients with
mild to moderate essential hypertension. Curr Med Res Opin 1989; 11: 550
X
195. Kohlman et al. Brazilian Multicenter Study on Efficacy and Tolerability of Trandolapril in Mild-to-Moderate Essential
Arterial Hypertension. EMBATHE Substudy with Ambulatory Blood Pressure Monitoring Arq Bra Cardiol 1999; 72: 553
X
196. Chan et al. Additive effects of diltiazem and lisinopril in the treatment of elderly patients with mild-to-moderate
hypertension. Am J Hypertens 1997; 10: 743
X
197. Thurig et al. Lisinopril is neutral to insulin sensitivity and serum lipoproteins in essential hypertensive patients. Eur J Clin
Pharmacol 1995; 49: 21
X
198. Chrysant et al. Perindopril as monotherapy in hypertension: a multicenter comparison of two dosing regimens. The
Perindopril Study Group. Clin Pharmacol Ther 1993; 53: 479
X
199. Byyny et al. Losartan potassium lowers blood pressure measured by ambulatory blood pressure monitoring. J Hypertens
1995; 13: s29
X
200. Mackay et al. Losartan and low-dose hydrochlorothiazide in patients with essential hypertension. A double-blind, placebo-
controlled trial of concomitant administration compared with individual components. Arch Intern Med 1996; 156: 278
X
255
201. Harper et al. Effects of low dose versus conventional dose thiazide diuretic on insulin action in essential hypertension. BMJ
1994; 309: 226
X
202. Bakris et al. Differences in glucose tolerance between fixed-dose antihypertensive drug combinations in people with
metabolic syndrome. Diabetes Care 2006; 29: 2592
X
203. Thurmann et al. Influence of the angiotensin II antagonist valsartan on left ventricular hypertrophy in patients with essential
hypertension. Circulation 1998; 98: 2037
X
204. Yasunari et al. Comparative effects of valsartan versus amlodipine on left ventricular mass and reactive oxygen species
formation by monocytes in hypertensive patients with left ventricular hypertrophy. J Am Coll Cardiol 2004; 43: 2116
X
205. Fogari et al. Comparison of the effects of valsartan and felodipine on plasma leptin and insulin sensitivity in hypertensive
obese patients. Hypertension Res 2005; 28: 209
X
206. Malacco et al. Effects of valsartan/hydrochlorothiazide and amlodipine on ambulatory blood pressure and plasma
norepinephrine levels in high-risk hypertensive patients. Adv Therapy 2004; 21.3: 149
X
207. Carreta et al. Pulse pressure responses in patients treated with Valsartan and hydrochlorothiazide combination therapy. J Int
Med Res 2003; 31.5: 370
X
208. Malacco et al. Comparison of valsartan 160 mg with lisinopril 20 mg, given as monotherapy or in combination with a
diuretic, for the treatment of hypertension: the Blood Pressure Reduction and Tolerability of Valsartan in Comparison with
Lisinopril (PREVAIL) study. Clin Ther 2004; 26.6: 855
X
209. Schmidt et al. Antihypertensive effects of valsartan/hydrochlorothiazide combination in essential hypertension. Blood Press
2001; 10.4: 230
X
210. Palatini et al. A multicenter, randomized double-blind study of valsartan/hydrochlorothiazide combination versus
amlodipine in patients with mild to moderate hypertension. J Hypertens 2001; 19.9: 1691
X
211. Malacco et al. A randomized, double-blind, active-controlled, parallel-group comparison of valsartan and amlodipine in the
treatment of isolated systolic hypertension in elderly patients: the Val-Syst study. Clin Ther 2003; 25.11: 2765
X
212. Bobrie et al. A home blood pressure monitoring study comparing the antihypertensive efficacy of two angiotensin II
receptor antagonist fixed combinations. J Hypertens 2005; 18.11: 1482
X
213. Lombardo et al. Efficacy and safety evaluation of lacidipine compared with amlodipine in mild-to-moderate hypertensive
patients. J Cardiovasc Pharmacol 1994; 23 s 5: S98
X
214. Fadayomi et al. Monotherapy with nifedipine for essential hypertension in adult blacks. J Cardiovasc Pharmacol 1986; 8:
466
X
215. Venter et al. The effects of xipamide on mild-moderate hypertension in black South Africans - results of a clinical trial. Med
Sci Res 1991; 19: 217
X
216. Venter et al. [The effect of enalapril and prazosin on mild to moderate hypertension in black South Africans] S Afr Med J
1991; 80: 324
X
217. Kirch et al. Efficacy and tolerability of the new calcium antagonist isradipine in essential hypertension. J Cardiovasc
Pharmacol 1990; 15 S 1: S55
X
218. Winer et al. Placebo-controlled trial of once-a-day isradipine monotherapy in mild to moderately severe hypertension. J
Clin Pharmacol 1990; 30: 1006
X
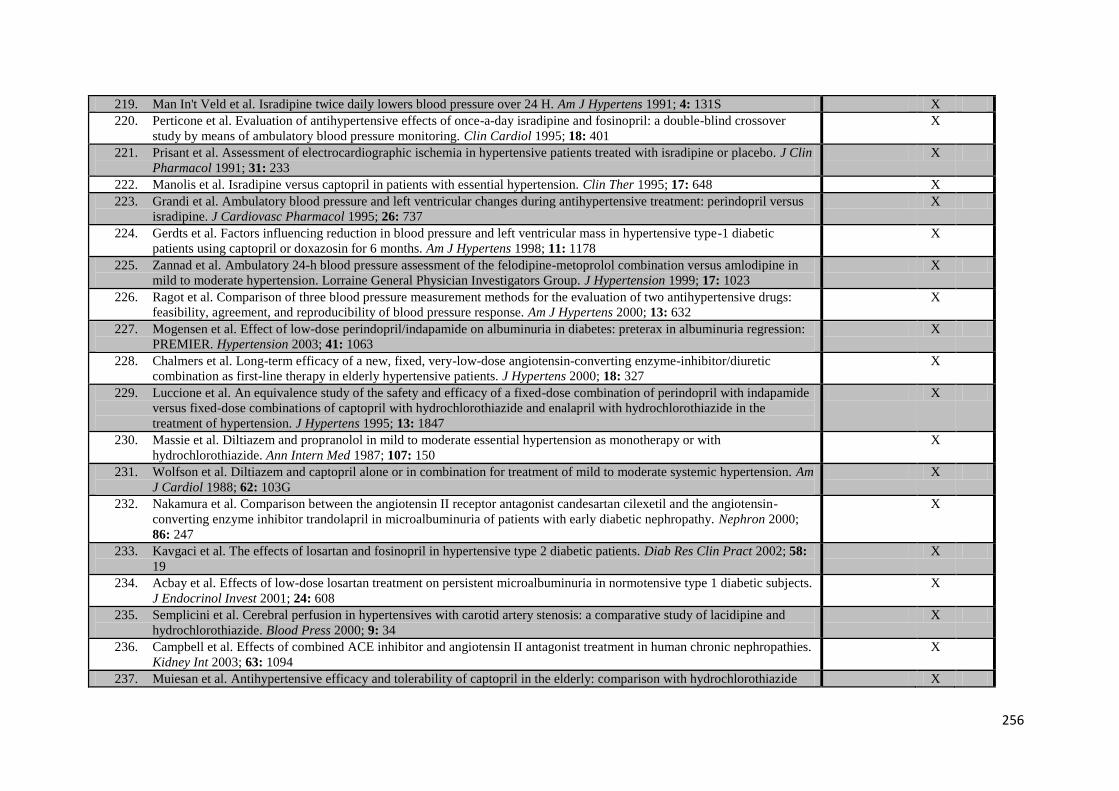
256
219. Man In't Veld et al. Isradipine twice daily lowers blood pressure over 24 H. Am J Hypertens 1991; 4: 131S X
220. Perticone et al. Evaluation of antihypertensive effects of once-a-day isradipine and fosinopril: a double-blind crossover
study by means of ambulatory blood pressure monitoring. Clin Cardiol 1995; 18: 401
X
221. Prisant et al. Assessment of electrocardiographic ischemia in hypertensive patients treated with isradipine or placebo. J Clin
Pharmacol 1991; 31: 233
X
222. Manolis et al. Isradipine versus captopril in patients with essential hypertension. Clin Ther 1995; 17: 648 X
223. Grandi et al. Ambulatory blood pressure and left ventricular changes during antihypertensive treatment: perindopril versus
isradipine. J Cardiovasc Pharmacol 1995; 26: 737
X
224. Gerdts et al. Factors influencing reduction in blood pressure and left ventricular mass in hypertensive type-1 diabetic
patients using captopril or doxazosin for 6 months. Am J Hypertens 1998; 11: 1178
X
225. Zannad et al. Ambulatory 24-h blood pressure assessment of the felodipine-metoprolol combination versus amlodipine in
mild to moderate hypertension. Lorraine General Physician Investigators Group. J Hypertension 1999; 17: 1023
X
226. Ragot et al. Comparison of three blood pressure measurement methods for the evaluation of two antihypertensive drugs:
feasibility, agreement, and reproducibility of blood pressure response. Am J Hypertens 2000; 13: 632
X
227. Mogensen et al. Effect of low-dose perindopril/indapamide on albuminuria in diabetes: preterax in albuminuria regression:
PREMIER. Hypertension 2003; 41: 1063
X
228. Chalmers et al. Long-term efficacy of a new, fixed, very-low-dose angiotensin-converting enzyme-inhibitor/diuretic
combination as first-line therapy in elderly hypertensive patients. J Hypertens 2000; 18: 327
X
229. Luccione et al. An equivalence study of the safety and efficacy of a fixed-dose combination of perindopril with indapamide
versus fixed-dose combinations of captopril with hydrochlorothiazide and enalapril with hydrochlorothiazide in the
treatment of hypertension. J Hypertens 1995; 13: 1847
X
230. Massie et al. Diltiazem and propranolol in mild to moderate essential hypertension as monotherapy or with
hydrochlorothiazide. Ann Intern Med 1987; 107: 150
X
231. Wolfson et al. Diltiazem and captopril alone or in combination for treatment of mild to moderate systemic hypertension. Am
J Cardiol 1988; 62: 103G
X
232. Nakamura et al. Comparison between the angiotensin II receptor antagonist candesartan cilexetil and the angiotensin-
converting enzyme inhibitor trandolapril in microalbuminuria of patients with early diabetic nephropathy. Nephron 2000;
86: 247
X
233. Kavgaci et al. The effects of losartan and fosinopril in hypertensive type 2 diabetic patients. Diab Res Clin Pract 2002; 58:
19
X
234. Acbay et al. Effects of low-dose losartan treatment on persistent microalbuminuria in normotensive type 1 diabetic subjects.
J Endocrinol Invest 2001; 24: 608
X
235. Semplicini et al. Cerebral perfusion in hypertensives with carotid artery stenosis: a comparative study of lacidipine and
hydrochlorothiazide. Blood Press 2000; 9: 34
X
236. Campbell et al. Effects of combined ACE inhibitor and angiotensin II antagonist treatment in human chronic nephropathies.
Kidney Int 2003; 63: 1094
X
237. Muiesan et al. Antihypertensive efficacy and tolerability of captopril in the elderly: comparison with hydrochlorothiazide X
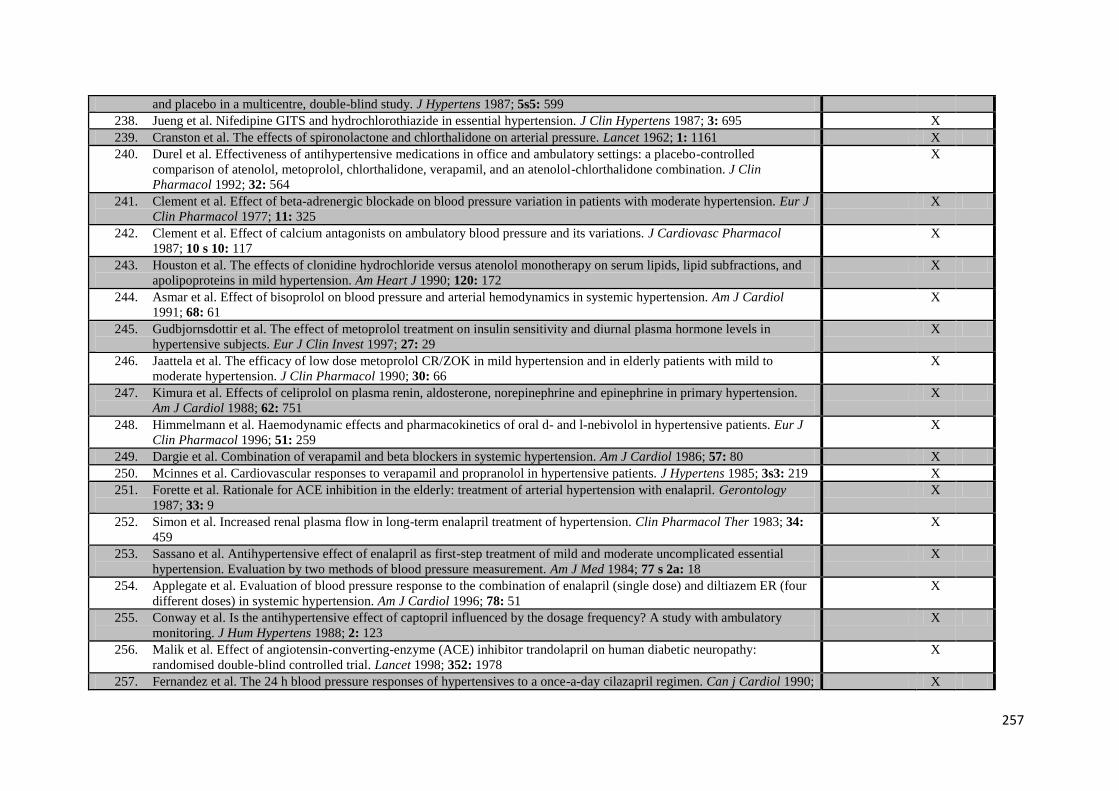
257
and placebo in a multicentre, double-blind study. J Hypertens 1987; 5s5: 599
238. Jueng et al. Nifedipine GITS and hydrochlorothiazide in essential hypertension. J Clin Hypertens 1987; 3: 695 X
239. Cranston et al. The effects of spironolactone and chlorthalidone on arterial pressure. Lancet 1962; 1: 1161 X
240. Durel et al. Effectiveness of antihypertensive medications in office and ambulatory settings: a placebo-controlled
comparison of atenolol, metoprolol, chlorthalidone, verapamil, and an atenolol-chlorthalidone combination. J Clin
Pharmacol 1992; 32: 564
X
241. Clement et al. Effect of beta-adrenergic blockade on blood pressure variation in patients with moderate hypertension. Eur J
Clin Pharmacol 1977; 11: 325
X
242. Clement et al. Effect of calcium antagonists on ambulatory blood pressure and its variations. J Cardiovasc Pharmacol
1987; 10 s 10: 117
X
243. Houston et al. The effects of clonidine hydrochloride versus atenolol monotherapy on serum lipids, lipid subfractions, and
apolipoproteins in mild hypertension. Am Heart J 1990; 120: 172
X
244. Asmar et al. Effect of bisoprolol on blood pressure and arterial hemodynamics in systemic hypertension. Am J Cardiol
1991; 68: 61
X
245. Gudbjornsdottir et al. The effect of metoprolol treatment on insulin sensitivity and diurnal plasma hormone levels in
hypertensive subjects. Eur J Clin Invest 1997; 27: 29
X
246. Jaattela et al. The efficacy of low dose metoprolol CR/ZOK in mild hypertension and in elderly patients with mild to
moderate hypertension. J Clin Pharmacol 1990; 30: 66
X
247. Kimura et al. Effects of celiprolol on plasma renin, aldosterone, norepinephrine and epinephrine in primary hypertension.
Am J Cardiol 1988; 62: 751
X
248. Himmelmann et al. Haemodynamic effects and pharmacokinetics of oral d- and l-nebivolol in hypertensive patients. Eur J
Clin Pharmacol 1996; 51: 259
X
249. Dargie et al. Combination of verapamil and beta blockers in systemic hypertension. Am J Cardiol 1986; 57: 80 X
250. Mcinnes et al. Cardiovascular responses to verapamil and propranolol in hypertensive patients. J Hypertens 1985; 3s3: 219 X
251. Forette et al. Rationale for ACE inhibition in the elderly: treatment of arterial hypertension with enalapril. Gerontology
1987; 33: 9
X
252. Simon et al. Increased renal plasma flow in long-term enalapril treatment of hypertension. Clin Pharmacol Ther 1983; 34:
459
X
253. Sassano et al. Antihypertensive effect of enalapril as first-step treatment of mild and moderate uncomplicated essential
hypertension. Evaluation by two methods of blood pressure measurement. Am J Med 1984; 77 s 2a: 18
X
254. Applegate et al. Evaluation of blood pressure response to the combination of enalapril (single dose) and diltiazem ER (four
different doses) in systemic hypertension. Am J Cardiol 1996; 78: 51
X
255. Conway et al. Is the antihypertensive effect of captopril influenced by the dosage frequency? A study with ambulatory
monitoring. J Hum Hypertens 1988; 2: 123
X
256. Malik et al. Effect of angiotensin-converting-enzyme (ACE) inhibitor trandolapril on human diabetic neuropathy:
randomised double-blind controlled trial. Lancet 1998; 352: 1978
X
257. Fernandez et al. The 24 h blood pressure responses of hypertensives to a once-a-day cilazapril regimen. Can j Cardiol 1990; X
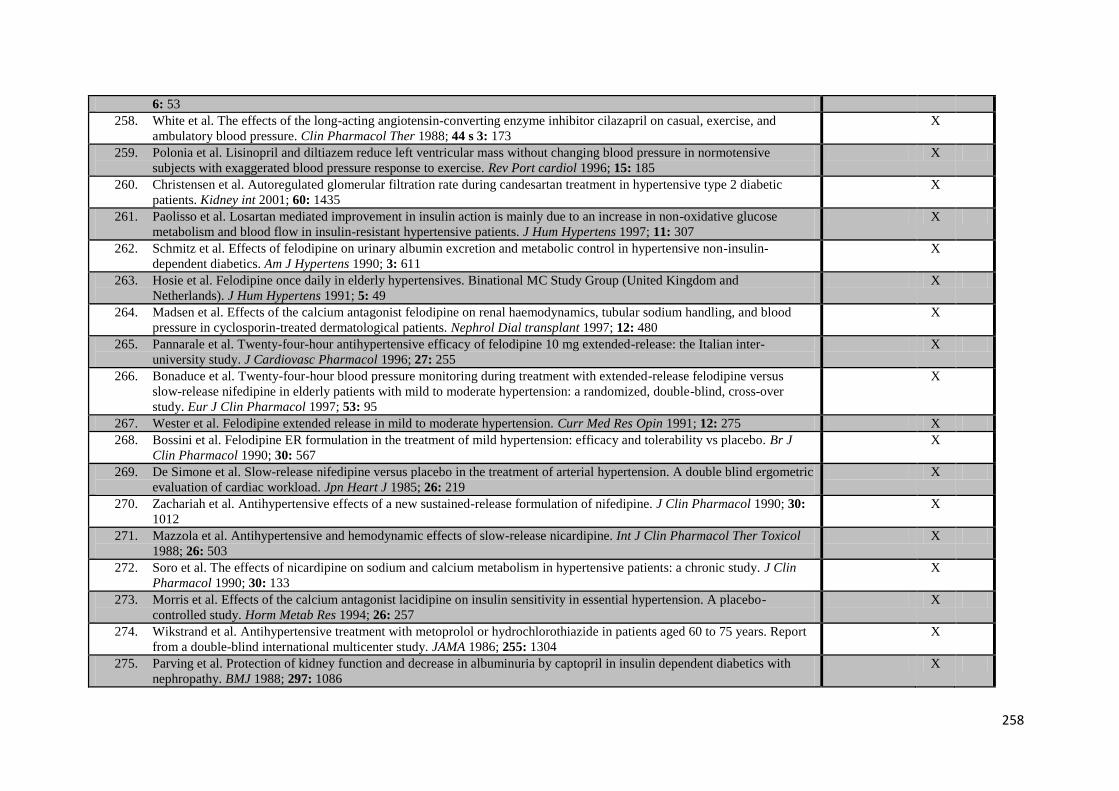
258
6: 53
258. White et al. The effects of the long-acting angiotensin-converting enzyme inhibitor cilazapril on casual, exercise, and
ambulatory blood pressure. Clin Pharmacol Ther 1988; 44 s 3: 173
X
259. Polonia et al. Lisinopril and diltiazem reduce left ventricular mass without changing blood pressure in normotensive
subjects with exaggerated blood pressure response to exercise. Rev Port cardiol 1996; 15: 185
X
260. Christensen et al. Autoregulated glomerular filtration rate during candesartan treatment in hypertensive type 2 diabetic
patients. Kidney int 2001; 60: 1435
X
261. Paolisso et al. Losartan mediated improvement in insulin action is mainly due to an increase in non-oxidative glucose
metabolism and blood flow in insulin-resistant hypertensive patients. J Hum Hypertens 1997; 11: 307
X
262. Schmitz et al. Effects of felodipine on urinary albumin excretion and metabolic control in hypertensive non-insulin-
dependent diabetics. Am J Hypertens 1990; 3: 611
X
263. Hosie et al. Felodipine once daily in elderly hypertensives. Binational MC Study Group (United Kingdom and
Netherlands). J Hum Hypertens 1991; 5: 49
X
264. Madsen et al. Effects of the calcium antagonist felodipine on renal haemodynamics, tubular sodium handling, and blood
pressure in cyclosporin-treated dermatological patients. Nephrol Dial transplant 1997; 12: 480
X
265. Pannarale et al. Twenty-four-hour antihypertensive efficacy of felodipine 10 mg extended-release: the Italian inter-
university study. J Cardiovasc Pharmacol 1996; 27: 255
X
266. Bonaduce et al. Twenty-four-hour blood pressure monitoring during treatment with extended-release felodipine versus
slow-release nifedipine in elderly patients with mild to moderate hypertension: a randomized, double-blind, cross-over
study. Eur J Clin Pharmacol 1997; 53: 95
X
267. Wester et al. Felodipine extended release in mild to moderate hypertension. Curr Med Res Opin 1991; 12: 275 X
268. Bossini et al. Felodipine ER formulation in the treatment of mild hypertension: efficacy and tolerability vs placebo. Br J
Clin Pharmacol 1990; 30: 567
X
269. De Simone et al. Slow-release nifedipine versus placebo in the treatment of arterial hypertension. A double blind ergometric
evaluation of cardiac workload. Jpn Heart J 1985; 26: 219
X
270. Zachariah et al. Antihypertensive effects of a new sustained-release formulation of nifedipine. J Clin Pharmacol 1990; 30:
1012
X
271. Mazzola et al. Antihypertensive and hemodynamic effects of slow-release nicardipine. Int J Clin Pharmacol Ther Toxicol
1988; 26: 503
X
272. Soro et al. The effects of nicardipine on sodium and calcium metabolism in hypertensive patients: a chronic study. J Clin
Pharmacol 1990; 30: 133
X
273. Morris et al. Effects of the calcium antagonist lacidipine on insulin sensitivity in essential hypertension. A placebo-
controlled study. Horm Metab Res 1994; 26: 257
X
274. Wikstrand et al. Antihypertensive treatment with metoprolol or hydrochlorothiazide in patients aged 60 to 75 years. Report
from a double-blind international multicenter study. JAMA 1986; 255: 1304
X
275. Parving et al. Protection of kidney function and decrease in albuminuria by captopril in insulin dependent diabetics with
nephropathy. BMJ 1988; 297: 1086
X
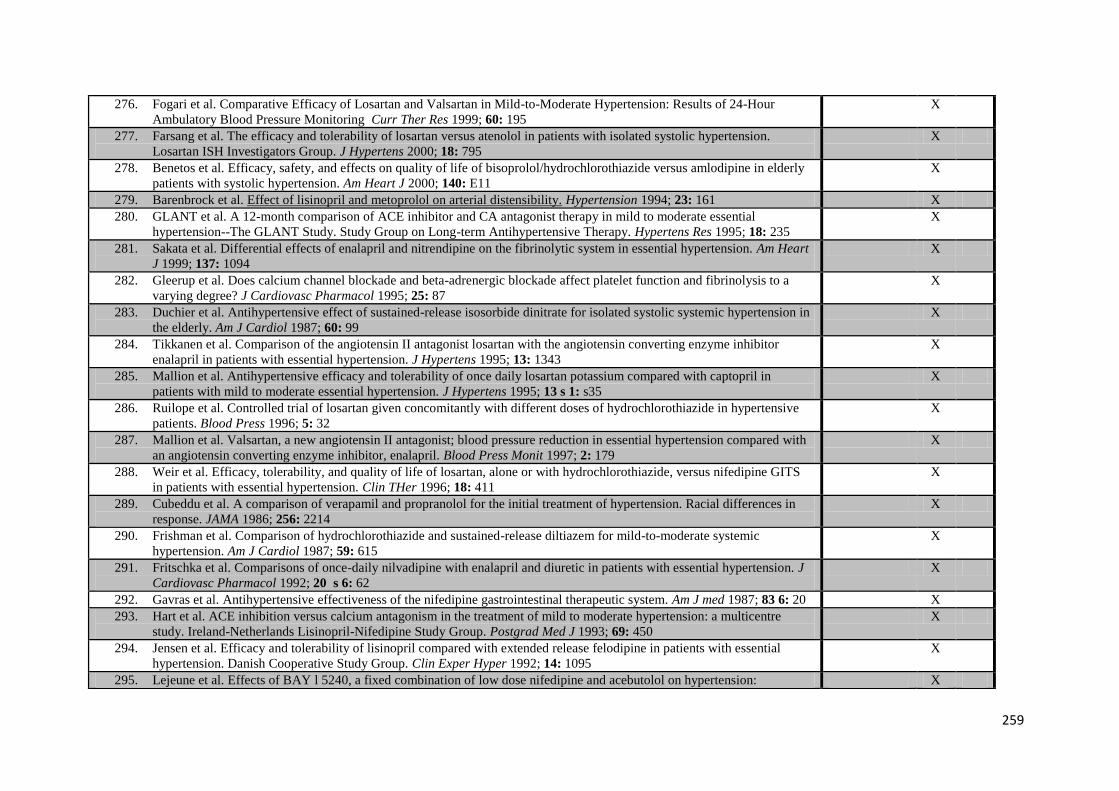
259
276. Fogari et al. Comparative Efficacy of Losartan and Valsartan in Mild-to-Moderate Hypertension: Results of 24-Hour
Ambulatory Blood Pressure Monitoring Curr Ther Res 1999; 60: 195
X
277. Farsang et al. The efficacy and tolerability of losartan versus atenolol in patients with isolated systolic hypertension.
Losartan ISH Investigators Group. J Hypertens 2000; 18: 795
X
278. Benetos et al. Efficacy, safety, and effects on quality of life of bisoprolol/hydrochlorothiazide versus amlodipine in elderly
patients with systolic hypertension. Am Heart J 2000; 140: E11
X
279. Barenbrock et al. Effect of lisinopril and metoprolol on arterial distensibility. Hypertension 1994; 23: 161 X
280. GLANT et al. A 12-month comparison of ACE inhibitor and CA antagonist therapy in mild to moderate essential
hypertension--The GLANT Study. Study Group on Long-term Antihypertensive Therapy. Hypertens Res 1995; 18: 235
X
281. Sakata et al. Differential effects of enalapril and nitrendipine on the fibrinolytic system in essential hypertension. Am Heart
J 1999; 137: 1094
X
282. Gleerup et al. Does calcium channel blockade and beta-adrenergic blockade affect platelet function and fibrinolysis to a
varying degree? J Cardiovasc Pharmacol 1995; 25: 87
X
283. Duchier et al. Antihypertensive effect of sustained-release isosorbide dinitrate for isolated systolic systemic hypertension in
the elderly. Am J Cardiol 1987; 60: 99
X
284. Tikkanen et al. Comparison of the angiotensin II antagonist losartan with the angiotensin converting enzyme inhibitor
enalapril in patients with essential hypertension. J Hypertens 1995; 13: 1343
X
285. Mallion et al. Antihypertensive efficacy and tolerability of once daily losartan potassium compared with captopril in
patients with mild to moderate essential hypertension. J Hypertens 1995; 13 s 1: s35
X
286. Ruilope et al. Controlled trial of losartan given concomitantly with different doses of hydrochlorothiazide in hypertensive
patients. Blood Press 1996; 5: 32
X
287. Mallion et al. Valsartan, a new angiotensin II antagonist; blood pressure reduction in essential hypertension compared with
an angiotensin converting enzyme inhibitor, enalapril. Blood Press Monit 1997; 2: 179
X
288. Weir et al. Efficacy, tolerability, and quality of life of losartan, alone or with hydrochlorothiazide, versus nifedipine GITS
in patients with essential hypertension. Clin THer 1996; 18: 411
X
289. Cubeddu et al. A comparison of verapamil and propranolol for the initial treatment of hypertension. Racial differences in
response. JAMA 1986; 256: 2214
X
290. Frishman et al. Comparison of hydrochlorothiazide and sustained-release diltiazem for mild-to-moderate systemic
hypertension. Am J Cardiol 1987; 59: 615
X
291. Fritschka et al. Comparisons of once-daily nilvadipine with enalapril and diuretic in patients with essential hypertension. J
Cardiovasc Pharmacol 1992; 20 s 6: 62
X
292. Gavras et al. Antihypertensive effectiveness of the nifedipine gastrointestinal therapeutic system. Am J med 1987; 83 6: 20 X
293. Hart et al. ACE inhibition versus calcium antagonism in the treatment of mild to moderate hypertension: a multicentre
study. Ireland-Netherlands Lisinopril-Nifedipine Study Group. Postgrad Med J 1993; 69: 450
X
294. Jensen et al. Efficacy and tolerability of lisinopril compared with extended release felodipine in patients with essential
hypertension. Danish Cooperative Study Group. Clin Exper Hyper 1992; 14: 1095
X
295. Lejeune et al. Effects of BAY l 5240, a fixed combination of low dose nifedipine and acebutolol on hypertension: X
260
comparison with standard dose nifedipine. Eur J Clin Pharmacol 1985; 28: 17
296. Leon et al. Efficacy and safety of enalapril versus extended-release nifedipine for the treatment of mild-to-moderate
essential hypertension: a multicenter 22-week study. Multicenter Cooperative Study Group. Clin Ther 1993; 15: 1094
X
297. Lessem et al. Long-term enalapril--a new converting enzyme inhibitor--in the treatment of mild to moderate essential
hypertension, results of a worldwide multiclinic study. Comparing two ways of analyzing data. Clin Exper Theory Pract
1985; A7: 1515
X
298. Rumboldt et al. Controlled multicentre comparison of captopril versus lisinopril in the treatment of mild-to-moderate
arterial hypertension. Int J Clin Pharmacol Res 1993; 13: 35
X
299. Seedat et al. A comparison of lisinopril and atenolol in black and Indian patients with mild-to-moderate essential
hypertension. S Afr Med J 1987; 71: 149
X
300. Stamler et al. Initial antihypertensive drug therapy--a comparison of alpha-blocker (prazosin) and diuretic
(hydrochlorothiazide). Brief summary of a randomized, controlled trial. Am J Med 1989; 86: 24
X
301. Aberg et al. Different long-term metabolic effects of enalapril and atenolol in patients with mild hypertension. EGTA
Group. J Hum Hypertens 1995; 9.2: 149
X
302. Agabiti-Rosei et al. Efficacy and tolerability of moexipril and nitrendipine in postmenopausal women with hypertension.
MADAM study group. Moexipril as Antihypertensive Drug After Menopause. Eur J Clin Pharmacol 1999; 55: 185
X
303. Albergati et al. Comparison of the effects of carvedilol and nifedipine in patients with essential hypertension and non-
insulin dependent diabetes mellitus. J Cardiovasc Pharmacol 1998; 19: 86
X
304. Catalano et al. Effects of treatment with verapamil SR and captopril on the lipid profile of hypertensive patients. Drugs
1992; 44: 88
X
305. Cheung et al. Fosinopril reduces left ventricular mass in untreated hypertensive patients: a controlled trial. Br J Clin
Pharmacol 1999; 47: 179
X
306. Clamp et al. Comparative trial of nifedipine retard and atenolol in the treatment of elderly patients with mild to moderate
hypertension. J Hum Hypertens 1990; 4: 557
X
307. Cleophas et al. Quality of life before and during antihypertensive treatment: a comparative study of celiprolol and atenolol.
Int J Clin Pharmacol ther 1996; 34: 312
X
308. Coca et al. A multicenter, parallel comparative study of the antihypertensive efficacy of once-daily lisinopril vs enalapril
with 24-h ambulatory blood pressure monitoring in essential hypertension. J Hum Hypertens 1996; 10: 837
X
309. Cosenzi et al. Doxazosin versus nitrendipine: a double-blind comparative study in patients adhering to a sodium-restricted
diet. Cardiovasc Drug Ther 1994; 8: 473
X
310. Dahlof et al. Effects of diltiazem and metoprolol on blood pressure, adverse symptoms and general well-being. The
Swedish Diltiazem-Metoprolol Multi-Centre Study Group. Eur J Clin Pharmacol 1991; 40: 453
X
311. De Cesaris et al. Effects of atenolol and enalapril on kidney function in hypertensive diabetic patients. J Cardiovasc
Pharmacol 1993; 22: 208
X
312. Dimenas et al. Comparison of CNS-related subjective symptoms in hypertensive patients treated with either a new
controlled release (CR/ZOK) formulation of metoprolol or atenolol. J Clin Pharmacol 1990; 30: 82
X
313. Distler et al. Clinical aspects of antihypertensive therapy with urapidil. Comparison with hydrochlorothiazide. Drugs 1990; X
261
40: 21
314. Duncan et al. Effect of intrinsic sympathomimetic activity on the ability of hypertensive patients to derive a
cardiorespiratory training effect during chronic beta-blockade. Am J Hypertens 1990; 3: 302
X
315. Enstrom et al. Comparison between enalapril and lisinopril in mild-moderate hypertension: a comprehensive model for
evaluation of drug efficacy. Blood Press 1992; 1: 102
X
316. Faust et al. The tolerability of nilvadipine compared to nifedipine in patients with essential hypertension. J Cardiovasc
Pharmacol 1992; 20: 56
X
317. Fogari et al. Effect of low-dose manidipine on ambulatory blood pressure in very elderly hypertensives. Cardiovasc Drug
Ther 1999; 13: 243
X
318. Forslund et al. Comparison of fosinopril and hydrochlorothiazide in patients with mild to moderate hypertension. J intern
Med 1991; 230: 511
X
319. Frimhodt-Moeller et al. Quality of life, side effects and efficacy of lisinopril compared with metoprolol in patients with
mild to moderate essential hypertension. J Hum Hypertens 1991; 5: 215
X
320. Fukiyama et al. A double-blind comparative study of doxazosin and prazosin in the treatment of essential hypertension. Am
Heart J 1991; 121: 317
X
321. Gambini et al. Acute and short-term effects of nitrendipine and diltiazem at rest and during exercise in hypertensive
patients. Clin Ther 1991; 13: 680
X
322. Gans et al. Effect of cilazapril on glucose tolerance and lipid profile in hypertensive patients with non-insulin-dependent
diabetes mellitus. Neth J Med 1993; 43: 3
X
323. Garca et al. Hydrochlorothiazide versus spironolactone: long-term metabolic modifications in patients with essential
hypertension J Clin Pharmacol 1991; 31: 455
X
324. Habte et al. The efficacy of hydrochlorothiazide, timolol and enalapril in Ethiopians with essential hypertension. Ethiop
Med J 1992; 30: 163
X
325. Havinga et al. Captopril compared to atenolol in mild to moderate hypertension in a randomized double-blind controlled
trial. Neth J Med 1991; 38: 13
X
326. Isles et al. A randomised double-blind study comparing nifedipine GITS 20 mg and bendrofluazide 2.5 mg administered
once daily in mild-to-moderate hypertension. J Hum Hypertens 1999; 13: 69
X
327. Klein et al. A double-blind comparison of metoprolol CR/ZOK 50 mg and atenolol 50 mg once daily for uncomplicated
hypertension. J Clin Pharmacol 1990; 30: 72
X
328. Lacourciere et al. Comparison of amlodipine and captopril in hypertension based on 24-hour ambulatory monitoring. J
Cardiovasc Pharmacol 1993; 22: 20
X
329. Lefebvre et al. Comparative effects of felodipine ER, amlodipine and nifedipine GITS on 24 h blood pressure control and
trough to peak ratios in mild to moderate ambulatory hypertension: a forced titration study. Can j Cardiol 1998; 14: 682
X
330. Lopez et al. Nitrendipine and atenolol in essential hypertension in young and middle-aged patients: effect on serum lipids
and left ventricular mass. J Cardiovasc Pharmacol 1991; 18: 101
X
331. Malatino et al. Comparison of ketanserin and enalapril in the treatment of mild-to-moderate essential hypertension.
Cardiovasc Drug Ther 1990; 4: 123
X
262
332. Mounier-Vehier et al. Compliance and antihypertensive efficacy of amlodipine compared with nifedipine slow-release. Am
J Hypertens 1998; 11: 478
X
333. Murdoch et al. A comparative trial of lisinopril and nifedipine in mild to moderate hypertension in general practice. NZ Med
J 1992; 105: 260
X
334. O'Donnell et al. Comparison of the effects of an angiotensin converting enzyme inhibitor and a calcium antagonist in
hypertensive, macroproteinuric diabetic patients: a randomised double-blind study. J Hum Hypertens 1993; 7: 333
X
335. Palermo et al. Nitrendipine once daily compared with nicardipine in the treatment of mild to moderate hypertension. Clin
Ther 1990; 12: 149
X
336. Pannarale et al. Effects of slow-release verapamil and nitrendipine on office and 24-hour ambulatory blood pressure in
hypertensive patients. J Cardiovasc Pharmacol 1992; 19: 53
X
337. Poncelet et al. A double-blind, randomized, comparative study of nitrendipine and enalapril in elderly hypertensive patients.
J Cardiovasc Pharmacol 1991; 18: 67
X
338. Radevski et al. Antihypertensive monotherapy with nisoldipine CC is superior to enalapril in black patients with severe
hypertension. Am J hypertens 1999; 12: 194
X
339. Sadowski et al. Regression of left ventricular hypertrophy in hypertensive patients after 1 year of treatment with
rilmenidine: a double-blind, randomized, controlled (versus nifedipine) study. J Hypertens Suppl 1998; 16: 55
X
340. Salako et al. Evaluation of lacidipine (a calcium blocker) in the treatment of hypertension in black African people: a double-
blind comparison with hydrochlorothiazide. Afr J Med Sci 1998; 27: 73
X
341. Sambol et al. Effect of hydrochlorothiazide 25 mg/day on essential hypertension. Clin Pharm 1990; 9: 873 X
342. Schmieder et al. Obesity as a determinant for response to antihypertensive treatment. BMJ 1993; 307: 537 X
343. Smith et al. Once-daily monotherapy with trandolapril in the treatment of hypertension. J Hum Hypertens 1996; 10: 129 X
344. Tan et al. Efficacy and tolerability of doxazosin versus enalapril in the treatment of patients with mild-to-moderate
hypertension. Clin Ther 1997; 19: 459
X
345. Tedesco et al. Effects of losartan on hypertension and left ventricular mass: a long-term study. J Hum Hypertens 1998; 12:
505
X
346. Trenkwalder et al. Antihypertensive treatment with candesartan cilexetil does not affect glucose homeostasis or serum lipid
profile in patients with mild hypertension and type II diabetes. Blood Press 1998; 7: 170
X
347. Vyssoulis et al. Left ventricular and aortic root structure and function changes with beta blocker antihypertensive therapy. A
one-year double blind study of celiprolol and metoprolol. Int J Cardiol 1995; 49: 45
X
348. Wang et al. Parrallel comparative trial of amlodipine and nitrendipine monotherapy in patients with essential hypertension.
J Hypertens Suppl 1998; 16: 43
X
349. Weir et al. Efficacy and tolerability of enalapril and sustained-release verapamil in older patients with mild to moderate
essential hypertension. Clin Ther 1990; 12: 139
X
350. Bjorck et al. Contrasting effects of enalapril and metoprolol on proteinuria in diabetic nephropathy. BMJ 1990; 300: 904 X
351. Mathiesen et al. Efficacy of captopril in postponing nephropathy in normotensive insulin dependent diabetic patients with
microalbuminuria. BMJ 1991; 303: 81
X
352. Cruickshank et al. Treating hypertension in black compared with white non-insulin dependent diabetics: a double blind trial X
263
of verapamil and metoprolol. BMJ 1988; 297: 1155
353. Chellingsworth et al. The effects of verapamil, diltiazem, nifedipine and propranolol on metabolic control in hypertensives
with non-insulin dependent diabetes mellitus. J Hum Hypertens 1989; 3: 35
X
354. Capewell et al. A trial of the calcium antagonist felodipine in hypertensive type 2 diabetic patients. Diabetic Med 1989; 6:
809
X
355. Frishman et al. Multicenter comparison of the nifedipine gastrointestinal therapeutic system and long-acting propranolol in
patients with mild to moderate systemic hypertension receiving diuretics. A preliminary experience. Am J Med 1987; 83: 15
X
356. Apperloo et al. Differential effects of enalapril and atenolol on proteinuria and renal haemodynamics in non-diabetic renal
disease. BMJ 1991; 303: 821
X
357. Romero et al. Comparative effects of captopril versus nifedipine on proteinuria and renal function of type 2 diabetic
patients. Diab Res Clin Pract 1992; 17: 191
X
358. Tettamanti et al. Effects of ramipril (R) and Nitrendipine (N) on proteinuria in hypetensive patients with albuminuric
NIDDM. J Hypertens 1992; 10S4: 102
X
359. Romero et al. Renal function changes in microalbuminuric normotensive type II diabetic patients treated with angiotensin-
converting enzyme inhibitors. Diabetes Care 1993; 16: 597
X
360. Stornello et al. Persistent albuminuria in normotensive non-insulin-dependent (type II) diabetic patients: comparative effects
of angiotensin-converting enzyme inhibitors and beta-adrenoceptor blockers. Clin Sci 1992; 82: 19
X
361. Flack et al. Regression of microalbuminuria: results of a controlled study, indapamide versus captopril. J Cardiovasc
Pharmacol 1993; 22s6: 75
X
362. Norgaard et al. A comparison of spirapril and isradipine in patients with diabetic nephropathy and hypertension. Blood
Press 1993; 2: 301
X
363. Kreeft et al. Comparative trial of indapamide and hydrochlorothiazide in essential hypertension, with forearm
plethysmography. J Cardiovasc Pharmacol 1984; 6: 622
X
364. Lehtonen et al. Comparison of sustained release verapamil and hydrochlorothiazide in hypertension--effect on blood
pressure and metabolic variables. Int J Clin Pharmacol Ther Toxicol 1987; 25: 301
X
365. Lacourciere et al. Influence of zofenopril and low doses of hydrochlorothiazide on plasma lipoproteins in patients with mild
to moderate essential hypertension. Am J Hypertens 1989; 2: 861
X
366. Johnson et al. The effects of thiazide diuretics upon plasma lipoproteins. J Hypertens 1986; 4: 235 X
367. Zuchelli et al. Comparison of the effects of ACE inhibitors and calcium channel blockers on the progression of renal failure.
Nephrol Dial Tranplant 1995; 10: 46
X
368. Dittrich et al. Effects of sustained-release nicardipine on regression of left ventricular hypertrophy in systemic hypertension.
Am J Cardiol 1992; 69: 1559
X
369. Genovesi-ebert et al. Effect of a new multifactorial antihypertensive on heart morphology and function in mild to moderate
essential arterial hypertension. Eur Heart J 1992; 13A: 45
X
370. Grandi et al. Double-blind comparison of perindopril and captopril in hypertension. Effects on left ventricular morphology
and function. Am J Hypertens 1991; 4: 516
X
371. Licata et al. Medium-term double-blind study of indenolol in hypertensive patients: clinical hemodynamic, and X
264
echocardiographic correlates. Curr Ther Res 1989; 46: 103
372. Otterstad et al. Changes in left ventricular dimensions and systolic function in 100 mildly hypertensive men during one
year's treatment with atenolol vs. hydrochlorothiazide and amiloride (Moduretic): a double-blind, randomized study. J
intern Med 1992; 231: 493
X
373. Leonetti et al. Effects of blood pressure reduction with trandolapril and enalapril on left ventricular hypertrophy and
exercise tolerance. J Hypertens 1993; 11: 5356
X
374. Bergstrand et al. Comparative study of metoprolol and alpha-methyldopa in untreated essential hypertension Eur J Clin
Pharmacol 1976; 10: 375
X
375. Sassano et al. Treatment of mild to moderate hypertension with or without the converting enzyme inhibitor enalapril.
Results of a six-month double-blind trial. Am J Med 1987; 83: 227
X
376. Fogari et al. Angiotensin II receptor antagonist telmisartan in isolated systolic hypertension (ARAMIS) study: efficacy and
safety of telmisartan 20, 40 or 80 mg versus hydrochlorothiazide 12.5 mg or placebo. Curr Ther Res 2001; 62.1: 68
X
377. Schoenberger et al. [Cilazapril in essential hypertension. A placebo-controlled double-blind study to establish the dosage] J
Hypertens 1995; 13.1: 43
X
378. Belz et al. [Cilazapril in essential hypertension. A placebo-controlled double-blind study to establish the dosage]
Medizinische Klinik 1986; 81: 524
X
379. Pizarro et al. Placebo-controlled comparison of the efficacy and tolerability of once-daily moxonidine and enalapril in mild
to moderate essential hypertension. Revista Portuguesa de Cardiologia 1996; 15.6: 495
X
380. Prichard et al. Placebo-controlled comparison of the efficacy and tolerability of once-daily moxonidine and enalapril in
mild to moderate essential hypertension.[Article in German] Blood Press 2002; 11.3: 166
X
381. Trevisan et al. Effects of moderate salt restriction alone and in combination with cilazapril on office and ambulatory blood
pressure. Am J Hypertens 1995; 8.9: 876
X
382. Uusitupa et al. Dose finding studies with imidapril--a new ACE inhibitor. J Hum Hypertens 1996; 10.5: 319 X
383. O'Hare et al. Low-dose ramipril reduces microalbuminuria in type 1 diabetic patients without hypertension: results of a
randomized controlled trial. Diab Care 2000; 23 (12): 1823
X
384. Bojestig et al. Reduction of ACE activity is insufficient to decrease microalbuminuria in normotensive patients with type 1
diabetes. Diab Care 2001; 24: 919
X
385. Ko et al. Stabilization and regression of albuminuria in Chinese patients with type 2 diabetes: a one-year randomized study
of valsartan versus enalapril. Adv Ther 2005; 22: 155
X
386. Poulsen et al. Lisinopril reduces albuminuria during exercise in low grade microalbuminuric type 1 diabetic patients: a
double blind randomized study. J Int med 2001; 249: 433
X
387. Rizzoni et al. Effect of treatment with candesartan or enalapril on subcutaneous small artery structure in hypertensive
patients with noninsulin-dependent diabetes mellitus. Hypertension 2005; 45: 659
X
388. Tan et al. Effects of angiotensin II receptor antagonist on endothelial vasomotor function and urinary albumin excretion in
type 2 diabetic patients with microalbuminuria Diab/Metab Res rev 2002; 18: 71
X
389. Tutuncu et al. Efficacy of ACE inhibitors and ATII receptor blockers in patients with microalbuminuria: a prospective
study. Acta Diabet 2001; 38: 157
X
265
390. Yusuf et al for the PROFESS study group. Telmisartan to prevent recurrent stroke and cardiovascular events. N Engl J Med.
2008; 359 (12): 1225-37.
X
391. The Telmisartan Randomised AssessmeNt Study in ACE iNtolerant subjects with Cardiovascular Disease (TRANSCEND)
Investigators. Effects of the angiotensin-receptor blocker telmisartan on cardiovascular events in high-risk patients
intolerant to angiotensin-converting enzyme inhibitors: a randomised controlled trial. Lancet. 2008; 372: 1174-83.
X
392. Jamerson K et al. Benazepril plus amlodipine or hydrochlorothiazide for hypertension in high risk patients. N Engl J Med.
2008; 359: 2417-18.
X
393. Wright JT et al. Successful blood pressure control in the African American Study of Kidney disease and hypertension.
Arch Inter Med. 2002; 162: 1636-1643.
X
394. Estacio RO et al. The effect of nisoldipine as compared with enalapril on cardiovascular outcomes in patients with non-
insulin-dependent diabetes and hypertension. N Engl J Med. 1998; 338: 645-52.
X
395. Schrier RW et al. Effects of aggressive blood pressure control in normotensive type 2 diabetic patients on albuminuria,
retinopathy and strokes. Kidney International. Kidney International. 2002; 61: 1086-97.
X
396. Poole-Wilson P et al. Effect of long-acting nifedipine on mortality and cardiovascular morbidity in patients with stable
angina requiring treatment (ACTION trial): a randomised controlled trial. Lancet. 2004; 364: 849-57.
X
397. ADVANCE Collaborative Group et al. Effects of a fixed combination of perindopril and indapamide on macrovascular and
microvascular outcomes in patients with type 2 diabetes mellitus (the ADVANCE trial): a randomised controlled trial.
Lancet. 2007; 370: 829-40.
X
398. Wing LMH et al. A comparison of outcomes with angiotensin-converting-enzyme inhibitors and diuretics for hypertension
in the elderly. N Engl J Med. 2003; 348: 583-92.
X
399. Management Committee et al. The Australian therapeutic trial in mild hypertension. Lancet. 1980; 1: 1261-1266. X
400. Poulter NR et al. Role of blood pressure and other variables in the differential cardiovascular event rates noted in the
Anglo-Scandinavian Cardiac Outcomes Trial-Blood Pressure Lowering Arm (ASCOT-BPLA). Lancet. 2005; 366: 907-
913.
X
401. Esnault VLM et al. The effects of amlodipine and enalapril on renal function in adults with hypertension and nondiabetic
nephropathies: a 3-year, randomized, multicenter, double-blind, placebo-controlled study. Clin Ther. 2008; 30: 482-98.
X
402. Hedblad B et al. Low-dose metoprolol CR/XL and fluvastatin slow progression of carotid intima-media thickness.
Circulation. 2001; 103: 1721-1726.
X
403. Hansson L et al. Effect of angiotensin-converting-enzyme inhibition compared with conventional therapy on
cardiovascular morbidity and mortality in hypertension: the Captopril Prevention Project (CAPPP) randomised trial.
Lancet. 1999; 353: 611-16.
X
266
404. Black HR et al. Principal results of the Controlled Onset Verapamil Investigation of Cardiovascular End Points
(CONVINCE) trial. JAMA. 2003; 289: 2073-2082.
X
405. Coope J et al. Randomised trial of hypertension in elderly patients in primary care. BMJ. 1986; 293: 1145-1148. X
406. Barnett AH et al. Angiotensin-receptor blockade versus converting-enzyme inhibition in type 2 diabetes and nephropathy.
N Engl J Med. 2004; 351: 1952-61.
X
407. Marre M et al. Effects of low dose ramipril on cardiovascular and renal outcomes in patients with type 2 diabetes and
raised excretion of urinary albumin: randomised, double blind, placebo controlled trial (the DIABHYCAR study). BMJ.
2004; 328: 495-500.
X
408. The DREAM Trial Investigators et al. Effect of ramipril on the incidence of diabetes. N Engl J Med. 2006; 355: 1551-62. X
409. The Dutch TIA Trial Study Group et al. Trial of secondary prevention with atenolol after transient ischaemic attack or
nondisabling stroke. Stroke. 1993; 24: 543-548.
X
410. Zanchetti A et al. Calcium antagonist lacidipine slows down progression of asymptomatic carotid atherosclerosis: principal
results of the European Lacidipine Study on Atherosclerosis (ELSA), a randomized, double-blind, long-term trial.
Circulation. 2002; 106: 2422-2427.
X
411. Marfin R et al. on behalf of the investigators of the ESPIRAL Study. J Hypertens. 2001; 19: 1871-1876.
412. The EUCLID study group et al. Randomised controlled trial of Lisinopril in normotensive patients with insulin-dependent
diabetes and normalbuminuria or microalbuminuria. Lancet. 1997; 349: 1787-1792.
X
413. The EURopean trial On Reduction of cardiac events with Perindopril in stable coronary Artery disease Investigators et al.
Efficacy of perindopril in reduction of cardiovascular events among patients with stable coronary artery disease:
randomised, double-blind, placebo-controlled, multi-centre trial (the EUROPA study). Lancet. 2003; 362: 782-88.
X
414. Amery A et al. Mortality and morbidity results from the European Working Party on High blood pressure in the Elderly
trial. Lancet. 1985; 15: 1349-1354.
X
415. Tatti P et al. Outcome results of the Fosinopril versus Amlodipine Cardiovascular Events randomized Trail (FACET) in
patients with hypertension and NIDDM. Diabetes care. 1998; 21: 597-603.
X
416. Zannad F et al. Prevention of cardiovascular events in end-stage renal disease: results of a randomized trial of fosinopril
and implications for future studies. Kidney International. Kidney International. 2006; 70: 1318-1324.
X
417. Hypertension Detection and Follow-up Program Cooperative Group et al. Five-year findings of the Hypertension Detection
and Follow-up Program. JAMA.1979 1979; 242 2562-2571.
X
418. Himmelmann A et al. ACE inhibition preserves renal function better than b-blockade in the treatment of essential
hypertension. Blood Pressure. 1995; 4: 85-90.
X
267
419. The Heart Outcomes Prevention Evaluation Study Investigators et al. Effects of an angiotensin-converting-enzyme
inhibitor, ramipril, on cardiovascular events in high-risk patients. N Engl J Med. 2000; 342: 145-53.
X
420. Hypertension-Stroke Cooperative Study Group et al. Effect of antihypertensive treatment on stroke recurrence. JAMA.
1974; 229: 409-18.
X
421. Beckett NS et al. Treatment of hypertension in patients 80 years of age or older. N Engl J Med. 2008; 358: 1887-1898. X
422. Lewis EJ et al. Renoprotective effect of the angiotensin-receptor antagonist irbesartan in patients with nephropathy due to
type 2 diabetes. N Engl J Med. 2001; 345: 851-60.
X
423. Brown MJ et al. Morbidity and mortality in patients randomised to double-blind treatment with a long-acting calcium-
channel blocker or diuretic in the International Nifedipine GITS Study: Intervention as a Goal in HyperTension.
(INSIGHT). Lancet. 2000; 356: 366-72.
X
424. Parving HH et al. The effect of irbesartan on the development of diabetic nephropathy in patients with type 2 diabetes. N
Engl J Med. 2001; 345: 870-8.
X
425. Yui Y et al. Comparison of nifedipine retard with angiotensin converting enzyme inhibitors in Japanese hypertensive
patients with coronary artery disease: the Japan Multicentre Investigation for Cardiovascular diseases-B (JMIC-B).
Hypertens Res. 2004; 27: 181-191.
X
426. Baba S et al. Nifedipine and Enalapril equally reduce the progression of nephropathy in hypertensive type 2 diabetics.
Diabetes Res Clin Pract. Diabetes Res Clin Pract. 2001; 54: 191-201.
X
427. Ludwig M et al. Comparison of the effects of losartan and atenolol on common carotid artery intima-media thickness in
patients with hypertension: results of a 2-year, double-blind, randomized, controlled study. Clin Ther. 2002; 24: 1175-
1193.
X
428. Maschio G et al. and the angiotensive-converting-enzyme inhibition in progressive renal insufficiency study group. N Engl
J Med. 1996; 334: 939-945.
X
429. Borhani NO et al. Final outcome results of the Multicenter Isradipine Diuretic Atherosclerosis Study (MIDAS). JAMA.
1996; 276: 785-791.
X
430. Medical Research Council Working Party et al. MRC trial of treatment of mild hypertension: principal results. BMJ. 1985;
291: 97-104.
X
431. MRC Working Party et al. Medical Research Council trial of treatment of hypertension in older adults: principal results.
BMJ. 1992; 304: 405-12.
X
432. Dens AJ et al. Usefulness of nisoldipine for prevention of restenosis after percutaneous transluminal coronary angioplasty
(results of the NICOLE study). Am J Cardiol. 2001; 87: 28-33.
X
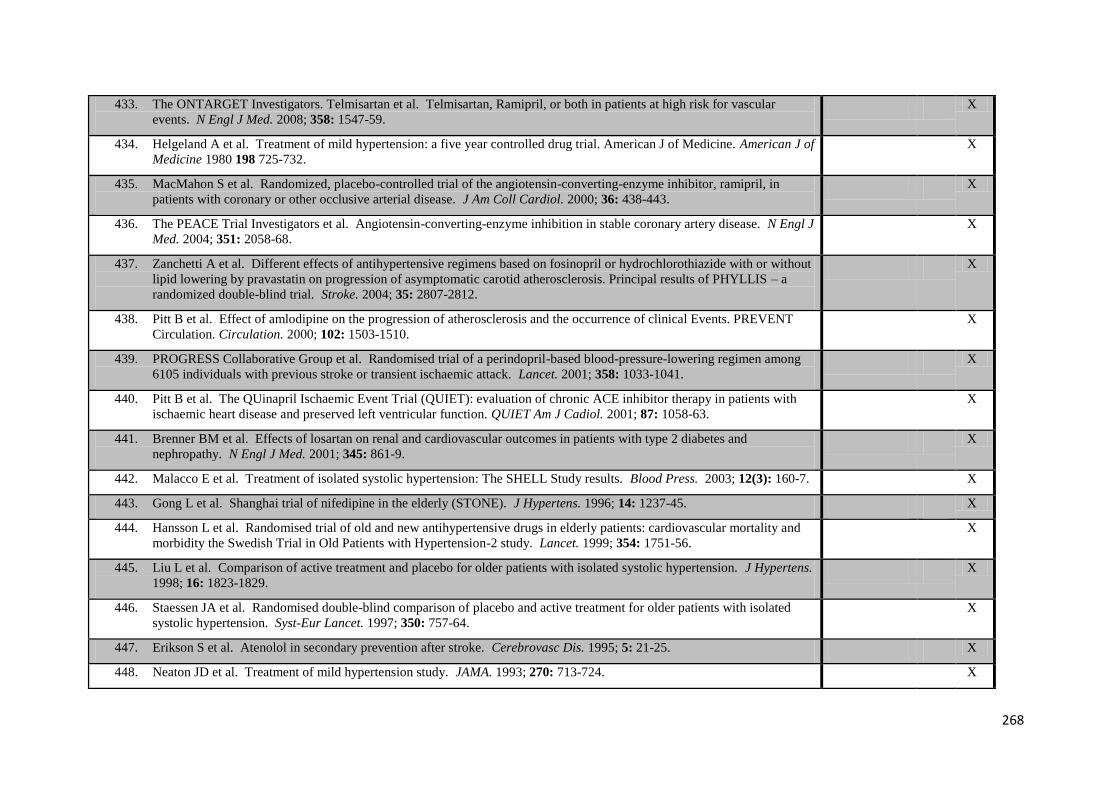
268
433. The ONTARGET Investigators. Telmisartan et al. Telmisartan, Ramipril, or both in patients at high risk for vascular
events. N Engl J Med. 2008; 358: 1547-59.
X
434. Helgeland A et al. Treatment of mild hypertension: a five year controlled drug trial. American J of Medicine. American J of
Medicine 1980 198 725-732.
X
435. MacMahon S et al. Randomized, placebo-controlled trial of the angiotensin-converting-enzyme inhibitor, ramipril, in
patients with coronary or other occlusive arterial disease. J Am Coll Cardiol. 2000; 36: 438-443.
X
436. The PEACE Trial Investigators et al. Angiotensin-converting-enzyme inhibition in stable coronary artery disease. N Engl J
Med. 2004; 351: 2058-68.
X
437. Zanchetti A et al. Different effects of antihypertensive regimens based on fosinopril or hydrochlorothiazide with or without
lipid lowering by pravastatin on progression of asymptomatic carotid atherosclerosis. Principal results of PHYLLIS – a
randomized double-blind trial. Stroke. 2004; 35: 2807-2812.
X
438. Pitt B et al. Effect of amlodipine on the progression of atherosclerosis and the occurrence of clinical Events. PREVENT
Circulation. Circulation. 2000; 102: 1503-1510.
X
439. PROGRESS Collaborative Group et al. Randomised trial of a perindopril-based blood-pressure-lowering regimen among
6105 individuals with previous stroke or transient ischaemic attack. Lancet. 2001; 358: 1033-1041.
X
440. Pitt B et al. The QUinapril Ischaemic Event Trial (QUIET): evaluation of chronic ACE inhibitor therapy in patients with
ischaemic heart disease and preserved left ventricular function. QUIET Am J Cadiol. 2001; 87: 1058-63.
X
441. Brenner BM et al. Effects of losartan on renal and cardiovascular outcomes in patients with type 2 diabetes and
nephropathy. N Engl J Med. 2001; 345: 861-9.
X
442. Malacco E et al. Treatment of isolated systolic hypertension: The SHELL Study results. Blood Press. 2003; 12(3): 160-7. X
443. Gong L et al. Shanghai trial of nifedipine in the elderly (STONE). J Hypertens. 1996; 14: 1237-45. X
444. Hansson L et al. Randomised trial of old and new antihypertensive drugs in elderly patients: cardiovascular mortality and
morbidity the Swedish Trial in Old Patients with Hypertension-2 study. Lancet. 1999; 354: 1751-56.
X
445. Liu L et al. Comparison of active treatment and placebo for older patients with isolated systolic hypertension. J Hypertens.
1998; 16: 1823-1829.
X
446. Staessen JA et al. Randomised double-blind comparison of placebo and active treatment for older patients with isolated
systolic hypertension. Syst-Eur Lancet. 1997; 350: 757-64.
X
447. Erikson S et al. Atenolol in secondary prevention after stroke. Cerebrovasc Dis. 1995; 5: 21-25. X
448. Neaton JD et al. Treatment of mild hypertension study. JAMA. 1993; 270: 713-724. X

269
449. Julius S et al. for the Trial of Preventing Hypertension (TROPHY) study investigators. N Engl J Med. 2006; 354: 1685-
1697.
X
450. Veterans administration cooperative study group on antihypertensive agents et al. Effects of treatment on morbidity in
hypertension. JAMA. 1970; 213: 1143-1152.
X
451. Materson BJ et al. for the department of Veterans Affairs Cooperative Study group on antihypertensive agents. N Engl J
Med. 1993; 328: 914-921.
X
452. Perry HM et al. Treatment of mild hypertension. Preliminary results of a two-year feasibility trial. Circ Res. 1977; 40:
I180-187.
X
453. Rosei EA et al. Clinical results of the Verapamil in Hypertension and Atherosclerosis Study. Journal of Hypertension.
Journal of Hypertension. 1997; 15: 1337-1344.
X
454. Yurenev AP et al. Management of essential hypertension in patients with different degrees of left ventricular hypertrophy.
Multicenter trial. Am J Hypertens. 1992; 5: 182S-189S
X
270
APPENDIX FIVE
Protocol version 4: 13/11/12
A study of the association between blood pressure variability, blood pressure control and clinical outcomes in patients with transient ischaemic attack or strokes
Alastair Webb, Jonathan Diesch, Peter M. Rothwell Background Blood pressure variability and stroke: Blood pressure (BP), particularly systolic blood pressure (SBP), is the most powerful risk factor for ischemic stroke.1,2,3 Lowering BP is highly effective in preventing stroke in both primary prevention4 and in the medium- and long-term after a transient ischemic attack.5
We recently showed that patients with episodic hypertension have a high risk of vascular events,6,7 that residual visit-to-visit variability in blood pressure (BP) on treatment has a poor prognosis despite good control of mean BP,6,7 and that benefits of some antihypertensive drugs are due partly to reduced variability in SBP.8,9 Variability in SBP is reduced by calcium channel blockers (CCBs), less so by diuretics and increased by beta-blockers, explaining class differences in effects on stroke risk in randomized controlled trials (RCTs).8,9 Furthermore, variability of BP measurements are increased in patients with prior cerebrovascular disease.10 Screening for hypertension based on a single measurement can be misleading and estimates of the prevalence of hypertension can be biased if appropriate correction for within-person variability is not made. Measurements obtained from 24-hour ambulatory BP monitoring can reduce the effects of short-term (daily) variation,11 but there are also important medium-term (within weeks or months) components of variability in patients with a previous TIA or stroke.10 There is some evidence that within-person variation in BP increases with age and tends to be high in patients with widespread atherosclerosis.14
These groups are of particular clinical importance because they are at a high risk of stroke and coronary events. Autonomic cardiovascular system and stroke: BP regulation is maintained by the autonomic nervous system. One of the most important mechanisms in the regulation of the autonomic cardiovascular system is the baroreceptor reflex arc, which includes peripheral afferent (aortic and carotid baroreceptors) and efferent (vagal and sympathetic tone) as well as central mechanisms (brain stem and higher cerebral centers).15,16 Baroreflex function, expressed as Baroreflex sensitivity (BRS), has been reported to be an important determinant of cardiac death after acute myocardial infarction.17 There is also evidence of abnormal BRS in animal models of stroke16,18 and in patients with chronic cerebrovascular diseases.19,20 Furthermore it was found that BRS was impaired after acute stroke, and that poststroke patients with impaired BRS had a poor prognosis.15,21 However, data about BRS in patients with TIA and minor strokes are lacking. Blood pressure variability and autonomic cardiovascular system: High BP variability might reflect an impairment of central control of the autonomic cardiovascular system. This can be tested by stimulation of the sympathetic nervous system. For example, BP and heart rate responses to a stress test (cold pressor test, CPT) in patients with a coronary artery disease were significantly larger than in matched controls.22 Therefore the question arises, whether patients with minor strokes and TIA with high BP variability show a higher increase in their BP after CPT or mental arithmetic than patients without high BP variability. High sympathetic nervous system activity can raise the BP significantly. It is a well known phenomenon that in the acute phase after TIA or minor stroke BP is often high. Until now this so-called “post-stroke hypertension” has been assumed to be a physiological response to stroke, perhaps aimed at improving cerebral
271
perfusion. However, the hypothesis resulting from our recent work is that the BP rise precedes and is, in fact, in many cases the cause of the TIA or stroke rather than the consequence. Therefore patients with a high BP variability with occasionally high BP values might be at much higher risk of stroke in both the primary and secondary preventing settings. Measuring short- and medium-term variability in BP requires many consecutive BP measurements over weeks and months. A simple and reliable tool - such as the measurement of BRS or the CPT - reflecting BP variability in short- and medium-term is lacking. These simple tests of autonomic cardiovascular function may help selecting patients at high risk for recurrent ischemic events and may therefore influence primary and secondary prevention strategies. Furthermore, showing that patients who display a rapid rise in BP during CPT have a higher risk of stroke at long-term follow-up would support the evidence, that high BP in patients with an acute TIA or stroke was the cause of the stroke and not vice versa. Hypothesis and objectives This project aims to test the hypothesis that patients with a TIA and stroke with high short- and medium-term BP variability have a more impaired autonomic function than patients with a low BP variability. Impaired autonomic function is defined as impaired cardiac BRS and as an excessive cardiovascular response to a stress test (CPT). Since arterial stiffness and vascular reactivity influence BP variability as well, arterial stiffness and vascular reactivity will also be assessed. Primary Objective: The primary objective of this study is to establish whether a link exists between short- and medium-term BP variability; furthermore we want to assess, whether there is a link between short- and medium-term BP variability and impaired autonomic cardiovascular function in patients with a TIA or minor stroke. Secondary Objective: The secondary objective is to test whether patients with a TIA or minor stroke with a high BP variability and and/or an impaired autonomic cardiovascular function have a greater risk of recurrent ischemic events during long-term follow-up than patients with a low BP variability and/or normal autonomic cardiovascular function. Study Design Eligibility and Recruitment 500 participants will be identified from patients recruited to the Oxford Vascular Study with a suspected TIA or stroke. This study provides rapid assessment, investigation and treatment for nine GP practices in Oxfordshire (pop 91,500). Patients are seen at the West Wing Out-patients Department at the John Radcliffe Hospital if directly referred, usually in the first 24 hours after symptom onset, or are recruited following admission to hospital. All patients are followed-up after one month, six months, one year and five years. As part of the daily clinical practice, patients directly referred to the OXVASC clinic are currently measuring their BP with a monitor at home three times a day (morning, mid-morning and evening) during the first month after their event. Twenty-four-hours BP monitoring is also done as part of the clinical routine one month after the event. Physiological assessments will be accomplished through close cooperation between the OXVASC Clinic (Prof Peter Rothwell and colleagues) and the Department of Cardiovascular Medicine, and will be performed in the new Cardiovascular Clinical
272
Research Facility at the JR Hospital, by Jonathan Diesch, the vascular scientist employed by the CCRF. The eligibility criteria are as follows: 1. Recruited to the OXVASC study in the month after a TIA or ischaemic stroke. 2. Written informed consent. The following patients will be excluded from the study: 1. Inability to give informed consent. 2. Recent myocardial infarction (in the last month) or unstable angina pectoris. 3. Severe cardiac heart failure (NYHA 3-4, EF<40%) 4. Bilateral severe stenosis of the carotid arteries prior to carotid endarterectomy.
The following patients will be exclude from CPT and mental arithmetic tests: 1. Very high blood pressure (>180/110 mmHg).
The following patients will be excluded from the analysis of baroreceptor sensitivity: 1. Patients with atrial fibrillation . 2. Patients with a history of severe diabetes mellitus. 3. Patients with an impaired renal function (creatinine >200 umol/L). 4. Patients with other conditions with autonomic failure (e.g.: Parkinson’s disease) The following patients will be excluded from the assessment of pulse wave velocity: 1. Severe (>50%) or recently symptomatic carotid stenosis on that side. Assessing clinical and radiographic data Clinical and radiological data and stroke aetiology are assessed in all patients with an ischemic stroke and transient ischemic attack in the ongoing OXVASC study. Assessing short-term BP variability 24-hours BP monitoring will be assessed with the use of a Spacelabs recorder on the occasion of the one month follow-up visit. The monitor will record BP at 15-minute intervals during the day (7 am to 10 pm) and 30-minute intervals at night (10.01 pm to 6:59 am). Assessing BP medium-term variability BP values of all patients before their stroke or TIA recorded by the GP are collected within the OXVASC study. This will allow assessment of medium-term BP variability in the patients before their stroke. Furthermore all patients referred to the OXVASC clinic are currently measuring their BP at home during the first month after stroke with a BP monitor as part of the usual care in OXVASC patients. This will allow assessing medium-term BP variability in the patients after their stroke. Assessing cardiovascular physiological measures The physiological measurements will be performed either on the day of the initial assessment in clinic, once carotid imaging has been performed, or on another occasion within six weeks after the index event, if recruited at or prior to the one month follow up visit. If the tests are performed after the day of the acute assessment, patients will be asked to abstain from smoking, alcohol, and all caffeinated products for at least 12 hours. The tests will be performed at least 2 hours after a light meal, in an evenly lit room kept at a constant
273
temperature between 22-220C. The patients will be asked to micturate, if they wish, before the study. The following tests will be performed: 1. Testing spontaneous baroreflex sensitivity (BRS)15
Continuous ECG will be recorded and continuous BP will be assessed using a Finometer (BP monitor which allows continuous non-invasive assessment of finger arterial pressure). After a period of at least 15 minutes of rest and after achievement of a satisfactory BP signal from the monitor and the stabilization of BP at the same level, recordings will be performed for a 10 minutes. The outputs from the Finometer and simultaneous surface ECG recordings will be analysed to estimate the cardiac BRS using in-house analysis programs written in Matlab, according to both sequential23 and spectral15 methods. 2. Assessment of cardiovascular reactivity24,25,26 To test the reactivity of the baroreceptor arch to vasoconstriction as well as to vasodilatation, the following tests will be performed: 2.1. Vasoconstriction Baroreceptor reactivity and central sympathetic response to vasoconstriction will be assessed using the cold pressor test according to Hines and Brown (Am Heart J 11:1–9, 1936). The cold pressor test is used to assess neural control of the cardiovascular system, which reflects cardiac sympathetic nerve activity. The test is based on the fact that immersion of a hand in ice-cold water causes a rise of BP which varies in different subjects. It is designed to measure the reactivity of the cardiovascular system to a standard stimulus. The technique adopted by Hines is as follows: Patients have to rest in the supine position until the BP has reached a steady basal level. The hand on the side opposite to the arm used to record the BP pressure is then immersed in water at a temperature of 0-40C for one minute. BP and heart rate will be assessed during the immersion and until the pressure has fallen to its original basal level. The maximum increase of the systolic and diastolic BP above the basal level is taken as a measure to the size of the cold pressor response. 2.2 Mental Arithmetic Blood pressure response to a purely internal sympathetic stimulus will be assessed through mental arithmetic. Patients will be asked to perform mental arithmetic aloud for two minutes, consisting of serially subtracting 29 from 1007, or if this is too difficult, serially subtracting 7 from 100. Blood pressure response will be assessed by the maximum increase in blood pressure from baseline. 2.3 Postural Blood Pressure BP will be measured with the Finometer and using a standard “AND” oscillometric brachial BP manometer in the sitting, supine and standing positions. The minimum and maximum BP reached after transition from sitting to standing and lying to standing will be measured. 2. Assessment of arterial stiffness27 3.1 Augmentation index
274
Radial artery pulse waveforms will be recorded using a pressure tonometer and designated software as previously described (SphygmoCor, At-Cor Medical, Sydney, Australia).28 Briefly, mean values of approximately 10 radial pulse waves will be used to generate a corresponding central aortic pressure waveform with a validated mathematical transfer function.29 The software uses an algorithm to determine the aortic pressure waveform’s inflection point which corresponds to the onset of the reflected wave returning from peripheral arteries, and divides the aortic pressure wave into an early and late systolic peak. Augmentation index (AIx) quantifies augmentation of central aortic pressure (due to the reflected component of the pulse pressure waveform) and typically increases with age as the arteries become stiffer (or less compliant).30 AIx is calculated as the difference between the second (P2) and first systolic peak pressure (P1), expressed as percentage of the central pulse pressure (PP): AIx (%) = ((P2-P1)/PP)*100. As heart rate influences AIx, all values of AIx will be corrected to 75 beats per minute as previously described.31 Essentially, the faster the pulse wave returns from the periphery, the stiffer the arteries must be, and the higher the calculated augmentation index. A minimum of 10 radial artery pulse waveforms are required by the software to calculate the AIx and to also derive an operator index (indicating the quality and reproducibility of the arterial signal (SphygmoCor, At-Cor Medical, Sydney, Australia). Several estimates of AIx will be performed on each occasion and the measurement with the highest operator index will be used for statistical analysis. 3.2 Aortic pulse wave velocity Aortic arterial stiffness will be assessed by the gold standard technique of carotid-femoral pulse wave velocity. This requires recording of the pulse wave by applanation tonometry with the SphygmoCor device from both carotid and femoral arteries, and the speed of transmission between the two sites used to estimate the velocity of the pulse wave. This provides a measure of the stiffness of the central arteries. 4 Transcranial Doppler Ultrasound (TCD) Dual channel, bilateral, monitoring TCD will be performed with a DiaMon 2MHz monitoring set acquired by the DWL Doppler Box, and MCA velocity will be acquired simultaneously with the Finometer continuous BP monitoring by an ADInstruments Powerlab acquisition system. This allows measurement of stiffness of the middle cerebral artery by pulse wave velocity,32 and assessment of cerebrovascular reactivity / autoregulation in the face of perturbations in blood pressure. The gain of cerebrovascular reactivity will be measured as the change in MCA velocity per unit change in systolic and mean arterial pressure. Potential risk BP monitoring, assessment of aortic stiffness and BRS function consist of BP measurements, tonometry and ECG monitoring, none of which are harmful to patients. The cold pressor test has no greater effect on BP than MRI scans or multiple other tests, performed in patients with an ischemic stroke, and therefore does not expose patients to an additional risk. Ethical considerations The pulse wave analyses will be entirely non-invasive and take 15 minutes per session. There will be no adverse effects from the pulse wave analysis system.
275
Power Calculation 500 patients will be recruited over five years. Based on Years 1-7 of OXVASC, the two-year stroke risk (excluding the first 7-days) is 20%. Assuming a linear relation between the mainly continuous physiological parameters and stroke risk, and allowing for 15% mortality due to non-stroke causes, this will provide 80% power at the 95% level of significance to detect a two-fold increase in stroke risk across quintiles of each variable over two years. However, the risk relations that we have identified in our preceding studies of BP variability have often been considerably stronger (5-10-fold increases across deciles) and so we will perform two intermediate analyses after recruitment of 250 patients (mean follow-up = 6 months) and after 400 patients (mean follow-up = 10 months). Although leading to a slight reduction in statistical power, the use of intermediate analyses will prevent the study going on beyond a clear result. Statistical Analysis BP variability on home monitoring: Standard deviation (SD), coefficient variant (SD/mean) and variation independent of the mean BP will be evaluated. Data analysis of baroreflex sensitivity testing (BRS): In-house programs written in Matlab will be used for the analysis of BRS according to the sequential and spectral methods, and correlated with the automatic calculation of BRS by the Westergren method by the proprietary Beatscope software provided with the Finometer. Assessment of arterial stiffness – The SphygmoCor software provides automated analysis of PWV and augmentation index. Assessment of reactivity of blood-pressure: The maximum increase of the systolic and diastolic BP above the basal level is taken as a measure of the size of the cold pressor response. Subgroup analysis: Patients with a cardioembolic stroke and those with antihypertensive medication will be analyzed separately. The statistical tests that we intend to use are logistic regression for clinical outcomes and multivariate linear regression for relating continuous physiological variables. Funding The cost of the physiological tests will be reimbursed from an Oxford BRC grant and an MRC Clinical Fellowship awarded to Alastair Webb. The grant is administered by the University of Oxford.
276
References
1. MacMahon S, Peto R, Cutler J, Collins R, Sorlie P, Neaton J, et al. Blood pressure, stroke, and coronary heart disease. Part 1, Prolonged differences in blood pressure: prospective observational studies corrected for the regression dilution bias. Lancet. 1990 Mar 31;335(8692):765-74.
2. Blood pressure, cholesterol, and stroke in eastern Asia. Eastern Stroke and Coronary Heart Disease Collaborative Research Group. Lancet. 1998 Dec 5;352(9143):1801-7.
3. Lewington S, Clarke R, Qizilbash N, Peto R, Collins R. Age-specific relevance of usual blood pressure to vascular mortality: a meta-analysis of individual data for one million adults in 61 prospective studies. Lancet. 2002 Dec 14;360(9349):1903-13.
4. Turnbull F. Effects of different blood-pressure-lowering regimens on major cardiovascular events: results of prospectively-designed overviews of randomised trials. Lancet. 2003 Nov 8;362(9395):1527-35.
5. Randomised trial of a perindopril-based blood-pressure-lowering regimen among 6,105 individuals with previous stroke or transient ischaemic attack. Lancet. 2001 Sep 29;358(9287):1033-41.
6. Rothwell PM. Limitations of the usual BP hypothesis and importance of variability, instability, and episodic hypertension. Lancet 2010; 375: 938-948
7. Rothwell PM, Howard SC, Dolan E, O’Brien E, Dobson JE, Dahlof B, Sever PS, Poulter NR. Prognostic significance of visit-to-visit variability, maximum systolic BP, and episodic hypertension. Lancet 2010; 375: 895-905.
8. Rothwell PM, Howard SC, Dolan E, O’Brien E, Dobson JR, Dahlof B, Poulter NR, Sever PS;
ASCOT-BPLA and MRC Trial investigators. Effects of blockers and calcium-channel blockers on within-individual variability in BP and risk of stroke. Lancet Neurology 2010; 9(5): 469-480.
9. Webb AJS, Fischer U, Mehta Z, Rothwell PM. Effects of antihypertensive-drug class on interindividual variation in BP and risk of stroke: a systematic review and meta-analysis. Lancet 2010; 375: 906-915.
10. Howard SC, Rothwell PM. Regression dilution of systolic and diastolic blood pressure in patients with established cerebrovascular disease. Journal of clinical epidemiology. 2003 Nov;56(11):1084-91.
11. Rosner B, Polk BF. The implications of blood pressure variability for clinical and screening purposes. Journal of chronic diseases. 1979;32(6):451-61.
12. Pickering TG, Hall JE, Appel LJ, Falkner BE, Graves J, Hill MN, et al. Recommendations for blood pressure measurement in humans and experimental animals: Part 1: blood pressure measurement in humans: a statement for professionals from the Subcommittee of Professional and Public Education of the American Heart Association Council on High Blood Pressure Research. Hypertension. 2005 Jan;45(1):142-61.
13. Cicconetti P, Cacciafesta M, Migliori M, Di Gioacchino CF, Vetta F, Chiarotti F, et al. Influence of sex and age on blood pressure variability. Arch Gerontol Geriatr. 2000 Jun 1;30(3):225-36.
14. Roman MJ, Pickering TG, Schwartz JE, Pini R, Devereux RB. Relation of blood pressure variability to carotid atherosclerosis and carotid artery and left ventricular hypertrophy. Arteriosclerosis, thrombosis, and vascular biology. 2001 Sep;21(9):1507-
15. Robinson TG, Dawson SL, Eames PJ, Panerai RB, Potter JF. Cardiac baroreceptor sensitivity predicts long-term outcome after acute ischemic stroke. Stroke; a journal of cerebral circulation. 2003 Mar;34(3):705-12.
16. Liu AJ, Ma XJ, Shen FM, Liu JG, Chen H, Su DF. Arterial baroreflex: a novel target for preventing stroke in rat hypertension. Stroke; a journal of cerebral circulation. 2007 Jun;38(6):1916-23.
17. La Rovere MT, Pinna GD, Hohnloser SH, Marcus FI, Mortara A, Nohara R, et al. Baroreflex sensitivity and heart rate variability in the identification of patients at risk for life-threatening arrhythmias: implications for clinical trials. Circulation. 2001 Apr 24;103(16):2072-7.
18. Cechetto DF, Wilson JX, Smith KE, Wolski D, Silver MD, Hachinski VC. Autonomic and myocardial changes in middle cerebral artery occlusion: stroke models in the rat. Brain research. 1989 Nov 20;502(2):296-305.
19. Appenzeller O, Descarries L. Circulatory Reflexes in Patients with Cerebrovascular Disease. The New England journal of medicine. 1964 Oct 15;271:820-3.
277
20. Gross M. Circulatory reflexes in cerebral ischaemia involving different vascular territories. Clinical science. 1970 Apr;38(4):491-502.
21. Robinson TG, James M, Youde J, Panerai R, Potter J. Cardiac baroreceptor sensitivity is impaired after acute stroke. Stroke; a journal of cerebral circulation. 1997 Sep;28(9):1671-6.
22. Sevre K, Rostrup M. Blood pressure and heart rate responses to cold pressor test in patients admitted to hospital due to chest pain. Blood pressure. 1999;8(2):110-3.
23. Wolff HH. The mechanism and significance of the cold pressor response. The Quarterly journal of medicine. 1951 Jul;20(79):261-73.
24. Parati G, Di Rienzo M, Pomidossi G, Casadei R, Gropelli A, Pedotti Am Zanchetti A, Mancia G. Evaluation of the baroreceptor-heart rate reflex by 24-hour intra-arterial blood pressure monitoring in humans. Hypertension. 1988; 12: 214-222.
25. Dubois-Rande JL, Dupouy P, Aptecar E, Bhatia A, Teiger E, Hittinger L, et al. Comparison of the effects of exercise and cold pressor test on the vasomotor response of normal and atherosclerotic coronary arteries and their relation to the flow-mediated mechanism. The American journal of cardiology. 1995 Sep 1;76(7):467-73.
26. Ifuku H, Moriyama K, Arai K, Shiraishi-Hichiwa Y. Regulation of cardiac function during a cold pressor test in athletes and untrained subjects. European journal of applied physiology. 2007 Sep;101(1):75-9.
27. Vlachopoulos C, Kosmopoulou F, Panagiotakos D, Ioakeimidis N, Alexopoulos N, Pitsavos C, et al. Smoking and caffeine have a synergistic detrimental effect on aortic stiffness and wave reflections. Journal of the American College of Cardiology. 2004 Nov 2;44(9):1911-7.
28. Kelly RP, Hayward CS, Avolio AP, O'Rourke M. Noninvasive determination of age-related changes in the human arterial pulse. Circulation. 1989; 80: 1652-1659.
29. Pauca AL, O'Rourke MF, Kon ND. Prospective evaluation of a method for estimating ascending aortic pressure from the radial artery pressure waveform. Hypertension. 2001; 38: 932-937.
30. Safar ME, London GM. Therapeutic studies and arterial stiffness in hypertension: recommendations of the European Society of Hypertension. The clinical committee of arterial structure and function. Working group on vascular structure and function of the European Society of Hypertension. J Hypertens. 2000; 18: 1527-1535.
31. Wilkinson IB, Mohammad NH, Tyrell S, Hall IR, Webb DJ, Paul VE, Levy T, Cockcroft JR. Heart rate dependency of pulse pressure amplification and arterial stiffness. Am J Hypertens. 2002; 15: 24-30.
32. Gladdish S, Manawadu D, Banya W et al. Repeatability of non-invasive measurement of intracerebral pulse wave velocity using transcranial Doppler. Clin SCi (Lond). 2005; 108: 433-439.
278
APPENDIX SIX
A pilot study into the relationship between differences in variability in systolic blood pressure, blood pressure control mechanisms and cerebrovascular autoregulation
Ethics Ref: Southampton REC B – 11/SC/0415 Date and Version No: 07/09/2011 Version 1.0
Chief Investigator: Prof PM Rothwell, Stroke Prevention Research Unit, Oxford University, [email protected]
Investigators: Dr AJS Webb, Stroke Prevention Research Unit, Oxford University, [email protected]
Sponsor: University of Oxford Funders: Oxford Biomedical Research Centre
Medical Research Council Clinical Fellowship (Alastair Webb)
Signatures:
Prof PM Rothwell Dr AJS Webb Chief Investigator Clinical Fellow
279
Summary Differences in intra-individual variability in systolic blood pressure strongly predict the risk of stroke, independent of mean blood pressure. However, it is unclear which blood pressure control mechanisms are responsible for differences in variability in blood pressure and whether there are associated differences in cerebrovascular autoregulation which might explain effects on stroke risk. This study aims to assess the relationship between systemic blood pressure control mechanisms and cerebrovascular autoregulation in states of reduced or increased blood pressure variability. Drugs that reduce peripheral resistance reduce variability in blood pressure whilst beta-blockers increase peripheral resistance and increase variability in blood pressure. Using these medications to induce a physiological state with increased or decreased peripheral resistance and blood pressure variability allows measurement of the relationship between blood pressure control mechanisms and cerebrovascular autoregulation. 10 healthy men and women will undergo physiological tests and an MRI brain scan at baseline and following 48 hours (two doses) of 10mg of amlodipine and of 160mg propranolol LA (Inderal LA). These tests include ECG monitoring, non-invasive beat-to-beat blood pressure (Finometer), middle cerebral artery blood flow (by transcranial ultrasound, DWL DopplerBox), and radial, femoral and carotid applanation tonometry (SphygmoCor). They will then undergo brain MRI in states of hypocapnia, normocapnia and hypercapnia to measure cerebrovascular reactivity. These techniques enable measurement of central and peripheral arterial stiffness (aortic pulse wave velocity, middle cerebral artery pulse wave velocity and augmentation index respectively), spontaneous baroreceptor sensitivity, orthostatic blood pressure responses, responses to mild stress (mental arithmetic and cold pressor test) and measures of cerebrovascular autoregulation (breath holding index, spontaneous transfer gain of blood pressure, MRI perfusion). The tests will measure changes in physiological blood pressure control mechanisms and associated differences in cerebrovascular perfusion during treatment, and relate these to beat-to-beat and 24 hour variability in SBP. Background We recently demonstrated that increased visit-to-visit, within-visit and 24 hour variability in systolic blood pressure (SBP) are associated with an increased risk of stroke in 3 cohorts of patients with previous TIA or stroke and 2 cohorts of patients with hypertension, independent of mean SBP.1, 2 Visit-to-visit variability in SBP is therefore a powerful new marker of stroke risk that is amenable to treatment with current antihypertensive agents, with resulting reductions in the risk of stroke. It has since been demonstrated that visit-to-visit variability is also predictive of overall mortality3 and the risk of nephropathy in type 1 diabetes.4 However, the physiological basis for differences in variability in SBP is unknown. Furthermore, it is possible that the relationship between variability in SBP and risk of stroke is dependent upon strongly correlated differences in cerebrovascular autoregulation rather than effects on systemic blood pressure. Drugs that cause peripheral vasodilation decrease both blood pressure variability and the risk of stroke, whilst drugs that increase peripheral resistance increase them.5, 6 This study is designed to assess the relationship between the mechanisms underlying the systemic control of blood pressure and cerebrovascular autoregulation in a physiological state known to be associated with a lower variability in blood pressure and risk of stroke (during treatment with amlodipine) and in a physiological state associated with an increased variability in blood pressure and the risk of stroke (during treatment with propranolol). Physiological control of blood pressure The primary aim of this study is to assess the relationship between changes in peripheral mechanisms controlling blood pressure and cerebrovascular autoregulation. We have previously demonstrated that the differing effects of antihypertensive drugs on variability in SBP and the risk of stroke are unlikely to be due to new-onset atrial fibrillation.7 As this is the commonest cause of cardioembolic stroke, it is likely that the increase in stroke risk
280
associated with increased blood pressure variability is due either to direct blood pressure changes or associated changes in the cerebrovascular circulation. Increased variability in SBP could relate to any component of the blood pressure control system. This includes increased centrally-driven sympathetic responses to stressful external stimuli (increased cardiovascular reactivity), greater responses to direct environmental stimuli such as postural changes, or a reduced capacity to buffer changes in blood pressure through decreased arterial compliance (ie arterial stiffness) or reduced baroreceptor sensitivity. Increased cardiovascular reactivity has been shown to predict future hypertension and an increased risk of cardiovascular events.8 This is consistent with findings that people with hostile personality traits are at an increased risk of cardiovascular events9, 10 and that known triggers of stroke also cause marked elevations in blood pressure.11 Many laboratory tests of cardiovascular reactivity have been devised. For this study, we have selected a purely internal stressor, mental arithmetic, and an external, mildly noxious stress test, the cold pressor test, which has previously been shown to be increased in patients with coronary artery disease and predict increased coronary reactivity.12, 13 Postural blood pressure responses reflect both the effect of a gravitational challenge to blood pressure and the capacity of the body to buffer this. Both orthostatic hypertension and orthostatic hypotensive are predictive of future cardiovascular events.14-16 Two major arterial functions that buffer blood pressure changes in the short term are arterial stiffness and the baroreceptor reflex. Arterial stiffness can be measured in many ways and at many sites of the arterial system.17 Central aortic stiffness is most commonly assessed by carotid-femoral pulse wave velocity18 and has been shown to be strongly predictive of the risk of white matter disease19 and lacunar stroke.20 An alternative measurement, the augmentation index, assesses the effect of reflected pulse waves returning from the peripheral circulation and increasing the size of the forward travelling wave from the heart and has been shown to be predictive of future cardiovascular events in some studies.21 Finally, the cerebral vessels are of particular interest regarding the subsequent risk of stroke but no study has yet assessed the prognostic significance of middle cerebral artery stiffness, although a technique for this purpose has recently been developed.22 Baroreceptors situated predominantly in the carotid bulb and aortic arch buffer acute changes in blood pressure, predominantly through modulating the autonomic control of cardiac output. Baroreceptor sensitivity is decreased post-stroke23 and this predicts a worse outcome after stroke,24 whilst animal experiments indicate a direct effect of calcium channel blockade on baroreceptor function.25 Evidence for the effects of amlodipine and propranolol on variability in SBP The calcium channel blocker in this study will be amlodipine as it is the agent with the strongest evidence for significant effects on visit-to-visit variability in blood pressure3 and stroke risk, is taken once a day and is well-tolerated. The beta-blocker will be propranolol as the typical non-selective beta-blocker in common use in neurological practice, including in patients at increased risk of stroke (ie migraine with aura and essential tremor). We have recently shown that non-selective beta-blockers are associated with a greater increase in visit-to-visit variability in SBP than selective beta-blockers26 and are associated with greater increases in the risk of stroke. As such, it is likely to produce greater differences in variability in SBP and the physiological measurements, increasing the sensitivity of this study. A prospective cohort study is currently underway in patients with TIA or minor stroke (reference 08/H0606/124) to identify the relationship between differences in various physiological measures, variability in SBP and the subsequent risk of TIA, stroke or cognitive decline. However, this study includes patients with pre-existing cerebrovascular disease which has direct effects on both blood pressure variability and cerebrovascular autoregulation which could confound any measured relationships. Furthermore, detailed assessment of parenchymal cerebral perfusion and autoregulation by MRI is not feasible in a large cohort of patients under prospective surveillance due to the more prolonged and
281
complex imaging protocols required. Finally, any relationship between peripheral measures and cerebrovascular autoregulation in a cross-sectional study is likely to be confounded by multiple demographic measures or other variables that are not measured. In this study, participants will be compared with themselves, avoiding any confounding by inter-individual variation. Hypothesis Changes in peripheral mechanisms underlying the control of systemic blood pressure are strongly correlated with changes in cerebrovascular autoregulation. Primary Objective: Measure the correlation between changes in baroreceptor sensitivity, arterial stiffness and postural blood pressure control with changes in cerebrovascular autoregulation in healthy individuals in a state of increased blood pressure variability compared to decreased blood pressure variability. Secondary Objectives:
1. Measure the direct correlation between changes in systemic blood pressure control
mechanisms or cerebrovascular autoregulation with awake variability in systolic
blood pressure in healthy individuals, in a state of increased blood pressure
variability compared to decreased blood pressure variability.
2. Assess the degree of change in measured physiological variables in each state of
blood pressure variability to guide power calculations for future studies.
Study Design The study is a human-subject, laboratory and MRI-based experiment. This study will be performed in healthy volunteers to exclude the possibility of confounding due to coexistent conditions associated with differences in variability in blood pressure (ie heart failure, previous cerebrovascular disease, autonomic failure). It aims to recruit 10 volunteers over the next 6 months, with each volunteer participating for 3 weeks from the time of the registration visit. The sequence of administration of the two drugs will be randomised to nullify any medium-term effects of the medications after cessation. Inclusion Criteria
1. Healthy men and women volunteers.
2. Aged 18-70.
3. Written informed consent.
Exclusion Criteria 1. Inability to provide informed consent, ie significant cognitive impairment
(MMSE<23).
2. Established cardiovascular disease including previous diagnosis of myocardial
infarction, angina, TIA, stroke, peripheral vascular disease, heart failure, cardiac
valve disease, diabetes, familial hyperlipidaemia.
3. Other major organ disease likely to affect blood pressure: ie liver disease, renal
impairment (creatinine >150 or eGFR<50), autonomic failure, Parkinson’s
disease.
4. Pregnancy.
5. Current treatment with antihypertensive agents or hypertension likely to require
treatment (SBP>160 or DBP>100).
282
6. Conditions preventing accurate physiological testing: atrial fibrillation, Raynaud’s
syndrome, bilateral carotid stenosis (>50%) or haemodynamically significant
vertebrobasilar stenosis, significant aortic valve disease.
7. Contraindication to treatment with calcium channel blockers or beta-blockers:
asthma, bradycardia, previous adverse reaction.
8. Contraindication to MRI – cerebral aneurysm clip, pacemaker, cochlear implant,
mechanical cardiac valve, coronary artery stent, potential iron debris in eyes.
Recruitment Recruitment of healthy volunteers will be carried out in two ways: firstly by open advertisement of the study within University premises, and secondly by sending a letter and information sheet to people who have previously been control participants for the OXVASC study. Once a potential participant has contacted the study, a short telephone interview will be carried out to ensure that there are no obvious inclusion or exclusion criteria, and that the participant is aware of what the study will entail. Following this, arrangements will be made to meet the participant for a 30 minute registration and consent interview at the John Radcliffe Hospital. All phases of recruitment will be performed by Dr Alastair Webb. Study procedures Once recruited to the study, participants will undergo a 30 minute registration interview by Dr Alastair Webb, entailing full informed consent and a brief medical interview and examination to identify any possible exclusion criteria. At the registration visit, appointment times will be agreed for three subsequent visits and physiological procedures. Following the registration visit, each participant will be examined on three occasions with physiological testing and MRI. The first test will be performed on no medications. Following this visit, the participant will take either amlodipine 10mg or propranolol LA 160mg at 6am for 48 hours. On the second day at 6 hours post-dose (peak serum concentration) they will undergo 2 hours of physiological tests and an MRI scan. They will then take no further treatment for at least 1 week, after which they will take the other medication for 48hours, undergoing testing at 6 hours post-dose. At the end of each visit, patients will be fitted with a 24 hour blood pressure monitor to measure half hourly blood pressures during the daytime and hourly blood pressures overnight until the same time the next day. Physiological tests will be performed at the Cardiovascular Clinical Research Facility at the John Radcliffe Hospital, in the morning following at least a 12 hour fast from a substantial meal and caffeinated drink, by Dr Alastair Webb. Blood pressure measurement Office blood pressure will be measured at each of the four visits with an automated ‘AND’ brachial blood pressure device with an appropriately sized cuff. 3 measurements will be taken from the non-dominant arm after 5 minutes of quiet rest in a sitting position. 3 measurements will also be taken from the dominant arm at the registration visit. 24-hour ambulatory BP monitoring will be assessed with the use of a Spacelabs recorder. The monitor will record BP at 30-minute intervals during the day (7 am to 10 pm) and 60-minute intervals at night (10.01 pm to 6:59 am). Physiological Testing The physiological measurements will be performed at each clinic visit except for the registration visit and take approximately 2 hours to perform. Participants will be asked to abstain from smoking, alcohol, and all caffeinated products for at least 12 hours. The tests will be performed at least 2 hours after a light meal. The patients will be asked to micturate, if they wish, before the study. The following tests will be performed:
283
1. Testing spontaneous baroreflex sensitivity (BRS)
Continuous ECG will be recorded and continuous BP will be assessed using a Finometer (BP monitor which allows continuous non-invasive assessment of finger arterial pressure). After a period of at least 15 minutes of rest and after achievement of a satisfactory BP signal from the monitor and the stabilization of BP at the same level, recordings will be performed for a 10 minutes. The outputs from the Finometer and simultaneous surface ECG recordings will be analysed to estimate the cardiac BRS using in-house analysis programs written in Matlab, according to both sequential27 and spectral28 methods. 2. Assessment of cardiovascular reactivity 2.1. Cold Pressor Test Baroreceptor reactivity and central sympathetic response to vasoconstriction will be assessed using the cold pressor test. The cold pressor test is used to assess neural control of the cardiovascular system, which reflects cardiac sympathetic nerve activity. The test is based on the fact that immersion of a hand in ice-cold water causes a rise of BP which varies in different subjects. It is designed to measure the reactivity of the cardiovascular system to a standard stimulus. The technique is as follows: Patients have to rest in the supine position until the BP has reached a steady basal level. The hand on the side opposite to the arm used to record the BP pressure is then immersed in water at a temperature of 0-40 Celsius for one minute. BP and heart rate will be assessed during the immersion and until the pressure has fallen to its original basal level. The maximum increase of the systolic and diastolic BP above the basal level is taken as a measure to the size of the cold pressor response. 2.2 Mental Arithmetic Blood pressure response to a purely internal sympathetic stimulus will be assessed through mental arithmetic. Patients will be asked to perform mental arithmetic aloud for two minutes, consisting of serially subtracting 27 from 1005, or if this is too difficult, serially subtracting 7 from 100. Blood pressure response will be assessed by the maximum increase in blood pressure from baseline. 2.3 Postural Blood Pressure BP will be measured with the Finometer and using a standard ‘AND’ oscillometric brachial BP manometer in the sitting, supine and standing positions. The minimum and maximum BP reached after transition from sitting to standing and lying to standing will be measured. 3. Assessment of arterial stiffness 3.1 Augmentation index Radial artery pulse waveforms will be recorded using a pressure tonometer and designated software as previously described (SphygmoCor, At-Cor Medical, Sydney, Australia).21 Briefly, mean values of approximately 10 radial pulse waves will be used to generate a corresponding central aortic pressure waveform with a validated mathematical transfer function. The software uses an algorithm to determine the aortic pressure waveform’s inflection point which corresponds to the onset of the reflected wave returning from peripheral arteries, and divides the aortic pressure wave into an early and late systolic peak. Augmentation index (AIx) quantifies augmentation of central aortic pressure (due to the reflected component of the pulse pressure waveform) and typically increases with age as the arteries become stiffer (or less compliant).29 AIx is calculated as the difference between the second (P2) and first systolic peak pressure (P1), expressed as percentage of the central pulse pressure (PP): AIx (%) = ((P2-P1)/PP)*100. As heart rate influences AIx, all values of AIx will be corrected to 75 beats per minute as previously described. Essentially, the faster the pulse wave returns from the periphery, the stiffer the arteries must be, and the higher the calculated augmentation index. 3.2 Aortic pulse wave velocity
284
Aortic arterial stiffness will be assessed by the gold standard technique of carotid-femoral pulse wave velocity. This requires recording of the pulse wave by applanation tonometry with the SphygmoCor device from both carotid and femoral arteries, and the speed of transmission between the two sites used to estimate the velocity of the pulse wave. This provides a measure of the stiffness of the central arteries. 4 Transcranial Doppler Ultrasound (TCD) Dual channel, bilateral, monitoring TCD will be performed with a DiaMon 2MHz monitoring set acquired by the DWL Doppler Box, and MCA velocity will be acquired simultaneously with the Finometer continuous BP monitoring by an ADInstruments Powerlab acquisition system. This allows measurement of stiffness of the middle cerebral artery by pulse wave velocity,22 and assessment of cerebrovascular reactivity / autoregulation in the face of perturbations in blood pressure. The gain of cerebrovascular reactivity will be measured as the change in MCA velocity per unit change in systolic and mean arterial pressure.30 Then, a 30 second breath hold will be performed to increase arterial pCO2 and 20s of hyperventilation at 1 breath/second will be perfumed to decrease arterial pCO2 to assess cerebrovascular reactivity.31 During this phase of assessment, end-tidal CO2 will be measured via nasal cannulae with the use of a capnograph (OXI-PULSE, Pulmolink). MRI imaging Participants will undergo 1 hour of MRI scanning, including approximately 15 minutes for preparation and a safety questionnaire. The scan will be performed in the AVIC 3T Siemens MRI scanner for approximately 45 minutes. During this period they will wear a saturation probe on a finger, an ECG monitor and nasal cannula to record carbon dioxide levels. During scanning they will be asked to breath regularly through their nose whilst a series of sequences are taken. During the scans they will be asked to lie still, and at times carry out respiratory manoeuvres including 3 periods of 30s breath-holding and three periods of controlled hyperventilation at 1 breath per second for 30s in random order. Instructions will be delivered to the patient by means of projected instructions on to a screen. Following this period of assessment, participants will wear a tight-fitting mask covering the lower half of the face to deliver a specified mixture of medical air and carbon dioxide (3-5%). A sequence measuring cerebral blood flow will be performed whilst breathing medical air alone and then whilst breathing a mixture of medical air and 3-5% carbon dioxide for 5 minutes. Potential risks Both medications used in this study have been used commonly for several decades in routine clinical practice, including in the treatment of hypertensive patients and in normotensive patients for other indications. They are both very well-tolerated, with limited side-effects and minimal or no evidence of significant risks associated with their use in otherwise healthy individuals. Risk of side-effects: The most common side-effects of amlodipine include postural dizziness, ankle oedema, flushing and headache, and of propranolol include postural dizziness, cold extremities, sleep disturbance and impotence. Rare but more serious potential complications of treatment include symptomatic bradycardia and bronchospasm with propranolol and heart failure with amlodipine. In addition, there is a very low risk of idiosyncratic allergic reactions to either agent. To reduce the likelihood of serious complications, subjects at risk of these will be excluded: pregnant or breast-feeding women, known history of asthma, cardiac conduction disease (or strong family history of), predisposition to heart failure. Secondly, patients will be warned of the above possible side-effects prior to consenting to the study, and will be provided with a telephone number to contact the study investigators directly if they experience them, and if necessary will be reviewed immediately. BP monitoring, cerebrovascular reactivity, assessment of aortic stiffness and BRS function consist of BP measurements, transcranial Doppler ultrasound, tonometry and ECG monitoring, none of which are harmful to patients. The cold pressor test and mental
285
arithmetic tests have no greater effect on BP than MRI scans or multiple other tests, performed in patients with an ischemic stroke, and therefore does not expose patients to an additional risk. The MRI scans will require no contrast agent and will not be performed in any participant with a potential contraindication to MRI, and therefore pose no additional risk to the participants. MRI is a safe and non-invasive technique, which does not involve ionising radiation. Risks associated with the magnetic field will be removed by excluding potential participants with ferromagnetic objects in their bodies (e.g. metal implants, vessel clips, shrapnel injuries) or with implanted devices which may be damaged by the magnet (e.g. heart pacemakers). All people entering the scanner room are screened for such objects. While most people do not experience discomfort in a MRI environment, the enclosed space of the scanner can potentially feel uncomfortable, especially for more elderly subjects. Discomfort from lying still for a long period of time will be minimised with comfortable padding and positioning. Whilst in the scanner, subjects would be able to use the alarm button if they wish to communicate with the operator or to interrupt the scanning. People with a history of claustrophobia would be excluded from participation in the study. All participants would be introduced carefully to the scanner and allowed to leave at any stage, should they wish to do so. Once in the scanner, participants would be able to indicate immediately if they wish the scanning to cease by squeezing a bulb placed in their hands, or by requesting it verbally. As the MRI scanner is noisy, subjects would be given ear-plugs and acoustically shielded headphones to minimize the noise. Carbon dioxide inhalation: This procedure is a very common respiratory physiology technique used to generate reflex respiratory responses and to maintain arterial CO2 levels constant in the face of changes in respiration. There are no serious risks associated with breathing CO2 in healthy individuals. When PCO2 is raised to more than 8kPa (a level that will not be reached in this study) common side effects include headache and lightheadedness. At much higher blood levels than employed here (~11kPa), there is a remote possibility of abnormal heart rhythms or increase in blood pressure. These side effects usually disappear within 1 minute of the removal of inspired CO2 and are highly unlikely to occur with the level of CO2 we propose to use.
Serious Adverse Events
A serious adverse event is any untoward medical occurrence that:
Results in death,
Is life-threatening,
NOTE: The term "life-threatening" in the definition of "serious" refers to an event in which
the participant was at risk of death at the time of the event; it does not refer to an event
which hypothetically might have caused death if it were more severe.
Requires inpatient hospitalisation or prolongation of existing hospitalisation,
Results in persistent or significant disability/incapacity, or
Is a congenital anomaly/birth defect.
Other important medical events.*
*Other events that may not result in death, are not life threatening, or do not require
hospitalisation, may be considered a serious adverse event when, based upon appropriate
medical judgement, the event may jeopardise the participant and may require medical or
surgical intervention to prevent one of the outcomes listed above.
*Other events that may not result in death, are not life threatening, or do not require hospitalisation, may be considered a serious adverse event when, based upon appropriate medical judgement, the event may jeopardise the participant and may require medical or surgical intervention to prevent one of the outcomes listed above.
286
Reporting Procedures for Serious Adverse Events A serious adverse event (SAE) occurring to participant would be reported to the REC that gave a favourable opinion of the study where in the opinion of the Chief Investigator the event was: ‘related’ – that is, it resulted from administration of any of the research procedures; and ‘unexpected’ – that is, the type of event is not listed in the protocol as an expected occurrence. Reports of related and unexpected SAEs would be submitted within 15 days of the Chief Investigator becoming aware of the event, using the NRES report of serious adverse event form. In addition, the CI will report any related and unexpected SAE’s to the MHRA using the Yellow Card System. In addition to the expedited reporting above, the CI shall submit once a year throughout the clinical research study or on request a safety report to the Ethics Committee. All related AEs that result in a patient’s withdrawal from the study or are present at the end of the study, should be followed up until a satisfactory resolution occurs. It will be left to the investigator’s clinical judgment whether or not an AE is of sufficient severity to require the patient’s removal from treatment. A patient may also voluntarily withdraw from treatment due to what he or she perceives as an intolerable AE. If either of these occurs, the patient would undergo an end of study assessment and be given appropriate care under medical supervision until symptoms cease or the condition becomes stable. Statistical Analysis BP variability on home monitoring: Standard deviation (SD), coefficient variant (SD/mean) and variation independent of the mean BP will be evaluated. Data analysis of baroreflex sensitivity testing (BRS): In-house programs written in Matlab will be used for the analysis of BRS according to the sequential and spectral methods, and correlated with the automatic calculation of BRS by the Westergren method by the proprietary Beatscope software provided with the Finometer. Assessment of arterial stiffness The SphygmoCor software provides automated analysis of PWV and augmentation index. Middle cerebral artery stiffness will be assessed by the time interval between the R-wave of the ECG to the foot of the pulse wave recorded by TCD, divided by the distance between the sternal notch and the temporal window.22 Assessment of blood-pressure reactivity: The maximum increase of the systolic and diastolic BP above the basal level is taken as a measure of the size of the cold pressor, orthostatic and mental arithmetic responses. Assessment of TCD cerebrovascular reactivity: The breath-holding index will be used as the primary measure of cerebrovascular reactivity in TCD measures, calculated as the percentage increase in middle cerebral artery blood flow from rest divided by the time the breath was held.32 This will be correlated with end-tidal CO2 levels measured by expiration capnography via nasal cannulae. Secondly, the transfer gain function relating spontaneous changes in blood pressure with changes in middle cerebral artery blood flow will be calculated.30 MRI imaging: MRI imaging will be analysed to exclude the presence of white matter disease and intracranial arterial stenosis. Secondly, whole brain perfusion and regional perfusion will be measured on ASL and VASO-GRASE sequences at rest, during hyperventilation and during inhalation of 3-5% carbon dioxide mixed with medical air using specially written, in-house software in MATLAB as described previously.33 The statistical tests that we intend to use are multivariate linear regression for relating continuous physiological variables and t-tests or ANOVA for direct group comparisons. Power Calculation This is a pilot study to assess the relationship between two sets of continuously varying physiological measures within individuals. As such, no clear prior data exists upon which an
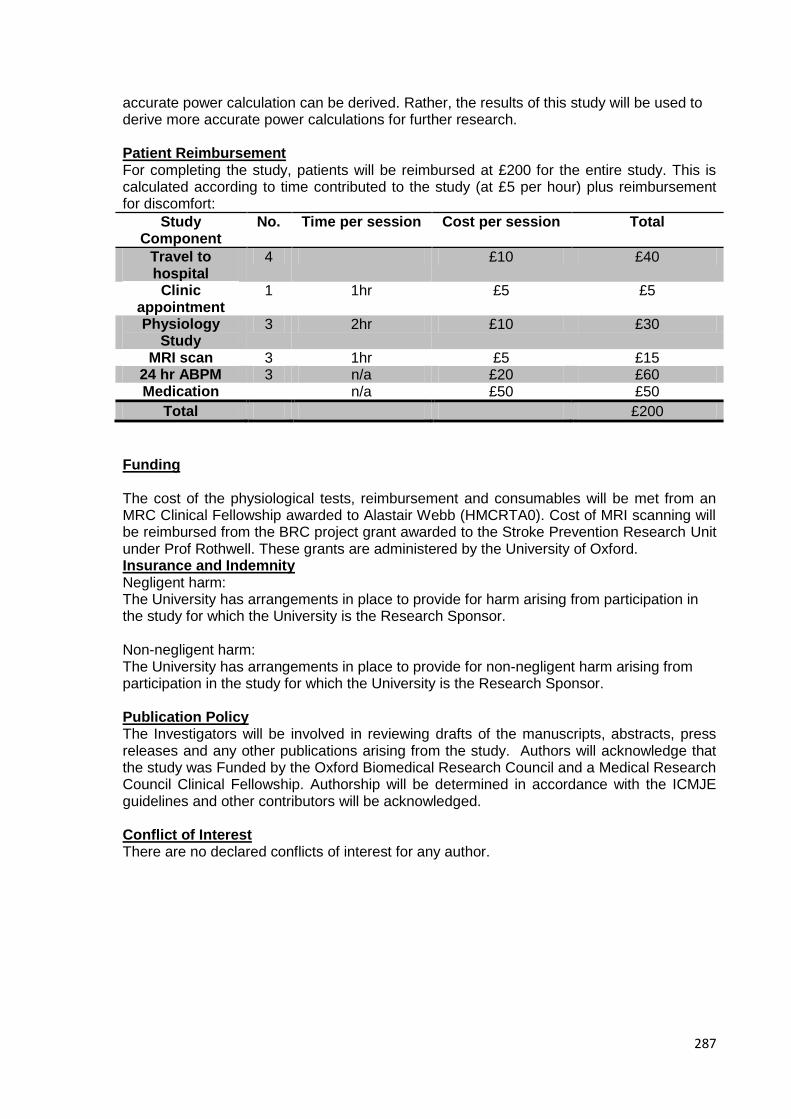
287
accurate power calculation can be derived. Rather, the results of this study will be used to derive more accurate power calculations for further research. Patient Reimbursement For completing the study, patients will be reimbursed at £200 for the entire study. This is calculated according to time contributed to the study (at £5 per hour) plus reimbursement for discomfort:
Study Component
No. Time per session Cost per session Total
Travel to hospital
4 £10 £40
Clinic appointment
1 1hr £5 £5
Physiology Study
3 2hr £10 £30
MRI scan 3 1hr £5 £15 24 hr ABPM 3 n/a £20 £60 Medication n/a £50 £50
Total £200
Funding The cost of the physiological tests, reimbursement and consumables will be met from an MRC Clinical Fellowship awarded to Alastair Webb (HMCRTA0). Cost of MRI scanning will be reimbursed from the BRC project grant awarded to the Stroke Prevention Research Unit under Prof Rothwell. These grants are administered by the University of Oxford. Insurance and Indemnity Negligent harm: The University has arrangements in place to provide for harm arising from participation in the study for which the University is the Research Sponsor. Non-negligent harm: The University has arrangements in place to provide for non-negligent harm arising from participation in the study for which the University is the Research Sponsor. Publication Policy The Investigators will be involved in reviewing drafts of the manuscripts, abstracts, press releases and any other publications arising from the study. Authors will acknowledge that the study was Funded by the Oxford Biomedical Research Council and a Medical Research Council Clinical Fellowship. Authorship will be determined in accordance with the ICMJE guidelines and other contributors will be acknowledged. Conflict of Interest There are no declared conflicts of interest for any author.
288
References 1. Rothwell, P.M., Limitations of the usual blood-pressure hypothesis and importance
of variability, instability, and episodic hypertension. Lancet, 2010. 375(9718): p. 938-48.
2. Rothwell, P.M., et al., Prognostic significance of visit-to-visit variability, maximum systolic blood pressure, and episodic hypertension. Lancet, 2010. 375(9718): p. 895-905.
3. Muntner, P., et al., The Relationship Between Visit-to-Visit Variability in Systolic Blood Pressure and All-Cause Mortality in the General Population: Findings From NHANES III, 1988 to 1994. Hypertension, 2011.
4. Kilpatrick, E.S., A.S. Rigby, and S.L. Atkin, The role of blood pressure variability in the development of nephropathy in type 1 diabetes. Diabetes Care, 2010. 33(11): p. 2442-7.
5. Rothwell, P.M., et al., Effects of beta blockers and calcium-channel blockers on within-individual variability in blood pressure and risk of stroke. Lancet Neurol, 2010. 9(5): p. 469-80.
6. Webb, A.J., et al., Effects of antihypertensive-drug class on interindividual variation in blood pressure and risk of stroke: a systematic review and meta-analysis. Lancet, 2010. 375(9718): p. 906-15.
7. Webb, A.J. and P.M. Rothwell, Blood pressure variability and risk of new-onset atrial fibrillation: a systematic review of randomized trials of antihypertensive drugs. Stroke, 2010. 41(9): p. 2091-3.
8. Chida, Y. and A. Steptoe, Greater Cardiovascular Responses to Laboratory Mental Stress Are Associated With Poor Subsequent Cardiovascular Risk Status: A Meta-Analysis of Prospective Evidence. Hypertension, 2010. 55(4): p. 1026-1032.
9. Pavek, K. and A. Taube, Personality characteristics influencing determinacy of day and night blood pressure and heart rate. Blood Press, 2009. 18(1-2): p. 30-5.
10. Brotman, D.J., S.H. Golden, and I.S. Wittstein, The cardiovascular toll of stress. Lancet, 2007. 370(9592): p. 1089-100.
11. Koton, S., et al., Triggering risk factors for ischemic stroke: a case-crossover study. Neurology, 2004. 63(11): p. 2006-10.
12. Schindler, T.H., Prognostic Value of Abnormal Vasoreactivity of Epicardial Coronary Arteries to Sympathetic Stimulation in Patients With Normal Coronary Angiograms. Arteriosclerosis, Thrombosis, and Vascular Biology, 2003. 23(3): p. 495-501.
13. Sevre, K. and M. Rostrup, Blood pressure and heart rate responses to cold pressor test in patients admitted to hospital due to chest pain. Blood Press, 1999. 8(2): p. 110-3.
14. Kario, K., Orthostatic hypertension: a measure of blood pressure variation for predicting cardiovascular risk. Circ J, 2009. 73(6): p. 1002-7.
15. Fessel, J. and D. Robertson, Orthostatic hypertension: when pressor reflexes overcompensate. Nat Clin Pract Nephrol, 2006. 2(8): p. 424-31.
16. Hossain, M., W.L. Ooi, and L.A. Lipsitz, Intra-individual postural blood pressure variability and stroke in elderly nursing home residents. J Clin Epidemiol, 2001. 54(5): p. 488-94.
17. Gurovich, A.N. and R.W. Braith, Pulse wave analysis and pulse wave velocity techniques: are they ready for the clinic? Hypertens Res, 2010.
18. Nemeth, Z.K., et al., The Method of Distance Measurement and Torso Length Influences the Relationship of Pulse Wave Velocity to Cardiovascular Mortality. Am J Hypertens, 2010.
19. Henskens, L.H.G., et al., Increased Aortic Pulse Wave Velocity Is Associated With Silent Cerebral Small-Vessel Disease in Hypertensive Patients. Hypertension, 2008. 52(6): p. 1120-1126.
20. Tuttolomondo, A., et al., Arterial stiffness indexes in acute ischemic stroke: relationship with stroke subtype. Atherosclerosis, 2010. 211(1): p. 187-94.
289
21. Mitchell, G.F., et al., Hemodynamic Correlates of Blood Pressure Across the Adult Age Spectrum: Noninvasive Evaluation in the Framingham Heart Study. Circulation, 2010. 122(14): p. 1379-1386.
22. Gladdish, S., et al., Repeatability of non-invasive measurement of intracerebral pulse wave velocity using transcranial Doppler. Clin Sci (Lond), 2005. 108(5): p. 433-9.
23. Robinson, T.G., et al., Cardiac baroreceptor sensitivity is impaired after acute stroke. Stroke, 1997. 28(9): p. 1671-6.
24. Robinson, T.G., et al., Cardiac baroreceptor sensitivity predicts long-term outcome after acute ischemic stroke. Stroke, 2003. 34(3): p. 705-12.
25. Stauss, H.M., Identification of blood pressure control mechanisms by power spectral analysis. Clin Exp Pharmacol Physiol, 2007. 34(4): p. 362-8.
26. Webb, A. and P. Rothwell, β1-selectivity of beta-blockers influences effects on blood pressure variability and risk of stroke: a systematic review. 2011.
27. Pagani, M., et al., Changes in autonomic regulation induced by physical training in mild hypertension. Hypertension, 1988. 12(6): p. 600-10.
28. Parati, G., et al., Evaluation of the baroreceptor-heart rate reflex by 24-hour intra-arterial blood pressure monitoring in humans. Hypertension, 1988. 12(2): p. 214-22.
29. McEniery, C.M., et al., The impact of cardiovascular risk factors on aortic stiffness and wave reflections depends on age: the Anglo-Cardiff Collaborative Trial (ACCT III). Hypertension, 2010. 56(4): p. 591-7.
30. Zhang, R., et al., Transfer function analysis of dynamic cerebral autoregulation in humans. Am J Physiol, 1998. 274(1 Pt 2): p. H233-41.
31. Bellapart, J. and J.F. Fraser, Transcranial Doppler assessment of cerebral autoregulation. Ultrasound Med Biol, 2009. 35(6): p. 883-93.
32. Cupini, L.M., et al., Cerebrovascular reactivity and subcortical infarctions. Arch Neurol, 2001. 58(4): p. 577-81.
33. Donahue, M.J., et al., Cerebral blood flow, blood volume, and oxygen metabolism dynamics in human visual and motor cortex as measured by whole-brain multi-modal magnetic resonance imaging. J Cereb Blood Flow Metab, 2009. 29(11): p. 1856-66.
290
APPENDIX SEVEN
A physiological study to determine relationships between changes in variability in systolic blood pressure, arterial stiffness, aortic blood pressure and cerebrovascular
pulsatility Ethics Ref: 13/SC/0245 Oxfordshire REC A Date and Version No: 22/04/2013 Version 1.0
Chief Investigator: Prof PM Rothwell, Stroke Prevention Research Unit, Oxford University, [email protected]
Investigators: Dr AJS Webb, Stroke Prevention Research Unit, Oxford University, [email protected] Dr N Lovett, Stroke Prevention Research Unit, Oxford University, [email protected] Dr MT Tuna, Stroke Prevention Research Unit, Oxford University, [email protected] Mr J Diesch, Senior Vascular Scientist, Cardiovascular Clinical Research Facility, Nuffield Department of Medicine, Oxford University Dr Louise Silver, Stroke Prevention Research Unit, Oxford University, [email protected]
Sponsor: University of Oxford Funders: Oxford Biomedical Research Centre / Medical Research
Council Signatures:
Prof PM Rothwell Dr AJS Webb Chief Investigator Clinical Fellow
291
Contents Page
Amendment history 3 Synopsis 3 List of Abbreviations 4 Summary 5 Study flow chart 6 Background 7 Objectives 8 Study Design 9 Inclusion / Exclusion Criteria 9 Recruitment 9 Study procedures 10 Risks and adverse events 13 Confidentiality and Data Protection 15 Statistical Analysis 15 Funding and Declarations 16 References 17
292
MENDMENT HISTORY
Amendment No.
Protocol Version No.
Date issued
Author(s) of changes Details of Changes made
1 1 17/02/2013 A Webb Original Version
SYNOPSIS
Study Title A physiological study to determine relationships between changes in variability in systolic blood pressure, arterial stiffness, aortic blood pressure and cerebrovascular pulsatility
Internal ref. no. n/a
Study Design A human-subject, laboratory and clinic-based experiment to determine relationships between changes in physiological variables.
Study Participants Patients with acute TIA or minor stroke, already recruited to the Oxford Vascular Study
Number of Participants
50
Planned Study Period
20 Months
Primary Objective To measure the relationship between changes in arterial stiffness, aortic blood pressure and cerebral pulsatility with changes in home blood pressure variability in hypertensive individuals with recent cerebrovascular disease.
Secondary Objectives
To measure the relationship between changes in arterial stiffness, aortic blood pressure and cerebral pulsatility with changes in ambulatory blood pressure variability in hypertensive individuals with recent cerebrovascular disease. To measure the association between cerebral pulsatility and both home and ambulatory blood pressure variability, independent of central aortic measures
Intervention (s) Standard treatment of hypertension with amlodipine or perindopril, as per national guidelines. Choice of treatment by random allocation.
ABBREVIATIONS
ABPM Ambulatory blood pressure monitoring
ACE Angiotensin converting enzyme
AE Adverse Event
AIx Augmentation index
ARB Angiotensin receptor blocker
CCB Calcium channel blocker
CI Chief Investigator

293
DBP Diastolic blood pressure
GP General practitioner
MRI Magnetic resonance imaging
NRES National Research Ethics Service
OXVASC Oxford Vascular Study
REC Research Ethics Committee
SAE Serious adverse event
SBP Systolic blood pressure
TIA Transient ischaemic attack
TCD Transcranial Doppler ultrasound
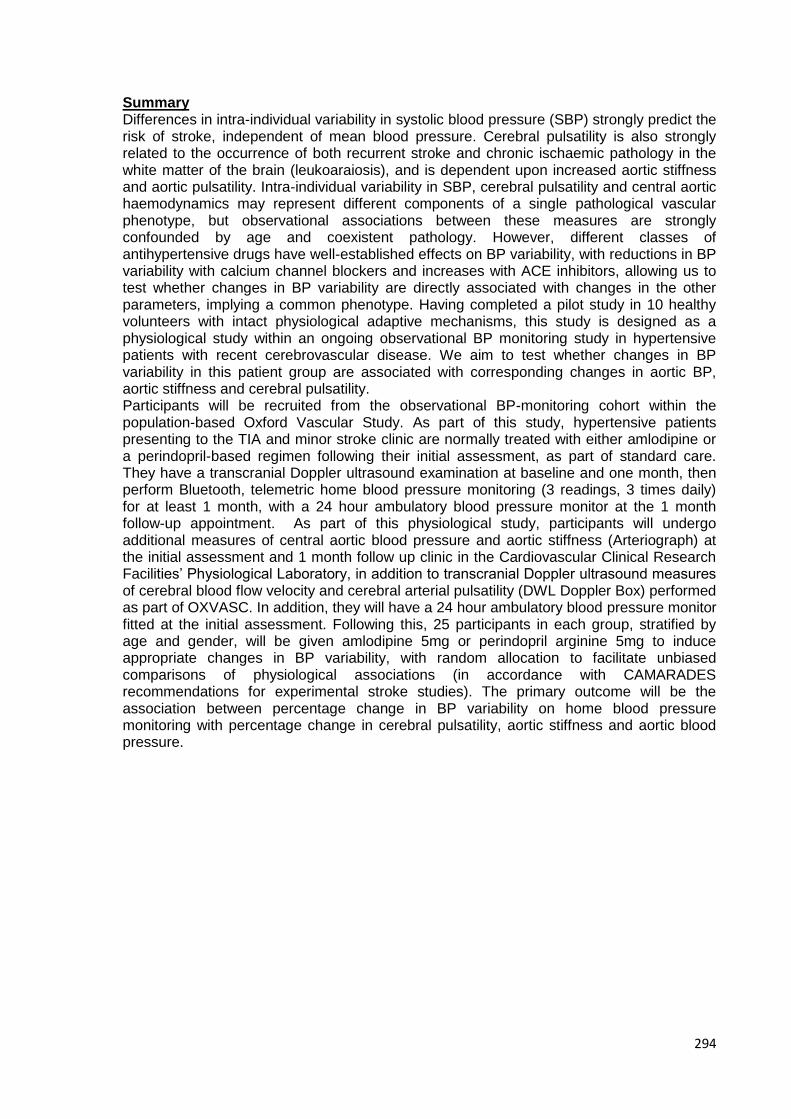
294
Summary Differences in intra-individual variability in systolic blood pressure (SBP) strongly predict the risk of stroke, independent of mean blood pressure. Cerebral pulsatility is also strongly related to the occurrence of both recurrent stroke and chronic ischaemic pathology in the white matter of the brain (leukoaraiosis), and is dependent upon increased aortic stiffness and aortic pulsatility. Intra-individual variability in SBP, cerebral pulsatility and central aortic haemodynamics may represent different components of a single pathological vascular phenotype, but observational associations between these measures are strongly confounded by age and coexistent pathology. However, different classes of antihypertensive drugs have well-established effects on BP variability, with reductions in BP variability with calcium channel blockers and increases with ACE inhibitors, allowing us to test whether changes in BP variability are directly associated with changes in the other parameters, implying a common phenotype. Having completed a pilot study in 10 healthy volunteers with intact physiological adaptive mechanisms, this study is designed as a physiological study within an ongoing observational BP monitoring study in hypertensive patients with recent cerebrovascular disease. We aim to test whether changes in BP variability in this patient group are associated with corresponding changes in aortic BP, aortic stiffness and cerebral pulsatility. Participants will be recruited from the observational BP-monitoring cohort within the population-based Oxford Vascular Study. As part of this study, hypertensive patients presenting to the TIA and minor stroke clinic are normally treated with either amlodipine or a perindopril-based regimen following their initial assessment, as part of standard care. They have a transcranial Doppler ultrasound examination at baseline and one month, then perform Bluetooth, telemetric home blood pressure monitoring (3 readings, 3 times daily) for at least 1 month, with a 24 hour ambulatory blood pressure monitor at the 1 month follow-up appointment. As part of this physiological study, participants will undergo additional measures of central aortic blood pressure and aortic stiffness (Arteriograph) at the initial assessment and 1 month follow up clinic in the Cardiovascular Clinical Research Facilities’ Physiological Laboratory, in addition to transcranial Doppler ultrasound measures of cerebral blood flow velocity and cerebral arterial pulsatility (DWL Doppler Box) performed as part of OXVASC. In addition, they will have a 24 hour ambulatory blood pressure monitor fitted at the initial assessment. Following this, 25 participants in each group, stratified by age and gender, will be given amlodipine 5mg or perindopril arginine 5mg to induce appropriate changes in BP variability, with random allocation to facilitate unbiased comparisons of physiological associations (in accordance with CAMARADES recommendations for experimental stroke studies). The primary outcome will be the association between percentage change in BP variability on home blood pressure monitoring with percentage change in cerebral pulsatility, aortic stiffness and aortic blood pressure.
295
Physiology study design
Background
Design: Physiological laboratory + clinic-based study with use of known effects of antihypertensive drugs to alter BP variability (as NIMP).
Measures: Cerebral pulsatility (TCD), arterial stiffness and Aortic BP (arteriograph), BP variability – home and ambulatory
Endpoint: Relationship between changes in BP variability + changes in cerebral pulsatility, aortic BP and arterial stiffness
Exclusion Criteria
1. Unable or unwilling to provide informed consent,
including an individual, who, in the opinion of the
investigator may be unable to comply with the
requirements of the protocol.
2. Recent non-cerebrovascular cardiovascular event:
myocardial infarction, unstable angina, peripheral
vascular disease or new heart failure.
3. Major organ disease likely to affect blood pressure
or physiological indices: liver disease, renal
impairment (creatinine >150 or eGFR<50),
autonomic failure, Parkinson’s disease, prosthetic
cardiac valve.
4. Pregnancy.
5. Current treatment with ACE inhibitor, angiotensin-
receptor blocker or calcium channel blocker.
6. Clinical need for treatment with either ACEi or
CCBs: heart failure or renal failure.
7. Atrial fibrillation.
8. Contraindication to treatment with calcium
channel blockers or ACE inhibitors: heart failure,
previous adverse reaction, bilateral carotid
stenosis (>70%) or haemodynamically significant
end-artery or posterior circulation stenosis.
Inclusion Criteria
1. Men and women with a recent cerebrovascular
event assessed in the TIA and minor stroke clinic
of the Oxford Vascular Study.14
2. Consenting participants in the Oxford Vascular
Study.
3. Aged ≥18 years.
4. Written informed consent.
5. Able to perform home blood pressure monitoring.
6. BP >140/90 in clinic
HO
ME
MO
NIT
OR
ING
A
SC
ER
TA
INM
EN
T C
LIN
IC
1 M
ON
TH
C
LIN
IC
Patient assessed in TIA / stroke clinic + recruited to OXVASC
Assessed for eligibility for
study
Undergo physiological tests: TCD +
Arteriograph
Treated with standard care
Amlodipine or perindopril as per standard
care
24 hour ABPM fitted
Not
Significant side-effects on 5mg:
to standard care
Dose increased at 1 week if still
hypertensive
Undergo physiological tests: TCD +
Arteriograph
Review in 1 month FU clinic
Treated with standard care
24 hour ABPM on day before 1
month FU
Undergo physiological tests: TCD +
Arteriograph
24 hour ABPM on day before 1
month FU
Physiological Study Standard Care
Defined allocation to
amlodipine 5mg or perindopril
5mg
Undergo TCD
296
We recently demonstrated that increased medium term visit-to-visit variability in systolic blood pressure (SBP) is associated with an increased risk of stroke in 3 cohorts of patients with previous TIA or stroke and 2 cohorts of patients with hypertension, independent of mean SBP.1, 2 Further studies have also demonstrated associations with total mortality,3 vascular mortality,4 cerebral white matter disease (leaukoaraiosis)5, 6 and cognitive dysfunction7. The association between medium-term variability and stroke can also be measured on day-to-day home blood pressure monitoring,8 and more weakly with 24 hour ABPM.1 However, the physiological basis for the association between blood pressure variability and stroke risk remains unclear with no published studies directly measuring the relationship between changes in medium-term blood pressure variability and changes in cerebral perfusion or systemic BP-related physiological indices.
A number of recent studies have demonstrated a relationship between cerebral pulsatility and both recurrent stroke9 and cerebral white matter disease,10 but the physiological determinants of cerebral pulsatility and leukoaraiosis are unclear. However, our recent study11 in 100 patients with TIA or minor stroke demonstrated a strong relationship between central aortic stiffness, aortic blood pressure, cerebral pulsatility and the resulting severity of leukoaraiosis on MRI, providing a pathophysiological explanation for the relationship between cerebral pulsatility with leukoaraiosis, in which increased central aortic stiffness results in both increased aortic pulsatility and increased transmission of the pulsatile arterial waveform to the cerebral circulation. The exposure of the small vessels of the brain to increased pulsatility then results in vessel rarefraction, leukoaraiosis and an increased risk of stroke.
A possible explanation for the association between increased blood pressure variability and stroke risk is that increased blood pressure variability, arterial stiffness and cerebral pulsatility represent different facets of the same hypertension-related vascular phenotype. These measures are all strongly related to age and therefore any associations in an observational study are strongly confounded by age and gender. A less confounded method of investigating the potential relationship between arterial stiffness, cerebral pulsatility and blood pressure variability is to pharmacologically increase one measure and determine if there are strongly associated effects on the potentially associated measures. It is now well established that different antihypertensive medications reduce blood pressure variability. In the ASCOT-BPLA study, a calcium channel blocker (amlodipine) reduced blood pressure variability compared to a beta-blocker based regimen,12 explaining the unexplained difference in stroke risk between the two arms. In addition, our meta-analysis of all published trials demonstrated that there is a significant reduction in both blood pressure variability and stroke risk in patients treated with calcium channels blockers compared to either beta-blockers or angiotensin converting enzyme inhibitors (ACEi).13 We recently carried out a pilot physiological study in 10 healthy volunteers to determine the feasibility of treatment with an antihypertensive agent to induce a reduction in blood pressure variability (amlodipine) compared to an agent to increase blood pressure variability (propranolol) in order to investigate the relationship between central aortic blood pressure and cerebral pulsatility (REC: 11/SC/0415). There were no serious adverse events with either treatment and the test procedures were both reliable and tolerable, however there was limited power in this small study to investigate these relationships due to its size and the efficient vascular adaptation in young individuals with healthy cerebral circulations. Furthermore, this study did not assess medium-term blood pressure variability, which is more strongly associated with stroke risk than ambulatory blood pressure variability. Therefore, we aim to test the hypothesis that induced changes in blood pressure variability are associated with changes in cerebral pulsatility and central aortic blood pressure in a larger population of patients with TIA or minor stroke who already require initiation of antihypertensive treatments.
This study will be carried out as a physiological substudy of the observational BP-monitoring cohort within the Oxford vascular study (OXVASC OREC A: 05/Q1604/70). Within this study, patients are recruited at the time of their initial assessment with a TIA or minor stroke, when they also undergo a transcranial Doppler study. They undergo 1 month
297
of telemetric Bluetooth home blood pressure monitoring followed by 24 hour ambulatory blood pressure monitoring and a physiological assessment at one month including a repeat transcranial Doppler ultrasound and measure of arterial measures with the Arteriograph. During the home monitoring period, they are actively treated for hypertension according to current guidelines with the specific antihypertensive agent chosen by the treating physician according to standard care, with the commonest agents prescribed being either perindopril arginine (an ACE inhibitor) or amlodipine (a calcium channel blocker). Therefore, this study will measure relationships between changes in aortic stiffness, central aortic blood pressure, cerebral pulsatility, 24 hour ambulatory blood pressure variability and home blood pressure variability between ascertainment to the OXVASC study and the one month follow-up visit. Differences in blood pressure variability between individuals will result from allocation to either amlodipine or perindopril arginine, in accordance with standard care and current guidelines, but with equal numbers of participants allocated each drug. Primary Objective: Is there a relationship between changes in arterial stiffness, aortic blood pressure and cerebral pulsatility with changes in home blood pressure variability in hypertensive individuals with recent cerebrovascular disease? Secondary Objectives:
3. Is there a relationship between changes in arterial stiffness, aortic blood pressure
and cerebral pulsatility with changes in ambulatory blood pressure variability in
hypertensive individuals with recent cerebrovascular disease?
4. Is there an association between cerebral pulsatility and both home and ambulatory
blood pressure variability, independent of central aortic measures?
Endpoints 1. SBP variability on home and ambulatory blood pressure monitoring
2. Aortic SBP, DBP and pulse pressure
3. Aortic pulse wave velocity
4. Middle cerebral artery pulsatility – Gosling’s pulsatility index
Study Design
The study is a human-subject, laboratory and clinic-based experiment to determine relationships between changes in physiological variables, resulting from established effects of commonly used antihypertensive medications. Physiological testing will be performed in 50 hypertensive participants with cerebrovascular disease, before and after 1 month of home blood pressure monitoring. Inclusion Criteria
4. Men and women with a recent cerebrovascular event assessed in the TIA and
minor stroke clinic of the Oxford Vascular Study.14
5. Consenting participants in the Oxford Vascular Study.
6. Aged ≥18 years.
7. Written informed consent.
8. Able to perform home blood pressure monitoring.
9. BP >140/90 in clinic
Exclusion Criteria 1. Unable or unwilling to provide informed consent, including an individual, who, in
the opinion of the investigator may be unable to comply with the requirements of
the protocol.
298
2. Recent non-cerebrovascular cardiovascular event: myocardial infarction,
unstable angina, peripheral vascular disease or new heart failure.
3. Major organ disease likely to affect blood pressure or physiological indices: liver
disease, renal impairment (creatinine >150 or eGFR<50), autonomic failure,
Parkinson’s disease, prosthetic cardiac valve.
4. Pregnancy.
5. Current treatment with ACE inhibitor, angiotensin-receptor blocker or calcium
channel blocker.
6. Clinical need for treatment with either ACEi or CCBs: heart failure or renal
failure.
7. Atrial fibrillation.
8. Contraindication to treatment with calcium channel blockers or ACE inhibitors:
heart failure, previous adverse reaction, bilateral carotid stenosis (>70%) or
haemodynamically significant end-artery or posterior circulation stenosis.
Recruitment Participants will be recruited from the TIA and minor stroke assessment clinic of the Oxford Vascular Study, at the time of ascertainment to OXVASC study and following informed consent. All patients with a new TIA or minor stroke within the OXVASC study area are referred to this assessment clinic by local GP practices who participate in the OXVASC study, as part of their clinical care following a TIA or non-disabling stroke. All consecutive patients fulfilling the inclusion and exclusion criteria will be offered the opportunity to participate, with the Clinical Fellow Responsible for the clinic identifying appropriate participants. Withdrawal Participants will provide formal consent for use of their data, and any participant will be entitled to withdraw from the study at any stage, and may withdraw consent for the use of any or all information gathered as part of this study. They will be asked if we can use all data gathered up to the point of withdrawal, but they will be entitled to withdraw consent to the use of this data. Study procedures Study Summary Participants will be recruited from the TIA and minor stroke clinic associated with the population-based, observational Oxford Vascular Study (OXVASC). The OXVASC population consists of about 92,000 individuals registered with 100 primary-care physicians in nine practices in Oxfordshire, UK, with very high ascertainment of cerebrovascular events through multiple overlapping methods of ascertainment.15 All patients requiring treatment for probable TIA or stroke undergo a standardised medical history and examination by the stroke physician or neurologist in the clinic, ECG and routine blood tests, with face-to-face follow up at 1, 3, 6, 12 and 60 months. When not contraindicated, patients then undergo a stroke protocol MRI brain and contrast-enhanced MRA of the extracranial brain-supplying arteries during the assessment clinic, with the remaining patients having a CT-brain and either a carotid Doppler ultrasound or CT-angiogram. The majority of patients with TIA and minor stroke also undergo transcranial Doppler ultrasound in the acute clinic. Participants to this study perform home blood pressure monitoring with a Bluetooth-enabled, telemetric home blood pressure monitor, 3 times a day, taking three readings at each sitting for at least one month. Treatment is initiated either at the assessment clinic or after 1 week of home blood pressure readings if indicated according to national guidelines. Choice of antihypertensive agent is left to the treating physician, but in accordance with guidelines most patients are treated with either a perindopril-based
299
treatment or an amlodipine-based regimen as standard care, with titration of drug dose, or addition of a second agent, after 1 week of further home blood pressure monitoring. At the one month face-to-face follow-up, all patients then undergo a 24 hour ambulatory blood pressure monitor to assess for adequate blood pressure control and a repeat physiological assessment including transcranial Doppler ultrasound and Arteriograph. Participants fulfilling the eligibility criteria for this physiological study (see above), will have exactly the same clinical care and diagnostic investigations as all patients presenting to the OXVASC clinic, and will perform the same blood pressure monitoring procedures. In addition to the transcranial Doppler ultrasound performed in the acute clinic as part of OXVASC, they will also have arterial measures taken with the Arteriograph, adding approximately 5 minutes to the initial assessment clinic. This will measure central aortic blood pressure and aortic stiffness.16, 17 Cerebral pulsatility and other cerebrovascular haemodynamic parameters will be measured by transcranial Doppler ultrasound (DWL Doppler Box).11 In addition to the tests carried out as part of OXVASC, participants will also undergo ambulatory blood pressure monitoring for the subsequent 24 hours, which will be fitted during the acute clinic. As in the overall OXVASC study, participants who are hypertensive in the assessment clinic will start antihypertensive treatment as soon as is feasible. However, rather than allowing a free choice of antihypertensive agent, equal numbers of participants will be allocated to one of two drugs, where either drug is equally acceptable according to guidelines and standard care: perindopril arginine 5mg or amlodipine 5mg, with titration of the dose of each agent to 10mg after 1 week, unless normotension has been achieved. Drug choice will be randomly allocated to facilitate unbiased comparisons of physiological associations, in accordance with CAMARADES recommendations for experimental stroke studies. At the one month follow-up visit, the physiological tests and a 24 hour ambulatory blood pressure monitor will be repeated. If normotension has been achieved at 1 month, then participants will stop home blood pressure monitoring, but if they are still hypertensive they will continue with home blood pressure monitoring as part of the OXVASC study, with selection of antihypertensive medication at the physician’s discretion. Throughout the study, all participants will have an open access telephone number to contact during working hours. The physiological tests (transcranial Doppler ultrasound and Arteriograph measures) will be performed during the assessment clinic in Neurosciences Outpatients and at the one month follow up clinic in the Cardiovascular Clinical Research Facility at the John Radcliffe Hospital, either by Neurology Research Fellows (LL / MT) or by the senior vascular scientist (JD). Telemetric home blood pressure and treatment is monitored as part of OXVASC by Stroke Research Fellows (NL / AW). Blood pressure measurement Office blood pressure will be measured at baseline and follow up with an automated ‘AND’ brachial blood pressure device with an appropriately sized cuff. 3 measurements will be taken from the non-dominant arm after 5 minutes of quiet rest in a sitting position. Home blood pressure will be measured by all participants. Readings will be performed in sets of three measurements, three times daily (on waking, mid-morning and before sleep) with a Bluetooth-enabled, regularly-calibrated, telemetric BP monitor, either an IEM Stabil-o-Graph or an A&D UA-767 BT. Participants will be asked to relax in a chair for 5 minutes before performing readings in the non-dominant arm, or the arm with the higher reading if the mean SBP differed by >20mmHg between arms, and are trained and assessed at doing so at the assessment clinic. Anonymised measures are transmitted by Bluetooth radio to a mobile phone, for secure transmission to a server hosting a password-protected website for daily review and download of readings (t+ Medical, Abingdon, UK). At baseline and the 1 month follow-up visit, ambulatory blood pressure monitoring (ABPM) will be performed with an A&D TM-2430 monitor in the non-dominant arm, fitted by a trained study nurse, at 30 minutes intervals during the day and 60 minute intervals at night. During a reading, participants will be asked to sit down and refrain from excessive activity if possible and are asked to keep a diary of the day. Participants are instructed in how to
300
operate the monitor, and to switch the monitor off. Currently ABPM is only performed at 1 month as part of OXVASC. Physiological Testing The physiological measurements will be performed at each clinic visit and take approximately 30 minutes to perform. Currently, transcranial Doppler ultrasound is performed at both ascertainment and 1 month, whilst Arteriograph measures are only performed at 1 month. All tests will be performed after at least 5 minutes of supine rest. The following tests will be performed: Central Aortic Blood Pressure / Aortic Pulse Wave Velocity Central aortic blood pressure and aortic pulse wave velocity will be determined with an Arteriograph.16, 17 This records brachial arterial waveforms with a blood pressure cuff inflated to 35mmHg supra-systolic pressure for 6-8 seconds. This procedure is very similar to a normal blood pressure measurement and exposes the participants to no additional discomfort or risk. The recorded waveforms are then automatically analysed to derive central aortic blood pressure via a proprietary transfer function. Aortic pulse wave velocity is estimated from the interval between the forward travelling aortic waveform and its reflection from the aortic bifurcation, both waves being recordable at the brachial artery. This time period is divided by the aortic length, estimated by the symphisis-sternal notch length. Augmentation index (AIx) quantifies augmentation of central aortic pressure (due to the reflected component of the pressure waveform) and typically increases with age as the arteries become stiffer (or less compliant).18 AIx is calculated as the difference between the second (P2) and first systolic peak pressure (P1), expressed as percentage of the central pulse pressure (PP): AIx (%) = ((P2-P1)/PP)*100. Transcranial Doppler Ultrasound (TCD) TCD will be performed with a DiaMon 2MHz hand held probe, with spectra acquired by a DWL Doppler Box to a dedicated laptop. The M1 segment of the middle cerebral artery will be identified bilaterally via a trans-temporal bone window (anterior to the ear and above the zygoma). The M1 segment will be identified between 50-60mm depth as the segment of the artery with blood flow towards the probe, slightly superficial to a site of bifurcation into another vessel with flow away from the probe (the anterior cerebral artery), with blood flow towards the probe extending for at least 1cm within the skull. The peak, trough and mean blood flow velocities will be derived from the wave form envelope. From these measures Gosling’s pulsatility index will be derived as the primary measure of cerebral pulsatility.11 Blood Pressure Treatment Participants will be eligible for the study if they are hypertensive in clinic (>140/90 mmHg). Furthermore, they must not be on an ACEi or CCB and must not have a specific clinical indication for or contraindication to one of these drugs (see above). Participants on other antihypertensive medications except for renin-angiotensin receptor antagonists are eligible. Treatment will be initiated as for the overall OXVASC study, in which drugs are openly prescribed by the study physician in the clinic, or else a prescription is sent via the post after a telephone consultation. In accordance with CAMARADES recommendations for experimental stroke studies, drug allocation will be carried out by randomised allocation, stratified by age and gender, by the Stroke Prevention Unit statistician (ZM), who will be blinded to clinical details except for age and gender. Participants will be allocated to either perindopril arginine 5mg or amlodipine 5mg, with titration to 10mg of each drug if normotension (mean <130/80) is not achieved after 1 week of home monitoring. As for the OXVASC study, the patient’s GP will be informed regarding the prescribed treatment. Participants will continue on the higher dose of the drug (or the lower dose if normotensive at 1 week) until the one month clinic appointment. However, in the case of significant side-effects on the lower dose of the drug requiring its cessation, or excessively low BP (20% of readings <90/60mmHg), then the drug will be stopped and the patient will be excluded from the physiologically substudy at that point. However, they will then continue monitoring as
301
part of the overall OXVASC study. If the blood pressure remains excessively high and further treatment is clinically indicated prior to one month (mean or 50% of readings >160/100 or frequent readings >180/110), then the addition of indapamide 2.5mg will be recommended unless contraindicated. If at one month the patient is still hypertensive (BP >130/80) then the patient will continue to monitor as part of the overall OXVASC study, with antihypertensive treatment at the physician’s discretion. Randomisation Random allocation will be performed stratified by age (into <50, 50-65, 65-80 and >80 groups) and gender. The allocation procedure will be performed by a random computerised allocation method using in-house software, carried out by members of the Stroke Prevention Research Unit who are blinded to clinical data. Summary of additional procedures As part of this study, most procedures are already carried out within the Oxford vascular study. No additional visits to the hospital will be required for the study, but a study nurse will make one additional visit to the participant’s home to retrieve the 24 hour blood pressure monitor. In addition to the standard procedures carried out as part of OXVASC, participants will also undergo measurement of arterial stiffness with the Arteriograph at baseline, and an additional 24 ambulatory blood pressure monitor. Finally, choice of antihypertensive for participants will be determined by computer-assisted randomisation between amlodipine and perindopril, as opposed to the choice being determined by the treating physician. No other procedures or interventions in addition to those performed as part of OXVASC are required. Potential risks and Adverse Events Both medications used in this study are recommended as part of national guidelines for use in this patient group for the indications stated in this study, without a definitive preference for either agent. They are both very well-tolerated, with limited side-effects and an overall net benefit for use in this patient group.19 Risk of side-effects: The most common side-effects of amlodipine include postural dizziness, ankle oedema, flushing and headache. The most common side-effects of perindopril include postural dizziness, dry cough and sleep disturbance. Rare but more serious potential complications of treatment include heart failure with amlodipine and renal impairment or angioedema with perindopril arginine. In addition, there is a very low risk of idiosyncratic allergic reactions to either agent. To reduce the likelihood of serious complications, subjects at risk of heart failure or renal failure will be excluded. Secondly, participants will be warned of the above possible side-effects prior to consenting to the study, and will be provided with a telephone number to contact the study investigators directly if they experience them, and if necessary will be reviewed immediately. BP monitoring, cerebrovascular pulsatility and assessment of aortic stiffness and central aortic blood pressure consist of standard BP measurement methods and transcranial Doppler ultrasound, neither of which pose any additional risk to participants.
Serious Adverse Events
A serious adverse event is any untoward medical occurrence that:
Results in death,
Is life-threatening,
NOTE: The term "life-threatening" in the definition of "serious" refers to an event in which
the participant was at risk of death at the time of the event; it does not refer to an event
which hypothetically might have caused death if it were more severe.
Requires inpatient hospitalisation or prolongation of existing hospitalisation,
302
Results in persistent or significant disability/incapacity, or
Is a congenital anomaly/birth defect.
Other important medical events.*
*Other events that may not result in death, are not life threatening, or do not require
hospitalisation, may be considered a serious adverse event when, based upon appropriate
medical judgement, the event may jeopardise the participant and may require medical or
surgical intervention to prevent one of the outcomes listed above.
*Other events that may not result in death, are not life threatening, or do not require hospitalisation, may be considered a serious adverse event when, based upon appropriate medical judgement, the event may jeopardise the participant and may require medical or surgical intervention to prevent one of the outcomes listed above. Reporting Procedures for Serious Adverse Events A serious adverse event (SAE) occurring to participant would be reported to the REC that gave a favourable opinion of the study where in the opinion of the Chief Investigator the event was: ‘related’ – that is, it resulted from administration of any of the research procedures; and ‘unexpected’ – that is, the type of event is not listed in the protocol as an expected occurrence. Reports of related and unexpected SAEs would be submitted within 15 days of the Chief Investigator becoming aware of the event, using the NRES report of serious adverse event form. Only events occurring during the first month of treatment, prior to the 1 month follow up clinic will be deemed eligible to be SAEs. In addition, the CI will report any related and unexpected SAE’s to the MHRA using the Yellow Card System and to the Sponsor. Confidentiality and Data Protection All participants will be participants of the Oxford Vascular Study and will be allocated a unique ID number associated with this study. Their full clinical details are retained as part of the OXVASC study within the premises of the Stroke Prevention Research Unit, except when required as part of the patient's clinical care. Any further use of data for analysis both within the unit or outside of the unit will use data only identifiable by this unique ID number and date of birth. Responsible members of the University of Oxford or the Oxford University Hospitals NHS Trust may be given access to data for monitoring and/or audit of the study to ensure we are complying with regulations. Research data will be stored on the University of Oxford Network, and physiological data is acquired with the use of laptops for both transcranial doppler ultrasound and Arteriograph measures. These password-protected laptops are retained within the Laboratory. Finally, all participants in OXVASC have a paper file, also retained in secure storage within the University Department of Clinical Neurosciences. As part of the ongoing Oxford Vascular Study, telemetric Bluetooth-enabled home blood pressure monitoring involves the transmission of encrypted and anonymised blood pressure readings over a data-only mobile telephone connection. Also as part of OXVASC, patients provide details of personal contact information, and 24 hour ambulatory blood pressure machines are often fitted or collected at an individuals home. Statistical Analysis BP variability on monitoring: The 2nd two readings of each set of three readings will be averaged to determine the point estimate of blood pressure at each time of day. The standard deviation (SD), coefficient of variation (SD/mean) and residual coefficient of variation about a 3 day moving average will be calculated for the first seven days compared to the last 7 days of home monitoring, for all measures and at each time of day. The same
303
indices will be determined for the awake and asleep periods of ambulatory blood pressure monitoring. Assessment of arterial stiffness: The Arteriograph provides automated analysis of aortic pulse wave velocity, central aortic BP and augmentation index. Middle cerebral artery TCD measures will be determined from measurement with the proprietary QL software. The primary analysis for this study will be a general linear model to determine predictors of the percentage change in home BP variability from baseline to follow-up. Independent predictors will include change in cerebral pulsatility, central aortic pulse pressure and aortic stiffness and drug allocation, with and without interaction terms between drug allocation and the other three primary indices, individually and in a combined model. Models will be analysed both unadjusted and adjusted for age, gender and significant cardiovascular risk factors. Secondary analyses will be paired analyses comparing baseline and follow readings for each of the four primary measures (BP variability, cerebral pulsatility, aortic blood pressure and aortic stiffness), by drug class allocation. Power Calculation No evidence for the relationship between home BP variability and the physiological parameters in this study has been published, so no accurate power calculation can be determined based upon BP variability. However, the association between central aortic pulse pressure and cerebral pulsatility, (the physiological measures most likely to be related to BP variability) was measured in our previous study.11 To have 80% power of replicating this association in each of the groups assigned a specific drug would require 25 participants per group at a 0.05 level of significance. Funding This study will be funded through the Oxford Biomedical Research Centre and via a Clinical Research Training Fellowship award to AW Insurance and Indemnity Negligent harm: The University has arrangements in place to provide for harm arising from participation in the study for which the University is the Research Sponsor. NHS indemnity operates in respect of the clinical treatment which is provided. Non-negligent harm: The University has arrangements in place to provide for non-negligent harm arising from participation in the study for which the University is the Research Sponsor. Publication Policy The Investigators will be involved in reviewing drafts of the manuscripts, abstracts, press releases and any other publications arising from the study. Authors will acknowledge that the study was Funded by the Oxford Biomedical Research Council and a Medical Research Council Clinical Fellowship. Authorship will be determined in accordance with the ICMJE guidelines and other contributors will be acknowledged. Participants are continued to be followed-up for 10 years as part of the Oxford Vascular Study. Any participants in this Physiological Study will therefore be informed of the results at the appropriate follow-up. Conflict of Interest There are no declared conflicts of interest for any author. References 1. Rothwell PM, Howard SC, Dolan E, O'Brien E, Dobson JE, Dahlof B, et al. Prognostic significance of visit-to-visit variability, maximum systolic blood pressure, and episodic hypertension. Lancet. 2010 Mar 13;375(9718):895-905.
304
2. Rothwell PM. Limitations of the usual blood-pressure hypothesis and importance of variability, instability, and episodic hypertension. Lancet. 2010 Mar 13;375(9718):938-48. 3. Muntner P, Shimbo D, Tonelli M, Reynolds K, Arnett DK, Oparil S. The Relationship Between Visit-to-Visit Variability in Systolic Blood Pressure and All-Cause Mortality in the General Population: Findings From NHANES III, 1988 to 1994. Hypertension. 2011 Jan 3. 4. Kikuya M, Ohkubo T, Metoki H, Asayama K, Hara A, Obara T, et al. Day-by-day variability of blood pressure and heart rate at home as a novel predictor of prognosis: the Ohasama study. Hypertension. 2008 Dec;52(6):1045-50. 5. Havlik RJ, Foley DJ, Sayer B, Masaki K, White L, Launer LJ. Variability in midlife systolic blood pressure is related to late-life brain white matter lesions: the Honolulu-Asia Aging study. Stroke. 2002 Jan;33(1):26-30. 6. Liu W, Liu R, Sun W, Peng Q, Zhang W, Xu E, et al. Different impacts of blood pressure variability on the progression of cerebral microbleeds and white matter lesions. Stroke. 2012 Nov;43(11):2916-22. 7. Nagai M, Hoshide S, Ishikawa J, Shimada K, Kario K. Visit-to-visit blood pressure variations: new independent determinants for cognitive function in the elderly at high risk of cardiovascular disease. J Hypertens. 2012 Aug;30(8):1556-63. 8. Johansson JK, Niiranen TJ, Puukka PJ, Jula AM. Prognostic value of the variability in home-measured blood pressure and heart rate: the Finn-Home Study. Hypertension. 2012 Feb;59(2):212-8. 9. Wijnhoud AD, Koudstaal PJ, Dippel DW. The prognostic value of pulsatility index, flow velocity, and their ratio, measured with TCD ultrasound, in patients with a recent TIA or ischemic stroke. Acta Neurol Scand. 2011 Oct;124(4):238-44. 10. Kidwell CS, el-Saden S, Livshits Z, Martin NA, Glenn TC, Saver JL. Transcranial Doppler pulsatility indices as a measure of diffuse small-vessel disease. J Neuroimaging. 2001 Jul;11(3):229-35. 11. Webb AJ, Simoni M, Mazzucco S, Kuker W, Schulz U, Rothwell PM. Increased cerebral arterial pulsatility in patients with leukoaraiosis: arterial stiffness enhances transmission of aortic pulsatility. Stroke. 2012 Oct;43(10):2631-6. 12. Rothwell PM, Howard SC, Dolan E, O'Brien E, Dobson JE, Dahlof B, et al. Effects of beta blockers and calcium-channel blockers on within-individual variability in blood pressure and risk of stroke. Lancet Neurol. 2010 May;9(5):469-80. 13. Webb AJ, Fischer U, Mehta Z, Rothwell PM. Effects of antihypertensive-drug class on interindividual variation in blood pressure and risk of stroke: a systematic review and meta-analysis. Lancet. 2010 Mar 13;375(9718):906-15. 14. Rothwell PM, Coull AJ, Silver LE, Fairhead JF, Giles MF, Lovelock CE, et al. Population-based study of event-rate, incidence, case fatality, and mortality for all acute vascular events in all arterial territories (Oxford Vascular Study). Lancet. 2005 Nov 19;366(9499):1773-83. 15. Rothwell PM, Coull AJ, Giles MF, Howard SC, Silver LE, Bull LM, et al. Change in stroke incidence, mortality, case-fatality, severity, and risk factors in Oxfordshire, UK from 1981 to 2004 (Oxford Vascular Study). Lancet. 2004 Jun 12;363(9425):1925-33. 16. Horvath IG, Nemeth A, Lenkey Z, Alessandri N, Tufano F, Kis P, et al. Invasive validation of a new oscillometric device (Arteriograph) for measuring augmentation index, central blood pressure and aortic pulse wave velocity. J Hypertens. 2010 Oct;28(10):2068 17. Hidvegi EV, Illyes M, Benczur B, Bocskei RM, Ratgeber L, Lenkey Z, et al. Reference values of aortic pulse wave velocity in a large healthy population aged between 3 and 18 years. J Hypertens. 2012 Sep 15. 18. McEniery CM, Yasmin, Maki-Petaja KM, McDonnell BJ, Munnery M, Hickson SS, et al. The impact of cardiovascular risk factors on aortic stiffness and wave reflections depends on age: the Anglo-Cardiff Collaborative Trial (ACCT III). Hypertension. 2010 Oct;56(4):591-7. 19. Law MR, Morris JK, Wald NJ. Use of blood pressure lowering drugs in the prevention of cardiovascular disease: meta-analysis of 147 randomised trials in the context of expectations from prospective epidemiological studies. Bmj. 2009;338(may19 1):b1665