THE DETERMINANTS OF MANAGEMENT ACCOUNTING ...
98
THE DETERMINANTS OF MANAGEMENT ACCOUNTING PERFORMANCE AMONG DIPLOMA IN ACCOUNTANCY STUDENTS AT UiTM KEDAH, UiTM PERLIS AND UiTM PERAK INSTITUT PENYELIDIKAN, PEMBANGUNAN DAN PENGKOMERSILAN UNIVERSITI TEKNOLOGI MARA 40450 SHAH ALAM, SELANGOR MALAYSIA PREPARED BY: NORAINI ABDUL RAHIM WAN FAIZAH WAN ABDULLAH MARZLIN MARZUKI SITI SALMAH ABU BAKAR 30 SEPTEMBER 2005
-
Upload
khangminh22 -
Category
Documents
-
view
0 -
download
0
Transcript of THE DETERMINANTS OF MANAGEMENT ACCOUNTING ...

THE DETERMINANTS OF MANAGEMENT ACCOUNTING PERFORMANCE AMONG
DIPLOMA IN ACCOUNTANCY STUDENTS AT UiTM KEDAH, UiTM PERLIS AND UiTM PERAK
INSTITUT PENYELIDIKAN, PEMBANGUNAN DAN PENGKOMERSILAN
UNIVERSITI TEKNOLOGI MARA 40450 SHAH ALAM, SELANGOR
MALAYSIA
PREPARED BY:
NORAINI ABDUL RAHIM WAN FAIZAH WAN ABDULLAH
MARZLIN MARZUKI SITI SALMAH ABU BAKAR
30 SEPTEMBER 2005

'JNIVERSm TEKNO1 OGi MARA MJdM) CAWANGAS KEDAH
v it w -otn
• * • .
■< ' « u - < ?c*s-?„e:
nc to &■*«:.»
NC Td M-tjUOW
M: Te 0t<it?v?3
x * * - Uo<- iap« ».-
Kc T«. OttJini}
No -d W 15531U
to o 'a 'w tt t;K 'e :nii:iiz
$ r£ T 1OG-UiTMSP{HEA 9 i ?j4 April 2GC-4
Peso \cra in , ADdiji Rahim Per.sya'ahUr.iverstti Tekno’.ogi f/ara Ca.vangan Kedah
Puan
CADANGAN PROJEK PENYELIDIKAN
fv'erjjuk kepada perkara di atas. ciT.aklunr.kan bahawa Jawaiankuasa Teknikal Penyelidikan pada dasamya telan membuat persetujuan pada 28 Mac 2004 meluluskan projek penyelidikan kumpulan puan yang bertajuk The Determinant of Management Accounting Performance Among Diploma in Accountancy at UiTM Kedah, UiTM Pedis and UiTM Perak’ dengan beberapa pindaan / penambahbaikan Projek ini akan dijalankan secara berkumpulan dan puan dengan ini bertanggungjawab sebagai Ketua Projek. Temped penyelidikan yang diiuluskan adalah selama satu (1) lahun mulai 1 April 2004 hingga 31 Mac 2005. Perunfukan penyelidikan yang diiuluskan adalah ber.umlah RM10,085.00.
Sehubungan dengan ilu. puan bolehlah menghuoungi Kcordmator Uml Penyeiicikan. Pembangunan dan Pengkormesi(an unluk urusar. se!arjuinya
< * > D —Bahagian Ha! Efcwa Akaserrik
• ctv S-jrcd V Su'at '5:We'oo*- e i ir Darui ar Tc-; 04-456223204 45620 X-2230
Fax 0^-^562223: -::«t !pr-63*&gkeC*‘ <r. «X' Ty
Sek-an. Selama: Maju Jaya
Yang Denar /1
Pengarah Kampus
s k 1 Penolong Naib Canselor (Penyelidikan)2. Timbalan Pengarah Kampus HEA3. Koordinafor UPP4. Penolong Bendahan5. Fail Peribadi
11

TarikhNo. Fail Projek
30 September 2005
Penolong Naib Canselor (Penyelidikan)Institut Penyelidikan, Pembangunan dan Pengkomersilan Universiti Teknologi MARA 40450 Shah Alam Selangor Darul Ehsan
Y. Bhg. Profesor,
LAPORAN AKHIR PENYELIDIKAN “THE DETERMINANTS OF MANAGEMENT ACCOUNTING PERFORMANCE AMONG DIPLOMA IN ACCOUNTANCY STUDENTS AT UiTM KEDAH, UiTM PERLIS AND UiTM PERAK”
Merujuk kepada perkara di atas, bersama-sama ini disertakan tiga (3) naskah Laporan Akhir Penyelidikan bertajuk “The Determinants Of Management Accounting Performance Among Diploma In Accountancy Students At UiTM Kedah, UiTM Perlis And UiTM Perak’"
Sekian. Terima kasih.
Yang benar
NORAINI ABDUL RAHIMKetuaProjek Penyelidikan
iii

KUMPULAN PENYELIDIK
NORAINI ABDUL RAHIM KETUA PROJEK
(Tandatangan)
WAN FAIZAH WAN ABDULLAH
MARZLIN MARZUKI AH LI
(Tandatangan)
SITI SALMAH ABU BAKAR AHLI
' (Tandatangan)
IV

PENGHARGAAN
Setinggi-tinggi penghargaan dan ribuan terima kasih diucapkan kepada scmua pihak yang terlibat secara langsung dan tidak langsung bagi membolehkan
penyelidikan ini disiapkan dengan sempurna.
Di antaranya:
Prof. Madya Dr. Zaliha Haji Hussin (Pengarah Kampus UiTM Cawangan Kedah)
Prof. Madya Dr. Ahmad Redzuan Abdul Rahman (Pengarah Kampus UiTM Cawangan Perlis)
Prof Madya Dr. Abdullah Mohamad Said (Pengarah Kampus UiTM Cawangan Perak)
Puan Zauyah Abdul Razak(Timbalan Pengarah Kampus (HEA) UiTM Cawangan Kedah)
Puan Siti Salmah Abu Bakar (Koordinator URDC UiTM Cawangan Kedah)
Prof Madya Dr. Mohd Baidi Bahari
Semua Kakitangan Bahagian Hal Ehwal Akademik UiTM Cawangan Kedah,Perlis dan Perak
Mohd. Fauzi Abdul Ajis dan Muhammad Shuhaili Samsu
\

TABLE OF CONTENTS:
Acknowledgement V
Contents vi
List of Tables IX
List of Appendices xi
Abstract xii
CHAPTER 1 INTRODUCTION
1.1 Research Background 1
1.2 Research Objectives .>
1.3 Significance of the Study 4
1.4 Scope of the Study 4
1.5 Definition of Terms/Concepts 5
Used in the Objectives
1.6 Theoretical Framework 6
1.7 Research Questions 9
1.8 Hypothesis 10
1.9 Research Report Organization 12
CHAPTER 2 LITERATURE REVIEW
2.1 Background 14
2.2 Grade History 14
2.3 Demographic Background 21
CHAPTER 3 RESEARCH METHODOLOGY
3.1 Study Location 24
Sample Selection 24
A. A Sample Size 25
3.4 Data Collection 26
3.5 Data Analysis 27
3.6 Stepwise Multiple Regression 29
Research Model
VI

CHAPTER 4 RESULTS
CHAPTER 5
4.1 Demographic 31
4.2 Comparison Between the 32
Performance in Each Management
Accounting Course of Students
With and Without SPM Grade
History and Their Demographic
Background
4.3 The Association of Each SPM 36
Subjects and The Performance of
Each Management Accounting
Course
4.4 The Joint Effects of SPM 41
Subjects. Demographic
Background and Prior
Management Accounting Course
on the Performance of Each
Management Accounting Course.
DISCUSSION
5.1 Comparison of Management 45
Accounting Performance Between
Students Who Sat for Accounting.
Additional Mathematics and
Economics in Their SPM and
Those Who Did Not Sit for the
Subjects. School Location and
Gender.
5.2 The Association of the SPM 48
Subjects and the Performance of
Each Management Accounting
Course.
vii

The Joint Effects of SPM 505.3
Subjects, Demographic
Background and Prior
Management Accounting on the
Performance in the Next
Management Accounting Course.
CHAPTER 6 CONCLUSION, RECOMMENDATION
AND LIMITATION
6.1 Conclusion 52
6.2 Recommendation 53
6.3 Limitation 54
References 55
Appendix 60
Research Progress Schedule 86
viii

LIST OF TABLES:
Table 3.1: Total Population According to Campuses and Parts
Table 3.2: Samples According to Campus and Parts
Table 4.1: Demographic Data
Table 4.2: Performance of Each Management Accounting Courses
Between Students With and Without SPM Accounting
Table 4.3: Performance of Each Management Accounting Courses
Between Students With and Without SPM Additional
Mathematics
Table 4.4: Performance of Each Management Accounting Courses
Between Students With and Without SPM Economics.
Table 4.5: Performance of Each Management Accounting Courses
Between Genders
Table4.6: Performance of Each Management Accounting Courses
Between Students from Different Location Of School.
Table 4.7: Correlation Between SPM Accounting and the Performance of
Each Management Accounting Courses.
Table 4.8: Correlation Between SPM Additional Mathematics and the
Performance of Each Management Accounting Courses.
Table 4.9: Correlation Between SPM Economics and the Performance of
Each Management Accounting Courses.
Table 4.10: Correlation Between SPM Mathematics and the Performance of
Each Management Accounting Courses.
IX
T able 4.1 1:
Table 4.12:
Table 4 .13:
Correlation Between SPM English and the Performance of Each
Management Accounting Courses.
Effect of SPM Accounting, SPM Additional Mathematics, SPM
Economics, SPM Modern Mathematics, SPM English and
Demographic Background on MAC210.
Effect Of SPM Accounting. SPM Additional Mathematics. SPM
Economics, SPM Modern Mathematics, SPM English,
Demographic Background and MAC210 on MAC260
Performance.
x

LIST OF APPENDICES:
APPENDIX A:
APPENDIX B:
APPENDIX C:
APPENDIX D:
Syllabus
List of Municipal Councils in Malaysia
Research Form
Results
xi

ABSTRACT
The main objective o f this study is to investigate the determinantscontribute to the success in the performances o f Management Accounting 1 (MAC 210) and 2 (MAC 260) o f Diploma Accountancy students at the northern campuses o f UniversitiTeknologi MARA (Kedah, and Perak).All the data were obtained from the Academic Affairs Department at the respective campuses, t-test, Pearson Correlations and Stepwise Multiple Regression arc used to analyze the data Findings show that the performance o f students with SPM Accounting and SPM A Mathematics are higher for all management accounting courses. Students with SPM Economics performed lower for both courses but the difference is insignificant for Management Accounting 2. The results also show that SPM Accounting, SPM Additional Mathematics, SPM Mathematics and SPM Economics except for SPM English have low positive correlations for MAC 210 and MAC 260. For joint effect, only SPM Economics shows positive influence on both MAC performance. Interestingly, MAC 210 has no effect on MAC 260.
xii

CHAPTER 1
INTRODUCTION
1.1 RESEARCH BACKGROUND
The manufacturing industry has become the main contributor to the growth of the
Malaysian economy. The Economic Report 2004/2005 showed that the
contribution of manufacturing sector to Gross Domestic Product was expected to
grow from 30.8% in 2003 to 32.3% in 2005. With the increase in manufacturing,
the demand for management accountants will also be high.
Besides working in the manufacturing industry, management accountants also
work in many other different sectors such as banking and financial services,
engineering, tourism and government. Their expertise is highly demanded
because the management accountants are able to strategize in key areas of
management
The Chartered Institute of Management Accountants (CIMA) offers the
Management Accounting qualification, which combines financial and
management skills. CIMA is a recognized qualification and it is based in the
I

United Kingdom. Malaysia is one of its divisions in 156 countries (Lan,
2000/2001). Besides CIMA, there are many other public and private universities
such as Universiti Teknologi MARA (UiTM) offering the accounting programme.
One of the programmes offered by UiTM which acts as a feeder to CIMA is the
Diploma in Accountancy (DIA). The DIA graduates may pursue their studies for
a Bachelor in Accountancy (BACC) or other accounting professional programmes
such as CIMA and the Association of Chartered Certified Accountant (ACCA).
In order to pursue the CIMA programme and to be a management accountant, the
DIA students must get good results in management accounting papers. There are
two management accounting courses in the DIA programme at UiTM, which are
Introduction to Cost and Management Accounting (MAC210) and Basic
Management Accounting (MAC260). Normally, the failure rates for these two
courses at UiTM Kedah are around 15% to 25%. This motivated the researchers
to study the determinants that influence the performance of these two
management accounting courses.
Most prior studies have shown that the students' academic background affects
their performance in financial accounting courses. However, there were very few
studies conducted on the determinants that affect the students' performance in
management accounting courses. The lack of research in this area suggests that an
investigation should be taken to determine the factors that affect the students'
performance. Therefore, the factor to be focused is the academic background.

which is the Sijil Pelajaran Malaysia (SPM) results. The entry requirement for this
programme requires candidates to pass with credit in Modern Mathematics.
English and three other subjects. This leads to a situation where students have
slight variations in their academic background such as having taken Accounting,
Additional Mathematics and Economics.
1.2 RESEARCH OBJECTIVES
The main objective of this study was to identify and determine the significant
factors that influence the DIA students’ performance in management accounting
courses at UiTM.
The other objectives of the research were:
1.2.1 To look at the effects on management accounting performance between
students who have taken and students w'ho have not taken each SPM
subject (Accounting, Additional Mathematics and Economics) and their
demographic background.
1.2.2 To determine the correlations between the performance in each SPM
subject (Accounting, Additional Mathematics. Economics, Modern
Mathematics and English) and the performance of the students in
management accounting courses.

1.2.3 To look at the joint effects of SPM subjects (Accounting. Additional
Mathematics, Economics, Modem Mathematics and English),
demographic factors and prior management accounting course.
1.3 SIGNIFICANCE OF THE STUDY
This study could be of importance to the accounting profession particularly in the
area of management accounting because most of the previous studies on
accounting performance seldom focus on management accounting. Besides,
the results of this study will benefit the lecturers by increasing their understanding
of the differential performance among students and in evaluating new
developments in the teaching of management accounting courses. The findings
also could help the school students in evaluating the suitability of pursuing a DIA
programme because the management accounting is an important course in the
programme.
1.4 SCOPE OF THE STUDY
This is a limited study which was conducted on students pursuing the DIA
programme at UiTM Kedah. UiTM Perlis and UiTM Perak. The populations were
DIA students in parts 5. 6, 7. 8 in the November 2002 - April 2003 semester, who
had completed MAC 2 10 and MAC 260.
4

1.5 DEFINITION OF THE TERMS/CONCEPTS USED IN THE OBJECTIVES
MAC 210 is defined as an introductory course and MAC 260 is defined as an
intermediate course. MAC 210 - Introduction to Cost and Management
Accounting covers the following topics:
■ Introduction to Cost Accounting
■ Material
■ Labour
■ Overheads
■ Job and Batch Costing
■ Contract Costing
■ Process Costing
MAC 260 - Basic Management Accounting covers the following topics:
■ Introduction to Management Accounting
■ Marginal and Absorption Costing
■ Cost Volume Profit
■ Budgeting
■ Decision Making
■ Standard Costing and Variance
1.5.1 Dependent variables
Student performance in each management accounting course.

1.5.2 Independent variables:
1.5.2.1 Academic Background
1.5.2.1.1 SPM Accounting
1.5.2.1.2 SPM Additional Mathematics
1.5.2.1.3 SPM Economics
1.5.2.1.4 SPM Modern Mathematics
1.5.2.1.5 SPM English
1.5.2.1.6 Prior management accounting course at UiTM
1.5.2.2 Demographic background
1.5.2.2.1 Gender (male and female)
1.5.2.2.2 School location (urban and rural)
Schools located in municipal councils are considered as urban
schools while schools located outside the municipal councils are
considered as rural schools. This is based on the definition given
by the Malaysian Education Department. The list of the
municipal councils is given in Appendix A.
1.6 THEORETICAL FRAMEWORK
1.6.1 The comparison betw een students who have taken and those who have not
taken each SPM subject (Accounting. Additional Mathematics and
6

Economics) and their demographic background with student performance
in management accounting courses.
Figure: 1.1
1.6.2 The correlation between the performance in each SPM subject
(Accounting, Additional Mathematics. Economics. Modern Mathematics
and English), demographic background and the students' performance in
management accounting courses.
7

Figure: 1.2
1.6.3 The joint effects of SPM subjects (Accounting. Additional Mathematics.
Economics, Modern Mathematics and English), and demographic
background on the performance in MAC 210.
Figure: 1.3
8

1.6.4 The joint effect of SPM subject (Accounting, Additional Mathematics.
Economics, Modern Mathematics and English), demographic background
and the performance in MAC 210 on the student performance in MAC
260.
Figure 1.4
1.7 RESEARCH QUESTIONS
1.7.1 Do students who ha\e taken Accounting, Additional Mathematics, and
Economics in SPM perform differently in each management accounting
course from those students who have not taken the subjects?
9

1.7.2 Do the demographic factors (gender and school location) affect the
students’ performance in each management accounting course?
1.7.3 Does the performance in each SPM subject (Accounting, Additional
Mathematics, Economics, Modern Mathematics and English) correlate
with the student performance in each management accounting
course?
1.7.4 Does the academic background at SPM level (Accounting, Additional
Mathematics, Economics, Modern Mathematics and English), prior
management accounting course and demographic background jointly
affect the student performance in management accounting
courses?
1.8 HYPOTHESES
HO| : There is no significant difference in the performance of each
management accounting course between students who have taken
and students who have not taken SPM Accounting.
HOi : There is no significant difference in the performance of each
management accounting course between students who have taken
and students who have not taken SPM Additional Mathematics.
10

There is no significant difference in the performance of each
management accounting course between students who have taken
and students who have not taken SPM Economics.
There is no significant difference between gender on the
performance in each management accounting course.
There is no significant difference in each management accounting
course performance between school locations.
There is no correlation between SPM Accounting and the
performance in each management accounting course.
There is no correlation between SPM Additional Mathematics
performance in each management accounting course.
There is no correlation between SPM Economics and the
performance in each management accounting course.
There is no correlation between SPM Modern Mathematics and the
performance in each management accounting course.

H0|o There is no correlation between SPM English and the performance
in each management accounting course.
HO|| : SPM Accounting, SPM Additional Mathematics, SPM Economics,
SPM Modern Mathematics, SPM English and demographic
background have no significant effect on MAC 210 performance.
HO12 : SPM Accounting, SPM Additional Mathematics, SPM Economics,
SPM Modern Mathematics, SPM English, demographic
background and MAC 210 have no significant effect on MAC 260
performance.
1.9 RESEARCH REPORT ORGANISATION
The report consists of five chapters. Chapter One highlights the research
background where the objectives, significance of the project, definition of the
terms used, scope of the project, theoretical framework, research questions and
hypotheses of the research are discussed. The literature review' is presented in
Chapter Two. This chapter discusses previous reports related to the factors that
influence students' performance in accounting courses. The following chapter
discusses on the research methodology. It elaborates on the technique for
collecting data, data sampling, and the method for analyzing data.
12

Chapter Four focuses on the research findings. Tables and charts are used
appropriately to facilitate understanding of the data. The discussions of the
findings are covered in Chapter Five. The last chapter presents the conclusion and
limitation of the research. This research report also suggests recommendations for
further improvement in the future.
13

CHAPTER 2
LITERATURE REVIEW
2.1 BACKGROUND
There are several prior studies that have been conducted on students’ performance
in accounting courses. The studies found that the students’ performance can be
influenced by many factors. These factors include aptitude, motivation, effort,
gender, group or team study involvement and previous academic achievement
(Williams, Cheng, Lim & Yow, 1995).
2.2 GRADE HISTORY
In Malaysia, a study by Lai Mooi Tho (1994) at University of Malaya found that
three academic factors, specifically, high school accounting, mathematics and
economics, are important predictors of performance in a first-level tertiary
accounting course. The academic courses to be focused on by the researchers in
this study are as follows:
14

2.2.1 Accounting
Earlier studies showed that previous exposure to bookkeeping and
performances in tertiary introductory accounting courses have a positive
association (Bergin 1983). This result is supported by Gul and Fong
(1993), Auyeung and Sands (1994) and Lai Mooi Tho (1994). In
Malaysia, a study done by Lai Mooi Tho (1994) revealed that students
who took STPM Accounting do better in their first year accounting
examination (which consists of 30 percent management accounting topics)
than those who did not take the subject. The results indicate that the
performance in accounting and STPM Accounting is positively correlated
Williams et. al. (1995) showed that studying bookkeeping courses at high
school or any equivalent level may help students in initial accounting
courses (Financial Accounting I and Cost and Management Accounting I),
but it is not significant for attaining good performance in higher level
accounting courses (Financial Accounting II and Cost and Management
Accounting II). The Performance in initial accounting courses (Financial
Accounting I and Cost and Management Accounting I) is significantly
positively correlated with the performance in second year accounting
courses (Financial Accounting II and Cost and Management Accounting
II). The study is supported by Hill. Stratton and Edwards (1996). There is
a strong positive relationship between students' performance in the first
tw'o accounting courses and that the fundamentals of bookkeeping studied
15

in the first course are significant to the second accounting course
(Accounting II which includes parts of management accounting topics)
performance. A study by Didia and Hasnat (1998) showed that good
performance in accounting enhances performance in the Introductory
Finance course.
There are a few research that revealed contradictory results from the
above studies. Keef and Roush (1988) studied the effect of performance in
the three segments of accounting, which are Financial Accounting,
Financial Management and Management Accounting. He found that the
level of previous study in accounting had no effect on performance in the
course as a whole (p=0.63) or in the three segments of Financial
Accounting (p=0.76), Financial Management (p=0.22) and Management
Accounting (p=0.72). These results are in agreement with the prior studies
by Baldwin and Howe (1982) and Mitchell (1985).
Bartlett. Peel and Pendlebury (1993) who used univariate analysis in their
study found that prior study of accounting (at ‘A' or '0 ' level) did not
appear to confer any significant advantage on students in their first year
or final year examination in Financial Accounting and Management
Accounting even though it shows a significant relationship with
performance in the initial test.
16

Doran, Bouillon and Smith (1991) used multiple regression methodology
to assess the relative importance of various factors in predicting students'
performance in Accounting Principle I (Financial Accounting) and
Accounting Principle II (Financial Accounting and Management
Accounting). The result suggests that high school bookkeeping appears to
benefit only in studying five to six chapters of Accounting Principle I.
2.2.2 Mathematics
Studies by Roy and Macneill (1967) and Clark and Sweeney (1985) (as
cited in Gist and Goedde, 1996), found that mathematics and calculus are
essential areas of study for accountants. A few studies have examined the
relationship between mathematics and the performance of students in
Accounting. Gul and Fong (1993) and Wan Faizah, Noraini. Siti Salmah,
Marzlin and Wan Zulkipli (2005) found that previous knowledge of
mathematics have positive and significant effects on student performance
in introductory accounting courses. Eskew and Faley (1988) identified that
the students with more university study hours in mathematics and statistics
perform better than the other students in first year accounting.
According to Lai Mooi Tho (1994), students who have sat for STPM
Mathematics perform better than those who have not in the compulsory
17

Introductory Accounting course at University of Malaya which examines
70% on financial accounting and 30% on management accounting.
Williams et al. (1995) found that basic mathematics course at the '0 ' level
and mathematics course at the ‘A' level are the significant predictors in
the students’ performance which is a measure of aggregate performance
over the two first year accounting courses, namely Financial Accounting I
and Cost and Management Accounting 1. T heir studies also identified that
mathematics is significantly and positively correlated with students’
aggregate performance over the two second year accounting courses, i.e..
Financial Accounting 2 and Cost and Management Accounting 2. Hill et
al. (1996) stated that there is a significant positive relationship between
mathematics skill and the students’ performance in the second
introductory accounting course which covers equally financial and
management accounting topics. Keef (1988) reported that the level of
previous study in mathematics did not have an important influence on the
first accounting course as a whole. However, the study showed that
mathematics has an important influence on the management accounting
section in the final examinations as the course tested the students 50% on
management accounting. 25% on financial accounting and 25% on
financial management.
18

A IJK study by Bartlett et ai. (1993) examined the effects of the prior
study in mathematics on the first year and third year management
accounting courses. Their results showed that students who have ‘A’
level mathematics did not, on average, significantly outperform the
students without these qualifications in both the first year and third year
management accounting courses.
2.2.3 English
The literature gathered contain mixed results about the significance of
languange on student performance.
Jackling and Anderson (1998), looked at language as one of the features
of the students’ background to explain the students' performance in an
intermediate accounting course. They surveyed students in a single second
year management accounting subject and found that language has no
significant impact on student performance. Bergevin and Davison (1994),
and Rankin. Silvester. Vallely and Wyatt (2003), also found that language
has no significant impact on performance.
However, Drennan. Rohde and Smith (2002) ( as cited in Wright. Baker
and Perera, 2004) suggested that students whose primary language is
English are likely to outperform others in higher level subjects with less
structured interpretive contents. This has been supported by Wright. Baker
19

and Perera (2004 ). They found that English language proficiency
significantly improves performance in the management accounting course.
In fact, they stated that there is a relative disadvantage to students for
whom English is their second language and the degree of disadvantage
appears to be greater in those subjects which have higher reliance on
language skills.
2.2.4 Economics
A few studies have examined the relationship between students who have
been exposed to economics courses in high school and the performance of
students in the accounting courses. but the results have been inconsistent.
Wan Faizah et.al (2005) found that SPM Economics has a negative effect
on the performance of students in introductory accounting courses.
However, Lai Mooi Tho ( 1994) found that STPM Economics influenced
the performance in the introductory accounting course which tested the
students 30% on management accounting topics.
Keef ( 1988) reported that the level of previous study of economics has an
important influence on the first accounting course as a whole. The major
benefit was associated with the management accounting section which
covers 50% of the final examination questions. The empirical findings in
Bartlett et. al. ( 1993) showed that the most consistent explanatory variable
20

of first and third year management accounting courses examination
performance is the prior study of economics at 'A' Level. However, the
prior study of economics at ‘O' level does not exhibit a similar influence
on all the examination performances.
2.3 DEMOGRAPHIC BACKGROUND
Very few of the demographic variables appear to have a significant influence on
student performance in university accounting examination (Bartlett e t . a l 1993).
The demographic study in this research concentrates on the gender and school
location.
2.3.1 Gender
The literature on the effect of gender on accounting course performance
has shown inconclusive conflicting results. Females perform significantly
better in second year accounting courses but not in first year accounting
courses (Williams et al., 1995). A recent study by Gammie. Paver and
Duncan (2003) showed that females outperformed their male counterparts
in the first year accounting module. However. the\ found no gender
differences in any of the final year module.
On the other hand, males are found to perform better than females. Doran
et al. (1991) found that males perform significantly better in the
introductory accounting course, but not in the second course.

Studies also found that there is no association between gender and
performance. Li pc (1989) as cited in Park. Hayes and Step (1994) found
no gender effects on lower division managerial accounting students’
performance. The results of this study were consistent with studies by
Hanks and Shivaswamy (1985). Mutchler. Turner and William (1987),
Tyson (1989), Canlar and Bristol (1988). Lskew and Faley (1988),
Buckless, Lipe and Ravenscroft (1991), Carpenter. Friar and Lipe (1993)
and Gist and Goedde (1996) Doran et al. (1991), and Keef and Roush
(1997). In Malaysia, a study by Lai Mooi Tho (1994) reported that gender
did not contribute significantly to performance in the first level accounting
course whereas in another study by Wan Faizah et al. (2005) gender did
not significantly affect the accounting performance at the introductory and
intermediate levels.
2.3.2 Residential status
Wan Faizah et al. (2005) found that students from urban schools
performed significantly better only in the first introductory course. In their
study, schools are categorized into rural and urban schools depending on
their location. Schools located in municipal councils are considered as
urban schools whereas schools outside municipal councils are considered
as rural schools.
22

Lai Mooi Tho (1994) found no difference in performance between rural
and urban status schools. It is hypothesized in Lai Mooi Tho's study that
students from urban areas, where educational facilities are well developed
and easily available, would perform better than students from rural areas.
Urban status is defined as schools in capital cities and large towns in the
states of Malaysia.

CHAPTER 3
RESEARCH METHODOLOGY
3.1 STUDY LOCATION
The study was carried out at UiTM northern region namely, UiTM Cawangan
Kedah, UiTM Cawangan Perlis and UiTM Cawangan Perak
3.2 SAMPLE SELECTION
3.2.1 Selection Criteria
Full-time DIA students from parts 5. 6 , 7 and 8 in semester November
2002 - April 2003, at UiTM northern campuses, in Kedah. Perlis and
Perak.
3.2.2 Exclusion Criteria
3.2.2.1 Students with incomplete record in their personal file.
3 ? ? ? Students who have not sat for all management accounting
courses.
3.2.2.3 Students who had sat for STPM
24

3.3 SAMPLE SIZE
Samples were seleeted randomly from Part 5. 6 . 7 and 8 DIA students from IJiTM
northern region campuses who had taken MAC2I0 and MAC260. 85% of'
samples were obtained from each campus population. All respondents were taught
management accounting courses using a common syllabus and sat for a common
final exam paper. The data of the samples are illustrated in fable 3.1 and fable
3.2.
Table 3.1: Total Population According to Campuses and Part
PartCampus
Kedah Perlis Perak
5 62 1 0 1 85
6 72 1 14 114
7 15 42 2 1
8 4 34 1 2
TOTAL 153 291 232
Table 3.2: Samples According to Campus and Part
PartCampus
Kedah Perlis Perak
5 53 86 72
6 61 97 97
7 13 36 18
8 3 29 10
TOTAL 130 247 197
25

The final grade was based on ongoing assessments (40%) and performance in the
final examination (60%). The final examinations were uniformly graded which
provided a control on individual lecturer grading effects. Samples who had not
taken any of the management accounting courses and samples who had taken
STPM were excluded from the final sample.
3.4 DATA COLLECTION
A research form was developed by the researchers to facilitate the data collection.
The study form comprised three different parts (Appendix C).
3.4.1 Part A provided demographic information such as gender, branch campus,
previous school and location of the previous school.
3.4.2 Part B sought information about the respondents' grade history in
Accounting. Mathematics. Additional Mathematics. F.nglish and
Economics at the SPM level.
3.4.3 Part C gathered information regarding the students' grades for
management accounting courses at UiTM.
The data were obtained from the three UiTM branches' academic office records
(Kedah, Perlis and Perak).
26

Data collections were done by the researchers themselves to avoid errors. Only
students’ first attempt grades were taken into consideration for this study. Any
results unavailable in the personal file were sought out in the Integrated Student
Information System (ISIS) at the respective campuses.
3.5 DATA ANALYSIS
Data were analyzed using the Statistical Package for Social Sciences (SPSS)
version 11.0 programme. Missing data (subjects that were not taken at SPM by
the samples) were coded as 0 and the students’ performance were coded I to 9 (1
for poor and 9 for good). The performance in management accounting courses
was coded as 0.00 to 4.33 (0.00 for poor and 4.33 for excellent). Gender was
coded as 0 for male and 1 for female. For the school location, urban was coded as
0 and rural was coded as I.
3.5.1 Comparison between the performance in each management accounting
course of students with and without SPM grade history and their
demographic background.
The differences in the performance of students who had taken each SPM
subject and the students' demographic background were tested using
independent t-test to see the difference between the mean performances
27

between the groups. A p value < 0.05 was considered significant. This
independent t-test was used to test hypotheses I l(,i to I los-
3.5.2 Correlation between the performance in each SPM subject and the
performance of each management accounting course.
Pearson Correlation test was used to evaluate the correlation between the
student performance in each SPM subject and the performance in
management accounting courses. R value of 0.75 or more is considered as
a strong correlation, 0.46 to 0.74 as moderate and less than 0.46 as weak.
A significant level of 0.05 or less is used. This Pearson Correlation was
used to test hypotheses I lor - Hoio-
3.5.3 The joint effects of SPM subjects, demographic background and prior
management accounting courses in the prediction of the performance of
students in each management accounting course.
Stepwise Multiple Regression model was used to analyze the joint effects
of SPM grade history, the demographic background and prior management
accounting courses on the students' performance in each management
accounting course. The Stepwise Multiple Regression model has also
been used by studies on student performance in examination such as
Moses (1987), Eskew and Faley (1988). Gul and Fong (1993). William
28

et.al.C!995) and Lai Mooi Tho (1994). This Stepwise Multiple Regression
Model was used to test hypotheses Hon and Hoi2-
3.6 STEPWISE MULTIPLE REGRESSION RESEARCH MODEL
3.6.1 Model 1
This model was used to examine a set of independent variables which
might potentially iniluence the MAC2I0 performance. The equation for
this model is:
MAC210 = B„ + B/SPMAcc + B + B3SPMAddMath +
BjSPMEng + B$S'PMEco + - B + ej
where:
MAC2I0 = Management Accounting 1 performance
SPMAcc Accounting At SPM Level
SPMMath Mathematics At SPM Level
SPMAddMath Additional Mathematics At SPM Level
SPMEng English At SPM Level
SPMEcon = Economics At SPM Level
Gen Gender (Male. Female)
SchLoc = School Location (I'rban. Rural)
29

3.6.2 Model 2
This model was used to examine a set of independent variables which
might potentially influence the MAC260 performance. The equation for
model 2 is:
MAC260 = B0+B,SPMAcc + BiSPMMalh + B3SPMAddMath +
BjSPMEng + B3SPMEco + B^Gen + BjEchLoc - BgMAC210
where:
MAC260 Management Accounting II performance
30

CHAPTER 4
RESULTS
4.1 DEMOGRAPHIC DATA
The study was carried out on DIA students at UiTM Kedah, Perlis and Perak
branches. The number of samples selected in this study were 574 students from
parts 5, 6 , 7 and 8 and 123 students were excluded from the study due to
incomplete data. The division of the usable data is I 16 from Kedah, 164 from
Perlis and 171 from Perak. Table 4.1 shows the demographic data of the
students.
Table 4.1: Demographic Data
Parameters Number of students Percentage (%)Gender
Male 124 27.5Female 325 72.1
Level of studyPart 5 132 29.3Part 6 256 56.8Part 7 37 OO r~>
Part 8 26 5.8School location
Rural 169 37.5Urban 260 57.6

4.2 COMPARISON BETWEEN THE PERFORMANCE IN EACH
MANAGEMENT ACCOUNTING COURSE OF STUDENTS
WITH AND WITHOUT SPM GRADE HISTORY AND THEIR
DEMOGRAPHIC BACKGROUND
4.2.1 Hqi: There is no significant difference in the performance of each
management accounting course between students who have taken
and students who have not taken SPM Accounting.
Table 4.2: Performance Of Each Management Accounting Course Between Students With And Without SPM Accounting
SPMAccounting N Mean Std.
DeviationStd. Error
MeanSignificant (2 tailed)
Grade Without 192 2.0346 .85863 .06197 0.000Point
MAC210 With 243 2.4158 .88062 .05649
Grade Without 147 2.3627 .86186 .07109 0.006Point
MAC260 With 2 0 2 2.6152 .82800 .05826
The results in Table 4.2 show that the mean performance in all
management accounting courses (MAC210 and MAC260) are
significantly higher for students with SPM Accounting compared to the
performance of students without SPM Accounting. The two-tailed
significant value for all management accounting courses are less than 0.05
and thus H qi is rejected.
32

4.2.2 l-lo2: There is no significant difference in the performance of each
management accounting course between students who have taken
and students who have not taken SPM Additional Mathematics
Table 4.3: Performance Of Each Management Accounting Course Between Students With And Without SPM Additional Mathematics
SPMAdd. Math N Mean Std.
DeviationStd. Error
MeanSignificant (2 tailed)
Grade Without 217 2.1123 .89386 .06068 0 . 0 0 2Point
MAC210 With 218 2.3730 .87572 .05931
Grade Without 165 2.3958 .85875 .06685 0 . 0 2 0Point
MAC260 With 182 2.6096 .83750 .06208
The results in Table 4.3 show that the mean score in the management
accounting courses are consistently higher among the students with SPM
Additional Mathematics compared to those without SPM Additional
Mathematics. The differences in the mean scores are significant for
MAC210 and MAC260 as shown by the significant 2-tailed values of
0.002 and 0.020 respectively. Therefore, H02 is rejected.
4.2.3 H03: There is no significant difference in the performance of each
management accounting course between students who have taken
and students who have not taken SPM Economics.
33

Table 4.4 Performance Of Each Management Accounting Course Between Students With And Without SPM Economics
SPMEconomics N 1
11Mean
jStd.
DeviationStd. Error
MeanSignificant (2 tailed)
Grade Without 293 2.3106 .86245 .05038 0 .0 2 1Point
MAC210 With 146 2.1027 .92910 .07689
Grade Without 237 2.5566 .85061 .05525 0.107Point 1
MAC260 With 1 14 2.4005 .83911 .07859
Table 4.4 shows that the mean performance of MAC210 and M AC260 are
lower for students with SPM Economics as compared to the performance
of students without SPM Economics. The two-tailed significant difference
value for MAC2I0 is 0.021 which indicates a significant difference. The
difference in the MAC260 is not significant (t = 0.107). Therefore, the null
hypothesis H03 is rejected only for MAC2 10.
4.2.4 H04: There is no significant difference between gender on the
performance in each management accounting course.
Table 4.5: Performance Of Each Management Accounting CourseBetween Gender
Gender N Mean Std.Deviation
Std. Error Mean
Significant (2 tailed)
Grade Female 318 j 2.3134 .88440 .04959 0.006Point
MAC210 Male 1 19 2.0532 .88607 .08123
Grade Female 256 2.5480 .85325 .05333 0.184Point
MAC260 Male 93 2.4116 .82582 .08563
34

The results in Table 4.5 show that female students perform significantly
better than their male counterparts (t = 0.006) in the Management
Accounting MAC 210. The difference in performance, however,
diminished in Management Accounting MAC 260. F.ven though female
students perform slightly better, yet the result is not significant. Therefore,
the null hypothesis Ho4 is rejected for MAC2I0.
4.2.5 H05: There is no significant difference in each management accounting
course performance between school locations.
Table 4.6: Performance Of Each Management Accounting Course BetweenSchool Locations
SchoolLocation N Mean Std.
DeviationStd. Error
MeanSignificant (2 tailed)
Grade Rural 165 2.1292 .87914 .06844 0.029Point
MAC210 Urban 252 2.3241 .89373 .05630
Grade Rural 133 2.5811 .78271 .06787 0 . 2 1 0Point
MAC260 Urban 204 2.4623 .89089 .06238
Table 4.6 shows that students from urban schools performed significantly
superior in MAC 210 (t = 0.029) but the difference diminished in the
higher level course, Management Accounting MAC 260. Therefore, the
null hypothesis H05 is rejected forMAC2IO.
35

4.3 THE ASSOCIATION OF EACH SPM SUBJECT AND THE
PERFORMANCE OF EACH MANAGEMENT ACCOUNTING
COURSE
Pearson Correlation is used to test the correlations of students’ performance in
their SPM Accounting, Additional Mathematics, Economics, English,
Mathematics and the performance of each management accounting course.
Numbers 1 to 9 were used to denote the score for SPM subjects. Number I
represents poor performance where else 9 is for excellent performance. The score
in Management Accounting was given as 0.00 as poor and 4.33 as excellent. The
missing data was omitted to avoid the effect on the evaluation.
4.3.1 Ho6: There is no correlation between SPM Accounting and the
performance in each management accounting course.
The results in Table 4.7 show a positive correlation between SPM
Accounting and all management accounting courses. The R values are all
less than 0.46 which indicate low correlation but significant at the 0.01
level and therefore H06 is rejected.
36

Table 4.7: Correlation between SPM Accounting and the performance ineach management accounting course
1 SPM Accounting
SPMAccounting
Pearson Correlation
Sig. (2-tailed)
N
1
252
Pearson Correlation .173**
MAC210 Sig. (2-tailed) .006
N 247
Pearson Correlation .223**
MAC260 Sig. (2-tailed) .0 0 1
N 204
* Correlation is significant at the 0.05 level (2-tailed)** Correlation is significant at the 0.01 level (2-tailed)
4.3.2 H07: There is no correlation between SPM Additional Mathematics and
the performance in each management accounting course.
The results in the Table 4.8 show a positive correlation between SPM
Additional Mathematics and all management accounting courses. The R
values are all less than 0.46, which indicate low correlation but significant
at the 0 .0 1 level and thus H07 is rejected.
37

Table 4.8: Correlation between SPM Additional Mathematics and theperformance in each management accounting course
SPM Add. Math
SPMPearson Correlation i
Add. Math Sig. (2-tailed)
N 228
Pearson Correlation .306**
MAC210 Sig. (2-tailed) .000
N 2 2 2
Pearson Correlation .245**
MAC260 Sig. (2-tailed) .0 0 1
N 186
Correlation is significant at the 0.05 level (2-tailed) Correlation is significant at the 0.01 level (2-tailed)
4.3.3 Ho8: There is no correlation between SPM Economics and the
performance in each management accounting course.
Table 4.9 shows that there are positive correlations between SPM
Economics and both management accounting courses (MAC210 and
MAC260). The R values are less than 0.46 which indicate low correlation
but significant at 0.01. Thus, the null hypothesis Hos is rejected for all
management accounting courses.
38

Table 4.9: Correlation between SPM Economics and the performance ineach management accounting course
SPM Economics
Pearson Correlation---------------------------------- 1
1
SPMEconomics Sig. (2-taiied)
N 150
Pearson Correlation .296**
MAC210 Sig. (2-tailed) .0 0 0
N 146
Pearson Correlation .253**
MAC260 Sig. (2-tailed) .007
N 1 14
Correlation is significant at the 0.05 level (2-tailed) Correlation is significant at the 0.01 level (2-tailed)
4.3.4 H09: There is no correlation between SPM Modern Mathematics and the
performance in each management accounting course.
The results in Table 4.10 show that there are positive correlations between
SPM Mathematics and both management accounting courses. The R
values are all below 0.46 which indicate low correlation but significant at
the 0 .0 1 level and thus H09 is rejected.
39

Table 4.10 : Correlation between SPM Mathematics and the performance ineach management accounting course
SPM Modern Math
SPMPearson Correlation 1
Modern Sig. (2-tailed)Math
N 444
Pearson Correlation .261**
MAC210 Sig. (2 -tailed) .000
N 436
Pearson Correlation .174**
MAC260 Sig. (2-tailed) .001
N 348
Correlation is significant at the 0.05 level (2-tailed) Correlation is significant at the 0.01 level (2-tailed)
4.3.5 Hoicf There is no correlation between SPM English and the performance
in each management accounting course.
Table 4.11 shows that there are low positive correlations between SPM
English and MAC 210. However, there is no significant correlation
between SPM English and MAC 260. Therefore, Hoio is rejected for MAC
2 1 0 only.
40

Table 4.11: Correlation between SPM English and the performance in eachmanagement accounting course
SPM English
SPMEnglish
Pearson Correlation
Sig. (2-taiicd)
N
i
444
Pearson Correlation 191**
MAC210 Sig. (2 -tailed) .000
N 432
Pearson Correlation .023
MAC260 Sig. (2-tailed) .665
N 344
Correlation is significant at the 0.05 level (2-tailed) Correlation is significant at the 0.01 level (2-tailed)
4.4 THE JOINT EFFECTS OF SPM SUBJECTS, DEMOGRAPHIC
BACKGROUND AND PRIOR MANAGEMENT ACCOUNTING
COURSE ON THE PERFORMANCE OF EACH
MANAGEMENT ACCOUNTING COURSE
To evaluate the predictor for the performance in each management accounting
course, the Stepwise Multiple Regression analysis was applied. One of the SPM
papers consistently excluded by the Stepwise Multiple Regressions was SPM
Additional Mathematics.
41

4.4.! Hon: SPM Accounting, SPM Additional Mathematics, SPM Economics,
SPM Modern Mathematics, SPM English and demographic
background have no significant effect on MAC 210 performance.
Table 4.12: Effect of SPM Additional Mathematics, SPM Accounting, SPM Economics, SPM Modern Mathematics, SPM English and demographic
background on MAC 210 performance
Included independent variables
UnstandardizedCoefficients
BStd. Error Sig.
(Constant) 0.724 .583 .254
SPM Economics .254 .093 .030
Excluded independent variables Beta In t Sig.
SPM Accounting -.508 -1.579 .165
SPM Modern Mathematics -.097 -.343 .743
SPM Additional Mathematics -.463 -2.175 .073
Model Summary
R Square F Sig
.515 7.424 0.030
The result of the Stepwise Multiple Regression Model 1 is reported in
Table 4.12. It shows that the R square is 0.515 which is more than 0.5 and
the value is significant. Thus, the model will be able to predict up to
51.5% of MAC 210 performance. The only independent variable included
in the model is SPM Economics. The independent variables excluded in
42

the model are SPM Accounting, SPM Mathematics and SPM Additional
Mathematics. Thus the model developed by the analysis is:
MAC 210 = 0 724 + 0.254 (SPM Economics) + <?/
4.4.2 Ho12: SPM Accounting, SPM Additional Mathematics, SPM Economics,
SPM Modern Mathematics, SPM English, demographic
background and MAC 210 have no significant effect on MAC 260
performance.
Table 4.13: Effect of SPM Additional Mathematics, SPM Accounting, SPM Economics, SPM Modern Mathematics, SPM English, demographic
background and MAC 210 on MAC 260 performance
Included Unstandardizedindependent
variablesCoefficients
BStd. Error Sig.
(Constant) 1.237 .431 .010
SPM Economics . 2 2 2 .072 .006
Excluded independent variables Beta In t Sig.
SPM English .196 1.032 .316
SPM Add. Math .242 1.188 .250
MAC 2101
. 0 2 1 .096 .925
Model Summary
R Square F Sign n *7
.J>J> / 9.661 0.006
43

Table 4.13 reports on the independent variables affecting the MAC 260
performance. SPM Economics again shows a positive influence on MAC
260 performance. The excluded variables are SPM English, SPM
Additional Mathematics and MAC 210. The R square value obtained is
0.337, which explains a significant portion of 33.7 % of variation in
students’ performance in MAC 260. Thus, the equation obtained from the
Stepwise Multiple Regression Model 2 is as follows:
MAC 260 = 1.237 + 0.222 (SPMEconomics) + c>i
44

CHAPTER 5
DISCUSSION
5.1 COMPARISON OF MANAGEMENT ACCOUNTING
PERFORMANCE BETWEEN STUDENTS WHO SAT FOR
ACCOUNTING, ADDITIONAL MATHEMATICS AND
ECONOMICS IN THEIR SPM AND THOSE WHO DID NOT
SIT FOR THE SUBJECTS, SCHOOL LOCATION AND
GENDER
5.1.1 SPM Subjects
The positive effect of SPM Accounting on management accounting
courses is consistent with the findings found by Lai Mooi Tho (1994)
which, shows that the performance of students who had taken accounting
is better than those who had not taken accounting. Other studies done by
Bergin and Davinson (1983), Gul and Fong (1993) and Auyeung and
sands (1994) also support the findings.
45

The findings of SPM Additional Mathematics corresponded to the
previous studies (Lai Mooi Tho, 1994; Williams et a l 1995; Hill et al.,
1996; Keef, 1988) which found that the students’ performance with
previous knowledge of mathematics are better than those without previous
knowledge in mathematics for management accounting courses. The
results are also supported by Gul and Fong (1993) and Wan Faizah et al.
(2005). However, the finding contradicted Bartlett et al. (1993) who found
that students who have studied mathematics at ‘A’ level did not on
average significantly outperform the students without these qualifications
in management accounting courses.
A positive effect is found between SPM Economics and the students’
performance in MAC 210 only. This finding is similar to the findings of
previous studies by Lai Mooi Tho (1994), Keef (1998) and Bartlett et al.
(1993). The negative effect of SPM Economics on MAC 260 is similar to
the findings by Wan Faizah et al. (2005).
5.1.2 Gender
The result on MAC 210 corresponded to the survey of instruction by
Gammie et al. (2003) that showed that females are perceived to be better
accounting students than male students in the introductory accounting
course, but not in the second course.
46

However, the result did not correspond with the finding by Doran et. al.
(1991) where males are found to have significantly higher examination
scores in the introductory accounting course, hut not in the second course.
The results of this study also differs from a previous study by fipe (1989)
( as cited in Park ct al., 1994) which found no gender effects on
performance in a lower division managerial accounting course. A New
Zealand study by Keef (1988) also found gender is not significant in the
performance of management accounting. A local study conducted by Wan
Faizah et al. (2005) reported that gender did not significantly affect the
accounting performance in both the introductory and intermediate courses.
Lai Mooi Tho (1994) also reported that gender did not contribute
significantly to performance in the first level accounting course. Other
studies that reported no gender effect on accounting performance were
Tyson (1989), Canlar and Bristol (1988). Eskew and Farley (1988),
Bucklcss ct al. (1991), Carpenter et al. (1993), Gist and Godde (1996),
Hanks and Shivaswamy (1985).
5.1.3 School Location
The results obtained is consistent with a study by Wan Faizah et al.(2005).
They found that students from urban schools performed significantly
better in the first accounting paper only This could be due to the fact that
students from urban schools are expected to have better facilities and
exposure to resources. However, for the higher level management
47

accounting course, there is no significant difference between students from
different school locations. This result could be explained by the fact that
as students proceed to a higher semester, the facilities and exposure to
resources enjoyed at school has no effect anymore. They now share the
same facilities and are exposed to the same resources at UiTM. The
finding did not correspond to the study by Lai Mooi Tho (1994) who
found that there was no significant difference in the performance between
students from rural and urban areas. However, Lai Mooi Tho (1994)
studied the students’ residence and not the location of their school. In the
Malaysian scenario, the location of schools may be a better indicator of
exposure to better facilities as there are students from rural areas who
study in urban and boarding schools.
5.2 THE ASSOCIATION OF THE SPM SUBJECTS AND THE
PERFORMANCE OF EACH MANAGEMENT ACCOUNTING
COURSE
Pearson Correlation (refer to Table 4.7) shows that there are low positive
correlations between SPM Accounting and the performance in all management
accounting courses i.e. MAC2I0 and MAC260. Finding by Williams et al (1995)
only corresponded for initial accounting courses (Financial Accounting I and
Cost and Management Accounting I) but not for the higher level accounting
48

courses. This finding also does not corresponded very well to Lai Mooi Tho
(1994), who found that performance in first year accounting examination and
STPM Accounting has a high positive correlation coefficient. One possible
explanation for this finding could be due to the level of previous accounting
background. Students who have STPM Accounting have basic knowledge of Cost
and Management Accounting since it is included in the syllabus, while SPM
Accounting syllabus just focuses on Financial Accounting. The study contradict s
results from studies done by Keef (1988) and Bartlett et al.( 1993). Their studies
found that the level of previous study of accounting had no effect on the
performance in the course of Management Accounting.
In the previous chapter, the correlation between SPM Additional Mathematics and
Mathematics and the performance in each management accounting course is
shown in Table 4.8 and Table 4.10 respectively. Both tables indicate that there are
low positive correlations between SPM Additional Mathematics and the
performance in all management accounting courses as well as SPM Mathematics
and the performance in all management accounting courses. This study
corresponded to Williams et al. (1995) and Hill et al. (1996) where it was found
that mathematics courses have a positive relationship with students' performance
not only in financial accounting but also in cost and management accounting.
However, the study contradicts results of a study done by Bartlett et al. (1993).
49

SPM Economics is positively associated with the performance in both
management accounting courses. However, the correlations are low though they
are significant. This finding corresponded to Keef (1998) and Bartlett et al.
(1993).
There is a low positive correlation between SPM English and the performance in
MAC 210 only. The finding is similar to previous research reported by Wright,
Baker and Perera (2004). They found that English language proficiency improves
performance in management accounting. This is only relevant to MAC210.
On the other hand, Jackling and Anderson (1998), Bergevin and Davison (1994),
and Rankin et al (2003) reported that language has no significant impact on
performance. This is only relevant to the MAC 260 findings.
5.3 THE JOINT EFFECTS OF SPM SUBJECTS, DEMOGRAPHIC
BACKGROUND AND PRIOR MANAGEMENT ACCOUNTING
ON THE PERFORMANCE IN THE NEXT MANAGEMENT
ACCOUNTING COURSE
Stepwise Multiple Regression analysis shows that only SPM Economics seems
to be the best determinant to predict the performance of MAC2I0 and MAC 260.
Other independent variables, specifically, SPM Accounting. SPM English, SPM
50

\dditional Mathematics, SPM Mathematics, gender as well as school location are
not significant and are excluded from the model.
The Stepwise Multiple Regression model obtained an R square of 0.515 and 0.337
for Model 1 and Model 2 respectively. The R square obtained in this study
indicates that Model 1 could predict up to 51.5% of the performance in MAC2I0
and 33.7% of the performance in MAC260.
This study also found that most of the SPM subjects do not contribute
significantly to the performance of management accounting courses subsequent to
MAC2I0 as shown by the result from the Stepwise Multiple Regression analysis
except for SPM Economics which still contributes to MAC260.
These findings are consistent with the findings previously reported by Bartlett et
al. (1993) and Keef (1988). They found that the most consistent explanatory
variable is economics studied previously.
51

CHAPTER 6
CONCLUSIONS, RECOMMENDATIONS
AND LIMITATIONS
6.1 CONCLUSIONS
Students who have taken SPM Accounting and SPM Additional Mathematics
perform significantly better in all management accounting courses than students
who have not taken both papers. The performance of MAC2 10 and MAC260 are
lower for students with SPM Economics as compared to the performance of
students without SPM Economics. However, the results is only significant for
MAC 210. Demographic background, gender and school location have significant
effect only on the MAC210 course but the difference in performance diminished
in MAC260.
The association of SPM Accounting. SPM Additional Mathematics, SPM
Mathematics and SPM Economics with the performance in all management
accounting courses is low positive but significant. However. SPM English has
low positive association but is significant only for the MAC210 course.
52

The joint effect of independent variables on the performance in MAC210 showed
that only SPM Fxonomics contributes significantly to the performance in
MAC210. In another management accounting course, MAC260. again SPM
Economics indicated a positive influence on student performance.
6.2 RECOMMENDATIONS
The findings show that the students’ performance in MAC 210 and MAC 260 are
significantly different between the students who have taken and have not taken
Accounting and Additional Mathematics in their SPM examinations. Therefore, it
is recommended that the Faculty of Accountancy enroll students who have taken
SPM Accounting and SPM Additional Mathematics.
Besides that, the Faculty of Accountancy is recommended to arrange programmes
for potentially poor performers to supplement them with topics related to Basic
Accounting and Mathematics. The group of students who may require these
supporting programmes should include students without SPM Accounting,
student without Additional Mathematics and students with SPM Economics. The
programme could be in the form of a basic management accounting course, extra
lectures and tutorials, and computer aided learning.
53

Secondly, the results also show that SPM Accounting, SPM Additional
Mathematics, SPM Mathematics and SPM Economics are the best predictors for
MAC 210 and MAC 260. As such, UiTM should consider giving priority to
applicants who have good results in their SPM Accounting, SPM Additional
Mathematics, SPM Mathematics and SPM Economics as entry requirements to
the DIA programme.
6.3 LIMITATIONS
This research has been based only on students from three out of eleven UiTM
campuses offering DIA programme. Thus, the generalization of the results to
similar courses in other universities should be viewed with some caution.
Besides, on going assessments, that is, tests, quizzes, assignments and projects are
not controlled since this study covered three branches with different lecturers
which resulted in different on-going testing and evaluation.
54

REFERENCES
Auyeung. P.K... & Sands, D.F., (1994). Predicting success in first-year university accounting
using gender-based learning analysis. A c c o u n t in g 259-272.
Baldwin. B.A.. & Howe, K.R. (1982). Secondary-level study of accounting and subsequent
performance in the first college course. A c c o u n t in g R e v ie w , 5 7 (3), 619-627.
Bartlett, S., Peel, M.J., & Pendlebury, M. (1993). From fresher to finalist: A three
year analysis of student performance on an accounting degree programme.
A c c o u n t in g E d u c a tio n , 2 (2), 111-122.
Bergevin, P.M., & Davison, D.L. (1994).‘The relationship between objective format
accounting examination validity and student native language. T h e J o u r n a l o f
L a n g u a g e f o r I n te r n a t io n a l B u s in e s s , 6(1), 23-32.
Bergin. L.J. (1983). The effect of previous accounting study on student performance in the
first college-level financial accounting course. I s s u e s in A c c o u n t in g E d u c a tio n , 19-
28.
Buckless. F. A.. Lipe. M.G., & Ravenscroft. S.P. (1991). Do gender effects on
accounting course performance persist after controlling for general academic aptitude.
Is s u e s In A c c o u n t in g E d u c a tio n . 6 (2). 248-261.

Canlar, M. & Bristol, J. T. (1988). Female and male undergraduate accounting students. The
W o m a n C P A , 5 0 (2 ) , 20-23.
Carpenter, V. L., Friar, S. & Lipe, M. G. (1993). Evidence on the performance of accounting
students: Race, gender and expectations. Is s u e s in A c c o u n t in g E d u c a tio n , #(1), 1-17.
Didia, D. & Hasnat. B. (1998). The determinants of performance in the university
introductory finance course. F in a n c ia l P r a c tic e a n d , 102-107.
Doran, B.M., Bouillon, M.L., & Smith, C.G. (1991). Determinants of student performance in
accounting principles I and IF I s s u e s In A c c o u n t in g E d u c a t io n , (5(1), 74-84.
Drennan L., Rohde F., & Smith, C.G. (2002). Determinants of performance in advanced
undergraduate management accounting: An empirical investigation. A c c o u n t in g a n d
F in a n c e , 4 2 (1 ) , 27-40.
Eskew, R.K., & Faley, R.H. (1988). Some determinants of student performance in the first
college-level financial accounting course. 137-147.
Gammie. E.. Paver, B.. Gammie, B.. & Duncan. F. (2003). Gender differences in accounting
education: An undergraduate exploration. A c c o u n t in g E d u c a tio n . 1 2 (2 ) , 177-196.
Gist, W.E. & Goedde, H. (1996). The influence of mathematical skills and other factors on
minority student performance in principles of accounting. I s s u e s A c c o u n tin g
E d u c a tio n , 1 1(1), 49-60.
56

Hanks, G., & Shivaswamy, M. (1985). Academic performance in accounting: Is there a
gender gap?. J o u r n a l o f B u s in e s s E d u c a tio n , 154-156.
Hill, M.C., Stratton, R., & Edwards, J.D. (1996). Transfer of learning in the introductory
accounting course sequence. AccounitngEducators’ J o u r n a l 5(1). 27-49.
Jackling B., & Anderson, A. (1998). Study mode, general ability and performance in
accounting:A research note. A c c o u n t in g E d u c a tio n , 7(1), 65-73.
Keef, S.P. (1988). Preparation for a first level university accounting course: The experience
in New Zealand. J o u r n a l o f A c c o u n t in g E d u c a tio n , 6 (2 ) , 293-307.
Keef. S.P., & Roush, M.L. (1997). New Zealand evidence on the performance of accounting
students:Race, gender and self-concept. Issues in Accounting Education. 1 2 (2 ). 315-
330.
Lai, M.T. (1994). Some evidence on the determinants of student performance in the
University of Malaya introductory accounting course. A c c o u n t in g E d u c a tio n . j (4).
331-340.
Gul. F.A., & Fong, S.C.C. (1993). Predicting success for introductory students: Some further
Hong Kong evidence. A ccounting E ducation. 1), 33-41.
57

Lan, C.S. (2000/2001). '['he management accounting qualification. A c c o u n t in g J o u r n a l.
University of Malaya, 58.
Ministry of Finance. (2004). E c o n o m ic R e p o r t 2 0 0 4 2 0 0 5 . K u a la
N a s io n a l M a la y s ia H er h a d .
Mitchell, F. (1985). School accounting qualifications and student performance in a first level
university accounting examination. A c c o u n t in g a n d B u s in e s s , 15(58). 81-86.
Mutchler, J.F., Turner, J.H., & William, D.D. (1987). The performance of female versus male
accounting students. I s s u e s in A c c o u n t in g E d u c a tio n , 2(1), 103-111.
Park, L.J., Hayes, R.S., & Step, F. (1994). Men & Women: Equal in accounting?. J o u r n a l
E d u c a tio n fo r B u s in e s s W a s h in g to n . 6 9 (6 ) . 349.
Rankin, M., Silvester. M., Vallely, & Wyatt. A. (2003). An analysis of the implications of
diversity for students' first level accounting performance. A c c o u n t in g a n d F in a n c e ,
43(3), 365-393.
Tyson, T. (1989). Grade performance in introductory accounting courses: Why female
students outperform males. I s s u e s In A c c o u n t in g E d u c a tio n . -/(1), 153-160.
Wan Faizah Wan Abdullah. Noraini Abdul Rahim. Siti Salmah Abu Bakar. Marzlin Marzuki,
Wan Zulkipli Wan Salleh. (2005). Predicting success factors in financial accounting
58

courses for diploma in accountancy programme (Northern region UilM).
Proceedings of the Conference on Scientific & Social Research 2005. Proceeding. 12.
Williams, J.J., Cheng, T.C., Lim, S.H., & Yow, Y.M. (1995). Factors influencing student
performance in university accounting subjects: Evidence from Singapore. A c c o u n tin g
a n d B u s in e s s Review, 2 (2 ) , 291-315.
Wright, S.. Baker, P., & Perera, S. (March 2004). Determinants of student performance in
intermediate accounting subject. First Semester 2004 Seminar Series, Macquarie
University, Australia.
59

APPENDIX A
Below is the summarized topics covered under Introduction to Cost and Management Accounting (MAC210) and Management Accounting (MAC260) courses:
MANAGEMENT ACCOUNTING TOPICSCOURSES
MAC210 Introduction to Cost and Management Accounting
IntroductionMaterialsLabourOverheadsJob and batch Costing Contract Costing Process Costing
MAC260 Management Accounting Introduction to Management Accounting Cost BehaviourMarginal Costing and Absorption CostingCVP AnalysisShort Decision MakingBudgets and Budgetary ControlStandard Costing and Variance Analysis
60

APPENDIX B
KEDAH
PBT
Majlis Perbandaran Kota SetarJalan Kolam Air05675 ALOR SETAR, KEDAH.TEL : 04 - 7332499FAX : 04-7320622
Majlis Perbandaran Sungai Petani 08000 SUNGAI PETANI, KEDAH. TEL : 04-4212205 FAX : 04-4233416
Majlis Perbandaran Kulim No 104-121, Lorong Kenari 5/1 Kota Kenari09000 KULIM, KEDAH.TEL : 04 - 4907525 /6 FAX : 04-4901443
Majlis Daerah Baling d/a Pejabat Daerah Baling 717 Jalan Mahmud 09100 BALING, KEDAH. TEL : 04-4701800 FAX : 04 -4701580
Majlis Perbandaran Langkawi Bandaraya Pelancongan07000 LANGKAWI, KEDAH.TEL : 04 - 9666590 FAX : 04-9666158
Majlis Daerah Bandar Baharu 09800 SERDANG, KEDAH. TEL : 04 - 4077264 FAX : 04 -4077581
Majlis Daerah Kubang Pasu 06000 JITRA, KEDAH. TEL : 04 - 9171901 FAX : 04-9174057
Majlis Daerah Padang Terap 06300 KUALA NERANG, KEDAH. TEL : 04 - 7866328 FAX : 04 - 7866639
Majlis Daerah Sik 08200 SIK, KEDAH. TEL : 04 -4695394 FAX : 04-4695448
Majlis Daerah Pendang 06700 PENDANG. KEDAH. TEL : 04 - 7596077 FAX : 04 - 7596709
Majlis Daerah Yan 06900 YAN, KEDAH. TEL : 04 -4655745 FAX: 04 -4655990
Pihakberkuasa TempatanTaman Perindustrian Hi-Tech KulimP. O Box 28,09000 KULIM. KEDAH TEL : 04-4912266 FAX : 04-4912277
61

PERLIS
PBT
Majlis Bandaraya Ipoh Peti Surat 1009 30820 IPOH, PERAK.TEL : 05 - 2413733FAX: 05 - 2537396/2540144
Majlis Perbandaran Manjung Pejabat Majlis Perbandaran Manjung Kompleks Pentadbiran Daerah Manjung 32040 MANJUNG. PERAK TEL: 05 - 6883121 /6882122 FAX: 05 -6882102
Majlis Perbandaran Taiping Wisma Perbandaran Jalan Taming Sari 34000 TAIPING, PERAK. TEL : 05 - 8080777 FAX: 05 -8053000
Majlis Daerah Gerik Jalan Haji Meor Yahaya 33000 GERIK, PERAK.TEL: 05 - 7912305 /7912686 FAX : 05 - 7912288 E-Mail: [email protected]
Majlis Daerah Hilir Perak 36000 TELUK INTAN, PERAK TEL: 05 - 6221299/6221277 FAX: 05 - 6212446 E-Mail: [email protected]
Majlis Daerah Kinta Selatan JKR 163. Jalan Batu 31900 KAMPAR. PERAK. TEL : 05 - 4666004 / 4664823 FAX : 05 - 4665136
Majlis Daerah KerianNo 1, Wisma Majlis Daerah KerianJalan Padang34200 PARIT BUNTAR, PERAK. TEL : 05 - 7163658
Majlis Daerah Kinta Barat Jalan Devvangsa31007 BATU GA.IAH, PERAK.TEL : 05 - 3661216FAX : 05 - 3665930 / 3662702
62

FAX : 05 - 7169268 E-Mail: mdkfaJnon.iarintuny
E-ivlail: mdkb'^po.jari ng. my
Mai 1 is Daerah Kuala Karmsar Jalan Raja Chulan33000 KUALA KANGSAR, PERAK. TEL : 05 - 7763199 FAX : 05 -7761004
Majlis Daerah Lenggong Jalan Alang Iskandar 33400 LENGGONG. PERAK. TEE : 05 - 7677207 FAX : 05 - 7677002
Majlis Daerah Perak Tengah Aras BumiKompleks Pentadbiran Daerah Perak Tengah32600 SERI ISKANDAR, PERAK. TEL : 05 - 3762088 FAX : 05 -3762089 E-Mail: mdpt(5),tm.net.my
Majlis Daerah Pengkalan Hulu 33100 PENGKALAN HULU, PERAK TEL : 04 - 4778224 FAX : 04 -4778458
Majlis Daerah Selama 34100 SELAMA, PERAK. TEL : 05 - 8394201 FAX: 05 - 8394377
Majlis Daerah Tapah Jalan Station 35000 TAPAH, PERAK. TEL : 05 - 4011326 FAX : 05 -4012288
Majlis Daerah Tanjung Malim NO. 1, Jalan Raja Itam 35900 TANJUNG MALIM, PERAK. TEL : 05 -4490100 FAX : 05 -4490102
JOHOR
PBT
Majlis Bandaraya Johor Bahru Jalan Dato' Onn Peti Surat 23280720 JOHOR BAHRU, .10110R. TEL : 07 - 2248833 / 2282525 FAX : 07 -2230619
Majlis Perbandaran Kluang Jalan Pejabat Kerajaan 86000 KLUANG. JOHOR. TEL: 07 - 7723912 / 7723911 FAX : 07 - 7713209
Majlis Daerah Labis 85300 Labis, JOHOR. TEL : 07 - 9251781 FAX : 07-9251308
Majlis Perbandaran Batu Pahat 83000 BATU PAHAT, JOHOR. TEL: 07 -4341045 /4341944 FAX : 07 -4321164
63

Majlis Perbandaran Muar Karung Berkunci No 516 84009 MUAR, JOHOR. TEL : 06-9521204-206 FAX : 06 -9522691
Majlis Daerah TangkakPejabat Besar Majlis Daerah Tangkak84900 TANGKAK, JOHOR.TEL : 06 - 9781261 /9782226 FAX : 06 - 9782670
Majlis Perbandaran Johor Bahru Tengah81300 Skudai, Johor BahruJOHORTEL: 07 - 5561005 /5571730 FAX : 07 - 5568007
Majlis Daerah Simpang Renggam Jalan Pejabat86200 SIMPANG RENGAM. JOHOR. TEL: 07 - 755 1300/ 7551303 FAX : 07 - 7556131 FAX : 07 - 7551302
Majlis Daerah Yong Peng KM 1, Jalan Labis 83700 Yong Peng, JOHOR TEL : 07 -4671276/4675649 FAX : 07 -4671712
Majlis Daerah Pontian Bangunan Majlis Daerah 82000 PONTIAN, JOHOR. TEL : 07 -6871442/6870292 FAX : 07 - 6873131
Majlis Daerah Segamat No 1, Jalan Abdullah 85000 SEGAMAT, JOHOR. TEL : 07 -9314455/9312710 FAX : 07 -9312712
Majlis Daerah Kulai Jalan Pejabat Kerajaan 81000 KULAI, JOHOR.TEL: 07 - 6631511 /6632132 FAX : 07 - 6632407
Majlis Daerah Kota Tinggi Jalan Padang81900 KOTA TINGGI, JOHOR. TEL : 07 - 8831004 / 8834558 FAX : 07 -8834015
Majlis Daerah Mersing 243 Jalan Ibrahim 86800 MERSING, JOHOR. TEL : 07 - 7992969 FAX : 07 - 7993975
Lembaga Bandaran Johor Tenggara Ibu Pejabat KEJORA Jalan Dato' Onn Bandar Penawar, Desaru 81900 KOTA TINGGI, JOHOR. TEL : 07 - 8221601 - 8221610 FAX : 07 - 8221216
Pihakberkuasa Tempatan Pasir Gudang L3 - 06, Kompleks Pusat Bandar Jalan Bandar81700 PASIR GUDANG, JOHOR. TEL : 07 - 2513720 FAX : 07 -2515260
64

KELANTAN
PBT
Majlis Perbandaran Kota Bharu 15000 KOTA BHARU, KELANTAN.TEL : 09 - 7483344 / 7483209 FAX : 09 - 7486026
Majlis Daerah Bachok 16300 BACHOK. KELANTAN.TEL : 09 - 7788524 FAX : 09 - 7789563
Majlis Daerah Kota Bharu 16450 KETEREH, KELANTAN.TEL: 09 - 7886112/7887267 FAX : 09 - 7886031 ( Pej MD )
Majlis Daerah Kuala Krai Selatan 18200 DABONG,KELANTAN.TEL : 09 - 7440725 FAX : 09-7440725
Majlis Daerah Gua Musang 18300 GUA MUSANG, KELANTAN. TEL : 09- 9121235 FAX : 09-9121044
Majlis Daerah Jeli 17600 JELI,KELANTAN.TEL : 09 - 9440023 / 63 FAX : 09 - 9440007 / 9440250
Majlis Daerah Tanah Merah 17500 TANAH MERAH, KELANTAN. TEL: 09 -9556026 FAX : 09 - 9556826
Majlis Daerah Tumpat 16200 TUMPAT, KELANTAN.TEL: 09 - 7257285 /7257788 FAX : 09-7256919
Majlis Daerah Kuala Krai Utara 18000 KUALA KRAI, KELANTAN.TEL: 09-9665215/9666121 FAX : 09 - 9663284
Majlis Daerah Pasir Mas 17000 PASIR MAS, KELANTAN.TEL : 09 - 7909250 FAX : 09 -7903250
Majlis Daerah MachangPejabat Majlis Daerah MachangTingkat 1 & 2, Bangunan Aked MDMJalan Dato' Hashim18500 MACHANG, KELANTAN.TEL: 09 - 9751076FAX: 09-9751431
Majlis Daerah Pasir Puteh 16800 PASIR PUTEH, KELANTAN.TEL: 09- 7866011 FAX : 09 -786701 1
65

MELAKA
PBT
Majlis Bandaraya Melaka Berseiarah Bangunan Graha Makmor No 1, Lebuh Ayer Keroh 75450 MELAKA.TEL: 06 -2336411FAX : 06 -2325716E-Mail: m bsf2) ,m D m bb.o re .m v
Majlis Perbandaran A lor Gajah JKRNo. 2239,78000 ALOR GAJAH. MELAKA. TEL: 06 - 5562575 FAX : 06 - 5564909
Majlis Daerah Jasin 77000 JASIN, MELAKA.TEL : 06- 5291245/ 5291994 FAX : 06- 5293537
NEGERI SEMBILAN
PBT
Majlis Perbandaran Nilai Peti Surat No. 5271800 NILAI,NEGERI SEMBILAN. TEL : 06- 8501890 FAX: 06 - 8501893
Majlis Perbandaran Port Dickson 71009 PORT DICKSON, NEGERI SEMBILAN TEL : 06 - 6473904 / 6474962 FAX : 06 - 6474007 / 6474984
Majlis Daerah Jelebu d/a Dewan Besar 71600 JELEBU,NEGERI SEMBILAN.TEL : 06 -6136479/6136991 FAX : 06 - 6137515
Majlis Daerah Kuala Pilah Jalan Seremban 72009 KUALA PILAU. NEGERI SEMBILAN. TEL : 06-4814025 FAX : 06 -4811042
Majlis Perbandaran Seremban Wisma Perbandaran Jalan Yam Tuan 70990 SEREMBAN.NEGERI SEMBILAN.TEL : 06 - 7642944 FAX : 06 - 7637449
Majlis Daerah Jempol 721 120 Bandar Baru Selling NEGERI SEMBILAN.TEL: 06 - 4581233 FAX : 06 - 4585800
Majlis Daerah Rembau Jalan Dato' Maharaja Lela 71309 REMBAU,
Majlis Daerah Tampin 73000 TAMPIN. NEGERI SEMBILAN
66

NEGERI SEMBILAN. TEL : 06 - 4411601TEL: 06 -6851144 FAX : 06-4413001FAX : 06-68551 17
PAHANG
PBT
Majlis Perbandaran Kuantan Jalan Tanah Puteh 25100 KUANTAN, PAHANG. TEL: 09- 5132311 FAX : 09-5130644
Majlis Daerah Cameron Highlands 29007 TANAH RATA, PAHANG TEL : 05 - 4911455/4912097 FAX : 05 -4911728 FAX ; 05 - 4911843 ( Pej MD )
Majlis Perbandaran Temerloh 28000 TEMERLOH, PAHANG. TEL : 09 - 2961477 FAX : 09-2962664
Majlis Daerah Bentong 28700 BENTONG, PAHANG TEL: 0 9 -2 2 2 1148 FAX : 09 - 2223729
Majlis Daerah Bera 28300 Triang Tel: 09-2553870 Fax: 09-2554243
Majlis Daerah Jerantut27000 JERANTUT. PAHANG.TEL : 09 - 2662205FAX : 09 - 2661545, 2665513
Majlis Daerah Pekan Jalan Tengku Mahkota 26600 PEKAN, PAHANG. TEL: 09 -4224350/4221350 FAX: 09 -4221954
Majlis Daerah Raub 27600 RAUB. PAHANG.TEL : 09 - 3551175 / 3551804 FAX : 09 - 3554270
Majlis Daerah Lipis 27100 KUALA LIPIS, PAHANG. TEL : 09 - 3121253 FAX : 09 - 3123953
Majlis Daerah Maran d/a Pejabat Daerah Maran 26500 MARAN. PAHANG. TEL : 09 - 477141 1 /4771412 FAX : 09 - 4771511
Majlis Daerah Rompin 26800 KUALA ROMPIN, PAHANG. TEL : 09 -4146677 /4146688 FAX : 09-4146077
67

PULAU PINANG
PBT
Majlis Perbandaran Pulau Pinang Majlis Perbandaran Seberang PeraiTingkat 17, Bangunan KOMTAR Jalan Datuk Hj Ahmad Said10675 PULAU PINANG 12000 BUTTER WORTH. PULAUTEL : 04 - 2624400 PINANG.FAX : 04 - 2626260 TEL : 04 -3105500
FAX : 04 - 3322140FAX : 04 - 3322339 ( Ibu Pej MPSP )
SELANGOR
PBT
Mailis Bandarava Shah Alam Tingkat 1, Wisma MBSA Peti Surat 720040706 SHAH ALAM, SELANGOR TEL : 03 - 55105133 FAX: 03 -55108010
Majlis Perbandaran Ampang Java Menara MPAJ, Persiaran MPAJ Jalan Pandan Utama, Pandan Indah 55100 KUALA LUMPUR TEL : 03 - 42968000 FAX : 03 - 42968060
Mailis Perbandaran Klang Jalan Perbandaran 41675 KLANG, SELANGOR TEL : 03 - 33716044 FAX : 03 - 33720344
Majlis Perbandaran Petaling JavaJalan Yong Shook Lin46675 PETALING JAYA. SELANGORTEL : 03 - 79563544FAX : 03 - 79586491 / 79575476
Majlis Perbandaran Kajang 43000 KAJANG, SELANGOR TEL : 03 - 87377899 FAX : 03 - 87377897
Majlis Perbandaran Selayang Persiaran 3, Bandar Baru Selayang KM 15. Jalan Ipoh68100 BATU CAVES. SELANGOR. TEL : 03 - 61380001 FAX : 03 -61388933
Mailis Perbandaran Subang Java Persiaran Perpaduan, Jalan USJ5 47610 SUBANG JAYA, SELANGOR TEL : 03 - 80263131 FAX : 03 - 56376585
Majlis Daerah Hulu Selangor Jalan Bukit Kerajaan44000 HULU SELANGOR. SELANGOR TEL : 03 -60641331 FAX : 03 -60643991
Majlis Daerah Kuala Langat Teluk Datok
Majlis Daerah Kuala Selangor45000 KUALA SELANGOR, SELANGOR.
68

42700 BANTING, SELANGOR. TEL: 03 -31872825 / 732 FAX : 03 -31879304
TEL: 03 - 8891439 FAX : 03 -8891 101
Majlis Daerah Sepang Tingkat 1, Bangunan Tun Aziz Salak Tinggi43900 SEPANG, SELANGOR. TEL: 03 - 87061016/87061090 FAX : 03 -87061971
Majlis Daerah Sabak Bernam 45300 SUNGAI BESAR, SELANGOR TEL : 03 - 32241655 FAX : 03 - 32242766
TERENGGANU
PBT
Majlis Perbandaran Kuala TerengganuTingkat 8, Menara PERMINTJalan Sultan Ismail20200 KUALA TERENGGANU,TERENGGANUTEL: 09-6221044/6221662FAX : 09 -6226570
Majlis Daerah Hulu Terengganu21700 Kuala Berang, Hulu TerengganuTERENGGANUTEL: 09-6811466/6811149FAX : 09 -6811655
Majlis Perbandaran Kemaman 24000 KEMAMAN, TERENGGANU TEL: 09- 8597777/8597700 FAX: 09 -8595455
Majlis Daerah Besut 22200 BESUT, TERENGGANU TEL : 09 -6956388/6956389 FAX : 09-6956199
Majlis Daerah Dungun 23000 DUNGUN, TERENGGANU TEL: 09-8441931 /8441932/020/ 4386FAX: 09-8483210
Majlis Daerah Setiu Wisma Majlis Daerah Setiu Bandar Permaisuri 22100 SETIU, TERENGGANU TEL : 09 - 6099377 / 6099434 FAX : 09 - 6099367
Majlis Daerah Marang 21600 MARANG, TERENGGANU TEL : 09-6182366/6182368 FAX : 09-6181963
69

SARAWAK
PBT
Dewan Bandaraya Kuching Utara Bukit Siol, Jalan Semariang, Petra Jaya 93050 KUCHING, SARAWAK.TEL : 082 - 446688 FAX : 082 - 446414 E-Mail: dbkuqrc42>po.iaring.my
Majlis Perbandaran Padawan Kota Padawan, Pasar Batu 10 Jalan Penrissen93250 KUCHING, SARAWAK. TEL : 082 - 615566 FAX : 082-611832
Majlis Bandarava Kuching Selatan Jalan Padungan93675 KUCHING, SARAWAK TEL: 082 -242311 FAX : 082-417372
Majlis Perbandaran Miri Jalan Raja98000 MIRI, SARAWAK. TEL : 085 -433439 FAX : 085 -415486
Majlis Perbandaran SibuJalan Wong Nai SiongPeti Surat 55796007 SIBU, SARAWAK.TEL: 084 - 333411FAX : 084 - 320240E-Mail: mpsibu(2)po.iaring.my
Majlis Daerah Bau 94000 BAU, SARAWAK TEL : 082 - 763128 FAX : 082 - 763545
Majlis Daerah Kanowit 96700 KANOWIT, SARAWAK TEL : 084 - 752093 FAX : 084 - 752695
Majlis Daerah Kapit 96800 KAPIT, SARAWAK TEL : 084 - 796266 FAX : 084 - 796323
Majlis Daerah Lawas Peti Surat 8098857 LAWAS. SARAWAK TEL : 085 -284001 FAX : 085 - 285485
Majlis Daerah Limbang P.O. Box 39098708 LIMBANG, SARAWAK TEL : 085 -211358 FAX : 085 - 212577
Majlis Daerah Lundu 94500 LUNDU. SARAWAK TEL : 082 - 735501 / 735729 FAX : 082 - 735035
Majlis Daerah Maradong & Julau Jalan Mahkamah96507 BINTANGOR. SARAWAK TEL : 084 - 693232 FAX : 084-693973
Majlis Daerah Betong Bangunan Kubu Rentap 95700 BETONG. SARAWAK TEL : 083 -472124 FAX : 083 -472192
Majlis Daerah Marudi Peti Surat 374, Marudi 98058 BARAM, SARAWAK TEL : 085 - 755755 FAX : 085 -755336
70

Majlis Daerah Dalai & Mukah Jalan Kubu,Peti Sural 68 96400 MUKAH, SARAWAK TEL: 084 - 871622 FAX: 084 - 871041
Majlis Daerah Luar Bandar Sibu Jalan Bujang Suntong Peti Surat 1318 96008 SIBU, SARAWAK.TEL : 084 - 336077 FAX : 084 - 324694
Majlis Daerah Lubok Antu 95800 ENGKILILI, SARAWAK TEL: 083 - 563915 FAX: 083 - 563144
Majlis Daerah Matu & Daro 96250 MATU, SARAWAK TEL : 084 - 832233 FAX : 084 - 832343
Majlis Daerah Samarahan 94300 KOTA SAMARAHAN, SARAWAK TEL: 082-671023 FAX: 082 - 671342
Majlis Daerah Saratok 95400 SARATOK. SARAWAK TEL : 083 -436104 FAX : 083 -436511
Majlis Daerah Sarikei Jalan Nyelong, Peti Surat 420 96100 SARIKEI, SARAWAK TEL : 084 -651201 FAX : 085 - 653702
Majlis Daerah SimunjanJalan Kapitan 94800 SIMUNJAN,SARAWAKTEL : 082 - 803610/ 803622 FAX : 082 - 803785
Majlis Daerah Serian 94700 SERIAN, SARAWAK TEL: 084 - 874154 FAX : 084 - 874799
Majlis Daerah Sri Aman Peti Surat 78 95007 SRI AMAN, SARAWAK TEL : 083 - 322072 FAX : 083 - 320829
Majlis Daerah Subis 98150 BEKENU, SARAWAK TEL: 085 -719018 FAX: 085 - 719527
SABAH
PBT
Dewan Bandaraya Kota Kinabalu No. 1, Jalan Bandaran 88675 KOTA KINABALU. SABAH TEL: 088 - 254063 FAX: 088-219175
Majlis Perbandaran Sandakan Peti Surat 22190007 SANDAKAN. SABAH TEL: 089 - 273753 FAX: 089 - 272112
Majlis Perbandaran Tawau Peti Surat 412
Majlis Daerah Beaufort Peti Surat Bil 181
71

91007 TAWAU. SABAH TEL : 089 - 772868 FAX : 089 - 762267
89808 BEAUFORT. SABAHTEL : 087 - 21 1550FAX : 087 - 21 1539FAX : 087 - 211519 ( Pej Daerah )
Majlis Daerah Kinabatangan W.D.T. NO. 8,90200 KINABATANGAN, SABAH TEL : 089 - 560101 FAX : 089- 560100
Majlis Daerah Kuala Penyu Peti Surat No. 120 89740 KUALA PI NA L. SABAH TEL : 087 - 884248 FAX : 087 - 884709
Majlis Daerah Kota Belud Peti Surat No 889157 KOTA BELUD, SABAH TEL: 088 - 976529 FAX: 088 - 976529
Majlis Daerah Kota Marudu Peti Surat 12989100 KOTA MARUDU. SABAH TEL : 088 - 661323 FAX: 088-661163
Majlis Daerah Beluran Peti Surat 2090107 BELURAN, SABAHTEL : 089 - 511255 FAX : 089 - 511272
Majlis Daerah Lahad DatuPeti Surat 6024991112 LAHAD DATU, SABAHTEL: 089- 881621FAX : 089 - 881832
Majlis Daerah Keningau Peti Surat 18189008 KENINGAU, SABAH TEL: 087 - 341146 FAX : 087 - 339986
Majlis Daerah Papar Peti Surat 1 77,89608 PAPAR, SABAH TEL: 088 - 912318/911094 FAX : 088 -913608
Majlis Daerah Kunak Peti Surat Bil. 15 91207 KUNAK, SABAH TEL : 089- 851205 FAX : 089- 851398
Majlis Daerah Penampang Peti Surat 8089507 PENAMPANG, SABAH TEL: 088 - 711712 FAX : 088 - 712588
Majlis Daerah Nabawan Peti Surat No 2789957 NABAWAN PENSIANGAN. SABAHTEL : 087 - 366194 FAX : 087 - 366212
Majlis Daerah Sipitang Peti Surat 2889857 SIPITANG. SABAH TLL : 087 - 821701 FAX : 087 - 821284
Majlis Daerah Ranau Peti Surat No 57 89308 RANAU, SABAH TEL : 088 - 876411 FAX : 088 - 875542
Majlis Daerah Semporna Peti Surat Bil 134 91308 SEMPORNA. SABAH TEL : 089 - 785350 FAX : 089 - 785484
Majlis Daerah Tambunan Majlis Daerah Tenom
72

89650 TAMBUNAN, SABAH TEL : 087 - 770126/770127 FAX : 087 - 774441
Peti Surat 1 14 89907 TENOM. SABAH TEL: 087 - 735553 FAX : 087 - 735553
Majlis Daerah Tuaran Peti Surat Bil 580 89208 TUARAN, SABAH TEL: 088 - 788303/ 550 FAX: 088 - 787573
Lembaga Bandaran Kudat Peti Surat No 201 89058 KUDAT, SABAH TEL : 088 - 61 1266 FAX : 088 - 613002
73

APPENDIX C
UNIVERSITI TEKNOLOGI MARA KEDAH CAMPUS
SERIAL NO : For Office Use Only
THE DETERMINANTS OF MANAGEMENT ACCOUNTING PERFORMANCE AMONG DIPLOMA IN ACCOUNTANCY STUDENTS AT
UiTM KEDAH, PERLIS AND PERAK
Noraini Abdul Rahim / Wan Faizah Wan Abdullah / Marzlin Marzuki /Siti Salmah Abu Bakar
RESEARCH FORM
PART A
1. Student ID: (please specify)
2. Name of branch campus : (please specify)
3. Age (as at 1/1/2003) : (please specify)
4. Part: 5
5. Gender: Male | | Female [
6. Secondary school attended for SPM: Boarding school | | Daily school [
□ 6 U 7 Z 1 » □
74

7. Town in which vour school was located: Urban Q Rural Q
PART B
8. Grades obtained for each subject at SPM level.
AccountingCommerceEnglishMathematicsAdditional MathematicsEconomics
PART C
9. Grades obtained for each subject at UiTM Diploma in Accountancy Programme (Please indicate the first attempt grade only)
MAC210MAC260
A+ A A- B+ B B- C+ c c- D+ D D- E F
AI A2 B3 B4 C5 C6 D7 D8 G9
75

APPENDIX DDEMOGRAPHIC TABLE
Parameters Number of students Percentage (%)Gender
Male 124 27 5Female 325 72.1
Level of studyPart 5 132 29.3Part 6 256 56.8Part 7 37 8.2Part 8 26 5.8
School locationRural 169 37.5Urban 260 57.6
76

PERFORMANCE OF EACH MANAGEMENT ACCOUNTING COURSEBETWEEN STUDENTS WITH AND WITHOUT SPM ACCOUNTING
spm accounting N MeanStd.
DeviationStd. Error
Mean
Significant (2 tail)
grade point mac210 without 192 2 0346 .85863 06197 0 000with 243 2.4158 .88062 05649
grade point mac260 without 147 2.3627 .86186 O'7109 0.006with 202 2.6152 .82800 05826
grade point fmc330 without 104 2.2661 .92603 .09080 0.011with 168 ! 2.5533 .88508 ; .06829
PERFORMANCE OF EACH MANAGEMENT ACCOUNTING COURSE BETWEEN STUDENTS WITH AND WITHOUT SPM ADDITIONAL
MATHEMETICS
spm add math N
!
MeanStd.
DeviationStd. Error
Mean
Significant (2 tail)
grade point mac210 without 217 2.1 123 .89386 I .06068 0.002with 218 2.3730 .87572 1 .05931
grade point mac260 without 165 2.3958 .85875 .06685 0.020
with 182 2.6096 .83750 | .06208grade point fmc330 without 127 2.3622 .88286 .07834 0.154
with 141 2.5222 .94139 .07928
PERFORMANCE OF EACH MANAGEMENT ACCOUNTING COURSE BETWEEN STUDENTS WITH AND WITHOUT SPM ECONOMIC
spm economic N MeanStd.
DeviationStd. Error
Mean
Significant (2 tail)
grade point mac210 without 293 2.3106 .86245 .05038 0.021
with 146 2.1027 .92910 .07689grade point mac260 without 237 2.5566 85061 .05525 0 107
with 114 2.4005 .8391 1 07859grade point fmc330 without 185 2.5224 .88299 .06492 0.037
with 87 2.2757 .94863 .10170
77

PERFORMANCE OF EACH MANAGEMENT ACCOUNTING COURSEBETWEEN GENDER
gender N Mean Std. DeviationStd. Error
Mean
Significant (2 tail)
grade point mac210 female 318 1" 2.3134 .88440 .04959 0.006male 119 2.0532 j .88607 .08123
grade point mac260 female 256 2.5480 .85325 .05333 0 184male 93 2 4116 .82582 .08563
grade point fmc330 female 202 2.5197 .86950 .06118 0.019
male 70 2.2236 .99222 i .11859
PERFORMANCE OF EACH MANAGEMENT ACCOUNTING COURSE BETWEEN SCHOOL LOCATIONS
school location N Mean Std. DeviationStd. Error
Mean
Significant (2 tail)
grade point mac210 rural 165 2.1292 1 .87914 .06844 0.029
urban 252 2.3241 .89373 .05630grade point mac260 rural 133 2.581 1 .78271 .06787 0.210
urban 204 2.4623 .89089 .06238grade point fmc330 rural 90 2.4440 .79328 .08362 0.947
urban 169 2.4360 .98324 .07563
78

CORRELATION BETWEEN THE PERFORMANCE OF MANAGEMENT ACCOUNTING 210, SPM SUBJECTS AND DERMOGRAPHIC DATA
M A C 210 genderschoo l
lo ca tio nspm-
acco u n tin g spm -cng lishspm-
m athem atics spm-add mathspm-
econom ies
M A C 210 Pearson C o rre la tio n 1
S ig ( 2-tailed )
N 439
gender Pea rso n C o rre la tio n -. 13 0 ( * *) 1
S ig (2- ta ilcd ) .006
N 437 449
schoo l location Pearson C o rre la tio n . 107 ( * ) -03 2 1
S ig (2- ta iled ) .029 507
N 417 428 429
sp in -acco u n tin g Pearson C o rre la tio n * 173 (* *) - 076 - 020 1
S ig (2- ta iled ) .006 229 758
N 247 252 242 252
spm -cng lish Pearson C o rre la tio n . 191 ( * *) - 069 1 3 6 ( 0 2 4 4 ( 0 1
S ig (2- ta ilcd ) .000 145 005 000
N 432 442 425 250 444
sp m -m ath cm atics Pearson C o rre la tio n . 2 6 1 ( 0 - 007 071 3 0 6 ( 0 . 3 0 1 ( 0 1
S ig (2- ta ile d ) .000 876 141 000 000
N 436 446 428 252 444 448 1spm -add.m ath Pearson C o rre la tion . 3 0 6 ( 0 - 020 001 2 3 6 ( 0 1 9 5 ( 0 5 5 8 ( 0 1
S ig ( 2-tai le d ) .000 767 989 008 .003 000
N 222 226 218 126 228 228 228
spm -econom ics Pearson C o rre la tio n. 2 9 6 ( 0 - 1 81 ( * ) 078 2 4 6 0 160 2 8 7 ( 0 366 1
S ig (2- ta iled ) .000 027 359 037 .053 000 004
N 146 149 140 72 147 150 -- 150
** Correlation is significant at the 0.01 level (2-tailed). * Correlation is significant at the 0.05 level (2-tailed).
79

CORELLATION BETWEEN THE PERFORMANCE OF MANAGEMENT ACCOUNTING 260, MANAGEMENT ACCOUNTING 210 , SPMSUBJECTS AND DERMOGRAPHIC DATA
M A C 260 M A C 210 genderschool
locationspm-
acco u n tin g spm -englishspm-
m athem aticsspm-
spm-add m ath econom icsM A C 260 Pearson C o rre la tio n 1
S ig ( 2- ta iled )
N 351
M A C 210 Pearson C o rre la tio n , 4 33 ( * ‘ ) 1
S ig (2- ta iled ) .000
N 346 439
gender Pearson C o rre la tio n -.072 - 13 0 (* * ) 1
S ig (2- ta iled ) .177 .006 |
N 349 437 449
schoo l location Pearson C o rre la tio n -.069 10 7 (* ) - 032 1
S ig (2 - ta ilcd ) .209 029 507 ,N 337 417 428 429 '
sp m -accoun ting Pearson C o rre la tio n . 223 ( * * ) 1 7 3 (* * ) - 076 - 020 1 1
S ig (2 - ta ilc d ) .001 .006 229 758
N 204 247 252 242 252
spm -english Pearson C o rre la tio n .023 191( * * ) - 069 13 6 (* *) 2 4 4 (* * ) 1
S ig (2 - ta ilc d ) .665 000 145 005 000
N 344 432 442 425 250 444
spm -m athem atics Pearson C o rre la tio n . 174 (* *) 261 ( * *) - 007 071 306( * * ) 3 0 1 (* * ) 1
S ig (2- ta iled ) .001 000 876 141 000 000
N 348 436 446 428 252 444 448
spm -add m ath Pearson C o rre la tio n • 245 ( * *) 3 0 6 (* * ) -.020 001 2 3 6 (* * ) 19 5 (* * ) 5 5 S (* * ) 1
S ig . (2- ta iled ) .001 000 767 989 008 003 000
N 186 222 226 218 126 228 228 228 |
80

spm -econom ics Pearson C o rre la tio n . 253 ( * * ) 2 9 6 ( 0 - 1 81 (*) 078 2 4 6 0 160 2 8 7 ( 0 366 i
S ig ( 2-la i l e d ) .007 000 .027 .359 .037 053 000 094
N 114 146 149 140 72 147 150 150
** Correlation is significant at the 0.01 level (2-tailed). * Correlation is significant at the 0.05 level (2-tailed).
81
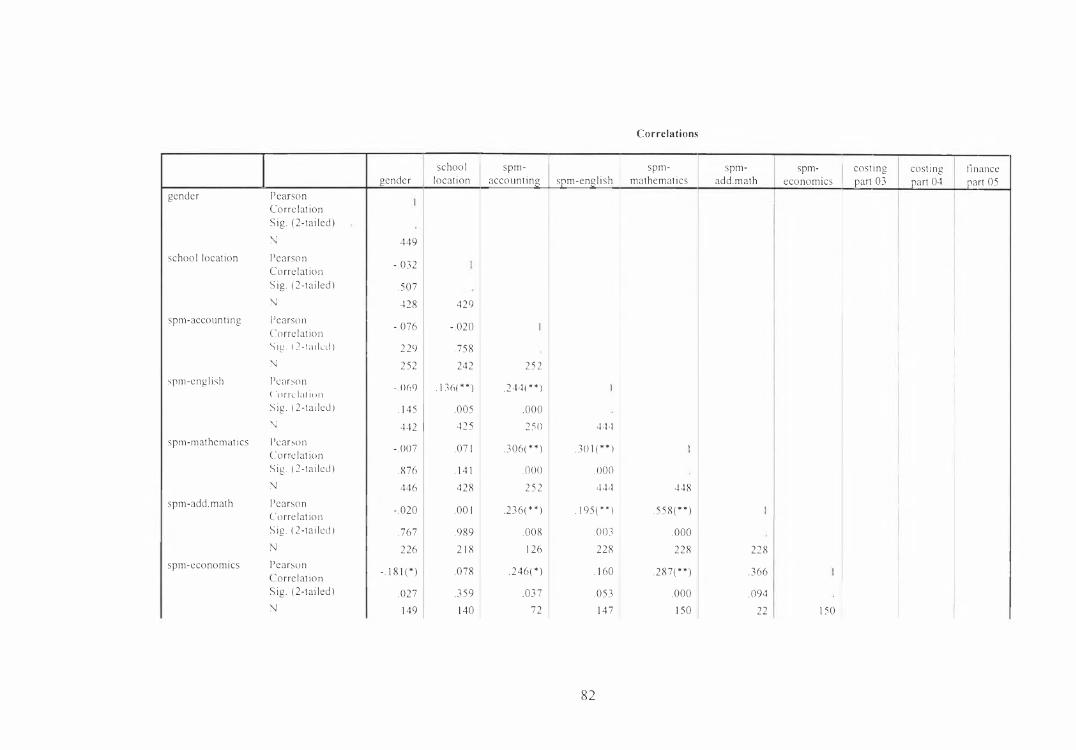
Correlations
genderschool
locationspm-
accounting spm-englishspm-
mathematicsspm-
add.mathspm-
economicscosting part 03
costing part 04
finance part 05
gender Pearson Correlation Sig. (2-tailed)N
!
449school location Pearson
Correlation -.032 l
Sig. (2-tailed) .507N 428 429
spm-accounting PearsonCorrelation -.076 -.020 I
Sig. (2-tailed) .229 .758N 252 242 252
spm-english Pearson ( orrdalmn - 069 . 136(**) ,244(**) 1Sig. (2-tailed) .145 .005 .000N 442 425 250 444
spm-mathematics PearsonCorrelation -.007 .071 .306(**) .301 (**) 1
Sig. (2-tailed) .876 .141 .000 .000N 446 428 252 444 448
spm-add.math PearsonCorrelation -.020 .001 .236(**) . 195(**) .558(**) \Sig. (2-tailed) .767 .989 .008 .003 .000N 226 218 126 228 228 228
spm-economics PearsonCorrelation - 181(*) .078 .246(*) .160 .287(**) .366 1
Sig. (2-tailed) .027 .359 .037 .053 .000 .094N 149 140 72 147 150 22 150
82

costing part 03 PearsonCorrelation - 130(**) •107(*) . 173(**)Sig. (2-tailed) .006 .029 .006N 437 417 247
costing part 04 PearsonCorrelation -.072 -.069 .223(**)Sig. (2-tailed) .177 .209 .001N 349 337 204
finance part 05 PearsonCorrelation -.143(*) -.004 .257(**)Sig. (2-tailed) .019 .947 .001N 272 259 168
* Correlation is significant at the 0.05 level (2-tailed). ** Correlation is significant at the 0.01 level (2-tailcd).
191(**) .261(**) .306(**) ,296(**) 1.000 .000 .000 .000432 436 222 146 439.023 .174(**) .245(**) .253(**) .433(**) 1.665 .001 .001 .007 .000 >:344 348 186 114 346 351
.071 .179(**) •183(*) •412(**) .514(**) .457(**) 1
.246 .003 .028 .000 .000 .000267 270 145 87 267 243 272
83

Model Summary(b)
Predictor for MAC 210 (stepwise multiple regression)
R Square F Sig0.515 7.424 0.030
a Predictors: (Constant), spm-economics b Dependent Variable: costing part 03
Included variables
Unstandardized Coefficients Sic..
B Std. Error(Constant) 0.724 .583 .254spm-economics 0.254 .093 .030a Dependent Variable: costing part 03
Excluded Variables
b Dependent Variable: costing part 03
Model
MAC 210 = 0.724 + 0.254 (SPM-economics) + e\
84

Predictor for MAC 260 (stepwise multiple regression)
Model Summary(b)
R Square F Significant
0.337 9.661 0.006
a Predictors: (Constant), spm-economics b Dependent Variable: costing part 04
Included variables
Unstandardized Coefficients _ Sig. _
B Std. Error(Constant) 1.237 .431 .010
i spm-cconomics .222 .072 .006
a Dependent Variable: costing part 04
Excluded Variables
b Dependent Variable: costing part 04
Model
MAC 260 = 1.237 + 0.222 (SPM-economics) + e\
85

PROGRESS SCHEDULE
D a t eA c t iv i t y
4 ,5 ,6,7 ( 2 0 0 4 )
8,9( 2 0 0 4 )
1 0 , 11 ,12 ( 2 0 0 4 ) , 1 ( 2 0 0 5 )
2 ,3 ,4 ,5 ( 2 0 0 5 )
6,7( 2 0 0 5 )
8,9( 2 0 0 5 )
LiteratureReview/frameworkResearch Design/ResearchMethodology/Theoretical
* ** * ' 4
i l |,
Drafting Questionnaire & Pilot testing
D a t a C o l l e c t i o n /
InterviewsConducted
D a ta A n a l y s i s
Results and Findings
W r i t i n g U p
86