Cost and Management Accounting - Cengage
209
Cost and Management Accounting Eighth Edition Students’ Manual Colin Drury Australia • Brazil • Japan • Korea • Mexico • Singapore • Spain • United Kingdom • United States
-
Upload
khangminh22 -
Category
Documents
-
view
1 -
download
0
Transcript of Cost and Management Accounting - Cengage
Cost and
Management Accounting
Eighth Edition
Students’
Manual
Colin Drury
Australia • Brazil • Japan • Korea • Mexico • Singapore • Spain • United Kingdom • United States

Cost and Management Accounting 8e: Students’ Manual Colin Drury
Production Editor: Susan Povey Publisher: Andrew Ashwin Development Editor: Jennifer Greene
Editorial Assistant: Gareth Bentley
© 2015, Cengage Learning EMEA
ALL RIGHTS RESERVED. No part of this work covered by the
copyright herein may be reproduced, transmitted, stored or used
in any form or by any means graphic, electronic, or mechanical,
including but not limited to photocopying, recording, scanning,
digitizing, taping, Web distribution, information networks, or
information storage and retrieval systems, except as permitted
under Section 107 or 108 of the 1976 United States Copyright Act,
or applicable copyright law of another jurisdiction, without the
prior written permission of the publisher.
While the publisher has taken all reasonable care in the
preparation of this book, the publisher makes no representation,
express or implied, with regard to the accuracy of the information
contained in this book and cannot accept any legal responsibility
or liability for any errors or omissions from the book or the
consequences thereof.
Products and services that are referred to in this book may be either trademarks and/or registered trademarks of their respective owners. The publishers and author/s make no claim to these trademarks.
For product information and technology assistance, contact
[email protected]. For permission to use material from this text or product, and
for permission queries, email [email protected].
British Library Cataloguing-in-Publication Data A catalogue record for this book is available from the British Library.
Cengage Learning EMEA Cheriton House, North Way, Andover, Hampshire, SP10 5BE, United Kingdom
Cengage Learning products are represented in Canada by Nelson Education Ltd.
For your lifelong learning solutions, visit www.cengage.co.uk Purchase your next print book, e-book or e-chapter at www.cengagebrain.co.uk

Contents
Part 1: Questions 1An introduction to cost terms and conceptsAccounting for direct costsCost assignment for indirect costsAccounting entries for a job costing systemProcess costingJoint and by-product costingIncome effects of alternative cost accumulation systemsCost-volume-profit analysisCost estimation and cost behaviourMeasuring relevant costs and revenues for decision-making
The application of linear programming to management accounting
Activity-based costing
Decision-making under conditions of risk and uncertainty
The budgeting process Management control systemsStandard costing and variance analysis
Part 2: SolutionsAn introduction to cost terms and conceptsAccounting for direct costsCost assignment for indirect costsAccounting entries for a job costing systemProcess costingJoint and by-product costingIncome effects of alternative cost accumulation systemsCost-volume-profit analysisCost estimation and cost behaviourMeasuring relevant costs and revenues for decision-making
The application of linear programming to management accounting
Activity-based costing
Decision-making under conditions of risk and uncertainty
The budgeting process Management control systemsStandard costing and variance analysis
35
1120253137424953626671798689
99 19396
104112119129134142
155151
162168174182192197


Part I
Questions

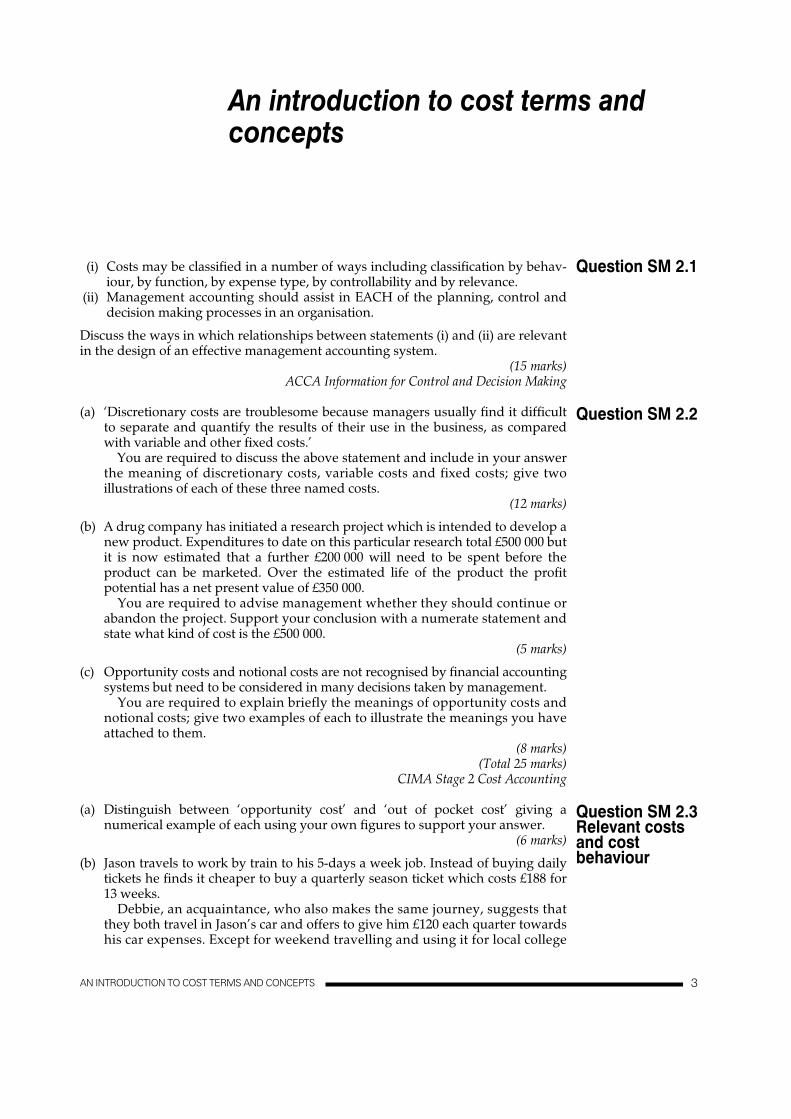
(i) Costs may be classified in a number of ways including classification by behav-iour, by function, by expense type, by controllability and by relevance.
(ii) Management accounting should assist in EACH of the planning, control anddecision making processes in an organisation.
Discuss the ways in which relationships between statements (i) and (ii) are relevantin the design of an effective management accounting system.
(15 marks)ACCA Information for Control and Decision Making
(a) ‘Discretionary costs are troublesome because managers usually find it difficultto separate and quantify the results of their use in the business, as comparedwith variable and other fixed costs.’
You are required to discuss the above statement and include in your answerthe meaning of discretionary costs, variable costs and fixed costs; give twoillustrations of each of these three named costs.
(12 marks)
(b) A drug company has initiated a research project which is intended to develop anew product. Expenditures to date on this particular research total £500 000 butit is now estimated that a further £200 000 will need to be spent before theproduct can be marketed. Over the estimated life of the product the profitpotential has a net present value of £350 000.
You are required to advise management whether they should continue orabandon the project. Support your conclusion with a numerate statement andstate what kind of cost is the £500 000.
(5 marks)
(c) Opportunity costs and notional costs are not recognised by financial accountingsystems but need to be considered in many decisions taken by management.
You are required to explain briefly the meanings of opportunity costs andnotional costs; give two examples of each to illustrate the meanings you haveattached to them.
(8 marks)(Total 25 marks)
CIMA Stage 2 Cost Accounting
(a) Distinguish between ‘opportunity cost’ and ‘out of pocket cost’ giving anumerical example of each using your own figures to support your answer.
(6 marks)
(b) Jason travels to work by train to his 5-days a week job. Instead of buying dailytickets he finds it cheaper to buy a quarterly season ticket which costs £188 for13 weeks.
Debbie, an acquaintance, who also makes the same journey, suggests thatthey both travel in Jason’s car and offers to give him £120 each quarter towardshis car expenses. Except for weekend travelling and using it for local college
Question SM 2.1
Question SM 2.2
Question SM 2.3Relevant costsand costbehaviour
AN INTRODUCTION TO COST TERMS AND CONCEPTS 3
An introduction to cost terms andconcepts
3

attendance near his home on three evenings each week to study for his CIMAStage 2, the car remains in Jason’s garage.
Jason estimates that using his car for work would involve him, each quarter,in the following expenses:
(£)
Depreciation (proportion of annual figure) 200Petrol and oil 128Tyres and miscellaneous 52
You are required to state whether Jason should accept Debbie’s offer and todraft a statement to show clearly the monetary effect of your conclusion.
(5 marks)
(c) A company with a financial year 1 September to 31 August prepared a salesbudget which resulted in the following cost structure:
% of sales
Direct materials 32Direct wages 18Production overhead: variable 6
fixed 24Administrative and selling costs: variable 3
fixed 7Profit 10
After ten weeks, however, it became obvious that the sales budget was toooptimistic and it has now been estimated that because of a reduction in salesvolume, for the full year, sales will total £2 560 000 which is only 80% of thepreviously budgeted figure.
You are required to present a statement for management showing theamended sales and cost structure in £s and percentages, in a marginalcosting format.
(4 marks)(Total 15 marks)
CIMA Stage 2 Cost Accounting
4 AN INTRODUCTION TO COST TERMS AND CONCEPTS
If actual output is lower than budgeted output, which of the following costs would you expect to be lower than the original budget?A Total variable costsB Total fi xed costsC Variable costs per unitD Fixed costs per unit
ACCA Foundation Paper 3
Which of the following would be classed as indirect labour?A assembly workers in a company manufacturing televisions;B a stores assistant in a factory store;C plasterers in a construction company;D an audit clerk in a fi rm of auditors.
CIMA Stage 1 Cost Accounting
Question SM 2.4
Question SM 2.5
4

A company currently remunerates its factory workers on a time basis and is nowconsidering the introduction of alternative methods of remuneration. The follow-ing information relates to two employees for one week:
Y Z
Hours worked 44 40Rate of pay per hourUnits of output achieved 480 390
Required:(a) Calculate the earnings of each employee where earnings are based on:
(i) piecework rates with earnings guaranteed at 80% of pay calculated on anhourly basis; (4 marks)
(ii) premium bonus scheme in which bonus (based on 75% of time saved) isadded to pay calculated on an hourly basis. (3 marks)
(b) Describe two situations in which the time basis of remuneration is likely to bemore appropriate than piecework schemes. (4 marks)
(Total 11 marks)AAT Cost Accounting and Budgeting
(a) Describe the characteristics of factory direct and indirect labour cost andexplain the treatment of factory overtime wages and holiday pay in costaccounting systems. (9 marks)
(b) A Ltd makes engineering components. The company has been manufacturing
A new remuneration scheme is being introduced. Each employee will receive pay-ment on the following basis:
next 200all additional
output will increase to 6600 components per week with the new scheme.
Required:Describe the general features of time-based and individual-performance-basedremuneration systems, and outline the relative merits of each type of system. (Usethe above figures to illustrate your discussion, making whatever additionalassumptions that you feel are necessary.) (16 marks)
(Total 25 marks)ACCA Level 1 Costing
Question SM 3.1Calculation ofearnings
Question SM 3.2Calculation ofearnings and adiscussion oftime-based andindividualperformance-basedremunerationsystems
ACCOUNTING FOR DIRECT COSTS 5
Accounting for direct costs
£12
The time allowed for each unit of output is seven standard minutes. For purposes
£14
at a basic wage of £12 per hour. Each worker operates independently.6000 components per week, with six direct employees working a 40-hour week,
first 800 components per week – 48 pence per unit5154
There will be a guaranteed minimum wage of £420 per week. It is expected that
5
of piecework calculations each minute is valued at £0.16.

X Ltd has an average of 42 workers employed in one of its factories in a period dur-ing which 7 workers left and were replaced.
used as the standard rate. In addition, a factory-wide bonus scheme is in operation.A bonus of half of the efficiency ratio in excess of 100% is added as a percentage to
Required:(a) Calculate the labour turnover percentage for the period. (3 marks)(b)
be reduced (12 marks)(c)
(10 marks)(Total 25 marks)
ACAA Cost and Management Accounting I
(a) Explain how the following cost items, relating to direct personnel, would beprocessed in a manufacturing business’s cost accounts:(i) idle time; (3 marks)
(ii) overtime. (3 marks)
(b) The following information is available regarding the labour costs in a factorydepartment for a week:
Direct personnel Indirect personnel
Payroll hours:Production 432 117Training 24 —Idle time 32 4Total 488 121
Rates per hour:Basic £7.50 £6.00Overtime premium £2.50 £2.00
The following additional information is provided:(i) There are 12 direct personnel and 3 indirect personnel in the department.
(ii) Group bonuses for the week, shared by all workers in the department,total £520.
(iii) The basic wage rates apply to a normal working week of 37 hours.(iv) Overtime is worked in order to meet the general requirements of production.(v) The idle time and the time spent training during the week are regarded as
normal.(vi) The expected number of payroll hours of direct personnel in the week
(excluding time spent training), required to produce the output achieved,is 470.
Required:(i) Calculate the total amounts paid in the week (before share of group bonus) to
direct personnel and indirect personnel respectively. (4 marks)(ii) Determine the total amounts to be charged as direct wages and indirect
wages respectively. (5 marks)(iii) Complete the Wages Control Account in the company’s separate cost account-
ing system, clearly indicating the account in which each corresponding entrywould be made. (3 marks)
Question SM 3.3Calculation oflabour turnoverand efficiencyratio
Question SM 3.4Computation ofearnings andanalysis by directand indirectcategories
6 ACCOUNTING FOR DIRECT COSTS
The company pays a basic rate of £13.80 per hour to all its direct personnel. This is
the basic hourly rate, e.g. if the efficiency ratio is 110% then the hourly rate is £14.49
Identify the reasons for, and cost of, labour turnover, and discuss how it may
During the period 114 268 units of the company’s single product were manufac-
Calculate the hourly wage rate paid for the period, and the total labour variance.
tured in 4900 hours. The standard hour is 22 units.
(i.e. £13.80 + (£13.80 × 5%)).
6
(iv) Calculate the efficiency ratio relating to the direct personnel (expressed as apercentage to one decimal place). (2 marks)
(Total 20 marks)ACCA Management Information – Paper 3
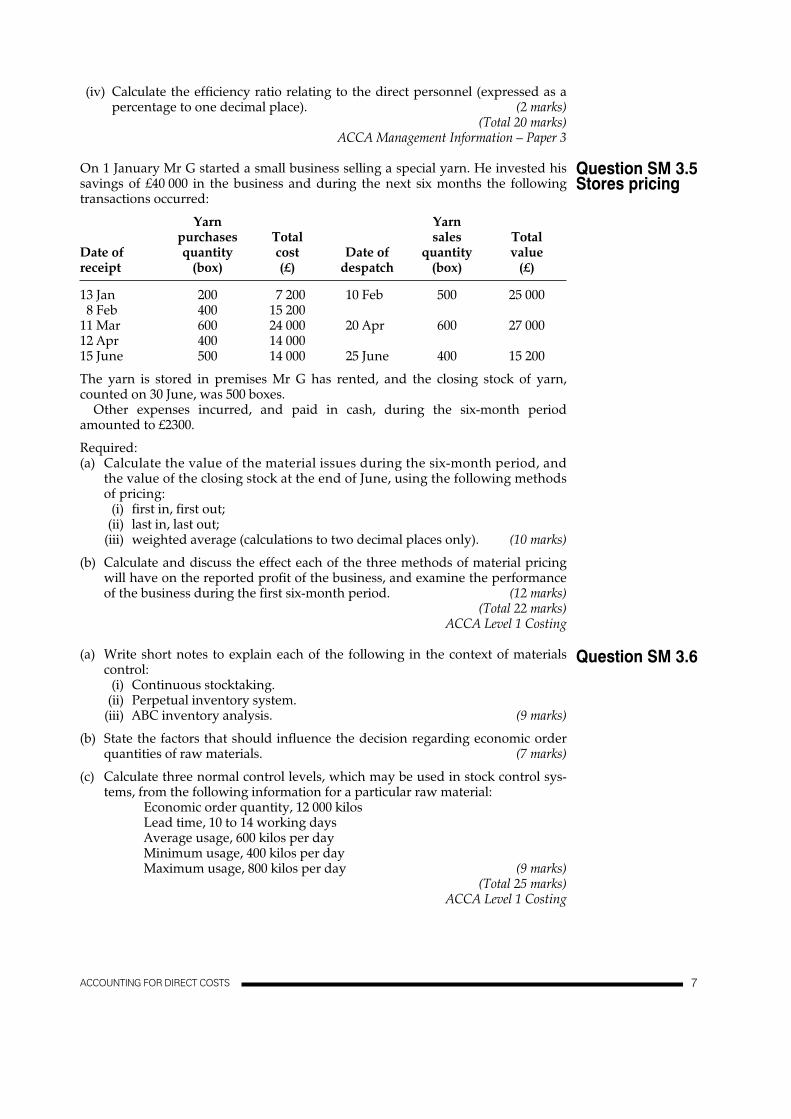
On 1 January Mr G started a small business selling a special yarn. He invested hissavings of £40 000 in the business and during the next six months the followingtransactions occurred:
Yarn Yarn purchases Total sales Total
Date of quantity cost Date of quantity value receipt (box) (£) despatch (box) (£)
13 Jan 200 7 200 10 Feb 500 25 0008 Feb 400 15 200
11 Mar 600 24 000 20 Apr 600 27 00012 Apr 400 14 00015 June 500 14 000 25 June 400 15 200
The yarn is stored in premises Mr G has rented, and the closing stock of yarn,counted on 30 June, was 500 boxes.
Other expenses incurred, and paid in cash, during the six-month periodamounted to £2300.
Required:(a) Calculate the value of the material issues during the six-month period, and
the value of the closing stock at the end of June, using the following methodsof pricing:
(i) first in, first out;(ii) last in, last out;
(iii) weighted average (calculations to two decimal places only). (10 marks)
(b) Calculate and discuss the effect each of the three methods of material pricingwill have on the reported profit of the business, and examine the performanceof the business during the first six-month period. (12 marks)
(Total 22 marks)ACCA Level 1 Costing
(a) Write short notes to explain each of the following in the context of materialscontrol:
(i) Continuous stocktaking.(ii) Perpetual inventory system.
(iii) ABC inventory analysis. (9 marks)
(b) State the factors that should influence the decision regarding economic orderquantities of raw materials. (7 marks)
(c) Calculate three normal control levels, which may be used in stock control sys-tems, from the following information for a particular raw material:
Economic order quantity, 12 000 kilosLead time, 10 to 14 working daysAverage usage, 600 kilos per dayMinimum usage, 400 kilos per dayMaximum usage, 800 kilos per day (9 marks)
(Total 25 marks)ACCA Level 1 Costing
Question SM 3.5Stores pricing
Question SM 3.6
ACCOUNTING FOR DIRECT COSTS 77
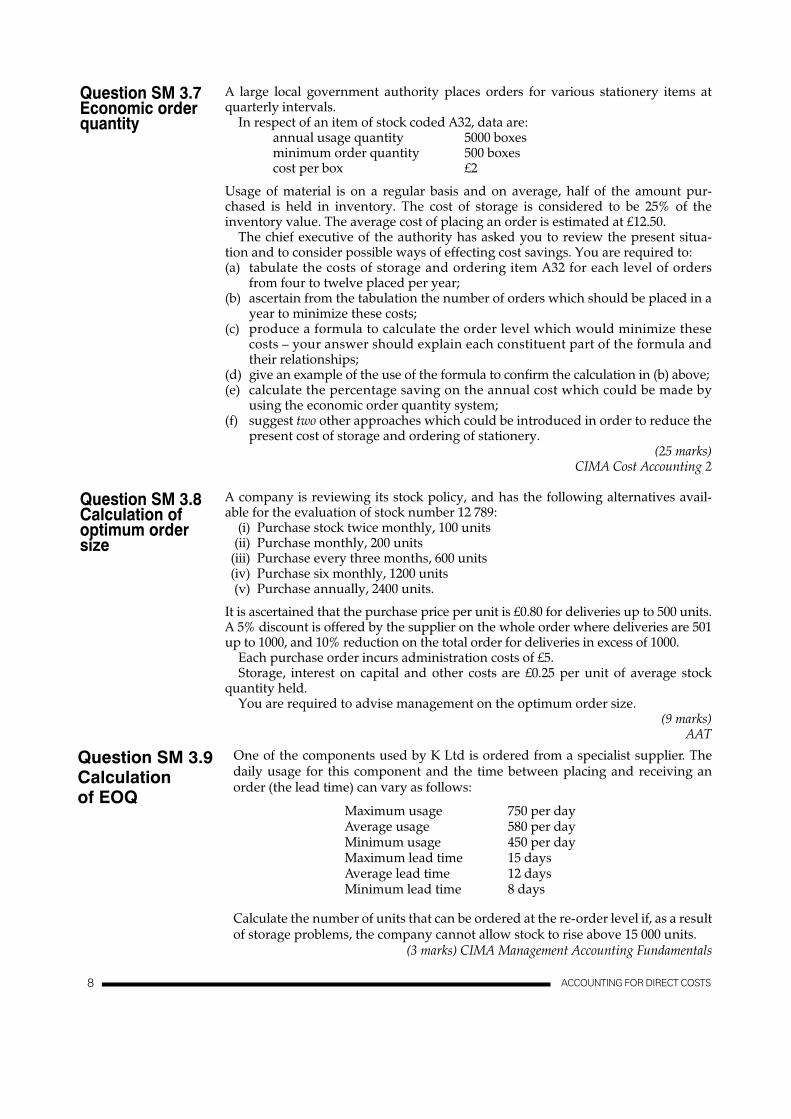
A large local government authority places orders for various stationery items atquarterly intervals.
In respect of an item of stock coded A32, data are:annual usage quantity 5000 boxesminimum order quantity 500 boxescost per box £2
Usage of material is on a regular basis and on average, half of the amount pur-chased is held in inventory. The cost of storage is considered to be 25% of theinventory value. The average cost of placing an order is estimated at £12.50.
The chief executive of the authority has asked you to review the present situa-tion and to consider possible ways of effecting cost savings. You are required to:(a) tabulate the costs of storage and ordering item A32 for each level of orders
from four to twelve placed per year;(b) ascertain from the tabulation the number of orders which should be placed in a
year to minimize these costs;(c) produce a formula to calculate the order level which would minimize these
costs – your answer should explain each constituent part of the formula andtheir relationships;
(d) give an example of the use of the formula to confirm the calculation in (b) above;(e) calculate the percentage saving on the annual cost which could be made by
using the economic order quantity system;(f) suggest two other approaches which could be introduced in order to reduce the
present cost of storage and ordering of stationery.(25 marks)
CIMA Cost Accounting 2
A company is reviewing its stock policy, and has the following alternatives avail-able for the evaluation of stock number 12 789:
(i) Purchase stock twice monthly, 100 units(ii) Purchase monthly, 200 units
(iii) Purchase every three months, 600 units(iv) Purchase six monthly, 1200 units(v) Purchase annually, 2400 units.
It is ascertained that the purchase price per unit is £0.80 for deliveries up to 500 units.A 5% discount is offered by the supplier on the whole order where deliveries are 501up to 1000, and 10% reduction on the total order for deliveries in excess of 1000.
Each purchase order incurs administration costs of £5.Storage, interest on capital and other costs are £0.25 per unit of average stock
quantity held.You are required to advise management on the optimum order size.
(9 marks)AAT
Question SM 3.7Economic orderquantity
Question SM 3.8Calculation ofoptimum ordersize
8 ACCOUNTING FOR DIRECT COSTS
One of the components used by K Ltd is ordered from a specialist supplier. The daily usage for this component and the time between placing and receiving an order (the lead time) can vary as follows:
Maximum usage 750 per dayAverage usage 580 per dayMinimum usage 450 per dayMaximum lead time 15 daysAverage lead time 12 daysMinimum lead time 8 days
Calculate the number of units that can be ordered at the re-order level if, as a result of storage problems, the company cannot allow stock to rise above 15 000 units.
(3 marks) CIMA Management Accounting Fundamentals
Question SM 3.9Calculation of EOQ
8

ACCOUNTING FOR DIRECT COSTS 5
A business currently order 1000 units of product X at a time. It has decided that it may be better to use the Economic Order Quantity method to establish an optimal reorder quantity.Information regarding stocks is given below:
Purchase price £15/unitFixed cost per order £200Holding cost 8% of the purchase price per annumAnnual demand 12 000 units
Current annual total stock costs are £183 000, being the total of the purchasing, ordering and holding costs of product X.
Required:(a) Calculate the Economic Order Quantity
(2 marks)(b) Using your answer to (a) above calculate the revised annual total stock costs
for product X and so establish the difference compared to the current ordering policy.
(4 marks) ACCA Paper 1.2 - Financial Information for Management
A company values stocks using the weighted average value after each purchase. The following receipts and issues have been made with regards to materials for the last month:
Receipts IssuesDate Units £/unit Valuation Units
Brought forward 100 5 £5004th 150 5.50 £8.2516th 10020th 100 6 £60021st 75
What is the value of the closing stock using this weighted average method?A £1012.50B £976.50C £962.50D £925.00
ACCA Paper 1.2 - Financial Information for Management
Moura uses the economic order quantity formula (EOQ) to establish its optimal reorder quantity for its single raw material. The following data relates to the stock costs:
Purchase price: £15 per itemCarriage costs: £50 per orderOrdering costs: £5 per orderStorage costs: 10% of purchase price plus £0.20 per unit
per annum
Question SM 3.11
Question SM 3.12
Question SM 3.10Calculation of EOQ
9
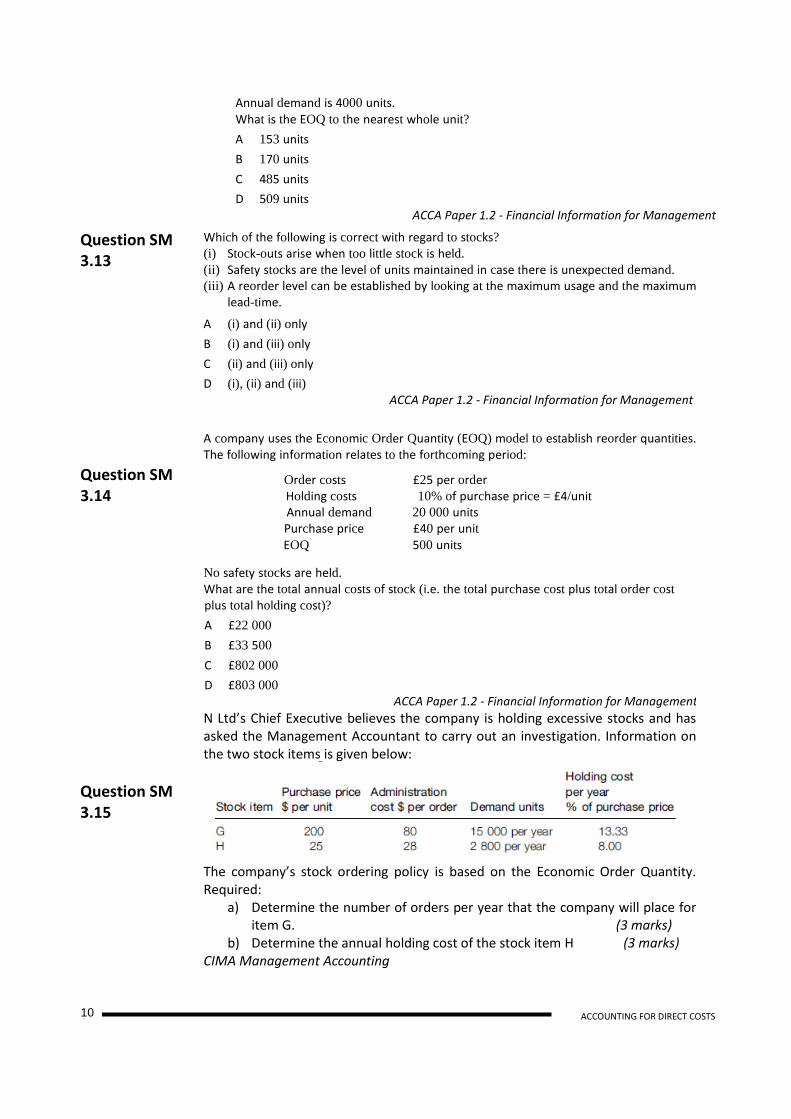
Annual demand is 4000 units. What is the EOQ to the nearest whole unit?
A 153 units
B 170 units
C 485 units
D 509 units ACCA Paper 1.2 - Financial Information for Management
Question SM 3.13
Question SM 3.14 Question SM 3.15
Which of the following is correct with regard to stocks? (i) Stock-outs arise when too little stock is held. (ii) Safety stocks are the level of units maintained in case there is unexpected demand. (iii) A reorder level can be established by looking at the maximum usage and the maximum
lead-time.
A (i) and (ii) only
B (i) and (iii) only
C (ii) and (iii) only
D (i), (ii) and (iii) ACCA Paper 1.2 - Financial Information for Management
A company uses the Economic Order Quantity (EOQ) model to establish reorder quantities.
The following information relates to the forthcoming period:
Order costs £25 per order Holding costs 10% of purchase price = £4/unit Annual demand 20 000 units Purchase price £40 per unit EOQ 500 units
No safety stocks are held. What are the total annual costs of stock (i.e. the total purchase cost plus total order cost
plus total holding cost)?
A £22 000
B £33 500
C £802 000
D £803 000 ACCA Paper 1.2 - Financial Information for Management
N Ltd’s Chief Executive believes the company is holding excessive stocks and has asked the Management Accountant to carry out an investigation. Information on the two stock items is given below:
The company’s stock ordering policy is based on the Economic Order Quantity. Required:
a) Determine the number of orders per year that the company will place for item G. (3 marks)
b) Determine the annual holding cost of the stock item H (3 marks) CIMA Management Accounting
ACCOUNTING FOR DIRECT COSTS 6 10

Question SM 3.13
You have been approached for your advice on the proposed
introduction of an incentive scheme for the direct operatives in the
final production department of a factory producing one standard
product. This department, the Finishing Shop, employs 30 direct
operatives, all of whom are paid £8 per hour for a basic 40-hour
week, with a guaranteed wage of £320 per week. When necessary,
overtime is worked up to a maximum of 15 hours per week per
operative and is paid at time rate plus one-half. It is the opinion of
the personnel manager that no more direct operatives could be
recruited for this department.
An analysis of recent production returns from the Finishing Shop
indicates that the current average output is approximately 6 units of
the standard product per productive man-hour. The work study
manager has conducted an appraisal of the working methods in the
Finishing Shop and suggests that it would be reasonable to expect
operatives to process 8 units of the product per man-hour and that a
piecework scheme be introduced in which the direct operatives are
paid £1.40 for each unit processed. It is anticipated that, when
necessary, operatives would continue to work overtime up to the
previous specified limit, although as the operatives would be on
piecework no premium would be paid.
Next year’ s budgeted production for the factory varies from a
minimum of 7000 units per week to a maximum of 12 000 units per
week, with the most frequent budgeted weekly output being 9600
units. The expected selling price of the product next year is £11 per
unit and the budgeted variable production cost of the incomplete
product passed into the Finishing Shop amounts to £8 per unit.
Variable production overheads in the Finishing Shop, excluding the
overtime premium of the direct operatives, are budgeted to be £0.48
per direct labour hour worked, and it is considered that variable
overheads do vary directly with productive hours worked. Direct
material costs are not incurred by the Finishing Shop. The fixed
overheads incurred by the factory amount in total to £9000 per
week.
Stocks of work in progress and finished goods are not carried.
Required:
(i) Calculate the effect on the company’s budgeted weekly profits
of the proposed incentive scheme in the Finishing Shop.
(Calculation should be to the nearest £.)
(15 marks)
(ii) Explain the reasons for the changes in the weekly budgeted
profits caused by the proposed incentive scheme.
(7 marks)
ACCA Level 1
ACCOUNTING FOR DIRECT COSTS 6 10a

Knowing that you are studying for the CIMA qualification, a friend who manages asmall business has sought your advice about how to produce quotations inresponse to the enquiries which her business receives. Her business is sheet metalfabrication – supplying ducting for dust extraction and air conditioning installa-tions. She believes that she has lost orders recently through the use of a job costestimating system which was introduced, on the advice of her auditors, sevenyears ago. You are invited to review this system.
Upon investigation, you find that a plant-wide percentage of 125% is added toprime costs in order to arrive at a selling price. The percentage added is intended tocover all overheads for the three production departments (Departments P, Q andR), all the selling, distribution and administration costs, and the profit.
You also discover that the selling, distribution and administration costs equate toroughly 20% of total production costs, and that to achieve the desired return oncapital employed, a margin of 20% of sales value is necessary.
You recommend an analysis of overhead cost items be undertaken with theobjective of determining a direct labour hour rate of overhead absorption for eachof the three departments work passes through. (You think about activity-basedcosting but feel this would be too sophisticated and difficult to introduce at thepresent time.)
There are 50 direct workers in the business plus 5 indirect production people.From the books, records and some measuring, you ascertain the following infor-
mation which will enable you to compile an overhead analysis spreadsheet, and todetermine overhead absorption rates per direct labour hour for departmental over-head purposes:
Cost/expense Annual Basis foramount apportionment
where allocationnot given
£Repairs and maintenance 62 000 Technical assessment:
P £42 000, Q £10 000, R £10 000Depreciation 40 000 Cost of plant and equipmentConsumable supplies 9 000 Direct labour hoursWage-related costs 87 000 12.5% of direct wages costsIndirect labour 90 000 Direct labour hoursCanteen/rest/smoke room 30 000 Number of direct workersBusiness rates and insurance 26 000 Floor area
Question SM 4.1Overheadanalysis,calculation ofoverhead ratesand a productcost
COST ASSIGNMENT FOR INDIRECT COSTS 9
Cost assignment for indirect costs
11

Other estimates/information
Department Department DepartmentP Q R
Estimated direct labour hours 50 000 30 000 20 000Direct wages costs £386 000 £210 000 £100 000Number of direct workers 25 15 10Floor area in square metres 5 000 4 000 1 000Plant and equipment, at cost £170 000 £140 000 £90 000
Required:(a) Calculate the overhead absorption rates for each department, based on direct
labour hours. (9 marks)
(b) Prepare a sample quotation for Job 976, utilising information given in the ques-tion, your answer to (a) above, and the following additional information:
Estimated direct material cost: £800Estimated direct labour hours: 30 in Department P
10 in Department Q5 in Department R
(3 marks)
(c) Calculate what would have been quoted for Job 976 under the ‘auditors’ sys-tem’ and comment on whether your friend’s suspicions about lost businesscould be correct. (3 marks)
(Total 15 marks)CIMA Stage 2 Cost Accounting
DC Limited is an engineering company which uses job costing to attribute costs toindividual products and services provided to its customers. It has commenced the
(£000)
Machining 600Assembly 250Finishing 150Stores 100Maintenance 80
1 180
The stores and maintenance departments are production service departments.An analysis of the services they provide indicates that their costs should beapportioned accordingly:
Machining Assembly Finishing Stores Maintenance
Stores 40% 30% 20% — 10%Maintenance 55% 20% 20% 5% —
Machining Assembly Finishing
Machine hours 50 000 4 000 5 000Labour hours 10 000 30 000 20 000
Requirements:(a) Calculate appropriate overhead absorption rates for each production department
(9 marks)
Question SM 4.2Calculation ofoverhead ratesand a productcost
10 COST ASSIGNMENT FOR INDIRECT COSTS
for the next financial year.
12
and has identified the following costs:preparation of its fixed production overhead cost budget for the next financial year
The number of machine and labour hours budgeted is:

(b) Prepare a quotation for job number XX34, which is to be commenced early in
Direct materials costing £2400Direct labour costing £1500and requires:
Machine Labourhours hours
Machining department 45 10Assembly department 5 15Finishing department 4 12
and that profit is 20% of selling price. (5 marks)
(c)
hours were 30 700.Prepare the fixed production overhead control account for the assembly
(5 marks)
(d) Explain how activity based costing would be used in organisations like DCLimited. (6 marks)
(Total marks 25)CIMA Stage 2 Operational Cost Accounting
A manufacturing company has two production cost centres (Departments A and B)and one service cost centre (Department C) in its factory.
A predetermined overhead absorption rate (to two decimal places of £) is estab-lished for each of the production cost centres on the basis of budgeted overheadsand budgeted machine hours.
The overheads of each production cost centre comprise directly allocated costsand a share of the costs of the service cost centre.
Budgeted production overhead data for a period is as follows:
Department A Department B Department C
Allocated costs £217 860 £374 450 £103 970Apportioned costs £45 150 £58 820 (£103 970)Machine hours 13 730 16 110Direct labour hours 16 360 27 390
Actual production overhead costs and activity for the same period are:
Department A Department B Department C
Allocated costs £219 917 £387 181 £103 254Machine hours 13 672 16 953Direct labour hours 16 402 27 568
70% of the actual costs of Department C are to be apportioned to production costcentres on the basis of actual machine hours worked and the remainder on thebasis of actual direct labour hours.
Required:(a) Establish the production overhead absorption rates for the period. (3 marks)(b) Determine the under- or over-absorption of production overhead for the
period in each production cost centre. (Show workings clearly.) (12 marks)(c) Explain when, and how, the repeated distribution method may be applied in
the overhead apportionment process. (5 marks)(Total 20 marks)
ACCA Management Information – Paper 3
Question SM 4.3Calculation ofoverheadabsorption ratesand under/over-recovery ofoverheads
COST ASSIGNMENT FOR INDIRECT COSTS 11
the next financial year, assuming that it has:
Assume for the next financial year the actual fixed overhead cost of the assembly department
department, showing clearly the causes of any over-/under-absorption.
was £300 000 and that the actual machine hours were 4200 and actual labour
13

(a) One of the factories in the XYZ Group of companies absorbs fixed productionoverheads into product cost using a predetermined machine hour rate.
In Year 1, machine hours budgeted were 132 500 and the absorption rate forfixed production overheads was £18.20 per machine hour. Overheads absorbedand incurred were £2 442 440 and £2 317 461 respectively.
In Year 2, machine hours were budgeted to be 5% higher than those actuallyworked in Year 1. Budgeted and actual fixed production overhead expenditurewere £2 620 926 and £2 695 721 respectively, and actual machine hours were139 260.
Required:Analyse, in as much detail as possible, the under-/over-absorption of fixedproduction overhead occurring in Years 1 and 2, and the change in absorptionrate between the two years. (15 marks)
(b) Contrast the use of(i) blanket as opposed to departmental overhead absorption rates;
(ii) predetermined overhead absorption rates as opposed to rates calculatedfrom actual activity and expenditure. (10 marks)
(Total 25 marks)ACCA Cost and Management Accounting 1
(a) C Ltd is a manufacturing company. In one of the production departments inits main factory a machine hour rate is used for absorbing production over-head. This is established as a predetermined rate, based on normal activity.The rate that will be used for the period which is just commencing is £15.00per machine hour. Overhead expenditure anticipated, at a range of activitylevels, is as follows:
Activity level (£)(machine hours)
1500 25 6501650 26 3252000 27 900
Required:Calculate:
(i) the variable overhead rate per machine hour;(ii) the total budgeted fixed overhead;
(iii) the normal activity level of the department; and(iv) the extent of over-/under-absorption if actual machine hours are 1700 and
expenditure is as budgeted. (10 marks)
(b) In another of its factories, C Ltd carries out jobs to customers’ specifications. Aparticular job requires the following machine hours and direct labour hours inthe two production departments:
Machining FinishingDepartment Department
Direct labour hours 25 28Machine hours 46 8
Direct labour in both departments is paid at a basic rate of £4.00 per hour. 10%of the direct labour hours in the finishing department are overtime hours, paidat 125% of basic rate. Overtime premiums are charged to production overhead.
The job requires the manufacture of 189 components. Each componentrequires 1.1 kilos of prepared material. Loss on preparation is 10% ofunprepared material, which costs £2.35 per kilo.
Question SM 4.4Analysis of under/over recovery ofoverheads and adiscussion ofblanket versusdepartmentoverheads
Question SM 4.5Calculation offixed and variableoverhead rates,normal activitylevel andunder/over-recovery ofoverheads
12 COST ASSIGNMENT FOR INDIRECT COSTS14

Overhead absorption rates are to be established from the following data:
Machining FinishingDepartment Department
Production overhead £35 280 £12 480Direct labour hours 3 500 7 800Machine hours 11 200 2 100
Required:(i) Calculate the overhead absorption rate for each department and justify the
absorption method used.(ii) Calculate the cost of the job. (15 marks)
(Total 25 marks)ACCA Level 1
A company reapportions the costs incurred by two service cost centres, materialshandling and inspection, to the three production cost centres of machining, finish-ing and assembly.
The following are the overhead costs which have been allocated and apportionedto the five cost centres:
(£000)Machining 400Finishing 200Assembly 100Materials handling 100Inspection 50
Estimates of the benefits received by each cost centre are as follows:
MaterialsMachining Finishing Assembly handling Inspection
% % % % %
Materials handling 30 25 35 — 10Inspection 20 30 45 5 —
You are required to:
(a) calculate the charge for overhead to each of the three production cost centres,including the amounts reapportioned from the two service centres, using:(i) the continuous allotment (or repeated distribution) method;
(ii) an algebraic method; (15 marks)
(b) comment on whether reapportioning service cost centre costs is generallyworthwhile and suggest an alternative treatment for such costs; (4 marks)
(c) discuss the following statement: ‘Some writers advocate that an under- or over-absorption of overhead should be apportioned between the cost of goodssold in the period to which it relates and to closing stocks. However, theUnited Kingdom practice is to treat under- or over-absorption of overhead asa period cost.’ (6 marks)
(Total 25 marks)CIMA Stage 2 Cost Accounting 3
Question SM 4.6Reapportionmentof servicedepartment costs
COST ASSIGNMENT FOR INDIRECT COSTS 1315

12 COST ASSIGNMENT FOR INDIRECT COSTS
A business operates with two production centres and three service centres. Costs have been allocated and apportioned to these centres as follows:
Production centres Service centres1 2 A B C£2000 £3500 £300 £500 £700
Information regarding how the service centres work for each other and for the production centres is given as:
Work done for:Production centres Service centres
1 2 A B CBy A 45% 45% — 10% —By B 50% 20% 20% —10%By C 60% 40% — — —
Information concerning production requirements in the two production centres is as follows:
Centre 1 Centre 2Units produced 1500 units 2000 unitsMachine hours 3000 hours 4500 hoursLabour hours 2000 hours 6000 hours
Required:(a) Using the reciprocal method calculate the total overheads in production cen-
tres 1 and 2 after reapportionment of the service centre costs.(7 marks)
(b) Using the most appropriate basis establish the overhead absorption rate for pro-duction centre 1. Briefl y explain the reason for your chosen absorption basis.
(3 marks)(Total 10 marks)
ACCA Paper 1.2 - Financial Information for Management
A company uses a predetermined overhead recovery rate based on machine hours. Budgeted factory overhead for a year amounted to £720 000, but actual factory overhead incurred was £738 000. During the year, the company absorbed £714 000 of factory overhead on 119 000 actual machine hours.What was the company’s budgeted level of machine hours for the year?A 116 098B 119 000C 120 000D 123 000
ACCA Foundation Paper 3
A company absorbs overheads on machine hours which were budgeted at 11 250 with overheads of £258 750. Actual results were 10 980 hours with overheads of £254 692.Overheads were:A under-absorbed by £2152B over-absorbed by £4058C under-absorbed by £4058D over-absorbed by £2152
CIMA Stage 1
Question SM 4.7Reapportionment of service department costs
Question SM 4.8
Question SM 4.9
16

COST ASSIGNMENT FOR INDIRECT COSTS 13
A company has over-absorbed fi xed production overheads for the period by £6000. The fi xed production overhead absorption rate was £8 per unit and is based on the normal level of activity of 5000 units. Actual production was 4500 units.What was the actual fi xed production overheads incurred for the period?A £30 000B £36 000C £40 000D £42 000
ACCA Paper 1.2 - Financial Information for Management
A company absorbs overheads on machine hours. In a period, actual machine hours were 17 285, actual overheads were £496 500 and there was under- absorp-tion of £12 520.What was the budgeted level of overheads?A £483 980B £496 500C £509 020D It cannot be calculated from the information provided.
CIMA Stage 1 Cost Accounting
Canberra has established the following information regarding fi xed overheads for the coming month:Budgeted information:
Fixed overheads £180 000Labour hours 3 000Machine hours 10 000Units of production 5 000
Actual fi xed costs for the last month were £160 000.Canberra produces many different products using highly automated manufactur-ing processes and absorbs overheads on the most appropriate basis.What will be the predetermined overhead absorption rate?A £16B £18C £36D £60
ACCA Paper 1.2 - Financial information for Management
The management accountant of Gympie Limited has already allocated and appor-tioned the fi xed overheads for the period although she has yet to reapportion the service centre costs. Information for the period is as follows:
Production departments
Service departments
Total1 2 Stores MaintenanceAllocated and apportioned £17 500 £32 750 £6300 £8450 £65 000
Work done by:Stores 60% 30% – 10%Maintenance 75% 20% 5% –
Question SM 4.10
Question SM 4.11
Question SM 4.12
Question SM 4.13
17

What are the total overheads included in production department 1 if the reciprocal method is
used to reapportion service centre costs? A £27 618 B £28 171 C £28 398 D £28 453
ACCA Paper 1.2 - Financial information for Management
J Ltd uses standard absorption costing and absorbs production overheads on the basis of Question SM standard machine hours. The following budgeted and actual information applied in its last 4.13
accounting period:
Budget Actual
Production overhead $180 000 $178 080
Machine hours 50 000 48 260
Units produced 40 000 38 760
At the end of the period, production overhead will be reported as:
A under-absorbed by $4344
B under-absorbed by $3660
C over-absorbed by $4344
D over-absorbed by $3660
CIMA – Management Accounting Fundamentals
COST ASSIGNMENT FOR INDIRECT COSTS 12 18


14 ACCOUNTING ENTRIES FOR A JOB COSTING SYSTEM
Set out below are incomplete cost accounts for a period for a manufacturing business:
Stores Ledger Control Account
Opening Balance £60 140Cost Ledger Control A/c £93 106
£153 246 £153 246
Production Wages Control Account
Cost Ledger Control A/c Finished Goods A/c £87 480Production O’hd Control A/c
Production Overhead Control Account
Cost Ledger Control A/c £116 202Prod. Wages Control A/c
Finished Goods Control Account
Opening Balance £147 890 Prod. Cost of Sales (variable)Closing Balance £150 187
Note1. Raw materials:
Issues of materials from stores for the period:Material Y: 1164 kg (issued at a periodic weighted average price, calculatedto two decimal places of £). Other materials: £78 520.
No indirect materials are held on the Stores ledger.
Transactions for Material Y in the period:Opening stock: 540 kg, £7663Purchases: 1100 kg purchased at £14.40 per kg
2. Payroll:
Direct Indirect workers workers
Hours worked:Basic time 11 140 4 250Overtime 1 075 405Productive time – direct workers 11 664
Basic hourly rate (£) 7.50 5.70
Overtime, which is paid at basic rate plus one third, is regularly worked to meetproduction targets.
Question SM 5.1Integratedaccounts andcomputation ofthe net profit
Accounting entries for a job costingsystem
20

3. Production overheads:The business uses a marginal costing system. 60% of production overheads arefixed costs. Variable production overhead costs are absorbed at a rate of 70% ofactual direct labour.
4. Finished goods:There is no work in progress at the beginning or end of the period, and a Work inProgress Account is not kept. Direct materials issued, direct labour and productionoverheads absorbed are transferred to the Finished Goods Control Account.
Required:(a) Complete the above four accounts for the period, by listing the missing
amounts and descriptions. (13 marks)(b) Provide an analysis of the indirect labour for the period. (3 marks)(c) Calculate the contribution and the net profit for the period, based on the cost
accounts prepared in (a) and using the following additional information:Sales £479 462Selling and administration overheads:
variable £38 575fixed £74 360
(4 marks)(Total 20 marks)
ACCA Management Information – Paper 3
A company manufactures two products (A and B). In the period just ended pro-duction and sales of the two products were:
Product A Product B(000 units) (000 units)
Production 41 27Sales 38 28
The selling prices of the products were £35 and £39 per unit for A and B respectively.
Opening stocks were:Raw materials £72 460
Finished goods:Product A £80 640 (3200 units)Product B £102 920 (3100 units)
Raw material purchases (on credit) during the period totalled £631 220. Raw mater-ial costs per unit are £7.20 for Product A and £11.60 for Product B.
Direct labour hours worked during the period totalled 73 400 (1 hour per unit ofProduct A and 1.2 hours per unit of Product B), paid at a basic rate of £8.00 per hour.
3250 overtime hours were worked by direct workers, paid at a premium of 25%over the basic rate. Overtime premiums are treated as indirect production costs.Other indirect labour costs during the period totalled £186 470 and productionoverhead costs (other than indirect labour) were £549 630. Production overheadsare absorbed at a rate of £10.00 per direct labour hour (including £6.80 per hour forfixed production overheads). Any over-/under-absorbed balances are transferred tothe Profit and Loss Account in the period in which they arise. Non-productionoverheads totalled £394 700 in the period.
Required:(a) Prepare the following accounts for the period in the company’s integrated
accounting system:(i) Raw material stock control;
(ii) Production overhead control;(iii) Finished goods stock control (showing the details of the valuation of clos-
ing stocks as a note). (12 marks)
Question SM 5.2Integratedaccounts, profitscomputation andreconciliationrelating toabsorption andmarginal costing
ACCOUNTING ENTRIES FOR A JOB COSTING SYSTEM 1521

16 ACCOUNTING ENTRIES FOR A JOB COSTING SYSTEM
(b) Prepare the Profit and Loss Account for the period, clearly showing sales, pro-duction cost of sales and gross profit for each product. (4 marks)
(c) Calculate, and explain, the difference in the net profit (loss) for the period if themarginal costing method is employed. (4 marks)
(Total 20 marks)ACCA Management Information – Paper 3
A company has been carrying out work on a number of building contracts (includ-
information is available:
All contracts Contract ABC(including ABC)
Number of contracts 10 —worked on in the
Value £76.2 m £6.4 mDuration 8–22 months 11 months
(average 13 months)Contract months 531 6Direct labour costs in the period £9.762 m £1.017 mRaw material costs in the period £10.817 m £1.456 mDistance from base 16 kilometres (average) 23 kilometres
— £5.180 mNote:1Contract months for ‘All Contracts’ are the sum of the number of months’ work on each individualcontract during the six-month period.
tive costs on the contract, held in work-in-progress, totalled £1.063 m (includingoverheads).
plete Contract ABC on time (including overheads) will not exceed £0.937 m.
apportioned to individual contracts are:
£m
Stores operations 1.56Contract general management 1.22Transport 1.37General administration 4.25
The bases of apportionment are:Stores operations– contract value × contract monthsContract general management– direct labour costsTransport– distance from base × contract monthsGeneral administration– contract months
Required:(a) (i) Apportion overheads to Contract ABC for the six-month period to 31 May
(6 marks)(ii) Determine the expected profit/loss on Contract ABC, and the amount of
profit/loss on the contract that you recommend be included in the accounts(7 marks)
Question SM 5.3Computation ofcontract profit
ing Contract ABC) over the six-month period ended 31 May. The following
six months to 31 May
Value of work certified at 31 May
Contract ABC commenced on 1 September. As at 30 November cumula
The company confidently predicts that further costs after 31 May to com-
Overheads incurred over the six-month period to 31 May, which are to be
(to the nearest £000 for each overhead item).
of the company for the six-month period to 31 May.
22

(b) The company is introducing a service costing system into its stores operationsdepartment.
Outline the key factors to consider when introducing the service costing system.(7 marks)
(Total 20 marks)ACCA Management Information – Paper 3
A construction company is currently undertaking three separate contracts andinformation relating to these contracts for the previous year, together with otherrelevant data, is shown below.
Constructionservices
Contract Contract Contract deptMNO PQR STU overhead(000) (000) (000) (000s)
Contract price 800 675 1100Balances brought forward
at beginning of year:Cost of work completed — 190 370 —Material on site — — 25 —Written-down value of
plant and machinery — 35 170 12Wages accrued — 2 — —Profit previously transferred
to profit/loss a/c — — 15 —Transactions during year:
Material delivered to site 40 99 180 —Wages paid 20 47 110 8Payments to subcontractors — — 35 —Salaries and other costs 6 20 25 21Written down value of plant:
issued to sites 90 15 — —transferred from sites — 8 — —
Balances carried forward at the end of year:
Material on site 8 — — —Written-down value of
plant and machinery 70 — 110 5Wages accrued — 5 — —Pre-payments to
subcontractors — — 15 —Value of work certified
at end of year 90 390 950 —Cost of work not certified
at end of year — — 26 —
The cost of operating the construction services department, which provides tech-nical advice to each of the contracts, is apportioned over the contracts in propor-tion to wages incurred. Contract STU is scheduled for handing over to thecontractee in the near future and the site engineer estimates that the extra costsrequired to complete the contract in addition to those tabulated above, will total£138 000. This amount includes an allowance for plant depreciation, constructionservices and for contingencies.
ACCOUNTING ENTRIES FOR A JOB COSTING SYSTEM 17
Question SM 5.4Contract costing
23

Required:(a) Construct a cost account for each of the three contracts for the previous year
and show the cost of the work completed at the year end. (9 marks)(b) (i) Recommend how much profit or loss should be taken, for each contract, for
the previous year. (7 marks)(ii) Explain the reasons for each of your recommendations in (b) (i) above.
(6 marks)(Total 22 marks)
ACCA Level 1 Costing
18 ACCOUNTING ENTRIES FOR A JOB COSTING SYSTEM24

A chemical compound is made by raw material being processed through twoprocesses. The output of Process A is passed to Process B where further material isadded to the mix. The details of the process costs for the financial period number10 were as shown below:
Process A
Direct material 2000 kilograms at 5 per kgDirect labour £7200Process plant time 140 hours at £60 per hour
Process B
Direct material 1400 kilograms at £12 per kgDirect labour £4200Process plant time 80 hours at £72.50 per hour
The departmental overhead for Period 10 was £6840 and is absorbed into the costsof each process on direct labour cost.
Process A Process B
Expected output was 80% of input 90% of inputActual output was 1400 kg 2620 kg
Assume no finished stock at the beginning of the period and no work in progress ateither the beginning or the end of the period.
Normal loss is contaminated material which is sold as scrap for £0.50 per kgfrom Process A and £1.825 per kg from Process B, for both of which immediatepayment is received.
You are required to prepare the accounts for Period 10, for(i) Process A,
(ii) Process B,(iii) Normal loss/gain,(iv) Abnormal loss/gain,(v) Finished goods,(vi) Profit and loss (extract).
(15 marks)CIMA Stage 2 Cost Accounting
A firm operates a process, the details of which for the period were as follows. Therewas no opening work-in-progress. During the period 8250 units were receivedfrom the previous process at a value of £453 750, labour and overheads were£350 060 and material introduced was £24 750. At the end of the period the closingwork-in-progress was 1600 units, which were 100% complete in respect of materi-als, and 60% complete in respect of labour and overheads. The balance of unitswere transferred to finished goods.
Question SM 6.1Preparation ofprocess accountswith all outputfully completed
Question SM 6.2Equivalentproduction and nolosses
PROCESS COSTING 19
Process costing
25

Requirements:(a) Calculate the number of equivalent units produced. (3 marks)(b) Calculate the cost per equivalent unit. (2 marks)(c) Prepare the process account. (7 marks)(d) Distinguish between joint products and by-products, and briefly explain the
difference in accounting treatment between them. (3 marks)(Total 15 marks)
CIMA Stage 1 Cost Accounting and Quantitative Methods
A company manufactures a product that requires two separate processes for itscompletion. Output from Process 1 is immediately input to Process 2.
The following information is available for Process 2 for a period:(i) Opening work-in-progress units:
12 000 units: 90% complete as to materials, 50% complete as to conversion costs.(ii) Opening work-in-progress value:
Process 1 output: £13 440Process 2 materials added: £4970Conversion costs: £3120.
(iii) Costs incurred during the period:Process 1 output: £107 790 (95 000 units)Process 2 materials added: £44 000Conversion costs: £51 480.
(iv) Closing work-in-progress units10 000 units: 90% complete as to materials, 70% complete as to conversion costs.
(v) The product is inspected when it is complete. 200 units of finished productwere rejected during the period, in line with the normal allowance. Unitsrejected have no disposal value.
Required:(a) Calculate the unit cost of production for the period in Process 2 (to three
decimal places of £), using the periodic weighted average method. (7 marks)(b) Prepare the Process 2 Account for the period using the unit cost of production
calculated in (a) above. (5 marks)(c) Explain why, and how, the Process 2 Account would be different if there was
no normal allowance for rejects. NB The process account should not bereworked. (5 marks)
(d) Explain how the process account workings, required in (a) above to calculatethe unit cost, would differ if the FIFO valuation method was used instead.
(3 marks)(Total 20 marks)
ACCA Management Information – Paper 3
Chemical Processors manufacture Wonderchem using two processes, mixing anddistillation. The following details relate to the distillation process for a period
No opening work in progress (WIP)Input from mixing 36 000 kg at a cost of £166 000Labour for period £43 800Overheads for period £29 200
Closing WIP of 8000 kg, which was 100% complete for materials and 50% completefor labour and overheads.
The normal loss in distillation is 10% of fully complete production. Actual loss inthe period was 3600 kg, fully complete, which were scrapped.
Required:(a) Calculate whether there was a normal or abnormal loss or abnormal gain for
the period. (2 marks)
Question SM 6.3Losses in process(weightedaverage)
Question SM 6.4Losses in process(weightedaverage)
20 PROCESS COSTING26

(b) Prepare the distillation process account for the period, showing clearly weightsand values. (10 marks)
(c) Explain what changes would be required in the accounts if the scrappedproduction had a resale value, and give the accounting entries. (3 marks)
(Total 15 marks)CIMA Stage 1 Cost Accounting
(a) Z Ltd manufactures metal cans for use in the food processing industry. Themetal is introduced in sheet form at the start of the process. Normal wastage inthe form of offcuts is 2% of input. The offcuts can be sold for £0.26 per kilo.Each metal sheet weighs 2 kilos and is expected to yield 80 cans. In addition towastage through offcuts, 1% of cans manufactured are expected to be rejected.These rejects can also be sold at £0.26 per kilo.
Production, and costs incurred, in the month just completed, were as follows:Production: 3 100 760 cans
Costs incurred:Direct materials: 39 300 metal sheets at £2.50 per sheet
Direct labour and overhead: £33 087
There was no opening or closing work in process.
Required:Prepare the process accounts for the can manufacturing operation for themonth just completed. (15 marks)
(b) Another of the manufacturing operations of Z Ltd involves the continuous pro-cessing of raw materials with the result that, at the end of any period, there arepartly completed units of product remaining.
Required:With reference to the general situation outlined above(i) explain the concept of equivalent units (3 marks)
(ii) describe, and contrast, the FIFO and average methods of work in processvaluation. (7 marks)
(Total 25 marks)ACCA Level 1 Costing
The manufacture of one of the products of A Ltd requires three separate processes.In the last of the three processes, costs, production and stock for the month justended were:(1) Transfers from Process 2: 180 000 units at a cost of £394 200.(2) Process 3 costs: materials £110 520, conversion costs £76 506.(3) Work in process at the beginning of the month: 20 000 units at a cost of £55 160
(based on FIFO pricing method). Units were 70% complete for materials, and40% complete for conversion costs.
(4) Work in process at the end of the month: 18 000 units which were 90% completefor materials, and 70% complete for conversion costs.
(5) Product is inspected when it is complete. Normally no losses are expected butduring the month 60 units were rejected and sold for £1.50 per unit.
Required:(a) Prepare the Process 3 account for the month just ended. (15 marks)(b) Explain how, and why, your calculations would be affected if the 60 units lost
were treated as normal losses. (5 marks)(c) Explain how your calculations would be affected by the use of weighted
average pricing instead of FIFO. (5 marks)(Total 25 marks)
ACCA Cost and Management Accounting 1
Question SM 6.5Preparation ofprocess accountswith output fullycompleted and adiscussion ofFIFO and averagemethods of WIPvaluation
Question SM 6.6FIFO method andlosses in process
PROCESS COSTING 2127
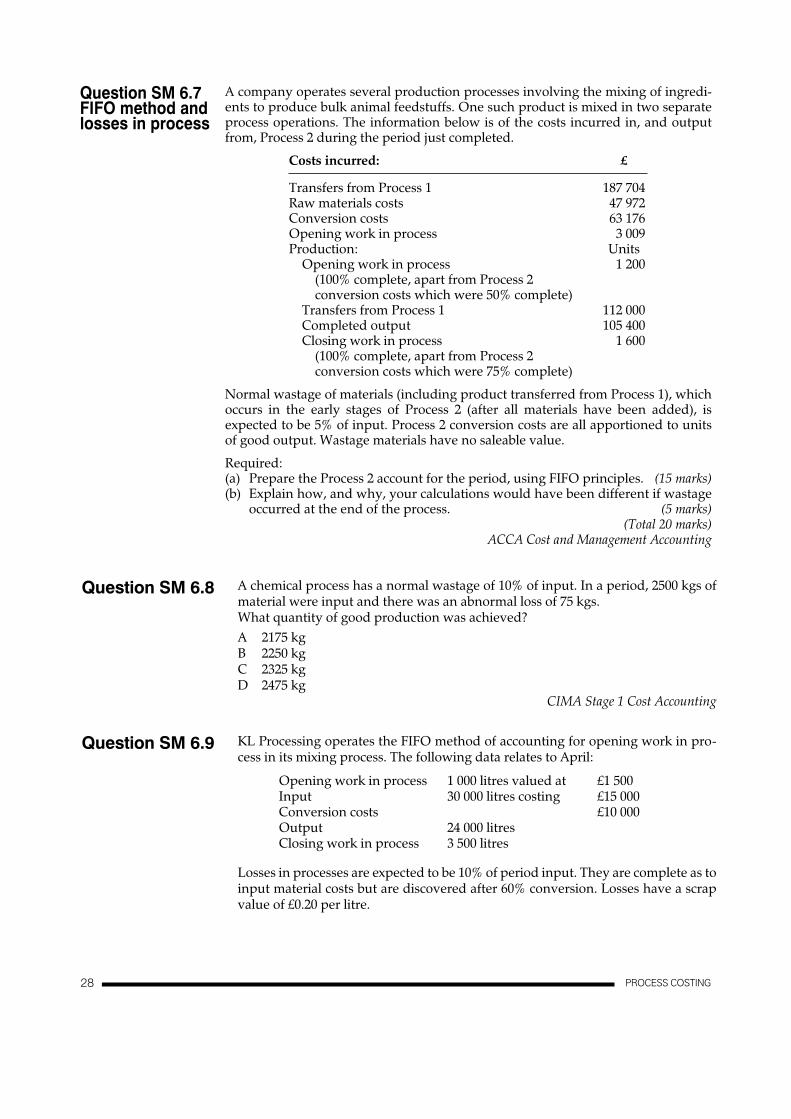
A company operates several production processes involving the mixing of ingredi-ents to produce bulk animal feedstuffs. One such product is mixed in two separateprocess operations. The information below is of the costs incurred in, and outputfrom, Process 2 during the period just completed.
Costs incurred: £
Transfers from Process 1 187 704Raw materials costs 47 972Conversion costs 63 176Opening work in process 3 009Production: Units
Opening work in process 1 200(100% complete, apart from Process 2 conversion costs which were 50% complete)
Transfers from Process 1 112 000Completed output 105 400Closing work in process 1 600
(100% complete, apart from Process 2 conversion costs which were 75% complete)
Normal wastage of materials (including product transferred from Process 1), whichoccurs in the early stages of Process 2 (after all materials have been added), isexpected to be 5% of input. Process 2 conversion costs are all apportioned to unitsof good output. Wastage materials have no saleable value.
Required:(a) Prepare the Process 2 account for the period, using FIFO principles. (15 marks)(b) Explain how, and why, your calculations would have been different if wastage
occurred at the end of the process. (5 marks)(Total 20 marks)
ACCA Cost and Management Accounting
Question SM 6.7FIFO method andlosses in process
22 PROCESS COSTING
A chemical process has a normal wastage of 10% of input. In a period, 2500 kgs of material were input and there was an abnormal loss of 75 kgs.What quantity of good production was achieved?A 2175 kgB 2250 kgC 2325 kgD 2475 kg
CIMA Stage 1 Cost Accounting
KL Processing operates the FIFO method of accounting for opening work in pro-cess in its mixing process. The following data relates to April:
Opening work in process 1 000 litres valued at £1 500Input 30 000 litres costing £15 000Conversion costs £10 000Output 24 000 litresClosing work in process 3 500 litres
Losses in processes are expected to be 10% of period input. They are complete as to input material costs but are discovered after 60% conversion. Losses have a scrap value of £0.20 per litre.
Question SM 6.8
Question SM 6.9
28

PROCESS COSTING 21
Opening work in process was 100% complete as to input materials, and 70% complete as to conversion. Closing work in process is complete as to input materi-als and 80% complete as to conversion.A The number of material-equivalent units was (i) 26 300 litres (ii) 26 600 litres (iii) 27 000 litres (iv) 28 000 litres (v) 29 000 litresB The number of conversion-equivalent units was (i) 26 400 litres (ii) 26 600 litres (iii) 26 800 litres (iv) 27 000 litres (v) 27 400 litres
(Total 20 marks) CIMA Stage 1 Operational Cost Accounting
The following process account has been drawn up for the last month:
Process accountUnits £ Units £
Opening WP 250 3 000 Normal loss 225 450Input: Output 4100Materials 4500 22 500 Abnormal Loss 275Labour 37 500 Closing WIP 150
4750 4750
Work in progress has the following level of completion:
Material LabourOpening WIP 100% 40%Closing WIP 100% 30%
Question SM 6.10
The company uses the FIFO method for valuing the output from the process and all losses occurred at the end of the process.What were the equivalent units for labour?A 4380 unitsB 4270 unitsC 4320 unitsD 4420 units.
ACCA Paper 1.2 - Financial Information for Management
Perth operates a process costing system. The process is expected to lose 25% of input and this can be sold for £8 per kg.Input for the month were:
Direct materials 3500 kg at a total cost of £52 500Direct labour £9625 for the period
There is no opening or closing work in progress in the period. Actual output was 2800 kg.What is the valuation of the output?A £44 100B £49 700C £58 800D £56 525.
ACCA Paper 1.2 - Financial Information for Management
Question SM 6.11
29

A company uses process costing to value its output and all materials are input at the start of the process. The following information relates to the process for one month:
Input 3000 units
Opening stock 400 units
Losses 10% of input is expected to be lost
Closing stock 200 units
How many good units were output from the process if actual losses were 400 units? (a) 2800 units (b) 2900 units (c) 3000 units (d) 3200 units
ACCA Financial Information for Management
PROCESS COSTING
1 30
Question SM 6.12

PQR Limited produces two joint products – P and Q – together with a by-product R, from a single main process (process 1). Product P is sold at the point ofseparation for £5 per kg, whereas product Q is sold for £7 per kg after further process-ing into product Q2. By-product R is sold without further processing for £1.75 per kg.
Process 1 is closely monitored by a team of chemists, who planned the outputper 1000 kg of input materials to be as follows:
Product P 500 kgProduct Q 350 kgProduct R 100 kgToxic waste 50 kg
The toxic waste is disposed of at a cost of £1.50 per kg, and arises at the end ofprocessing.
Process 2, which is used for further processing of product Q into product Q2, hasthe following cost structure:
Fixed costs £6000 per weekVariable costs £1.50 per kg processed
The following actual data relate to the first week of accounting period 10:
Process 1
Opening work in process NilMaterials input 10 000 kg costing £15 000Direct labour £10 000Variable overhead £4 000Fixed overhead £6 000
Outputs:Product P 4800 kgProduct Q 3600 kgProduct R 1000 kgToxic waste 600 kgClosing work in progress nil
Process 2
Opening work in process nilInput of product Q 3600 kgOutput of product Q2 3300 kgClosing work in progress 300 kg,
50% converted
Conversion costs were incurred in accordance with the planned cost structure.
Question SM 7.1Preparation ofjoint productaccount and adecision onfurtherprocessing
JOINT AND BY-PRODUFCT COSTING 23
Joint and by-product costing
31

Required:(a) Prepare the main process account for the first week of period 10 using the final
sales value method to attribute pre-separation costs to joint products. (12 marks)(b) Prepare the toxic waste accounts and process 2 account for the first week of
period 10. (9 marks)(c) Comment on the method used by PQR Limited to attribute pre-separation costs
to its joint products. (4 marks)(d) Advise the management of PQR Limited whether or not, on purely financial
grounds, it should continue to process product Q into product Q2:(i) if product Q could be sold at the point of separation for £4.30 per kg; and
(ii) if 60% of the weekly fixed costs of process 2 were avoided by not processingproduct Q further. (5 marks)
(Total 30 marks)CIMA Stage 2 Operational Cost Accounting
A distillation plant, which works continuously, processes 1000 tonnes of raw mater-ial each day. The raw material costs £4 per tonne and the plant operating costs perday are £2600. From the input of raw material the following output is produced:
(%)
Distillate X 40Distillate Y 30Distillate Z 20By-product B 10
From the initial distillation process, Distillate X passes through a heat process whichcosts £1500 per day and becomes product X which requires blending before sale.
Distillate Y goes through a second distillation process costing £3300 per day andproduces 75% of product Y and 25% of product X1.
Distillate Z has a second distillation process costing £2400 per day and produces60% of product Z and 40% of product X2. The three streams of products X, X1 andX2 are blended, at a cost of £1555 per day to become the saleable final product XXX.
There is no loss of material from any of the processes.By-product B is sold for £3 per tonne and such proceeds are credited to the
process from which the by-product is derived.Joint costs are apportioned on a physical unit basis.
You are required to:(a) draw a flow chart, flowing from left to right, to show for one day of production
the flow of material and the build up of the operating costs for each product;(18 marks)
(b) present a statement for management showing for each of the products XXX, Yand Z, the output for one day, the total cost and the unit cost per tonne;
(5 marks)(c) suggest an alternative method for the treatment of the income receivable for
by-product B than that followed in this question (figures are not required).(2 marks)
(Total 25 marks)CIMA Stage 2 Cost Accounting
Question SM 7.2Flow chart andcalculation of costper unit for jointproducts
24 JOINT AND BY-PRODUCT COSTING32

A chemical company carries on production operations in two processes. Materialsfirst pass through process I, where a compound is produced. A loss in weight takesplace at the start of processing. The following data, which can be assumed to berepresentative, relates to the month just ended:
Quantities (kg):
Material input 200 000Opening work in process 40 000
(half processed)Work completed 160 000Closing work in process 30 000
(two-thirds processed)
Costs (£):
Material input 75 000Processing costs 96 000Opening work in process:
Materials 20 000Processing costs 12 000
Any quantity of the compound can be sold for £1.60 per kg. Alternatively, it can betransferred to process II for further processing and packing to be sold as Starcompfor £2.00 per kg. Further materials are added in process II such that for every kg ofcompound used, 2 kg of Starcomp result.
Of the 160 000 kg per month of work completed in process I, 40 000 kg are sold ascompound and 120 000 kg are passed through process II for sale as Starcomp. ProcessII has facilities to handle up to 160 000 kg of compound per month if required. Themonthly costs incurred in process II (other than the cost of the compound) are:
120 000 kg 160 000 kgof compound of compound
input input
Materials (£) 120 000 160 000Processing costs (£) 120 000 140 000
Required:(a) Determine, using the average method, the cost per kg of compound in process
I, and the value of both work completed and closing work in process for themonth just ended. (11 marks)
(b) Demonstrate that it is worth while further processing 120 000 kg of compound.(5 marks)
(c) Calculate the minimum acceptable selling price per kg, if a potential buyercould be found for the additional output of Starcomp that could be producedwith the remaining compound. (6 marks)
(Total 22 marks)ACCA Level 1 Costing
C Ltd operates a process which produces three joint products. In the period justended costs of production totalled £509 640. Output from the process during theperiod was:
Product W 276 000 kilosProduct X 334 000 kilosProduct Y 134 000 kilos
Question SM 7.3Calculation ofcost per unit anddecision onfurtherprocessing
Question SM 7.4Profitabilityanalysis and adecision onfurtherprocessing
JOINT AND BY-PRODUCT COSTING 2533

There were no opening stocks of the three products. Products W and X are sold inthis state. Product Y is subjected to further processing. Sales of Products W and Xduring the period were:
Product W 255 000 kilos at £0.945 per kiloProduct X 312 000 kilos at £0.890 per kilo
128 000 kilos of Product Y were further processed during the period. The balance ofthe period production of the three products W, X and Y remained in stock at theend of the period. The value of closing stock of individual products is calculated byapportioning costs according to weight of output.
The additional costs in the period of further processing Product Y, which is con-verted into Product Z, were:
Direct labour £10 850Production overhead £7 070
96 000 kilos of Product Z were produced from the 128 000 kilos of Product Y. A by-product BP is also produced which can be sold for £0.12 per kilo. 8000 kilos of BPwere produced and sold in the period.
Sales of Product Z during the period were 94 000 kilos, with a total revenue of£100 110. Opening stock of Product Z was 8000 kilos, valued at £8640. The FIFOmethod is used for pricing transfers of Product Z to cost of sales.
Selling and administration costs are charged to all main products when sold, at10% of revenue.
Required:(a) Prepare a profit and loss account for the period, identifying separately the
profitability of each of the three main products. (14 marks)(b) C Ltd has now received an offer from another company to purchase the total
output of Product Y (i.e. before further processing) for £0.62 per kilo. Calculatethe viability of this alternative. (5 marks)
(c) Discuss briefly the methods of, and rationale for, joint cost apportionment.(6 marks)
(Total 25 marks)ACCA Level 1 Cost and Management Accounting 1
26 JOINT AND BY-PRODUCT COSTING
A company operates a process which produces three joint products - K, P and Z. The costs of operating this process during September amounted to £117 000. During the month the output of the three products was:
K 2000 litresP 4500 litresZ 3250 litres
P is further processed at a cost of £9.00 per litre. The actual loss of the second pro-cess was 10% of the input which was normal. Products K and Z are sold without further processing.The fi nal selling prices of each of the products are:
K £20.00 per litreP £25.00 per litreZ £18.00 per litre
Question SM 7.5
34

JOINT AND BY-PRODUCT COSTING 25
Joint costs are attributed to products on the basis of output volume.The profi t attributed to product P was:A £6750B £12 150C £13 500D £16 200E £18 000
CIMA Stage 2 Specimen Paper
Charleville products and one by-product. Output from the process for a month was as follows:
ProductSelling price per unit
Units of output from process
1 £18 10 0002 £25 20 0003 £20 20 0004 (by-product) £2 3 500
Total output costs were £277 000.What was the unit valuation for product 3 using the sales revenue basis for allocating joint cost?A £4.70B £4.80C £5.00D £5.10.
ACCA Paper 1.2 - Financial Information for Management
Question SM 7.6
35


A company sells a single product at a price of £14 per unit. Variable manufacturingcosts of the product are £6.40 per unit. Fixed manufacturing overheads, which areabsorbed into the cost of production at a unit rate (based on normal activity of 20 000units per period), are £92 000 per period. Any over- or under-absorbed fixed manu-facturing overhead balances are transferred to the profit and loss account at the endof each period, in order to establish the manufacturing profit.
Sales and production (in units) for two periods are as follows:
Period 1 Period 2
Sales 15 000 22 000Production 18 000 21 000
The manufacturing profit in Period 1 was reported as £35 800.
Required:(a) Prepare a trading statement to identify the manufacturing profit for Period 2
using the existing absorption costing method. (7 marks)(b) Determine the manufacturing profit that would be reported in Period 2 if
marginal costing was used. (4 marks)(c) Explain, with supporting calculations:
(i) the reasons for the change in manufacturing profit between Periods 1 and 2where absorption costing is used in each period; (5 marks)
(ii) why the manufacturing profit in (a) and (b) differs. (4 marks)(Total 20 marks)
ACCA Management Information – Paper 3
and sells a single product, which has budgeted costs and selling price as follows:
£ per unit
Selling price 45Direct materials 11Direct labour 8Production overhead:
variable 4fixed 3
Selling overhead:variable 5fixed 2
Administration overhead:fixed 3
Fixed overhead costs per unit are based on a normal annual activity level of 96 000units. These costs are expected to be incurred at a constant rate throughout the year.
Question SM 8.1Preparation ofvariable andabsorptioncosting profitstatements and anexplanation of thechange in profits
Question SM 8.2Preparation ofvariable andabsorptioncosting profitstatements andCVP analysis
INCOME EFFECTS OF ALTERNATIVE COST ACCUMULATION SYSTEMS 27
Income effects of alternative costaccumulation systems
R Limited is considering its plans for the year ending 31 December. It makes
37

January Februaryunits units
Sales 7000 8750Production 8500 7750
Required:(a) Prepare, in columnar format, profit statements for each of the two months of
(i) absorption costing;(ii) marginal costing. (12 marks)
(b) Reconcile and explain the reasons for any differences between the marginaland absorption profits for each month which you have calculated in youranswer to (a) above. (3 marks)
(c) Based upon marginal costing, calculate:(i) the annual breakeven sales value; and
(ii) the activity level, in units, which will yield an annual profit of £122 800.(6 marks)
(d) Explain 3 fundamental assumptions underpinning single product breakevenanalysis. (6 marks)
(Total 27 marks)CIMA Stage 2 – Operational Cost Accounting
The following budgeted profit statement has been prepared using absorption costingprinciples:
January to July to June December
(£000) (£000) (£000) (£000)
Sales 540 360Opening stock 100 160Production costs:
Direct materials 108 36Direct labour 162 54Overhead 90 30
460 280Closing stock 160 80
300 200GROSS PROFIT 240 160Production overhead:
(Over)/Under absorption (12) 12Selling costs 50 50Distribution costs 45 40Administration costs 80 80
163 182NET PROFIT/(LOSS) 77 (22)Sales units 15 000 10 000Production units 18 000 6 000
Question SM 8.3Preparation ofvariable andabsorptioncostingstatements as areconciliation ofthe profits
28 INCOME EFFECTS OF ALTERNATIVE COST ACCUMULATION SYSTEMS
Activity levels during January and February are expected to be:
Assume that there will be no stocks held on 1 January.
January and February using:
38
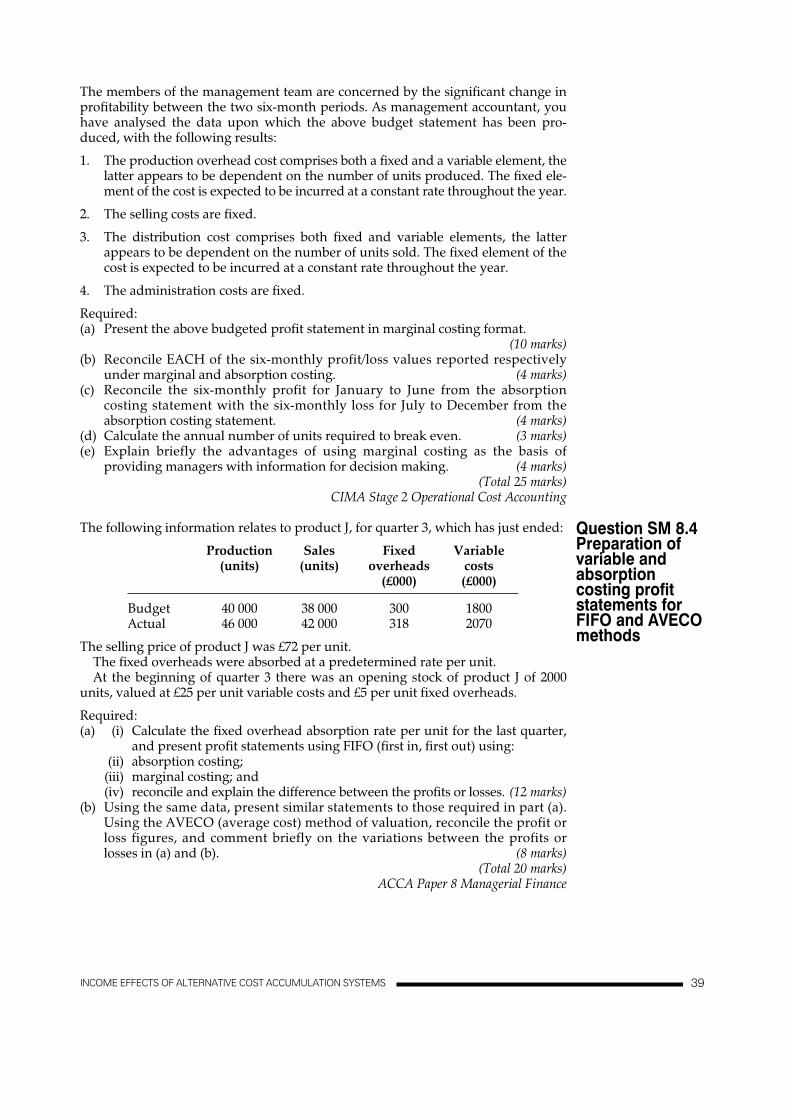
The members of the management team are concerned by the significant change inprofitability between the two six-month periods. As management accountant, youhave analysed the data upon which the above budget statement has been pro-duced, with the following results:
1. The production overhead cost comprises both a fixed and a variable element, thelatter appears to be dependent on the number of units produced. The fixed ele-ment of the cost is expected to be incurred at a constant rate throughout the year.
2. The selling costs are fixed.
3. The distribution cost comprises both fixed and variable elements, the latterappears to be dependent on the number of units sold. The fixed element of thecost is expected to be incurred at a constant rate throughout the year.
4. The administration costs are fixed.
Required:(a) Present the above budgeted profit statement in marginal costing format.
(10 marks)(b) Reconcile EACH of the six-monthly profit/loss values reported respectively
under marginal and absorption costing. (4 marks)(c) Reconcile the six-monthly profit for January to June from the absorption
costing statement with the six-monthly loss for July to December from theabsorption costing statement. (4 marks)
(d) Calculate the annual number of units required to break even. (3 marks)(e) Explain briefly the advantages of using marginal costing as the basis of
providing managers with information for decision making. (4 marks)(Total 25 marks)
CIMA Stage 2 Operational Cost Accounting
The following information relates to product J, for quarter 3, which has just ended:
Production Sales Fixed Variable(units) (units) overheads costs
(£000) (£000)
Budget 40 000 38 000 300 1800Actual 46 000 42 000 318 2070
The selling price of product J was £72 per unit.The fixed overheads were absorbed at a predetermined rate per unit.At the beginning of quarter 3 there was an opening stock of product J of 2000
units, valued at £25 per unit variable costs and £5 per unit fixed overheads.
Required:(a) (i) Calculate the fixed overhead absorption rate per unit for the last quarter,
and present profit statements using FIFO (first in, first out) using:(ii) absorption costing;
(iii) marginal costing; and(iv) reconcile and explain the difference between the profits or losses. (12 marks)
(b) Using the same data, present similar statements to those required in part (a).Using the AVECO (average cost) method of valuation, reconcile the profit orloss figures, and comment briefly on the variations between the profits orlosses in (a) and (b). (8 marks)
(Total 20 marks)ACCA Paper 8 Managerial Finance
Question SM 8.4Preparation ofvariable andabsorptioncosting profitstatements forFIFO and AVECOmethods
INCOME EFFECTS OF ALTERNATIVE COST ACCUMULATION SYSTEMS 2939

28 INCOME EFFECTS OF ALTERNATIVE COST ACCUMULATION SYSTEMS
Oathall Limited, which manufactures a single product, is considering whether to use marginal or absorption costing to report its budgeted profi t in its management accounts.The following information is available:
£/unitDirect materials 4Direct labour 15
19Selling price 50
Fixed production overheads are budgeted to be £300 000 per month and are absorbed on an activity level of 100 000 units per month.For the month in question, sales are expected to be 100 000 units although produc-tion units will be 120 000 units.
Fixed selling costs of £150 000 per month will need to be included in the budget as will the variable selling costs of £2 per unit.There are no opening stocks.Required:(a) Prepare the budgeted profi t and loss account for a month for Oathall Limited
using absorption costing. Clearly show the valuation of any stock fi gures.(6 marks)
(b) Prepare the budgeted profi t and loss account for a month for Oathall Limited using marginal costing. Clearly show the valuation of any stock fi gures.
(4 marks)(10 marks)
ACCA Paper 1.2 - Financial Information for Management
Z Limited manufactures a single product, the budgeted selling price andvariable cost details of which are as follows:
(£)Selling price 15.00Variable costs per unit:Direct materials 3.50Direct labour 4.00Variable overhead 2.00
Budgeted fi xed overhead costs are £60 000 per annum, charged at a constant rate each month. Budgeted production is 30 000 units per annum.In a month when actual production was 2400 units and exceeded sales by 180 units the profi t reported under absorption costing wasA £6660B £7570C £7770D £8200E £8400
CIMA Stage 2
A company produces and sells a single product whose variable cost is £6 per unit.Fixed costs have been absorbed over the normal level of activity of 200 000 units and have been calculated as £2 per unit.
The current selling price is £10 per unit.
Question SM 8.5 Preparation of variable and absorption costing profi t statements
Question SM 8.6
Question SM 8.7
40

How much profit is made under marginal costing if the company sells 250 000 units? A £500 000 B £600 000 C £900 000 D £1 000 000
ACCA Paper 1.2 - Financial Information for Management
Exe Limited makes a single product whose total cost per unit is budgeted to be £45. This includes fixed cost of £8 per unit based on a volume of 10 000 units per period.
In a period, sales volume was 9000 units, and production volume was 11 500 units. The
actual profit for the same period, calculated using absorption costing, was £42 000. If the profit statement were prepared using marginal costing, the profit for the period
A would be £10 000 B would be £22 000 C would be £50 000 D would be £62 000 E cannot be calculated without more information
CIMA Stage 1 Operational Cost Accounting
A newly formed company has drawn up the following budgets for its first two accounting periods:
Period 1 Period 2
Sales units 9500 10 000
Production units (equivalent to normal capacity) 10 300 10 000
The following budgeted information applies to both periods:
$
Selling price per unit 6.40
Variable cost per unit 3.60
Fixed production overhead per period 15 000
(a) In period 1, the budgeted profit will be
(i) the same under both absorption costing and marginal costing.
(ii) $750 higher under marginal costing.
(iii) $750 higher under absorption costing.
(iv) $1400 higher under absorption costing.
(b) In period 2, everything was as budgeted, except for the fixed production overhead, which
was $15 700. The reported profit, using absorption costing in period 2, would be
(i) $12 300
(ii) $12 690
(iii) $13 140
(iv) $13 840
CIMA – Management Accounting Fundamentals
INCOME EFFECTS OF ALTERNATIVE COST ACCUMULATION SYSTEMS 29 41
Question SM 8.8
Question SM 8.9

30 COST–VOLUME–PROFIT ANALYSIS
(a) From the following information you are required to construct:(i) a break-even chart, showing the break-even point and the margin of safety;
(ii) a chart displaying the contribution level and the profit level;(iii) a profit–volume chart.
Sales 6000 units at £12 per unit = £72 000
Variable costs 6000 units at £7 per unit = £42 000
Fixed costs = £20 000(9 marks)
(b) State the purposes of each of the three charts in (a) above. (6 marks)
(c) Outline the limitations of break-even analysis. (5 marks)
(d) What are the advantages of graphical presentation of financial data to executives?(2 marks)
(Total 22 marks)AAT
A company produces and sells two products with the following costs:
Product X Product Y
Variable costs £0.45 £0.6(per £ of sales)
Fixed costs £1 212 000 £1 212 000per period
Total sales revenue is currently generated by the two products in the followingproportions:
Product X 70%Product Y 30%
Required:(a) Calculate the break-even sales revenue per period, based on the sales mix
assumed above. (6 marks)(b) Prepare a profit–volume chart of the above situation for sales revenue up to
£4 000 000. Show on the same chart the effect of a change in the sales mix toproduct X 50%, product Y 50%. Clearly indicate on the chart the break-evenpoint for each situation. (11 marks)
(c) Of the fixed costs £455 000 are attributable to product X. Calculate the salesrevenue required on product X in order to recover the attributable fixedcosts and provide a net contribution of £700 000 towards general fixed costsand profit. (5 marks)
(Total 22 marks)ACCA Level 1 Costing
Question SM 9.1Break-even,contribution andprofit–volumegraph
Question SM 9.2Profit–volumegraph andchanges in salesmix
Cost–volume–profit analysis
42

M Ltd manufactures three products which have the following revenue and costs(£ per unit).
Product 1 2 3
Selling price 2.92 1.35 2.83Variable costs 1.61 0.72 0.96Fixed costs:
Product-specific 0.49 0.35 0.62General 0.46 0.46 0.46
Unit fixed costs are based upon the following annual sales and production volumes(thousand units):
Product 1 2 3
98.2 42.1 111.8
Required:(a) Calculate:
(i) the break-even point sales (to the nearest £ hundred) of M Ltd based on thecurrent product mix; (9 marks)
(ii) the number of units of Product 2 (to the nearest hundred) at the break-even point determined in (i) above; (3 marks)
(b) Comment upon the viability of Product 2. (8 marks)(Total 20 marks)
ACCA Cost and Management Accounting 1
You are employed as an accounting technician by Smith, Williams and Jones, asmall firm of accountants and registered auditors. One of your clients is Winter plc,a large department store. Judith Howarth, the purchasing director for Winter plc,has gained considerable knowledge about bedding and soft furnishings and is con-sidering acquiring her own business.
She has recently written to you requesting a meeting to discuss the possible pur-chase of Brita Beds Ltd. Brita Beds has one outlet in Mytown, a small town 100miles from where Judith works. Enclosed with her letter was Brita Beds’ latestprofit and loss account. This is reproduced below.
Brita Beds LtdProfit and loss account – year to 31 MaySales (units) (£)
Model A 1 620 336 960Model B 2 160 758 160Model C 1 620 1 010 880
Turnover 2 106 000Expenses (£)
Cost of beds 1 620 000Commission 210 600Transport 216 000Rates and insurance 8 450Light heat and power 10 000Assistants’ salaries 40 000Manager’s salary 40 000 2 145 050
Loss for year 39 050
Question SM 9.3Calculation ofbreak-even pointsbased on differentsales mixassumptions anda productabandonmentdecision
Question SM 9.4Calculation ofbreak-even pointsand limiting factordecision-making
COST–VOLUME–PROFIT ANALYSIS 3143

32 COST–VOLUME–PROFIT ANALYSIS
Also included in the letter was the following information:
1. Brita Beds sells three types of bed, models A to C inclusive.2. Selling prices are determined by adding 30% to the cost of beds.3. Sales assistants receive a commission of 10% of the selling price for each bed sold.4. The beds are delivered in consignments of 10 beds at a cost of £400 per
delivery. This expense is shown as ‘Transport’ in the profit and loss account.5. All other expenses are annual amounts.6. The mix of models sold is likely to remain constant irrespective of overall
sales volume.
Task 1In preparation for your meeting with Judith Howarth, you are asked to calculate:
(a) the minimum number of beds to be sold if Brita Beds is to avoid making a loss;(b) the minimum turnover required if Brita Beds it to avoid making a loss.
At the meeting, Judith Howarth provides you with further information:
1. The purchase price of the business is £300 000.2. Judith has savings of £300 000 currently earning 5% interest per annum, which
she can use to acquire Beta Beds.3. Her current salary is £36 550.
To reduce costs, Judith suggests that she should take over the role of manager asthe current one is about to retire. However, she does not want to take a reductionin income. Judith also tells you that she has been carrying out some marketresearch. The results of this are as follows:
1. The number of households in Mytown is currently 44 880.2. Brita Beds Ltd is the only outlet selling beds in Mytown.3. According to a recent survey, 10% of households change their beds every 9 years,
60% every 10 years and 30% every 11 years.4. The survey also suggested that there is an average of 2.1 beds per household.
Task 2Write a letter to Judith Howarth. Your letter should:
(a) identify the profit required to compensate for the loss of salary and interest;(b) show the number of beds to be sold to achieve that profit;(c) calculate the likely maximum number of beds that Brita Beds would sell in a year;(d) use your answers in (a) to (c) to justify whether or not Judith Howarth should
purchase the company and become its manager;(e) give two possible reasons why your estimate of the maximum annual sales
volume may prove inaccurate.
On receiving your letter, Judith Howarth decides she would prefer to remain asthe purchasing director for Winter plc rather than acquire Brita Beds Ltd. Shortlyafterwards, you receive a telephone call from her. Judith explains that Winter plcis redeveloping its premises and that she is concerned about the appropriate salespolicy for Winter’s bed department while the redevelopment takes place.Although she has a statement of unit profitability, this had been prepared beforethe start of the redevelopment and had assumed that there would be in excess of800 square metres of storage space available to the bed department. Storage spaceis critical as customers demand immediate delivery and are not prepared to waituntil the new stock arrives.
44

The next day, Judith Howarth sends you a letter containing a copy of the originalstatement of profitability. This is reproduced below:
Model A B CMonthly demand 35 45 20(beds) (£) (£) (£)
Unit selling price 240.00 448.00 672.00Unit cost per bed 130.00 310.00 550.00Carriage inwards 20.00 20.00 20.00Staff costs 21.60 40.32 60.48Department fixed overheads 20.00 20.00 20.00General fixed overheads 25.20 25.20 25.20Unit profit 23.20 32.48 (3.68)Storage required per
bed (square metres) 3 4 5
In her letter she asks for your help in preparing a marketing plan which will maxi-mize the profitability of Winter’s bed department while the redevelopment takesplace. To help you, she has provided you with the following additional information:
1 Currently storage space available totals 300 square metres.2 Staff costs represent the salaries of the sales staff in the bed department. Their total
cost of £3780 per month is apportioned to units on the basis of planned turnover.3 Departmental fixed overhead of £2000 per month is directly attributable to the
department and is apportioned on the number of beds planned to be sold.4 General fixed overheads of £2520 are also apportioned on the number of beds
planned to be sold. The directors of Winter plc believe this to be a fairapportionment of the store’s central fixed overheads.
5 The cost of carriage inwards and the cost of beds vary directly with the numberof beds purchased.
Task 3(a) Prepare a recommended monthly sales schedule in units which will maximize
the profitability of Winter plc’s bed department.(b) Calculate the profit that will be reported per month if your recommendation is
implemented.AAT Technician’s Stage
Fosterjohn Press Ltd is considering launching a new monthly magazine at a sellingprice of £1 per copy. Sales of the magazine are expected to be 500 000 copies per month,but it is possible that the actual sales could differ quite significantly from this estimate.
Two different methods of producing the magazine are being considered and nei-ther would involve any additional capital expenditure. The estimated productioncosts for each of the two methods of manufacture, together with the additional mar-keting and distribution costs of selling the new magazine, are summarised below:
Method A Method B
Variable costs 0.55 per copy 0.50 per copySpecific fixed costs £80 000 £120 000
per month per monthSemi-variable costs:
The following estimates have been obtained:350 000 copies £55 000 per month £47 500 per month450 000 copies £65 000 per month £52 500 per month650 000 copies £85 000 per month £62 500 per month
It may be assumed that the fixed cost content of the semi-variable costs will remainconstant throughout the range of activity shown.
COST–VOLUME–PROFIT ANALYSIS 33
Question SM 9.5Decision-makingand non-graphicalCVP analysis
45

The company currently sells a magazine covering related topics to those that will beincluded in the new publication and consequently it is anticipated that sales of thisexisting magazine will be adversely affected. It is estimated that for every ten copiessold of the new publication, sales of the existing magazine will be reduced by one copy.
Sales and cost data of the existing magazine are shown below:Sales 220 000 copies per monthSelling price 0.85 per copyVariable costs 0.35 per copySpecific fixed costs £80 000 per month
Required:(a) Calculate, for each production method, the net increase in company profits
which will result from the introduction of the new magazine, at each of thefollowing levels of activity:
500 000 copies per month400 000 copies per month600 000 copies per month (12 marks)
(b) Calculate, for each production method, the amount by which sales volume ofthe new magazine could decline from the anticipated 500 000 copies permonth, before the company makes no additional profit from the introductionof the new publication. (6 marks)
(c) Briefly identify any conclusions which may be drawn from your calculations.(4 marks)
(Total 22 marks)ACCA Foundation Costing
Mr Belle has recently developed a new improved video cassette and shown belowis a summary of a report by a firm of management consultants on the sales poten-tial and production costs of the new cassette.
Sales potential: The sales volume is difficult to predict and will vary with the price,but it is reasonable to assume that at a selling price of £10 per cassette, sales would bebetween 7500 and 10 000 units per month. Alternatively, if the selling price wasreduced to £9 per cassette, sales would be between 12 000 and 18 000 units per month.
Production costs: If production is maintained at or below 10 000 units per month,then variable manufacturing costs would be approximately £8.25 per cassette andfixed costs £12 125 per month. However, if production is planned to exceed 10 000units per month, then variable costs would be reduced to £7.75 per cassette, but thefixed costs would increase to £16 125 per month.
Mr Belle has been charged £2000 for the report by the management consultantsand, in addition, he has incurred £3000 development costs on the new cassette.
If Mr Belle decides to produce and sell the new cassette it will be necessary forhim to use factory premises which he owns, but are leased to a colleague for arental of £400 per month. Also he will resign from his current post in an electronicsfirm where he is earning a salary of £1000 per month.
Required:(a) Identify in the question an example of
(i) an opportunity cost,(ii) a sunk cost. (3 marks)
(b) Making whatever calculations you consider appropriate, analyse the reportfrom the consultants and advise Mr Belle of the potential profitability of thealternatives shown in the report.
Any assumptions considered necessary or matters which may require furtherinvestigation or comment should be clearly stated. (19 marks)
(Total 22 marks)ACCA Level 1 Costing
Question SM 9.6Decision-makingand non-graphicalCVP analysis
34 COST–VOLUME–PROFIT ANALYSIS46

COST–VOLUME–PROFIT ANALYSIS 33
A company has calculated its margin of safety as 20% on budgeted sales and bud-geted sales are 5000 units per month.
What would be the budgeted fi xed costs if the budgeted contribution was £25 per unit?A £100 000B £125 000C £150 000D £160 000
ACCA Paper 1.2 - Financial Information for Management
H Limited manufactures and sells two products, J and K. Annual sales are expected to be in the ratio of J:l, K:3. Total annual sales are planned to be £420 000. Product J has a contribution to sales ratio of 40%, whereas that of product K is 50%. Annual fi xed costs are estimated to be £120 000.The budgeted break-even sales value (to the nearest £1000):A £196 000B £200 000C £253 000D £255 000E cannot be determined from the above data.
CIMA Stage 2
E plc operates a marginal costing system. For the forthcoming year, variable costs are budgeted to be 60% of sales value and fi xed costs are budgeted to be 10% of sales value.
If E plc increases its selling prices by 10%, but if fi xed costs, variable costs per unit and sales volume remain unchanged, the effect on E plc’s contribution would be:A a decrease of 2%B an increase of 5%C an increase of 10%D an increase of 25%E an increase of 662/3%
CIMA Stage 2
A manufacturer of cell phones is considering the following actions. Which of these is likely to increase the manufacturer ’s C/S (contribution/sales) ratio? (i) taking advantage of quantity discounts for bulk purchases of material; (ii) introducing training programmes designed to improve labour effi ciency;(iii) following the actions of a competitor who has cut prices substantially;(iv) reducing exports to countries where there is intense price competition; (v) offering retailers a lower price if they display the product more prominently.A (ii), (iii) and (v)B (i), (ii) and (iv)C (i), (iii) and (iv)D (ii), (iv) and (v)
CIMA Management Accounting Fundamentals
Question SM 9.7
Question SM 9.8
Question SM 9.9
Question SM 9.10
47

34 COST–VOLUME–PROFIT ANALYSIS
Z plc makes a single product which it sells for £16 per unit. Fixed costs are £76 800 per month and the product has a contribution to sales ratio of 40%.In a period when actual sales were £224 000, Z plc’s margin of safety, in units, wasA 2 000B 6 000C 8 000D 12 000E 14 000
CIMA Stage 2
Question SM 9.11
48

Cost estimation and cost behaviour
Factory overheads 168 000
Total production costs £435 000
Output (units) 160 000 190 000 220 000 180 000
The costs of raw materials and skilled and unskilled labour have increased steadily during
the past four years at an annual compound rate of 20%, and the costs of factory overheads
have increased at an annual compound rate of 15% during the same period. Power prices
increased by 10% on 1 January 2014 and by 25% on the 1 January of each subsequent year.
All costs except power are expected to increase by a further 20% during 2017. Power prices
are due to rise by 25% on 1 January 2017.
The directors of Savitt Ltd are now formulating the company’s production plan for 2016
and wish to estimate the costs of manufacturing the product LT. The finance director has
expressed the view that ‘the full relevant cost of producing LTs can be determined only if a
fair share of general company overheads is allocated to them’. No such allocation is included
in the table of costs above.
You are required to:
(a) use linear regression analysis to estimate the relationship of total production costs to
volume for the products LT for 2017 (ignore general company overheads and do not
undertake a separate regression calculation for each item of cost), (12 marks)
(b) discuss the advantages and limitations of linear regression analysis for the estimation of
cost–volume relationships, (8 marks)
(c) comment on the view expressed by the finance director. (5 marks)
Ignore taxation.
ICAEW Elements of Financial Decisions
COST ESTIMATION AND COST BEHAVIOUR
Savitt Ltd manufactures a variety of products at its industrial site in Ruratania. One of the
products, the LT, is produced in a specially equipped factory in which no other production
takes place. For technical reasons the company keeps no stocks of either LTs or the raw
material used in their manufacture. The costs of producing LTs in the special factory during the past four years have been as follows:
(2016)
2013 2014 2015 (estimated)
(£) (£) (£) (£)
Raw materials 70 000 100 000 130 000 132 000
Skilled labour 40 000 71 000 96 000 115 000
Unskilled labour 132 000 173 000 235 000 230 000
Power 25 000 33 000 47 000 44 000
Question SM 10.1
Linear regression
analysis with
price level
adjustments
35 49

Q Limited used an incremental budgeting approach to setting its budgets for the
The budget for the company’s power costs was determined by analysing the pastrelationship between costs and activity levels and then adjusting for inflation of 6%.
The relationship between monthly cost and activity levels, before adjusting for6% inflation, was found to be:
y = £(14 000 + 0.0025x2)where y = total cost; and
x = machine hours
was £16 423. The total power cost variance to be reported is nearest to
A £3391 (A) B £3391 (F) C £3740 (F) D £4580 (F)
CIMA Management Accounting – Performance Management
The overhead costs of RP Limited have been found to be accurately represented bythe formula
y = £10 000 + £0.25x
where y is the montly cost and x represents the activity level measured in machinehours.
Monthly activity levels, in machine hours, may be estimated using a combinedregression analysis and time series model:
a = 100 000 + 30b
where a represents the de-seasonalised monthly activity level and b represents themonth number.
In month 240, when the seasonal index value is 108, the overhead cost (to thenearest £1000) is expected to be
A £35 000 B £37 000 C £39 000 D £41 000
(3 marks)CIMA Management Accounting – Performance Management
Question SM 10.2
Question SM 10.3
36 COST ESTIMATION AND COST BEHAVIOUR
year ending 30 June.
In April, the number of machine hours was 1525 and the actual cost incurred
The following information for advertising and sales has been established over the past six months:
MonthSales Revenue £000
Advertising expenditure £000
1 155 32 125 2.53 200 64 175 5.55 150 4.56 225 6.5
Using the high-low method, which of the following is the correct equation for link-ing advertising and sales from the above data?A sales revenue = 62 500 + (25 × advertising expenditure)B advertising expenditure = �2500 + (0.04 × sales revenue)C sales revenue = 95 000 + (20 × advertising expenditure)D advertising expenditure = �4750 + (0.05 × sales revenue)
ACCA – Financial Information for Management
Question SM 10.4
50

COST ESTIMATION AND COST BEHAVIOUR 35
A company incurs the following costs at various activity levels:
Total cost £ Activity level Units250 000 5 000312 500 7 500400 000 10 000
Using the high-low method what is the variable cost per unit?A £25B £30C £35D £40
ACCA – Financial Information for Management
V Ltd buys IT support services from an outside agency. In its last four accounting periods, the charges made by the agency have been as follows:
Period Usage (hours) Charge for services $1 3700 16 7002 4900 20 3003 3250 15 3504 5800 23 000
The agency did not increase its charging rates in periods 1 to 4. It has notifi ed V Ltd that, in period 5, it will increase the fi xed element of the charge by 5% and the variable element by 10%.
If V Ltd estimates its level of usage at 5500 hours in period 5, the expected charge for IT support services will beA $23 485B $24 030C $25 020D $26 010
ACCA – Financial Information for Management
A company has established the following information for the costs and revenues at an activity level of 500 units:
£Direct materials 2 500Direct labour 5 000Production overheads 1 000Selling costs 1 250Total cost 9 750Sales revenue 17 500Profi t 7 750
20% of the selling costs and 50% of the production overheads are fi xed over all levels of activity.What would be the profi t at an activity level of 1000 units?A £15 500B £16 250C £16 500D £17 750
ACCA – Financial Information for Management
Question SM 10.5
Question SM 10.6
Question SM 10.7
51

An organization has the following total costs at two activity levels: Activity level (units) 15 000 24 000 Total costs £380 000 £470 000 Variable cost per unit is constant in this activity range but there is a step up of £18 000 in the total fixed costs when the activity exceeds 20 000 units. What are the total costs at an activity level of 18 000 units? (a) £404 000 (b) £410 000 (c) £422 000 (d) £428 000
ACCA – Financial Information for Management
The following production and total cost information relates to a single product
organization for the last three months: Month Production units Total cost £
1 1200 66 600 2 900 58 200 3 1400 68 200
The variable cost per unit is constant up to a production level of 2000 units per month but a step up of £6000 in the monthly total fixed cost occurs when production reaches 1100 units per month. What is the total cost for a month when 1000 units are produced? (a) £54 200 (b) £55 000 (c) £59 000 (d) £60 200
ACCA – Financial Information for Management
COST ESTIMATION AND COST BEHAVIOUR 35 52
Question SM 10.8
Question SM 10.9

The management of Springer plc is considering next year’s production and pur-chase budgets.
One of the components produced by the company, which is incorporated intoanother product before being sold, has a budgeted manufacturing cost as follows:
(£)
Direct material 14
Variable overhead (4 hours at £2 per hour) 8Fixed overhead (4 hours at £5 per hour) 20Total cost
Trigger plc has offered to supply the above component at a guaranteed price of
Required:(a) Considering cost criteria only, advise management whether the above
component should be purchased from Trigger plc. Any calculations should beshown and assumptions made, or aspects which may require furtherinvestigation should be clearly stated. (6 marks)
(b) Explain how your above advice would be affected by each of the two separatesituations shown below.(i) As a result of recent government legislation if Springer plc continues to
manufacture this component the company will incur additional inspectionand testing expenses of £56 000 per annum, which are not included in theabove budgeted manufacturing costs. (3 marks)
(ii) Additional labour cannot be recruited and if the above component is notmanufactured by Springer plc the direct labour released will be employedin increasing the production of an existing product which is sold for £90and which has a budgeted manufacturing cost as follows:
(£)
Direct material 10
Variable overhead (8 hours at £2 per hour) 16Fixed overhead (8 hours at £5 per hour) 40
All calculations should be shown. (4 marks)
(c) The production director of Springer plc recently said:
‘We must continue to manufacture the component as only one year ago wepurchased some special grinding equipment to be used exclusively by thiscomponent. The equipment cost £100 000, it cannot be resold or used else-where and if we cease production of this component we will have to writeoff the written down book value which is £80 000.’
Question SM 11.1Make or buydecision
MEASURING RELEVANT COSTS AND REVENUES FOR DECISION-MAKING 37
Measuring relevant costs andrevenues for decision-making
Direct labour (4 hours at £12 per hour) 48
£86 per unit.
90 per unit
Direct labour (8 hours at £12 per hour) 96
53
162 per unit

Draft a brief reply to the production director commenting on his statement.(4 marks)
(Total 17 marks)ACCA Level 1 Costing
You have received a request from EXE plc to provide a quotation for the manu-facture of a specialized piece of equipment. This would be a one-off order, inexcess of normal budgeted production. The following cost estimate has alreadybeen prepared:
Note (£)
Direct materials:Steel 10 m2 at £5.00
per sq. metre 1 50Brass fittings 2 20
Direct labourSkilled
per hour 3Semi-skilled
per hour 4Overhead 35 hours at £10.00
per hour 5 350Estimating time 6 100
Administrative overhead at 20% of production cost 7
Profit at 25% of total cost 8Selling price
Notes1. The steel is regularly used, and has a current stock value of £5.00 per sq. metre.
There are currently 100 sq. metres in stock. The steel is readily available at aprice of £5.50 per sq. metre.
2.has quoted the price of £20 for the fittings required.
3. The skilled labour is currently employed by your company and paid at a rate of
production of another product which earns a contribution of £13.00 per hour.4.
complete this work.5. The overhead absorption rate includes power costs which are directly related
to machine usage. If this job were undertaken, it is estimated that the machinetime required would be ten hours. The machines incur power costs of £0.75 perhour. There are no other overhead costs which can be specifically identifiedwith this job.
6. The cost of the estimating time is that attributed to the four hours taken by theengineers to analyse the drawings and determine the cost estimate given above.
7. It is company policy to add 20% on to the production cost as an allowanceagainst administration costs associated with the jobs accepted.
8. This is the standard profit added by your company as part of its pricing policy.
Question SM 11.2Calculation ofminimum sellingprice
38 MEASURING RELEVANT COSTS AND REVENUES FOR DECISION-MAKING
25 hours at £14
10 hours at £12350
120
990
1981188
The brass fittings would have to be bought specifically for this job: a supplier
work 25 hours overtime which would be paid at time plus one half or to reduce
297
The semi-skilled labour currently has sufficient paid idle time to be able to
1485
£14 per hour. If this job were undertaken it would be necessary either to
54

Required:(a) Prepare, on a relevant cost basis, the lowest cost estimate that could be used as
the basis for a quotation. Explain briefly your reasons for using each of thevalues in your estimate. (12 marks)
(b) There may be a possibility of repeat orders from EXE plc which would occupypart of normal production capacity. What factors need to be considered beforequoting for this order? (7 marks)
(c) When an organisation identifies that it has a single production resource whichis in short supply, but is used by more than one product, the optimumproduction plan is determined by ranking the products according to theircontribution per unit of the scarce resource.
Using a numerical example of your own, reconcile this approach with theopportunity cost approach used in (a) above. (6 marks)
(Total 25 marks)CIMA Stage Operational Cost Accounting
(a) Budgeted information for A Ltd for the following period, analysed by product,is shown below:
Product Product ProductI II III
Sales units (000s) 225 376 190Selling price (£ per unit) 11.00 10.50 8.00Variable costs (£ per unit) 5.80 6.00 5.20Attributable fixed costs (£000s) 275 337 296
General fixed costs, which are apportioned to products as a percentage of sales,are budgeted at £1 668 000.
Required:(i) Calculate the budgeted profit of A Ltd, and of each of its products. (5 marks)
(ii) Recalculate the budgeted profit of A Ltd on the assumption that ProductIII is discontinued, with no effect on sales of the other two products. Stateand justify other assumptions made. (5 marks)
(iii) Additional advertising, to that included in the budget for Product I, isbeing considered.
Calculate the minimum extra sales units required of Product I to coveradditional advertising expenditure of £80 000. Assume that all other exist-ing fixed costs would remain unchanged. (3 marks)
(iv) Calculate the increase in sales volume of Product II that is necessary in orderto compensate for the effect on profit of a 10% reduction in the selling priceof the product. State clearly any assumptions made. (5 marks)
(b) Discuss the factors which influence cost behaviour in response to changes inactivity. (7 marks)
(Total 25 marks)ACCA Cost and Management Accounting 1
Question SM 11.3Impact of aproductabandonmentdecision and CVPanalysis
MEASURING RELEVANT COSTS AND REVENUES FOR DECISION-MAKING 3955

You work as a trainee for a small management consultancy which has been askedto advise a company, Rane Limited, which manufactures and sells a single prod-uct. Rane is currently operating at full capacity producing and selling 25 000 unitsof its product each year. The cost and selling price structure for this level of activityis as follows:
At 25 000units output
(£ per unit) (£ per unit)
Production costsDirect material 14Direct labour 13Variable production overhead 4Fixed production overhead 8
Total production cost 39Selling and distribution overhead:
Sales commission – 10% of sales value 6Fixed 3
9Administration overhead:
Fixed 2Total cost 50Mark up – 20% 10
Selling price 60
A new managing director has recently joined the company and he has engagedyour organisation to advise on his company’s selling price policy. The sales price of£60 has been derived as above from a cost-plus pricing policy. The price was viewedas satisfactory because the resulting demand enabled full capacity operation.
You have been asked to investigate the effect on costs and profit of an increase inthe selling price. The marketing department has provided you with the followingestimates of sales volumes which could be achieved at the three alternative salesprices under consideration.
Selling price per unit £70 £80 £90Annual sales volume (units) 20 000 16 000 11 000
You have spent some time estimating the effect that changes in output volumewill have on cost behaviour patterns and you have now collected the followinginformation.
Direct material: The loss of bulk discounts means that the direct material costper unit will increase by 15% for all units produced in the year if activityreduces below 15 000 units per annum.Direct labour: Savings in bonus payments will reduce labour costs by 10% forall units produced in the year if activity reduces below 20 000 units per annum.Sales commission: This would continue to be paid at the rate of 10% of sales price.Fixed production overhead: If annual output volume was below 20 000 units,then a machine rental cost of £10 000 per annum could be saved. This will bethe only change in the total expenditure on fixed production overhead.Fixed selling overhead: A reduction in the part-time sales force would result ina £5000 per annum saving if annual sales volume falls below 24 000 units. Thiswill be the only change in the total expenditure on fixed selling anddistribution overhead.Variable production overhead: There would be no change in the unit cost forvariable production overhead.Administration overhead: The total expenditure on administration overheadwould remain unaltered within this range of activity.Stocks: Rane’s product is highly perishable, therefore no stocks are held.
Question SM 11.4Price/output andkey factordecisions
40 MEASURING RELEVANT COSTS AND REVENUES FOR DECISION-MAKING56

Task 1(a) Calculate the annual profit which is earned with the current selling price of £60
per unit.(b) Prepare a schedule to show the annual profit which would be earned with
each of the three alternative selling prices.
Task 2Prepare a brief memorandum to your boss, Chris Jones. The memorandum shouldcover the following points:(a) Your recommendation as to the selling price which should be charged to
maximise Rane Limited’s annual profits.(b) Two non-financial factors which the management of Rane Limited should
consider before planning to operate below full capacity.Another of your consultancy’s clients is a manufacturing company, Shortage
Limited, which is experiencing problems in obtaining supplies of a majorcomponent. The component is used in all of its four products and there is alabour dispute at the supplier’s factory, which is restricting the component’savailability.
Supplies will be restricted to 22 400 components for the next period and thecompany wishes to ensure that the best use is made of the availablecomponents. This is the only component used in the four products, and thereare no alternatives and no other suppliers.
The components cost £2 each and are used in varying amounts in each of thefour products.
Shortage Limited’s fixed costs amount to £8000 per period. No stocks areheld of finished goods or work in progress.
The following information is available concerning the products.
Maximum Product A Product B Product C Product Ddemand 4000 units 2500 units 3600 units 2750 unitsper period (£ per unit) (£ per unit) (£ per unit) (£ per unit)
Selling price 14 12 16 17Component costs 4 2 6 8Other variable costs 7 9 6 4
Task 3(a) Prepare a recommended production schedule for next period which will
maximise Shortage Limited’s profit.(b) Calculate the profit that will be earned in the next period if your recommended
production schedule is followed.AAT Technicians Stage
MEASURING RELEVANT COSTS AND REVENUES FOR DECISION-MAKING 41
Due to a national wage agreement, you fi nd that wage rates for skilled workers are to increase by 50% over the budget fi gures. There is a shortage of such skilled workers and it takes over a year to train new recruits adequately. The managing director has asked you for advice as to which order of priority on the product range would give best use of the skilled labour resources available. The cost of unskilled labour, of which there is no shortage, will go up by 20% over budget.
The original budget fi gures for the next period before allowing for the increase in labour cost detailed above, were:
Product V W X Y ZMaximum production in units 3000 4000 6000 7000 9000Selling price per unit £16 £15 £18 £15 £30Variable costs per unitMaterial 3 5 4 7 6Skilled labour £4 per hour 4 4 6 2 8Unskilled labour £2 per hour 2 2 114
Question SM 11.5Key/limiting factors
57

40 MEASURING RELEVANT COSTS AND REVENUES FOR DECISION-MAKING
Variable overheads are recovered at the rate of £1 per labour hour. The skilled labour available amounts to 30 000 hours in the period and there are fi xed costs of £22 800.You are required to:(a) calculate the product mix which would result in the maximum profi t;
(12 marks)(b) comment on the results of the revised budget.
(6 marks)(Total 18 marks)
AAT
A company produces three products which have the following details:
I Per unit II Per unit III Per unit Direct materials (at £5/kg) 8 kg 5 kg 6 kg Contribution per unit £35 £25 £48 Contribution per kg of material $4.375 £5 £8 Demand (excluding special contract) (units)
3000 5000 2000
The company must produce 1000 units of Product I for a special contract before meeting normal demand. Unfortunately there are only 35 000 kg of material available.
What is the optimal production plan?
I II IIIA 1000 4600 2000B 1000 3000 2000C 2875 – 2000D 3000 2200 –
ACCA – Financial Information for Management
Question SM 11.6
A company uses limiting factor analysis to calculate an optimal production plan given a scarce resource.The following applies to the three products of the company:
Product I £ II £ III £Direct materials (at £6/kg) 36 24 15Direct labour (at £10/hour) 40 25 10Variable overheads (£2/hour) 8 5 2
84 54 27Maximum demand (units) 2000 4000 4000Optimal production plan 2000 1500 4000
How many kg of material were avalable for use in production?A 15 750 kgB 28 000 kgC 30 000 kgD 38 000 kg
ACCA – Financial Information for Management
Question SM 11.7
58

MEASURING RELEVANT COSTS AND REVENUES FOR DECISION-MAKING 41
A company has just secured a new contract which requires 500 hours of labour.There are 400 hours of spare labour capacity. The remaining hours could be
worked as overtime at time and a half or labour could be diverted from the pro-duction of product X. Product X currently earns a contribution of £4 in two labour hours and direct labour is currently paid at a rate of £12 per normal hour.
What is the relevant cost of labour for the contract?A £200B £1200C £1400D £1800
ACCA – Financial Information for Management
A company has just purchased a new machine, costing £150 000, for a contract. It has an installation cost of £25 000 and is expected to have a scrap value of £10 000 in fi ve years’ time. The machine will be depreciated on a straight line basis over fi ve years.What is the relevant cost of the machine for the contract?A £140 000B £150 000C £165 000D £175 000
ACCA – Financial Information for Management
Your company regularly uses material X and currently has in stock 600 kg, for which it paid £1500 two weeks ago. It this were to be sold as raw material it could be sold today for £2.00 per kg. You are aware that the material can be bought on the open market for £3.25 per kg, but it must be purchased in quantities of 1000 kg.
You have been asked to determine the relevant cost of 600 kg of material X to be used in a job for a customer. The relevant cost of the 600 kg is:A £1200B £1325C £1825D £1950E £3250
CIMA Stage 2
Question SM 11.8
Question SM 11.9
Question SM 11.10
BB Limited makes three components: S, T and U. The following costs have been recorded:
Component S Unit cost (£)
Component T Unit cost (£)
Component U Unit cost (£)
Variable cost 2.50 8.00 5.00Fixed cost 2.00 8.30 3.75Total cost 4.50 16.30 8.75
Another company has offered to supply the components to BB Limited at the following prices:
Component S Component T Component UPrice each £4 £7 £5.50
Which component(s), if any, should BB Limited consider buying in?Buy in all three components.Do not buy any.Buy in S and U.Buy in T only.
CIMA Stage 1
Question SM 11.11
59

Question SM 11.12
A company is considering accepting a one-year contract which will require four skilled
employees. The four skilled employees could be recruited on a one-year contract at a cost
of £40 000, per employee. The employees would be supervised by an existing manager who earns £60 000 per annum. It is expected that supervision of the contract would take
10% of the manager’s time. Instead of recruiting new employees, the company could retrain some existing
employees who currently earn £30 000 per year. The training would cost £15 000 in total. If these employees were used they would need to be replaced at a total cost of £100 000. The relevant labour cost of the contract is:
A £100 000 B £115 000 C £135 000 D £141000 E £166 000
CIMA Stage 2 Relevant costs for labour and materials Inez Ltd is evaluating the relevant costs of a one-off contract. The following information relates to the materials and labour requirements of the contract: Materials The contract required 2500 kg of material R, which is a material regularly used by the company in other production. The company has 4000 kg of R currently in stock. Half of that stock was purchased two months ago for £24 per kg and the other half was purchased last month for £25 per kg. The supplier has recently notified the company that the price of R has risen by 8 per cent compared with last month. Labour The contract requires 600 hours of skilled labour which is paid £10 per hour. The company’s existing skilled labour is all fully employed in the manufacture of product T and no further supply is available. The following information relates to product T:
Required:
(a) Calculate the total relevant costs for the contract in respect of:
(i) Material R; and (ii) Skilled labour.
(5 marks) (b) Explain the basis you would use to determine if any production overhead costs would
be relevant to the evaluation of the contract. Illustrate your answer with examples of such costs but no calculations are required.
(3 marks) (8 marks) ACCA – Financial information for Management
MEASURING RELEVANT COSTS AND REVENUES FOR DECISION-MAKING
£ per unit £ per unit
Selling price 100 Less Variable costs:
Direct materials 40 Skilled labour 25 Selling 5
(70)
30
40 60
Question SM 11.13


44 ACTIVITY-BASED COSTING
The following budgeted information relates to Brunti plc for the forthcoming period:
Products
XYI YZT ABW(000) (000) (000)
Sales and production (units) 50 40 30(£) (£) (£)
Selling price (per unit) 45 95 73Prime cost (per unit) 32 84 65
Hours Hours Hours
Machine department(machine hours per unit) 2 5 4
Assembly department(direct labour hours per unit) 7 3 2
Overheads allocated and apportioned to production departments (including ser-vice cost centre costs) were to be recovered in product costs as follows:
Machine department at£1.20 per machine hourAssembly department at£0.825 per direct labour hour
You ascertain that the above overheads could be re-analysed into ‘cost pools’ asfollows:
Quantityfor the
Cost pool £000 Cost driver period
Machining services 357 Machine hours 420 000Assembly services 318 Direct labour hours 530 000Set-up costs 26 Set-ups 520Order processing 156 Customer orders 32 000Purchasing 84 Suppliers orders 11 200
941
You have also been provided with the following estimates for the period:
Products
XYI YZT ABW
Number of set-ups 120 200 200Customer orders 8000 8000 16 000Suppliers’ orders 3000 4000 4 200
Preparation ofconventionalcosting and ABCprofit statements
Activity-based costing
Question SM 12.1
62

Required:(a) Prepare and present profit statements using:
(i) conventional absorption costing; (5 marks)(ii) activity-based costing; (10 marks)
(b) Comment on why activity-based costing is considered to present a fairervaluation of the product cost per unit. (5 marks)
(Total 20 marks)ACCA Paper 8 Managerial Finance
In a marginal costing system only variable costs would be assigned to products orservices, in which case management may rely on a contribution approach to decisions.
Required:(a) Explain and discuss the contribution approach to decisions giving brief examples
and drawing attention to any limitations. (6 marks)
A full absorption costing system would involve the assignment of both variable andfixed overhead costs to products. A traditional full absorption costing system typi-cally uses a single volume related allocation base (or cost driver) to assign overheads toproducts. An activity based costing (ABC) system would use multiple allocation bases(or cost drivers), taking account of different categories of activities and related overheadcosts such as unit, batch, product sustaining and facility sustaining.
Required:(b) Describe the likely stages involved in the design and operation of an ABC system.
(4 marks)(c) Explain and discuss volume related allocation bases (or cost drivers), giving an
example of one within a traditional costing system. Contrast this with themultiple allocation bases (or cost drivers) of an ABC system. (6 marks)
(d) Briefly elaborate on the different categories of activities and related overheadcosts, such as unit, batch, product sustaining and facility sustaining, which maybe used in an ABC system. (4 marks)
(Total 20 marks)ACCA Paper 8 Managerial Finance
The following information provides details of the costs, volume and cost drivers fora particular period in respect of ABC plc, a hypothetical company:
Product X Product Y Product Z Total
1. Production and sales (units) 30 000 20 000 8 0002. Raw material usage (units) 5 5 113. Direct material cost £25 £20 £11 £1 238 0004. Direct labour hours 11/3 2 1 88 0005. Machine hours 11/3 1 2 76 0006. Direct labour cost 8 £12 £67. Number of production runs 3 7 20 308. Number of deliveries 9 3 20 329. Number of receipts (2 × 7)a 15 35 220 270
10. Number of production orders 15 10 25 5011. Overhead costs:
Set-up 30 000Machines 760 000Receiving 435 000Packing 250 000Engineering 373 000
£1 848 000a The company operates a just-in-time inventory policy, and receives each component once perproduction run.
Computation ofproduct costs fortraditional andABC systems
ACTIVITY-BASED COSTING 45
Question SM 12.2
Question SM 12.3
63

In the past the company has allocated overheads to products on the basis of direct labour
hours.
However, the majority of overheads are more closely related to machine hours than direct
labour hours.
The company has recently redesigned its cost system by recovering overheads using two
volume-related bases: machine hours and a materials handling overhead rate for recovering
overheads of the receiving department. Both the current and the previous cost system
reported low profit margins for product X, which is the company’s highest-selling product.
The management accountant has recently attended a conference on activity-based costing,
and the overhead costs for the last period have been analysed by the major activities in order
to compute activity-based costs.
From the above information you are required to:
(a) Compute the product costs using a traditional volume-related costing system based on
the assumptions that:
(i) all overheads are recovered on the basis of direct labour hours (i.e. the company’s
past product costing system);
(ii) the overheads of the receiving department are recovered by a materials handling
overhead rate and the remaining overheads are recovered using a machine hour rate
(i.e. the company’s current costing system).
(b) Compute product costs using an activity-based costing system.
(c) Briefly explain the differences between the product cost computations in (a) and (b).
DRP Limited has recently introduced an activity-based costing system. It manufactures three
products, details of which are set out below:
Product D Product R Product P
Budgeted annual production (units) 100 000 100 000 50 000
Batch size (units) 100 50 25
Machine set-ups per batch 3 4 6
Purchase orders per batch 2 1 1
Processing time per unit (minutes) 2 3 3
Three cost pools have been identified. Their budgeted costs for the year ending 30 June
are as follows:
Machine set-up costs £150 000
Purchasing of materials £70 000
Processing £80 000
The budgeted machine set-up cost per unit of product R is nearest to:
(a) £ 0.52
(b) £ 0.60
(c) £ 6.52
(d) £ 26.09
(3 marks)
CIMA Management Accounting – Performance Management
ACTIVITY-BASED COSTING
46 64
Question SM
12.4

CJD Ltd manufactures plastic components for the car industry. The following budgeted
information is available for three of their key plastic components:
W £ per unit X £ per unit Y £ per unit
Selling price 200 183 175
Direct material 50 40 35
Direct labour 30 35 30
Units produced and sold 10 000 15 000 18 000
The total number of activities for each of the three products for the period is as follows:
Number of purchase requisitions 1200 1800 2000
Number of set ups 240 260 300
Overhead costs have been analyzed as follows:
Receiving/inspecting quality assurance £1 400 000
Production scheduling/machine set up £1 200 000
Calculate the budgeted profit per unit for each of the three products using activity based
budgeting.
(4 marks)
CIMA P1 Management Accounting: Performance Evaluation
ACTIVITY-BASED COSTING
46 65
Question SM
12.5

52 THE BUDGETING PROCESS
Wollongong wishes to calculate an operating budget for the forthcoming period.Information regarding products, costs and sales levels is as follows:
Product A B
Materials requiredX (kg) 2 3Y (litres) 1 4
Labour hours requiredSkilled (hours) 4 2Semi-skilled (hours) 2 5
Sales level (units) 2000 1500Opening stocks (units) 100 200
Closing stock of materials and finished goods will be sufficient to meet 10% ofdemand. Opening stocks of material X was 300 kg and for material Y was 1000litres. Material prices are £10 per kg for material X and £7 per litre for material Y.Labour costs are £12 per hour for the skilled workers and £8 per hour for the semiskilled workers.
Required:Produce the following budgets:(a) production (units);(b) materials usage (kg and litres);(c) materials purchases (kg, litres and £); and(d) labour (hours and £). (10 marks)
ACCA Paper 1.2 – Financial information for Management
A division of Bud plc is engaged in the manual assembly of finished products F1and F2 from bought-in components. These products are sold to external customers.The budgeted sales volumes and prices for Month 9 are as follows:
Product Units Price
F1 34 000 £50.00F2 58 000 £30.00
Finished goods stockholding budgeted for the end of Month 9, is 1000 units of F1and 2000 units of F2, with no stock at the beginning of that month. The purchasedcomponents C3 and C4 are used in the finished products in the quantities shownbelow. The unit price is for just-in-time delivery of the components; the companyholds no component stocks.
ComponentProduct C3 C4
F1 (per unit) 8 units 4 unitsF2 (per unit) 4 units 3 unitsPrice (each) £1.25 £1.80
functionalbudgets
Preparation offunctionalbudgets andbudgeted profitstatement
The budgeting process
Preparation ofQuestion SM 13.1
Question SM 13.2
66

The standard direct labour times and labour rates and the budgeted monthly man-ufacturing overhead costs for the assembly and finishing departments for Month 9are given below:
Product Assembly Finishing
F1 (per unit) 30 minutes 12 minutesF2 (per unit) 15 minutes 10 minutesLabour rate (per hour)Manufacturing overhead
cost for the month £617 500 £204 000
Every month a predetermined direct labour hour recovery rate is computed ineach department for manufacturing overhead and applied to items produced inthat month.
The selling overhead of £344 000 per month is applied to products based on apredetermined percentage of the budgeted sales value in each month.
Required:(a) Prepare summaries of the following budgets for Month 9:
(i) component purchase and usage (units and value);(ii) direct labour (hours and value);
(iii) departmental manufacturing overhead recovery rates;(iv) selling overhead recovery rate;(v) stock value at the month-end. (8 marks)
(b) Tabulate the standard unit cost and profit of each of F1 and F2 in Month 9.(3 marks)
(c) Prepare a budgeted profit and loss account for Month 9 which clearlyincorporates the budget values obtained in (a) above. (3 marks)
(d) Explain clearly the implications of the company’s treatment of manufacturingoverheads, i.e. computing a monthly overhead rate, compared to apredetermined overhead rate prepared annually. (6 marks)
(Total 20 marks)ACCA Paper 8 Managerial Finance
A redundant manager who received compensation of £80 000 decides to commencebusiness on 4 January, manufacturing a product for which he knows there is aready market. He intends to employ some of his former workers who were alsomade redundant but they will not all commence on 4 January. Suitable premiseshave been found to rent and second-hand machinery costing £60 000 has beenbought out of the £80 000. This machinery has an estimated life of five years fromJanuary and no residual value.
Other data1. Production will begin on 4 January and 25% of the following month’s sales
will be manufactured in January. Each month thereafter the production willconsist of 75% of the current month’s sales and 25% of the followingmonth’s sales.
2. Estimated sales are
(Units) (£)
January Nil NilFebruary 3200 80 000March 3600 90 000April 4000 100 000May 4000 100 000
Preparation ofcash budgets
THE BUDGETING PROCESS 53
£10 £12
Question SM 13.3
67

3. Variable production cost per unit
(£)
Direct materials 7
Direct wages 6
Variable overhead
4. Raw material stocks costing £10 000 have been purchased (out of the manager’s
£80 000) to enable production to commence and it is intended to buy, each month, 50%
of the materials required for the following month’s production requirements. The other
50% will be purchased in the month of production. Payment will be made 30 days after
purchase.
5. Direct workers have agreed to have their wages paid into bank accounts on the seventh
working day of each month in respect of the previous month’s earnings.
6. Variable production overhead: 60% is to be paid in the month following the month it
was incurred and 40% is to be paid one month later.
7. Fixed overheads are £4000 per month. One quarter of this is paid in the month incurred,
one half in the following month, and the remainder represents depreciation on the
second-hand machinery.
8. Amounts receivable: a 5% cash discount is allowed for payment in the current month
and 20% of each month’s sales qualify for this discount. 50% of each month’s sales are
received in the following month, 20% in the third month and 8% in the fourth month.
The balance of 2% represents anticipated bad debts.
You are required to:
(a) (i) prepare a cash budget for each of the first four months, assuming that overdraft
facilities will be available; (17 marks)
(ii) state the amount receivable from customers in May; (4 marks)
(b) describe briefly the benefits to cash budgeting from the use of a particular type of
software package. (4 marks)
(Total 25 marks)
CIMA Stage 2 Cost Accounting 2
Question SM 13.4 BDL plc is current preparing its cash budget for the year to 31 March 2016. An extract from
its sales budget for the same year shows the following sales values: £
March 60 000
April 70 000
May 55 000
June 65 000
40% of its sales are expected to be for cash. Of its credit sales, 70% are expected to pay
in the month after sale and take a 2% discount; 27% are expected to pay in the second
month after the sale, and the remaining 3% are expected to be bad debts. The value of sales receipts to be shown in the cash budget for May is:
A £38 532
B £39 120
C £60 532
D £64 220
E £65 200
CIMA Stage 2
THE BUDGETING PROCESS 54 68

A company is preparing a production budget for the next year. The following Question SM 13.5
information is relevant:
Budgeted sales 10 000 units
Opening stock 600 units Closing stock 5% of budgeted sales
The production process is such that 10% of the units produced are rejected.
What is the number of units required to be produced to meet demand?
A 8900 units B 9900 units C 10 900 units D 11 000 units
A company has the following budget for the next month:
Finished product
Sales 7000 units
Production units 7200 units
Materials
Usage per unit 3 kg
Opening stock 400 kg
Closing stock 500 kg
What is the material purchases budget for the month?
(a) 20 900 kg
(b) 21 100 kg
(c) 21 500 kg
(d) 21 700 kg
ACCA − Financial Information for Management
THE BUDGETING PROCESS
53 69
Question SM 13.6

D plc operates a retail business. Purchases are sold at cost plus 25 per cent.
The management team are preparing the cash budget and have gathered the
following data:
1 The budgeted sales are as follows:
Month £000
July 100
August 90
September 125
October 140
2 It is management policy to hold inventory at the end of each month which is
sufficient to meet sales demand for the next half month. Sales are budgeted to
occur evenly during each month.
3 Creditors are paid one month after the purchase has been made.
Calculate the entries for purchases that will be shown for August, September
and October.
(3 marks)
CIMA P1 Management Accounting: Performance Evaluation
THE BUDGETING PROCESS 70
Question SM 13.7

The Viking Smelting Company established a division, called the reclamation division,two years ago, to extract silver from jewellers’ waste materials. The waste materialsare processed in a furnace, enabling silver to be recovered. The silver is then furtherprocessed into finished products by three other divisions within the company.
A performance report is prepared each month for the reclamation division whichis then discussed by the management team. Sharon Houghton, the newlyappointed financial controller of the reclamation division, has recently preparedher first report for the four weeks to 31 May. This is shown below:
Performance Report Reclamation Division4 weeks to 31 May
Actual Budget Variance Comments
Production (tonnes) 200 250 50 (F)a
(£) (£) (£)Wages and social security costs 46 133 45 586 547 (A) OverspendFuel 15 500 18 750 3 250 (F)Consumables 2 100 2 500 400 (F)Power 1 590 1 750 160 (F)Divisional overheads 21 000 20 000 1 000 (A) OverspendPlant maintenance 6 900 5 950 950 (A) OverspendCentral services 7 300 6 850 450 (A) OverspendTotal 100 523 101 386 863 (F)a(A) = adverse, (F) = favourable
In preparing the budgeted figures, the following assumptions were made for May:
• the reclamation division was to employ four teams of six production employees;• each employee was to work a basic 42-hour week and be paid £7.50 per hour
for the four weeks of May;• social security and other employment costs were estimated at 40% of basic wages;• a bonus, shared amongst the production employees, was payable if production
exceeded 150 tonnes. This varied depending on the output achieved;
1. if output was between 150 and 199 tonnes, the bonus was £3 per tonne produced;2. if output was between 200 and 249 tonnes, the bonus was £8 per tonne produced;3. if output exceeded 249 tonnes the bonus was £13 per tonne produced;
• the cost of fuel was £75 per tonne;• consumables were £10 per tonne;• power comprised a fixed charge of £500 per four weeks plus £5 per tonne for
every tonne produced;• overheads directly attributable to the division were £20 000;• plant maintenance was to be apportioned to divisions on the basis of the
capital values of each division;• the cost of Viking’s central services was to be shared equally by all four divisions.
Preparation of aflexible budgetperformancereport
MANAGEMENT CONTROL SYSTEMS 55
Management control systems
Question SM 14.1
71

You are the deputy financial controller of the reclamation division. After attendingher first monthly meeting with the board of the reclamation division, SharonHoughton arranges a meeting with you. She is concerned about a number of issues,one of them being that the current report does not clearly identify those expensesand variances which are the direct responsibility of the reclamation division.
Task 1Sharon Houghton asks you to prepare a flexible budget report for the reclamationdivision for May in a form consistent with responsibility accounting.
On receiving your revised report. Sharon tells you about the other questionsraised at the management meeting when the original report was presented. Theseare summarised below:
(i) Why are the budget figures based on two-year-old data taken from the proposalrecommending the establishment of the reclamation division?
(ii) Should the budget data be based on what we were proposing to do or whatwe actually did do?
(iii) Is it true that the less we produce the more favourable our variances will be?(iv) Why is there so much maintenance in a new division with modern equip-
ment and why should we be charged with the actual costs of the maintenancedepartment even when they overspend?
(v) Could the comments, explaining the variances, be improved?(vi) Should all the variances be investigated?
(vii) Does showing the cost of central services on the divisional performancereport help control these costs and motivate the divisional managers?
Task 2Prepare a memo for the management of the reclamation division. Your memo should:
(a) answer their queries and justify your comments;(b) highlight the main objective of your revised performance report developed in
Task 1 and give two advantages of it over the original reportAAT Technicians Stage
You work as the assistant to the management accountant for Henry Limited, amedium-sized manufacturing company. One of its products, product P, has beenvery successful in recent years, showing a steadily increasing trend in sales vol-umes. Sales volumes for the four quarters of last year were as follows:
Quarter Quarter Quarter Quarter1 2 3 4
Actual sales volume (units) 420 000 450 000 475 000 475 000
A new assistant has recently joined the marketing department and she has askedyou for help in understanding the terminology which is used in preparing salesforecasts and analysing sales trends. She has said: ‘My main problem is that I do notsee why my boss is so enthusiastic about the growth in product P’s sales volume. Itlooks to me as though the rate of growth is really slowing down and has actuallystopped in quarter 4. I am told that I should be looking at the deseasonalised or sea-sonally adjusted sales data but I do not understand what is meant by this.’
You have found that product P’s sales are subject to the following seasonalvariations:
Quarter Quarter Quarter Quarter1 2 3 4
Seasonal variation (units) +25 000 +15 000 0 –40 000
Sales forecastingremovingseasonalvariations, flexiblebudgets andbudgetpreparation
56 MANAGEMENT CONTROL SYSTEMS
Question SM 14.2
72

Task 1(a) Adjust for the seasonal variations to calculate deseasonalised or seasonally
adjusted sales volume (i.e. the trend figures) for each quarter of last year.(b) Assuming that the trend and seasonal variations will continue, forecast the
sales volumes for each of the four quarters of next year.
Task 2Prepare a memorandum to the marketing assistant which explains:
(a) what is meant by seasonal variations and deseasonalised or seasonally adjusteddata;
(b) how they can be useful in analysing a time series and preparing forecasts.
Use the figures for product P’s sales to illustrate your explanations.
Task 3Using the additional data below, prepare a further memorandum to the marketingassistant which explains the following:
(a) why fixed budgets are useful for planning but flexible budgets may be more use-ful to enable management to exercise reflective control over distribution costs,
(b) two possible activity indicators which could be used as a basis for flexing thebudget for distribution costs,
(c) how a flexible budget cost allowance is calculated and used for controlpurposes. Use your own examples and figures where appropriate to illustrateyour explanations.
Additional data:The marketing assistant has now approached you for more help in understandingthe company’s planning and control systems. She has been talking with the distrib-ution manager, who has tried to explain how flexible budgets are used to controldistribution costs within Henry Limited. She makes the following comment. ‘Ithought that budgets were supposed to provide a target to plan our activities andagainst which to monitor our costs. How can we possibly plan and control ourcosts if we simply change the budgets when activity levels alter?’
Product Q is another product which is manufactured and sold by Henry Limited.In the process of preparing budgetary plans for next year the following informationhas been made available to you.
1. Forecast sales units of product Q for the year = 18 135 units.2. Closing stocks of finished units of product Q at the end of next year will be
increased by 15% from their opening level of 1200 units.3. All units are subject to quality control check. The budget plans are to allow for
1% of all units checked to be rejected and scrapped at the end of the process.All closing stocks will have passed this quality control check.
4. Five direct labour hours are to be worked for each unit of product Q processed,including those which are scrapped after the quality control check. Of the totalhours to be paid for, 7.5% are budgeted to be idle time.
5. The standard hourly rate of pay for direct employees is £6 per hour.6. Material M is used in the manufacture of product Q. One finished unit of Q
contains 9 kg of M but there is a wastage of 10% of input of material M due toevaporation and spillage during the process.
7. By the end of next year stocks of material M are to be increased by 12% fromtheir opening level of 8000 kg. During the year a loss of 1000 kg is expected dueto deterioration of the material in store.
Task 4Prepare the following budgets for the forthcoming year:
(a) production budget for product Q, in units;(b) direct labour budget for product Q, in hours and in £;
MANAGEMENT CONTROL SYSTEMS 5773

(c) material usage budget for material M, in kg;(d) material purchases budget for material M, in kg.
Task 5The supplier of material M was warned that available supplies will be below theamount indicated in your budget for Task 4 part (d) above. Explain the implicationsof this shortage and suggest four possible actions which could be taken to overcomethe problem. For each suggestion, identify any problems which may arise.
AAT Technicians Stage
DataRivermede Ltd makes a single product called the Fasta. Last year, Steven Jones, themanaging director of Rivermede Ltd, attended a course on budgetary control. As aresult, he agreed to revise the way budgets were prepared in the company. Ratherthan imposing targets for managers, he encouraged participation by senior man-agers in the preparation of budgets.
An initial budget was prepared but Mike Fisher, the sales director, felt that thebudgeted sales volume was set too high. He explained that setting too high a bud-geted sales volume would mean his sales staff would be de-motivated because theywould not be able to achieve that sales volume. Steven Jones agreed to use therevised sales volume suggested by Mike Fisher.
Both the initial and revised budgets are reproduced below complete with theactual results for the year ended 31 May.
Rivermede Ltd – budgeted and actual costs for the year ended 31 May
Fast Variancesproduction Original Revised Actual from revisedand sales budget budget results budget(units) 24 000 20 000 22 000 2000 (F)
(£) (£) (£) (£)
Variable costsMaterial 216 000 180 000 206 800 26 800 (A)Labour 288 000 240 000 255 200 15 200 (A)
Semi-variable costsHeat, light and power 31 000 27 000 33 400 6 400 (A)
Fixed costsRent, rates and depreciation 40 000 40 000 38 000 2 000 (F)
575 000 487 000 533 400 46 400 (A)
Assumptions in the two budgets
1. No change in input prices2. No change in the quantity of variable inputs per Fasta
As the management accountant at Rivermede Ltd, one of your tasks is to check thatinvoices have been properly coded. On checking the actual invoices for heat, lightand power for the year to 31 May, you find that one invoice for £7520 had beenincorrectly coded. The invoice should have been coded to materials.
Task 1(a) Using the information in the original and revised budgets, identify:
• the variable cost of material and labour per Fasta;• the fixed and unit variable cost within heat, light and power.
(b) Prepare a flexible budget, including variances, for Rivermede Ltd after correctingfor the miscoding of the invoice.
DataOn receiving your flexible budget statement, Steven Jones states that the totaladverse variance is much less than the £46 400 shown in the original statement. He
Preparation offlexible budgets
58 MANAGEMENT CONTROL SYSTEMS
Question SM 14.3
74

also draws your attention to the actual sales volume being greater than in therevised budget. He believes these results show that a participative approach tobudgeting is better for the company and wants to discuss this belief at the nextboard meeting. Before doing so, Steven Jones asked for your comments.
Task 2Write a memo to Steven Jones. Your memo should:
(a) briefly explain why the flexible budgeting variances differ from those in theoriginal statement given in the data to task 1;
(b) give two reasons why a favourable cost variance may have arisen other thanthrough the introduction of participative budgeting;
(c) give two reasons why the actual sales volume compared with the revisedbudget’s sales volume may not be a measure of improved motivation followingthe introduction of participative budgeting.
AAT Technicians Stage
DataHappy Holidays Ltd sells holidays to Xanadu through newspaper advertisements.Tourist are flown each week of the holiday season to Xanadu, where they take a 10-
regression formula to help forecast the demand for its holidays.You are employed by Happy Holidays as an accounting technician in the finan-
cial controller’s department. A colleague of yours has recently used the least-squares regression formula on a spreadsheet to estimate the demand for holidaysper year. The resulting formula was:
y = 640 + 40x
Task 1(a) Use the least-squares regression formula developed by your colleague to
(b) In preparation for a budget meeting with the financial controller, draft a briefnote. Your note should identify three weaknesses of the least-squares regressionformula in forecasting the weekly demand for holidays in Xanadu.
DataThe budget and actual costs for holidays to Xanadu for the 10 days ended
Happy Holidays Ltd Cost Statement
Fixedbudget Actual Variances
(£) (£) (£)
Aircraft seats 18 000 18 600 600 ACoach hire 5 000 4 700 300 FHotel rooms 14 000 14 200 200 AMeals 4 800 4 600 200 FTour guide 1 800 1 700 100 FAdvertising 2 000 1 800 200 FTotal costs 45 600 45 600 0Key: A = adverse, F = favourable
Demand forecastsand preparationof flexiblebudgets
MANAGEMENT CONTROL SYSTEMS 59
day touring holiday. In the current financial year, Happy Holidays began to use the least-squares
where y is the annual demand and x is the year. The data started with the number of holidays sold seven years prior to the current financial year and was identified in the formula as year 1. In each subsequent year the value of x increases by 1 so, for example, the current financial year was year 8. To obtain the weekly demand the result is divided by 25, the number of weeks Happy Holidays operates in Xanadu.
estimate the weekly demand for holidays in Xanadu for the next year.
27 November of the current year is reproduced below.
10 days ended 27 November
Question SM 14.4
75

The financial controller gives you the following additional information:
Cost and volume information
• each holiday lasts 10 days;• meals and hotel rooms are provided for each of the 10 days;• the airline charges £450 per return flight per passenger for each holiday but the
airline will only sell seats at this reduced price if Happy Holidays purchasesseats in blocks of 20;
• the costs of coach hire, the tour guide and advertising are fixed costs;• the cost of meals was budgeted at £12 per tourist per day;• the cost of a single room was budgeted at £60 per day;• the cost of a double room was budgeted at £70 per day;• 38 tourists travelled on the holiday requiring 17 double rooms and 4 single
rooms;
Sales information
• the price of a holiday is £250 more if using a single room.
Task 2Write a memo to the financial controller. Your memo should:
(a) take account of the cost and volume information to prepare a revised coststatement using flexible budgeting and identifying any variances;
(b) state and justify which of the two cost statements is more useful formanagement control of costs;
(c) identify three factors to be taken into account in deciding whether or not toinvestigate individual variances.
AAT Technicians Stage
60 MANAGEMENT CONTROL SYSTEMS
(a) Explain what is meant by the terms ‘fi xed budget’ and ‘fl exible budget’, and state the main objective of preparing fl exible budgets.
(5 marks)(b) (i) Prepare a fl exible budget for 20X5 for the overhead expenses of a produc-
tion department at the activity levels of 80%, 90% and 100%, using the information listed below.
(12 marks) 1. The direct labour hourly rate is expected to be £3.75. 2. 100% activity represents 60 000 direct labour hours. 3. Variable costs:
Indirect labour £0.75 per direct labour hourConsumable supplies £0.375 per direct labour hourCanteen and other welfare services
6% of direct and indirect labour costs
4. Semi-variable costs are expected to correlate with the direct labour hours in the same manner as for the last fi ve years, which was:
Direct Year labour Hours Semi-variable Costs (£)20X0 64 000 20 80020X1 59 000 19 80020X2 53 000 18 60020X3 49 000 17 80020X4 40 000 16 000
(estimate) (estimate)
Question SM 14.5 Fixed and fl exible budgets
76

5. Fixed costs:
(£)
Depreciation 18 000 Maintenance 10 000 Insurance 4 000 Rates 15 000 Management salaries 25 000
6. Inflation is to be ignored. (ii) Calculate the budgets cost allowance for 20X5 assuming that 57 000 direct labour hours
are worked. (3 marks)
CIMA Cost Accounting 1
Flexible budgets and variance analysis A company has obtained the following information regarding costs and revenue for the past
financial year:
Original budget:
Sales 10 000 units
Production 12 000 units
Standard cost per unit:
£
Direct materials 5
Direct labour 9
Fixed production overheads 8
22
Selling price 30
Actual results:
Sales 9750 units
Revenue £325 000
Production 11 000 units
Material cost £65 000
Labour cost £100 000
Fixed production overheads £95 000
There were no opening stocks.
Required:
(a) Produce a flexed budget statement showing the flexed budget and actual results.
(b) Calculate the variances between the actual and flexed figures for the following:
• sales;
• materials;
• labour; and
• fixed production overhead.
(7 marks)
(c) Explain briefly how the sales and materials variances calculated in (a) may have
arisen.
(3 marks)
ACCA Paper 1.2 – Financial Information for Management
MANAGEMENT CONTROL SYSTEMS 59 77
Question SM 14.6


SK Limited makes and sells a single product ‘Jay’ for which the standard cost isas follows:
£ per unit
Direct materials 4 kilograms at £12.00 per kg 48.00Direct labour 5 hours at £7.00 per hour 35.00Variable production overhead 5 hours at £2.00 per hour 10.00Fixed production overhead 5 hours at £10.00 per hour 50.00
143.00
The variable production overhead is deemed to vary with the hours worked.Overhead is absorbed into production on the basis of standard hours of produc-
tion and the normal volume of production for the period just ended was 20 000units (100 000 standard hours of production).
For the period under consideration, the actual results were:
18 000units
Production of ‘Jay’ (£)
Direct material used – 76 000 kg at a cost of 836 000Direct labour cost incurred – for 84 000 hours worked 604 800Variable production overhead incurred 172 000Fixed production overhead incurred 1 030 000
You are required(a) to calculate and show, by element of cost, the standard cost for the output for
the period; (2 marks)(b) to calculate and list the relevant variances in a way which reconciles the standard
cost with the actual cost (Note: Fixed production overhead sub-variances ofcapacity and volume efficiency (productivity) are not required); (9 marks)
(c) to comment briefly on the usefulness to management of statements such asthat given in your answer to (b) above. (4 marks)
(Total 15 marks)CIMA Stage 2 Cost Accounting
JK plc operates a chain of fast-food restaurants. The company uses a standard mar-ginal costing system to monitor the costs incurred in its outlets. The standard costof one of its most popular meals is as follows:
Ingredients (1.08 units) 1.18Labour (1.5 minutes)Variable conversion costs (1.5 minutes)
The standard selling price of this meal is
Variance analysisand reconciliationof standard withactual cost
Reconciliation ofbudgeted andactualcontribution
STANDARD COSTING AND VARIANCE ANALYSIS 61
Standard costing and varianceanalysis
0.06
£ per meal
0.30
2.14
Question SM 15.1
Question SM 15.2
79

In one of its outlets, which has budgeted sales and production activity level of 50 000such meals, the number of such meals that were produced and sold during April
£
Ingredients (55 000 units) 58 450Labour (1 200 hours)Variable conversion costs (1 200 hours) 3 250
The actual revenue from the sale of the meals was
Required:(a) Calculate
(i)(ii) (3 marks)
(b) Present a statement that reconciles the budgeted and actual contribution for
possible. (17 marks)(c) Explain why a marginal costing approach to variance analysis is more
appropriate in environments such as that of JK plc, where there are a numberof different items being produced and sold. (5 marks)
(Total 25 marks)CIMA Management Accounting – Performance Management
A company manufactures two components in one of its factories. Material A is oneof several materials used in the manufacture of both components.
The standard direct labour hours per unit of production and budgeted productionquantities for a 13-week period were:
Standard Budgeteddirect labour production
hours quantities
Component X 0.40 hours 36 000 unitsComponent Y 0.56 hours 22 000 units
Throughout the 13-week period 53 direct workers were employed, working astandard 40-hour week.
The following actual information for the 13-week period is available:
Production:Component X, 35 000 unitsComponent Y, 25 000 units
Material A purchases, 47 000 kilos costing £85 110Material A price variance, £430 FMaterial A usage (component X), 33 426 kilosMaterial A usage variance (component X), £320.32 A
Required:(a) Calculate the direct labour variances for the period; (5 marks)(b) Calculate the standard purchase price for material A for the period and the
standard usage of material A per unit of production of component X. (8 marks)(c) Describe the steps, and information, required to establish the material purchase
quantity budget for material A for a period. (7 marks)(Total 20 marks)
ACCA Cost and Management Accounting 1
Calculation of
and actualmaterial inputsworkingbackwards fromvariances
62 STANDARD COSTING AND VARIANCE ANALYSIS
was 49 700. The actual cost data was as follows:
the total budgeted contribution for April;the total actual contribution for April.
April. Show all variances to the nearest £1 and in as much detail as
The standard wage rate for all direct workers was £14 per hour.
Direct wages paid, £386 540
103 935
labour variances
Question SM 15.3
80
13 600

You have been provided with the following data for S plc for September:
Accounting method: Absorption MarginalVariances: (£) (£)
Selling price 1900 (A) 1900 (A)Sales volume 4500 (A) 7500 (A)Fixed overhead expenditure 2500 (F) 2500 (F)Fixed overhead volume 1800 (A) n/a
During September production and sales volumes were as follows:
Sales Production
Budget 10 000 10 000Actual 9 500 9 700
Required:(a) Calculate:
(i) the standard contribution per unit;(ii) the standard profit per unit;
(iii) the actual fixed overhead cost total. (9 marks)(b) Using the information presented above, explain why different variances are
calculated depending upon the choice of marginal or absorption costing.(8 marks)
(c) Explain the meaning of the fixed overhead volume variance and its usefulnessto management. (5 marks)
(d) Fixed overhead absorption rates are often calculated using a single measure ofactivity. It is suggested that fixed overhead costs should be attributed to costunits using multiple measures of activity (activity-based costing).
Explain ‘activity-based costing’ and how it may provide useful informationto managers.
(Your answer should refer to both the setting of cost driver rates and subsequentoverhead cost control.) (8 marks)
(Total 30 marks)CIMA Operational Cost Accounting Stage 2
JC Limited produces and sells one product only, Product J, the standard cost forwhich is as follows for one unit.
(£)
Direct material X – 10 kilograms at £20 200Direct material Y – 5 litres at £6 30
Fixed production overhead 50Total standard costStandard gross profitStandard selling price
The fixed production overhead is based on an expected annual output of 10 800units produced at an even flow throughout the year; assume each calendar monthis equal. Fixed production overhead is absorbed on direct labour hours.
Comparison ofabsorption andmarginal costingvariances
Calculation oflabour, materialand overheadvariances plusappropriateaccountingentries
STANDARD COSTING AND VARIANCE ANALYSIS 63
Direct wages – 5 hours at £14 70
350
44090
Question SM 15.4
Question SM 15.5
81

During April, the first month of the financial year, the following were the actualresults for an actual production of 800 units.
(£)
Sales on credit:
Direct materials:X 7800 kilogrammes 159 900Y 4300 litres 23 650
Direct wages: 4200 hoursFixed production overhead 47 000
Gross profit
The material price variance is extracted at the time of receipt and the raw materialsstores control is maintained at standard prices. The purchases, bought on credit,during the month of April were:
X 9000 kilograms at £20.50 per kg from K LimitedY 5000 litres at £5.50 per litre from C plc.
Assume no opening stocks.Wages owing for March brought forward were £6000.
Deductions from wages owing to the Inland Revenue for PAYE and NI were£5000 and the wages accrued for April were £5000.
£33 000, none of which was paid in April, and depreciation of £14 000.The company operates an integrated accounting system.
You are required to(a) (i) calculate price and usage variances for each material,
(ii) calculate labour rate and efficiency variances,(iii) calculate fixed production overhead expenditure, efficiency and volume
variances; (9 marks)(b) show all the accounting entries in T accounts for the month of April – the
work-in-progress account should be maintained at standard cost and eachbalance on the separate variance accounts is to be transferred to a Profit andLoss Account which you are also required to show; (18 marks)
(c) explain the reason for the difference between the actual gross profit given inthe question and the profit shown in your profit and loss account. (3 marks)
(Total 30 marks)CIMA Stage 2 Cost Accounting
64 STANDARD COSTING AND VARIANCE ANALYSIS
352 000800 units at £440
57 750
288 300
The fixed production overhead of £47 000 was made up of expense creditors of
63 700
Wages paid during April (net) £53 750.
A company uses absorption costing for both internal and external reporting purposes as it has a considerable level of fi xed production costs.
The following information has been recorded for the past year:
Budgeted fi xed production overheads £2 500 000Budgeted (Normal) activity levels:Units 62 500 unitsLabour hours 500 000 hoursActual fi xed production overheads £2 890 350Actual levels of activity:Units produced 70 000 unitsLabour hours 525 000 hours
Question SM 15.6 Calculation of absorption costing fi xed overhead variances
82

STANDARD COSTING AND VARIANCE ANALYSIS 63
Required:(a) Calculate the fi xed production overhead expenditure and volume variances and
briefl y explain what each variance shows.(5 marks)
(b) Calculate the fi xed production overhead effi ciency and capacity variances and briefl y explain what each variance shows.
(5 marks) ACCA Paper 1.2 – Financial Information for Management
Standard direct labour cost of one unit of product Q (0.25 hours × $12.00 per hour) is $3.00.
The eight employees who make product Q work a seven-hour day. In a recent three-day period, results were as follows:
Actual units produced 650 unitsActual wages cost $2275
During this period, there was a power failure. This meant that all work had to stop for 2 hours.(a) If the company reports idle time separately, the labour effi ciency variance for the
period is (i) $258 (A) (ii) $126 (A) (iii) $42 (F) (iv) $126 (F)(b) The labour rate variance for the period is (i) $451 (A) (ii) $259 (A) (iii) $266 (F) (iv) $375 (F)
CIMA – Management Accounting Fundamentals
QR Limited uses a standard absorption costing system. The following details have been extracted from its budget for April:
Fixed production overhead cost £48 000Production (units) 4 800
In April the fi xed production overhead cost was under-absorbed by £8000 and the fi xed production overhead expenditure variance was £2000 adverse.The actual number of units produced was:
A 3800B 4000C 4200D 5400E 5800
CIMA Stage 2
Question SM 15.7
Question SM 15.8
83

Question SM 15.9
Question SM 15.10
Question SM
15.11
Bowen has established the following with regard to fixed overheads for the past month:
Actual costs incurred £132 400
Actual units produced 5000 units
Actual labour hours worked 9750 hours Budgeted costs £135 000 Budgeted units of production 4500 units Budgeted labour hours 9000 hours
Overheads are absorbed on a labour hour basis. What was the fixed overhead capacity variance?
A £750 favourable B £11 250 favourable C £22 500 favourable D £11 250 adverse.
ACCA Paper 1.2 – Financial Information for Management
S Ltd makes a single product. The budget for October 2016 contained the following details:
Sales volume 12 000 units Selling price per unit $15.00 Cost per unit $9.50
The actions of a competitor and an unexpected fall in material prices meant that actual
results were:
Sales volume 10 800 units Selling price per unit $13.50 Cost per unit $8.70
The total sales margin variance for October was
A $22 800 (A) B $14 160 (A) C $7560 (A) D $9600 (A)
CIMA – Management Accounting Fundamentals
A company uses variance analysis to control costs and revenues. Information
concerning sales is as follows:
Budgeted selling price £15 per unit Budgeted sales units 10 000 units
Budgeted profit per unit £5 per unit
Actual sales revenue £151 500 Actual units sold 9800 units
What is the sales volume profit variance? A £500 favourable
B £1000 favourable C £1000 adverse D £3000 adverse
ACCA Paper 1.2 – Financial Information for Management
STANDARD COSTING AND VARIANCE ANALYSIS 64 84

A company is reviewing actual performance to budget to see where there are dif-
ferences. The following standard information is relevant:
£ per unit
Selling price 50
Direct materials 4
Direct labour 16
Fixed production overheads 5
Variable production overheads 10
Fixed selling costs 1
Variable selling cost 1
Total costs 37
Budgeted sales units 3000
Actual sales units 3500
What was the favourable sales volume variance using marginal costing? A £9500 B £7500 C £7000
D £6500
ACCA Paper 1.2 – Financial Information for Management
Q plc used standard costing. The details for April were as follows:
Budgeted output 15 000 units
Budgeted labour hours 60 000 hours
Budgeted labour cost £540 000
Actual output 14 650 units
Actual labour hours paid 61 500 hours
Productive labour hours 56 000 hours
Actual labour cost £522 750
Calculate the idle time and labour efficiency variances for April
(4 marks)
CIMA P1 Management Accounting: Performance Evaluation
Casilda Ltd manufactures gonds, which have a standard selling price of £120 per gond.
The company operates a standard marginal costing system and values stocks at standard
cost.The standard variable cost of a gond is as follows: £ per gond
Direct material 20
Direct labour (6 hours at £8 per
hour)
48
Production overhead 24
92
The budgeted and actual activity levels for last month were as follows:
Budget units Actual units
Sales 25 000 25 000
Production 25 000 26 000
The actual sales and variable costs for last month were as follows:
STANDARD COSTING AND VARIANCE ANALYSIS
63 85
Question SM 15.13
Question SM
15.12
Question SM 15.14

£
Sales 2 995 000
Direct labour (purchased and used) 532 800
Direct labour (150 000 hours) 1 221 000
Variable production overhead 614 000
Required: (a) Calculate the following cost variances for last month:
(i) Total direct materials;
(ii) Total variable production overhead;
(iii) Direct labour rate;
(iv) Direct labour efficiency.
(4 marks)
(b) Prepare a statement that reconciles the budgeted contribution with the
actual contribution for last month and which incorporates the variances
calculated in (a).
(6 marks)
(c) Suggest ONE possible explanation of how the direct labour variance
calculated in (a) could be interrelated.
(2 marks)
(12 marks)
ACCA Financial Information for Management
Fairfax Ltd manufactures a single product which has a standard selling
price of £22 per unit. It operates a standard marginal costing system.
The standard variable production cost is £9 per unit. Budgeted annual
production is 360 000 units and budgeted non-production costs of
£1 152 000 per annum are all fixed. The following data relate to
last month:
Budget units Actual units
Production 30 000 33 000
Sales 32 000 34 000
Required:
(a) Calculate the sales price and sales volume contribution variances for
last month showing clearly whether each variance is favourable or adverse.
(4 marks)
(b) Explain how the two variances calculated in (a) could be interrelated.
(3 marks)
(c) Calculate the BUDGETED profit for last month assuming that the company
was using absorption costing.
(4 marks)
ACCA Financial Information for Management
BS Limited manufactures one standard product and operates a system
of variance accounting using a fixed budget. As assistant management
accountant, you are responsible for preparing the monthly operating
statements. Data from the budget, the standard product cost and actual
data for the month ended 31 October are given below.
Using the data given, you are required to prepare the operating statement
for the month ended 31 October to show the budgeted profit; the variances
for direct materials, direct wages, overhead and sales, each analyzed into
causes; and actual profit.
Budgeted sales and production for the month: 10 000 units Standard
cost for each unit of product:
STANDARD COSTING AND VARIANCE ANALYSIS
63 85a
Question SM 15.15
Question SM 15.16

Direct material: X: 10 kg at £1 per kg
Y: 5 kg at £5 per kg
Direct wages: 5 hours at £8 per hour
Budgeted fixed overheads are £300 000
Budgeted sales price has been calculated to give a contribution of
50 per cent of the selling price.
Actual data for the month ended 31 October: Production: 9500 units sold at a price of £160
Direct materials consumed:
X: 96 000 kg at £1.20 per kg
Y: 48 000 kg at £4.70 per kg
Direct wages incurred 46 000 hours at £8.20 per hour
Fixed production overhead incurred £290 000
(30 marks)
STANDARD COSTING AND VARIANCE ANALYSIS 63 85b

The application of linear programming to management accounting (Questions
relating to Learning Note 11.1)
The fixed production cost per unit is based upon an absorption rate of £20 per direct labour hour and a total annual production activity of 90 000 direct labour hours. One-twelfth of
the annual fixed production cost will be incurred in period 1.
In addition to the above costs, non-production overhead costs are expected to be £57 750
in period 1.
During period 1, the availability of material P is expected to be limited to 31 250 litres.
Other materials and sufficient direct labour are expected to be available to meet demand.
It is MF plc’s policy not to hold stocks of finished goods.
Required:
(a) Calculate the number of units of product types M and F that should be produced and
sold in period 1 in order to maximize profit. (4 marks)
(b) Using your answer to (a) above, prepare a columnar budgeted profit statement for period
1 in a marginal cost format. (4 marks)
After presenting your statement to the budget management meeting, the production manager
has advised you that in period 1 the other resources will also be limited. The maximum
resources available will be:
Material P 31 250 litres
Material Q 20 000 litres
Direct labour 8 750 hours
It has been agreed that these factors should be incorporated into a revised plan and that the
objective should be to make as much profit as possible from the available resources.
THE APPLICATION OF LINEAR PROGRAMMING TO MANAGEMENT ACCOUNTING
Question SM 1
Optimal output
and calculation of
shadow prices
using graphical
approach
MF plc manufactures and sells two types of product to a number of customers. The company
is currently preparing its budget for the year ending 31 December 2016 which it divides into
12 equal periods.
The cost and resource details for each of the company’s product types are as follows:
Selling price per unit
Variable costs per unit
Direct material P (£2.50 per litre)
Direct material Q (£4.00 per litre)
Direct labour (£14 per hour)
Overhead (£4.00 per hour)
Fixed production cost per unit
Maximum sales demand in period 1
Product type M
£
200
20
40
28
16
40
Units
1000
Product type F
£
210
25
20
35
20
50
Units
3000
42 86

Required:(c) Use graphical linear programming to determine the revised production plan
for period 1. State clearly the number of units of product types M and F that areto be produced. (10 marks)
(d) Using your answer to part (c) above, calculate the profit that will be earnedfrom the revised plan. (3 marks)
(e) Calculate and explain the meaning of the shadow price for material Q. (5 marks)(f) Discuss the other factors that should be considered by MF plc in relation to the
revised production plan. (4 marks)(Total 30 marks)
CIMA Management Accounting – Performance Management
A company manufactures two products (X and Y) in one of its factories. Productioncapacity is limited to 85 000 machine hours per period. There is no restriction ondirect labour hours.
The following information is provided concerning the two products:
Product ProductX Y
Estimated demand (000 units) 315 135Selling price (per unit) £11.20 £15.70Variable costs (per unit) £6.30 £8.70Fixed costs (per unit) £4.00 £7.00Machine hours (per 000 units) 160 280Direct labour hours (per 000 units) 120 140
Fixed costs are absorbed into unit costs at a rate per machine hour based uponfull capacity.
Required:(a) Calculate the production quantities of Products X and Y which are required per
period in order to maximise profit in the situation described above. (5 marks)(b) Prepare a marginal costing statement in order to establish the total contribution
of each product, and the net profit per period, based on selling the quantitiescalculated in (a) above. (4 marks)
(c) Calculate the production quantities of Products X and Y per period whichwould fully utilise both machine capacity and direct labour hours, where theavailable direct labour hours are restricted to 55 000 per period. (The limit of85 000 machine hours remains.) (5 marks)
(Total 14 marks)ACCA Foundation Paper 3
Limiting factoroptimumproduction andthe use ofsimultaneousequations wheremore than onescarce factorexists
THE APPLICATION OF LINEAR PROGRAMMING TO MANAGEMENT ACCOUNTING 43
Question SM 2
87


Decision-making under conditions of risk and uncertainty (Questions
relating to Learning Note 11.4)
The Dunburgh Bus Company operated during the year ended 31 May 2015 with the following results: (i) Average variable costs were £0.75 per bus mile.
(ii) Total fixed costs were £1 750 000. (iii) The fare structure per journey was as follows:
Adults 0 to 3 miles £0.20
4 to 5 miles £0.30
over 5 miles £0.50
Juveniles (any distance) £0.15
Senior citizens (any distance) £0.10
(iv) Total passenger journeys paid for were 24 000 000 which represented 60%capacity
utilisation. The capacity utilised comprised 60% adult, 20% juvenile and 20% senior
citizen journeys. The adult journeys were broken down into 0–3 miles: 50%, 4–5 miles:
30%, over 5 miles: 20%.
(v) Twenty routes were operated with four buses per route, each bus covering150 miles
per day for 330 days of the year. The remaining days were taken up with maintenance
work on the buses.
(vi) Advertising revenue from displays inside and outside the buses totalled £250 000 for
the year. This is a fixed sum from contracts which will apply to each year up to 31
May 2017.
It is anticipated that all costs will increase by 10% due to inflation during the year
to 31 May 2016 and that fares will be increased by 5% during the year. Whilst the fare
increase of 5% has already been agreed and cannot be altered, it is possible that
inflation might differ from the 10% rate anticipated.
Required:
(a) Prepare a statement showing the calculation of the net profit or loss for the year ended
31 May 2015 (5 marks)
(b) Calculate the average percentage capacity utilisation at which the company will break
even during the forthcoming year to 31 May 2016 if all fares are increased by 5%, cost
inflation is 10% as anticipated and the passenger mix and bus operating activity are the
same as for the year to 31 May 2015. (5 marks)
(c) Now assume that management have some doubts about the level of capacity utilisation
and rate of cost inflation which will apply in the year to 31 May 2016. Other factors are
as previously forecast. Revised estimates of the likely levels of capacity utilisation and
inflation are as follows:
(Capacity utilisation rates and inflation rates are independent of each other.)
DECISION-MAKING UNDER CONDITIONS OF RISK AND UNCERTAINTY
Capacity
utilisation Probability Inflation Probability
70% 0.1 8% 0.3
60% 0.5 10% 0.6
50% 0.4 12% 0.1
47 89
Question SM 1 Calculation of expected value and the presentation of a probability distribution.

(i) Calculate the expected value of net profit or loss for the year to 31 May 2016 and show the range of profits or losses which may occur. (9 marks)
(ii) Draw up a table of the possible profits and losses and their probabilities as
calculated in (i) for the year ended 31 May 2016 in a way which brings to the
attention of management the risks and opportunities which are implied and
comment briefly on the figures. (5 marks)
(d) Comment on factors which have not been incorporated into the model used in (c)
above which may affect its usefulness to management in profit forecasting.
(6 marks)
(Total 30 marks)
ACCA Level 2 Cost Accounting
E Ltd manufactures a hedge-trimming device which has been sold at £16 per unit for a
number of years. The selling price is to be reviewed and the following information is
available on costs and likely demand.
The standard variable cost of manufacture is £10 per unit and an analysis of the cost
variances for the past 20 months show the following pattern which the production manager
expects to continue in the future.
Adverse variances of +10% of standard variable cost occurred in ten of the months.
Nil variances occurred in six of the months.
Favourable variances of –5% of standard variable cost occurred in four of the months.
Monthly data
Fixed costs have been £4 per unit on an average sales level of 20 000 units but these costs
are expected to rise in the future and the following estimates have been made for the total
fixed cost:
(£)
Optimistic estimate (Probability 0.3) 82 000
Most likely estimate (Probability 0.5) 85 000
Pessimistic estimate (Probability 0.2) 90 000
The demand estimates at the two new selling prices being considered are as follows:
If the selling
price/unit is £17 £18
demand would be:
Optimistic estimate
(Probability 0.2) 21 000 units 19 000 units
Most likely estimate
(Probability 0.5) 19 000 units 17 500 units
Pessimistic estimate
(Probability 0.3) 16 500 units 15 500 units
It can be assumed that all estimates and probabilities are independent.
You are required to
(a) advise management, based only on the information given above, whether they should
alter the selling price and, if so, the price you would recommend;
(6 marks)
(b) calculate the expected profit at the price you recommend and the resulting margin of
safety, expressed as a percentage of expected sales; (6 marks)
(c) criticise the method of analysis you have used to deal with the probabilities given in the
question; (4 marks)
(d) describe briefly how computer assistance might improve the analysis. (4 marks)
(Total 20 marks)
CIMA Stage 3 Management Accounting Techniques
DECISION-MAKING UNDER CONDITIONS OF RISK AND UNCERTAINTY 48 90
Question SM 2
Pricing decision
and the
calculation of
expected profit
and margin of
safety

Part II
Solutions


Solution SM 2.1In Chapters 1 and 2 it was pointed out that a management accounting system shouldgenerate information to meet the following requirements:
1. to allocate costs between cost of goods sold and inventories for internal andexternal profit measurement and inventory valuation;
2. to provide relevant information to help managers to make better decisions;3. to provide information for planning, control and performance measurement.
The question relates to how costs can be classified for meeting the planning, controland decision-making requirements.
Planning relates to the annual budgeting and long-term processes described in
• Behaviour – By classifying costs into fixed, variable, semi-fixed and semi-variable categories the outcomes from different activity levels can be examined.
• Function – Functions are the different responsibility centres within theorganisation. The budget is built up by the functional levels so that everyone inthe organisation has a clear understanding of the role that their responsibilitycentre has in achieving the annual budget.
• Expense type – Classifying by expense types provides useful information on thenature, content and trend of different expense categories that is useful forplanning how much should be authorised on spending within the differentcategories.
• Controllability – Classifying expenses by responsibility centres determines theindividuals who are accountable for achieving the budget and who shouldthus be involved in setting the budget for the specific responsibility centres.
The management function of control consists of the measurement, reporting and thesubsequent correction of performance in an attempt to ensure that a firm’s objectivesand plans are achieved. Within the control process costs can be classified by:
• Behaviour – Costs must be classified by behaviour for comparing actual and
for a description of flexible budgeting.• Function – For control, cost and revenues should be traced to the heads of the
responsibility centres who are responsible for incurring them. For a descriptionof this process you should refer to ‘Responsibility accounting’ in Chapter 2.
• Expense type – This will ensure that like items are compared with one anotherwhen budget and actual performance are compared and trends in revenuesand different expense categories are monitored.
• Controllability – Costs and revenues must be assigned to the responsibility headswho are made accountable for them so that effective control can be exercised.
• Relevance – Attention should only be focused on those expense categorieswhere there are significant deviations from the budget. Insignificant deviationsare not relevant for cost control. See ‘Management by exception’ in Chapter 1for a more detailed explanation of this point.
AN INTRODUCTION TO COST TERMS AND CONCEPTS 67
An introduction to cost terms andconceptsSolutions to Chapter 2 questions
Chapter 13. Within these processes costs can be classified by:
budgeted performance using flexible budgets. You should refer to Chapter 14
93

Decision-making involves choosing between alternative courses of actions. Thefollowing classifications are important for decision-making:
• By behaviour – Classification of costs by fixed, variable, semi-fixed and semi-variable is necessary for predicting future costs for alternative courses of action.In particular, classification is necessary for cost–volume–profit analysis andidentifying break-even levels. You should refer to Chapter 8 for a moredetailed discussion of these topics.
• By expense type – This is necessary to identify how different cost categories willchange as a result of pursuing alternative courses of action.
• By relevance – For decision-making it is necessary to distinguish betweenrelevant and irrelevant costs and revenues for alternative courses of action. Fora more detailed explanation you should refer to ‘Relevant and Irrelevant Costsand Revenues’ in Chapter 2.
It is apparent from the above discussion that costs should be classified in different
Solution SM 2.2(a) A large proportion of non-manufacturing costs are of a discretionary nature. In
respect of such costs, management has some significant range of discretion asto the amount it will budget for the particular activity in question. Examples ofdiscretionary costs (sometimes called managed or programmed costs) includeadvertising, research and development, and training costs. There is nooptimum relationship between inputs (as measured by the costs) and outputs
Furthermore, they are not predetermined by some previous commitment. Ineffect, management can determine what quantity of service it wishes topurchase. For example, it can choose to spend small or large amounts onresearch and development or advertising. The great difficulty in controllingsuch costs is that there is no established method for determining theappropriate amount to be spent in particular periods.
For a description of fixed and variable costs see Chapter 2. Examples of fixedcosts include depreciation of the factory building, supervisors’ salaries andleasing charges. Examples of variable costs include direct materials, power andsales commissions.
(b) The £500 000 is a sunk cost and cannot be avoided. It is therefore not a relevantcost for decision-making purposes. The project should be continued becausethe incremented/relevant benefits exceed the incremental/relevant costs:
(£000)Incremental benefits 350Incremental costs 200
Net incremental benefit 150
(c) An opportunity cost is a cost that measures the opportunity lost or sacrificedwhen the choice of one course of action requires that an alternative course ofaction be given up. The following are examples of opportunity costs:
(i) If scarce resources such as machine hours are required for a special contractthen the opportunity cost represents the lost profit that would have beenearned from the alternative use of the machine hours.
(ii) If an employee is paid £5 per hour and is charged out at £11 per hour for com-mitted work then, if that employee is redirected to other work, the lost contri-bution of £6 per hour represents the opportunity cost of the employee’s time.
68 AN INTRODUCTION TO COST TERMS AND CONCEPTS
ways for different purposes. This is explained in more detail in the final section
(as measured by revenues or some other objective function) for these costs.
in Chapter 2.
94

The CIMA terminology defines a notional cost as: ‘A hypothetical cost takeninto account in a particular situation to represent a benefit enjoyed by an entityin respect of which no actual cost is incurred.’ The following are examples ofnotional costs:
(i) interest on capital to represent the notional cost of using an asset ratherthan investing the capital elsewhere;
(ii) including rent as a cost for premises owned by the company so as to representthe lost rent income resulting from using the premises for business purposes.
Solution SM 2.3(a) See Chapter 2 for a description of opportunity costs. Out of pocket cost can be
viewed as being equivalent to incremental or relevant costs as described inChapter 2.
(b) Depreciation is not a relevant cost since it will be the same for both alternatives.It is assumed that tyres and miscellaneous represent the additional costsincurred in travelling to work. The relevant costs are:
Using the car to travel to work:(£)
Petrol 128Tyres and miscellaneous 52
180Contribution from passenger 120Relevant cost 60
Using the train:Relevant cost £188
(c) (£000) (£000) (%)Sales 2560.0 100Direct materials 819.2 32Direct wages 460.8 18Variable production overhead 153.6 6Variable administration/selling 76.8 3Total variable cost 1510.4 59Contribution 1049.6 41Fixed production overhead a 768 30Fixed administration/selling b 224 8.75
992Profit 57.6 2.25
Notesa100/80 � £2 560 000 � 0.24b100/80 � £2 560 000 � 0.07
AN INTRODUCTION TO COST TERMS AND CONCEPTS 69
2.17 Item (B) will be constant within the relevant range of output.Item (C) will be constant per unit.If output declines fi xed cost per unit will decrease. Total variable cost will fall in line with a decline in output and therefore item A is the correct answer.
Answer = B
Solution SM 2.4
Solution SM 2.5
95

70 ACCOUNTING FOR DIRECT COSTS
Solution SM 3.1(a)
(i) Y Z£ £
Time-based earningsGuaranteed minimum (80%)Piecework earningsEarnings
(ii) Time taken 40 hrsTime allowed (480 × 7/60) 45.5 hrs (390 ×7/60)Time saved 5.5 hrsBonus hours 9 hrs 4.125 hrs(75% of time saved)Hours paid 53 hrs 44.125 hrsEarnings
(b) Time rate bases are preferable when:(i) quality is more important than quantity;
(ii) employees have little control over their output.
Solution SM 3.2(a) For the answer to this question you should refer to the sections on categories of
manufacturing cost in Chapter 2 and accounting treatment of various labourcost items in Chapter 3.
(b) Current system:Total weekly wagesWeekly wage per employeeAverage output per employee 1000 units (6000 units/6)Labour cost per unit of outputNew system:Average output per employeeWeekly wage per employeeTotal weekly wagesLabour cost per unit of output
Note that the above calculations are based on the assumption that each indi-
case then total wages will differ slightly from the above figure.With time-based remuneration systems, workers are paid for the number of
hours attended at the basic wage rate. An additional premium over the base rateis paid for overtime. The merits of time-based systems are that they are simple toadminister and easy to understand. The weekly wage is known in advance anddoes not fluctuate with changes in output. Time rate systems have a number ofdisadvantages. In particular, there is no motivation to increase output, and thiscan result in a greater need for supervision. Time-based systems are most
Accounting for direct costsSolutions to Chapter 3 questions
528
12 hrs
422.40
56 hrs
537.60
44 hrs£537.60
£636
(44 × £12)
(480 × £1.12)£448
£617.75
(40 × £14)
(390 ×£1.12)
£480
48p (£2880/6000 units)
£2880 (6 × £480)
1100 units (6600 units/6)
vidual produces the average output of 1,100 units per week. If this is not the
£540 (800 × 48p) + (200 × 51p) + (100 × 54p)£3240 (£540 × 6)49.09p (£3240/6600 units)
96
560 448436.80
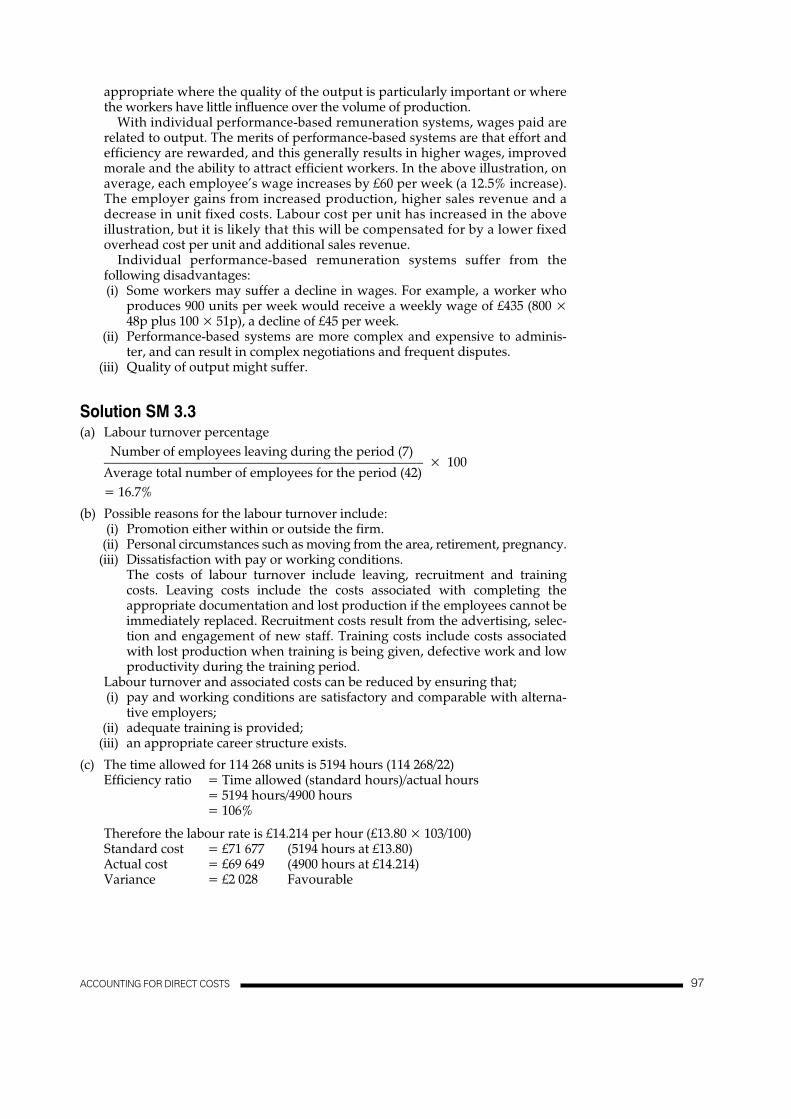
appropriate where the quality of the output is particularly important or wherethe workers have little influence over the volume of production.
With individual performance-based remuneration systems, wages paid arerelated to output. The merits of performance-based systems are that effort andefficiency are rewarded, and this generally results in higher wages, improvedmorale and the ability to attract efficient workers. In the above illustration, on
The employer gains from increased production, higher sales revenue and adecrease in unit fixed costs. Labour cost per unit has increased in the aboveillustration, but it is likely that this will be compensated for by a lower fixedoverhead cost per unit and additional sales revenue.
Individual performance-based remuneration systems suffer from thefollowing disadvantages:(i) Some workers may suffer a decline in wages. For example, a worker who
(ii) Performance-based systems are more complex and expensive to adminis-ter, and can result in complex negotiations and frequent disputes.
(iii) Quality of output might suffer.
Solution SM 3.3(a) Labour turnover percentage
Number of employees leaving during the period (7)–––––––––––––––––––––––––––––––––––––––––––––––– × 100Average total number of employees for the period (42)= 16.7%
(b) Possible reasons for the labour turnover include:(i) Promotion either within or outside the firm.
(ii) Personal circumstances such as moving from the area, retirement, pregnancy.(iii) Dissatisfaction with pay or working conditions.
The costs of labour turnover include leaving, recruitment and trainingcosts. Leaving costs include the costs associated with completing theappropriate documentation and lost production if the employees cannot beimmediately replaced. Recruitment costs result from the advertising, selec-tion and engagement of new staff. Training costs include costs associatedwith lost production when training is being given, defective work and lowproductivity during the training period.
Labour turnover and associated costs can be reduced by ensuring that;(i) pay and working conditions are satisfactory and comparable with alterna-
tive employers;(ii) adequate training is provided;
(iii) an appropriate career structure exists.
(c) The time allowed for 114 268 units is 5194 hours (114 268/22)Efficiency ratio = Time allowed (standard hours)/actual hours
= 5194 hours/4900 hours= 106%
Standard costActual costVariance
ACCOUNTING FOR DIRECT COSTS 71
average, each employee’s wage increases by £60 per week (a 12.5% increase).
produces 900 units per week would receive a weekly wage of £435 (800 ×48p plus 100 × 51p), a decline of £45 per week.
= £71 677= £69 649
Favourable= £2 028
Therefore the labour rate is £14.214 per hour (£13.80 × 10³/100)(5194 hours at £13.80)(4900 hours at £14.214)
97

Solution SM 3.4(a)
(b) (i) Wages paid (before share of group bonus): Direct personnel Indirect personnel
Total hours 121Normal hours 444 (12 × 37) 111 (3 × 37)Overtime hours 44 (488 – 444) 10 (121 – 111)Basic wages £3 660 (488 × £7.50) £726 (121 × £6)Overtime premium £110 (44 × £2.50) £20 (20 × £2)Total wages £3 770 £746
(ii) Analysis of wages: Direct cost Indirect cost
£ £Direc workers:
Basic wages 3240 (432 × £7.50) 420 (56 × £7.50)Overtime premium 110
Indirect workers 746Group bonus 520
–––– ––––3240 1796–––– ––––
(iii)Wages control account
Cost ledger control account 5036 Work in progress account 3240 Production overhead account 1796
–––– ––––5036 5036–––– ––––
(iv)
Efficiency ratio = =
�(432
47+0
32)� × 100 = 101.3%
Solution SM 3.5(a) (i) FIFO: 2100 boxes were purchased and 1500 boxes were issued to produc-
tion, leaving a balance of 600 boxes. Actual closing stock is 500 boxes,resulting in a stock loss of 100 boxes. The closing stock will be valued atthe latest purchase price: £28 per unit (£14 000/500).Closing stock valuation = £14 000 (500 × £28)Cost of sales (including stock loss) =£60 400 (Total purchase cost (74 400) – (14 000)
Expected hours for actual output����
Actual hours
72 ACCOUNTING FOR DIRECT COSTS
See ‘Accounting treatment of various
488
labour cost items’ in Chapter 3 for the answer to this question.
98

(ii) LIFO:Date Issue Cost
(£)10/2 400 units 15 200
100 units at £7200/200 3 60018 800
20/4 400 units 14 000200 units at £24 000/600 8 000
22 00025/6 400 units at £14 000/500 11 20030/6 100 units (stock loss) at £14 000/500 2 800
Total cost of issues 54 800
Closing stock = Purchase cost (£74 000)– Issue cost (£54 800)
= £19 600
Note(1) If the question does not require you to prepare a stores ledger
account, you are recommended for the FIFO method to follow theapproach shown in this answer. First calculate the closing stock inunits. With the FIFO method the closing stock will be valued at thelatest purchase prices. You can calculate the cost of sales as follows:
Cost of sales = Opening stock + Purchases– Closing stock
(iii)Weighted average method
Receipts Issues Closing balance
Weightedaverage
Total Total issue Quantity cost Quantity cost Quantity Cost price
Date (boxes) (£) Date (boxes) (£) (boxes) (£) (£)13/1 200 7 200 200 7 200 36.008/2 400 15 200 600 22 400 37.33
10/2 500 at 18 665 100 3 735 37.33£37.33
11/3 600 24 000 700 27 735 39.6212/4 400 14 000 1 100 41 735 37.94
20/4 600 at 22.764 500 18 971 37.94£37.94
15/6 500 14 000 1 000 32 971 32.9725/6 400 at 13 188 600 19 783 32.97
£32.9730/6 100 at 3 297 500 16 486 32.97
£32.9757 914
(b) Profit calculationsWeighted
FIFO LIFO average (£) (£) (£)
Sales 67 200 67 200 67 200Cost of sales and stock loss (60 400) (54 800) (57 914)Other expenses (2 300) (2 300) (2 300)Profit 4 500 10 100 6 986
ACCOUNTING FOR DIRECT COSTS 7399

The purchase cost per box is £36 (Jan.), £38 (Feb.), £40 (March), £35 (April) and£28 (June).
The use of FIFO results in the lowest profit because prices are falling and thehigher earlier prices are charged to production, whereas with LIFO the laterand lower prices are charged to production. The use of the weighted averagemethod results in a profit calculation between these two extremes. There aretwo items of concern regarding the performance of the business:(i) There was a large purchase at the highest purchase price in March. This
purchase could have been delayed until April so as to take advantage ofthe lower price.
(ii) The stock loss has cost over £3000. This should be investigated. A materialscontrol procedure should be implemented.
Solution SM 3.6(a) (i) Continuous stocktaking refers to a situation where a sample of store items
are counted regularly on, say, a daily basis. Sufficient items should bechecked each day so that during a year all items are checked at least once.The alternative system of stocktaking is a complete physical stockcountwhere all the stock items are counted at one point in time. Continuousstocktaking is preferable because production is not disrupted and any dis-crepancies and losses are relevant earlier.
(ii) A perpetual inventory system is a stock recording system whereby thebalance is shown for a stock item after each receipt or issue. In a non-computerised system the records are maintained on bin cards or storesledger cards. A separate record is maintained for each item of materials instores. Therefore the stock balance for each stores item is available at anypoint in time.
(iii) For an explanation of ABC inventory analysis see the section on control ofstocks through classification in Chapter 3.
(b) For the answer to this question you should refer to Chapter 3 (sections on rele-vant costs for quantitative models under conditions of certainty and determin-ing the economic order quantity).
(c) Normal control levels are the re-order level, minimum level and maximumlevel explained in the ‘Key Examination Points’ section.
Reorder level = Maximum usage× Maximum lead time
= 800 kg × 14 days= 11 200 kg
Minimum level = Re-order level– Average usage in average lead time
= 11 200 kg – (600 kg × 12 days)= 4000 kg
Maximum level = Re-order level + EOQ– Minimum usage in minimum lead time
=11 200 kg + 12 000 kg– (400 kg × 10 days)
= 19 200 kg
74 ACCOUNTING FOR DIRECT COSTS100

Solution SM 3.7(a) Item A32: storage and ordering cost schedule
No of orders per year 4 5 6 7 8 9 10 11 12
Order size (boxes) 1250 1000 833 714 625 556 500 455 417Average stock
(boxes) 625 500 417 357 313 278 250 228 208
(£) (£) (£) (£) (£) (£) (£) (£) (£)Storage costs
(average stock × 25% of £2) 312.5 250.0 208.5 178.5 156.5 139.0 125.0 114.0 104.0
Ordering costs (£12.5 per order) 50.0 62.5 75.0 87.5 100.0 112.5 125.0 137.5 150.0
Total cost £362.5 £312.5 £283.5 £266.,0 £256.5 £251.5 £250.0 £251.5 £254.0
(b) The number of orders which should be placed in a year to minimize costs is 10.(c)
where D = total demand for period, O = ordering cost per order, H = holdingcost per unit.
(d)
(e) The maximum saving that could be made if the authority process four ordersper year would be:
(f) (i) Reducing the number of stock items by eliminating slow moving andobsolete stocks.
(ii) Standardization of stock items thus reducing the total number of items instock.
Solution SM 3.8The purchase cost is not constant per unit. It is therefore not possible to use theEOQ formula. Instead the following schedule of costs should be prepared:
Evaluation of optimum order sizeSize of No. of Annual purchase Storage Admin. Totalorder orders cost (WI) cost cost cost
(£) (£) (£) (£)
2400 1 1728 (£0.72) 300 5 20331200 2 1728 (£0.72) 150 10 1888600 4 1824 (£0.76) 75 20 1919200 12 1920 (£0.80) 25 60 2005100 24 1920 (£0.80) 12.50 120 2052.50
It is recommended that two orders be placed per year for 1200 units.(£)
Calculation of cost 2(1200 × £0.80 – 10%) = £1728Add: Storage, average quantity held 600 × £0.25 = 150Add two orders placed per annum × £5 = 10
£1888Workings (W1) Annual demand of 2400 units × unit purchase cost
£362.50 £250£362.50
− = 31%
EO
500 units
Q 2 5000 12.50.5
= � �⎛⎝⎜
⎞⎠⎟
=
EOQ 2= ⎛⎝⎜
⎞⎠⎟
DOH
ACCOUNTING FOR DIRECT COSTS 75101

74 ACCOUNTING FOR DIRECT COSTS
Re-order level = Maximum usage (750) × Maximum lead time (15 days) = 11 250 unitsMinimum stock reduction before an order is received = 11 250 − (450 × 8 days) = 7 650 unitsMaximum order size = 15 000 − 7 650 = 7 350 units Answer = 7 350 units
(a) EOQ = √(2 × 12 000 × 200)/(£15 × 0.08) = 2 000 units(b) Revised stock costs
£
Purchase costs (12 000 × £15) 180 000 12 000Order costs × 200 2 000
1 200
12 000Holding costs × 15 × 0.08 2 000
1 200
182 400Original stock costs 183 000Saving 600
Units Receipts and issues Price per unit Cost
100 5 00 500150 5 50 825250 5 30 1,325
(100) 5 30 (530)100 6 00 600250 5 58 1,395(75) 5 58 (418 5)175 5 58 976 50
Answer = B
Solution SM 3.9
Solution SM 3.10
Solution SM 3.11
Answer = D
Answer = D
Annual holding cost = EOQ/2 × £4 per unit = 250 units × £4 = £1000Annual ordering costs = Annual demand of 20 000 units/ EOQ (500 units) × order-ing cost (£25) = £1000 Annual purchase cost = 20 000 units × £40 = £800 000 Total annual cost = £1000 + £1000 + £800 000 = £802 000 Answer = C
Solution SM 3.12
Solution SM 3.13
Solution SM 3.14
102

Solution SM 3.15 a) EQQ = √(2 × 15 000 × 80)/(0.1333 × 200)
= 300 units Number of orders per year = 15 000/300 = 50 orders
b) EQQ = √ (2 × 2800 × 28)/(25 × .08) = 280 units
Holding cost = 280/2 ×£2 = $280
Solution SM 3.16 (i) Current average maximum production = 30 × 55 hrs × 6 units = 9900 units. Proposed maximum production = 30 × 55 hrs × 8 units = 13 200 units
Existing payment system: Output level (units) 7 Output level (units) 7000 9600 9900 £ £ £
Sales value (£11 per unit) 77 000 105 600 108 900
Pre-finishing VC 56 000 76 800 79 200 Direct labour: Guaranteed 9600 9600 9600 Overtime (W1) — 4800 5400 Variable overhead (W2) 560 768 792 Fixed overhead 9000 9000 9000
Total cost 75 160 100 968 103 992
Profit 1840 4632 4908
Proposed scheme: Output level (units) 7000 9600 9900 12 000
£ £ £ £
Sales value 77 000 105 600 108 900 132 000
Pre-finishing VC 56 000 76 800 79 200 96 000
Direct labour at £1.40 per unit 9800 13 440 13 860 16 800
Variable overhead (W3) 420 576 594 720
Fixed overhead 9000 9000 9000 9000
Total cost 75 220 99 816 102 654 122 520
Profit 1780 5784 6246 9480
Working: (W1) 9600 units requires 1600 hrs (9600/6)
(Overtime = 400 hrs × £12 9900 units requires 1650 hrs (9900/6)
(Overtime = 450 hrs × £12 Basic hours 1200 hrs
(W2) 7000 units = 7000/6 × £0.48 9600 units 9600/6 × £0.48 9900 units 9900/6 × £0.48
(W3) 7000 units = 7000/8 × £0.48 9600 units 9600/8 × £0.48 9900 units 9900/8 × £0.48 12 000 units = 12 000/8 × £0.48
(ii) At low output levels the average wage rate per unit is £1.33 (£8/6 units), compared with £1.40 with the incentive scheme. Once overtime is worked, the wage rate per unit of output exceeds £1.40 per unit under the incentive scheme. For example, at an output level of 9600 units the wage rate per unit of output is £1.50 (£14 400/9600). Variable overheads vary with productive hours. Therefore variable overhead per unit will be £0.08 (£0.48/6) under the old scheme and £0.06 per unit under the new scheme (£0.48/8). The proposed incentive scheme will also enable the maximum output level to be achieved, thus enabling maximum sales to be achieved.
ACCOUNTING FOR DIRECT COSTS 59 103

76 COST ASSIGNMENT FOR INDIRECT COSTS
Solution SM 4.1(a) Calculation of department overhead rates
Department Department DepartmentP Q R
(£) (£) (£)Repairs and maintenance 42 000 a 10 000 10 000Depreciation 17 000 a 14 000 9 000Consumable supplies 4 500 b 2 700 1 800Wage related costs 48 250 a 26 250 12 500Indirect labour 45 000 a 27 000 18 000Canteen/rest/smoke room 15 000 c 9 000 6 000Business rates and insurance 13 000d 10 400 2 600–––––––a –––––– ––––––
184 750 a 99 350 55 900Direct labour hours 50 000 a 30 000 20 000Overhead absorption rate £3.70 a £3.31 £3.00
Notes:The calculations for Department P are:aDepreciation = £170 000/£400 000 � £40 000.bConsumable supplies = 50 000/100 000 � £9000.cCanteen = 25/50 � £30 000.dBusiness rates insurance = 5000/10 000 � £26 000.
(b) Job 976: Sample quotation(£) (£)
Direct materials 800.00Direct labour P (30 � £7.72 a) 231.60
Q (10 � £7.00 b) 70.00R (5 � £5.00 c) 25.00 326.60–––––
Overhead absorbed P (30 � £3.70) 111.00Q (10 � £3.31) 33.10R (5 � £3.00) 15.00 159.10–––––– –––––––
Production cost 1285.70Selling, distribution and administration costs (20% � £1285.70) 257.14–––––––Total cost 1542.84Profit margin (20% of selling price) 385.71–––––––Selling price (£1542.84 � 100/800) 1928.55
––––––––––––––Notes:a£386 000/50 000.b£210 000/30 000.c£100 000/20 000.
Cost assignment for indirect costsSolutions to Chapter 4 questions
104
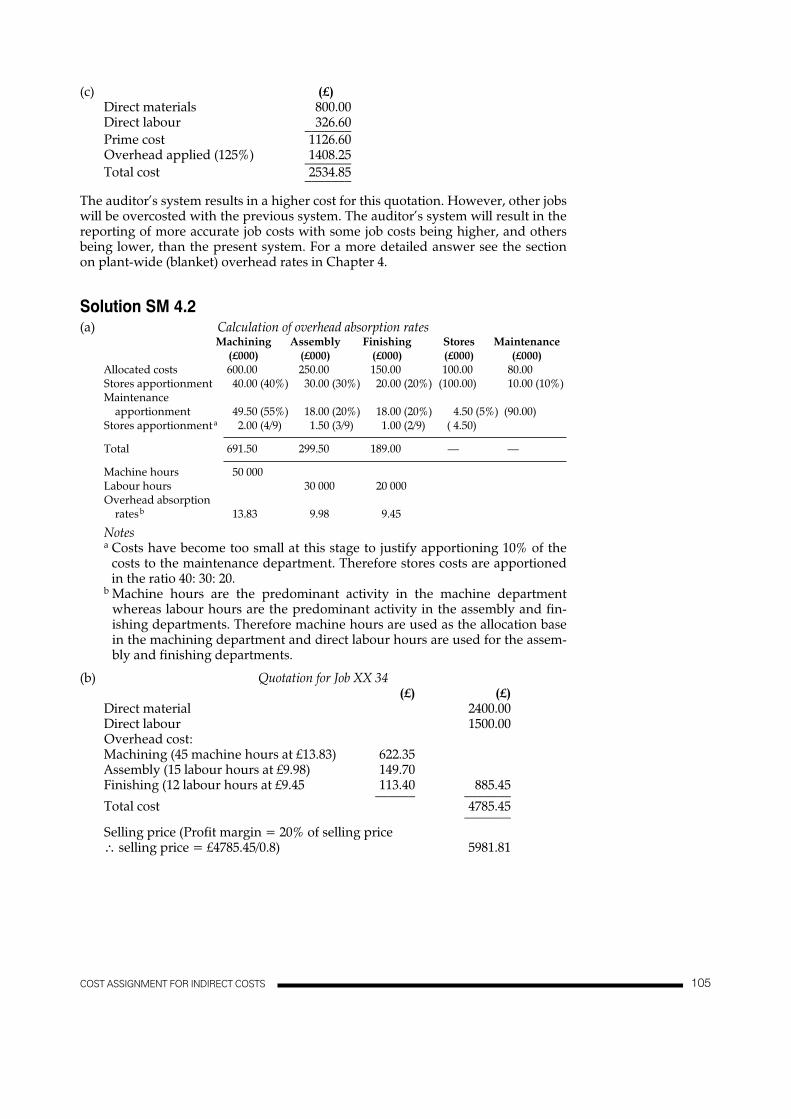
(c) (£)Direct materials 800.00Direct labour 326.60–––––––Prime cost 1126.60Overhead applied (125%) 1408.25–––––––Total cost 2534.85–––––––
The auditor’s system results in a higher cost for this quotation. However, other jobswill be overcosted with the previous system. The auditor’s system will result in thereporting of more accurate job costs with some job costs being higher, and othersbeing lower, than the present system. For a more detailed answer see the sectionon plant-wide (blanket) overhead rates in Chapter 4.
Solution SM 4.2(a) Calculation of overhead absorption rates
Machining Assembly Finishing Stores Maintenance(£000) (£000) (£000) (£000) (£000)
Allocated costs 600.00 250.00 150.00 100.00 80.00Stores apportionment 40.00 (40%) 30.00 (30%) 20.00 (20%) (100.00) 10.00 (10%)Maintenance
apportionment 49.50 (55%) 18.00 (20%) 18.00 (20%) 4.50 (5%) (90.00)Stores apportionmenta 2.00 (4/9) 1.50 (3/9) 1.00 (2/9) ( 4.50)
Total 691.50 299.50 189.00 — —
Machine hours 50 000Labour hours 30 000 20 000Overhead absorption
ratesb 13.83 9.98 9.45
Notesa Costs have become too small at this stage to justify apportioning 10% of the
costs to the maintenance department. Therefore stores costs are apportionedin the ratio 40: 30: 20.
b Machine hours are the predominant activity in the machine departmentwhereas labour hours are the predominant activity in the assembly and fin-ishing departments. Therefore machine hours are used as the allocation basein the machining department and direct labour hours are used for the assem-bly and finishing departments.
(b) Quotation for Job XX 34(£) (£)
Direct material 2400.00Direct labour 1500.00Overhead cost: Machining (45 machine hours at £13.83) 622.35Assembly (15 labour hours at £9.98) 149.70Finishing (12 labour hours at £9.45 113.40 885.45
–––––– –––––––Total cost 4785.45
–––––––Selling price (Profit margin = 20% of selling price ∴ selling price = £4785.45/0.8) 5981.81
COST ASSIGNMENT FOR INDIRECT COSTS 77105

(c) Overhead control account(£) (£)
Overhead incurred 300 000 WIP control (30 700 hrs at £9.98) 306 386Balance – over-recovery
transferred to costing profit and loss account 6 386
––––––– –––––––306 386 306 386
––––––– –––––––
(d) For the answer to this question see ‘An illustration of the two-stage process foran ABC system’ in Chapter 4. In particular, the answer should stress that costcentres will consist of activity cost centres rather than departmental centres.Separate cost driver rates would also be established for the service departmentsand the costs would be allocated to cost objects via cost driver rates rather thanbeing reallocated to production departments and assigned within the produc-tion department rates. The answer should also stress that instead of using justtwo volume-based cost drivers (e.g. direct labour and machine hours) a varietyof cost drivers would be used, including non-volume-based drivers such asnumber of set-ups and number of material issues. The answer could also stressthat within the machining department a separate set-up activity centre mightbe established with costs being assigned using the number of set-ups as thecost driver. The current system includes the set-up costs within the machinehour overhead rate.
Solution SM 4.3(a)
Department A Department BAllocated costs £217 860 £374 450Apportioned costs 45 150 58 820Total departmental overheads 263 010 433 270Overhead absorption rate £19.16 (£263 010/13 730) £26.89 (£433 270/16 110)
(b)Department Department Department
A B C(£) (£) (£)
Allocated costs 219 917 387 181 103 254)Apportionment of 70% of Department C costs a 32 267 40 011 ( 72 278)Apportionment of 30% of Department C costs b 11 555 19 421 ( 30 976)
––––––– –––––– –––––––Total departmental overheads 263 739 446 613
––––––– ––––––Overheads charged to production 261 956 c 455 866 d
Under/(over-recovery) 1 783 ( 9 253)
Notesa Allocated on the basis of actual machine hoursb Allocated on the basis of actual direct labour hoursc £19.16 × 13 672 actual machine hoursd £26.89 × 16 953 actual direct labour hours
(c) See Appendix 4.1 (Chapter 4) for the answer to this question.
78 COST ASSIGNMENT FOR INDIRECT COSTS106

Solution SM 4.4(a) Year 1
(1) Budgeted machine hours 132 500(2) Budgeted fixed overheads £2 411 500 (132 500 � £18.20)(3) Actual machine hours 134 200 (£2 442 440/£18.20)(4) Fixed overheads absorbed £2 442 440(5) Actual fixed overheads incurred £2 317 461
Over-absorption of fixed overheads £124 979 (5 � 4)
The section on ‘Under- and over-recovery of fixed overheads’ in Chapter 4indicates that an under- or over-recovery will arise whenever actual activity orexpenditure differs from budgeted activity or expenditure. Actual activity was1700 hours in excess of budget and this will result in an over-recovery of fixedoverheads of £30 940. Actual overheads incurred were £94 039 (£2 317 461 –£2 411 500) less than budget and this is the second factor explaining the over-absorption of fixed overheads.
Summary (£)Over-recovery due to actual expenditure
being less than budgeted expenditure 94 039Over-recovery due to actual activity exceeding
budgeted activity 30 940–––––––
Total over-recovery of overhead for year 1 124 979–––––––
Year 2(1) Budgeted machine hours (134 200 � 1.05) 140 910(2) Budgeted fixed overheads £2 620 926(3) Fixed overhead rate (£2 620 926/140 900 hours) £18.60(4) Actual fixed overheads incurred £2 695 721(5) Fixed overheads absorbed (139 260 � £18.60) £2 590 236(6) Under-recovery of overhead for year 2 (4 – 5) £105 485
Analysis of under-recovery of overhead (£)Under-recovery due to actual activity
being less than budgeted activity (139 260 – 140 910) � £18.60 30 690Under-recovery due to actual expenditure being greater
than budgeted expenditure (£2 695 721 � £2 620 926 74 795–––––––
Total under-recovery for the year 105 485–––––––
Change in the overhead rateChange in the rate (£18.60 – £18.20)/£18.20 � � 2.198%This can be analysed as follows:
Increase in budgetedexpenditure (£2 620 926 – £2 411 500)/£2 411 500 � � 8.684%
Increase in budgetedactivity (140 910 hours – 132 500 hrs)/132 500 � � 6.347%
The increase of 2.198% in the absorption rate is due to an expenditure increaseof 8.684% in budgeted expenditure partly offset by an increase in budgetedactivity of 6.347% over the 2 years.
Proof(1.08684/1.06347) – 1 � 0.02198 (2.198%)
(b) See ‘Plant-wide (blanket) overhead rates’ and ‘Budgeted overhead rates’ inChapter 4 for the answers to these questions.
COST ASSIGNMENT FOR INDIRECT COSTS 79107

Solution SM 4.5(a) (i) and (ii) An activity increase of 150 hours (1650 – 1500) results in an increase
in total overheads of £675. It is assumed that the increase in total over-heads is due entirely to the increase in variable overheads arising from anincrease in activity. Therefore the variable overhead rate is £4.50 (£675/150hours) per machine hour. The cost structure is as follows:
1. Activity level (hours) 1 500 1 650 2 0002. Variable overheads at £4.50 per hour £6 750 £7 425 £9 0003. Total overheads £25 650 £26 325 £27 9004. Fixed overheads (3 – 2) £18 900 £18 900 £18 900
(iii) The fixed overhead rate is £10.50 (£15 � £4.50 variable rate)
normal activity � fixed overheads (£18 900)/fixed overhead rate (£10.50)� 1800 machine hours
(iv) Under-absorption � 100 machine hours (1800 – 1700) at £10.50 � £1050
(b) (i) A machine hour rate is recommended for the machine departmentbecause most of the overheads (e.g. depreciation and maintenance) arelikely to be related to machine hours. For non-machine labour-intensivedepartments, such as the finishing department, overheads are likely to berelated to direct labour hours rather than machine hours. Overheads aretherefore charged to jobs performed in the finishing department using thedirect labour hour method of recovery.
Calculation of overhead ratesMachining Finishingdepartment department
Production overhead £35 280 £12 480Machine hours 11 200Direct labour hours 7800Machine hour overhead rate £3.15Direct labour hour overhead rate £1.60
(ii) Machining Finishingdepartment department
Direct materials (£) (£)(189 � 1.1 � £2.35/0.9) 542.85 —
Direct labour a
25 hours � £4 100.0028 hours � £4 112.00
Production overhead46 machine hours at £3.15 144.9028 direct labour hours at £1.60 44.80
–––––– ––––––787.75 156.80–––––– ––––––
Total cost of job = £944.55 (£787.75 + £156.80)
NoteaOvertime premiums are charged to overheads, and are therefore notincluded in the above job cost.
80 COST ASSIGNMENT FOR INDIRECT COSTS108

Solution SM 4.6(a) (i)
MaterialsMachining Finishing Assembly handling Inspection
(£) (£) (£) (£) (£)
Initial cost 400 000 200 000 100 000 100 000 50 000Reapportion:Materials
handling 30 000 25 000 35 000 (100 000) 10 000 430 000 225 000 135 000 — 60 000
Inspection 12 000 (20%) 18 000 (30%) 27 000 (45%) 3 000 (5%) (60 000)442 000 243 000 162 000 3 000 —
Materials handling 900 (30%) 750 (25%) 1 050 (45%) (3 000) 300 (10%)
442 900 243 750 163 050 — 300Inspection 60 (20%) 90 (30%) 135 (45%) 15 (5%) (300)
442 960 243 840 163 185 (15)5 4 6
442 965 243 844 163 191(ii) Let
x = material handlingy = inspectionx = 100 000 + 0.05yy = 50 000 + 0.1x
Rearranging the above equations:x – 0.05y = 100 000 (1)– 0.1x + y = 50 000 (2)
Multiply equation (1) by 1 and equation (2) by 10:x – 0.05y = 100 000–x + 10y = 500 000
Adding the above equations:9.95y = 600 000
y = 60 301Substituting for y in equation (1):
x – 0.05 × 60 301 = 100 000x = 103 015
Apportioning the values of x and y to the production departments in theagreed percentages:
Machining Finishing Assembly(£) (£) (£)
Initial cost 400 000 200 000 100 000(x) Materials handling (0.3) 30 905 (0.25) 25 754 (0.35) 36 055(y) Inspection (0.2) 12 060 (0.3) 18 090 (0.45) 27 136
442 965 243 844 163 191
(b) Reapportioning production service department costs is necessary to computeproduct costs for stock valuation purposes in order to meet the financial account-ing requirements. However, it is questionable whether arbitrary apportionmentsof fixed overhead costs provides useful information for decision-making. Suchapportionments are made to meet stock valuation requirements, and they areinappropriate for decision-making, cost control and performance reporting.
An alternative treatment would be to adopt a variable costing system andtreat fixed overheads as period costs. This would eliminate the need toreapportion service department fixed costs. A more recent suggestion is to tracesupport/service department costs to products using an activity-based costing
(c) For the answer to this question see ‘Under- and over-recovery of overheads’.
COST ASSIGNMENT FOR INDIRECT COSTS 81
system (ABCS). For a description of ABCS you should refer to Chapter 12.
109

80 COST ASSIGNMENT FOR INDIRECT COSTS
(a) It is easier to allocate service department B fi rst because it provides services to both of the other service departments.
Centre 1 Centre 2 Service A Service B Service C(£) (£) (£) (£) (£)
2000 3500 300 500 700Service B 250 (50%) 100 (20%) 100 (20%) (500) 50 (10%)
2250 3600 400 750Service A 180 (45%) 180 (45%) (400) 40 (10%)
2430 3780 40 750Service C 450 (60%) 300 (40%) (750)
2880 4080 40Service B 20 (50%) 8 (20%) 8 (20%) (40) 4 (10%)2900 4088 8 4Service A 4 (45%) 4 (45%) (8)Service C (Balance shared equally)
2 2 (4)
Total 2906 4094
(b) It would appear that the department is machine intensive so it is preferable to use machine hours. The overhead absorption rate per machine hour is £0.969 (£2906/3000 machine hours).
Overhead absorbed (£714 000) = Actual hours (119 000) × Predetermined over-head rate.
Predetermined overhead rate = £714 000/119 000 = £6.Budgeted overheads (£720 000) = Budgeted machine hours × Budgeted overhead
rate (£6).Budgeted machine hours = £720 000/£6 = 120 000 hours.Answer = C
Solution SM 4.7
Solution SM 4.8
Budgeted overhead rate = £258 750/11 250 hours = £23 per machine hourOverheads absorbed = £23 × 10 980 Actual hours = £252 540Overheads incurred = £254 692Overheads absorbed = £252 540Under-absorbed overheads = £2152
£Absorbed overheads (4 500 units × £8) 36 000
Over absorbed overheads (6 000)Actual overheads incurred 30 000
Answer = A
Solution SM 4.9
Solution SM 4.10
110

Solution SM 4.11
Answer = D
Solution SM 4.12 Because production is highly automated it is assumed that overheads will be most closely
associated with machine hours. The pre-determined overhead rate will therefore be £18
derived from dividing budgeted overheads (£180 000) by the budgeted machine hours (10
000). Therefore the answer is B.
Solution SM 4.13 Stores (S) = 6300 + 0.05 Maintenance (M) M =
8450 + 0.1S
Rearranging the equations:
S = 6300 + 0.05M (1) –0.1S
= 8450 − M (2)
Multiply equation (1) by 20 and (2) by 1
20S = 126 000 + M
–0.1S = 8450 − M
19.9S = 134 450
S = £6756
Substituting for S in equation (1)
6756 = 6300 + 0.05 M
0.05M = 456
M = £9126
For production department 1, the total overheads are
= 17 500 + (£6756 × 60%) + (9126 × 75%)
= £28 398
Answer = C
Solution SM 4.14 Budgeted machine hour rate = $3.60($180000/50 000 hours) Standard machine hours
per unit = 1.25(50000 hours/40000 units)
$
Overheads incurred 178 080
Overheads absorbed (38 760 units × 174 420
1.25 hours × $3.60) =
Under absorbed overheads 3660
Answer = (b)
COST ASSIGNMENT FOR INDIRECT COSTS 81 111

82 ACCOUNTING ENTRIES FOR A JOB COSTING SYSTEM
Solution SM 5.1(a) Stores ledger control account
(£) (£)Opening Balance 60 140 Finished Goods Control A/c (1) 95 200Cost Ledger Control A/c 93 106 Closing Balance 58 046
––––––– –––––––153 246 153 246
––––––– –––––––––––––– –––––––
Production wages control account(£) (£)
Cost Ledger Control A/c (2) 121 603 Finished Goods Control A/c 87 480Production Overhead
Control A/c (2) 34 123(indirect wages)
––––––– –––––––121 603 121 603
––––––– –––––––––––––– –––––––
Production overhead control account(£) (£)
Cost Ledger Control A/c 116 202 Finished Goods Control A/c (3) 61 236Production Wages Profit and Loss A/c – Fixed
Control A/c (2) 34 123 Overhead (3) 90 195Profit and Loss A/c – over
absorbed variable production overhead (3) 1 106
––––––– –––––––151 431 151 431
––––––– –––––––––––––– –––––––
Finished goods control account(£) (£)
Opening Balance 147 890 Variable Production Cost ofStores Ledger Control A/c 95 200 Sales A/c (balance) 241 619Production Wages Control A/c 87 480 Closing Balance 150 187Production Overhead
Control A/c 61 236––––––– –––––––391 806 391 806
––––––– –––––––––––––– –––––––
Accounting entries for a job costingsystemSolutions to Chapter 5 questions
112

Workings
(1)(Kg) (£)
Opening stock 540 7 663Purchases 1 100 15 840
––––– ––––––1 640 23 503
––––– ––––––
Issue price £23 503/1 640 = £14.33 per kgCost of material issues: Material Y = £14.33 × 1 164kg = £16 680
Other materials = £78 520––––––£95 200––––––
(2) Analysis of wagesDirect Indirectlabour labour
(£) (£)Direct workers productive time (11 664 × £7.50) 87 480Direct workers unproductive time at £7.50
(12 215 hours – 11 664) 4 132.50Overtime premium (1 075 hours × £2.50) 2 687.50Indirect workers basic time (4 655 hours × £5.70) 26 533.50Indirect workers overtime premium (405 hours × £1.90) 769.50
–––––– ––––––––87 480 34 123.00
–––––– ––––––––Total wages for the period £121 603 (£87 480 + £34 123)
(3) Analysis of overheadsProduction overheads = £150 325 (£116 202 + £34 123)Fixed overheads = 90 195 (60% × £150 325)Variable overheads = 60 130 (40% × £150 325)Variable overheads
absorbed = 61 236 (70% of the direct labour cost of £87 480)Over-absorbed overheads = 1 106 (£61 236 – £60 130)Note that with a marginal costing system fixed overheads are chargeddirectly to the profit and loss account and not included in the productcosts. Therefore they are not included in the finished stocks.
(b) See working (2) in part (a) for the answer to this question.
(c) (£) (£)Sales 479 462Less: Variable production cost of sales 241 619
Variable selling and administration overheads 38 575Over-absorbed variable production overheads (1 106) 279 088
–––––– –––––––Contribution 200 374Less: Fixed production overheads 90 195
Fixed selling and administration overheads 74 360 164 655–––––– –––––––
Net profit 35 819–––––––
ACCOUNTING ENTRIES FOR A JOB COSTING SYSTEM 83113

Solution SM 5.2(a) Raw material stock control account
(£) (£)Opening balance 72 460 Finished goods (1) 608 400Creditors 631 220 Closing balance 95 280
––––––– –––––––703 680 703 680
––––––– –––––––
Production overhead control account(£) (£)
Bank/Creditors 549 630 Finished goods (3) 734 000Wages (2) 192 970 P & L – under absorption (3) 8 600
––––––– –––––––742 600 742 600
––––––– –––––––
Finished goods stock control account(£) (£)
Opening balance 183 560 Production cost of sales (6) 1 887 200Raw materials 608 400 Closing balance 225 960Wages (5) 587 200Production overhead 734 000
–––––––– ––––––––2 113 160 2 113 160–––––––– ––––––––
Workings(1) Raw materials issues:
Product A: 41 000 units at £7.20 per unit = £295 200Product B: 27 000 units at £11.60 per unit = £313 200
–––––––£608 400–––––––
(2) Indirect labour charged to production overhead: 3 250 overtime premium hours at £2 per hour = £6 500 + £186 470 = £192 970
(3) Production overhead absorbed charged to finished goods: Product A: 41 000 × 1 hour × £10 = £410 000Product B: 27 000 × 1.2 hours × £10 = £324 000
–––––––£734 000–––––––
Production overhead under-absorbed = £549 630 + £192 970 – £734 000 = £8 600
(4) Direct labour charge to finished goods stock: Product A: 41 000 × 1 hour × £8 = £328 000Product B: 27 000 × 1.2 hours × £8 = £259 200
–––––––£587 200–––––––
(5) Production cost of sales: Cost of product A = £7.20 materials + £8 direct labour + £10 overhead =
£25.20Cost of product B = £11.60 materials + £9.60 direct labour (1.2 hours × £8)
+ £12 overhead (1.2 hours × £10) = £33.20Cost of sales: Product A = 38 000 units × £25.20 per unit= £957 600
Product B = 28 000 units × £33.20 per unit= £929 600–––––––––£1 887 200–––––––––
84 ACCOUNTING ENTRIES FOR A JOB COSTING SYSTEM114

(6) Valuation of closing stocks of finished goods: Product A: 6200 units at £25.20 = £156 240Product B: 2100 units at £33.20 = £69 720
–––––––£225 960–––––––
The above figure can also be derived from the balance of the account.
(b) Product A Product B Total(£000) (£000) (£000)
Sales 1330 1092 2422Production cost of sales (957.6) (929.6) (1887.2)
––––– –––– –––––Gross profit (before adjustment) 372.4 162.4 534.8Under absorbed production overheads (8.6)
–––––Gross profit (after adjustment) 526.2Non-production overheads (394.7)
–––––Net profit 131.5
–––––
(c) With a marginal costing system fixed production overheads are chargeddirectly against profits whereas with an absorption costing system they areincluded in the product costs and therefore included in the stock valuations.This means that with absorption costing cost of sales and profits will beaffected by the changes in stocks. An increase in stocks will result in some ofthe fixed overheads incurred during the period being deferred to future peri-ods whereas with a decrease in stocks the opposite situation will apply. Thus,absorption costing profits will be higher than marginal costing profits whenstocks increase and lower when stocks decrease. For a more detailed explana-tion of the difference in profits you should refer to ‘Variable costing andabsorption costing: a comparison of their impact on profit’ in Chapter 8.
In this question there is a stock increase of 3000 units for product A resultingin absorption costing profits exceeding marginal costing profits by £20 400(3000 units at £6.80 per unit fixed overhead). Conversely, for product B there isa 1000 units stock reduction resulting in marginal costing profits exceeding theabsorption costing profits by £8160 (1000 units at £8.16 per unit fixedoverhead). The overall impact is that absorption costing profits exceedmarginal costing profits by £12 240.
Solution SM 5.3(a) (i) The overheads apportioned to Contract ABC are as follows:
Stores operations = £1.56 million × (£6.4 million × 6 months)/(76.2 million × 53 months) = £148 000Contract general management = £1.22 million × (£1.017 million/9.762 million)= £127 000Transport = £1.37 million × (23km × 6 months)/(16km × 53 months) = £223 000General administration = £4.25 million × (6 months/53 months)= £481 000Total overheads apportioned to Contract ABC = £979 000
ACCOUNTING ENTRIES FOR A JOB COSTING SYSTEM 85115

(ii) (£ million) (£ million)1.063
Raw materials 1.456Direct labour 1.017Overheads 0.979 3.452
––––– –––––Costs to date 4.515Costs to complete 0.937
–––––Total costs 5.452Contract value 6.400
–––––0.948
–––––
Amount of profit taken to be included in the profit statement for the period:
[Value of work certified (£5.18 million)/Contract value (£6.4 million)] ×£0.948 million = £0.767 million
Note that with some questions on contract costing the profit to date is com-puted by deducting the cost of work certified from the value of work certi-fied. However, the cost of work not yet certified or the cost of work certifiedis not given in the question so it is not possible to adopt this approach.
(b) Service costing represents a costing system where the cost objects are the costof services rather than the cost of products. It is applied in the service sector butcan be applied in other sectors where the objective is to calculate the cost of theservice departments. The key factors to consider are as follows: • determining which services are to be costed within the stores department
(e.g. materials receiving, materials handling, etc.);• establishing whether total costs or unit costs should be calculated. In the
latter situation the output should be measurable to calculate the cost perunit of output;
• establishing how costs should be classified in determining the total costs ofservices (e.g. determining the different categories of direct and indirectcosts to be reported);
• deciding the key financial and non-financial performance measures to bereported.
86 ACCOUNTING ENTRIES FOR A JOB COSTING SYSTEM
Costs to 1 December
Estimated contract profit
Additional costs from 1 December to 31 May:
116

Solution SM 5.4(a) Contract accounts (for the previous year)
MNO PQR STU MNO PQR STU(£000) (£000) (£000) (£000) (£000) (£000)
Materials on site b/fwd 25 Wages accrued b/fwd 2Plant on site b/fwd 35 170 Plant control a/c 8Materials control a/c 40 99 180 Materials on site c/fwd 8Wages control a/c 20 47 110 Plant on site c/fwd 70 110Subcontractors a/c 35 Prepayment c/fwd 15Salaries 6 20 25 Cost of work not certifiedPlant control a/c 90 15 c/fwd 26Wages accrued c/fwd 5 Cost of work certifiedApportionment of (balance)c 82 221 416
construction services a 4 10 22––– ––– ––– ––– ––– –––160 231 567 160 231 567––– ––– ––– ––– ––– –––
Cost of work certified b/fwd 82 221 416 Attributable sales revenue 82 200 530Profit taken this period b 114 Loss taken b 21
––– ––– ––– ––– ––– –––82 221 530 82 221 530
––– ––– ––– ––– ––– –––Cost of work not certified Wages accrued b/fwd 5
b/fwd 26Materials on site b/fwd 8Plant on site b/fwd 70 110Prepayment b/fwd 15
NotesaCosts incurred by construction services department:
(£000)Plant depreciation (12 – 5) 7Salaries 21Wages paid 8––
36––
Wages incurred by each department are:(£000)
MNO 20PQR 50 (47 � 5 � 2)STU 110–––
180–––
The costs apportioned to each contract are:(£000)
MNO 4 �[20]� £36�–––
180PQR 10 �[50]
� £36�–––180
STU 22 �110� £36�–– –––
36 180––bSee (b) (i) for calculation.cProfit taken plus cost of sales for the current period or cost of sales less loss todate.
ACCOUNTING ENTRIES FOR A JOB COSTING SYSTEM 87117

(b) (i) Contract MNO: Nil.Contract PQR:
(£)Cost of contract to date (see part (a)) 411 000Value of work certified 390 000–––––––Recommended loss to be written off 21 000–––––––
Contract STU:(£)
Cost of work certified 786 000Cost of work not yet certified 26 000Estimated costs to complete 138 000––––––––Estimated cost of contract 950 000Contract price 1 100 000––––––––Anticipated profit 150 000––––––––
The profit taken to date is calculated using the following formula:cash received to date (£950 000)
� estimated profit from the contract (£150 000)contract price (£1 100 000)� £129 545 (say £129 000)The profit taken for the current period is £114 000, consisting of the profitto date of £129 000 less the profit previously transferred to the profit andloss account of £15 000.
(ii) Contract MNO: This contract is at a very early stage, and it is unlikely thatthe outcome can be reasonably foreseen. It is therefore prudent not toanticipate any profit at this stage.Contract PQR: This contract has incurred a loss, and, applying the prudenceconcept, this loss should be written off as soon as it is incurred.Contract STU: Applying the prudence concept, a proportion of the profit
cash received to datecontract price
is recognized in this period. The proportion of profit that is recognized isarbitrary and very much a matter of opinion. Alternative apportionmentsapplying the concept of prudence could have been applied.
88 ACCOUNTING ENTRIES FOR A JOB COSTING SYSTEM118

PROCESS COSTING 89
Solution SM 6.1(a) (i) Process A account
(kg) (£) (kg) (£) (£)Direct material 2000 10 000 Normal loss 400 0.50 200Direct labour 7 200 Process B 1400 18.575 26 005Process costs 8 400 Abnormal loss 200 18.575 3 715Overhead 4 320–––– –––––– –––– ––––––
2000 29 920 2000 29 920–––– –––––– –––– ––––––Unit cost � (£29 920 � £200)/1600 � £18.575
(ii) Process B account(kg) (£) (kg) (£) (£)
Process A 1400 26 005 Finished goods 2620 21.750 56 989Direct material 1400 16 800 Normal loss 280 1.825 511Direct labour 4 200 (10% � 2800)Overhead 2 520Process costs 5 800––––––
55 325Abnormal gain 100 2 175–––– –––––– –––– ––––––
2900 57 000 2900 57 500–––– –––––– –––– ––––––Unit cost � (£55 325 � £511)/(2800 � 280) � £21.75
(iii) Normal loss/gain account(kg) (£) (kg) (£)
Process A 400 200 Bank (A) 400 200.5Process B 280 511 Abnormal gain (B) 100 182.5
Bank (B) 180 328.5––– ––– ––– –––––680 711 680 711.5––– ––– ––– –––––
(iv) Abnormal loss/gain(£) (£)
Process A 3715.5 Process B 2175.5Normal loss/gain (B) 182.5 Bank 100.5
Profit and Loss 1622.5–––––– ––––––3897.5 3897.5–––––– ––––––
(v) Finished goods(£) (£)
Process B 56 989
(vi) Profit and loss account (extract)(£) (£)
Abnormal loss/gain 1622.5
Process costingSolutions to Chapter 6 questions
119
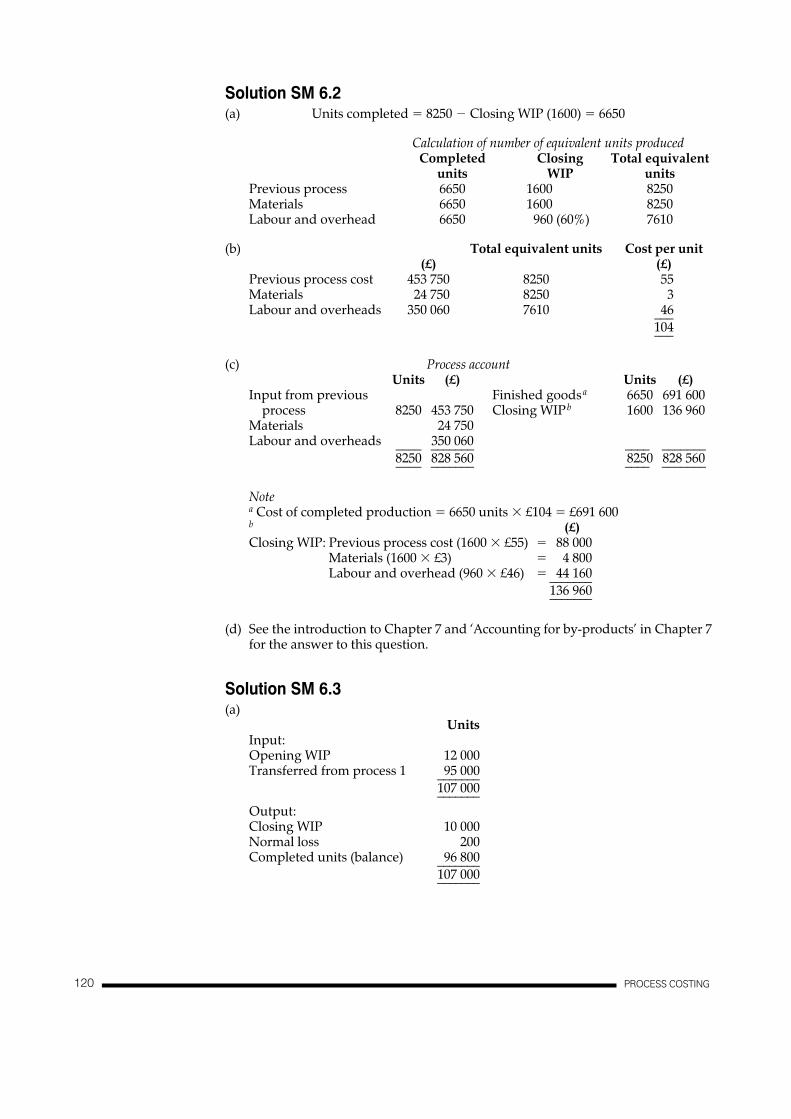
90 PROCESS COSTING
Solution SM 6.2(a) Units completed � 8250 � Closing WIP (1600) � 6650
Calculation of number of equivalent units producedCompleted Closing Total equivalent
units WIP unitsPrevious process 6650 1600 8250Materials 6650 1600 8250Labour and overhead 6650 960 (60%) 7610
(b) Total equivalent units Cost per unit(£) (£)
Previous process cost 453 750 8250 55Materials 24 750 8250 3Labour and overheads 350 060 7610 46–––
104–––
(c) Process accountUnits (£) Units (£)
Input from previous Finished goods a 6650 691 600process 8250 453 750 Closing WIP b 1600 136 960
Materials 24 750Labour and overheads 350 060–––– ––––––– –––– –––––––
8250 828 560 8250 828 560–––– ––––––– –––– –––––––
Notea Cost of completed production � 6650 units � £104 � £691 600b (£)Closing WIP: Previous process cost (1600 � £55) � 88 000
Materials (1600 � £3) � 4 800Labour and overhead (960 � £46) � 44 160–––––––
136 960–––––––
(d) See the introduction to Chapter 7 and ‘Accounting for by-products’ in Chapter 7for the answer to this question.
Solution SM 6.3(a)
UnitsInput:Opening WIP 12 000Transferred from process 1 95 000–––––––
107 000–––––––Output:Closing WIP 10 000Normal loss 200Completed units (balance) 96 800–––––––
107 000–––––––
120

PROCESS COSTING 91
Statement of completed production and calculation of cost per unit (Process 2)Opening Current Total Completed Closing Total Cost per WIPWIP (£) cost (£) cost (£) units WIP equiv. unit (£)
units (£)Previousprocess cost 13 440 107 790 121 230 96 800 10 000 106 800 1.135 11 350Materials added 4 970 44 000 48 970 96 800 9 000 105 800 0.463 4 167Conversion costs 3 120 51 480 54 600 96 800 7 000 103 800 0.526 3 682
–––––– –––––– –––––– –––––– ––––––21 530 203 270 224 800 2.124 19 199–––––– –––––– –––––– ––––––
Completed units (96 800 × £2.124) 205 601–––––––224 800–––––––
Note that the above answer is based on the short-cut approach described inAppendix 6.1.
(b)Process 2 Account
Units (£) Units (£)Opening WIP 12 000 21 530 Finished goods 96 800 205 601Transferred from
process 1 95 000 107 790 Normal loss 200 —Materials 44 000 Closing WIP 10 000 19 199Conversion cost 51 480––––––– ––––––– ––––––– –––––––
107 000 224 800 107 000 224 800––––––– ––––––– ––––––– –––––––
(c) If losses are not expected to occur the loss would be abnormal. Because abnor-mal losses are not an inherent part of the production process and arise frominefficiencies they are not included in the process costs. Instead, they arecharged with their full share of production costs and removed (credited) fromthe process account and reported separately as an abnormal loss. The abnormalloss is treated as a period cost and written off in the profit and loss account.
(d) Workings would be different because FIFO assumes that the opening WIP isthe first group of units to be completed during the current period. The openingWIP is charged separately to completed production, and the cost per unit isbased only on current period costs and production for the current period. Thisrequires that opening WIP equivalent units are deducted from completed unitsto derive current period equivalent units. The cost per unit is derived fromdividing current period costs by current period total equivalent units.
Solution SM 6.4(a) Fully complete production = Input (36 000) � Closing WIP (8000)
= 28 000 kgNormal loss = 2 800 (10% � 28 000 kg)Abnormal loss = 800 (Actual loss (3600) � 2800)Good output = 24 400 (28 000 � 3600)
(b)
121
(£) (£)Completed units (24 400 � £6.89236) 168 174
Total Cost

92 PROCESS COSTING
Total CostCompleted Abnormal equiv. per
units loss WIP units unit WIP(£) (£) (£)
Previous processcost 166 000 24 400 800 8000 33 200 5.00 40 000
Conversioncost 73 000 24 400 800 4000 29 200 2.50 10 000––––––– –––– –––––––
239 000 7.50 50 000––––––– –––– –––––––
Completed units (24 400 � £7.50) 183 000Abnormal loss (800 � £7.50) 6 000–––––––
239 000–––––––
Distillation process account(kg) (£) (kg) (£)
Input from mixing 36 000 166 000 Finished goods 24 400 183 000Labour 43 800 Abnormal loss 800 6 000Overheads 29 200 Normal loss 2 800 —
Closing WIP 8 000 50 000–––––– ––––––– –––––– ––––––36 000 239 000 36 000 239 000–––––– ––––––– –––––– ––––––
(c) If the scrapped production had a resale value the resale value would becredited to the process account (thus reducing the cost of the process account).The accounting entries would be as follows:
Dr CashCr Process Account (with sales value of normal loss)Cr Abnormal Loss Account (with sales value of abnormal loss)
The following calculations are based on the short-cut method which allo-cates allocates the normal loss between completed units, WIP and the abnormal loss. Because the units actually lost are fully complete it is likely that losses are detected on completion. Therefore the short-cut method is not theoretically cor-rect. Nevertheless the computations suggest that it was the examiner’s intention that the question should be answered using the shortcut method. The revised answer is as follows:
122

PROCESS COSTING 93
Solution SM 6.5(a) Expected output from an input of 39 300 sheets: 3 144 000 cans (39 300 � 80)
Less 1% rejects 31 440 cans–––––––––––––Expected output after rejects 3 112 560 cans–––––––––––––
The normal loss arising from the rejects (31 440 cans) is sold at £0.26 per kg. It is therefore necessary to express the rejects in terms of kilos of metal. Eachsheet weighs 2 kilos but wastage in the form of offcuts is 2% of input. Thereforethe total weight of 80 cans is 1.96 kg (0.98 � 2 kg) and the weight of each can is0.0245 kilos (1.96 kg/80 cans). The weight of the normal loss arising from therejects is 770.28 kg (31 440 � 0.0245 kg). The normal loss resulting from the offcuts is 1572 kg (39 300 � 2 kg � 0.02). Hence the total weight of the normalloss is 2342.28 kilos (1572 kg � 770.28 kg), with an expected sales value of £609(2342.28 kg � £0.26).
Process account(£) (£)
Direct materials Finished goods(39 300 � £2.50) 98 250 (3 100 760 cans � £0.042 a) 130 232
Normal loss 609Direct labour and Abnormal loss
overheads 33 087 (11 800 kg b at £0.042 a) 496––––––– –––––––131 337 131 337––––––– –––––––
Abnormal loss account(£) (£)
Process account 496 Sale proceedsc 75Profit and loss account 421––– –––
496 496––– –––
Notes£98 250 � £33 087 � £609aCost per unit �
expected output (3 112 560 cans)� £0.042 per can
bExpected output (3 112 560) � actual output (3 100 760 cans) � 11 800 canscAbnormal loss � 11 800 cans (3 112 560 � 3 100 760)This will yield 289.1 kilos (11 800 � 0.0245 kilos) of metal with a sales value of£75 (289.1 � £0.26).
(b) (i) See ‘Opening and closing work in progress’ in Chapter 6 for the answer tothis question.
(ii) See ‘Weighted average method’ and ‘First in, first out method’ in Chapter 6for the answer to this question.
Solution SM 6.6(a)
Production statementInput: Units
Opening WIP 20 000Transfer from previous process 180 000–––––––200 000–––––––
123

94 PROCESS COSTING
Output:Closing WIP 18 000Abnormal loss 60Completed units (balance) 181 940–––––––200 000–––––––
Statement of equivalent production and calculation of cost of completed production and WIPCompleted units Closing Current Cost
Current less opening WIP total percosts WIP equivalent Abnormal equivalent equivalent unit
(£) units loss units units (£)Previous process
cost 394 200 161 940 60 18 000 180 000 2.19Materials 110 520 167 940 60 16 200 184 200 0.60Conversion cost 76 506 173 940 60 12 600 186 600 0.41–––––– ––––
581 226 3.20–––––– ––––
(£) (£)Cost of completed production:
Opening WIP (given) 55 160Previous process cost (161 940 � £2.19) 354 649Materials (167 940 � £0.60) 100 764Conversion costs (173 940 � £0.41) 71 315 581 888–––––––
Cost of closing WIP:Previous process cost (18 000 � £2.19) 39 420Materials (16 200 � £0.60) 9 720Conversion costs (12 600 � £0.41) 5 166 54 306–––––––Value of abnormal loss (60 � £3.20) 192–––––––
636 386–––––––
Process 3 account(£) (£)
Opening WIP 55 160 Transfer to finished goodsTransfer from process 2 394 200 stock 581 888Materials 110 520 Abnormal loss 192Conversion costs 76 506 Closing WIP 54 306––––––– –––––––
636 386 636 386––––––– –––––––
(b) Normal losses are unavoidable losses that are expected to occur under efficientoperating conditions. They are an expected production cost and should beabsorbed by the completed production whereas abnormal losses are not includedin the process costs but are removed from the appropriate process account andreported separately as an abnormal loss. See ‘Losses in process and partiallycompleted units’ in the appendix to Chapter 6 for a more detailed explanationof the treatment of normal losses.
(c) If the weighted average method is used, both the units and value of WIP aremerged with current period costs and production to calculate the average costper unit. The weighted average cost per unit is then applied to all completedunits, any abnormal losses and closing WIP equivalent units. In contrast, withthe FIFO method the opening WIP is assumed to be the first group of unitscompleted during the current period. The opening WIP is charged separatelyto completed production, and the cost per unit is based only on current costsand production for the period. The closing WIP is assumed to come from thenew units that have been started during the period.
124
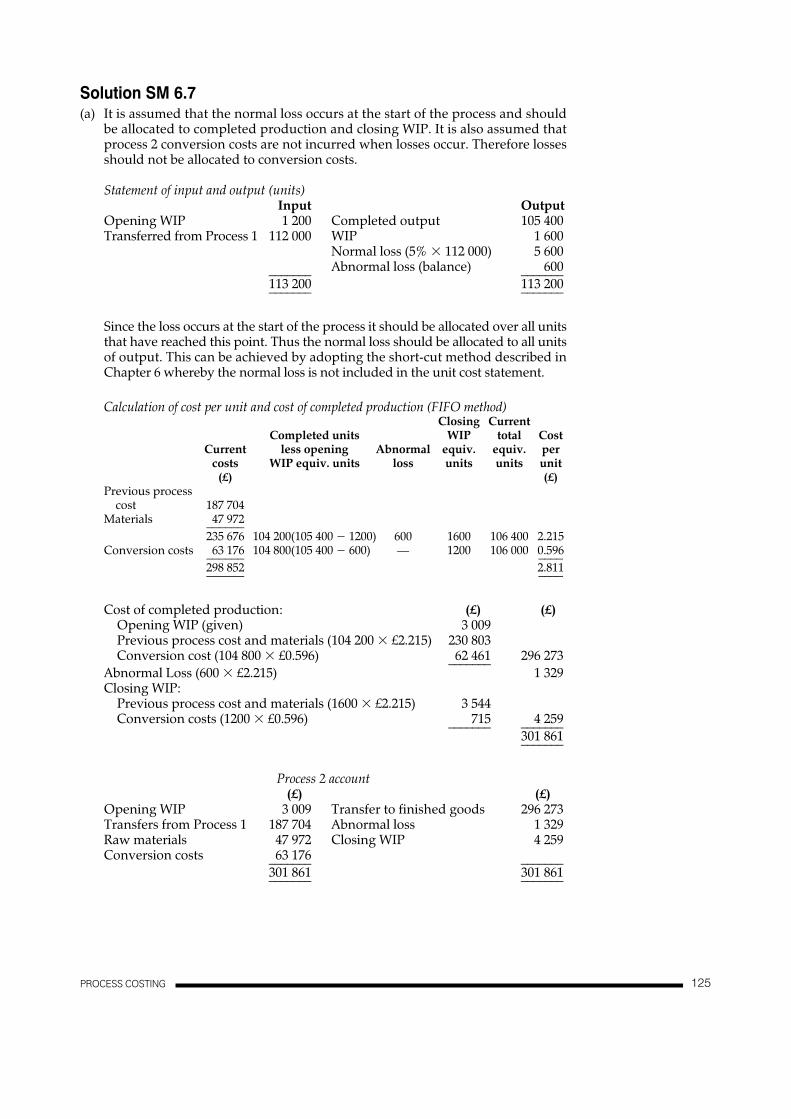
PROCESS COSTING 95
Solution SM 6.7(a) It is assumed that the normal loss occurs at the start of the process and should
be allocated to completed production and closing WIP. It is also assumed thatprocess 2 conversion costs are not incurred when losses occur. Therefore lossesshould not be allocated to conversion costs.
Statement of input and output (units)Input Output
Opening WIP 1 200 Completed output 105 400Transferred from Process 1 112 000 WIP 1 600
Normal loss (5% � 112 000) 5 600Abnormal loss (balance) 600––––––– –––––––
113 200 113 200––––––– –––––––
Since the loss occurs at the start of the process it should be allocated over all unitsthat have reached this point. Thus the normal loss should be allocated to all unitsof output. This can be achieved by adopting the short-cut method described inChapter 6 whereby the normal loss is not included in the unit cost statement.
Calculation of cost per unit and cost of completed production (FIFO method)Closing Current
Completed units WIP total CostCurrent less opening Abnormal equiv. equiv. per
costs WIP equiv. units loss units units unit(£) (£)
Previous processcost 187 704
Materials 47 972––––––235 676 104 200(105 400 � 1200) 600 1600 106 400 2.215
Conversion costs 63 176 104 800(105 400 � 600)0 — 1200 106 000 0.596–––––– ––––298 852 2.811–––––– ––––
Cost of completed production: (£) (£)Opening WIP (given) 3 009Previous process cost and materials (104 200 � £2.215) 230 803Conversion cost (104 800 � £0.596) 62 461 296 273–––––––
Abnormal Loss (600 � £2.215) 1 329Closing WIP:
Previous process cost and materials (1600 � £2.215) 3 544Conversion costs (1200 � £0.596) 715 4 259––––––– –––––––
301 861–––––––
Process 2 account(£) (£)
Opening WIP 3 009 Transfer to finished goods 296 273Transfers from Process 1 187 704 Abnormal loss 1 329Raw materials 47 972 Closing WIP 4 259Conversion costs 63 176––––––– –––––––
301 861 301 861––––––– –––––––
125

(b) If the loss occurs at the end of the process then the normal loss should only becharged to those units that have reached the end of the process. In otherwords, the cost of normal losses should not be allocated to closing WIP. Tomeet this requirement a separate column for normal losses is incorporated intothe unit cost statement and the normal loss equivalent units are included in thecalculation of total equivalent units. The cost of the normal loss should becalculated and added to the cost of completed production. For an illustration of
appendix to Chapter 6.
96 PROCESS COSTING
the approach see in the
Actual input 2500 kgNormal wastage (10%) 250Abnormal loss 75Balance = Good production 2175
Answer = A
Equivalent units (FIFO)
Completed units less Closing Abnormal Totalopening WIP equiv. WIP equiv. loss equiv. equiv.units units unitsa units
Materials 23 000 (24 000 – 1000) 3500 500 27 000Conversion cost 23 300 (24 000 – 700) 2800 (80%) 300 (60%) 26 400
NoteaTotal input (30 000 + 1000) − ((30 000 × 10%) + 24 000 + 3500) = 500
It is assumed that the answer should adopt the short-cut method and ignore the normal loss in the cost per unit calculation.(a) Answer = (iii)(b) Answer = (i)
Completed units lessopening WIPequivalent units 4000 (4100 less 40% × 250 units)Abnormal loss 275Closing WIP 45 (150 × 30%)Equivalent units 4320
It is assumed that the short-cut method (see Appendix 6.1) will be used in respect of normal losses.
Answer = C
Solution SM 6.8
Solution SM 6.9
Solution SM 6.10
126

Solution SM 6.11
Cost per unit of output
Input cost (£52 500 + £9625 = 62125) – less expected loss (0.25 × 3500 × £8 = £7000)
=
Expected output (0.75 × 3500)
= £21
Value of actual output = 2800 × £21 = £58 800
Answer = C
Note that there is an abnormal gain of 175 units (Actual output of 2800 units less
expected output of 2625 units) The debit side of the process account will consist of:
Input cost (3500 kg) = £62 125
Abnormal gain = 3 675
(175 kg at £21)
65 800
The following entries will be made on the credit side:
Normal loss (875 kg at £8) = £7 000
Value of actual output = £58 800
£65 500
Solution SM 6.12
Answer = (a)
PROCESS COSTING
Units
Opening stock 400
Input 3000
3400
Closing stock (200)
Actual losses (normal + abnormal) (400)
Output 2800
95 127

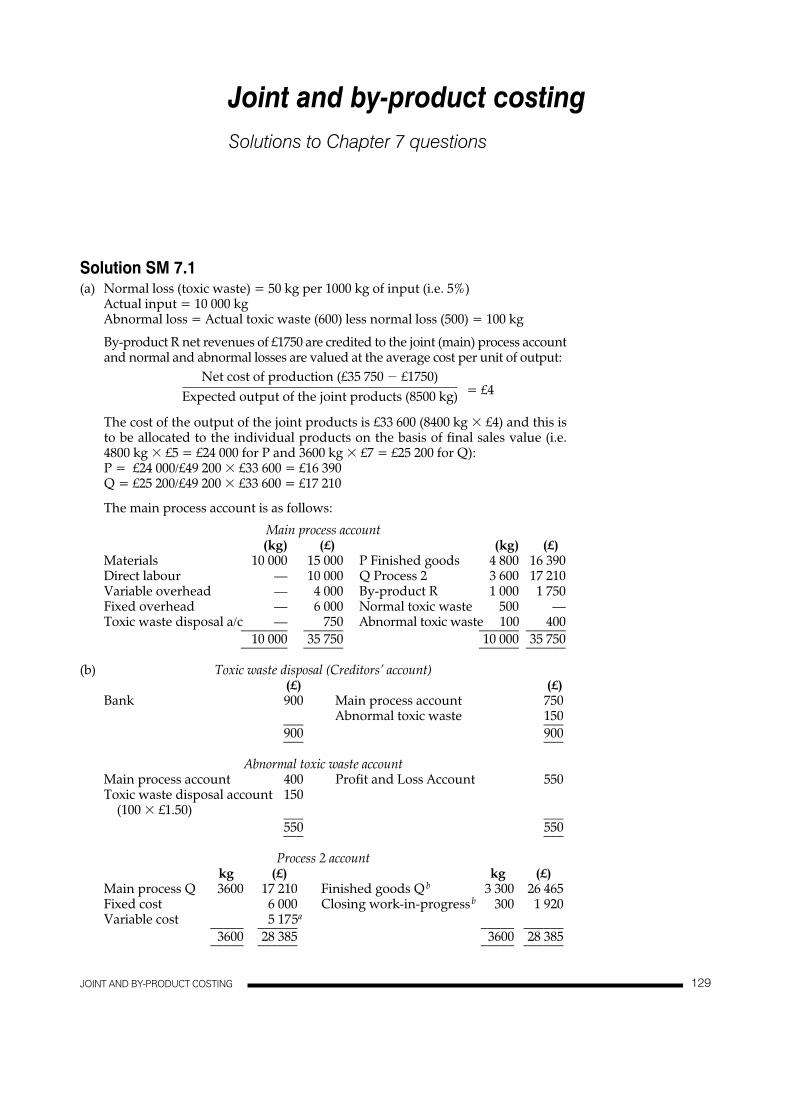
JOINT AND BY-PRODUCT COSTING 97
Solution SM 7.1(a) Normal loss (toxic waste) = 50 kg per 1000 kg of input (i.e. 5%)
Actual input = 10 000 kgAbnormal loss = Actual toxic waste (600) less normal loss (500) = 100 kg
By-product R net revenues of £1750 are credited to the joint (main) process accountand normal and abnormal losses are valued at the average cost per unit of output:
= £4
The cost of the output of the joint products is £33 600 (8400 kg � £4) and this isto be allocated to the individual products on the basis of final sales value (i.e. 4800 kg � £5 = £24 000 for P and 3600 kg � £7 = £25 200 for Q):P = £24 000/£49 200 � £33 600 = £16 390Q = £25 200/£49 200 � £33 600 = £17 210
The main process account is as follows:
Main process account(kg) (£) (kg) (£)
Materials 10 000 15 000 P Finished goods 4 800 16 390Direct labour — 10 000 Q Process 2 3 600 17 210Variable overhead — 4 000 By-product R 1 000 1 750Fixed overhead — 6 000 Normal toxic waste 500 —Toxic waste disposal a/c — 750 Abnormal toxic waste 100 400––––––– –––––– –––––– ––––––
10 000 35 750 10 000 35 750––––––– –––––– –––––– ––––––
(b) Toxic waste disposal (Creditors’ account)(£) (£)
Bank 900 Main process account 750Abnormal toxic waste 150––– –––
900 900––– –––
Abnormal toxic waste accountMain process account 400 Profit and Loss Account 550Toxic waste disposal account 150
(100 � £1.50) ––– –––550 550––– –––
Process 2 accountkg (£) kg (£)
Main process Q 3600 17 210 Finished goods Q b 3 300 26 465Fixed cost 6 000 Closing work-in-progress b 300 1 920Variable cost 5 175a
––––– –––––– ––––– ––––––3600 28 385 3600 28 385––––– –––––– ––––– ––––––
Net cost of production (£35 750 � £1750)������Expected output of the joint products (8500 kg)
Joint and by-product costingSolutions to Chapter 7 questions
129

Notesa 3300 + (50% � 300) � £1.50 = £5175b
TotalCompleted WIP equiv. equiv. Cost per
(£) units units units unitPrevious process cost 17 210 3300 300 3600 £4.78Conversion cost 11 175 3300 150 3450 £3.24–––––
£8.02–––––(£)
Completed units (3 300 units � £8.02) 26 465WIP (300 � £4.78) + (150 � £3.24) 1 920––––––
28 385––––––(c) See the section on methods of apportioning joint costs to joint products in
(d) (£)Incremental sales revenue per kg from further processing (£7 � £4.30) 2.70Incremental (variable) cost per kg of further processing 1.50––––Incremental contribution per kg from further processing 1.20––––
(£)At an output of 3600 kg the incremental contribution is 4320Avoidable fixed costs 3600–––––Net benefit 720–––––
Break-even point = = 3000 kg
Further processing should be undertaken if output is expected to exceed 3000 kgper week.
Solution SM 7.2(a) See Figure 7.2
Avoidable fixed costs (£3600)����Incremental unit contribution (£1.20)
98 JOINT AND BY-PRODUCT COSTING
X
Y
B
X2
Z
X1
Y
X
XXX
400 Tonnes ×£7(1) = £2800 + £1500
300 Tonnes ×£7(1) = £2100 + £3300
200 Tonnes ×£7(1) = £1400 + £2400
CR(£300)80 Tonnes ×£19(3) = £1520
120 Tonnes×£19(3) = £2280
75 Tonnes ×£18(2) = £1350
225 Tonnes ×£18(2) = £4050
100 Tonnes
INPUT1000
Tonnes£4000
Distillation£2600
Heattreatment
Seconddistillation
Product Blending£1155
555 Tonnes×£15(4)= £8325
Z
FFigure 7.2
Chapter 7 for the answer to this question.
130

JOINT AND BY-PRODUCT COSTING 99
Workings(W1) (4000 � 2600 � 300)/900 � £7(W2) (2100 � 3300)/300 � £18(W3) (1400 � 2400)/200 � £19(W4) (2800 � 1500 � 1155 � 1350 � 1520)/555 � £15
(b) OutputProduct (tonnes) Total cost Cost per tonne
(£) (£)XXX 555 8325 15
Y 225 4050 18Z 120 2280 19
(c) An alternative treatment is to credit the income direct to the profit and lossaccount rather than crediting the proceeds to the process from which the by-product was derived.
Solution SM 7.3(a) You can see from the question that the input is 240 000 kg and the output is
190 000 kg. It is assumed that the difference of 50 000 kg is a normal loss in output which occurs at the start of processing. Therefore the loss should becharged to the completed production and WIP. By making no entry for normallosses in the cost per unit calculation the normal loss is automaticallyapportioned between completed units and WIP.
Total CostOpening Current Total Completed Closing equivalent per WIP
WIP cost cost units WIP units unit value(£) (£) (£) (£) (£)
Materials 20 000 75 000 95 000 160 000 30 000 190 000 0.50 15 000Processing
costs 12 000 96 000 108 000 160 000 20 000 180 000 0.60 12 000–––––– ––– ––––––203 000 1.10 27 000
Completed units (160 000 units � £1.10) 176 000––––––203 000
(b) This question requires a comparison of incremental revenues and incrementalcosts. Note that the costs of process 1 are irrelevant to the decision since they will remain the same whichever of the two alternatives are selected. Youshould also note that further processing 120 000 kg of the compound results in 240 000 kg of Starcomp.
Incremental sales revenue:(£) (£)
Starcomp (120 000 � 2 kg � £2) 480 000Compound (120 000 � £1.60) 192 000 288 000–––––––
Incremental costs:Materials 120 000Processing costs 120 000 240 000––––––– –––––––
Incremental profits 48 000–––––––
It is therefore worthwhile further processing the compound.
131

100 JOINT AND BY-PRODUCT COSTING
(c) The sales revenue should cover the additional costs of further processing the 40 000 kg compound and the lost sales revenue from the 40 000 kg compound if it is sold without further processing.
Additional processing costs:
(£)Materials (£160 000 � £120 000) 40 000Processing costs (£140 000 � £120 000) 20 000
Lost compound sales revenue (40 000 � £1.60) 64 000–––––––124 000–––––––
£124 000Minimum selling price per kg of Starcomp �
40 000 kg � 2
� £1.55
Solution SM 7.4(a) Profit and loss account
W X Z Total(£) (£) (£) (£)
Opening stock — — 8 640 8 640Production cost 189 060 228 790 108 750 526 600Less closing stock (14 385) (15 070) (15 010) (44 465)––––––––––––––––––––––––––––––––––––––––Cost of sales 174 675 213 720 102 380 490 775Selling and administration costs 24 098 27 768 10 011 61 877––––––––––––––––––––––––––––––––––––––––Total costs 198 773 241 488 112 391 552 652Sales 240 975 277 680 100 110 618 765––––––––––––––––––––––––––––––––––––––––Profit/(loss) 42 202 36 192 (12 281) 66 113––––––––––––––––––––––––––––––––––––––––
WorkingsJoint process cost per kilo of output � £0.685 per kg (£509 640/744 000 kg)Production cost for products W, X and Y:
Product W (276 000 kg � £0.685) � £189 060X (334 000 kg � £0.685) � £228 790Y (134 000 kg � £0.685) � £91 790
Closing stocks for products W and X:
Product W (21 000 kg � £0.685) � £14 385X (22 000 kg � £0.685) � £15 070
Cost per kilo of product Z:
(£)Product Y (128 000 kg � £0.685) = 87 680Further processing costs 17 920Less by-product sales (8000 � £0.12) = (960)––––––
104 640––––––Cost per kilo (£104 640/96 000 kg) £1.09
Closing stock of product Z (10 000 kg � £1.09) � £10 900Add closing stock of input Y (6000 � £0.685) � £4 110––––––Closing stock relating to product Z £15 010––––––
132

Production cost relating to final product Z:
(£)Product Y (134 000 kg � £0.685) = 91 790Further processing costs 17 920Less by-product costs (960)––––––
108 750––––––
(b) The joint costs are common and unavoidable to both alternatives, and aretherefore not relevant for the decision under consideration. Further processingfrom an input of 128 000 kg of Y has resulted in an output of 96 000 kg of Z.Thus it requires 1.33 kg of Y to produce 1 kg of Z (128/96).
(£)Revenue per kilo for product Z 1.065 (£100 110/94 000 kg)Sale proceeds at split-off point
(1.33 � £0.62) 0.823–––––Incremental revenue per kg from further
processing 0.242Incremental costs of further processing 0.177 [(£17 920 � £960)/96 000]–––––Incremental profit from further processing 0.065–––––
It is assumed that selling and administration costs are fixed and will be unaffectedby which alternative is selected. The company should therefore process Yfurther into product Z and not accept the offer from the other company topurchase the entire output of product Y.
(c) See ‘Methods of allocating joint costs to joint products’ in Chapter 7 for theanswer to this question.
JOINT AND BY-PRODUCT COSTING 101
(£)Joint costs apportioned to P (4500/9750 × £117 000) = 54 000Further processing costs (4500 × £9) = 40 500Total cost 94 500Sales revenues (4050 × £25) 101 250Profi t 6 750
Answer = A
Total sales revenue = £1 080 000 (£18 × 10 000 + £25 × 20 000 + £20 × 20 000)Joint costs to be allocated = £270 000 (277 000 total output cost − £2 × 3500 by-
product sales revenue)Costs allocated to product 3 = 270 000 × (£20 × 20 000)/£1 080 000 = £100 000Unit cost of product 3 = £5 per unit (£100 000/20 000 units)Answer = C
Solution SM 7.5
Solution SM 7.6
133

102 INCOME EFFECTS OF ALTERNATIVE COST ACCUMULATION SYSTEMS
Solution SM 8.1(a) Manufacturing cost per unit of output = variable cost (£6.40) + fixed cost
(£92 000/20 000 = £4.60) = £11Absorption costing profit statement
(£000)Sales (22 000 units at £14 per unit) 308.0Manufacturing cost of sales (22 000 units × £11) 242.0
–––––Manufacturing profit before adjustment 66.0Overhead over-absorbed a 4.6
–––––Manufacturing profit 70.6
–––––
Notea The normal activity that was used to establish the fixed overhead absorption
rate was 20 000 units but actual production in period 2 was 21 000 units.Therefore a period cost adjustment is required because there is an over-absorption of fixed overheads of £4 600 [(22 000 units – 21 000 units) × £4.60].
(b) (£000)Sales 308.0Variable cost of sales (22 000 units × £6.40) 140.8
–––––Contribution to fixed costs 167.2Less fixed overheads 92.0
–––––Profit 75.2
–––––
(c) (i) Compared with period 1 profits are £34 800 higher in period 2 (£70 600 – £35 800). The reasons for the change are as follows:
(£000)Additional sales (7000 units at a profit of £3 per unit) 21 000Difference in fixed overhead absorption (3000 units extra
production at £4.60 per unit) a 13 800––––––
Additional profit 34 800––––––
Notea Because fixed overheads are absorbed on the basis of normal activity (20 000
units) there would have been an under-recovery of £9200 (2000 units ×£4.60) in period 1 when production was 18 000 units. In period 2 productionexceeds normal activity by 1000 units resulting in an over-recovery of £4600.The difference between the under- and over-recovery of £13 800 (£9200 +£4600) represents a period cost adjustment that is reflected in an increase inprofits of £13 800. In other words, the under-recovery of £9200 was notrequired in period 2 and in addition there was an over-recovery of £4600.
Income effects of alternative costaccumulation systemsSolutions to Chapter 8 questions
134
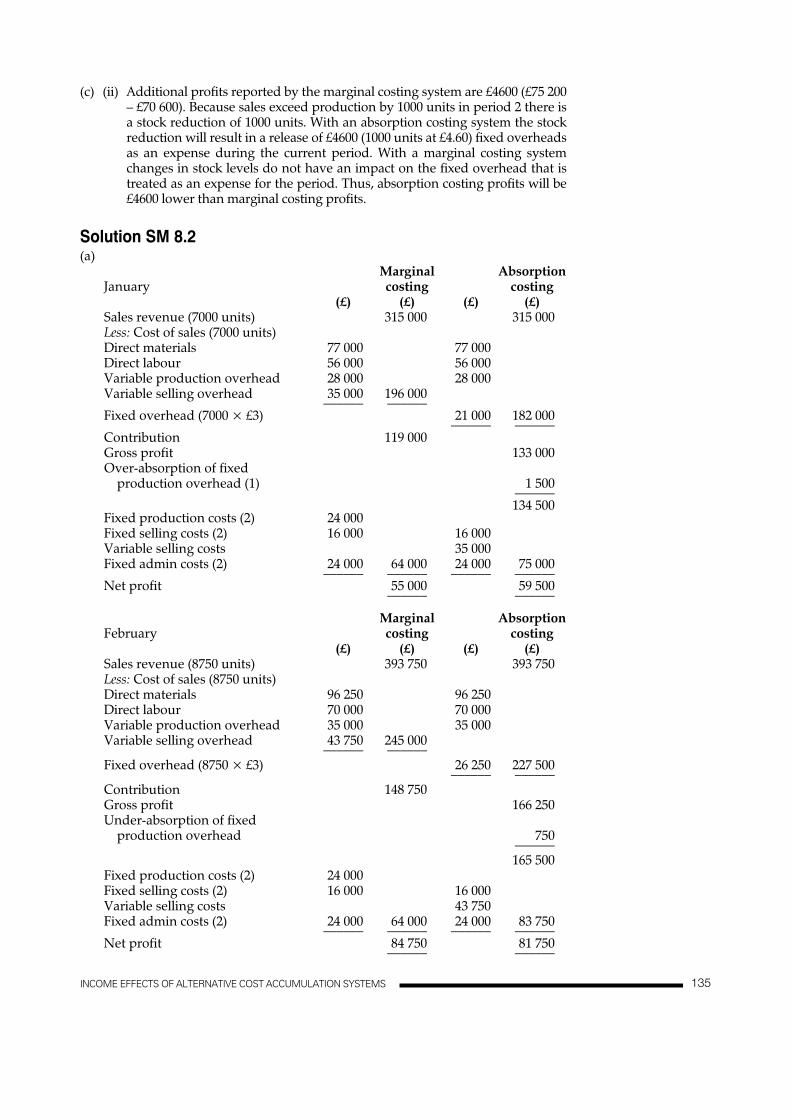
INCOME EFFECTS OF ALTERNATIVE COST ACCUMULATION SYSTEMS 103
(c) (ii) Additional profits reported by the marginal costing system are £4600 (£75 200– £70 600). Because sales exceed production by 1000 units in period 2 there isa stock reduction of 1000 units. With an absorption costing system the stockreduction will result in a release of £4600 (1000 units at £4.60) fixed overheadsas an expense during the current period. With a marginal costing systemchanges in stock levels do not have an impact on the fixed overhead that istreated as an expense for the period. Thus, absorption costing profits will be£4600 lower than marginal costing profits.
Solution SM 8.2(a)
Marginal AbsorptionJanuary costing costing
(£) (£) (£) (£)Sales revenue (7000 units) 315 000 315 000Less: Cost of sales (7000 units)Direct materials 77 000 77 000Direct labour 56 000 56 000Variable production overhead 28 000 28 000Variable selling overhead 35 000 196 000
–––––– ––––––Fixed overhead (7000 × £3) 21 000 182 000
–––––– ––––––Contribution 119 000Gross profit 133 000Over-absorption of fixed
production overhead (1) 1 500––––––134 500
Fixed production costs (2) 24 000Fixed selling costs (2) 16 000 16 000Variable selling costs 35 000Fixed admin costs (2) 24 000 64 000 24 000 75 000
–––––– –––––– –––––– ––––––Net profit 55 000 59 500
–––––– ––––––
Marginal AbsorptionFebruary costing costing
(£) (£) (£) (£)Sales revenue (8750 units) 393 750 393 750Less: Cost of sales (8750 units)Direct materials 96 250 96 250Direct labour 70 000 70 000Variable production overhead 35 000 35 000Variable selling overhead 43 750 245 000
–––––– ––––––Fixed overhead (8750 × £3) 26 250 227 500
–––––– ––––––Contribution 148 750Gross profit 166 250Under-absorption of fixed
production overhead 750––––––165 500
Fixed production costs (2) 24 000Fixed selling costs (2) 16 000 16 000Variable selling costs 43 750Fixed admin costs (2) 24 000 64 000 24 000 83 750
–––––– –––––– –––––– ––––––Net profit 84 750 81 750
–––––– ––––––
135
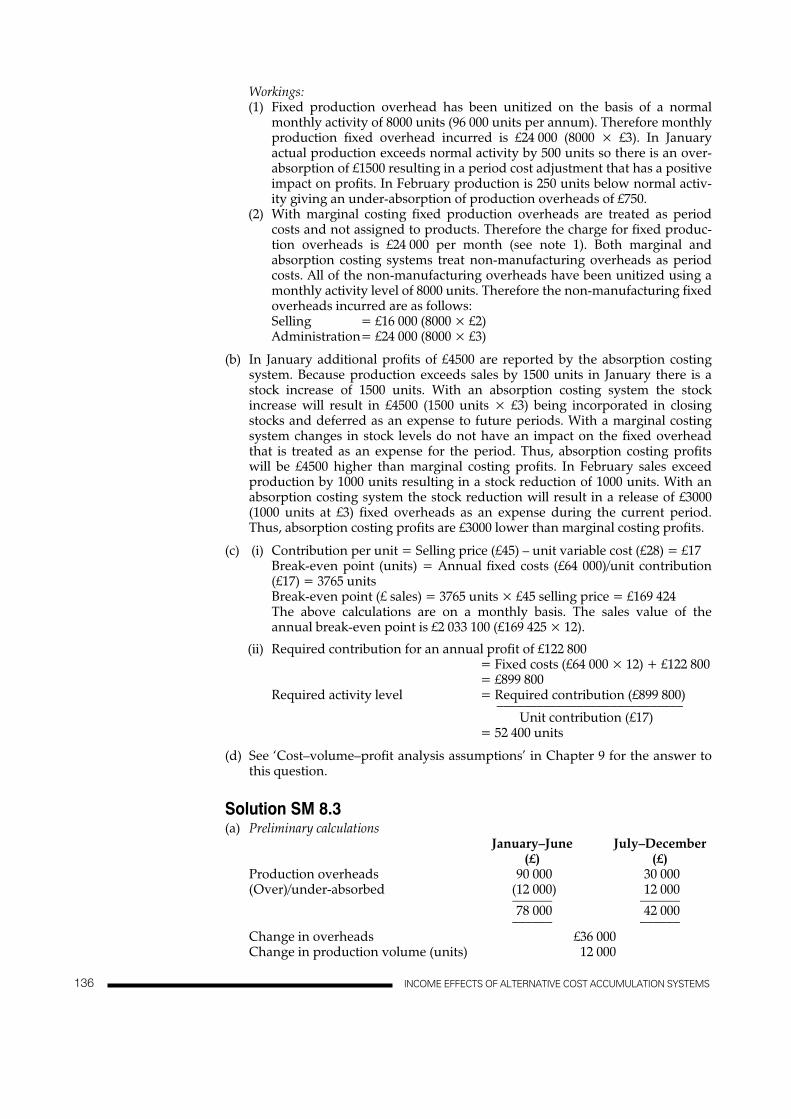
Workings: (1) Fixed production overhead has been unitized on the basis of a normal
monthly activity of 8000 units (96 000 units per annum). Therefore monthlyproduction fixed overhead incurred is £24 000 (8000 × £3). In Januaryactual production exceeds normal activity by 500 units so there is an over-absorption of £1500 resulting in a period cost adjustment that has a positiveimpact on profits. In February production is 250 units below normal activ-ity giving an under-absorption of production overheads of £750.
(2) With marginal costing fixed production overheads are treated as periodcosts and not assigned to products. Therefore the charge for fixed produc-tion overheads is £24 000 per month (see note 1). Both marginal andabsorption costing systems treat non-manufacturing overheads as periodcosts. All of the non-manufacturing overheads have been unitized using amonthly activity level of 8000 units. Therefore the non-manufacturing fixedoverheads incurred are as follows: Selling = £16 000 (8000 × £2)Administration= £24 000 (8000 × £3)
(b) In January additional profits of £4500 are reported by the absorption costingsystem. Because production exceeds sales by 1500 units in January there is astock increase of 1500 units. With an absorption costing system the stockincrease will result in £4500 (1500 units × £3) being incorporated in closingstocks and deferred as an expense to future periods. With a marginal costingsystem changes in stock levels do not have an impact on the fixed overheadthat is treated as an expense for the period. Thus, absorption costing profitswill be £4500 higher than marginal costing profits. In February sales exceedproduction by 1000 units resulting in a stock reduction of 1000 units. With anabsorption costing system the stock reduction will result in a release of £3000(1000 units at £3) fixed overheads as an expense during the current period.Thus, absorption costing profits are £3000 lower than marginal costing profits.
(c) (i) Contribution per unit = Selling price (£45) – unit variable cost (£28) = £17Break-even point (units) = Annual fixed costs (£64 000)/unit contribution(£17) = 3765 unitsBreak-even point (£ sales) = 3765 units × £45 selling price = £169 424The above calculations are on a monthly basis. The sales value of theannual break-even point is £2 033 100 (£169 425 × 12).
(ii) Required contribution for an annual profit of £122 800 = Fixed costs (£64 000 × 12) + £122 800= £899 800
Required activity level = Required contribution (£899 800)––––––––––––––––––––––––––––
Unit contribution (£17)= 52 400 units
(d) See ‘Cost–volume–profit analysis assumptions’ in Chapter 9 for the answer tothis question.
Solution SM 8.3(a) Preliminary calculations
January–June July–December(£) (£)
Production overheads 90 000 30 000(Over)/under-absorbed (12 000) 12 000
–––––– ––––––78 000 42 000
–––––– ––––––Change in overheads £36 000Change in production volume (units) 12 000
104 INCOME EFFECTS OF ALTERNATIVE COST ACCUMULATION SYSTEMS136

INCOME EFFECTS OF ALTERNATIVE COST ACCUMULATION SYSTEMS 105
Production variable overhead rate per unit £3Fixed production overheads (£78 000 – (18 000 × £3)) £24 000Distribution costs £45 000 £40 000Decrease in costs £5 000Decrease in sales volume (units) 5 000Distribution cost per unit sold £1Fixed distribution cost (£45 000 – (15 000 × £1)) £30 000Unit costs are as follows:
(£) (£)Selling price 36Direct materials 6Direct labour 9Variable production overhead 3Variable distribution cost 1 19–– ––Contribution 17––
Note that the unit direct costs are derived by dividing the total cost by unitsproduced
Marginal costing profit statement
January–June July–December(£000) (£000) (£000) (£000)
Sales 540 360Variable costs at £19 per unit sold 285 190
––– –––Contribution 255 170Fixed costs:Production overhead 24 24Selling costs 50 50Distribution cost 30 30Administration 80 184 80 184
–– ––– –– –––Profit 71 (14)
––– –––
(b) Marginal costing stock valuation per unit = £18 per unit production variable costAbsorption costing stock valuation per unit = £20 per unit total production cost
January–June July–December(£000) (£000)
Absorption costing profit 77 (22)Fixed overheads in stock increase of 3000 units 6Fixed overheads in stock decrease of 4000 units (8)–– ––Marginal costing profit 71 14
–– ––
(c) Absorption gross profit per unit sold = Annual gross profit (£400 000)/Annualproduction (15 000 units)
= £16(£000)
Profit from January–June 77Reduction in sales volume (5000 × £16) (80)Difference in overhead recovery (£12 000 over-recovery and £12 000
under-recovery) (24)Reduction in distribution cost 5
––(22)––
137

106 INCOME EFFECTS OF ALTERNATIVE COST ACCUMULATION SYSTEMS
(d) Fixed cost £184 000 × 2 = £368 000Contribution per unit £17Break-even point 21 647 units (Fixed costs/contribution per unit)
(e) See ‘Some arguments in support of variable costing’ in Chapter 8 for the answerto this question.
Solution SM 8.4(a) Budgeted fixed overheads (£300 000)
Fixed overhead rate per unit = –––––––––––––––––––––––––––––––– = £7.50Budgeted production (40 000 units)
Absorption Costing (FIFO) Profit Statement:(£000)
Sales (42 000 � £72) 3024Less cost of sales:Opening stock (2000 � £30) 60Add production (46 000 � £52.50 a) 2415–––––
2475Less closing stock (6000 � £52.50) 315 2160––––– –––––
864Add over-absorption of overheads b 27–––––Profit 891–––––
Notes:a Variable cost per unit = £2070/46 000 = £45Total cost per unit = £45 + £7.50 Fixed overhead = £52.50b Overhead absorbed (46 000 � £7.50) = £345 000Actual overhead incurred = £318 000––––––––Over-recovery £27 000––––––––
Marginal Costing (FIFO) Profit Statement:(£000) (£000)
Sales 3024Less cost of sales:Opening stock (2000 � £25) 50Add production (46 000 � £45) 2070–––––
2120Less closing stock (6000 � £45) 270 1850––––– –––––Contribution 1174Less fixed overheads incurred 318–––––Profit 856–––––
Reconciliation:Absorption profit exceeds marginal costing profit by £35 000 (£891 000 � £856 000).The difference is due to the fixed overheads carried forward in the stock valuations:
(£)Fixed overheads in closing stocks (6000 � £7.50) 45 000Less fixed overheads in opening stocks (2000 � £5) 10 000––––––Fixed overheads included in stock movement 35 000––––––
Absorption costing gives a higher profit because more of the fixed overheadsare carried forward into the next accounting period than were brought forwardfrom the last accounting period.
138

(b) Absorption Costing (AVECO) Profit Statement:(£000) (£000)
Sales 3024Opening stock plus production
(48 000 � £51.56 a) 2475Less closing stock (6000 � £51.56) 309 2166––––– –––––
858Add over-absorption of overheads 27–––––Profit 885–––––
Marginal Costing (AVECO) Profit Statement:(£000) (£000)
Sales 3024Less cost of salesOpening stock plus production
(48 000 � £44.17 b) 2120Less closing stock (6000 � £44.17) 265 1855––––– –––––Contribution 1169Less fixed overheads 318–––––Profit 851–––––
Notesa With the AVECO method the opening stock is merged with the production ofthe current period to ascertain the average unit cost: Opening stock (2000 � £30) + Production cost (£2 415 000) = £2 475 000Average cost per unit = £2 475 000/48 000 unitsb Average cost = (Production cost (£2 070 000) + Opening stock (50 000))/48 000units.
Reconciliation:(£000)
Difference in profits (£885 � £851) 34–––Fixed overheads in closing stocks (309 � 265) 44Less fixed overheads in opening stock (2000 � £5) 10
–––Fixed overheads included in stock movement 34
–––
The variations in profits between (a) and (b) are £6000 for absorption costingand £5000 for marginal costing. With the FIFO method all of the lower costbrought forward from the previous period is charged as an expense against thecurrent period. The closing stock is derived only from current period costs.With the AVECO method the opening stock is merged with the units producedin the current period and is thus allocated between cost of sales and closingstocks. Therefore some of the lower cost brought forward from the previousperiod is incorporated in the closing stock at the end of the period.
INCOME EFFECTS OF ALTERNATIVE COST ACCUMULATION SYSTEMS 107139

106 INCOME EFFECTS OF ALTERNATIVE COST ACCUMULATION SYSTEMS
(a) Fixed production overhead per unit = £3 (£300 000/100 000 units)
Absorption costing £000 £000Sales (£50 × 100 000) 5000Cost of sales: Opening stock –Production costs Variable (£19 × 120 000) 2280Fixed (£3 × 120 000) 360
2640Closing stock (£22 × 20 000) (440)Over-absorption (20 000 units × £3) (60)
(2140)Gross profi t 2860Selling costsFixed (150)Variable (£2 × 100 000) (200)Net profi t 2510
(b)Marginal costing £000 £000Sales (£50 × 100 000) 5000Cost of sales: Opening stock —Production costs Variable (£19 × 120 000) 2280
2280Closing stock (£19 × 20 000) (380)Variable selling costs 200
(2100)Contribution 2900Fixed costsProduction (300)Selling (150)Net profi t 2450
Solution SM 8.5
Fixed overhead = £2 per unit (£60 000/30 000 units) Because production exceeded sales by 180 units a sum of £360 (180 × £2) is included in the stock valuation and not charged as an expense of the current period. Fixed overheads of £4640 (£5000 monthly cost – £360) are therefore charged as an expense for the period.
(£)Contribution (2220 units sales × £5.50) 12 210Fixed overheads charged as an expense 4 640Profi t 7 570
Contribution = £4 per unit (£10 selling price − £6 variable cost)Profi t = Total contribution (250 000 × £4) − fi xed costs (200 000 × £2) = £600 000 Answer = B
Solution SM 8.7
Solution SM 8.6
140

Solution SM 8.8
Stocks have increased by 2500 units thus resulting in fixed overheads of £20 000 (2500
units at £8) being absorbed in the stock movements with the absorption costing system.
Therefore the absorption costing system will record £20 000 less than the fixed overheads
incurred for the period. In other words, the marginal costing system will record £20 000
more fixed costs resulting in profit of £22 000 being reported.
Answer = B
Solution SM 8.9 (a) Fixed overheads per unit = $15 000/10 000 units = $1.50
Production exceeds sales so that absorption costing will be greater than the marginal costing profit by the amount of fixed overheads included in the increase in inventories. Therefore the absorption profit will exceed the marginal costing profit by $750 (500 units × $1.50). Answer = (iii)
(b) $ $
Sales (10 300 × $6.40) 65 920 Cost of sales: Variable costs (10 300 × $3.60) 37 080 Fixed overheads (10 300 × $1.50) 15 450
52 530 Under-absorbed fixed overheads 700 53 230
($15 700 − $15 000) Profit 12 690
Answer = (ii)
Solution SM 8.10 The profit difference is due to the fixed overheads being incorporated in the stock movements with the absorption costing system.
Profit difference = £9750 (£60150 − £50 400) Fixed overheads in stock movement = £9750 Physical stock movement = 1500 units Fixed overhead rate per unit = £9750/1500 units
= £6.50 Answer = (d)
INCOME EFFECTS OF ALTERNATIVE COST ACCUMULATION SYSTEMS
107 141

Solution SM 8.11 (a)
£000 £000
Sales (24 000) 864 Less: Production cost of sales: Opening stock (3000 × 28) [W1] 84 Production (22 000 × 28) 616 Closing stock (1000 × 28) (28) – (672)
192 Less: Under absorption of fixed production overhead cost (15)
[W2] (3 000 × 5) Gross profit 177 Less: Non-production costs: Variable selling cost 60 Fixed selling and admin costs 40 – (100)
Net profit 77
Workings W1 Variable production cost per unit
= £23 (£506000/22 000 units) Fixed production overhead cost per unit = £5 (£125 000/5000 units) Total production cost per unit £28
W2 3000 units (normal production of 25000 units less actual production of 22 000 units) at £3 per unit.
(b) £000
Absorption costing net profit 77 Fixed production overheads included in the 10 stock decrease (2000 × £5)
Marginal costing profit 87
(b) Marginal costing is likely to be more relevant for short-term decision-making since it requires the segregation of costs into their fixed and variable elements. For short-term decisions fixed costs are likely to be irrelevant so a costing system that highlights such costs is required.
INCOME EFFECTS OF ALTERNATIVE COST ACCUMULATION SYSTEMS 107 141a

108 COST–VOLUME–PROFIT ANALYSIS
Solution SM 9.1(a) See Figure 9.1 (below).(b) See Chapter 9 for the answer to this question.(c) The major limitations are:
(i) Costs and revenue may only be linear within a certain output range.(ii) In practice, it is difficult to separate fixed and variable costs, and the calcu-
lations will represent an approximation.(iii) It is assumed that profits are calculated on a variable costing basis.(iv) Analysis assumes a single product is sold or a constant sales mix is
maintained.(d) The advantages are:
(i) The information can be absorbed at a glance without the need for detailedfigures.
(ii) Essential features are emphasised.(iii) The graphical presentation can be easily understood by non-accountants.
Cost–volume–profit analysisSolutions to Chapter 9 questions
1 2 3 4 5 6Units of production and sales (000s)
Loss area
Break-even point
Profit area
Margin ofsafety
Fixed cost
80
70
60
50
40
30
20
10
0
Costsandrevenues(£000)
Sales
Total cost
(A)
1 2 3 4 5 6Units of production and sales (000s)
Loss area
Break-even pointProfit area
Fixed cost
80
70
60
50
40
30
20
10
0
Sales
Total cost
Variable cost
Costsandrevenues(£000)
(B)
FFigure 9.1 (A) Break-even chart. (B) Contribution graph
142

COST–VOLUME–PROFIT ANALYSIS 109
Solution SM 9.2
(a) Break-even point = = £2 400 000
Average contribution per £ of sales � [0.7 � (£1 � £0.45)] � [0.3 � (£1 � £0.6)]
(b) The graph (Figure 9.2) is based on the following calculations:
Zero activity: loss � £1 212 000 (fixed costs)£4 m existing sales: (£4m � £0.505) � £1 212 000 � £808 000 profit£4 m revised sales: (£4m � £0.475) � £1 212 000 � £688 000 profitExisting break-even point: £2 400 000Revised break-even point: £2 551 579 (£1 212 000/£0.475)Revised contribution per £ of sales: (0.5 � £0.55) � (0.5 � £0.40) � £0.475
fixed costs (£1 212 000)�����average contribution per £ of sales (£0.505)
Loss areaBreak-even point
1 2 3 4 5 6
Profit area
Units ofproduction and sales
30
20
10
0
10
20
30
(C)
Profits(£000)
Losses(£000)
FFigure 9.1 (C) Profit–volume graph
20001000 3000 4000
1000
750
500
250
0
250
500
750
1000
1250
Profit(£000)
Loss(£000)
(£808000 profit)
(£688000 profit)
Break-even point(revised)
Break-even point(existing)
Salesrevenue(£000)
FFigure 9.2 Profit–volume chart
143

110 COST–VOLUME–PROFIT ANALYSIS
Solution SM 9.3(a) (i)
Products 1 2 3 Total1. Unit contribution £1.31 £0.63 £1.872. Specific fixed costs per unit £0.49 £0.35 £0.623. General fixed costs per unit £0.46 £0.46 £0.464. Sales volume (000s units) 98.2 42.1 111.8 252.15. Total contribution (1 � 4) £128.642 £26.523 £209.066 £364.2316. Total specific fixed costs (2 � 4) £48.118 £14.735 £69.316 £132.1697. Total general fixed costs (3 � 4) £45.172 £19.366 £51.428 £115.9668. Unit selling price £2.92 £1.35 £2.839. Total sales revenue (8 � 4) £286.744 £56.835 £316.394 £659.973
Average contribution per unit � Total contribution (£364.231)/sales volume� (252.1)� £1.4448
Average selling price per unit � Total sales revenue (£659.973)/sales� volume (252.1)� £2.6179
Break-even point (units) �Total fixed costs
Average contribution per unit
� (£132.169 � £115.966)/£1.4448� 171.743 units
Break-even point (sales value)� 171.743 units � average selling price� (£2.6179)� £449.606
Alternatively, the break-even point (sales value) can be calculated using thefollowing formula:
Break-even point �Fixed costs (£132.169 � £115.966)
� Total sales (£659.973)Total contribution (£364.231)
� £449.606
It is assumed that the question requires the calculation of the break-evenpoint to cover both general and specific fixed costs. An alternative answerwould have been to present details of the break-even point to cover onlyspecific fixed costs.
(ii) The planned sales mix for Product 2 that was used to calculate the break-even point in (i) is 42.1/252.1. Therefore the number of units of Product 2 atthe break-even point is:
42.1/252.1 � 171 743 units � 28 681
(b) At the forecast sales volume the profit/contributions are as follows:
(£000s)Contributions to all fixed costs 26.523Less specific fixed costs 14.735––––––Contribution to general fixed costs 11.788Less share of general fixed costs 19.366––––––Net loss 7.578––––––
Product 2 provides a contribution of £11 788 towards general fixed costs and,unless savings in general fixed costs in excess of £11 788 can be made if Product2 is abandoned, it is still viable to produce Product 2. If the company ceases
144

COST–VOLUME–PROFIT ANALYSIS 111
production of Product 2 it will lose a contribution of £11 788 and total profitswill decline by £11 788. The company should investigate whether a greatercontribution than £11 788 can be generated from the resources. If this is notpossible the company should continue production of Product 2.
Solution SM 9.4Task 1 (£) (£)Sales 2 106 000Less variable cost of sales:Cost of beds 1 620 000Commission 210 600Transport 216 000 2 046 600–––––––– ––––––––Contribution 59 400––––––––
Average contribution per bed sold = £59 400/5400 = £11Fixed costs (£8450 + £10 000 + £40 000 + £40 000) = £98 450
Fixed costs (£98 450)Break-even point (units) = –––––––––––––––––––––––– = 8950 bedsContribution per unit (£11)
Average selling price per unit (£2 106 000/5400 beds) = £390Break-even point (sales revenue) = 8950 beds at £390 = £3 490 500
Task 2The letter should include the items listed in (a) to (e) below:
(a) Required contribution: (£)Salary 36 550Interest lost 15 000Fixed costs shown in Task 1 98 450–––––––
150 000Less manager’s salary saved 40 000–––––––Total contribution 110 000–––––––
The minimum profit required to compensate for loss of salary and interest is£11 550 (£110 000 � £98 450 fixed costs).
(b) Required volume = Required contribution (£110 000)/Contribution per unit(£11) = 10 000 beds
(c) Average life of a bed = (9 years � 0.10) + (10 years � 0.60) + (11 years � 0.3) =10.2 years
Total bed population = 44 880 households � 2.1 beds per market = 94 248
94 248 beds Estimated annual demand = –––––––––––––––––––––––––––––––––––– Average replacement period (10.2 years)
= 9 240 beds
(d) The proposal will not achieve the desired profit. Estimated annual sales are9240 beds but 10 000 beds must be sold to achieve the desired profit. Theshortfall of 760 beds will result in profit being £8360 (760 � £11) less than thedesired profit.
145

112 COST–VOLUME–PROFIT ANALYSIS
(e) The estimate of maximum annual sales volume may prove to be inaccuratebecause of the following reasons:(i) The population of Mytown may differ from the sample population. For
example the population of Mytown might contain a greater proportion ofelderly people or younger people with families. Either of these situationsmay result in the buying habits of the population of Mytown being differ-ent from the sample proportion.
(ii) The data is historic and does not take into account future changes such asan increase in wealth of the population, change in composition or a changein buying habits arising from different types of beds being marketed.
Task 3This question requires a knowledge of the material covered in Chapter 11. Thereforeyou should delay attempting this question until you have understood the content ofChapter 11.
A B C Total(£) (£) (£)
Selling price 240 448 672Unit purchase cost 130 310 550Carriage inwards 20 20 20–––– –––– ––––Contribution 90 118 102–––– –––– ––––Square metres per bed 3 4 5Contribution per square metre £30 £29.50 £20.40Ranking 1 2 3Maximum demand 35 45 20Storage required (square metres) 105 180 100 385
Monthly sales schedule and statement of profitability:
(£) (£)Contribution from sales of A (35 � £90) 3150Contribution from sales of B (45 � £118) 5310Contribution from sales of C (3a � £102) 306–––––
8766Less specific avoidable fixed costs:Staff costs 3780Departmental fixed overheads 2000 5780––––– –––––Contribution to general fixed overheads 2986Less general fixed overheads 2520–––––Departmental profit 466–––––
Notea The balance of storage space available for Model C is 300 square metres less theamount allocated to A and B (285 metres) = 15 metres. This will result in the salesof 3 beds (15 metres/5 metres per bed).
Solution SM 9.5(a) Analysis of semi-variable costsa
Method A: variable element � = 100£01000
0c0o0pies
� £0.10 per copyTherefore fixed element � total semi-variable cost (£55 000) � variable cost
(£35 000) at an activity level of 350 000 copiesTherefore fixed element � £20 000
increase in costs���increase in activity
146

Method B: variable element � = 100 0£05000
c0opies
� £0.05 per copyTherefore fixed element � total semi-variable cost (£47 500) � variable costs
(£17 500) at an activity level of 350 000 copiesTherefore fixed element � £30 000
NoteaThe analysis is based on a comparison of total costs and activity levels at 350 000and 450 000 copies per year.
Contribution per copy of new magazineMethod A Method B
(£) (£)Selling price 1.00 1.00Variable cost (given) (0.55) (0.50)Variable element of semi-variable cost (0.10) (0.05)Lost contribution from existing magazine (0.05) (0.05)––––– –––––Contribution 0.30 0.40––––– –––––
Calculation of net increase in company profits
Method A Method BCopies sold 500 000 400 000 600 000 500 000 400 000 600 000Contribution per copy £0.30 £0.30 £0.30 £0.40 £0.40 £0.40Total contribution £150 000 £120 000 £180 000 £200 000 £160 000 £240 000Fixed costs a £100 000 £100 000 £100 000 £150 000 £150 000 £150 000–––––––––––––––––––––––––––––––––––––––––––––––––––––––––Net increase in profit £50 000 £20 000 £80 000 £50 000 £10 000 £90 000
NoteaMethod A � specific fixed costs (£80 000) � semi-variable element (£20 000)
� £100 000Method B � specific fixed costs (£120 000) � semi-variable element (£30 000)
� £150 000
(b) Break-even point �fixed costs
contribution per unit
Method A � £100 000/0.30 � 333 333 copiesMethod B � £150 000/0.40 � 375 000 copies
The margin of safety is the difference between the anticipated sales and thebreak-even point sales:
Method A � 500 000 � 333 333 � 166 667 copiesMethod B � 500 000 � 375 000 � 125 000 copies
(c) Method B has a higher break-even point and a higher contribution per copy sold. This implies that profits from Method B are more vulnerable to a decline in sales volume. However, higher profits are obtained with Method B whensales are high (see 600 000 copies in (B)).
The break-even point from the sale of the existing magazine is 160 000 copies(£80 000/£0.50) and the current level of monthly sales is 220 000 copies. Thereforesales can drop by 60 000 copies before break-even point is reached. For every10 copies sold of the new publication, sales of the existing publication will bereduced by one copy. Consequently, if more than 600 000 copies of the newpublication are sold, the existing magazine will make a loss. If sales of the newmagazine are expected to consistently exceed 600 000 copies then the viability ofthe existing magazine must be questioned.
increase in costs���increase in activity
COST–VOLUME–PROFIT ANALYSIS 113147

Solution SM 9.6(a) (i) The opportunity costs of producing cassettes are the salary forgone of
£1000 per month and the rental forgone of £400 per month.(ii) The consultant’s fees and development costs represent sunk costs.
(b) The following information can be obtained from the report.
£10 selling price £9 selling priceSales quantity 7500–10 000) units 12 000–18 000) unitsFixed costs a £13 525) £17 525)Profit at maximum sales b £3 975) £4 975)Profit/(loss) at minimum sales c (£400) (£2 525)Break-even pointd 7 729) units 14 020) unitsMargin of safety:
Below maximum 2 271 units 3 980 unitsAbove minimum 229 units 2 020 units
Notesa Fixed production cost � £1400 opportunity costb (10 000 units � £1.75 contribution) � £13 525 fixed costs � £3975 profitb (18 000 units � £1.25 contribution) � £17 525 fixed costs � £4975 profitc ( 7 500 units � £1.75 contribution) � £13 525 fixed costs � £400 lossc (12 000 units � £1.25 contribution) � £17 525 fixed costs � £2525 lossd Fixed costs/contribution per unit
Conclusions(i) The £10 selling price is less risky than the £9 selling price. With the £10 selling
price, the maximum loss is lower and the break-even point is only 3% aboveminimum sales (compared with 17% for a £9 selling price).
(ii) The £9 selling price will yield the higher profits if maximum sales quantityis achieved.
(iii) In order to earn £3975 profits at a £9 selling price, we must sell 17 200 units (required contribution of 17 525 fixed costs plus £3975 divided by acontribution per unit of £1.25).
Additional information required(i) Details of capital employed for each selling price.
(ii) Details of additional finance required to finance the working capital andthe relevant interest cost so as to determine the cost of financing theworking capital.
(iii) Estimated probability of units sold at different selling prices.(iv) How long will the project remain viable?(v) Details of range of possible costs. Are the cost figures given in the question
certain?
114 COST–VOLUME–PROFIT ANALYSIS
Budgeted total contribution = £125 000 (5000 units × £25) The margin of safety is positive thus indicating a budgeted profi t. Therefore fi xed costs must be less than £125 000 for a budgeted profi t to occur. Only one of the potential items (item A) meets this requirement.Answer = A
Solution SM 9.7
148

COST–VOLUME–PROFIT ANALYSIS 113
(40% × 1) + (50% × 3)Average contribution to sales ratio = = 47.5%
4
Break-even point is at the point where 47.5% of the sales equal the fi xed costs (i.e. £120 000/0.475 = £252 632).
Fixed costsIn other words, the break – even point =
PV ratioAnswer = C
Sales 100 110 (100 + 10%)Variable cost 60 60Contribution 40 50Increase = 25%
Answer = D
Solution SM 9.8
Solution SM 9.9
Items (i) and (ii) will reduce variable costs and thus increase the contribution/sales ratio. Item (iii) will result in a reduction in selling price and the c/s ratio whereas it is assumed that with item (iv) that sales to other countries will be at a higher selling price thus resulting in a higher average contribution and c/s ratio. The reduction in selling price for item (v) will result in a reduced contribution and lower ratio. Therefore items (i), (ii) and (iv) will result in an increase in the ratio.Answer = B
Break-even point in sales value = Fixed costs (£76 800)/Profi t – volume ratio (i.e. contribution/sales ratio)
= £76 800/(0.40) = £192 000 Actual sales = £224 000 Margin of safety = £32 000 (in sales revenues)
Margin of safety in units = £2000 (£32 000/£16)
Answer = A
Solution SM 9.10
Solution SM 9.11
149


Cost estimation and cost behaviour
Solutions to Chapter 10 questions
Solution SM 10.1 (a) The first stage is to convert all costs to a 2017 basis. The calculations are as follows:
Raw materials Skilled
labour Unskilled labour Factory overheads
Power Raw materials Skilled labour Unskilled labour Factory overheads Power Total (2017 prices) Output (units)
2013 (£000)
242(1.2)4
168(1.15)3(1.2) 25(1.1)(1.25)3
500.94
306.432 53.625
861 000 160 000
2014 (£000)
344(1.2)3
206(1.15)2(1.2) 33(1.25)3
595.12
326.304
64.35 986 000 190 000
2015 (£000)
461(1.2)2
246(1.15)(1.2) 47(1.25)2
663.84
339.48 73.32
1 077 000 220 000
2016 (£000)
477(1.2)
265(1.2) 44(1.25)
572.4
318 55
945 000 180 000
The equation Y = a + bx is calculated from the above schedule of total production costs (2017 prices) and
output. The calculations are as follows: Output Total cost in units
(000) (£000) x y x2 xy
160 861 25 600 137 760 190 986 36 100 187 340 220 1077 48 400 236 940
180 945 32 400 170 100
Σ x = 750 Σ y = 3869 Σ x2 =142 500 Σ xy = 732 140
Using the following equations presented in Chapter 10:
∑y b∑x
a = n – n
n∑xy – ∑x∑y
b = n∑x2 – (∑x)2
4(732 140) – (750) (3 869)
b = 4(142 500) – (750) 2 = 3.57 3869 – (3.57)(750)
a = 4 4 = 297.875
The relationship total production and volume for 2017 is:
y = £297 875 + 3.57x
Where y = total production costs (at 2017 prices) and x = output level.
115 151

(b) See Chapter 10 for the answer to this question.(c) General company overheads will still continue whether or not product LT is
produced. Therefore the output of LT will not affect general productionoverheads. Consequently, the regression equation should not be calculatedfrom cost data that includes general company overheads. General companyoverheads will not increase with increments in output of product LT. Henceshort-term decisions and cost control should focus on those costs that arerelevant to production of LTs. Common and unavoidable general fixed costsare not relevant to the production of LT, and should not be included in theregression equation.
Solution SM 10.2Total cost for 1525 machine hours = £14 000 + 0.0025(15252) = £19 814Inflation adjusted figure = £19 814 × 1.06 = £21 003Variance = £4580F (£21 003 – £16 423)Answer = D
Solution SM 10.3Machine hours = [100 000 + (30 × 240)] × 1.08 = 115 776Overhead cost = Overhead cost = £10 000 + (0.25 × 115 776) = £38 944Answer = C
116 COST ESTIMATION AND COST BEHAVIOUR
It is assumed that advertising generates sales. Therefore advertising is the inde-pendent variable and sales revenue the dependent variable. The lowest value of the independent variable is £2500 and the highest is £6500. An increase in advertis-ing expenditure of £4000 (6.5 − 2.5) results in additional sales revenue of £100 000 so that each £1 sales results in additional sales of £25. Based on £6500 advertising
500) represents the non-variable element. Therefore sales revenue = £62 500 + (£25 advertising expenditure)
Answer = A
An increase in activity of 5000 units results in an increase in costs of £150 000 so that the variable element is £30 per unit (£150 000/5000 units).Answer = B
Hours $High 5800 23 000Low 3250 15 350change 2550 7 650
Variable charge per hour = $3 ($7650/2550)At 5800 hours the variable cost is $17 400 and the total cost is $23 000 giving a fi xed cost of $5600. In period 5 the estimated variable cost is $18 150 (5500 × 1.10 × $3)
$24 030.Answer = B
Solution SM 10.4
Solution SM 10.5
Solution SM 10.6
152
and the fi xed cost is $5880 ($5600 × 1.05). Therefore the estimated total cost is
the sales revenue is £162 500 (6500 £25) so the balance £62 500 (£225 000 − £162 ×
×

Solution SM 10.7 Estimated variable costs at 500 units:
£
Direct costs 7500 Production overheads (50%) 500
Selling costs (80%)
Variable cost per unit = £18.00 (£9000/500 units) Total costs for 1000 units = £18 000 (1000 × £18.00) variable + fixed production (£500) +
fixed selling (£250) = £18 750. Profit = Sales revenue £35 000 − £18 750 total costs = £16 250 Answer = B
Solution SM 10.8 The high low method is used to calculate the variable cost per unit but it is necessary
to compare like with like by comparing the total costs at each level of activity without
the increase in fixed costs:
Increase in total costs = (£470000 − £18000) − £380 000 = £72 000
Increase in activity = 9000 units (24 000 − 15000)
Variable cost per unit = £8 (£72 000/9000)
Total fixed costs below 20 000 units £380 000 − (15000 × £8) = £260000
Total costs for 18000 units = £260000 + (18000 × £8) = £404 000
Answer = (a)
Solution SM 10.9 Given that unit variable costs are constant it is appropriate to compare the two activity levels
that include the increase in fixed costs. An increase in production from 1200 to 1400 units
results in an increase in total costs of £1600. Therefore the variable cost per unit is
£8 (£1600/200 units
Total fixed costs at 1400 units = £68 200 − (1400 × £8) = £57 000
Total costs at 1000 units = £51 000 fixed costs (£57000 − £6000) + (1000 × £8) = £59 000
Answer = (c)
COST ESTIMATION AND COST BEHAVIOUR 115 153


MEASURING RELEVANT COSTS AND REVENUES FOR DECISION-MAKING 117
Solution SM 11.1(a) (£)
Purchase price of component from supplierAdditional cost of manufacturing (variable cost only) ––Saving if component manufactured 16––
The component should be manufactured provided the following assumptionsare correct:(i) Direct labour represents the additional labour cost of producing the
component.(ii) The company will not incur any additional fixed overheads if the compo-
nent is manufactured.(iii) There are no scarce resources. Therefore the manufacture of the compo-
(b) (i) Additional fixed costs of £56 000 will be incurred, but there will be a savingin purchasing costs of £16 per unit produced. The break-even point is 3500units (fixed costs of £56 000/£16 per unit saving). If the quantity of compo-nents manufactured per year is less than 3500 units then it will be cheaperto purchase from the outside supplier.
(ii) The contribution per unit sold from the existing product is £40 and each unit produced uses 8 scarce labour hours. The contribution per labour houris £5. Therefore if the component is manufactured, 4 scarce labour hours will be used, resulting in a lost contribution of £20. Hence the relevant cost
plus a lost contribution of £20. The component should be purchased from the supplier.
(c) The book value of the equipment is a sunk cost and is not relevant to thedecision whether the company should purchase or continue to manufacturethe components. If we cease production now, the written-down value will bewritten off in a lump sum, whereas if we continue production, the written-down value will be written off over a period of years. Future cash outflows onthe equipment will not be affected by the decision to purchase or continue tomanufacture the components. For an illustration of the irrelevance of thewritten down value of assets for decision-making purposes see ‘Replacementof equipment’ in Chapter 11.
Measuring relevant costs andrevenues for decision-makingSolutions to Chapter 11 questions
86
nent will not restrict the production of other more profitable products.
70
of manufacturing the components is £90, consisting of £70 incremental cost
155

118 MEASURING RELEVANT COSTS AND REVENUES FOR DECISION-MAKING
Solution SM 11.2(a) Calculation of minimum selling price:
(£)Direct materials: Steel a 55.00
Brass Fittingsb 20.00Direct Labour: Skilledc
Semi-skilledd —Overheade 7.50Estimating timef —Administrationg —
––––––Relevant cost of the order
––––––
Notes:a Using the materials for the order will result in them having to be replaced.
Therefore future cash outflows will increase by £55.b Future cash outflows of £20 will be incurred.c The required labour hours can be obtained by reducing production of another
alternatives and therefore is not an incremental cash flow). Alternatively, the
d No incremental cost is involved since the alternative is paid idle time.e The only incremental cost is power consisting of 10 hours at £0.75 per hour.f
g Administration does not involve any incremental cash flows.
(b) Factors to be considered include:(i) time period for repeat orders, the number of repeat orders and the likely
demand;(ii) the cash flows generated from the alternative use of the capacity;
(iii) competition to obtain future orders from Exe plc;(iv) estimated price quotations from competitors.
(c) Limiting factor presentation:Product X Product Y
Product contribution £10 £20Kg of material used per product 1 4Contribution per kg £10 £5
Thus scarce materials should be allocated to Product X since it yields a contri-bution of £5 per kg in excess of the contribution derived from Product Y.
Opportunity cost approach:Product X Product Y
Product contribution at acquisition cost £10 £20Lost contribution from alternative use:
1 kg allocated to Y at £5 per kg (£5)4 kg allocated to X at £10 per kg £40
––– ––––Cash flow impact per product +£5 –£20
––– ––––Cash flow impact per kg +£5 (£5/1 kg) –£5 (£20/4 kg)
The above analysis shows that X yields a contribution of £5 per kg when takingalternative uses of the materials into consideration. Producing Product Yresults in the contribution being reduced by £5 per kg taking into account thealternative use of the materials. This is consistent with the limiting factor
525.00
607.50
Estimating time is a sunk cost.
(£13 + £14) per hour (note that the labour cost will be incurred for allproduct involving a lost contribution before deducting the labour cost of £27
£21). Therefore the latter course of action is the most economical and thecompany can pay additional wages involving overtime of £525 (25 hours ×
incremental cash flows from undertaking the order will be £525.
156

MEASURING RELEVANT COSTS AND REVENUES FOR DECISION-MAKING 119
approach which indicates that the company is £5 per kg better off using thematerials for X or £5 per kg worse off from using the materials for Y.
Solution SM 11.3(a) (i)
Product I Product II Product III Total(£000) (£000) (£000) (£000)
Sales 2475 3948 1520 7943Contribution 1170 1692 532 3394Attributable fixed costs (275) (337) (296) (908)General fixed costsa (520) (829) (319) (1668)–––––– –––––– –––––– ––––––
(795) (1166) (615) (2576)–––––– –––––– –––––– ––––––Profit 375 526 (83) 818
� £1.6/unit � £1.40/unit � (£0.04/unit)
NoteaGeneral fixed costs are allocated to products at 21% of total sales revenue(£1668/£7943)
(ii) If Product III is discontinued it is assumed that variable costs and attribut-able (i.e. specific) fixed costs are avoidable. It is assumed that general fixedcosts are common and unavoidable to all products and will remainunchanged if Product III is discontinued. However, it is possible that somegeneral fixed costs may be avoidable in the longer term. The revised prof-its if Product III is discontinued will be:
(£000s)Contribution of Products I and II (£1170 � £1692) 2862Attributable fixed costs (£275 � £337) (612)General fixed costs (1668)––––––Profit 582––––––
Profits will decline by £236 000 (£818 � £582) if Product III is discontinuedbecause A Ltd will no longer obtain a contribution of £236 000 (£532 �£296) towards general fixed costs.
(iii) Extra sales of 15 385 units (£80 000 additional fixed costs/£5.20 unit contri-bution) will be required to cover the additional advertising expenditure. Itis assumed that existing fixed costs will remain unchanged.
(iv) The revised unit contribution will be £3.45 (£9.45 � £6).
Required sales �£1 692 000 (existing total contribution)
£3.45 revised unit contribution
� 490 435 units (an increase of 30.4% over the budgeted sales of 376 000 units)
(b) The following factors will influence cost behaviour in response to changes inactivity:
(i) The magnitude of the change in activity (more costs are likely to be affectedwhen there is a large change in activity).
(ii) Type of expense (some expenses are directly variable with volume such asdirect materials, whereas others are fixed or semi-fixed).
(iii) Management policy (some expenses are varied at the discretion ofmanagement, e.g. advertising).
(iv) The time period (in the long term, all costs can be changed in response tochanges in activity whereas in the short term, some costs, e.g. salaries ofsupervisors, will remain unchanged).
157

120 MEASURING RELEVANT COSTS AND REVENUES FOR DECISION-MAKING
Solution SM 11.4Task 1(a) and (b)
Selling price £60 £70 £80 £90Sales volume (units) 25 000 20 000 16 000 11 000
(£ per unit)(£ per unit)(£ per unit)(£ per unit)Direct material 14.00 14.00 14.00 16.10 (£14 × 115/100)Direct labour 13.00 13.00 11.70 (90%) 11.70Variable production
overhead 4.00 4.00 4.00 4.00Sales commission
(10% of selling price) 6.00 7.00 8.00 9.00––––– ––––– ––––– –––––
Total variable cost per unit 37.00 38.00 37.70 40.80Contribution per unit 23.00 32.00 42.30 49.20
£000 £000 £000 £000Total contribution 575 640 676.8 541.2
––– ––– ––––– –––––Fixed costs:
production overhead(25 000 × £8) 200 200 190 190
selling and distribution(25 000 × £3) 75 70 70 70
administration(25 000 × £2) 50 50 50 50
––– ––– ––– –––Total fixed costs 325 320 310 310
––– ––– ––––– –––––Total annual profit 250 320 366.8 231.2
––– ––– ––––– –––––Task 2(a) A selling price of £80 maximises company profits at £366 800 per annum.(b) Factors to be considered include:
(i) The effect on morale arising from a large reduction in direct labour and theresulting redundancies.
(ii) If competitors do not increase their prices customers may migrate to com-petitors in the long term and long-term annual profits may be considerablyless than the profits predicted in the above schedule. The migration of cus-tomers may also enable competitors to reap the benefits of economies ofscale thus resulting in their having lower unit costs than Rane Ltd.
Task 3(a) The products should first be ranked according to their contribution per
component used.Product A Product B Product C Product D£ per unit £ per unit £ per unit £ per unit
Selling price 14 12 16 17Variable costs 11 11 12 12
–– –– –– ––Contribution 3 1 4 5Number of components used
per unit 2 (£4/£2) 1 (£2/£2) 3 (£6/£2) 4 (£8/£2)Contribution per component £1.50 £1.00 £1.33 £1.25Ranking 1 4 2 3
The scarce components should be allocated as follows:
Product Units Components used Balance unusedA 4000 8 000 14 400C 3600 10 800 3 600D 900 3 600 —
––––––22 400
158

MEASURING RELEVANT COSTS AND REVENUES FOR DECISION-MAKING 121
(b) Profit to be earned next period:
Product Units Contribution per unit Total(£) (£)
A 4000 3 12 000C 3600 4 14 400D 900 4 500
––––––Total contribution 30 900Fixed costs 8 000
––––––Profit 22 900
––––––
(a)
V W X Y Z(£) (£) (£) (£) (£)
Selling price 16 15 18 15 30Material 3 5 4 7 6Skilled labour 6 6 9 3 12Unskilled labour 2.4 2.4 1.2 1.2 4.8Variable overhead 2 2 2 1 4Total variable cost 13.4 15.4 16.2 12.2 26.8Contribution 2.6 (0.4) 1.8 2.8 3.2Number of skilled hours 1 1 1.5 0.5 2Contribution per skilled hour 2.6 (0.4) 1.2 5.6 1.6Ranking 2 Drop 4 1 3Skilled hours allocated (W1) 3000 5500 3500 18 000
(Balance)
The product mix will be:
(£)Y (7000 units × £2.80 contribution) 19 600V (3000 units × £2.60 contribution) 7 800Z (9000 units × £3.20 contribution) 28 800X (5500 hours × £1.80 contribution) 6 6001.5 hours Total contribution 62 800Less fi xed costs 22 800Maximum profi t 40 000
Workings:(W1) Maximum units demanded X skilled hours per unit.
(b) If the labour hours constraint is removed the output of product X should be increased to the maximum demand of 6000 units. At present the constraint on skilled labour hours results in a lost contribution of £4201 (6000 units less 3666 units allocated in (a) × £1.80 unit contribution). Therefore the company should consider ways of removing this constraint. As long as the costs of removing the constraint are less than £4201, total profi t will increase. Product W should be dropped from the range provided it does not affect the sales of other products.
Solution SM 11.5
159

120 MEASURING RELEVANT COSTS AND REVENUES FOR DECISION-MAKING
Based on the contribution per limiting factor (materials) the rankings are products (iii), (ii) and (i). Minimum demand requirements for product (i) = 8000 kg leaving a balance of 27 000 kg to be allocated as follows:Product (iii) maximum demand = 2000Product (ii) maximum output from the unallocated materials = 3000 units (15 000kg/5kg)Answer = B (with a minimum demand of 1000 units for product (i).
Total materials required = (2000 × 36/6) + (1500 × 24/6) + (4000 × 15/6) = 28 000 kgAnswer = B
The 400 labour hours unused capacity has zero relevant cost. The remaining 100 hours can be obtained from diverting production from product X. The relevant cost of this alternative consists of the labour cost (100 hours × £12) plus the lost contribution from the use of these labour hours (100/2 × £4 = £200), giving a total of £1400 (see ‘Determining the relevant costs of direct labour’ in Chapter 11 for an explanation of this point). In other words, the relevant cost is the lost contribution before deducting unavoidable labour costs. The other alternative is to work over-time resulting in an additional (relevant) cost of £1800 (100 hours at £18 per hour). Therefore it is cheaper to divert labour hours from the production of product X.Therefore answer = C
The relevant cost consists of the additional acquisition and installation costs less realizable value. Therefore the relevant cost is £150 000 + £25 000 − £10 000 = £165 000.Answer = C
The material is in regular use and if used will have to be replaced at a cost of £1950 (600 × £3.25). The cash fl ow consequences are £1950.Answer = D
Assuming that fi xed costs will remain unchanged whether or not the company makes or buys the components the relevant cost of manufacture will be the vari-able cost. Under these circumstances the company should only purchase compo-nents if the purchase price is less than the variable cost. Therefore the company should only purchase component TAnswer = D
Incremental cost of new employees = £40 000 × 4 = £160 000Supervision is not an incremental cost.Incremental costs of retraining = £15 000 + £100 000 replacement cost = £115 000Retraining is the cheaper alternative and therefore the relevant cost of the contract is £115 000.Answer = B
Solution SM 11.6
Solution SM 11.7
Solution SM 11.8
Solution SM 11.9
Solution SM 11.10
Solution SM 11.11
Solution SM 11.12
160

Solution SM 11.3
(a)
(i)The relevant cost of material in regular usage will be its replacement cost. Therefore
the relevant cost of 2500 kg of material R is
£67 500 (2500 × 25 × 1.08)
(ii) The relevant cost of skilled labour in short supply is the hourly wage rate plus the lost
contribution per labour hour. The alternative use of the skilled labour is the
production of product T which makes a contribution of £30 per unit. The labour hours
per unit of product T are 2.5 hours (£25 labour cost/£10 wage rate) giving a lost
contribution per hour of £12 (£30/2.5). Therefore the relevant cost per skilled labour
hour is £22 (£10 + £12). Relevant cost of labour = £13200 (600 × £22)
(b) Relevant costs are future costs that differ between alternatives. Variable overheads (e.g.
power to operate machinery) will increase as a result of accepting the contract but fixed
costs may remain unchanged with short-term changes in activity. However, it is possible
for fixed cost to change when activity expands or declines. For example stepped increases
in fixed costs can occur because of additional equipment rentals for undertaking the
contract.
COST ESTIMATION AND COST BEHAVIOUR 115 161

126 ACTIVITY-BASED-COSTING
(a) (i) Conventional Absorption Costing Profit Statement:
XYI YZT ABW(1) Sales volume (000 units) 50 40 30
£ £ £(2) Selling price per unit 45 95 73(3) Prime cost per unit 32 84 65(4) Contribution per unit 13 11 8(5) Total contribution in £000s (1 � 4) 650 440 240(6) Machine department overheads a 120 240 144(7) Assembly department overheads b 288.75 99 49.5–––––– ––– ––––(7) Profit (£000s) 241.25 101 46.5–––––– ––– ––––Total profit = £388 750
Notes:a XYI = 50 000 � 2 hrs � £1.20, YZT = 40 000 � 5 hrs � £1.20b XYI = 50 000 � 7 hrs � £0.825, YZT = 40 000 � 3 hrs � £0.825
(ii) Cost pools:Machining Assembly Set-ups Order Purchasing
services services processing£000 357 318 26 156 84Cost drivers 420 000 530 000 520 32 000 11 200
machine direct set-ups customer suppliers’hours labour hours orders orders
Cost driver £0.85 per £0.60 £50 per £4.875 per £7.50 perrates machine direct set-up customer suppliers’
hour labour hour order order
ABC Profit Statement:XYI YZT ABW
(£000) (£000) (£000)Total contribution 650 440 240Less overheads:Machine department at £0.85 per hour 85 170 102Assembly at £0.60 per hour 210 72 36Set-up costs at £50 per set-up 6 10 10Order processing at £4.875 per order 39 39 78Purchasing at £7.50 per order 22.5 30 31.5––––– ––– –––––Profit (Loss) 287.5 119 (17.5)––––– ––– –––––Total profit = £389 000
(b) See the sections on ‘Comparison of traditional and ABC costing systems’ and
answer to this question.
Activity-based-costingSolutions to Chapter 13 questions
‘Volume-based and non-volume-based cost drivers’ in Chapter 12 for the
Solution SM 12.1
162

ACTIVITY-BASED-COSTING 127
(a) For short-term decision-making, contribution to fixed costs is often advocated.Contribution is defined as sales less variable costs. It therefore attempts toinclude only those costs and revenues that will change as a result of a decision.Fixed costs are assumed to be unavoidable and remain unchanged and irrele-vant for decision-making. Ignoring fixed costs can only be justified in certaincircumstances. For example, the contribution approach can be applied to one-time only special orders where the company has a temporary excess supply ofspare capacity. In this situation a short-term approach can be adopted by focus-ing only on the sales revenues and variable costs. The contribution approach isalso advocated for pricing off-peak business and ranking products where limit-ing factors apply (see ‘Product-mix decisions when capacity constraints apply’
capacity constraint and profit is maximized by ranking products by their con-tributions per limiting factor.
The contribution approach can only be applied when decisions have nolong-term implications. However, most decisions do have long-termimplications and in these circumstances fixed costs cannot be ignored. With thecontribution approach there is a danger that only those direct costs that areuniquely attributable to individual products will be regarded as relevant fordecision-making. Those fixed costs relating to the joint resources that fluctuateaccording to the demand for them will also be relevant for decision-making. Anideal answer should emphasise, why in the longer-term, fixed costs are likelyto change and be relevant for decision-making. For a more detailed discussionof this issue you should refer to ‘The need for a cost accumulation system in
(b)
(c) See sections on ’A comparison of traditional and ABC systems’ and ‘Volume-
question.
(d)
(a) (i) Direct labour overhead rate
Product costsProduct X Y Z
(£) (£) (£)
Direct labour 8 12 6Direct materials 25 20 11Overhead a 28 42 21Total cost 61 74 38
NoteaX = 11/3 hours × £21Y = 2 hours × £21Z = 1 hour × £21
= total overheads (£1 848 000)total direct labour hours (88 000)
£21 per direct labour hour=
in Chapter 11). In the latter situation a company may be faced with short-term
See ‘Activity hierarchies’ in Chapter 12 for the answer to this question.
See section ‘Designing ABC systems’ in Chapter 12 for the answer to this question.
generating relevant cost information for decision-making’ in Chapter 12.
Solution SM 12.2
Solution SM 12.3
163
based and non-volume-based cost drivers’ in Chapter 12 for the answer to this

128 ACTIVITY-BASED-COSTING
(ii) Materials handlingOverhead rate
Machine hour overhead rate
Product costsProduct X Y Z
(£) (£) (£)
Direct labour 8.00 12.00 6.00Direct materials 25.00 20.00 11.00Materials handling 8.78 7.03 3.87
overhead (£25 × 35.14%) (£20 × 35.14%) (£11 × 35.14%)Other overheadsa
(machine hour basis) 24.79 18.59 37.18Total cost 66.57 57.62 58.05
NoteaX = 11/3 × £18.59Y = 1 × £18.59Z = 2 × £18.59
(b) The cost per transaction or activity for each of the cost centres is as follows:
Set-up costCost per set up
ReceivingCost per receiving order
PackingCost per packing order
EngineeringCost per production order
The total set-up cost for the period was £30 000 and the cost per transaction oractivity for the period is £1000 per set-up. Product X required three productionruns, and thus £3000 of the set-up cost is traced to the production of product Xfor the period. Thus the cost per set-up per unit produced for product X is£0.10 (£3000/30 000 units).
= receiving department overheads (£435 000)direct material ccost (£1 238 000)
100
35.14% of direct material cost
�
=
=
=
other overheads (£1 413 000)76 000 machine hours
£18.59 peer machine hour
= =setup cost (£30 000)number of production runs (30)
1000£
= =receiving cost (£435 000)number of orders (270)
£1611
= =packing cost (£250 000)number of orders (32)
£7812
= engineering cost (£373 000)number of production orders (500)
£7460=
164

Similarly, product Z required 20 set-ups, and so £20 000 is traced to productZ. Hence the cost per set-up for product Z is £2.50 (£20 000/8000 units).
The share of a support department’s cost that is traced to each unit of outputfor each product is therefore calculated as follows:
cost per transaction
The unit standardcosts for products X,Y and Z using anactivity-based costing system are
X Y Z
Direct labour £8.00 £12.00 £6.00Direct materials 25.00 20.00 11.00Machine overheada 13.33 10.00 20.00Set-up costs 0.10 0.35 2.50Receivingb 0.81 2.82 44.30Packingc 2.34 1.17 19.53Engineeringd 3.73 3.73 23.31Total manufacturing cost 53.31 50.07 126.64
NotesaMachine hours × machine overhead rate (£760 000/76 000 hrs)
bX = (£1611 × 15)/30 000Y = (£1611× 35)/20 000Z = (£1611 × 220)/8000
cX = (£7812 × 9)/30 000Y = (£7812 × 3)/20 000Z = (£7812 × 20)/8000
dX = (£7460 × 15)/30 000Y = (£7460 × 10)/20 000Z = (£7460 × 25)/8000
(c) The traditional product costing system assumes that products consumeresources in relation to volume measures such as direct labour, direct materialsor machine hours. The activity-based system recognises that some overheadsare unrelated to production volume, and uses cost drivers that are indepen-dent of production volume. For example, the activity-based system assigns thefollowing percentage of costs to product Z, the low volume product:
Set-up-related costs 66.67%(20 out of 30 set-ups)
Delivery-related costs 62.5%(20 out of 32 deliveries)
Receiving costs 81.5%(220 out of 270 receiving orders)
Engineering-related costs 50%(25 out of 50 production orders)
In contrast, the current costing system assigns the cost of the above activitiesaccording to production volume, measured in machine hours. The totalmachine hours are
Product X 40 000 (30 000 × 11/3)Product Y 20 000 (20 000 × 1)Product Z 16 000 (8 000 × 2)
76 000
ACTIVITY-BASED-COSTING 129
� number of transactions per productnumber of units producedd
165

Therefore 21% (16 000/76 000) of the non-volume-related costs are assigned to product
Z if machine hours are used as the allocation base. Hence the traditional system
undercosts the low-volume product, and, on applying the above approach, it can be
shown that the high-volume product (product X) is overcosted. For example, 53% of
the costs (40 000/76 000) are traced to product X with the current system, whereas the
activity-based system assigns a much lower proportion of non-volume-related costs to
this product.
Solution SM 12.4
Budgeted number of batches per product:
D = 1000 (100 000/100)
R = 2000 (100 000/50)
P = 2000 (50 000/25)
5000
Budgeted machine set-ups:
D = 3000 (1000 × 3)
R = 8000 (2000 × 4)
P = 12 000 (2000 × 6)
23 000
Budgeted cost per set-up = £150 000/23 000 = £6.52
Budgeted set-up cost per unit of R = (£6.52× 4)/50 = £0.52
Answer = (a)
Solution SM 12.5
Cost driver rates are as follows:
Receiving/inspection etc. = £1 400 000/5000 = £280 per requisition
Production scheduling/machine set-up = £1 200 000/800 = £1500 per set-
up
W (£) X (£) Y (£)
Direct costs 80.00 75.00 65.00
Receiving/inspection a 33.60 33.60 31.11
Production scheduling a 36.00 26.00 5.00
Total cost per unit 149.60 134.60 121.11
Selling price 200.00 183.00 175.00
Profit per unit 50.40 48.40 53.89
Notes
a(Number of units of activity used by each product × Cost driver
rate)/units produced
e.g. Product W for receiving/inspection = (1200 × 280)/10000 =
£33.60
166 ACTIVITY-BASED-COSTING


138 THE BUDGETING PROCESS
(a) Production budgetProduct A BSales 2000 1500Opening stock (100) (200)Closing stock(10% × sales level) 200 150––––– –––––
2100 1450––––– –––––––––– –––––
(b) Materials usage budgetMaterial type X Y
Kg LitresUsage(2100 × 2) + (1450 × 3) 8550(2100 × 1) + (1450 × 4) 7900
(c) Materials purchases budgetUsage 8550 7900Opening stock (300) (1000)Closing stocka 850 800––––––– –––––––
9100 7700× £10 × £7––––––– –––––––
£91 000 £53 900––––––– –––––––––––––– –––––––(d) Labour budget
Skilled Semi-skilledhours hours
(2100 × 4) + (1450 × 2) 11 300(2100 × 2) + (1450 × 5) 11 450
× £12 × £8–––––––– –––––––£135 600 £91 600–––––––– ––––––––––––––– –––––––
NoteaMaterial Closing StockMaterial X (2000 × 2 + 1500 × 3) × 10% = 850Material Y (2000 × 1 + 1500 × 4) × 10% = 850
The budgeting process
Solution SM 13.1
Solutions to Chapter 1 questions
168

THE BUDGETING PROCESS 139
(a) WorkingsBudgeted sales (units and value)
Product Units Price Value (£)F1 34 000 £50.00 1 700 000F2 58 000 £30.00 1 740 000–––––––––
3 440 000–––––––––
Budgeted production (units)
Product Sales Stock increase ProductionF1 34 000 1000 35 000F2 58 000 2000 60 000
(i) Component purchase and usage budget (units and value)Component Component
Product C3 C4 TotalF1 280 000u 140 000uF2 240 000u 180 000u–––––––– ––––––––
520 000u 320 000uValue £650 000 £576 000 £1 226 000
(ii) Direct labour budget (hours and value)Product Assembly Finishing Total
F1 17 500 hours 7000 hoursF2 15 000 hours 10 000 hours–––––– ––––––
32 500 17 000Value
(iii) Departmental manufacturing overhead recovery ratesAssembly Finishing
Total overhead cost per month £617 500 £204 000Total direct labour hours 32 500 17 000Overhead rate (per direct labour hour) £19.00 £12.00
(iv) Selling overhead recovery rateTotal overhead cost per month £344 000Total sales value (Month 9) £3 440 000Selling overhead rate 10%
(v) Closing stock budgetProduct Units Costa £ Value £
F1 1000F2 2000 ––––––
––––––NoteaSee part (b) for the calculation of the cost per unit
£325 000 £204 000 £529 000
21.6536 50043 300
36.50
79 800
Solution SM 13.2
169

140 THE BUDGETING PROCESS
(b) Standard unit costs for month 9Product
F1 F2£/unit £/unit
Material C3 8 × £1.25 10.00 4 × £1.25 5.00C4 4 × £1.80 7.20 3 × £1.80 5.40
Labour AssemblyFinishing
M’fg. overhead Assembly 30/60 × £19 9.50 15/60 × £19 4.75Finishing 12/60 × £12 2.40 2.00––––– –––––
Manufacturing costSelling overhead (10% of selling price) 5.00––––– –––––Total costSelling price 50.00 30.00––––– –––––Profit ––––– –––––
(c) Budgeted profit and loss account for month 9
(£)Components 1 226 000Direct labourManufacturing overhead 821 500–––––––––SubtotalLess closing stock –––––––––Cost of salesSelling overhead –––––––––Total costSales –––––––––Net profit –––––––––
(d) The company currently uses an absorption costing system but computespredetermined overhead rates on a monthly basis. It is preferable to calculate apredetermined overhead rate at annual intervals. This is because a largeamount of overheads are likely to be fixed in the short-term whereas activitywill fluctuate from month to month, giving large fluctuations in overhead ratesif monthly rates are used. An average, annualised rate based on therelationship of total annual overhead to total annual activity is morerepresentative of typical relationships between total costs and volume/activitythan a monthly rate. For a more detailed discussion of these issues you shouldrefer to ‘Budgeted overhead rates’ in Chapter 4.
(a) (i) Cash budget
January February March April(£) (£) (£) (£)
Balance b/d 10 000 9 000 3 890 9 090Sales (W1) — 15 200 57 100 80 000–––––– –––––– –––––– ––––––
10 000 24 200 60 990 89 090Purchases (W3) — 11 550 24 500 26 950Wages (W4) — 4 800 19 800 22 200Variable overhead (W5) — 960 4 600 7 080Fixed overhead (W6) 1 000 3 000 3 000 3 000–––––– –––––– –––––– ––––––
1 000 20 310 51 900 59 230Balance c/d 9 000 3 890 9 090 29 860–––––– –––––– –––––– ––––––
30/60 × £1012/60 × £12
5.002.40
36.50
41.50
8.50
15/60 × £10
10/60 × £12
10/60 × £122.50
3.00
2.00
21.65
24.65
5.35
529 000
2 576 500
344 000
79 8002 496 700
3 440 0002 840 700
599 300
Solution SM 13.3
170
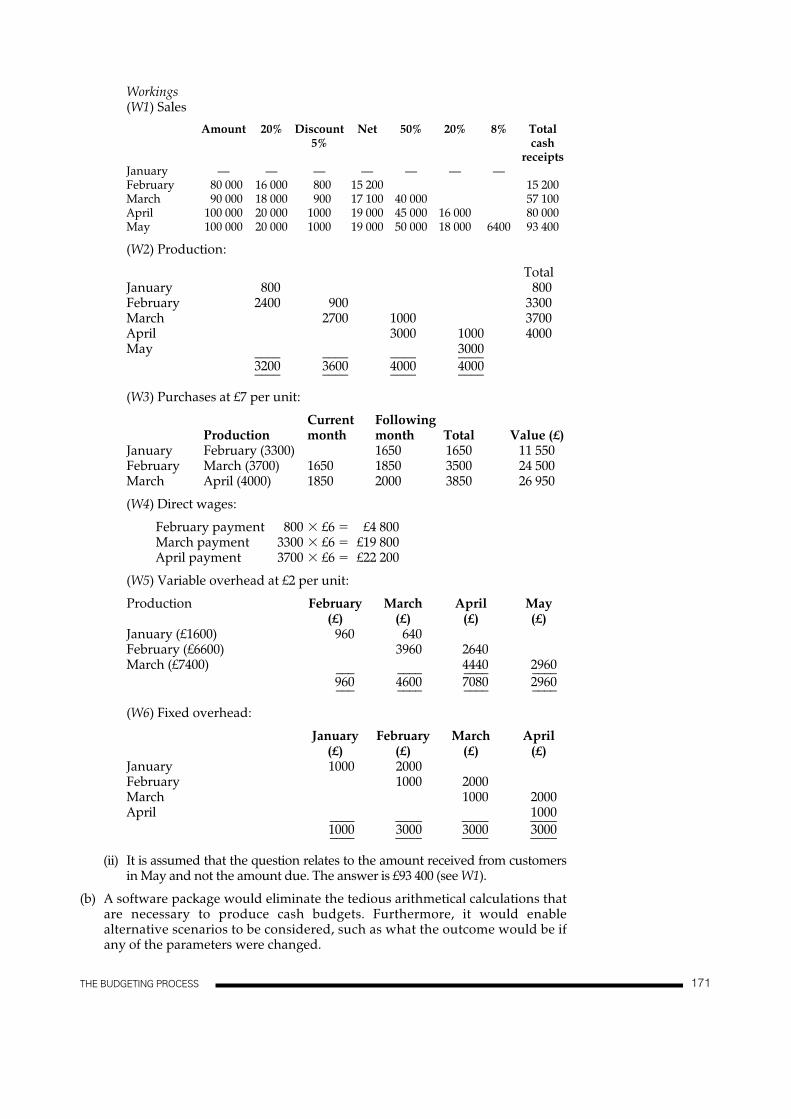
Workings(W1) Sales
Amount 20% Discount Net 50% 20% 8% Total5% cash
receiptsJanuary — — — — — — —February 80 000 16 000 800 15 200 15 200March 90 000 18 000 900 17 100 40 000 57 100April 100 000 20 000 1000 19 000 45 000 16 000 80 000May 100 000 20 000 1000 19 000 50 000 18 000 6400 93 400
(W2) Production:
TotalJanuary 800 800February 2400 900 3300March 2700 1000 3700April 3000 1000 4000May 3000–––– –––– –––– ––––
3200 3600 4000 4000–––– –––– –––– ––––
(W3) Purchases at £7 per unit:
Current FollowingProduction month month Total Value (£)
January February (3300) 1650 1650 11 550February March (3700) 1650 1850 3500 24 500March April (4000) 1850 2000 3850 26 950
(W4) Direct wages:
February payment 800 � £6 � £4 800March payment 3300 � £6 � £19 800April payment 3700 � £6 � £22 200
(W5) Variable overhead at £2 per unit:
Production February March April May(£) (£) (£) (£)
January (£1600) 960 640February (£6600) 3960 2640March (£7400) 4440 2960––– –––– –––– ––––
960 4600 7080 2960––– –––– –––– ––––
(W6) Fixed overhead:
January February March April(£) (£) (£) (£)
January 1000 2000February 1000 2000March 1000 2000April 1000–––– –––– –––– ––––
1000 3000 3000 3000–––– –––– –––– ––––
(ii) It is assumed that the question relates to the amount received from customersin May and not the amount due. The answer is £93 400 (see W1).
(b) A software package would eliminate the tedious arithmetical calculations thatare necessary to produce cash budgets. Furthermore, it would enablealternative scenarios to be considered, such as what the outcome would be ifany of the parameters were changed.
THE BUDGETING PROCESS 141171

Solution SM 13.4
Solution SM 13.5
Solution SM 13.6
Solution SM 13.7
All figures are £000
172 THE BUDGETING PROCESS


142 MANAGEMENT CONTROL SYSTEMS
Task 1Reclamation Division Performance Report – 4 weeks to 31 May:Original budget 250 tonnesActual output 200 tonnes
Budget basedon 200 tonnes Actual Variance Comments
Controllable expenses:Wages and social security costs a 43 936 46 133 2197AFuel b 15 000 15 500 500AConsumables c 2 000 2 100 100APowerd 1 500 1 590 90ADirectly attributable overheads e 20 000 21 000 1000A–––––– ––––––– ––––––
82 436 86 323 3887A–––––– ––––––– ––––––Non-controllable expenses:Plant maintenancee 5 950 6 900 950ACentral servicese 6 850 7 300 450A–––––– ––––––– ––––––
12 800 14 200 1400A–––––– ––––––– ––––––Total 95 236 100 523 5287A
Notesa 6 employees � 4 teams � 42 hours per week � £7.50 per hour � 4 weeks = £30 240.b 200 tonnes � £75c 200 tonnes � £10d £500 + (£5 � 200) = £1500e It is assumed that directly attributable expenses, plant maintenance and central
services are non-variable expenses.
Task 2(a) (i) Past knowledge can provide useful information on future outcomes but
ideally budgets ought to be based on the most up-to-date information.Budgeting should be related to the current environment and the use ofpast information that is two years old can only be justified where the oper-ating conditions and environment are expected to remain unchanged.
(ii) For motivation and planning purposes budgets should represent targetsbased on what we are proposing to do. For control purposes budgetsshould be flexed based on what was actually done so that actual costs foractual output can be compared with budgeted costs for the actual output.This ensures that valid comparisons will be made.
(iii) For variable expenses the original budget should be reduced in propor-tion to reduced output in order to reflect cost behaviour. Fixed costs arenot adjusted since they are unaffected in the short term by outputchanges. Flexible budgeting ensures that like is being compared with likeso that reduced output does not increase the probability that favourablecost variances will be reported. However, if less was produced because of
Management control systemsSolutions to Chapter 1 questions
Solution SM 14.1
174

MANAGEMENT CONTROL SYSTEMS 143
actual sales being less than budget this will result in an adverse sales vari-ance and possibly an adverse profit variance.
(iv) Plant maintenance costs are apportioned on the basis of capital values andtherefore newer equipment (with higher written-down values) will becharged with a higher maintenance cost. Such an approach does not pro-vide a meaningful estimate of maintenance resources consumed by depart-ments since older equipment is likely to be more expensive to maintain. Themethod of recharging should be reviewed and ideally based on estimatedusage according to maintenance records. The charging of the overspendingby the maintenance department to user departments is questionable sincethis masks inefficiencies. Ideally, maintenance department costs should berecharged based on actual usage at budgeted cost and the maintenancedepartment made accountable for the adverse spending (price) variance.
(v) The comments do not explain the causes of the variances and are pre-sented in a negative tone. No comments are made, nor is any praisegiven, for the favourable variances.
(vi) Not all variances should be investigated. The decision to investigateshould depend on both their absolute and relative size and the likelybenefits arising from an investigation.
(vii) Central service costs are not controllable by divisional managers. However,even though the divisional manager cannot control these costs there is anargument for including them as non-controllable costs in the performancereport. The justification for this is that divisional managers are made awareof central service costs and may put pressure on central service staff to con-trol such costs more effectively. It should be made clear to divisional man-agers that they are not accountable for any non-controllable expenses thatare included in their performance reports.
Task 1(a) Quarter 1 Quarter 2 Quarter 3 Quarter 4
units units units unitsActual sales volume 420 000 450 000 475 000 475 000Seasonal variation +25 000 +15 000 — 240 000––––––– ––––––– ––––––– –––––––Deseasonalised sales volumes 395 000 435 000 475 000 515 000––––––– ––––––– ––––––– –––––––
(b) The trend is for sales volume to increase by 40 000 units each quarter:
Forecast for next year Quarter 1 Quarter 2 Quarter 3 Quarter 4units units units units
Trend projection 555 000 595 000 635 000 675 000Seasonal variation +25 000 +15 000 — �40 000––––––– ––––––– ––––––– –––––––Forecast sales volumes 580 000 610 000 635 000 635 000––––––– ––––––– ––––––– –––––––
Task 2(a) Seasonal variations represent consistent patterns in sales volume that occur
throughout each year. For example, the seasonal variation of +25 000 forQuarter 1 indicates that sales volume in the first quarter tends to be 25 000units higher than the underlying trend in sales. In contrast, the seasonalvariation of �40 000 in Quarter 4 indicates that sales in this quarter tend to be40 000 units lower than the underlying trend in sales.
To derive the deseasonalised data the seasonal variations must be removedso that a trend can be observed. The above figures indicate an increase of40 000 units per quarter. This trend is concealed when the actual data isobserved because of the distorting effects of seasonal variations. Observationsof the actual data suggests that the rate of increase in sales is declining.
Solution SM 14.2
175

144 MANAGEMENT CONTROL SYSTEMS
(b) Provided that the observed trend in deseasonalised data continues thedeseasonalised data can be used to project the trend in future sales. The trendvalues are adjusted by seasonal variations in each quarter to predict actual sales.
Task 3(a) A fixed budget is a budget for the planned level of activity and budgeted costs
are not adjusted to the actual level of activity. A fixed budget is used at theplanning stage because an activity level has to be initially determined so that alldepartment activities can be coordinated to meet the planned level of activity.However, it is most unlikely that actual activity will be the same as the plannedlevel of activity. For example, if the actual level of activity is greater thanbudgeted level of activity then those costs that vary with the level of activity willbe greater than the budgeted costs purely because of changes in activity. It isclearly inappropriate for variable costs to compare actual costs at one level ofactivity with budgeted costs at another level of activity. The original fixedbudget must be adjusted to reflect the budgeted expenditure at the actual levelof activity. This procedure is called flexible budgeting. The resulting comparisonof actual costs with a flexible budget is more meaningful for cost control becausethe effect of the change in the activity level has been eliminated.
(b) Possible activity indicators include number of deliveries made, miles travelledand journeys made.
(c)
Task 4(a) Production budget for product Q
(units)Forecast sales for year 18 135Increase in stock (15% � 1200) 180––––––Finished units required 18 315––––––Quality control loss (1/99) 185Total units input to production 18 500––––––
(b) Direct labour budget for product Q(hours)
Active labour hours required (18 500 � 5) 92 500Idle time allowance (7.5/92.5) 7 500–––––––Total hours to be paid for 100 000–––––––Standard hourly rate £6Budgeted labour cost £600 000
(c) Material usage budget for material M
(kg)Material required for processing
18 500 units (� 9 kg) 166 500Wastage (10/90) 18 500–––––––Material usage for year 185 000–––––––
(d) Material purchases budget for material M
(kg)Material required for production input 185 000Increase in material stocks (12%) 960Expected loss in stores 1 000–––––––Material purchases required 186 960–––––––
See ‘Flexible budgets’ in Chapter 14 for the answer to this question.
176

MANAGEMENT CONTROL SYSTEMS 145
Task 5The implications of the shortage is that the budget plans cannot be achieved and theavailability of material is the limiting factor. If the limiting factor cannot be removedthe materials purchase budget should be the first budget to be prepared and all theother budgets coordinated to ensure the most efficient usage of materials. The fol-lowing four possible actions could be taken to overcome the problem:(i) Seek alternative supplies for material M. Possible problems include the relia-
bility and quality of materials delivered by new suppliers. New suppliersshould be carefully vetted prior to entering into any contracts or making com-pany plans dependent on deliveries from new suppliers.
(ii) Reduce the budgeted sales of product Q. This will lead to loss in profits andthe possible permanent loss of customers to competitors if the competitors areable to meet customer demand.
(iii) Reduce the stock levels for product Q and material M. The danger with thiscourse of action is that stocks may not be available when required which couldlead to disruptions in production and lost sales.
(iv) Reduce the wastage of material M and the defective output of product Q. Thiscourse of action will cause problems if quality standards are reduced resultingin inferior quality output. This could have a harmful effect on future sales.Problems will not be caused if quality standards are maintained and improvedworking practices result in a reduction of waste and defective output.
Task 1 (a)Calculation of unit variable costs
Original Revised Difference Variablebudget budget unit costa
Units 24 000 20 000 4 000Variable costsMaterial 216 000 180 000 £36 000 £9Labour 288 000 240 000 £48 000 £12Semi-variable costsHeat, light and power 31 000 27 000 £4 000 £1Analysis of heat, light and powerVariable cost £24 000 £20 000Total cost £31 000 £27 000
––––––– –––––––Fixed cost £7 000 £7 000
––––––– –––––––
NoteaUnit variable cost = change in total cost/change in volume
Task 1 (b)Rivermede Ltd – flexible budget statement for the year ended 31 May
Revised Actual Variancebudget results
Production and sales (units) 22 000 22 000Variable costs (£) (£) (£)Material 22 000 × £9 198 000 214 320 (£206 800 + £7520) 6320 (A)Labour 22 000 × £12 264 000 255 200 8800 (F)Semi-variable costHeat, light and power
(22 000 × £1) + £7000 29 000 25 880 (£33 400 � £7520) 3120 (F)Fixed costsRent, rates and depreciation 40 000 38 000 2000 (F)
––––––– ––––––– –––––––531 000 533 400 2400 (A)
––––––– ––––––– –––––––
Solution SM 14.3
177

146 MANAGEMENT CONTROL SYSTEMS
Task 2 (a)The original statement compares the actual cost of producing 22 000 units with abudget for 20 000 units. This is not comparing like with like. The flexible budgetshows what budgeted costs would have been for the actual production level of22 000 units. Because actual production was greater than budgeted production of20 000 units variable costs are likely to be higher and this comparison will result inan adverse effect on variable cost variances. The fact that overall variances aresmaller when comparisons are made with the flexible budget is due to flexing thebudget and not to participative budgeting.
Task 2 (b)The report should indicate that favourable variances may have arisen for the follow-ing reasons:
(i) Controllable factors due to the more efficient usage of direct labour andheating, light and power.
(ii) Budget participation may have resulted in the creation of slack through anoverstatement of budgeted costs.
(iii) Uncontrollable factors such as a reduction in the prices charged toRivermede for rent and rates.
Task 2 (c)The report should include the following items:
(i) The increased sales may have been due to a general increase in demandrather than the effort of the salesforce.
(ii) The original budget of 24 000 units may have been over-estimated or therevised budget of 20 000 units may have been understated due to the salesdirector creating slack by deliberately understating demand.
Task 1 (a)
Therefore annual demand (y) = 640 + (40 × 9) = 1000weekly demand = 1 000/25 = 40 holidays
Task 1 (b)Weaknesses of the least squares regression formula include:
(i) The formula assumes a linear relationship based on time but demand forholidays may not be a linear function of time.
(ii) Seasonal variations are ignored. Demand may vary throughout the holi-day season with some holiday weeks being more popular than others.
(iii) It ignores changes in holidaymakers’ tastes such as a change in demandfrom short haul to long haul or 10-day holidays to short-break holidays.
(iv) Cyclical fluctuations are ignored. Demand for holidays is likely to varydepending on the state of the economy, such as boom or recession.
Linear regression is covered in Chapter 10.
Task 2 (a)Revised cost statement 10 days ended 27 November
Flexed budget Budget Actual VarianceNote (£) (£) (£)
Aircraft seats 1 18 000 18 600 600 ACoach hire 5 000 4 700 300 FHotel rooms 2 14 300 14 200 100 FMeals 3 4 560 4 600 40 ATour guide 1 800 1 700 100 FAdvertising 2 000 1 800 200 F
–––––– –––––– ––––45 660 45 600 60 F
–––––– –––––– ––––
For the next year x takes on a value of 9.
Solution SM 14.4
178

MANAGEMENT CONTROL SYSTEMS 147
Notes1. £450 × 40 because purchases are in blocks of 20 seats2. £70 × 10 days × 34 tourists × 0.5 £11 900
£60 × 10 days × 4 tourists £2 400–––––––£14 300
–––––––3. £12 × 10 days × 38 tourists
Task 2 (b)The original budget is a fixed budget based on the anticipated demand when thebudget was set. If actual demand is different from anticipated demand a fixed bud-get is inappropriate for control purposes because it does not ensure that like iscompared with like. The revised flexible budget shows what costs should havebeen for the volume of passengers taken on the holiday. This ensures that a moremeaningful comparison of budget and actual costs is made.
Task 2 (c)The following factors should be considered:
(i) the absolute amount of the variance;(ii) the relative amount of the variance expressed as a percentage of budgeted
costs;(iii) the trend in variances by examining the cumulative variances for the
period;(iv) whether or not the variance is controllable; (v) the cost and benefits from investigating the variance.
(a) A fi xed budget refers to a budget which is designed to remain unchanged irre-spective of the level of activity, whereas a fl exible budget is a budget which adjusts the expense items for different levels of activity. See ‘Flexible budgets’ in Chapter 14 for an explanation of the objectives of fl exible budgeting.
(b) (i)Direct labour £180 000 £202 500 £225 000Direct labour hours 48 000 54 000 60 000Flexible budget (overhead expenditure): Activity levels 80% 90% 100%Direct labour hours 48 000 54 000 60 000
Variable costs (£) (£) (£)Indirect labour at £0.75 per direct labour hour 36 000 40 500 45 000
Consumable supplies at £0.375 per direct labour hour
18 000 20 250 22 500
Canteen and other welfare services at 6% of direct plus indirect wages
12 960 14 580 16 200
Semi-variable: variable (W1) 9 600 10 800 12 00076 560 86 130 95 700
Semi-variable: fi xed (W1) 8 000 8 000 8 000Fixed costs:Depreciation 18 000 18 000 18 000Maintenance 10 000 10 000 10 000Insurance 4 000 4 000 4 000
Solution SM 14.5
179

Rates 15 000 15 000 15 000
Management salaries
Workings: (W1) Obtained by using High and Low points method:
(£)
High 64 000 Direct labour hours 20 800 Low 40 000 Direct labour hours 24 000
£4800 = £0.20 per direct labour hour 24 000
24000
64 000 × £0.20 = £12 800 variable costs Total costs £20 800
∴ Fixed costs £8 000 (ii) Variable cost
(57 000/60 000 × £95 700) 90 915 Fixed costs 80 000 Budgeted cost allowance 170 915
Solution SM 14.6
(a)
(b) The variance will have arisen because the actual selling price was greater than the budgeted price. The adverse materials variance may have resulted either because the number of kg used, or the amount paid per kg, was greater than expected.
180 MANAGEMENT CONTROL SYSTEMS
Flexed budget Actual results Variances
Sales (units) 9750 9750
Production (units)
11 000 11 000
£000 £000 £000
Sales revenue 292.5 = (30 × 9 750) 325 32.5 favourable
Cost of sales:
Opening 0 0
stock
Production costs:
Materials 55 = (5 × 11 000) 65 10 adverse
Labour 99 = (9 × 11 000) 100 1 adverse
Fixed production overheads
96 (1) = (8 × 12 000) 95 1 favourable
250 260 10 adverse
Closing stock 27.5 = (£22 × (11 000 − 9750))
27.5
222.5 232.5
Profit 70 92.5 22.5 favourable


148 STANDARD COSTING AND VARIANCE ANALYSIS
(a) Standard cost of output produced (18 000 units)
(£)Direct materials 864 000Direct labour 630 000Variable production overhead 180 000Fixed production overhead 900 000–––––––––
2 574 000–––––––––
(b) Standard cost Variances Actual costof output
(£) (£) (£)Direct materials 864 000Price variance a 76 000 (F)Usage variance b 48 000 (A)Actual cost 836 000
Direct labour 630 000Rate variance c 16 800 (A)Efficiency varianced 42 000 (F)Actual cost 604 800
Variable production overhead 180 000Expenditure variance e 4 000 (A)Efficiency variance f 12 000 (F)Actual cost 172 000
Fixed production overhead 900 000Expenditure varianceg 30 000 (A)Volume varianceh 100 000 (A)Actual cost 1 030 000––––––––– –––––––––– –––––––––
2 574 000 68 800 (A) 2 642 800––––––––– –––––––––– –––––––––
Notesa (Standard price � Actual price) � Actual quantityb (£12 � £836 000/76 000) � 76 000 � £76 000 (F)b (Standard quantity � Actual quantity) � Standard priceb (18 000 � 4 kg � 72 000 � 76 000) � £12 � £48 000 (A)c (Standard rate � Actual rate) � Actual hoursb (£7 � £604 800/84 000) � 84 000 � £16 800 (A)d (Standard hours � Actual hours) � Standard rateb (18 000 � 5 hrs � 90 000 � 84 000) � £7 � £42 000 (F)e (Actual hours � Standard rate) � Actual costb (84 000 � £2 � £168 000 � £172 000 � £4000 (A)f (Standard hours � Actual hours) � Standard rateb (18 000 � 5 hrs � 90 000 � 84 000) � £2 � £12 000 (F)
Standard costing and variance analysisSolutions to Chapter 1 questions
Solution SM 15.1
182

STANDARD COSTING AND VARIANCE ANALYSIS 149
g Budgeted fixed overheads � Actual fixed overheadsb (20 000 � £50 � £1 000 000 � £1 030 000) � £30 000 (A)h (Actual output � Budgeted output) � Standard rateb (18 000 � 20 000) � £50 = £100 000 (A)
(c) The statement in (b) can be used to provide a detailed explanation as to whyactual cost exceeded standard cost by £68 800 for the output achieved. Thestatement provides attention-directing information by highlighting those areasthat require further investigation. Thus management can concentrate theirscarce time on focusing on those areas that are not proceeding according toplan. By investigating variances, management can pinpoint inefficiencies andtake steps to avoid them re-occurring. Alternatively, the investigation mayindicate that the current standards are inappropriate and need changing totake account of the changed circumstances. This may result in an alteration inthe plans or more up-to-date information for decision-making.
(a)50 000 = £30 000
(b) Sales margin price = (Actual price – Standard price) × Actual sales volume
= £2423A (note that the same answer would be obtainedusing contribution margins in the above formula)
Sales margin volume = (Actual volume – Budgeted volume) × Standard unitcontribution
= (49 700 – 50 000) × £0.60 = £180AIngredients price
= (55 000 × £1.18/1.08 = £60 093) – £58 450 = £1643FIngredients usage = (SQ – AQ)SP = (49 700 × 1.08 = 53 676 – 55 000)
£1.18/1.08 = £1447AWage rate = (SP – AP)AH = (AH × SP) – (AH × AP)
a
Labour efficiency = (SH – AH)SP = (49 700 × 1.5 minutes = 1242.5 hours
Variable conversion price = (SP – AP)AH = (AH × SP) – (AH × AP)= (1200 × £2.40b = £2880 – £3250 = £370A
Variable conversion efficiency = (SH – AH)SP = (49 700 × 1.5 minutes =1242.5 hours –1200 hours) × £2.40 = £102F
Notesa
hourb Actual variable overhead price = £0.06/1.5 minutes = £0.04 per minute =£2.40 per hour
Reconciliation statement(£)
Budgeted contribution 30 000Sales volume contribution variance 180 (A)–––Standard contribution on actual sales 29 820Sales price variance 2423 (A)––––
27 397
Budgeted contribution = Standard unit contribution (£2.14 – £1.54 = £0.60) ×
Actual contribution = £103 935 – (£58 450 + £13600 + £3250) = £28 635
= Actual sales (£103 935) – Actual sales volume (49 700) ×
= (SP – AP)AQ = (AQ × SP) – (AQ × AP)
Standard price (£2.14)
= (1200 × £12 = £14 400) – £13 600 = £800F
–1200hours) × £12 = £510F
Actual price paid for labour = £0.30/1.5 minutes = £0.20 per minute = £12 per
Solution SM 15.2
183

Cost variances A FIngredients: Price 1643
Usage 1447Labour Rate
EfficiencyConversion cost Expenditure 370
Efficiency 102–––– ––––Total 1817 (F)–––– –––– ––––––Actual contribution ––––––––––––
(c) The answer should point out that in any environment fixed overhead volumevariances are not particularly helpful for cost control (see ‘Volume variance’ inChapter 18 for an explanation of this point). Therefore, a marginal costingvariance analysis approach is preferable for most types of environment.
(a) Wage rate variance � (SP � AP)AH � (SP � AH) � (AP � AH)
� £700ALabour efficiency � (SH � AH)SPSH (Standard hours) � (35 000 � 0.4 hrs) � (25 000 � 0.56 hrs)
� 28 000AH (Actual hours) � 53 workers � 13 weeks � 40 hrs � 27 560Variance
(b) Material price variance � (SP � AP)AQ� (AQ � SP) � (AQ � AP)
£430F (given) � 47 000 SP � £85 110
SP (Standard price) �£430 � 85 110
47 000� £1.82
Material usage variance � (SQ � AQ)SP� (SQ � SP) � (AQ � SP)
£320.32A (given) � £1.82 SQ � (33 426 � £1.82)� £320.32A � £1.82 SQ � £60 835.32£1.82 SQ � £60 515SQ � £60 515/£1.82 � 33 250Note that SQ � Actual production (35 000 units) � Standard usageTherefore 35 000 � Standard usage � 33 250Standard usage � 33 250/35 000
� 0.95 kg per unit of component X
(c) For the answer to this question you should refer to the detailed illustration of
indicate that if sales are the limiting factor the production budget should belinked to the sales budget. Once the production budget has been establishedfor the two components, the production quantity of each componentmultiplied by the standard usage of material A per unit of component outputdetermines the required quantity of material to meet the productionrequirements. The budgeted purchase quantity of material A consists of thequantity to meet the production usage requirements plus or minus anadjustment to take account of any planned change in the level of rawmaterial stock.
150 STANDARD COSTING AND VARIANCE ANALYSIS
800510
3055 1 23828 635
� (£14 � 53 workers � 13 weeks � 40 hrs) � £386 540
� (28 000 � 27 560) � £14 � £6160A
the budget process shown in Chapter 13. In particular, the answer should
Solution SM 15.3
184
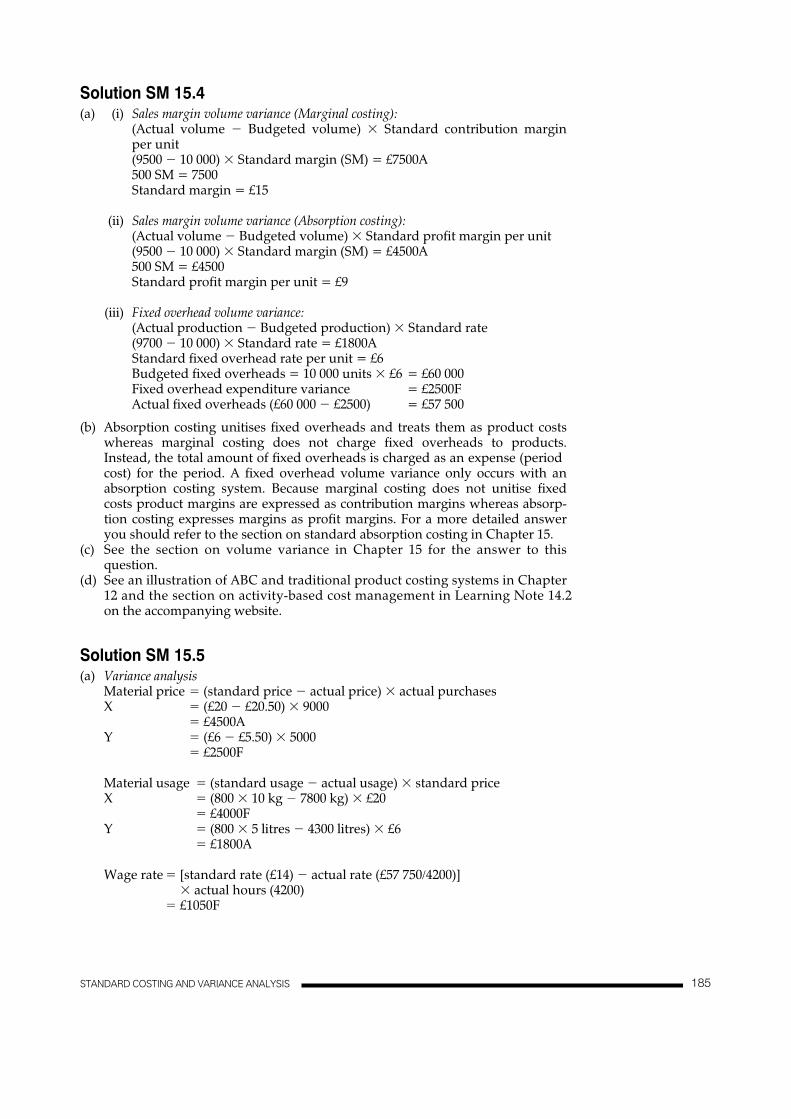
STANDARD COSTING AND VARIANCE ANALYSIS 151
(a) (i) Sales margin volume variance (Marginal costing):(Actual volume � Budgeted volume) � Standard contribution marginper unit(9500 � 10 000) � Standard margin (SM) = £7500A500 SM = 7500Standard margin = £15
(ii) Sales margin volume variance (Absorption costing):(Actual volume � Budgeted volume) � Standard profit margin per unit(9500 � 10 000) � Standard margin (SM) = £4500A500 SM = £4500Standard profit margin per unit = £9
(iii) Fixed overhead volume variance:(Actual production � Budgeted production) � Standard rate(9700 � 10 000) � Standard rate = £1800AStandard fixed overhead rate per unit = £6Budgeted fixed overheads = 10 000 units � £6 = £60 000Fixed overhead expenditure variance = £2500FActual fixed overheads (£60 000 � £2500) = £57 500
(b) Absorption costing unitises fixed overheads and treats them as product costswhereas marginal costing does not charge fixed overheads to products.Instead, the total amount of fixed overheads is charged as an expense (periodcost) for the period. A fixed overhead volume variance only occurs with anabsorption costing system. Because marginal costing does not unitise fixedcosts product margins are expressed as contribution margins whereas absorp-tion costing expresses margins as profit margins. For a more detailed answer
(c)question.
(d) See an illustration of ABC and traditional product costing systems in Chapter
(a) Variance analysisMaterial price � (standard price � actual price) � actual purchasesX � (£20 � £20.50) � 9000
� £4500AY � (£6 � £5.50) � 5000
� £2500F
Material usage � (standard usage � actual usage) � standard priceX � (800 � 10 kg � 7800 kg) � £20
� £4000FY � (800 � 5 litres � 4300 litres) � £6
� £1800A
� � actual hours (4200)� £1050F
you should refer to the section on standard absorption costing in Chapter 15.See the section on volume variance in Chapter 15 for the answer to this
12 and the section on activity-based cost management in Learning Note 14.2on the accompanying website.
Wage rate � [standard rate (£14) � actual rate (£57 750/4200)]
Solution SM 15.4
Solution SM 15.5
185

152 STANDARD COSTING AND VARIANCE ANALYSIS
Labour efficiency � [standard hours (800 � 5 hrs) � actual hours (4200)]
Fixed overhead expenditure � budgeted cost (10 800/12 � £50)� � actual cost (£47 000)� £2000A
Volume efficiency � [standard hours (800 � 5 hrs) � actual hours (4200)]� � (£50/5 hours)
Volume capacity a � [actual hours (4200) � budgeted hours b (4500)]� � FOAR (£50/5 hours)� £3000A
Notesa Note that the CIMA Terminology (at the time of setting the examination)
described the volume variance as being equivalent to the volume capacityvariance.
b Budgeted hours � monthly budgeted output (10 800/12) � 5 hrs
(b) Stores control
(£) (£)K Ltd: X (AQ � SP) 180 000 WIP: (SQ � SP) 160 000C Ltd: Y (AQ � SP) 30 000 WIP: (SQ � SP) 24 000Material usage variance (X) 4 000 Material usage variance (Y) 1 800
Balance 28 200–––––––– ––––––––£214 000 £214 000–––––––– ––––––––
Wages control account
(£) (£)Cash Wages owing b/fwd 6 000PAYE and NI 5 000 Labour efficiencyAccrued wages 5 000 WIP (SQ � SP)Wage rate variance 1 050––––––– –––––––
––––––– –––––––
WIP control account
(£) (£)Stores control: X 160 000 Finished goods control a/cStores control: Y 24 000Wages controlFixed overhead 40 000–––––––– ––––––––
–––––––– ––––––––
� � standard rate (£14)
� £2000A
� £2800A
53 750
£64 800
2 80056 000
£64 800
56 000
£280 000 £280 000
186
280 000

STANDARD COSTING AND VARIANCE ANALYSIS 153
Fixed overhead control
(£) (£)Expense creditors 33 000 WIP (SQ � SP) 40 000Depreciation provision 14 000 Expenditure variance 2 000
Efficiency variance 2 000Capacity variance 3 000––––––– –––––––
£47 000 £47 000––––––– –––––––
Finished goods control
(£) (£)WIP control Cost of sales–––––––– ––––––––
Cost of sales
(£) (£)Finished goods control Profit and loss (P/L)–––––––– ––––––––
Material price variance
(£) (£)K Ltd: X 4500 C Ltd: Y 2500
P/L 2000––––– –––––£4500 £4500––––– –––––
Material usage variance
(£) (£)Stores control: Y 1800 Stores control: X 4000P/L 2200––––– –––––
£4000 £4000––––– –––––
Labour rate variance
(£) (£)P/L Wages control––––– –––––
Labour efficiency variance
(£) (£)Wages control 1200 P/L 1200–––– ––––
Fixed overhead expenditure variance
(£) (£)Overhead control 2000 P/L 2000–––– ––––
Fixed overhead efficiency variance
(£) (£)Overhead control 2000 P/L 2000–––– ––––
£280 000 £280 000
£280 000 £280 000
£2800 £2800
187
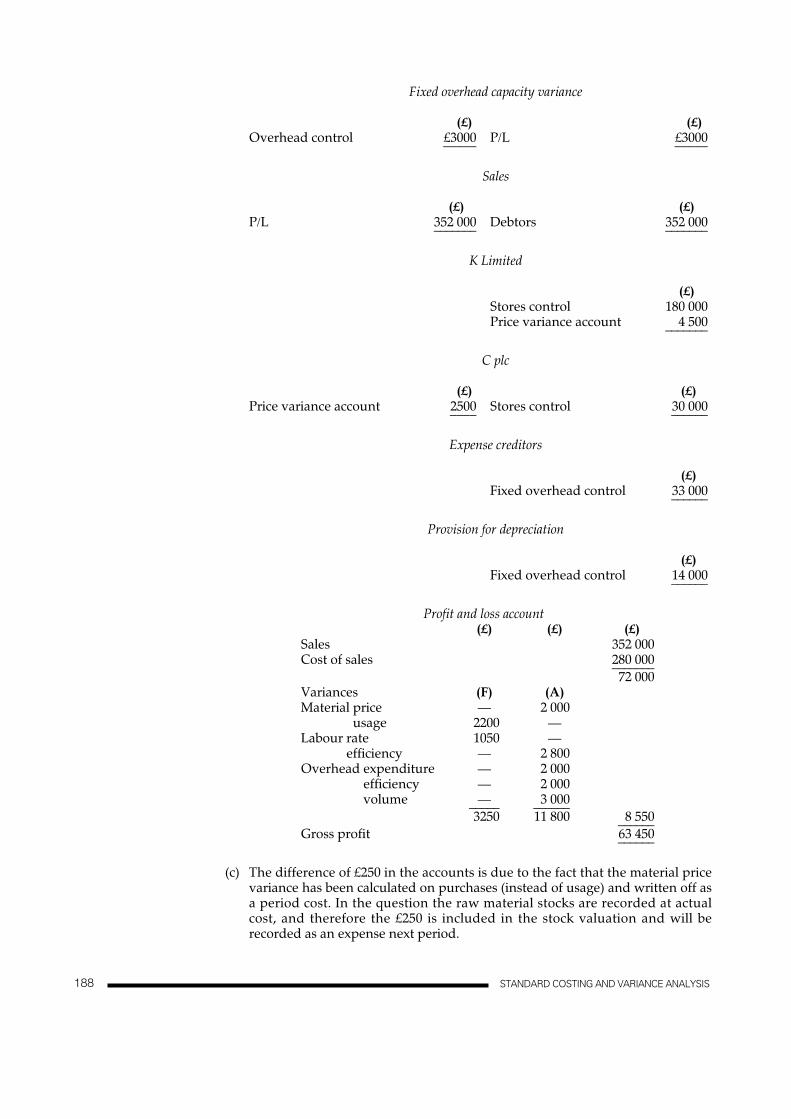
154 STANDARD COSTING AND VARIANCE ANALYSIS
Fixed overhead capacity variance
(£) (£)Overhead control £3000 P/L £3000––––– –––––
Sales
(£) (£)P/L Debtors––––––– –––––––
K Limited
(£)Stores control 180 000Price variance account 4 500–––––––
C plc
(£) (£)Price variance account 2500 30 000–––– ––––––
(£)33 000––––––
(£)14 000––––––
(£) (£) (£)
–––––––72 000
(F) (A)— 2 000
Material usage 2200 —Labour rate 1050 —Labour efficiency —Overhead expenditure — 2 000Overhead efficiency — 2 000Overhead volume — 3 000––––– ––––––
3250 ––––––Gross profit
(c) The difference of £250 in the accounts is due to the fact that the material pricevariance has been calculated on purchases (instead of usage) and written off as a period cost. In the question the raw material stocks are recorded at actualcost, and therefore the £250 is included in the stock valuation and will berecorded as an expense next period.
352 000 352 000
Material price
Sales
Stores control
Expense creditors
Fixed overhead control
Profit and loss account
Fixed overhead control
Provision for depreciation
Cost of sales
Variances
352 000
––––––
280 000
2 800
11 800 8 55063 450
188

STANDARD COSTING AND VARIANCE ANALYSIS 153
(a) Fixed overhead expenditure variance = Budgeted fi xed overheads (£2 500 000) − Actual fi xed overheads (£2 890 350) = £390 350 Adverse Volume variance = (Actual production of 70 000 units) – Budgeted production of 62 500 units) × Budgeted fi xed overhead absorption rate per unit (£2 500 000/ 62 500 units) = £300 000 Favourable
See Chapter 15 for an explanation of each of the variances.(b) Budgeted fi xed overhead absorption rate per hour = £5 (£2 500 000/500 000
hours) Effi ciency variance = (Standard quantity of input hours for actual production) − (Actual input hours) × Fixed overhead absorp-
tion rate = (70 000 units × 500 000 hours/62 500 units = 560 000 hours – 525 000 hours) × £5 = £175 000
Favourable Capacity variance = (Actual hours of input = 525 000) – (budgeted hours of
input = 500 000) × Fixed overhead absorption rate (£5) = £125 000 Favourable See Chapter 15 for an explanation of each of the variances.
(a) Standard hours for actual output (650 units × 0.25 hours) = 162.5 hours Actual hours taken (7 hours × 3 days × 8 employees) − idle time (16 hours) =
152 hours Effi ciency variance (10.5 hours × $12) = $126 Favourable Answer = (iv)
(b) Wage rate = (SP AP) AH = (AH × SP) – (AH × AP) = (168 × $12) $2275 = $259A Answer = (ii)
Solution SM 15.6
Solution SM 15.7
Budgeted cost (£48 000) Standard fi xed overhead rate = = £10
Budgeted output (4800 units)Overheads incurred = Budgeted cost + Expenditure variance (£2000) = £50 000Overheads absorbed = £50 000 – Under-absorption (£8000) = £42 000Actual number of units produced = £42 000/£10 = 4200Answer = C
Budgeted fi xed overhead hour rate = £135 000/9000 = £15 Capacity variance = [Actual hours (9750) – Budgeted hours (9000)] × £15 = £11 250FAnswer = B
Solution SM 15.8
Solution SM 15.9
Budgeted sales margin = $66 000 (12 000 units × ($15 – $9.50))Actual sales margin = $43 200 (10 800 × ($13.50 – $9.50))Variance = $22 800ANote that the actual margin is derived from using the standard cost and not the actual cost.Answer = A
Solution SM 15.10
189

Solution SM 15.11 Variance = (Actual sales volume of 9800 units) – (Budgeted sales volume of 10 000 units)
× budgeted profit margin (£5) = £1000 Adverse Answer = C
Solution SM 15.12 Variance = (Actual sales volume of 3500 units) – (Budgeted sales volume of 3000 units) ×
budgeted contribution margin (£50 – £31) = £9500 Favourable Answer = A
Solution SM 15.13 Idle time variance = Unproductive hours (5500) × Standard wage rate (£540 000/60 000
hours) = £49 500 Adverse
Labour efficiency variance = (standard productive hours − actual productive hours × standard
wage rate [(14 650 × 60 000 hours/15 000 units) − 56 000] × £9 = £23 400 Favourable
Solution SM 15.14 (a)Total materials cost variance = (actual production × standard material cost per unit of
production) − actual materials cost = (26 000 × £20) − £532 800 = £12 800A
Total variable overhead variance = (actual production × standard variable overhead rate per unit) − actual variable overhead cost
= (26 000 × £24) − £614 000 = £10 000F
Wage rate variance = (standard wage rate per hour − actual wage rate) × actual labour hours worked
= (£8 − £1 221 000/150 000) × 150 000 = £21 000A
Labour efficiency variance = (standard quantity of labour hours for actual production − actual labour hours) × standard wage rate
= [(26 000 × 6 hours) − 150 000] × £8 = £48 000F
(b) £ £
Budgeted contribution [25 000 × (£120 − £920]
700 000
Sales price variance (W1) 5000A Direct materials 12 800A Total variable overhead 10 000F production Direct labour rate 21 000A Direct labour efficiency 48 000F
Total direct labour 2700F
Actual contribution (W2) 719 200
Workings W1 Sales margin price variance = (actual selling price − standard selling price) ×
actual sales volume = [(£2 995 000/25 000) − £120] × 25 000 = £5000A
190 STANDARD COSTING AND VARIANCE ANALYSIS

(c) The two variances may be related if more skilled labour, paid at a higher wage rate than
that planned, was used. Higher skilled labour may have been more efficient resulting in a favourable efficiency variance, but the higher wage rate would also have resulted in an adverse wage rate variance.
Solution SM 15.15 (a) Sales margin = (actual selling price − standard price variance selling price) × actual sales
volume = [(£731 000/34 000) − £22] × 34 000 = £17 000A
Sales margin = (actual sales volume − budgeted volume variance sales volume) × standard contribution margin
= (34 000 − 32 000) × £13 = £26 000F
(b) The actual selling price was £0.50 less than the budgeted selling price resulting in an adverse sales margin price variance, whereas the actual sales volume was 2000 units in excess of the budget resulting in a favourable volume variance. The increase in sales volume may have been due to the reduction in the selling price. Therefore the two variances are interrelated and should be considered together rather than in isolation.
(c) £
Budgeted contribution (32 000 × £13) 416 000 Less budgeted variable/marginal costing profit 200 000
Budgeted fixed costs 216 000 Less budgeted non production fixed costs 96 000 (£1 152 000/12)
Budgeted fixed production costs 120 000
Budgeted fixed production cost per unit 4 (£120 000/30 000) Variable costing budgeted profit 200 000 Less fixed overheads included in decrease in 8000 stocks (2000 × £4) with the absorption costing system
Absorption costing profit 192 000
Solution SM 15.16 Preliminary calculations
The standard product cost and selling price are calculated as follows:
STANDARD COSTING AND VARIANCE ANALYSIS 191
W2 £ £
Actual sales 2 995 000 Actual costs: Materials 532 800 Labour 1 221 000 Production overhead 614 000
Less closing stock at 2 367 800 standard cost (1000 × £92) 92 000
Variable cost of sales 2 275 800
Actual contribution 719 200

(£)
Direct materials
X (10 kg at £1) 10
Y (5 kg at £5) 25
Direct wages (5 hours × £8) 40
Standard variable cost 75
Contribution margin 75
Selling price 150
The actual profit for the period is calculated as follows:
(£) (£)
Sales (9500 at £160) 1 520 000
Direct materials: X 115 200
Y 225 600
Direct wages (46 000 × £8.20) 377 200
Fixed overhead 290 000 1 008 000
Actual profit 512 000
The variances are analyzed as follows:
(£) (£)
Material price variance:
(standard price − actual price) × actual quantity
X: (£1 − £1.20) × 96 000 19 200 A
Y: (£5 − £4.70) × 48 000 14 440 F 4800A
Material usage variance:
(standard quantity − actual quantity) × standard price
X: (9500 × 10 = 95 000 − 96 000) × £1 1000 A
Y: (9500 × 5 = 47 500 − 48 000) × £5 2500 A 3500 A
The actual materials used are in standard proportions. Therefore there is no mix variance.
Wage rate variance:
(standard rate − actual rate) × actual
hours
(£8 − £8.20) × 46 000
9200 A
Labour efficiency variance:
(standard hours − actual hours) ×
standard rate
(9500 × 5 = 47 500 − 46 000) × £8
12 000 F 2800 F
Fixed overhead expenditure:
budgeted fixed overheads − actual
fixed
overheads
(£300 000 − £290 000) 10 000 F
Sales margin price variance:
(actual selling price− standard
selling price) × actual sales
volume
(£160 − £150) × 9500
95 000 F
Sales margin volume variance:
(actual sales volume − budgeted
sales volume)
× Standard margin
(9500 − 10 000) × £75
37 500 A 57 500 F
Total variance 62 000 F
(£)
Budgeted profit (10 000 units at £75) 750 000
Less budgeted fixed overheads 300 000
Budgeted profit 450 000
Add favourable variances (see above) 62 000
Actual profit 512 000
191a STANDARD COSTING AND VARIANCE ANALYSIS

122 THE APPLICATION OF LINEAR PROGRAMMING TO MANAGEMENT ACCOUNTING
(a)M F
Contribution per unit £96 £110Litres of material P required 8 10Contribution per litre of material P £12 £11Ranking 1 2Production/sales (units) 1000 2325a
Notea 31 250 litres of P less (1000 × 8) for M = 23 250 litres for F giving a totalproduction of 2325 units (23 250 litres/10)
(b)M F Total(£000) (£000) (£000)
Sales 200 488.250 688.250Variable costs:
Material P 20 58.125 78.125Material Q 40 46.500 86.500Direct labour 28 81.375 109.375Overhead 16 46.500 62.500––– ––––––– –––––––
104 232.500 336.500––– ––––––– –––––––Contribution 96 255.750 351.750Fixed costs (£150 000 + £57 750) 207.750–––––––Profit 144.000–––––––
(c) Maximise Z = 96M + 110F (product contributions) subject to: 8M + 10F � 31 250 (material P constraint)10M + 5F � 20 000 (material Q constraint)
M � 1 000 (maximum demand for M)F � 3 000 (maximum demand for F)
as follows:Material P; Line from M = 3906.25, F = 0 to F = 3125, M = 0Material Q; Line from M = 2000, F = 0 to F = 4000, M = 0Direct labour; Line from M = 4375, F = 0 to F = 3500, M = 0Sales demand of M; Line from M = 1000Sales demand of F; Line from F = 3000
P and Q constraints. The point can be determined from the graph ormathematically as follows: 8M + 10F = 31 250 (material P constraint)10M + 5F = 20 000 (material Q constraint)
The application of linear
accounting
2M + 2.5F � 8 750 (direct labour constraint)
The optimal solution occurs where the lines in Figure 1 intersect for material
programming to management
Solution SM 1 (Learning Note 11.1)
192
Solutions to questions relatin to earnin ote 111.
The above constraints are plotted on the graph shown in Figure 1 (below)

multiplying the first equation by 1 and the second equation by 2:
8M + 10F = 31 250 20M + 10F = 40 000subtracting –12M = – 8750M = 729.166
Substituting for M in the first equation:
8(729.166) + 10F = 31 250F = 2541.667
(d)(£)
Contribution: (729 units of M at £96) 69 984(2542 units of F at £110) 279 620–––––––
349 604Less fixed costs 207 750–––––––Profit 141 854–––––––
THE APPLICATION OF LINEAR PROGRAMMING TO MANAGEMENT ACCOUNTING 123
1000
2000
3000
4000
5000
Product M(units)
1000 2000 3000 4000
Product F
Material P
Material Q
Labour
Optimal solution
Product M
Product F (units)Z = 96M + 110F
FEASIBLEREGION
FFiigguurre 1
193

124 THE APPLICATION OF LINEAR PROGRAMMING TO MANAGEMENT ACCOUNTING
Moving from the solution in (c) where the lines intersect as a result of obtainingan additional litre of material Q gives the following revised equations: 8M + 10F = 31 250 (material P constraint)10M + 5F = 20 001 (material Q constraint)The values of M and F when the above equations are solved are 729.333 and2541.533. Therefore, M is increased by 0.167 units and F is reduced by 0.134 unitsgiving an additional total contribution of £1.292 [0.167 × £96) – (0.134 × £110)]per additional litre of Q. Therefore the shadow price of Q is £1.292 per litre.
(e)
(f) Other factors to be taken into account include the impact of failing to meet thedemand for product M, the need to examine methods of removing theconstraints by sourcing different markets for the materials and the possibilityof subcontracting to meet the unfulfilled demand.
(a) Product X Product Y Total(1) Estimated demand (000 units) 315 135(2) Machine hours required (per 000 units) 160 280(3) Machine hours required to meet demand
(1 × 2) 50 400 37 800 88 200
The machine hours required to meet demand are in excess of the machinehours that are available. Therefore machine hours are the limiting factor and thecompany should allocate capacity according to contribution per machine hour.
Product X Product Y(£) (£)
Selling price 11.20 15.70Variable cost 6.30 8.70––––– –––––Contribution 4.90 7.00Machine hours required per unita 0.16 0.28Contribution per machine hour £30.625 £25
Notea Product X = 160/1000 Product Y = 280/1000
The company should concentrate on maximizing output of Product X. Meetingthe maximum demand of Product X will require 50 400 machine hours and thiswill leave 34 600 hours (85 000 hrs – 50 400 hrs) to be allocated to Product Y.Therefore 123 571 units (34 600 hrs/0.28 hrs) of Y and 315 000 units of X shouldbe produced.
(b) Product X Product Y Total(£) (£) (£)
Contribution per unit 4.90 7.00Sales volume 315 000 123.571Contribution (£000s) 1543.5 864.997 2 408.497Less fixed costs a 2 124.997––––––––Profit 283.500––––––––
Notea Fixed costs: Product X = 315 000 units � £4 per unit = £1 260 000
Product Y = 123 571 units � £7 per unit = £864 997––––––––––2 124 997––––––––––
prices.
Solution SM 2 (Learning Note 11.1)
194
See Learning Note 11.1 on the accompanying website for an explanation of shadow

THE APPLICATION OF LINEAR PROGRAMMING TO MANAGEMENT ACCOUNTING 125
(c) There are now two limiting factors and linear programming techniques mustbe used.
Let X = Number of units of X produced (in 000s of units)Y = Number of units of Y produced (in 000s of units)
160X + 280Y = 85 000 Machine hours (1)120X + 140Y = 55 000 Labour hours (2)
Multiply equation (2) by 2 and equation (1) by 1
160X + 280Y = 85 000 (1)240X + 280Y = 110 000 (2)
Subtract equation (2) from equation (1)
� 80X = �25 000� 80X = 312.5 (i.e. 312 500 units)
Substitute for X in equation (1)
160 (312.5) + 280Y = 85 00050 000 + 280Y = 85 000
280Y = 35 000280Y = 125 (i.e. 125 000)
Therefore the optimal output to fully utilise both labour and machine capacityis 312 500 units of Product X and 125 000 units of Product Y.
195


Decision-making under conditions of risk and uncertainty
Solutions to questions relating to Learning Note 11.4
Solution SM 1 (Learning Note 11.4) (a) Profit and Loss Statement for Period Ending 31 May 2015
(£)
Revenue (14 400 000 journeys): 0–3 miles (7 200 000 × £0.20) 1 440 000) 4–5 miles (4 320 000 × £0.30) 1 296 000)
Over 5 miles (2 880 000 × £0.50) 1 440 000)
Juvenile fares (4 800 000 × £0.15) 720 000) Senior citizen fares (4 800 000 × £0.10) 480 000)
––––––––– 5 376 000)
Advertising revenue 250 000) ––––––––– 5 626 000)
Less: Variable costs (20 routes × 4 buses × 150 miles × 330 days × £0.75) (2 970 000) Less: Fixed costs (1 750 000)
––––––––– Net profit 906 000)
––––––––– (b) Assuming the same passenger mix as 2016 the weighted average fare per passenger for
year ending 31 May 2015 is (£5 376 000 × 1.05)/24 000 000 = £0.2352. The break-even point is where: Total revenue from fares + Advertising revenue = Total cost Let x = number of passenger journeys Break-even point: 0.2352x + £250 000 = (2 970 000 + £1 750 000) 1.1
0.2352x = £4 942 000
x = 21 011 905 Maximum capacity utilisation = 40 000 000 passenger journeys (24 000 000/0.6)
Break-even capacity utilisation = 21 011 905/40 000 000 = 52.5% (c) (i)
Expected value and probability estimates for 2016
Capacity Revenue Inflation Costs Combined Net Expected Utilisation Fares Adverts probability profit value % (Probability) (£000) (£000) (%) (Probability) (£000) (£000) (£000)
70 0.1 6585.6a 250 8 0.3 5097.6b 0.03 1738.0 52.14
6585.6 250 10 0.6 5192.0b 0.06 1643.6 98.62
6585.6 250 12 0.1 5286.4b 0.01 1549.2 15.49 60 0.5 5644.8a 250 8 0.3 5097.6 0.15 797.2 119.58
5644.8 250 10 0.6 5192.0 0.30 702.8 210.84 5644.8 250 12 0.1 5286.4 0.05 608.4 30.42
50 0.4 4704.0a 250 8 0.3 5097.6 0.12 143.6 17.23
4704.0 250 10 0.6 5192.0 0.24 238.0 57.12 4704.0 250 12 0.1 5286.4 0.04 332.4 13.30
–––– –––––– 1.00 439.44 –––––––– ––––––––––––
DECISION-MAKING UNDER CONDITIONS OF UNCERTAINTY 131 197

Notes aFare revenues at 60% capacity for 2015 were £5 376 000. Assuming 5% inflation fare
revenues for 2016 at 60% capacity will be £5 644 800 (£5 376 000 × 1.05). At 70% and
50% capacity utilization fare revenues will be as follows: 70% = 70/60 × £5 644 800 = £6 585 600
50% = 50/60 × £5 644 800 = £4 704 000 bVariable costs vary with bus miles which are assumed to remain unchanged. Predicted
costs at the different inflation levels are as follows:
8% = (£2 970 000 + £1 750 000)1.08 = £5 097 600
10% = (£2 970 000 + £1 750 000)1.10 = £5 192 000 12% = (£2 970 000 + £1 750 000) 1.12 = £5 286 400
(c) (ii) The answer to this question requires the preparation of a cumulative
probability distribution that measures the cumulative probability of profits/
(losses) being greater than specified levels.
Cumulative probability distribution
Losses greater than £300 000 = 0.04 probability Probability of a loss occurring = 0.40
Profits greater than £600 000 = 0.60 Profits greater than £700 000 = 0.55 Profits greater than £800 000 = 0.10
Profits greater than £1 500 000 = 0.10 (d) The following factors have not been incorporated into the analysis:
(i) Change in the passenger mix. (ii) Changes in the number of routes and the number of days of operation per year. (iii) Changes in fare structure such as off-peak travel or further concessions for
juveniles and senior citizens. (iv) Changes in cost levels due to factors other than inflation (e.g. more efficient
operating methods).
Solution SM 2 (Learning Note 11.4) (a) For each selling price there are three possible outcomes for sales demand, unit variable
cost and fixed costs. Consequently, there are 27 possible outcomes. In order to present
probability distributions for the two possible selling prices, it would be necessary to
compute profits for 54 outcomes. Clearly, there would be insufficient time to perform
these calculations within the examination time that can be allocated to this question. It
is therefore assumed that the examiner requires the calculations to be based on an
expected value approach. The expected value calculations are as follows:
(i) Variable cost (£) (ii) Fixed costs (£) (£10 × 10%) × 10/20 = 5.50 £82 000 × 0.3 = 24 600
(£10 × 6/20 = 3.00 £85 000 × 0.5 = 42 500
(£10 × 5%)× 4/20 = 1.90 ––––– 10.40 –––––
£90 000 × 0.2 = 18 000 –––––– 85 100 ––––––
(iii) £17 selling price (iv) £18 selling price
(units) (units)
21 000 units × 0.2 = 4 200 19 000 units × 0.2 = 3 800 19 000 units × 0.5 = 9 500 17 500 units × 0.5 = 8 750 16 500 units × 0.3 = 4 950
––––––
18 650
––––––
15 500 units × 0.3 = 4 650 –––––– 17 200
–––––– 198 DECISION-MAKING UNDER CONDITIONS OF UNCERTAINTY

Expected contribution
£17 selling price � (£17 � £10.40) � 18 650 � £123 090£18 selling price � (£18 � £10.40) � 17 200 � £130 720
The existing selling price is £16, and if demand continues at 20 000 units perannum then the total contribution will be £112 000 [(£16 � £10.40) � 20 000 units].
Using the expected value approach, a selling price of £18 is recommended. (b) Expected profit � £130 720 � £85 100 fixed costs � £45 620
Break-even point � fixed costs (£85 100)/contribution per unit (£7.60)� 11 197 units
Margin of safety � expected demand (17 200 units) � 11 197 units � 6003 units% margin of safety � 6003/17 200 � 34.9% of salesNote that the most pessimistic estimate is above the break-even point.
(c) An expected value approach has been used. The answer should draw attentionto the limitations of basing the decision solely on expected values. In particular, it should be stressed that risk is ignored and the range of possible outcomes isnot considered. The decision ought to be based on a comparison of the probabilitydistributions for the proposed selling prices. For a more detailed answer see‘Probability distributions and expected value’ and ‘Measuring the amount of
(d) Computer assistance would enable a more complex analysis to be undertaken.
combinations of assumptions regarding variable cost, fixed cost, selling prices
DECISION-MAKING UNDER CONDITIONS OF UNCERTAINTY 133
uncertainty’ in Learning Note 11.4.
and demand.
In particular, different scenarios could be considered, based on different
199