Determinants of firm survival: a duration analysis using the generalized gamma distribution
18
ORIGINAL PAPER Determinants of firm survival: a duration analysis using the generalized gamma distribution Serguei Kaniovski Michael Peneder Published online: 26 October 2007 Ó Springer Science+Business Media, LLC 2007 Abstract We use parametric duration analysis to study the survival of Austrian firms. We find that hazard rates in both manufacturing and services initially increase, reach a peak after the first year of operation and then decrease with age. The max- imum hazard rate is higher in services. We also find differences in hazard rates among different types of manufacturing industries distinguished by the nature of their sunk costs, their reliance on human resources and inputs from external services. Finally, we find that larger initial size and higher market growth, and at the same time lower net entry and declining market concentration prolong the life of an entrant. Keywords Firm survival Duration analysis Sectoral taxonomies JEL Classifications L25 L11 C41 1 Introduction The availability of administrative data on the full populations of business units has spurred on a large body of research on the patterns and determinants of their entry and performance. It has also enabled the use of statistical techniques that cannot be applied to aggregate data. A prominent line of research within this literature uses regression analysis to study the determinants of the duration of firms. This research has yielded a number of valuable insights on aspects of competition that shape the process of growth and renewal in industries. Unfortunately, no comparable studies S. Kaniovski (&) M. Peneder Austrian Institute of Economic Research (WIFO), Vienna, P.O. Box 91, Vienna 1103, Austria e-mail: [email protected] M. Peneder e-mail: [email protected] 123 Empirica (2008) 35:41–58 DOI 10.1007/s10663-007-9050-3
Transcript of Determinants of firm survival: a duration analysis using the generalized gamma distribution
ORI GIN AL PA PER
Determinants of firm survival: a duration analysis usingthe generalized gamma distribution
Serguei Kaniovski Æ Michael Peneder
Published online: 26 October 2007
� Springer Science+Business Media, LLC 2007
Abstract We use parametric duration analysis to study the survival of Austrian
firms. We find that hazard rates in both manufacturing and services initially increase,
reach a peak after the first year of operation and then decrease with age. The max-
imum hazard rate is higher in services. We also find differences in hazard rates
among different types of manufacturing industries distinguished by the nature of
their sunk costs, their reliance on human resources and inputs from external services.
Finally, we find that larger initial size and higher market growth, and at the same time
lower net entry and declining market concentration prolong the life of an entrant.
Keywords Firm survival � Duration analysis � Sectoral taxonomies
JEL Classifications L25 � L11 � C41
1 Introduction
The availability of administrative data on the full populations of business units has
spurred on a large body of research on the patterns and determinants of their entry
and performance. It has also enabled the use of statistical techniques that cannot be
applied to aggregate data. A prominent line of research within this literature uses
regression analysis to study the determinants of the duration of firms. This research
has yielded a number of valuable insights on aspects of competition that shape the
process of growth and renewal in industries. Unfortunately, no comparable studies
S. Kaniovski (&) � M. Peneder
Austrian Institute of Economic Research (WIFO), Vienna,
P.O. Box 91, Vienna 1103, Austria
e-mail: [email protected]
M. Peneder
e-mail: [email protected]
123
Empirica (2008) 35:41–58
DOI 10.1007/s10663-007-9050-3
have been carried out for Austria so far. This paper fills this gap by providing an
empirical analysis of the patterns and determinants of firm survival in Austria. In
our analysis we focus on the impact of the market structure and demographic
characteristics of an industry on survival. In terms of statistical technique our focus
lies on modelling the age dependency of survival rates––thus our choice of a
parametric rather than a non-parametric or a semi-parametric approach.
The literature on firm survival has produced several robust empirical regularities,
or ‘stylized facts.’1 Some of these empirical regularities concern the effect of firm-
specific characteristics such as the firm’s age and size on the survival of firms, while
most of them record the effect of market structure. The gist of this literature, as
succinctly put by Geroski (1995, p. 435), is that ‘entry appears to be relatively easy,
but survival is not.’ This conclusion is based on a large number of entrants coupled
with a short average duration typically observed in most industries. Our analysis
shows this to be especially true for the service industry.
Another robust empirical regularity is that most entrants start small and end
small. Nonetheless, an entrant’s initial size seems to have a positive effect on its
duration.2 This has been reported many times, starting from the early studies for US
manufacturing establishments by Evans (1987) and Dunne et al (1988). More
general is the finding that the probability of exit declines with current size and age.
There may be several reasons why young and small firms are exposed to a higher
risk of exit. For one, older and larger firms often harness more resources (capital and
human) and more managerial experience (tacit knowledge). Such firms can better
withstand external shocks, for example those emanating from demand or the stock
market. Second, older and larger firms will typically have more market power and
endurance. In many product markets a larger size confers more influence on the
market price, while endurance often derives from long-established market niches
and brands that insulate the firm’s own market segment by reducing its sensitivity to
the competitive challenge. Older and larger firms are also more likely to be
diversified and therefore less susceptible to fluctuations in demand.
A key parameter in the duration analysis of firms is the firm’s age measured from
its date of entry. It is a well-established fact that the probability of exit falls with
age. In the terminology of organizational ecology, new firms suffer from the liability
of newness (Freeman et al. 1983). Beyond this, the existing empirical evidence is
not entirely conclusive, as both strictly decreasing and non-monotonic hazard rates
are found. Decreasing hazard rates have been reported for US manufacturing
establishments by Evans (1987), Dunne et al. (1988), Audretsch (1991) and
Audretsch and Mahmood (1995); for Canadian manufacturing establishments by
Baldwin and Gorecki (1991); for Portuguese manufacturing firms by Mata and
Portugal (1994) and Mata et al. (1995). In duration regression the effect of age can
1 Surveys of the literature on the mobility of firms, of which the literature on firm survival is a permanent
strand, include Siegfried and Evans (1994), Geroski (1995), Sutton (1997) and Caves (1998). Of related
interest is the sociological literature on organizational ecology exemplified by Hannan and Carroll (1992)
and Carroll and Hannan (2000).2 In the framework of empirical duration analysis, the positive effect of an explanatory variable
on duration derives from its negative effect on the probability of exit. We will return to this point
in Sect. 3.2.
42 Empirica (2008) 35:41–58
123
be tested using a suitably parameterized hazard function. Roughly speaking, the
hazard function gives the probability of exit in the next time period. It is a function
of time elapsed since entry and hence that of age. To test the curvature of a hazard
function, earlier studies often used the Weibull model, which can only describe
monotonic hazard rates (Baldwin and Gorecki 1991, Mata and Portugal 1994).
More recent studies have tested several models, including those allowing for
non-monotonic hazard functions. In a study of small German manufacturing
establishments, Wagner (1994, p. 141) finds ‘hazard rates tend to increase during
the first years and to decrease afterwards.’ Agarwal et al. (2002) find inverted
U-shaped hazard rates using data on US manufacturing firms. In a study of the
impact of innovation activities on firm survival in the Dutch manufacturing
industry, Cefis and Marsili (2005) also report inverted U-shaped hazard functions.
To us, the absence of definitive results on the shape of the hazard function appears
to derive, at least in part, from the different parametric survival regression models
used to estimate them. Our findings point toward the varying degree of coverage of
small and large firms as another likely source of differences.
What difference does it make? For one, non-monotonic hazard rates are
consistent with the standard stochastic models of industry dynamics by Jovanovic
(1982) and Ericson and Pakes (1995). In these models entrants only learn their
relative efficiency with passage of time. If industries indeed differ in the time it
takes for an entrant to learn its competitiveness, then such differences should be
reflected in hazard rates. A still simpler explanation for non-monotonic hazard rates
alludes to the fact that an entrant will need some time to burn its initial capital
endowment, which is another reason to control for the effect of entry size when
estimating hazard functions. Beyond theoretical concerns, the knowledge of when
the firms become subject to the maximum risk of exit is useful in framing
consultancy and crediting programs for small and medium enterprises.
We estimate a parametric survival regression with a hazard function derived from
the generalized gamma distribution. This highly flexible functional form allows for
a large number of possible shapes of the hazard function. Special cases of the
generalized gamma distribution include the exponential (constant hazard), Weibull
(monotonically increasing or decreasing hazard) and log-normal (skewed inverted
U-shape, non-monotonic hazard) distributions. Ours is not the only distributional
choice that accommodates non-monotonic hazard functions. Such functions can also
be described using much simpler log-logistic and Gompertz–Makeham distribu-
tions. The main advantage of the family of gamma distributions lies in the variety of
functional forms nested in one general specification. One can thus discriminate
between them using the Likelihood-ratio and Wald tests. The main disadvantage is
the computational intensity of the maximum likelihood estimation.
Following this introduction we describe the dataset obtained using the Austrian
social security files. Section 3 then defines the explanatory variables and
generalized gamma regression. The explanatory variables include three taxonomies
of manufacturing industries designed to capture an industry’s general reliance on
tangible and intangible investment, human resources and inputs from external
services. Section 4 discusses the estimation results. Section 5 summarizes and
concludes.
Empirica (2008) 35:41–58 43
123
Briefly anticipating our results, we find that hazard rates first increase and then
decrease with age. This is true both for manufacturing and services, although firms
in the service sector are subject to a higher maximum hazard rate. We also find
differences in maximum hazard rates among the types of manufacturing industries
described by three sectoral taxonomies. These findings point to the importance of
sunk costs and the human resource dimension on survival rates, and in general to the
intensity of competition. Finally, we find that entry size, market growth, market
concentration, net entry and the vintage index––a rough proxy for the industry life-
cycle––have their predicted effects on the duration of firms.
2 Data
Our analysis is based on data from the Austrian social security files. The parent
administrative dataset covers all employers with one or more employees in all
sectors of the economy between 1975 and 2004, with less than complete coverage in
the years from 1972 to 1975. We use the employers’ records to construct a dataset of
business units. The main advantage of this dataset when compared to others
available for Austria lies in its comprehensiveness. It covers about one million
business units, seventy percent of which are assigned to a 6-digit NACE industry.
Of these, only 10% operate in manufacturing, while 61% operate in market services.
Despite having the largest output and employment share, the service sector is still
underrepresented in most of the datasets studied in the literature. The remaining
29% operate in the primary sector, utilities, or non-market services.3
Our dataset covers 29 years of daily operation, making it especially well-suited
for the study of firm duration. Measuring the duration in days as opposed to years
allows for a precise analysis of the effect of age on duration. The longer the time
period covered, the lower is the share of truncated durations that occur when either
the entry or the exit date is unobserved. It is this comprehensiveness and time
coverage that makes these data so appealing for the duration analysis. However, as
is common for administrative employment data in other countries, the comprehen-
siveness comes at the cost of scarce information on other characteristics of the
business unit such as productivity, financial performance, type of ownership and
relations to other business units.4 With only a few firm-specific variables available,
we focus on the impact of market structure and the demographic characteristics of
the industry on firm survival.
Table 1 shows that more than one half of all entrants in the manufacturing and
service sectors have only one employee. The median entry size and the median
lifespan or duration of manufacturing firms is only slightly higher than that of
service firms, which is surprising given the typically higher start up costs in the
3 We exclude these for various reasons. Competition in the farming industry is largely shaped by its
unique regulatory environment. Data on mining and utilities are sparse, while non-market services mostly
belong to the public sector.4 Stiglbauer (2003) argues that, due to the economies of scale in administrative reporting, the bulk of the
data can be found on the level of enterprises, not establishments. Clearly, this uncertainty is negligible for
small firms.
44 Empirica (2008) 35:41–58
123
manufacturing sector. On the contrary, average entry size is markedly higher in the
manufacturing sector, but a comparison of the two distributions reveals this
difference to originate from the 90th percentile. A large entrant in the manufacturing
sector is typically much larger than a large entrant in the service sector.
The dependent variable is firm duration measured in days. Measured from the
date of entry to that of exit, duration should ideally equal the firm’s age in days. In
practice, duration is often shorter than age due to either or both dates being
unobserved, in which case one speaks of truncation. Left truncation occurs when the
entry date is unobserved, right truncation when the exit date is unobserved. For
45.8% of the durations in manufacturing both the entry and exit dates are known
(Table 1).
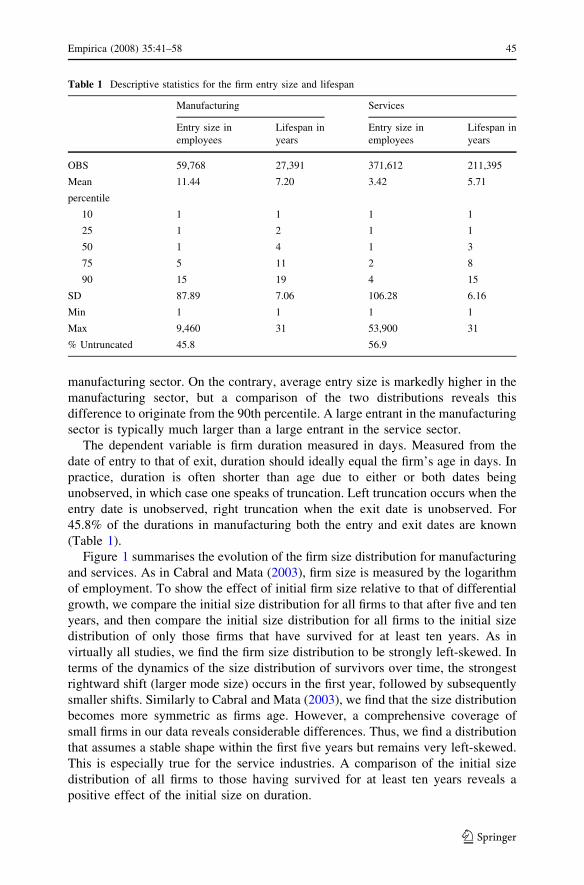
Figure 1 summarises the evolution of the firm size distribution for manufacturing
and services. As in Cabral and Mata (2003), firm size is measured by the logarithm
of employment. To show the effect of initial firm size relative to that of differential
growth, we compare the initial size distribution for all firms to that after five and ten
years, and then compare the initial size distribution for all firms to the initial size
distribution of only those firms that have survived for at least ten years. As in
virtually all studies, we find the firm size distribution to be strongly left-skewed. In
terms of the dynamics of the size distribution of survivors over time, the strongest
rightward shift (larger mode size) occurs in the first year, followed by subsequently
smaller shifts. Similarly to Cabral and Mata (2003), we find that the size distribution
becomes more symmetric as firms age. However, a comprehensive coverage of
small firms in our data reveals considerable differences. Thus, we find a distribution
that assumes a stable shape within the first five years but remains very left-skewed.
This is especially true for the service industries. A comparison of the initial size
distribution of all firms to those having survived for at least ten years reveals a
positive effect of the initial size on duration.
Table 1 Descriptive statistics for the firm entry size and lifespan
Manufacturing Services
Entry size in
employees
Lifespan in
years
Entry size in
employees
Lifespan in
years
OBS 59,768 27,391 371,612 211,395
Mean
percentile
11.44 7.20 3.42 5.71
10 1 1 1 1
25 1 2 1 1
50 1 4 1 3
75 5 11 2 8
90 15 19 4 15
SD 87.89 7.06 106.28 6.16
Min 1 1 1 1
Max 9,460 31 53,900 31
% Untruncated 45.8 56.9
Empirica (2008) 35:41–58 45
123
3 Explanatory variables and estimation
3.1 Explanatory variables
Since we estimate a parametric regression with time-invariant explanatory
variables, our analysis is essentially a cross-sectional one, with the effect of age
absorbed in the parameters of the hazard function. The time-invariance of the
explanatory variables poses the question of when to measure them. Should we, for
instance, include market concentration at the time of entry, at the time of exit,
or perhaps the average value over the whole lifespan? With a median duration of
3–4 years it might not make a big difference, as most market structure indicators
cannot be expected to vary a lot during such a short period of time. Nonetheless,
most structural indications used in this study are, in some way or another, averaged
over the firm’s lifespan. These include market growth, employment-weighted net
entry, and the Herfindahl–Hirschman and vintage indices. Market growth is
computed as the geometric rate between the entry and exit years (or the first and the
last year of observation). The net entry rate and vintage index are averages of annual
values during the years of operation. It is important to understand that, although
entry size is the only truly firm-specific variable, all market-specific variables are
also firm-specific in the sense that the firm’s actual entry and exit dates are used to
fix the relevant values of their constituent variables, and because they are computed
separately for each firm on the basis of the data for all other firms operating in the
same 4-digit NACE industry.
Entry size is measured in terms of the number of employees on the day the
employer’s identification number first appears in the social security files. It indicates
an entrepreneur’s better resource endowment and a stronger commitment to
withstanding temporary shocks. We thus expect a positive impact of size on firm
duration.
There appears to be a consensus that high market growth improves the survival
chances of firms. Higher market growth is typically accompanied by rising output
prices, which leads, at least in the short term, to higher profit margins. Despite
MANUFACTURING SERVICES
0.0
0.1
0.2
0.3
0.4
0.5
0.6
0.7
0.1 0.4 0.8 1.1 1.5 1.8
LOG10
(SIZE)2.2 2.5
0.0
0.1
0.2
0.3
0.4
0.5
0.6
0.7
0.0 0.4 0.7 1.1 1.5 1.8
LOG10
(SIZE)2.2 2.5
ENTRY 5 Y 10 Y 10 Y SURVIVORS ON ENTRYENTRY 5 Y 10 Y 10 Y SURVIVORS ON ENTRY
Fig. 1 The evolution of the firm size distribution over time
46 Empirica (2008) 35:41–58
123
market growth signifying an opportunity, the prospects of a single firm depend on
how many competitors it has. For an analysis of firm survival, one should therefore
take into account whether market expansion comes in the form of internal or
external growth. By separating the employment growth of an average firm from the
net entry rate, we identify a market growth component that is independent of
changes in the total number of firms. We thus aim to separate the general growth
prospects of a firm in an industry from the impact of changes in the number of its
potential rivals emanating from the influx of entrants to and the outflow of
incumbents from that same industry.
Our first measure of market growth is a geometrically computed growth rate of
the average number of employees per firm. Denote by E the ratio of total
employment of a NACE 4-digit industry to the total number of firms operating in
that industry. Then,
GROWTH ¼ffiffiffiffiffi
Ex
Ee
l�1
r
� 1: ð1Þ
The subscript x denotes the value in the firm’s year of exit (or the last year of
observation if the exit date is unobserved), and e denotes the value in the firm’s year
of entry (or the first year of observation if the entry date is unobserved). Finally, ldenotes the number of years of operation. It is well-known that small firms
experience higher average growth rates than large firms, thereby violating Gibrat’s
law of proportional effects (Sutton 1997). Beyond that, we expect this variable to
positively correlate with firm duration, reflecting the general opportunities prevalent
in the market.
The second measure relating to market growth is the employment weighted netentry of firms, defined as
NET ENTRY ¼ Le � Lx
L; ð2Þ
where Le – Lx is the net inflow of employment due to entry and exit in a given sector
and year, and L is the total employment in that sector. In our regression we include
the mean of L over the firm’s lifespan. Since our first measure of average firm
growth already controls for the opportunities an expanding market offers to
individual firms, a higher net entry reflects the increasing competition due to a
growing firm population.5
The Herfindahl–Hirschman index of market concentration, HHI, is computed using
the firm’s share in total employment of a NACE 4-digit industry. The index takes
values between the reciprocal of the number of firms operating in the sector and one,
with the value of one corresponding to the maximum concentration. In the regression
we include the difference between index values recorded over the lifespan
DHHI ¼ HHIx � HHIe ¼X
i
s2ix �
X
i
s2ie: ð3Þ
5 At the same time, net entry can proxy opportunities perceived by entrants (Peneder 2007).
Empirica (2008) 35:41–58 47
123
The sums are over the squares of the market shares of all firms in the 4-digit industry.
The change in market concentration is expected to have a negative effect on duration.
Agarwal and Audretsch (2001) and Agarwal et al. (2002) link the patterns of firm
duration to the industry life cycle hypothesis.6 The latter uncover differences in the
pattern of firm survival between the growth and the maturity phases. The growth
phase is characterized by low but rising mortality rates coupled with a moderate
liability of smallness but no liability of newness. Mature industries are characterized
by high but constant or falling mortality rates, and a stronger liability of newness.
Although quite long, the time-span of our data does not allow us to directly test
the effects of an industry life cycle. Instead we rely on the industrial vintage indexas a proxy (Desai et al. 2003). The index reflects the relative weight of young firms
in the overall population and is defined as the employment weighted average age
distribution of firms in an industry:
VINTAGE ¼X
i
LiAGEi
L: ð4Þ
The index is a weighted sum of the employment shares of all firms in a given
sector and year, with the firm’s age serving as the weights. A high vintage means
that a large portion of the overall productive capacity is employed in older
companies––a sign of a mature industry. Conversely, a low vintage characterises
‘entrepreneurial’ industries, where the predominance of younger firms indicates
either an early stage of a life cycle, or a competitive regime with a sustained
‘rejuvenation’ of the firm population through the displacement of incumbents by
new entrants (‘creative destruction’).
The theoretical literature recognizes the role of sunk costs as a barrier to both
entry and exit (Dixit 1989; Sutton 1991; Sutton 1998; Amir and Lambson 2003).
Sunk costs also consist of fixed investments in tangible and intangible assets, such
as superior technology or high reputation. These investments are sunk because most
if not all of their economic value will be lost on exit. As a barrier to exit, they also
discourage entry by dampening the expected post-entry profits due to aggressive
pricing by incumbents. Typical direct measures of sunk costs include industry’s
capital, R&D and advertising expenditures.
The turnover rate, measured as the sum of entry and exits divided by the total
number of firms, is an alternative indirect proxy that can be directly derived from data
on firm demography. The rationale is that higher sunk costs cause entry and exit rates
to fall, which by definition implies lower rates of firm turnover. In a study of entry and
exit in Austrian industries, Holzl (2005) confirms the negative effect of tangible and
intangible sunk costs on the level and volatility of firm turnover. Peneder (2007) uses
the turnover rate as a proxy for the ‘cost of experimentation’, that is, sunk costs, in a
sectoral study of firm demography in the OECD countries. In this study, we use the
turnover rate as a proxy for sunk costs in our basic specification.
6 This hypothesis takes a bird’s eye view of the evolution of industries by identifying several stages of
development, starting with an embryonic industry environment, to a growing industry followed by
eventual shakeout (a mass exit), maturity and decline (Klepper 1996).
48 Empirica (2008) 35:41–58
123
Sunk costs are notoriously difficult to measure empirically, and firm turnover is a
distant proxy. In an alternative specification we apply three distinct taxonomies ofmanufacturing industries that were explicitly designed to capture an industry’s
general reliance on intangible investments, human resources and inputs from
external services as distinct sources of competitive advantage. In addition to the
discrimination of industries according to the extent and nature of sunk costs, the
three taxonomies also capture broad patterns of competitive strategies typically
pursued in these industries (Kaniovski and Peneder 2002).
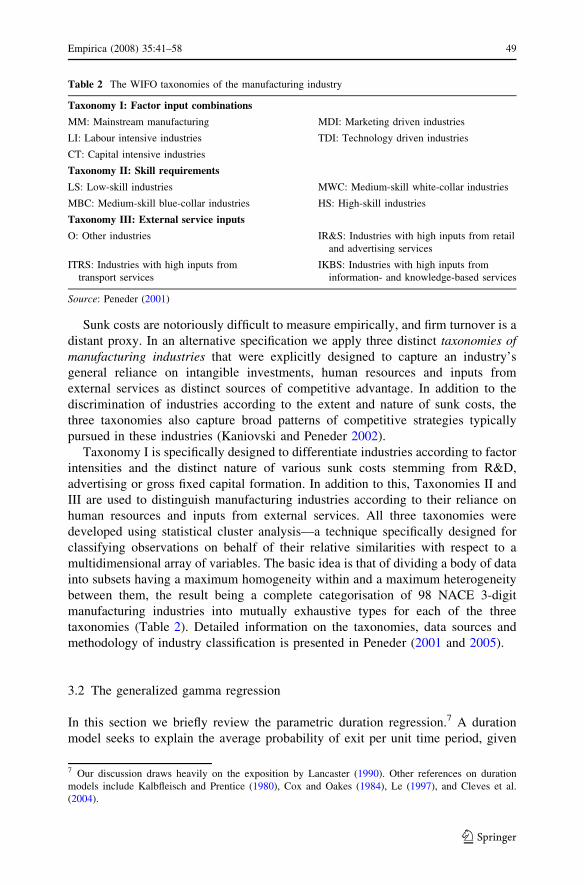
Taxonomy I is specifically designed to differentiate industries according to factor
intensities and the distinct nature of various sunk costs stemming from R&D,
advertising or gross fixed capital formation. In addition to this, Taxonomies II and
III are used to distinguish manufacturing industries according to their reliance on
human resources and inputs from external services. All three taxonomies were
developed using statistical cluster analysis––a technique specifically designed for
classifying observations on behalf of their relative similarities with respect to a
multidimensional array of variables. The basic idea is that of dividing a body of data
into subsets having a maximum homogeneity within and a maximum heterogeneity
between them, the result being a complete categorisation of 98 NACE 3-digit
manufacturing industries into mutually exhaustive types for each of the three
taxonomies (Table 2). Detailed information on the taxonomies, data sources and
methodology of industry classification is presented in Peneder (2001 and 2005).
3.2 The generalized gamma regression
In this section we briefly review the parametric duration regression.7 A duration
model seeks to explain the average probability of exit per unit time period, given
Table 2 The WIFO taxonomies of the manufacturing industry
Taxonomy I: Factor input combinations
MM: Mainstream manufacturing MDI: Marketing driven industries
LI: Labour intensive industries TDI: Technology driven industries
CT: Capital intensive industries
Taxonomy II: Skill requirements
LS: Low-skill industries MWC: Medium-skill white-collar industries
MBC: Medium-skill blue-collar industries HS: High-skill industries
Taxonomy III: External service inputs
O: Other industries IR&S: Industries with high inputs from retail
and advertising services
ITRS: Industries with high inputs from
transport services
IKBS: Industries with high inputs from
information- and knowledge-based services
Source: Peneder (2001)
7 Our discussion draws heavily on the exposition by Lancaster (1990). Other references on duration
models include Kalbfleisch and Prentice (1980), Cox and Oakes (1984), Le (1997), and Cleves et al.
(2004).
Empirica (2008) 35:41–58 49
123

that the firm has survived until time T. This probability is formally defined by the
hazard function over a short time interval of length dt after t as
hðtÞ ¼ limdt!0
Pðt� T � t þ dtjT � tÞdt
: ð5Þ
Roughly speaking, the hazard function gives the instantaneous probability of exit
in the next time period, given that the firm has survived until then (i.e., in the event
T ‡ t). The hazard function is usually expressed in terms of the probability
distribution F and the density function f = F0 of the firm’s duration as
hðtÞ ¼ limdt!0
Fðt þ dtÞ � FðtÞdt
� 1
1� FðtÞ ¼f ðtÞ
1� FðtÞ : ð6Þ
Different functional forms of the relationships between the instantaneous
probability of exit and duration can be modelled by choosing a suitable functional
form for F. This is the essence of the parametric approach to the analysis of
durations. The parametric approach has two advantages. First, specifying the
functional form of F helps us to adequately deal with truncated durations and,
second, choosing a suitably flexible functional form of F allows us to test a variety
of shapes of the hazard function, leading to possibly distinct models of the age
dependency.
The generalized gamma distribution is a highly flexible functional form that
allows for a large number of possible shapes of the hazard function. The exponential
(constant hazard), Weibull (monotonically increasing or decreasing hazard) and log-
normal (skewed inverted U-shape, non-monotonic hazard) distributions are all
special cases of the generalized gamma distribution. It is a three-parameter
distribution with a probability density function
f ðtÞ ¼akamtam�1e�kata
CðmÞ t [ 0
0 t� 0
�
a [ 0; m [ 0; k [ 0: ð7aÞ
The corresponding hazard function cannot be written in closed form, as Finvolves an incomplete gamma integral
CðmÞ ¼Z
1
0
xm�1e�xdx; m [ 0: ð7bÞ
Parameters a and m define the shape of the function, while k is a scale parameter.
Depending on the values of a and m, the hazard function can assume linear,
monotonically increasing or decreasing, or, in the case am [ 1 and a \ 1, non-
monotonic inverted U-shaped forms. For m = 1 it reduces to the probability density
function of the Weibull distribution; for m = a = 1 to the exponential density. Using
a parameterization, it can be shown to yield the log-normal distribution as m ? ?.
In this parameterization, the tested parameter assumes the value of zero under the
null-hypothesis leading to the log-normal model. The log-normal model implies an
inverted U-shaped hazard function.
50 Empirica (2008) 35:41–58
123
We have estimated an accelerated life regression. Without censoring or
truncation, the regression model can be written as8
log T ¼ X0bþ e: ð8Þ
Here X is the matrix of explanatory variables, b the vector of coefficients to be
estimated and e a random variable with a distribution independent of X or b. Vector
b contains the effect of changes in the explanatory variables on the expected
logarithmic duration. If exp(–xibx) [ 1, then an increase in the ith variable
shortens the expected logarithmic duration, whereas it has the opposite effect if
exp(–xibx) \ 1. The distribution of e is defined by the choice of the parametric
model. For example, in the generalized gamma model e is distributed as a positive
power of a standard gamma variate, whose density function is given by (7a), while
choosing the log-normal distribution for e would lead to a normally distributed error
term. In any case, ei’s are i.i.d. with unknown variance and known distributional
form. The expected lifetime given by e’s distribution is accelerated in the former
case and decelerated in the latter, hence the name of the regression model.
Several remarks are in order before we proceed with the estimation of the above
specification. First, the above regression model is essentially a cross-sectional
model. The explanatory variables are time-invariant. This raises the question of the
time period at which to measure them. How we deal with this issue is discussed in
Sect. 3.1. Second, the model is homoscedastic. In particular, the hazard function
obtained by estimation implies that in 1975 a five-year-old firm was subject to the
same probability of exit as was a five-year-old firm in 1995, or in any other year.
Hazard rates depend on duration, not entry date. Third, we would like to use the
dummy variables indicating membership in the types of industries distinguished by
the taxonomies. The inclusion of a dummy variable changes the estimates for the
coefficients and the parameters of the hazard function, but is unlikely to change the
functional form of the hazard function. A complete test would involve attaching
indicator variables to every parameter of the hazard function. Such a test would be
extremely computationally intensive given the size of the dataset and the number of
estimated parameters. Despite its flexibility, the generalized gamma model cannot
produce bimodal hazard functions, such as the ‘bathtub’ that describes the lifespan
of a human (higher mortality in infancy and near certain death upon reaching high
age). Thus, the model can be used to test either the liability of newness or the
liability of the age hypothesis, but not both. While we find strong support for the
first hypothesis, we surmise that data of even longer duration is required to
adequately test the second hypothesis.
4 Results
Our basic specification includes the five variables defined in Sect. 3.1, without the
dummy variables indicating different types of industries as discriminated by the
8 For a discussion of censoring and truncation in parametric models see, for example, chapter 4 in Cleves
et al. (2004).
Empirica (2008) 35:41–58 51
123
taxonomies. To reduce the computational burden and to highlight the differences
between manufacturing and market services, we have estimated this specification
separately for NACE industries 15 to 37 and NACE industries 50–74. The estimates
for the basic specification are shown in the second and sixth columns of Table 3,
which reports the non-exponentiated coefficient vector b. The positive sign on a
coefficient signifies a duration-prolonging effect of the respective variable.
Large initial size, measured in terms of the total number of employees, prolongs
the entrant’s life in both manufacturing and market services. Its influence is
somewhat higher in manufacturing, arguably because of the higher initial labour and
capital endowments required to start a manufacturing business. On average, firms
that start with more employees also have higher initial capital endowments, which
may serve as an indicator of their ability to withstand external shocks. However, in
our case this finding must be interpreted with caution, as large entry size could be
related to the establishment of a subsidiary of an already existing large enterprise––
a possibility we cannot exclude in our data.
We use industrial vintage as a crude control for the phase of the industry life-
cycle. The higher the share of old and large firms in the sector’s total
employment, the higher is the vintage index. High values of the index signify
mature industries and have a significant negative impact on firm duration. To
compete with older (presumably more experienced) firms in the same industry
appears to reduce one’s own prospect of survival. Increasing market concentration
as measured by the Herfindahl–Hirschman index has a negative effect on firm
duration. The coefficient on the vintage index is higher in manufacturing.
However, we are surprised to find that the negative effect of the change in the
Herfindahl-index is more than three times higher in services than in manufac-
turing, despite manufacturing industries being more concentrated. The data
suggest that, for services, the Herfindahl-index indeed indicates market concen-
tration, because firms tend to compete for the same local market. In contrast, the
same index for more export-oriented manufacturing sectors may conflate the effect
of increasing market concentration with that of growing industrial specialisation
due to comparative advantages.
Higher market growth unambiguously improves chances of survival. However,
our analysis shows that there is an important demographic dimension to this effect.
Separating market growth into the effects of net entry––that is, an increase in the
total population of firms, and the average employment growth per firm, we find
higher growth rates of an average firm to increase the lifespan of an entrant, whereas
a growing firm population, measured as the employment weighted net entry rate, has
the opposite effect. The negative effect of net entry is especially high and
statistically significant in the service industries. This finding strongly points to
displacement effects being the norm rather than the exception in services, which is
consistent with our previous argument about the more local nature of competition in
services when compared to manufacturing.
Next, we test the shape of the hazard function using the Likelihood-ratio-test
based on the numerical maximum of the log likelihood function, and the Wald test
on the relevant shape parameters of the generalized gamma distribution described in
Sect. 2.3 (Table 4). The null-hypothesis provides the parameter restrictions leading
52 Empirica (2008) 35:41–58
123

Tab
le3
Est
imat
esof
the
gen
eral
ized
gam
ma
dura
tion
regre
ssio
n
Man
ufa
ctu
rin
gS
erv
ices
En
try
size
0.0
01
99
(15
.28)*
**
0.0
02
05
(15
.30
)**
*0
.002
08
(15
.58)*
**
0.0
02
13
(15
.97)*
**
0.0
00
16
(8.7
0)
**
*
Vin
tag
eIn
dex
–0
.06
13
5(–
66
.30
)**
*–
0.0
65
57
(–8
1.0
7)*
**
–0
.06
55
7(–
81
.05
)**
*–
0.0
65
13
(–8
0.3
8)*
**
–0
.05
83
9(–
12
3.3
6)*
**
Gro
wth
2.9
62
99
(18
.55)*
**
3.4
56
96
(20
.89
)**
*3
.458
50
(21
.26)*
**
3.1
03
20
(19
.40)*
**
1.7
08
02
(39
.07
)**
*
Net
entr
y–
0.3
75
43
(–0
.59)
–0
.38
50
3(–
0.5
9)
–0
.10
24
9(–
0.1
6)
0.3
82
78
(0.5
8)
–8
.90
49
5(–
10
.50
)**
*
DH
erfi
nd
ahl
Ind
ex–
0.7
60
49
(–8
.15)*
**
–0
.66
64
4(–
7.2
5)*
**
–0
.64
35
5(–
7.0
0)*
**
–0
.68
88
0(–
7.4
6)*
**
–3
.04
43
3(–
49
.11
)**
*
Tu
rnov
er–
1.1
76
10
(–8
.52)*
**
–2
.84
53
0(–
11
5.9
4)*
**
Lab
our
inte
nsi
ve
(LI)
0.0
22
32
(1.7
3)*
Cap
ital
inte
nsi
ve
(CT
)0
.104
80
(3.0
5)*
**
Mar
ket
ing
dri
ven
(MD
I)0
.070
68
(5.2
8)*
**
Tec
hn
olo
gy
dri
ven
(TD
I)0
.177
20
(8.4
1)*
**
Lo
wsk
ill
(LS
)–
0.0
61
59
(–4
.47)*
**
Med
ium
skil
lb
lue
coll
ar(M
BC
)0
.018
00
(1.3
1)
Hig
hsk
ill
(HS
)0
.051
21
(2.4
7)*
*
Hig
hin
pu
tsfr
om
reta
il
and
adv
erti
sin
g(I
R&
S)
0.0
24
69
(1.9
6)*
Tra
nsp
ort
(IT
RS
)–
0.0
92
82
(–6
.02)*
**
Kn
ow
led
ge-
bas
ed(I
KB
S)
–0
.16
31
6(–
12
.73
)**
*
Nu
mb
ers
inp
aren
thes
isar
et-
stat
isti
cs.
Lev
elof
signifi
cance
:***
1%
;**
5%
;*
10%
.E
stim
ates
for
the
inte
rcep
tan
dth
epar
amet
ers
of
the
haz
ard
funct
ion
are
not
show
n
Empirica (2008) 35:41–58 53
123
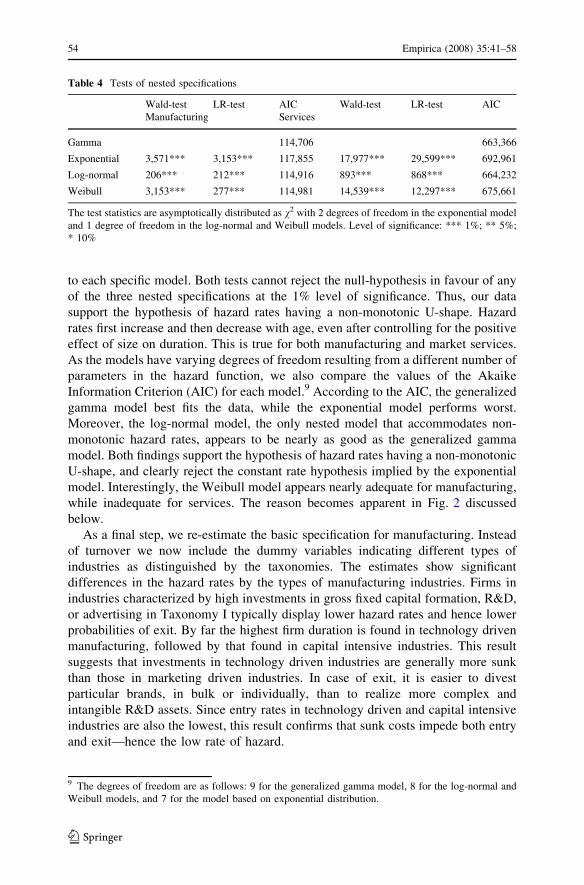
to each specific model. Both tests cannot reject the null-hypothesis in favour of any
of the three nested specifications at the 1% level of significance. Thus, our data
support the hypothesis of hazard rates having a non-monotonic U-shape. Hazard
rates first increase and then decrease with age, even after controlling for the positive
effect of size on duration. This is true for both manufacturing and market services.
As the models have varying degrees of freedom resulting from a different number of
parameters in the hazard function, we also compare the values of the Akaike
Information Criterion (AIC) for each model.9 According to the AIC, the generalized
gamma model best fits the data, while the exponential model performs worst.
Moreover, the log-normal model, the only nested model that accommodates non-
monotonic hazard rates, appears to be nearly as good as the generalized gamma
model. Both findings support the hypothesis of hazard rates having a non-monotonic
U-shape, and clearly reject the constant rate hypothesis implied by the exponential
model. Interestingly, the Weibull model appears nearly adequate for manufacturing,
while inadequate for services. The reason becomes apparent in Fig. 2 discussed
below.
As a final step, we re-estimate the basic specification for manufacturing. Instead
of turnover we now include the dummy variables indicating different types of
industries as distinguished by the taxonomies. The estimates show significant
differences in the hazard rates by the types of manufacturing industries. Firms in
industries characterized by high investments in gross fixed capital formation, R&D,
or advertising in Taxonomy I typically display lower hazard rates and hence lower
probabilities of exit. By far the highest firm duration is found in technology driven
manufacturing, followed by that found in capital intensive industries. This result
suggests that investments in technology driven industries are generally more sunk
than those in marketing driven industries. In case of exit, it is easier to divest
particular brands, in bulk or individually, than to realize more complex and
intangible R&D assets. Since entry rates in technology driven and capital intensive
industries are also the lowest, this result confirms that sunk costs impede both entry
and exit––hence the low rate of hazard.
Table 4 Tests of nested specifications
Wald-test LR-test AIC Wald-test LR-test AIC
Manufacturing Services
Gamma 114,706 663,366
Exponential 3,571*** 3,153*** 117,855 17,977*** 29,599*** 692,961
Log-normal 206*** 212*** 114,916 893*** 868*** 664,232
Weibull 3,153*** 277*** 114,981 14,539*** 12,297*** 675,661
The test statistics are asymptotically distributed as v2 with 2 degrees of freedom in the exponential model
and 1 degree of freedom in the log-normal and Weibull models. Level of significance: *** 1%; ** 5%;
* 10%
9 The degrees of freedom are as follows: 9 for the generalized gamma model, 8 for the log-normal and
Weibull models, and 7 for the model based on exponential distribution.
54 Empirica (2008) 35:41–58
123
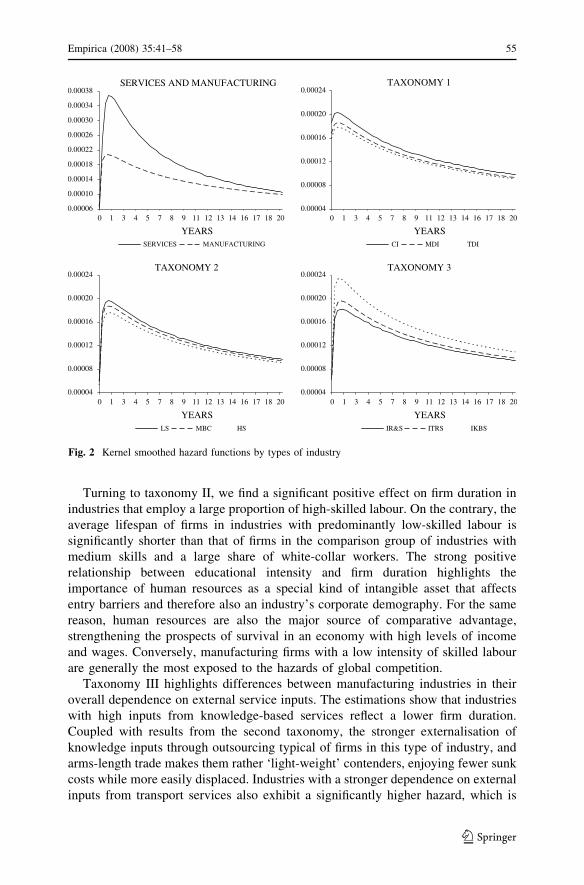
Turning to taxonomy II, we find a significant positive effect on firm duration in
industries that employ a large proportion of high-skilled labour. On the contrary, the
average lifespan of firms in industries with predominantly low-skilled labour is
significantly shorter than that of firms in the comparison group of industries with
medium skills and a large share of white-collar workers. The strong positive
relationship between educational intensity and firm duration highlights the
importance of human resources as a special kind of intangible asset that affects
entry barriers and therefore also an industry’s corporate demography. For the same
reason, human resources are also the major source of comparative advantage,
strengthening the prospects of survival in an economy with high levels of income
and wages. Conversely, manufacturing firms with a low intensity of skilled labour
are generally the most exposed to the hazards of global competition.
Taxonomy III highlights differences between manufacturing industries in their
overall dependence on external service inputs. The estimations show that industries
with high inputs from knowledge-based services reflect a lower firm duration.
Coupled with results from the second taxonomy, the stronger externalisation of
knowledge inputs through outsourcing typical of firms in this type of industry, and
arms-length trade makes them rather ‘light-weight’ contenders, enjoying fewer sunk
costs while more easily displaced. Industries with a stronger dependence on external
inputs from transport services also exhibit a significantly higher hazard, which is
SERVICES AND MANUFACTURING
1 3 4 5 7 8 9 11 12 13 14 16 17 18 20
YEARS
0.00006
0.00010
0.00014
0.00018
0.00022
0.00026
0.00030
0.00034
0.00038
0
1 3 4 5 7 8 9 11 12 13 14 16 17 18 200
SERVICES MANUFACTURING
TAXONOMY 2 TAXONOMY 3
0.00004
0.00008
0.00012
0.00016
0.00020
0.00024
TAXONOMY 1
0.00004
0.00008
0.00012
0.00016
0.00020
0.00024
0 1 3 4 5 7 8 9 11 12 13 14 16 17 18 20
0 1 3 4 5 7 8 9 11 12 13 14 16 17 18 20
YEARSCI MDI TDI
0.00004
0.00008
0.00012
0.00016
0.00020
0.00024
YEARSLS MBC HS
YEARSIR&S ITRS IKBS
Fig. 2 Kernel smoothed hazard functions by types of industry
Empirica (2008) 35:41–58 55
123
consistent with the expectation of rising intensity of competition the more tradable
the goods, and hence the more distant their shipments are.
Note that introducing dummy variables only slightly changes the estimates of the
variables that have been kept from the basic specification, preserving their statistical
significance. This fact underscores the robustness of our basic specification.
Figure 2 shows the smoothed estimated hazard functions for the manufacturing
industries by type of industry. To generate them, we have used a very simple
specification with entry size as the only explanatory variable. Our results strongly
confirm the liability of the newness hypothesis. Younger firms are subject to higher
probabilities of exit than older firms, even after controlling for the positive effect of
initial size on survival. Both for manufacturing and services, hazard rates first
increase and then decrease with age, although firms in service industries experience
markedly higher maximum hazard rates. Hazard rates peak at the beginning of the
second year of operation. One year seems to be the average experimentation time
required for an entrant to learn its competitiveness.
5 Summary
This paper presents an empirical analysis of the patterns and determinants of firm
survival and the evolution of firm size distribution in Austria. Our analysis is based
on micro-level data from the Austrian social security files that covers all employers
with one or more employees in all sectors of the economy between 1975 and 2004.
We estimate parametric regressions with a flexible hazard function based on the
generalized gamma distribution, and use it to test the shape of the hazard function.
Our dependent variable is firm duration measured in days. Our explanatory
variables focus on the impact of market structure and demographic characteristics of
the industry. We use (i) the initial number of employees as a measure of entry size;
(ii) an index of industrial vintage to proxy the maturity of an industry in terms of
life cycle hypotheses; (iii) the difference between the Herfindahl-index of marketconcentration at the time of entry and the time of exit of the firm to capture the
impact of changes in the intensity of competition. Further, we separate the impact of
market growth into (iv) the average employment growth of firms in the industry and
(v) the employment weighted net entry rate, which controls for the impact from the
overall growth or decline in the number of firms. Finally, we use (vi) the turnover
rate, and alternatively, a series of dummy variables from (vii) three distinct sectoral
taxonomies to test for the influence of sunk costs on the survival of firms.
Our analysis reveals the following:
1. The firm size distribution is extremely left-skewed but becomes more
symmetric as firms age, albeit at a diminishing rate. In the service industries
the firm size distribution assumes a relatively stable shape within the first five
years;
2. Initial size has a significant positive effect on firm survival, indicating an
entrepreneur’s better resource endowment and a stronger commitment to
withstanding temporary shocks;
56 Empirica (2008) 35:41–58
123
3. High values of industrial vintage, indicative of mature industries, have a
significant negative impact on firm duration. Having to compete with older and
more experienced firms in the same industry appears to have an adverse effect
on a firm’s prospect of survival;
4. Although market growth signifies an opportunity, the prospects of a single firm
depend on how many competitors are after it. When growth is internal,
measured by rising average employment per firm, the effects are significant and
positive. When market growth is largely absorbed by a growing firm population
via positive net entry rates, competition rises while the average duration
declines;
5. We generally expect sunk costs to lower entry and exit rates and therefore
improve the prospects of survival for firms already in the market. This
hypothesis is confirmed by our estimations using the turnover rate as an indirect
proxy of their overall extent, as well as by the use of sectoral taxonomies that
additionally distinguish between different kinds of tangible and intangible
sources of competitive advantage. Overall, membership in an industry that can
be characterised as technology driven, capital intensive, and human resource
intensive showed the highest positive impact on firm duration;
6. We find an inverted U-shape hazard function in both manufacturing and market
services, reaching a peak twelve months after entry. Firms in services
experience markedly higher maximum hazard rates. The latter finding supports
the liability of the newness hypothesis drawn in the literature on organizational
ecology, but only partially, as the relationship between the probability of exit
and age is not monotonic. This finding is consistent with the recent literature on
firm survival, while earlier studies often find monotonously decreasing hazard
rates.
Acknowledgments This paper benefited from comments and suggestions by Werner Holzl, PeterHuber, Michael Pfaffermayr and Egon Smeral, and the editorial assistance of Christine Kaufmann andAstrid Nolte. We are particularly indebted to Marianne Schoberl and Peter Huber, who invested muchtime, effort and ingenuity in compiling the micro-data from the Austrian social security files and sharedthem with us. All remaining errors are the sole responsibility of the authors. Both authors gratefullyacknowledge financial support from the Jubilaumsfond of the Austrian National Bank (Grant No. 11092).
References
Agarwal R, Audretsch DB (2001) Does start-up size matter? The impact of technology and product life
cycle on firm survival. J Ind Econ 49:21–44
Agarwal R, Sarkar MB, Echambadi R (2002) The conditioning effect of time on firm survival: a life cycle
approach. Acad Manage J 45:971–994
Amir R, Lambson V (2003) Entry, exit, and imperfect competition in the long run. J Econ Theory
110:191–203
Audretsch DB (1991) New firm survival and the technological regime. Rev Econ Stat 68:441–450
Audretsch DB, Mahmood T (1995) New firm survival: new results using a hazard function. Rev Econ Stat
77:97–103
Baldwin JR, Gorecki PK (1991) Firm entry and exit in Canadian manufacturing sector, 1970–1982. Can
J Econ 24:300–323
Cabral LMB, Mata J (2003) On the evolution of the firm size distribution: facts and theory. Am Econ Rev
93:1075–1090
Empirica (2008) 35:41–58 57
123
Carroll GR, Hannan MT (2000) The demography of corporations and industries. Princeton University
Press
Caves RE (1998) Industrial organization and new findings on the turnover and mobility of firms. J Econ
Lit 36:1947–1982
Cefis E, Marsili O (2005) A matter of life and death: innovation and firm survival. Ind Corpor Change
14:1–26
Cleves MA, Gould WW, Gutierrez RG (2004) An introduction to survival analysis using STATA1, Stata
Press
Cox DR, Oakes D (1984) Analysis of survival data, Chapman & Hall
Desai M, Gompers P, Lerner J (2003) Institutions, capital constraints and entrepreneurial firm dynamics:
evidence from Europe. NBER Working Papers 10165, National Bureau of Economic Research
Dixit A (1989) Entry and exit decisions under uncertainty. J Polit Econ 97:620–638
Dunne T, Roberts MJ, Samuelson L (1988) Patterns of firm entry and exit in US manufacturing industries.
RAND J Econ 19:495–515
Ericson R, Pakes A (1995) Markov-perfect industry dynamics: a framework for empirical work. Rev
Econ Stud 62:53–82
Evans D (1987) Tests of alternative theories of firm growth. J Polit Econ 95:657–674
Freeman J, Carroll GR, Hannan MT (1983) The liability of newness. age dependence and organizational
death rates. Am Sociol Rev 48:692–710
Hannan MT, Carroll GR (1992) Dynamics of organizational populations: density, legitimation, and
competition. Oxford University Press
Geroski PA (1995) What do we know about entry? Int J Indust Organ 13:421–440
Holzl W (2005) Tangible and intangible sunk costs and the entry of firms in a small open economy: the
case of Austria. Appl Econ 37:2429–2443
Jovanovic B (1982) Selection and the evolution of industry. Econometrica 50:649–670
Kalbfleisch JD, Prentice RL (1980) The statistical analysis of failure time data. John Wiley & Sons
Kaniovski S, Peneder M (2002) On the structural dimension of competitive strategy. Ind Corpor Change
113:557–579
Klepper S (1996) Entry, exit, growth, and innovation over the product life cycle. Am Econ Rev 86:562–583
Lancaster T, The econometric analysis of transition data, 1990, Econometric Society Monographs No. 17
Le CT (1997) Applied survival analysis. John Wiley & Sons
Mata J, Portugal P (1994) Life duration of new firms. J Indust Econ 42:227–245
Mata J, Portugal P, Guimaraes P (1995) The survival of new plants: start-up conditions and post-entry
evolution. Int J Indust Organ 13:459–481
Peneder M (2001) Entrepreneurial competition and industrial location. Edward Elgar, Cheltenham, UK
Peneder M (2005) Creating industry classifications by statistical cluster analysis. Estudios de Economica
Aplicada 23:451–463
Peneder M (2007) Firm entry and turnover: the nexus with profitability and growth. Small Bus Econ
(forthcoming)
Siegfried JJ, Evans LB (1994) Empirical studies of entry and exit: a survey of the evidence. Rev Indust
Organ 9:121–155
Stieglbauer A, Job and worker flows in Austria 1978–1998, Ph.D. thesis, University of Linz
Sutton J (1991) Sunk costs and market structure. MIT Press, Cambridge, MA
Sutton J (1997) Gibrat’s legacy. J Econ Lit 35:40–59
Sutton J (1998) Technology and market structure. MIT Press, Cambridge, MA
Wagner J (1994) The post-entry performance of new small firms in German manufacturing industries.
J Indust Econ 42:141–154
58 Empirica (2008) 35:41–58
123