Determinants of Corporate Capital Structure: Evidence from European Countries
33
Determinants of Corporate Capital Structure: Evidence from European Countries Antonios Antoniou Yilmaz Guney Krishna Paudyal Comments Welcome All authors are from the Centre for Empirical Research in Finance, Department of Economics and Finance, University of Durham, 23-26 Old Elvet, Durham, DH1 3HY, UK, Fax: 0191 374 7289. Email addresses of the authors are [email protected] , [email protected] and [email protected] respectively. This version: 1.2 (March 1, 2002)
-
Upload
independent -
Category
Documents
-
view
1 -
download
0
Transcript of Determinants of Corporate Capital Structure: Evidence from European Countries

Determinants of Corporate Capital Structure: Evidence from European Countries
Antonios Antoniou Yilmaz Guney
Krishna Paudyal
Comments Welcome All authors are from the Centre for Empirical Research in Finance, Department of Economics and Finance, University of Durham, 23-26 Old Elvet, Durham, DH1 3HY, UK, Fax: 0191 374 7289. Email addresses of the authors are [email protected], [email protected] and [email protected] respectively.
This version: 1.2 (March 1, 2002)

Determinants of Corporate Capital Structure:
Evidence from European Countries
Abstract This paper investigates the determinants of leverage ratio of French, German and British firms using panel data. These countries are characterised by different financial systems and traditions that have implications on how firms decide their capital structure. We model the leverage ratio as a function of firm specific characteristics and market related variables. The results suggest that the leverage ratio is positively affected by the size of the firm but inversely affected by market to book ratio, term-structure of interest rates and share price performance in all sample countries. Fixed-assets ratio, equity market premium, profitability and effective tax rates have different degree and direction of influence on leverage across the sample countries. The estimates reveal that the firms in all three countries adjust their debt ratios to attain their target capital structure but at different speed, French firms being the swiftest. Therefore, the capital structure decision of a firm is not only the product of its own characteristics, but also the result of environment and traditions in which it operates. Keywords: Dynamic Capital Structure, leverage, Panel Data, GMM. JEL Classification: G20, G32.
1
Determinants of Corporate Capital Structure: Evidence from European Countries
I. INTRODUCTION In spite of extensive research of four decades, the theory of capital structure remains one of the most controversial issues in modern corporate finance and Myers’ (1984, p 575) eighteen years old question “How do firms choose their capital structure?” still remains unanswered. The traditional trade-off argument postulates that optimal capital structure involves balancing the corporate tax advantages of debt financing against the present value of bankruptcy costs (Kim, 1978; Kraus and Litzenberger, 1973) and agency costs (Jensen and Meckling, 1976; Myers 1977). The empirical support for this argument is far from conclusive. For instance, while Bradley et al. (1984) find no clear evidence, Trezevant (1992) reports evidence supportive of this argument. Issues such as personal taxes (Miller, 1977) and non-debt tax shields (DeAngelo and Masulis, 1980) make the debate even more complicated. On the other hand, the Pecking Order Theory (Myers, 1984) suggests that firms do not have leverage targets and they use debt only when retained earnings are insufficient. Harris and Raviv (1991) generalise that leverage is positively related to non-debt tax shields, size of the firm, tangibility of assets and investment opportunities and is inversely related to bankruptcy risk, research & development expenditure, advertising expenditure and firm’s uniqueness. However, this generalisation cannot be accepted as stylised fact applicable to all countries due to the existence of conflicting evidence in the literature. As Berens and Cuny (1995) argue, we still do not know why the observed debt ratios of the firms are typically around 20-30 percent, despite the tax advantage of debt financing. Thus, further empirical analyses would shed light on our understanding of this important issue in corporate finance. Most empirical evidence on this issue is based on the experience of US firms1. However, studies based on the experience of a single country may not represent the effects of diversity of economic tradition and financial environment on corporate capital structures. Companies operating under Anglo-Saxon tradition (mainly USA, UK, and Canada) are known to have lower level of gearing than firms in other major economies (for instance, France, Italy, Japan and Germany). Furthermore, agency costs and indirect bankruptcy costs are known to be higher in Anglo-Saxon countries due to the lack of long-term relationship between firms and creditors and of long-term objectives of business management (see, for instance, Borio, 1996; Edward and Nibler, 2000). This paper contributes to the literature in several ways. First, it investigates the experiences of three different financial and institutional traditions viz. France, Germany and the UK. These countries represent different financial structures and traditions of their classes. The UK is known to follow the Anglo-Saxon tradition where there are large numbers of publicly listed companies and hostile takeovers owing to agency conflicts are common. Germany follows the Germanic tradition where corporate decisions and restructuring are made through the involvement of universal banks and financial holdings. In addition, capital markets are not as effective as in the Anglo-Saxon tradition and there are relatively fewer listed companies. On the other hand, France is known to follow the Latinic tradition where corporate ownership structure can be characterised by family control, financial holdings, state ownership, cross-shareholdings, and where agency problems are internalised (see Moerland, 1995). This study should shed light on the role of these financial and institutional traditions (accounting and taxation systems, bankruptcy laws, corporate governance) on capital structure decisions. 1 Notable exceptions are Booth et al. (2001), McClure et al. (1999), Rajan and Zingales (1995) and Wald (1999).

2
Second, most studies on this issue model firm specific characteristics as the determinants of capital structure. Such models cannot capture the possible effects of market conditions such as rates of interest, performance of the firm in stock markets, equity premium etc on capital structure of the firms. However, managers are likely to consider market conditions while deciding financing mix. Therefore, we extend the conventional model to incorporate the market variables. Finally, it is apparent that the role and strength of factors influencing firms' capital structure decision change overtime. Hence, cross sectional analysis of leverage ratios alone would not be sufficient in understanding the dynamism of its determinants. To explain time-varying observed differences in the capital structure of firms is another objective of this paper2. It is important to understand whether corporations react to new circumstances that occur in financial markets and how quickly they adjust their desired financial structure in response to random events. Thus, this paper extends the literature by incorporating a more complete picture of corporate dynamism in the analysis of the capital structure decision. This is achieved by analysing panel data using a two-step system-GMM procedure. The results reveal considerable differences in corporate financing patterns in France, Germany and the UK. It is found that French firms tend to adjust their leverage ratios more quickly towards their target level than their British and German counterparts. A positive relation between market-leverage and firm size is found in all countries. Market to book ratio, term-structure of interest rates and share price performance are inversely related to market-leverage in all sample countries. However, the effects of asset tangibility, equity premium, profitability and effective tax rates are found to vary across the countries. Hence, the results suggest that the differences in institutional arrangements and traditions contribute to the corporate capital structure decisions of firms. The rest of the paper is organised as follows. The next section discusses the literature and develops hypotheses in the contexts of institutional and financial traditions in sample countries. The sample, estimation methods and their robustness are discussed in section 3. Section 4 analyses the empirical results. Finally, section 5 concludes the paper.
II. THEORIES, TRADITIONS AND HYPOTHESES Based on the extant literature this section identifies variables that are potentially responsible for determining the leverage ratio of a firm. We use two different measures of leverage. First, book-leverage is measured as a ratio of book value of total debt to the book value of total assets. Second, market-leverage is measured as a ratio of book value of total debt to book value of total debt plus market value of equity. The testable propositions and hypotheses are developed in the context of institutional arrangements and traditions in the sample countries. In addition to firm specific features we include a number of market related variables in the model of determinants of capital structure. This extension rests on the premise that managers not only consider company specific features but also the general market condition while choosing the sources of finance. 2.1 Firm Characteristics and Leverage Profitability The Pecking Order theory (hereafter POT) of capital structure (Myers 1984) states that firms prefer to finance new investments from retained earnings and raise debt capital only if the former is insufficient. As the availability of internal capital (retained earnings) depends on profitability of
2 Rajan and Zingales (1995) and Titman and Wessels (1988) partially account for the leverage adjustment by taking the year-average of the explanatory variables. On the other hand, Fischer et al. (1989) and Jalilvand and Harris (1984) attempt to study dynamic capital structure. Marsh (1982) focuses on the deviations from long-term target debt levels.
3
the firm, one could expect an inverse relation between leverage and profitability. Jordan et al. (1998) argue that as small and medium-sized enterprises have restricted access to financial capital markets their capital structure should be consistent with this prediction. However, they find only limited empirical support to the predictions of the POT. Rajan and Zingales (1995), among others, empirically confirm an inverse relation between the leverage ratio and profitability. On the other hand, the Free Cash Flow theory (Jensen, 1986) suggests that debt reduces the agency cost of free cash flow. Debt financing ensures that the management is disciplined to making efficient investment decisions and that they are not pursuing individual objectives as this would increase the probability of bankruptcy (Harris and Raviv, 1990). In situations of information asymmetry, increases in the debt ratios of a profitable firm can signal quality financial management. Therefore, this theory implies a positive association between leverage and profitability. However, the findings of Kester (1986) and Titman and Wessels (1988) contradict this suggestion. We define profitability as a ratio of operating income (earnings before interest, taxes, and depreciation) to total assets. Observations show that closely held firms pay lower dividends while widely held firms, due to agency reasons, pay higher dividends. In general, French firms are closely held (by families) while British firms are widely held. On average, French firms retain 86.6 percent of earnings while British firms retain 57.2 percent. Therefore, we expect the role of profitability to be stronger in France than in the UK and a negative coefficient would support the prediction of the POT while a positive coefficient would support the free cashflow hypothesis. Effective tax rate As the interest on loan is tax-deductible, firms with higher tax liability have an incentive to use more debt. Therefore, a positive relationship between effective tax rate and leverage ratio is expected (Haugen and Senbet, 1986). This argument holds only if firms have a sufficient amount of taxable income. On the other hand, higher corporate tax rates would result in lower internal funds as well as higher cost of capital. As a result, fixed capital formation and demand for external funds would decrease (Kremp et al., 1999). This implies an inverse relationship between the level of debt and the effective tax rate. However, Titman and Wessels (1988), among others, failed to find any significant effect of corporate tax on financial decisions. Due to these complexities the overall relationship between effective tax rate and leverage remains an empirical matter. We measure the effective tax rate as the ratio of total tax to total taxable income of the firm. Market-to-book ratio Market-to-Book Ratio (MBR) measures market’s expectation of the value of the investment opportunities and growth of the firm. An increase in the probability of success of a positive NPV investment opportunity increases the MBR, as higher quality projects will be preferred by the investors. Johnson (1997) highlights the problem of asset substitution in this conjuncture since the growth opportunities related to MBRs are deemed intangibles in the sense that firms with proportionately more collateralisable tangible assets for secured debt would experience some difficulties in shifting to riskier projects. Rajan and Zingales (1995) offer two main reasons for a negative relationship between MBR and leverage. Firstly, it is expected that as MBR increases so does the cost of financial distress. Secondly, firms prefer to issue equity when the stocks are overvalued. Moreover, Myers (1977) argues that firms with growth opportunities should use less debt in order to mitigate agency problems. Thus, an inverse relationship between MBR and debt ratio is expected. Firms are less likely to use debt for funding during periods of rapid growth as the increased risk for debt holders to suffer from exploitation as mangers take more risk to raise return on equity will lead to an increase in the interest rate and/or the stipulation of limitations of managers’ ability to engage in new investment projects in the debt contracts (see argument on fixed assets in next paragraph).

4
On the other hand, faster growing firms are likely to be in need of external funds to finance their positive investment opportunities. As suggested by the POT, if firms require external finance they prefer debt relative to external equity. This causes the debt to go up and hence MBR should be positively associated with leverage (see, for example, Kremp et al., 1999). However, the strength and role of this variable is likely to vary across the sample countries. Lenders of German firms, especially the banks, are frequently represented in the supervisory board of the companies and work in close contact with the management. Thus, the lenders are likely to be fully aware of the quality of investment opportunities. This minimises information asymmetry which in turn affects the borrowing ability of the firms and the risk premium demanded by the lenders. On the other hand, British firms have arms length relationships with their lenders. Thus, lenders are unlikely to be fully aware of the quality of investment opportunities and hence they demand higher risk premiums (higher rates of interest) on their investment (loan). A higher interest rate is likely to deter firms from borrowing. Therefore, we expect MBR to have a stronger negative coefficient in the UK than in Germany. In the cases of closely held French firms the situation is likely to be similar to the cases of British firms as the information between the insiders and outside investors is likely to be asymmetric. This causes higher borrowing cost and hence high growth French firms are likely to borrow less than their German counterparts. We define MBR as the ratio of book value of total assets less book value of equity plus market value of equity to book value of total assets. Fixed assets As the value of intangible assets disappears (almost entirely) in the cases of bankruptcies the presence of tangible assets is expected to be important in external borrowing as it is easy to collateralise them. Similarly, it reduces agency costs since debts can be secured with known tangible assets that have alternative redeployable uses in case of default. Furthermore, as Stulz and Johnson (1985) argue, a firm’s opportunity to engage in asset substitution is reduced by secured debt. In firms with more intangible assets the costs of controlling capital outlays are higher as monitoring is more difficult. Similarly, Johnson (1997) argues that it is more difficult for firms holding secured debt to shift to riskier projects if they have more tangible assets. Thus, the creditors might impose restrictions to the firms with relatively less tangible assets. This general discussion converges to conclude that there is a positive relationship between leverage and fixed assets. Since collateral is more relevant in traditional bank lending than in borrowings from capital markets we expect the importance of fixed assets to be more prominent in Germany than in the UK. We define the fixed asset ratio as the ratio of net tangible assets to total assets. Size of the firm It is generally accepted that size is an inverse proxy for the probability of bankruptcy (Rajan and Zingales, 1995). Thus larger firms, because of diversification, are likely to have higher debt capacity and have expected to borrow more to maximise the tax benefit. Fama (1985) argues that the information content of small and large firms is not the same due to monitoring costs being relatively higher for smaller firms. Thus larger firms, due to lower information asymmetry, are likely to have easier access to debt markets and be able to borrow at lower cost. Consistent with the predictions of the ‘differential information hypothesis’, Titman and Wessels (1988) argue that if a size effect exists it should be associated with very small firms. Numerous studies argue that size can be a powerful explanation for cross-sectional differences in debt-equity ratios (see, for instance, Michaelas et al., 1999). Since the probability of bankruptcy is inversely related to size, such cost might be less important for large firms while raising debt capital. Thus, size is expected to be positively related to leverage. However, as Rajan and Zingales (1995) state, if the costs of financial distress are low, the positive relationship should not be strong. This proposition is empirically supported by the findings of Ferri and Jones (1979) and Kim and Sorensen (1986). Although its relation to leverage is not sufficiently straightforward, size is generally agreed to be positively associated with leverage. To capture the size effect on the leverage of firms we use two alternative definitions viz. total sales (Ln) and total assets (Ln).

5
Liquidity As described by the POT, the managers prefer internal sources of finance. Therefore, they would like to create liquid reserves from retained earnings to finance future investments. Firms with sufficient liquid asset do not require to raise external capital (debt) and hence are expected to have lower leverage. The cost of raising external capital is likely to increase with the level of information asymmetry. This asymmetry is likely to be more prominent in a market-oriented economy than in a bank-oriented economy. Hence, we expect the liquidity variable (current assets/current liabilities) to be more influential in the UK than in France and Germany in determining the corporate capital structure. Earnings volatility Firms with high earnings volatility carry a risk of earnings level dropping below the level of their debt service commitment. This may result in arranging funds at high cost to service the debt or face the risk of bankruptcy. On the other hand, firms financed by equity may choose not to pay dividend during the period of financial difficulties. Therefore, firms with highly volatile earnings borrow the least and prefer equity to debt. This suggests an inverse relation between earnings volatility and leverage ratio. However, the potential cost of failing to service debt depends upon the source of debt and the relationship of the firm with its lender. A close relation between the firm and its lender reduces such costs. The cases of German firms fall in this category as they have close ties with the banks. Therefore, the effective cost of failing to service debt is expected to be relatively low for German firms. On the other hand, British firms raise loan capital from capital markets and have arms-length relations with lenders. Hence, the cost of failing to service market debt is high. For these reasons, the British firms are expected to be more concerned with earnings volatility than their German counterparts while deciding their capital structure. 2.2 Market Related Factors Equity premium Equity premium measures the cost of equity in relation to the return on risk free investment. Evidence shows that the equity premium varies over time. Higher equity premium causes higher cost of equity capital. Thus, if a firm requires external capital during the period of high equity premium managers are likely to opt for debt than for equity. This implies a positive relationship between leverage ratio and equity premium. On the other hand, if the observed high equity premium is due to bullish stock market (stocks are overvalued), managers are likely to issue equity. This implies an inverse relation between equity premium and leverage. Therefore, the nature of the effects of equity premium on leverage is dependent on the source of change in equity premium. To allow for decision time we use six-month lagged equity premium. Term-structure of interest rates In spite of the tax savings on interest, higher interest rates cause higher weighted average cost of capital resulting in a decline in the value of the firm. Since the interest on loan is a relatively long-term fixed commitment, firms do not prefer to raise loan capital when the market rate of interest is high. Moreover, firms with higher interest commitments face higher risk of bankruptcy should the earnings level drop below the level of interest liability. Such liability increases with the increase in the rate of interest. Thus, managers are likely to consider the market rate of interest while deciding the capital structure. Since the term-structure of interest rates contains more information than the rate of interest on a particular type of financial asset, we include the term-structure as an explanatory variable in the model and expect an inverse relationship between this variable and corporate leverage ratio in all countries. This variable is measured with a six-month lag. Share price performance It is often argued that managers prefer to issue equity after share price increase. Marsh (1982) states that in choosing between debt and equity, firms are heavily affected by the past history of stock prices and market conditions. As explained by POT, information asymmetry between managers and outside investors forces managers to sell the equity at a discount. Managers offer
6
such discount when the benefit of raising external equity capital outweighs the cost of discount. When shares are overvalued discount could be offered without any loss in the wealth of existing shareholders. This is possible if equity is issued after a share price increase. This suggests an inverse relationship between the increase in share price and leverage ratio. However, such an inverse relationship with market-leverage may be observed due to artificial statistical distortions as the market value of equity increases with the change in market price even if there has not been any further equity issue. However, book leverage should remain independent of this statistical effect. These two taken together should be able to reveal the cause and nature of the relationship between leverage and change in share price. We use annual price charge to account year-end of the firm. 2.3 Lagged Leverage The effect of one period lagged leverage is useful in understanding whether firms have optimal capital structure, and if any, the degree of divergence (convergence) from (to) the target. Banerjee et al. (2000) argue that if adjustment costs (legal fees, flotation costs, etc.) are too high, dividend policy can be used to change the current capital structure without any transaction in capital markets. A positive and below unity coefficient, would suggest that firms change their capital structure over time. If the coefficient is greater than one it implies firms do not have a target debt-equity ratio. Therefore, one period lagged leverage (lagged dependent variable) will be included in the model.
III. SAMPLE AND METHODOLOGY
3.1 The Sample The selection of sample countries is motivated by the existence of distinct financial and institutional traditions prevailing in these three major European countries. In summary, the UK follows a more market-oriented tradition while Germany follows a more bank-oriented approach, with France falling in between the two traditions (see Table1 for selected indictors). To avoid a potential bias in sample selection, all non-financial firms (dead or alive) traded in the stock exchanges of the three countries are included. The sample period, guided by the availability of data, starts from 1969, 1983 and 1987 for the UK, France and Germany respectively and ends in 2000. As our dynamic models require at least three consecutive observations, firms with less than three consecutive observations are removed3. All data are obtained from Datastream. Summary statistics (Table 2) reveal that on average French firms have the highest leverage (both book leverage and market leverage) ratios (23.2 % and 31.1 %) while the UK firms borrow the least (16.7 % and 24.4 %). The average debt ratio of German firms remains between the two (19.7 % and 25.2 %)4. The relatively higher debt ratios in France and Germany confirm the view that continental European firms tend to borrow more than British firms. On the other hand the lower leverage ratio in the UK emphasise the relative importance of equity capital where share ownership is widely dispersed. The standard deviations of the debt-ratios suggest that it varies most (least) across German (UK) firms. The market leverage of French firms shows a decreasing trend over the years while book leverage remains fairly stable. The decreasing trend in market leverage implies that France is moving towards more market-oriented system as net increase in equity outweighs net increase in debt. On the other hand, there is an increasing trend in German firms' debt-ratios (both
3 See Appendix B for further details on sample selection. 4 Rajan and Zingales (1995) report that French firms have the highest debt-ratios (26%, 23%) while German (20%, 16%) and British (21%, 16%) firms have almost the same.

7
measures). This upward trend indicates that German firms are moving towards using more debt relative to equity. This further emphasises the lenders oriented structure of German corporate sector. Book leverage in the UK shows some tendency to increase over the years while Market leverage showed high degree of variability ranging from 15.7 % in 1987 and 45.0 % in 1974. Yet, the overall trend of leverage ratio in the UK is downward implying increased importance of equity over debt financing. Consistent with the predictions of the POT, correlation analysis (results available on request) reveals negative association between leverage (both definitions) and profitability in all countries. The significant negative relationship between leverage and effective tax rate in the sample countries is against the conventional wisdom. Consistent with the theoretical reasons discussed in a previous section the association between leverage and market-to-book ratio is negative in all cases. Similarly, as anticipated, both measures of leverage are found to be positively related to fixed asset and size in France and in the UK. However, whilst revealing, these univariate analysis cannot provide a complete picture of the relation between the company features and their leverage ratios. 3.1 The Methods: Determinants of leverage and the estimation methods: Unlike most previous studies this study uses panel data. There are some advantages in using panel data relative to period average cross-sectional data. It increases the degrees of freedom, renders large number of observations, reduces the collinearity among the explanatory variables and consequently leads to more efficient estimates. As discussed by Devereux and Schiantarelli (1990), to construct a complete dynamic specification that allows for the possible AR-process of the stochastic term and of adjustment costs effects we add the lagged dependent and explanatory variables to equation (1). Consider the following autoregressive distributed-lag model:
it
k k
titkib
kkita
ktiit XXYY εννδγβα ++++++= ∑ ∑= =
−−1 1
)1()1(10)( (1)
where Y(it) is a measure of leverage (book leverage or market leverage), X represent the vector of explanatory variables, vi represents time-invariant unobservable firm-specific effects (e.g., management performance, reputation, capital intensity, growth opportunities), and vt represents time-specific effects (e.g., stagflation, interest rates, inflation rates, demand shocks) which are common to all firms and can change through time. á, (the constant), â1, ãs and äs are unknown parameters to be estimated. The time-varying disturbance term å it is assumed to be serially uncorrelated with mean zero and variance ó2. The vector of explanatory variables incorporates the following variables (k = 1,10).
1. Profitability ratio 2. Effective tax rate 3. Market-to-book ratio 4. Fixed assets ratio 5. Size of the firm 6. Liquidity ratio 7. Earnings volatility 8. Market equity premium 9. Term-structure of interest rates 10. Changes in share price
For the definition of these variables see section II.
8
Hsiao (1985) suggests that OLS estimation of equation (1) would result in biased coefficients because vi is not directly observable, and it is correlated with other regressors in the model (i.e., Cov(vi, Xkit) � 0). Since Yi(t-1) is correlated with vi, this would be another reason for the inconsistent estimation of coefficients. To overcome these problems, one could take the first differences thereby eliminating time-invariant fixed effects (vi). However, the OLS estimators are still inefficient because there is a correlation between ∆ε it (i.e. ε it-ε it-1) and ∆Yi(t-1) (i.e. Yi(t-1)-Yi(t-2)) due to the correlation between the terms εi(t-1) and Yi(t-1). OLS specification leads to another estimation problem as it assumes that all the explanatory variables are strictly exogenous. Yet, this is a naive presumption since the random events affecting the dependent variable likely to have influence on the explanatory variables as well. To overcome this, Anderson and Hsiao (1982) propose instrumental variables (IV) technique such that ∆Yi(t-2) or Yi(t-2) can be used as instruments for ∆Yi(t-1). It is valid because ∆Yi(t-2) or Yi(t-2) is correlated with ∆Yi(t-1) but not with ∆ε it. If ε it is not serially correlated per se the IV estimation results will be consistent. However, they might not be efficient estimators since IV technique does not use all the related moment conditions. As a solution to these problems Arellano and Bond (1991) suggest Generalised Methods of Moments (GMM). They argue that GMM deploys additional instruments obtained by utilising the orthogonality conditions that exists between the disturbances and the lagged values of the dependent variable. In general, one can find a GMM estimator of the true parameter by finding the element of the parameter space which sets linear combination of the sample cross products 'as close to zero as possible' (Hansen, 1982). Thus, the advantage of GMM stems from the fact that it optimally exploits all the linear moment restrictions specified by the model. It is argued that E(ε it,ε it-1) in (1) is not necessarily zero but is assumed that E(ε it,ε it-2) is zero as the consistency of GMM procedure is based on the absence of second-order correlation in differences and that of first-order correlation in levels. Assuming that the disturbances are not correlated, it is expected that ∆ε it
is orthogonal to the past history of the variables X and Y so that (Yit-2, Yit-3,… Xit-2, Xit-3,…) can be used as valid instruments for ∆ε it. If ε it follows a MA(1) process the first valid instruments start from the third lag not from the second since the differenced disturbances follow an MA(2) process. As a result, it is essential to make sure that there is no higher-order serial correlation to have a valid set of instruments independent from the residuals. This can be investigated by the Sargan test of over-identifying restrictions. This two-step GMM methodology can control for the correlation of errors overtime, heteroscedasticity across firms, simultaneity, and measurement errors due to the utilisation of orthogonality conditions on the variance-covariance matrix.5 Although the GMM specification of the first differences (hereafter GMM-DIF) is superior to many other methodologies, recent econometric studies document that this standard GMM-DIF estimator has the problem of weak instruments. Arellano and Bover (1995) argue that the absence of information concerning the parameters in the level-variables causes substantial loss of efficiency in models estimated in first-differences using instruments in levels. Hence, they propose to use instruments in first-differences for equations in levels and instruments in levels for equations in first-differences. Furthermore, Blundell and Bond (1998) document that the extended GMM (hereafter GMM-SYS) estimator of Arellano and Bover (1995) reveals dramatic efficiency gains in cases where the standard GMM-DIF estimator performs poorly (e.g. for short sample periods and persistent data). This is especially relevant when the coefficient of a lagged dependent variable approaches unity and when the ratio of variance(vi)/variance(åit) in equation (1) increases. Blundell and Bond (1998) further document that once lagged first-differenced and lagged levels instruments are included in the instrument set, one could reduce the finite sample 5 Two-step GMM estimators, which use one-step residuals to construct asymptotically optimal weighting matrix, are more efficient than one-step estimators if the disturbances are expected to show heteroscedasticity in the large sample data with a relatively long time span. See Arellano and Bond (1991), and Blundell and Bond (1998) for further discussion.

9
bias substantially by exploiting the additional moment conditions in this approach. Their results show that the instruments used by the GMM-DIF estimator contain little information about the endogenous variables in first-differences, and that lagged first-differences are informative instruments for the endogenous variables in levels. Under GMM-SYS technique, the model is estimated in both levels and first-differences (level-equations are simultaneously estimated using differenced lagged regressors as instruments). In this way, apart from controlling for individual heterogeneity, variations between firms could partially be retained. For the reasons explained above our examination of the determinants of corporate capital structure is based on the estimation of equation (1) using the GMM-SYS method6. Industry effects: It is known that some industries are characterised by high leverage (for instance, capital-intensive manufacturing firms, utilities) while others are known to have low leverage (for instance, hi-tech companies, mining companies). Ferri and Jones (1979) emphasise the statistical relationship between relative debt structure class and generic industry class. Similarly, Harris and Raviv (1991) account for the industry classification by commenting that ‘firms within an industry are more alike than those in different industries, and that industries tend to retain their leverage rankings over time’. Thus, the industry factor is likely to play an important role in determining the capital structure of a firm. To control for this we include industry dummies in the models where appropriate7. Target leverage ratio and speed of adjustment: The following procedure examines the existence of target leverage level in the framework of adjustment costs and the speed at which the firms adjust their leverage ratio towards the target level. Assume that desired target debt-ratio, *
itLeverage , is a function of k explanatory variables as in equation (1).
∑=
+=1
*
kitkitkit xLeverage ωψ (2)
where x is a vector of k explanatory variables, ùit is a serially correlated disturbance term with mean zero and possibly heteroscedastic and øk 's are estimable unknown parameters which are common for each firm. The model assumes that firms adjust their current debt-ratios, Leverageit, with the degree of adjustment coefficient "è" to attain the desired capital structure (equation 3).
)( 1
*1 −− −=− itititit LeverageLeverageLeverageLeverage θ (3)
If è =1 then the actual change in leverage will be equal to the desired change and firms will have a complete adjustment with zero transaction costs. If è = 0, however, there will not be any adjustment due to unaffordable high transaction costs (or the cost of adjustment is significantly higher than the cost of remaining off target) and firms will set their current debt-ratios to the past level, Leverageit-1. Substituting (2) into (3), we get equation (4):
tk
kitkitit xLeverageLeverage θωθψθ ++−= ∑=
−1
1)1( (4)
6 Moreover, we estimated equation (1) using OLS, Anderson-Hsiao type estimate method, GMM estimates in level and first difference. The diagnostic statistics suggest that these models are not efficient estimators on our data set as well. The estimates suffer from the problems as discussed above in the text. The results are available on request. 7 These effects can only be investigated through the models in levels, not in differences.

10
This adjustment model assumes that è lies between zero and unity due to the existence of transaction costs. If the cost of being in disequilibrium is higher (lower) than the cost of adjustment, è, which is inversely proportional to transaction costs, tends to unity (zero). The long-term relationship: The long-term relationship between the corporate leverage and its determinants may differ form short-term effect. A forewarning of this possibility will be revealed by the difference in the sign of the coefficient of the contemporaneous and lagged values of explanatory variables. We examine the long-run relationship by estimating equation (5).
The parameters used in the above model (â, ã and ä) are obtained using a dynamic estimation of equation (1). Furthermore it is not easy to establish exogeneity in financial and accounting data. Hence, the direction of causation between variables could be problematic because of endogeneity. If, for instance, there has been a change in the market value of a firm in this year compared to last year, the source of this change should be obtained from the last year’s financial decisions. Therefore, using the contemporaneous data for both leverage and the determinants may lead to spurious results. The parameters used in the above model (â, ã and ä) are obtained using a dynamic estimation of equation (1). For the reasons described in a previous section we expect profitability, and market-to-book ratio to be inversely related while effective tax rate, tangibility of assets (fixed asset ratio) and size of the firm are expected to be positively associated with corporate leverage. However, the differences in the financial environments and traditions of these countries may result in influence (or magnitude) of firm specific variables on their capital structure. The results are discussed in section IV.
IV. THE RESULTS Estimation of equation (1) using alternative methods (as discussed in the methodology section) suggest that the most appropriate methodology in testing dynamic capital structure is a two step system-GMM specification that combines the differenced equations with level equations. The validity of the method is confirmed by the diagnostics reported in Tables 8. 4.1 Determinants of Leverage: A Dynamic Analysis The estimates of equation (1) based on a general dynamic model and a general-to-specific approach are presented in Tables 3 and 4 respectively. The general-to-specific approach excludes the insignificant lagged explanatory variables from the estimation of the general
8 It is noteworthy that our panel data set for the UK does not suffer from small samples bias. In the cases of French and German data set the small-sample bias is corrected using the Windmeijer (2000) process.
)5(Pr11
Pr1
1111
11Pr
1
*
1
1010*
1
99*
1
88
*
1
77*
1
66*
1
55*
1
44
*
1
33*
1
22*
1
11*
ititit
itititit
itititit
iceShareinChangeStructureTermemiumEquityMarket
VolatilityEarningsLiquidityfirmtheofSizeAssestsFixed
ratioBooktoMarketrateTaxyofitabilitLeverage
−+
+−
−+
+
−+
+
−+
+
−+
+
−+
+
−+
+
−+
+
−+
+
−+
=
βδγ
βδγ
βδγ
βδγ
βδγ
βδγ
βδγ
βδγ
βδγ
βδγ

11
dynamic model. In the paragraphs below we discuss the role of firm specific and market related variables in determining the capital structure9. Profitability Results presented in Table 4 reveal a significant negative association between profitability and market leverage in France and the UK. This is consistent with the predictions of the POT that firms prefer internal resources to finance their investments before raising external debt capital and with the findings reported, among others, by De Jong and Veld (2001). This is based on the view that higher profitability increases internal resources and hence reduces the need for external finance. By implication these results reject the prediction of the Free Cash Flow Theory (Jensen, 1986) that implies a positive relation. Although the view that debt reduces the agency cost of free cash-flow cannot be challenged just on the basis of these estimates, they certainly suggest that the agency cost of free cash flow cannot outweigh the predictions of POT based on the implications of information asymmetries. Hovakimian et al. (2001) argue that firms with relatively high profitability are likely to have more valuable assets-in-place and thus have higher target debt-ratios. However, the results in this paper contradict this argument as profitability has significantly negative influence on leverage despite a significantly positive correlation between profitability and fixed-assets ratio. As anticipated on the ground of closely held share ownership, the largest negative coefficient of profitability is in France. This suggests that French firms, whose managers are said to have a strategic advantage over the information possessed by creditors, use a hierarchy of alternative financing strategies, due to severe information asymmetries in the line suggested by POT. These firms retain a relatively larger proportion of earnings and hence the need for external finance is reduced10. Alternatively, this could be due to the relatively weaker protection of investors and creditors in France (La Porta et al., 2000), implying difficulty in raising external capital and forcing firms to rely on internal equity. Although the profitability exerts inverse impact on the leverage ratio of British firms, the size of the coefficient is relatively smaller. This, as expected, implies that because of wider distribution of share ownership British firms are required to distribute more dividends which, in turn, reduces the importance of profitability in the financing mix. The larger coefficient in the case of France could be due to relatively lower variability in profitability (Table 2) than in Germany and the UK as firms with volatile earnings are reluctant to enter into a fixed interest commitment contracts. The insignificant effect of profitability in Germany is consistent with the conventional view that firms’ close relation with banks and concentrated ownership mitigate asymmetric information problems11, reducing their dependence on internal finance. Incidentally, the standard deviations of profitability of German and British firms are almost identical. The relationship between past profitability and leverage is positive and significant in the cases of France and the UK but it insignificant in the case of Germany (Tables 3, 4). Past profitability can be regarded as a proxy for higher future growth opportunities. Higher profitability shows better
9 In tables we report the estimates for both book leverage and market leverage. Following the argument that market leverage is more relevant than book leverage (see, for instance, Welch 2002) we discuss the results based on market leverage. We discuss the results of book leverage where appropriate. 10 The average payout ratios of French, German and British firms are 13.4%, 29.7% and 42.8% respectively. 11 As Edwards and Fischer (1994) discuss in processing loan application German banks obtain the firm’s accounts for the preceding three years and analyse the management characteristics, its prospects for profitability and liquidity. The conventional wisdom that the ‘close relationship between German banks and firms due to bank representation on supervisory boards increases firm profitability’, however, receives limited empirical support. On the other hand, Cable’s (1985) study on the role of banks in increasing German firms’ profitability shows that there are motivations for large firms’ shareholders to monitor management closely, thus, improve profitability. This deduction might stem from the greater degree of concentration of shareholdings in German firms than in the UK firms.

12
prospect of the firm and the managers plan to invest further. Increased investment requires more external financing. Moreover, with a background of higher profitability it is much easier for the firms to raise external capital. For the reasons described by Myers (1984) managers would prefer to raise debt capital before external equity. This, in turn, increases the leverage ratio resulting a positive relation between leverage and lagged profitability. Effective tax rate Contrary to the conventional wisdom, the estimated coefficients of the effective tax rate are either statistically insignificant or positive (the UK). As the coefficients are insignificant, it can be argued that debt financing related costs (e.g., agency and bankruptcy costs) are not different from the tax benefits of debt financing. The insignificance impact of the tax rate in France is not surprising as the French tax system is mainly designed to promote the retention of profits by reducing corporate taxes rates. Market-to-Book Ratio The results presented in Table 4 show that the relationship between market-to-book ratio (a proxy for growth opportunities) and market leverage is generally negative in all countries. The inverse relation between these two variables is consistent with our expectation and the findings reported by Johnson (1998) and Rajan and Zingales (1995). Higher market-to-book ratios arise from higher expected future cash flows. The inverse relation supports the view that the cost of financial distress of high growth firms is relatively high and agency cost of debt is considerable. Because of high cost of debt (lenders demand for higher rate of interest when the information asymmetry is higher) managers would be reluctant to raise debt capital causing a lower leverage ratio. Baker and Wurgler (2002) use the market-to-book ratio to measure the market timing opportunities realised by managers and report that firms are low (high)-levered because they raise funds when their market valuations are high (low). In this case, high market-to-book ratios may reduce managers’ motivation to issue debt and internal equity remains preferable to both managers and shareholders of high growth firms. As in the UK, the coefficient of the market-to-book ratio is also significantly negative in Germany. The opportunity for managers to pursue their own objectives at the expense of shareholders is very limited in Germany, since most German firms have large shareholders with strong incentives to monitor the management (Edwards and Fischer, 1994). This, in turn, suggests that agency costs of debt financing are reduced as the structure of share ownership induces the close monitoring of management in Germany. Thus, firms can benefit from low costs of debt and high debt capacity because of their long-term relationship with the creditors. This explains the relatively smaller (and weaker) negative coefficient of market-to-book ratio in Germany. The magnitudes of the coefficients are relatively larger in France and in the UK (market leverage) than in Germany. This suggests higher degree of information asymmetry in France and in the UK deterring the corporate managers to raise external debt capital as it would be expensive. Fixed assets ratio The relationship between leverage and contemporary fixed assets ratios is positive in Germany, negative in the UK and insignificant in France (Table 3). The positive relation is consistent with the evidence reported in the literature (see, for instance, Harris and Raviv, 1991). Firms with relatively high tangible assets face difficulties in shifting their investments to riskier projects as their debt is secured against these assets (Johnson, 1997). Therefore, tangible assets mitigate the agency costs of debt financing thereby raising optimal debt level since they can be regarded as collateral for debt. Johnson (1997) uses the fixed asset ratio as a proxy for project liquidation values. Since intangible assets are less valuable at liquidation, firms with relatively more intangible assets are less preferred by creditors. Thus, relatively high tangible assets imply high debt capacity. The importance of collateral for loans in Germany is caused partly by institutional factors; e.g., saving banks are generally subject to limits on the amounts of uncollateralised loans they may make. Similarly, traditionally banks look for sufficient collateral causing a positive relation between the fixed assets and leverage. Tangibility of assets does not seem to matter in

13
France as French bankruptcy laws strongly favour the rehabilitation of firms and hence reduce the need to recover the loan by selling tangible assets. The observed inverse relationship between contemporaneous measure of tangibility of assets and market-leverage in the UK (tables 3 & 4) is more likely to be spurious than real. However, its lagged value has a positive impact on leverage. This combined with a relatively lower leverage ratio implies that firms in the UK, in general, have not exhausted their borrowing ability and that lenders are not keen on collateral. This scenario is more important in a situation where the role of the bank loan is relatively small in corporate borrowings like in the UK. Size of the firm Results presented in tables 3 & 4 reveal that the size of the firm and leverage are positively related in all countries 12. This is consistent with the results reported, among others, by Bennett and Donnelly (1993) and Michaelas et al. (1999). Since larger firms are less exposed to bankruptcy risk, this positive relation implies that the cost of financial distress is one of main determinants of the leverage ratio. Moreover, as argued by Warner (1977) market value of a firm is inversely related to the ratio of direct cost of bankruptcy to firm value. This implies that large firms might not envisage considerable difficulties in raising external loan. Assuming that size is an inverse proxy for bankruptcy probability, these arguments may help explain the positive association between firm size and market-leverage. This argument is more relevant in Germany where the bankruptcy code is not conductive to reorganising firms, i.e., firms entering bankruptcy are usually liquidated and the liquidation process is costly and lengthy. Similarly, the coefficients are positive in the UK and in France, implying that the borrowing capacity of firm is significantly limited by their bankruptcy risk and that the optimal leverage ratio of the firms with lower bankruptcy risk is high. Liquidity Managers’ preference for internal liquidity is likely to be more important in a market-oriented economy than in a bank based economy. Consistent with our expectation the results (Table 4) indicate that the liquidity variable is found to be statistically significant (negative) only in the UK (market oriented) and insignificant in France and Germany (bank-oriented). These are the reflections of market traditions. In general, German firms have close links with their lenders (banks) and hence information asymmetry could be reduced to minimum which in turn reduces the need for internal liquidity. On the other hand, in the UK raising external capital is likely to be expensive. The inverse relation between these variables in the UK is consistent with the findings of Ozkan (2001). Therefore firms with high liquidity tend to avoid raising external loan capital. This reduces the leverage ratio of firms. Thus, the possible effect of liquidity is dependent on market conditions. Volatility in earnings Contrary to our expectations the volatility in earnings does not play any significant role in the capital structure decisions of the firms in any of the sample countries. Although, in the case of Germany, some evidence of a positive relationship appears under general approach to estimation, this effect disappears under specific approach to estimating suggesting that the observed positive (theoretically inconsistent) relation was spurious. Equity premium The results indicate that the influence of equity premiums on capital structure decisions is market dependent. In France managers seem to prefer to issue debt at the time of higher equity premium as suggested by the positive and significant coefficient. On the other hand, the debt-equity ratio in the UK declines significantly in response to increases in equity premium. This implies that
12 The results are based on firm size measured by total sales. Results based on total assets (an alternative measure of size) are of similar quality.
14
managers issue more equity when the equity premium is high. This is possible in a situation when the observed high equity premium is due to a bullish market and managers believe that even after offering the required discount on equity issued the amount raised is at least equivalent to the true value of the securities issued. Unlike in France and in the UK firms in Germany do not seem to consider the market equity premium while deciding their financing mix. Term-structure of interest rates Consistent with our expectation the results reveal an inverse relationship between the term-structures of interest rates and market-leverage in all sample countries. This confirms that at the time of high long-term interest rate firms are reluctant to raise debt capital and hence raise equity capital to meet their financing need. This seems to hold in all sample countries irrespective of their institutional arrangements and traditions. Share price performance Consistent with our expectation the results for all sample countries reveal that the market-leverage declines after an increase in share value (Table 3). The significant negative coefficient of six-month lag annual return indicates that managers issue equity after positive market performance. In a situation of information asymmetry, where managers are better informed than the market and they work for the benefit of existing shareholders, issuing equity signals that the shares are overvalued and hence a discount should be offered to attract new investors to invest on equity capital. However, if the current share prices are high then the realised value of the shares (even after the discount) is likely to be at least equivalent the true value of the equity, a condition conducive to equity issue. Furthermore, the significant effect of this variable on book-leverage confirms that the decrease in leverage is not only due to the relative increase in the market value of equity (the denominator in market-leverage) but also due to actual additions in the value of equity. Thus, our results confirm that managers issue equity when share prices are high. In summary, the results discussed above suggest that the leverage ratio is positively related to assets and to size of the firm while it is inversely related to the profitability of the firm and the market to book ratio. These findings are consistent with the results reported in the literature. The influence of the effective tax rate and liquidity largely remains insignificant. Among the market related variables share price performance and the term-structure of interest rates seem to have strong inverse effects on leverage while the effect of the equity risk premium is found to be country dependent. Although there are instances of differences in the level of significance the results are largely consistent across the sample countries. Any noticeable variation in the results (levels of significance as well as the size of the coefficients) can be attributed to differences in corporate governance, tax system, role of capital markets and investor protection in these countries. 4.2 Target Leverage and Speed of Adjustment Results presented in Tables 3 and 4 reveal significant and positive effect of one period lagged leverage (LDV) on the leverage of the firms in all sample countries. The coefficients are between zero and one suggesting the estimates are stable and that leverage converges to its desired level over time. Hence, these results validate the inclusion of LDV in the model and imply the existence of dynamism in capital structure decision i.e. firms adjust their leverage ratios in order to achieve their target capital structure13. The estimate of the coefficient of LDV in the equation of Book Leverage is almost equal for all sample countries. However, in the case of market leverage the speed of adjustment is fastest among French firms with adjustment coefficient of 0.3664 (è = 1 -
13 In their survey of 392 US firms, Graham and Harvey (2001) find that 44% of the firms in their sample have strict or somewhat strict target debt ratios and 64% of investment-grade firms have somewhat strict optimal capital structure implied by static trade-off theory.
15
0.6336). This is consistent with the view that time dimension constructs a very important variable explaining the evolution of firms' debt ratios in France (Kremp et al., 1999). The estimates show that the adjustment process is relatively slow in Germany. It is possible that in Germany the cost of being off target is relatively low relative to the cost of adjusting its debt ratio. The fact that German firms have close ties with their banks and depend more on them for external finance, it is feasible to adjust slowly towards their target level without incurring much agency cost. The close association with the lenders (limited number of parties to deal with) allows the firms to explain the adjustment programme more easily than to signal through a costly and credible mechanism to a large number of investing public. The UK case lies closer to the speed of adjustment in France than in Germany. Overall, the results reveal the presence of dynamism in the capital structure decision of the European firms and they tend to trade-off between cost of speedy adjustment and cost of delay in achieving the target level. 4.3 The Static Long-run Relationship Table 5 shows the static long-run relationship between leverage and firm-specific factors based on specific dynamic estimation of equation (1). The GMM estimates for the long-run model are obtained using equation (5). In most cases the results confirm the findings of short-run dynamic capital structure discussed above. The long-run relation between the profitability of a firm and Market-leverage of the company is found to be significantly negative in France and the UK. This provides support for the predictions of the POT that managers prefer internal resources (equity) relative to external debt. Since the profitable firms are able to generate such resources, this strategy is feasible for them. The effect of tax rate on leverage remains insignificant except in the UK, where firms borrow more when the effective tax rate is high. The long-run effect of market-to-book ratio on market leverage is significant and negative in all countries. This reinforces the view that the agency costs of high growth firms are likely to be relatively higher and hence the managers are reluctant to borrow more. Moreover, in the long-run high growth is likely to generate higher cash flow and the firms may have sufficient internal resources reducing the need of external capital (debt) to finance further investment opportunities. Similarly, as in the short-run, the relationship between the fixed assets ratio and leverage is positive and significant in France and Germany. The positive relationship signifies that creditors in these countries prefer collateral while making loans available to the companies. In other words, in these countries the proportion of fixed assets plays an important role in determining the borrowing capacity of the companies. In the market oriented UK system information on credit-worthiness of the borrowing firms is more easily accessible, which in turn allows investors to make a fully informed decision. Borrowing from the market rather than from the banks diminishes the need for collateral. Therefore, the borrowing ability of UK companies could remain independent of tangibility of assets to a large extent. Moreover, the UK companies are relatively less geared than their French and German counterparts and hence creditors feel more secure in providing credit to British firms irrespective of their fixed assets ratio. (The observed inverse relationship between market leverage and tangibility of assets could be spurious). In Germany, given the close ties between the lenders and the firms little information asymmetry between the firm managers and creditors is expected. This should reduce the need for collateral and hence lower influence of the proportion of fixed assets is expected. On the other hand, firms in Germany depend on bank credit and traditionally banks require collateral for granting loans. Therefore, the proportion of fixed assets plays a significant role in determining the borrowing capacity of the companies. The long-run effect of the size of the firm on gearing level is sensitive to the definition of leverage. The market leverage in all three countries is significantly positively affected by the size of the firm while book leverage remains independent of size in France and Germany. The positive association between these variables is consistent with the results reported in the literature and is justifiable on the ground that larger firms are less exposed to bankruptcy risk and hence have higher borrowing capacity. Although an inverse relation between liquidity and leverage is observed in all countries, their significance seems to be model (general vs. specific) dependent. Contrary to our expectation the volatility in earnings does not
16
exert any effect on leverage. Among the market related variables, term-structure of interest rates and prior change in share price inversely affect the leverage of the firms in all three countries. However, German firms do not seem to consider equity premiums in determining their financing mix. Thus, in general, in the long-run the leverage ratio of a company seems to be positively related to the size of the firm and the proportion of fixed assets while it is inversely related to profitability, market-to-book ratio and three market related variables (equity premium, term-structure of interest rates, prior change in share price). However, there are some country specific differences in the relation between company leverage and explanatory variables that could be explained by the financial structure and institutional traditions of these countries. The Static Models Traditionally, studies on the determinants of corporate capital structures analyse static models by regressing a measure of leverage on a selection of explanatory variables, without their lags. In this section we estimate and discuss a similar model. Equation (1) is estimated without lagged terms and the results are presented in Table 6. In general, the results of static model confirm the results of long-run analysis (Table 5). In addition, it emerges that the corresponding coefficients of determination and Wald Test-1 statistics of the dynamic models are much higher than that of static models in every case. This shows the success and explanatory power of dynamic models relative to static models. More importantly, these findings support the appropriateness of dynamic models in capital structure studies. 4.4 Firm Size and the Determinants of leverage14 In previous paragraphs we saw the pivotal role of the size of the firm in determining its capital structure. To acquire better insight into its role we compose three size based portfolios and estimate equation (1) using the system-GMM method. Furthermore, size classification is instrumental in reducing the heterogeneity bias and thus to improve the precision of the estimates. Since the GMM estimates are known to be valid for large samples we correct for small sample bias in the estimation of the model for each size group. Correlation and Sargan tests confirm that all size portfolio based models are correctly specified. In France, profitability is inversely related to the leverage of medium and large firms only. Tangibility of assets, liquidity, and earnings volatility affect the market-leverage of medium size firms only. Among the market related factors, changes in share price inversely affects the leverage of all size groups of firms, but the effect of equity premium is limited to smaller firms and the term-structure of interest rates effects the market-leverage of medium and large firms. The impact of market-to-book ratio seems to be firm size as well as leverage definition dependent. The market-to-book ratio of small and large firms is found to be inversely related to the market leverage. However, book leverage of medium sized firms is found to be positively associated with market-to-book ratio. Finally, the invariance of leverage with effective corporate tax rate stands for all size classes. This may stem from the fact that French tax system favours the retention of profits with lowering tax rates gradually. The estimates reveal that different size classes show generally an uniform behaviour of German firms with respect to sign of the coefficients. The market leverage ratios of all size groups remain independent of profitability, effective tax rate, earnings volatility and equity premium. The changes in share price exert a significant inverse impact on the leverage of all size groups firms. Furthermore, the inverse relationship between market-to-book ratio and leverage is significant only for small firms whose average market-to-book ratio is highest among the size class. This finding may emphasise the existence of suboptimal investment decisions for such firms. Finally,
14 In the interest of space tables are not included here, but are available on request.

17
the relationship between fixed-assets ratio and leverage is positive and significant in the cases of small and medium firms. In the UK, market leverage of the firms in all size classes is affected inversely by market to book ratio, liquidity, equity premium, term-structure of interest rates and prior changes in share price. Consistent with the prediction of the POT profitability of the firm is significantly inversely related to leverage in the cases of medium firms. This finding implies that the problem of asymmetric information is more prominent in medium firms in the UK. On the other hand, earnings volatility does not affect the leverage of any firm while effective tax rates affect large firms and tangible assets affect medium and large firms only. The estimates reveal that large British and medium and large French firms tend to adjust their leverage towards their target ratios more quickly than smaller firms. This suggests that the relative cost of deviating from target level is higher for larger firms. It is also possible that given their size they are likely to have easier access to capital markets and hence can reorganise their financing source more easily. On the other hand, in Germany smaller firms adjust their capital structure more quickly. Unlike in the UK, in Germany firms borrow more from banks and the information asymmetry is lower. Because of close ties with the lenders, the cost of readjustment, even for smaller firms, is likely to be lower. However, it is noteworthy that in general German firms are slower than French and British firms in adjusting their capital structure. In summary, the above analysis suggests that within a given country the factors responsible for the leverage ratio of firms are sensitive to the firm size. Therefore, while setting the target leverage financial managers consider, among other factors, the size of their company and the institutional and financial environment in which they operate. 4.5 Industry Group and the Determinants of leverage15 Manufacturing and Service sector companies have some differences with respect to their asset structure and the degree of vulnerability to the changes in financial markets. Hovakimian et al. (2001) argue that firms' assets-in-place should be financed more by debt and growth opportunities more by equity, where the former is relevant to manufacturing firms. Our preliminary data analysis reveals that, in all countries, service industries have relatively lower debt ratios, higher market-to-book and fixed-assets ratios, and higher variability in profitability. To examine whether the determinants of the capital structure vary between manufacturing and service sectors we split the sample into two groups and estimate equation (1) for all three-sample countries using a two step system-GMM procedure. Among the French industries the inverse relationship between profitability and leverage is apparent in both sectors but is significant only in manufacturing sector. The results indicate that the effective tax rate does not affect the leverage ratio significantly. The presence of a significant negative relationship between market-to-book ratio and market leverage of manufacturing firms contradicts the view that there are difficulties in risk-shifting of firms with a higher tangible asset base. This view is also confirmed in the cases of service industries. Thus, the results imply that cost of financial distress increases with an increase in the market-to-book ratio irrespective of the nature of business in France. On the other hand, the relationship between leverage and fixed-assets ratio is significantly positive for both types of firms but is significant in the case of service firms only. The size of the firm and leverage are positively related in both industries. Considering the size variable as an inverse proxy for bankruptcy probability, these findings emphasise the influence of French insolvency code in which firms' reorganisation is favoured. Among the market related factors, term-structure of interest rates and prior changes in share prices are inversely
15 In the interest of space tables are not included here, but are available on request.
18
related to the leverage ratio of both manufacturing and service industries however the significant positive effect of equity premium is limited to the case of the manufacturing industry only. In Germany the market leverage ratio of manufacturing as well service sector firms seems to remain independent of their profitability, the effective tax rate, the market-to-book ratio, fixed assets, liquidity, variability in earnings and the term structure of interest rates. However, prior changes in share price exert significant negative impact on the leverage ratios of service as well as manufacturing companies. On the other hand, possibly due to strong liquidation process inherent in the German insolvency code, firm size and fixed assets have significant positive effects on the leverage of the manufacturing firms. In the UK the leverage ratios of manufacturing as well as service sector firms are significantly inversely affected by their profitability, market to book ratio, equity premium, term-structure of interest rates and prior changes in share prices. The negative sign associated with the coefficient of the profitability of the firm provides support to the predictions of the POT. The significantly negative effect of market-to-book ratio on leverage implies the importance of agency problems and financial distress costs in both types of firms. However, the size of the coefficient is slightly higher in the cases of service sector industries. Similar to the cases of German firms the effect of the effective tax rate remains insignificant in both industries. Although the effect of fixed-assets ratio on leverage generally remains insignificant the market leverage of service sector firms seem to be inversely affected. This inverse relation remains a puzzle. On the other hand, firm size has direct influence upon debt ratios for firms in both sectors supporting the importance of bankruptcy costs in the UK. Results further show that there is no clear pattern in the speed of leverage adjustment across the industry groups in France and Germany. It is sensitive to the definition of leverage used. However, in the UK manufacturing firms tend to adjust more rapidly than service sector firms. In conclusion, we find several important differences in financing patterns of manufacturing and service companies across countries. However, profitability, fixed-assets ratio and size variables tend to have similar effects on leverage across industries in these countries. One can say that the findings based on industry classification generally support the results from the full sample i.e. the role of firm specific characteristics as well as market related factors in determining the capital structure of a firm depends on the environment in which it operates.
V. CONCLUSION Using panel data, this paper identifies factors responsible for differences in the capital structure of the firms in France, Germany and the UK. As expected, the effects of possible determinants of capital structure are found to be country-specific. The results suggest that firms adjust their leverage ratios to achieve their target capital structure. The process of adjustment is quickest in France. This study identifies several factors responsible for corporate leverage in the sample countries. First, a significant positive impact of firm size and significant negative impact of term-structure of interest rates and prior changes in share price on leverage is found in all countries. The positive impact of firm size on leverage is consistent with the view that it is an inverse proxy of bankruptcy. The inverse relation between term-structure and leverage confirms that the firms are reluctant to raise debt capital while the long term-rate of interest is high. Similarly, the negative effect of prior share price change in leverage suggests that the firms issue equity after share price increase. Second, an inverse relation between profitability and leverage is found in France and the UK. This supports the proposition of POT in these two countries. Third, market-to-book ratio and leverage are inversely associated in France and the UK confirming the view that less debt is used to mitigate under investment problems in growing firms. Fourth, the relationship between fixed-assets ratio and leverage is found to be mixed, significant and positive in Germany, insignificant in France and negative in the UK. This suggests that the tangibility of assets is more important in banks borrowings (Germany). The inverse relation in the UK remains

19
a puzzle. Finally, liquidity and volatility is earnings do not seem have any significant effect on corporate leverage. Furthermore, we find some additional country-specific differences in the financing behaviour of firms based on their size groups. In France, support for the predictions of the POT as indicated by an inverse relation between profitability and leverage is found in firms of all size classes. On the other hand, neither size groups’ leverage was responsive to profitability in Germany while it was mixed in the UK. Unlike the cases in France and Germany, leverage of firms of all size groups in the UK is significantly related (inverse) to book to market ratio and all market related variables (term-structure of interest rates, equity premium and prior changes in share prices). This finding confirms view that the corporate sector in the UK market-oriented. The effects of all other variables are found to be sensitive to the size group and the country’s traditions. Similar to the cases of size-based analysis the effects of country specific and market related variable are found to be country specific and type of industry specific. In general, the UK firms, irrespective of their industry category, seem to consider a large number of factors, especially the market related factors, while deciding their capital structure relative to firms in France and Germany. In summary, profitability, size of the firm, book-to-market ratio, tangibility of assets, term-structure of interest rates and prior changes in share price etc. seem to play pivotal role in determining the capital structure of a firm. However, the strength and the nature of the effect of these factors are dependent on the financial environment and tradition of the country. Moreover, country specific factors do play important roles on how quickly the firms need to (and can) adjust their debt-equity position to achieve their desired leverage level. Therefore, the capital structure decision of a firm is not only the product of its own characteristics but also the result of environment and tradition in which it operates.

20
REFERENCES Anderson, T. W. and Hsiao, C. (1982), Formulation and estimation of dynamic models using panel data, Journal of Econometrics 18, 47-82. Arellano, M. and Bond, S. (1991), Some tests of specification for panel data, Review of Economic Studies 58, 277-297. Arellano, M. and Bover, O. (1995), Another look at the instrumental variable estimation of error-components models, Journal of Econometrics 68, 29-51. Baker, M. and Wurgler, J. (2002), Market timing and capital structure, Journal of Finance 57, forthcoming. Banerjee, S., Heshmati, A. and Wihlborg, C. (2000), The dynamics of capital structure, Working Paper #333, Stockholm School of Economics. Bårdsen, G. (1989), Estimation of long-run coefficients in error correction models, Oxford Bulletin of Economics and Statistics 51, 345-350. Bennett, M. and Donnelly, R. (1993), The determinants of capital structure: Some UK evidence, British Accounting Review 25, 43-59. Berens, L.J. and Cuny, C.J. (1995), The capital structure puzzle revisited, Review of Financial Studies 8,1185-1208. Blundell, R.W. and Bond, S.R. (1998), Initial conditions and moment restrictions in dynamic panel data models, Journal of Econometrics 87, 115-143. Blundell, R.W., Bond, S.R. and Windmeijer, F. (2000), Estimation in dynamic panel data models: improving on the performance of the standard GMM estimators", IFS Working Paper W00/12. Booth, L., Aivazian, V., Demirgüç-Kunt, A. and Maksimovic, V. (2001), Capital structure in developing countries, Journal of Finance 56, 87-130. Borio, C. E. V. (1996), Credit characteristics and the monetary policy transmission in fourteen industrial countries: Facts, conjectures and some econometric evidence, in: Alders, K., Koedijk, K., Kool, C and Winder, C., eds., Monetary policy in a converging Europe, Kluwer Academic Publishers, Financial and Monetary Studies 31, 77-115. Bradley, M., Jarrel, G.A. and Kim, E.H. (1984), On the existence of an optimal capital structure: Theory and evidence, Journal of Finance.39, 857-877. Cable, J.R. (1985), Capital market information and industrial performance: The role of West German banks, Economic Journal 95, 118-132. De Jong, A. and Veld, C. (2001), An empirical analysis of incremental capital structure decisions under managerial entrenchment, Journal of Banking and Finance 25, 1857-1895. DeAngelo, H. and Masulis, R.W. (1980), Optimal capital structure under corporate and personal taxation, Journal of Financial Economics l8, 3-29. Devereux, M. and Schiantarelli, F. (1990), Investment, financial factors and cash flow: Evidence from UK panel data, in: R.G. Hubbard, eds., Asymmetric information, corporate finance and investment, Chicago, University of Chicago Press, 279-306.

21
Edwards, J. and Fischer, K. (1994), Banks, finance and investment in Germany, Centre for economic policy research, Cambridge University Press. Edwards, J. and Nibler, M. (2000), Corporate governance in Germany: the role of banks and ownership concentration, Economic Policy 31, 239-267. Fama, E.F. (1985), What is different about banks?, Journal of Monetary Economics 15, 29-37. Ferri, M.G. and Jones, W.H. (1979), Determinants of financial structure: A new methodological approach, Journal of Finance 34, 631-644. Fischer, E.O., Heinkel, R. and Zechner, J. (1989), Dynamic capital structure choice: theory and tests, Journal of Finance 44, 19-40. Graham, J.R. and Harvey, C.R. (2001), The theory and practice of corporate finance: evidence from the field, Journal of Financial Economics 60, 187-243. Hansen, L.P. (1982), Large sample properties of generalised methods of moments estimators, Econometrica 50, 1029-1054. Harris, M. and Raviv, A. (1990), Capital structure and the informational role of debt, Journal of Finance 45, 321-349. Harris, M. and Raviv, A. (1991), The theory of capital structure, Journal of Finance 46, 297-355. Haugen, R.A. and Senbet, L.W. (1986), Corporate finance and taxes: A review, Financial Management 15, 5-22. Hovakimian, A., Opler, T. and Titman, S. (2001), The debt-equity choice", Journal of Financial and Quantitative Analysis 36, 1-24. Hsiao, C. (1985), Benefits and limitations of panel data, Econometric Reviews 4, 121-174. Jalilvand, A. and Harris, R.S. (1984), Corporate behaviour in adjusting to capital structure and dividend targets: An econometric study, Journal of Finance 39, 127-145. Jensen, M. (1986), Agency costs of free cash flows, corporate finance and takeovers, American Economic Review 76,323-339. Jensen, M.C. and Meckling, W.H. (1976), Theory of the firm: Managerial behaviour, agency costs and ownership structure, Journal of Financial Economics 3, 305-360. Johnson, A. S. (1997), An empirical analysis of the determinants of corporate debt ownership structure, Journal of Financial and Quantitative Analysis 32, 47-69. Johnson, A. S. (1998), The effect of bank debt on optimal capital structure, Financial Management 27, 47-57. Jordan, J., Lowe, J., and Taylor, P. (1998), Strategy and financial policy in UK small firms, Journal of Business Finance and Accounting 25, 1-27. Kester, C. W. (1986), Capital and ownership structure: A comparison of United States and Japanese manufacturing corporations, Financial Management 15, 5-16.

22
Kim, E.H. (1978), A mean-variance theory of optimal capital structure and corporate debt capacity, Journal of Finance 33, 45-63. Kim, W. S. and Sorensen, E.H. (1986), Evidence on the impact of the agency costs of debt in corporate debt policy, Journal of Financial and Quantitative Analysis 21, 131-144. Kraus, A. and Litzenberger, R.H. (1973), A state-preference model of optimal financial leverage, Journal of Finance 28, 911-922. Kremp, E., Stöss, E. and Gerdesmeier, D. (1999), Estimation of a debt function: Evidence from French and German firm panel data, in: Sauvé, A and Scheuer, M. eds., Corporate finance in Germany and France, A joint research of the Deutsche Bundesbank and the Banque de France, 139-194. La Porta, R., Lopez-de-Silanes, F., Shleifer, A., Vishny, R.W. (2000), Investor protection and corporate governance, Journal of Financial Economics 58, 3-27. Marsh, P. (1982), The choice between equity and debt: An empirical study, Journal of Finance 37,121-144. McClure, K. G., Clayton, R., and Hofler, R. A. (1999), International capital structure differences among the G7 Nations: A current empirical view, European Journal of Finance 5, 141-164. Michaelas, N., Chittenden, F., and Poutziouris, P. (1999), Financial policy and capital structure choice in U.K. SMEs: Empirical evidence from company panel data, Small Business Economics 12, 113-130. Miller, M.H. (1977), Debt and taxes, Journal of Finance 32, 261-274. Moerland, P. W. (1995), Alternative disciplinary mechanisms in different corporate systems, Journal of Economic Behaviour and Organisation 26, 17-34. Myers, S.C. (1977), Determinants of corporate borrowing, Journal of Financial Economics 5, 147-175. Myers, S.C. (1984), The capital structure puzzle, Journal of Finance 39, 575-592. Nestor, S. and Thompson, J.K. (2000), Corporate governance patterns in OECD Economies: Is convergence under way?, OECD Publications. Ozkan, A. (2001), Determinants of capital structure and adjustment to long run target: Evidence from UK company panel data, Journal of Business Finance and Accounting 28, 175-198. Rajan, R.G. and Zingales, L. (1995), What do we know about capital structure? Some evidence from international data, Journal of Finance 50, 1421-1460. Stulz, R. and Johnson, H. (1985), An analysis of secured debt, Journal of Financial Economics 14, 501-521. Titman, S. and Wessels, R. (1988), The determinants of capital structure choice, Journal of Finance 43, 1-19. Trezevant, R. (1992), Debt financing and tax status: Tests of substitution effect and the tax exhaustion hypothesis using firms responses to the economic recovery tax act of 1981, Journal of Finance 47, 1557-1568.

23
Wald, J.K. (1999), How firm characteristics affect capital structure: An international comparison, Journal of Financial Research 22, 161-187. Warner, J.B. (1977), Bankruptcy costs: Some evidence, Journal of Finance 32, 337-347. Windmeijer, F. (2000), A finite sample correction for the variance of linear two-step GMM estimators, Working Paper W00/19, Institute for Fiscal Studies, London
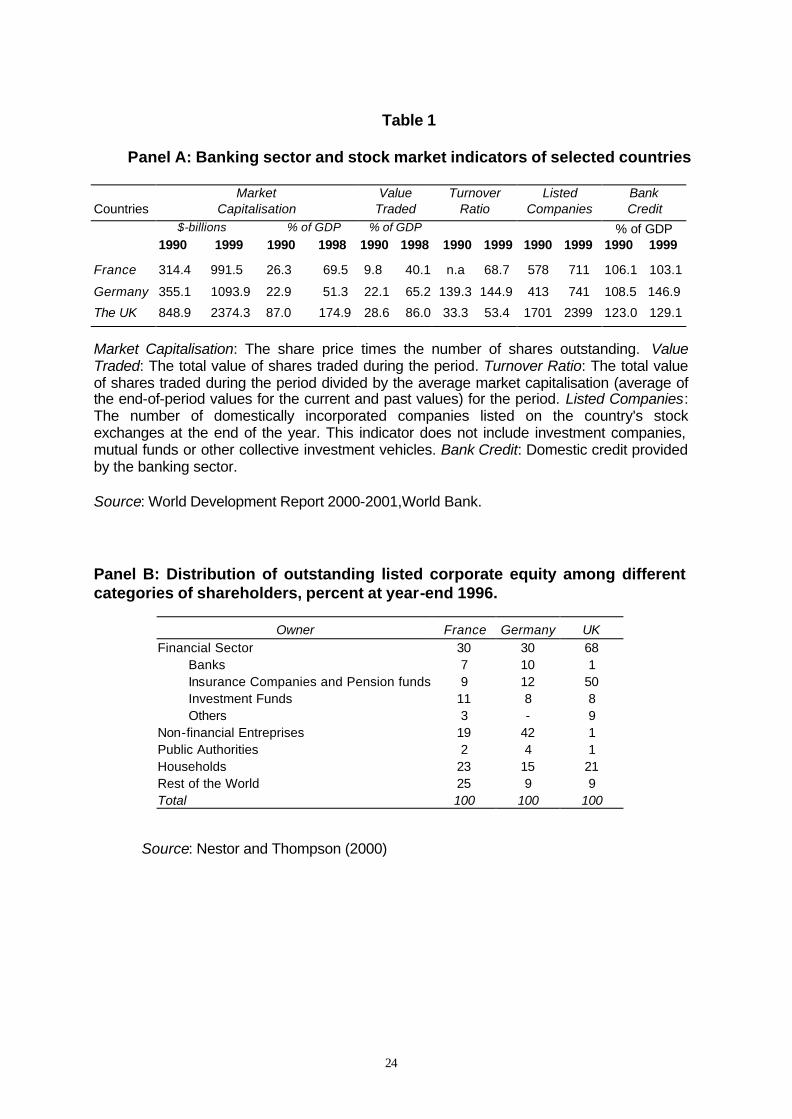
24
Table 1
Panel A: Banking sector and stock market indicators of selected countries
Countries
Market Capitalisation
Value Traded
Turnover Ratio
Listed Companies
Bank Credit
$-billions % of GDP % of GDP % of GDP 1990 1999 1990 1998 1990 1998 1990 1999 1990 1999 1990 1999
France 314.4 991.5 26.3 69.5 9.8 40.1 n.a 68.7 578 711 106.1 103.1
Germany 355.1 1093.9 22.9 51.3 22.1 65.2 139.3 144.9 413 741 108.5 146.9
The UK 848.9 2374.3 87.0 174.9 28.6 86.0 33.3 53.4 1701 2399 123.0 129.1
Market Capitalisation: The share price times the number of shares outstanding. Value Traded: The total value of shares traded during the period. Turnover Ratio: The total value of shares traded during the period divided by the average market capitalisation (average of the end-of-period values for the current and past values) for the period. Listed Companies: The number of domestically incorporated companies listed on the country's stock exchanges at the end of the year. This indicator does not include investment companies, mutual funds or other collective investment vehicles. Bank Credit: Domestic credit provided by the banking sector. Source: World Development Report 2000-2001,World Bank. Panel B: Distribution of outstanding listed corporate equity among different categories of shareholders, percent at year-end 1996.
Owner France Germany UK Financial Sector 30 30 68 Banks 7 10 1 Insurance Companies and Pension funds 9 12 50 Investment Funds 11 8 8 Others 3 - 9 Non-financial Entreprises 19 42 1 Public Authorities 2 4 1 Households 23 15 21 Rest of the World 25 9 9 Total 100 100 100
Source: Nestor and Thompson (2000)
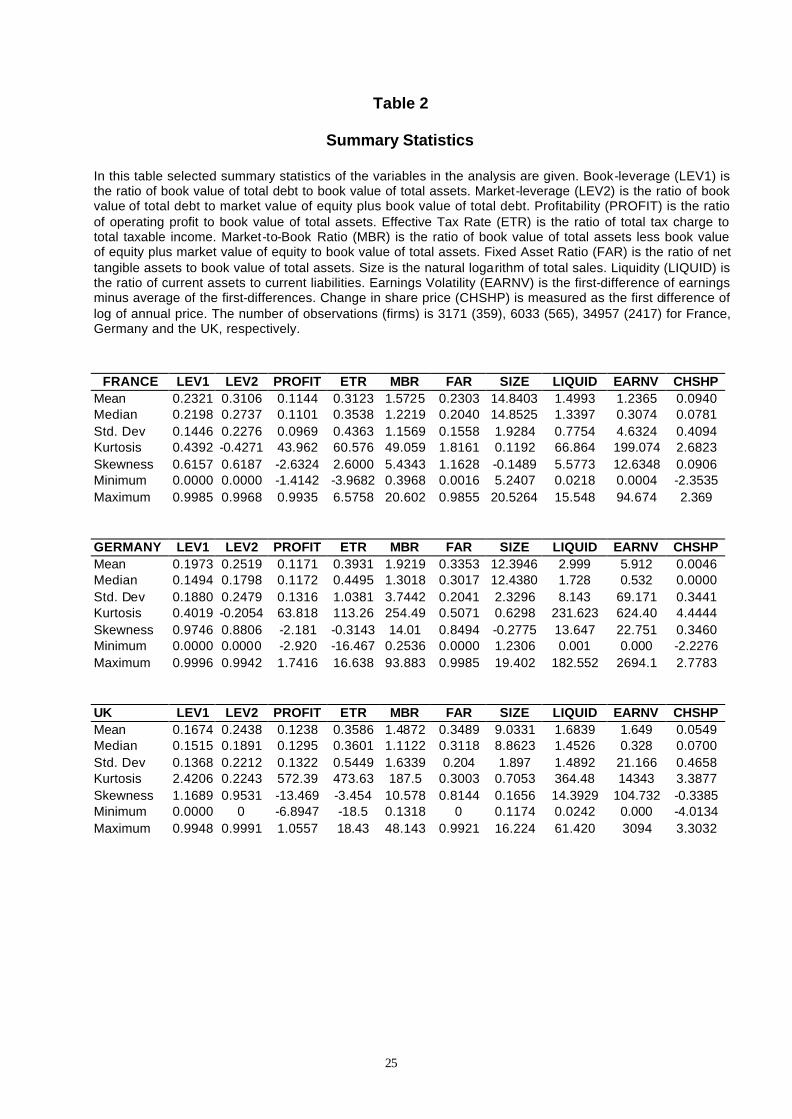
25
Table 2
Summary Statistics In this table selected summary statistics of the variables in the analysis are given. Book-leverage (LEV1) is the ratio of book value of total debt to book value of total assets. Market-leverage (LEV2) is the ratio of book value of total debt to market value of equity plus book value of total debt. Profitability (PROFIT) is the ratio of operating profit to book value of total assets. Effective Tax Rate (ETR) is the ratio of total tax charge to total taxable income. Market-to-Book Ratio (MBR) is the ratio of book value of total assets less book value of equity plus market value of equity to book value of total assets. Fixed Asset Ratio (FAR) is the ratio of net tangible assets to book value of total assets. Size is the natural logarithm of total sales. Liquidity (LIQUID) is the ratio of current assets to current liabilities. Earnings Volatility (EARNV) is the first-difference of earnings minus average of the first-differences. Change in share price (CHSHP) is measured as the first difference of log of annual price. The number of observations (firms) is 3171 (359), 6033 (565), 34957 (2417) for France, Germany and the UK, respectively.
FRANCE LEV1 LEV2 PROFIT ETR MBR FAR SIZE LIQUID EARNV CHSHP
Mean 0.2321 0.3106 0.1144 0.3123 1.5725 0.2303 14.8403 1.4993 1.2365 0.0940 Median 0.2198 0.2737 0.1101 0.3538 1.2219 0.2040 14.8525 1.3397 0.3074 0.0781 Std. Dev 0.1446 0.2276 0.0969 0.4363 1.1569 0.1558 1.9284 0.7754 4.6324 0.4094 Kurtosis 0.4392 -0.4271 43.962 60.576 49.059 1.8161 0.1192 66.864 199.074 2.6823 Skewness 0.6157 0.6187 -2.6324 2.6000 5.4343 1.1628 -0.1489 5.5773 12.6348 0.0906 Minimum 0.0000 0.0000 -1.4142 -3.9682 0.3968 0.0016 5.2407 0.0218 0.0004 -2.3535 Maximum 0.9985 0.9968 0.9935 6.5758 20.602 0.9855 20.5264 15.548 94.674 2.369 GERMANY LEV1 LEV2 PROFIT ETR MBR FAR SIZE LIQUID EARNV CHSHP Mean 0.1973 0.2519 0.1171 0.3931 1.9219 0.3353 12.3946 2.999 5.912 0.0046 Median 0.1494 0.1798 0.1172 0.4495 1.3018 0.3017 12.4380 1.728 0.532 0.0000 Std. Dev 0.1880 0.2479 0.1316 1.0381 3.7442 0.2041 2.3296 8.143 69.171 0.3441 Kurtosis 0.4019 -0.2054 63.818 113.26 254.49 0.5071 0.6298 231.623 624.40 4.4444 Skewness 0.9746 0.8806 -2.181 -0.3143 14.01 0.8494 -0.2775 13.647 22.751 0.3460 Minimum 0.0000 0.0000 -2.920 -16.467 0.2536 0.0000 1.2306 0.001 0.000 -2.2276 Maximum 0.9996 0.9942 1.7416 16.638 93.883 0.9985 19.402 182.552 2694.1 2.7783 UK LEV1 LEV2 PROFIT ETR MBR FAR SIZE LIQUID EARNV CHSHP Mean 0.1674 0.2438 0.1238 0.3586 1.4872 0.3489 9.0331 1.6839 1.649 0.0549 Median 0.1515 0.1891 0.1295 0.3601 1.1122 0.3118 8.8623 1.4526 0.328 0.0700 Std. Dev 0.1368 0.2212 0.1322 0.5449 1.6339 0.204 1.897 1.4892 21.166 0.4658 Kurtosis 2.4206 0.2243 572.39 473.63 187.5 0.3003 0.7053 364.48 14343 3.3877 Skewness 1.1689 0.9531 -13.469 -3.454 10.578 0.8144 0.1656 14.3929 104.732 -0.3385 Minimum 0.0000 0 -6.8947 -18.5 0.1318 0 0.1174 0.0242 0.000 -4.0134 Maximum 0.9948 0.9991 1.0557 18.43 48.143 0.9921 16.224 61.420 3094 3.3032
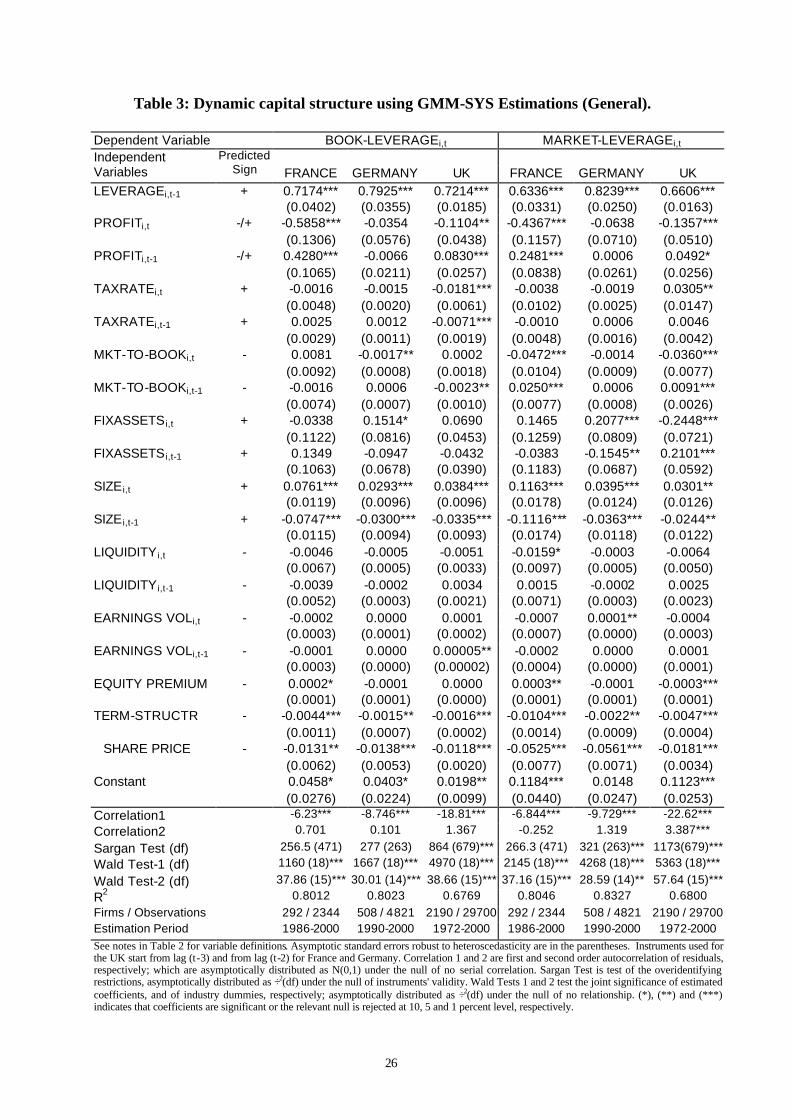
26
Table 3: Dynamic capital structure using GMM-SYS Estimations (General).
Dependent Variable BOOK-LEVERAGEi,t MARKET-LEVERAGEi,t Independent
Variables Predicted
Sign FRANCE GERMANY UK FRANCE GERMANY UK LEVERAGEi,t-1 + 0.7174*** 0.7925*** 0.7214*** 0.6336*** 0.8239*** 0.6606***
(0.0402) (0.0355) (0.0185) (0.0331) (0.0250) (0.0163) PROFITi,t -/+ -0.5858*** -0.0354 -0.1104** -0.4367*** -0.0638 -0.1357***
(0.1306) (0.0576) (0.0438) (0.1157) (0.0710) (0.0510) PROFITi,t-1 -/+ 0.4280*** -0.0066 0.0830*** 0.2481*** 0.0006 0.0492*
(0.1065) (0.0211) (0.0257) (0.0838) (0.0261) (0.0256) TAXRATEi,t + -0.0016 -0.0015 -0.0181*** -0.0038 -0.0019 0.0305**
(0.0048) (0.0020) (0.0061) (0.0102) (0.0025) (0.0147) TAXRATEi,t-1 + 0.0025 0.0012 -0.0071*** -0.0010 0.0006 0.0046
(0.0029) (0.0011) (0.0019) (0.0048) (0.0016) (0.0042) MKT-TO-BOOKi,t - 0.0081 -0.0017** 0.0002 -0.0472*** -0.0014 -0.0360***
(0.0092) (0.0008) (0.0018) (0.0104) (0.0009) (0.0077) MKT-TO-BOOKi,t-1 - -0.0016 0.0006 -0.0023** 0.0250*** 0.0006 0.0091***
(0.0074) (0.0007) (0.0010) (0.0077) (0.0008) (0.0026) FIXASSETS i,t + -0.0338 0.1514* 0.0690 0.1465 0.2077*** -0.2448***
(0.1122) (0.0816) (0.0453) (0.1259) (0.0809) (0.0721) FIXASSETS i,t-1 + 0.1349 -0.0947 -0.0432 -0.0383 -0.1545** 0.2101***
(0.1063) (0.0678) (0.0390) (0.1183) (0.0687) (0.0592) SIZE i,t + 0.0761*** 0.0293*** 0.0384*** 0.1163*** 0.0395*** 0.0301**
(0.0119) (0.0096) (0.0096) (0.0178) (0.0124) (0.0126) SIZE i,t-1 + -0.0747*** -0.0300*** -0.0335*** -0.1116*** -0.0363*** -0.0244**
(0.0115) (0.0094) (0.0093) (0.0174) (0.0118) (0.0122) LIQUIDITY i,t - -0.0046 -0.0005 -0.0051 -0.0159* -0.0003 -0.0064
(0.0067) (0.0005) (0.0033) (0.0097) (0.0005) (0.0050) LIQUIDITY i,t-1 - -0.0039 -0.0002 0.0034 0.0015 -0.0002 0.0025
(0.0052) (0.0003) (0.0021) (0.0071) (0.0003) (0.0023) EARNINGS VOLi,t - -0.0002 0.0000 0.0001 -0.0007 0.0001** -0.0004
(0.0003) (0.0001) (0.0002) (0.0007) (0.0000) (0.0003) EARNINGS VOLi,t-1 - -0.0001 0.0000 0.00005** -0.0002 0.0000 0.0001
(0.0003) (0.0000) (0.00002) (0.0004) (0.0000) (0.0001) EQUITY PREMIUM - 0.0002* -0.0001 0.0000 0.0003** -0.0001 -0.0003***
(0.0001) (0.0001) (0.0000) (0.0001) (0.0001) (0.0001) TERM-STRUCTR - -0.0044*** -0.0015** -0.0016*** -0.0104*** -0.0022** -0.0047***
(0.0011) (0.0007) (0.0002) (0.0014) (0.0009) (0.0004) �SHARE PRICE - -0.0131** -0.0138*** -0.0118*** -0.0525*** -0.0561*** -0.0181*** (0.0062) (0.0053) (0.0020) (0.0077) (0.0071) (0.0034) Constant 0.0458* 0.0403* 0.0198** 0.1184*** 0.0148 0.1123*** (0.0276) (0.0224) (0.0099) (0.0440) (0.0247) (0.0253) Correlation1 -6.23*** -8.746*** -18.81*** -6.844*** -9.729*** -22.62*** Correlation2 0.701 0.101 1.367 -0.252 1.319 3.387***
Sargan Test (df) 256.5 (471) 277 (263) 864 (679)*** 266.3 (471) 321 (263)*** 1173(679)*** Wald Test-1 (df) 1160 (18)*** 1667 (18)*** 4970 (18)*** 2145 (18)*** 4268 (18)*** 5363 (18)***
Wald Test-2 (df) 37.86 (15)*** 30.01 (14)*** 38.66 (15)*** 37.16 (15)*** 28.59 (14)** 57.64 (15)*** R2 0.8012 0.8023 0.6769 0.8046 0.8327 0.6800 Firms / Observations 292 / 2344 508 / 4821 2190 / 29700 292 / 2344 508 / 4821 2190 / 29700 Estimation Period 1986-2000 1990-2000 1972-2000 1986-2000 1990-2000 1972-2000 See notes in Table 2 for variable definitions. Asymptotic standard errors robust to heteroscedasticity are in the parentheses. Instruments used for the UK start from lag (t-3) and from lag (t-2) for France and Germany. Correlation 1 and 2 are first and second order autocorrelation of residuals, respectively; which are asymptotically distributed as N(0,1) under the null of no serial correlation. Sargan Test is test of the overidentifying restrictions, asymptotically distributed as ÷2(df) under the null of instruments' validity. Wald Tests 1 and 2 test the joint significance of estimated coefficients, and of industry dummies, respectively; asymptotically distributed as ÷2(df) under the null of no relationship. (*), (**) and (***) indicates that coefficients are significant or the relevant null is rejected at 10, 5 and 1 percent level, respectively.
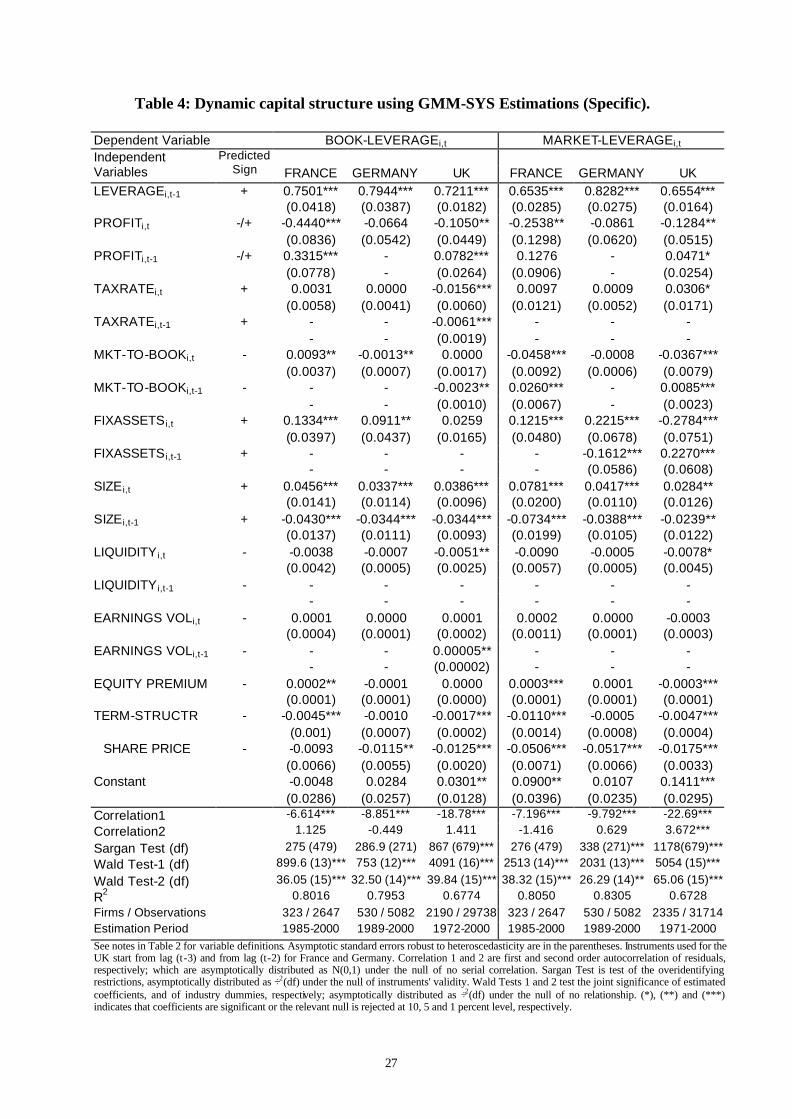
27
Table 4: Dynamic capital structure using GMM-SYS Estimations (Specific).
Dependent Variable BOOK-LEVERAGEi,t MARKET-LEVERAGEi,t Independent
Variables Predicted
Sign FRANCE GERMANY UK FRANCE GERMANY UK LEVERAGEi,t-1 + 0.7501*** 0.7944*** 0.7211*** 0.6535*** 0.8282*** 0.6554***
(0.0418) (0.0387) (0.0182) (0.0285) (0.0275) (0.0164) PROFITi,t -/+ -0.4440*** -0.0664 -0.1050** -0.2538** -0.0861 -0.1284**
(0.0836) (0.0542) (0.0449) (0.1298) (0.0620) (0.0515) PROFITi,t-1 -/+ 0.3315*** - 0.0782*** 0.1276 - 0.0471*
(0.0778) - (0.0264) (0.0906) - (0.0254) TAXRATEi,t + 0.0031 0.0000 -0.0156*** 0.0097 0.0009 0.0306*
(0.0058) (0.0041) (0.0060) (0.0121) (0.0052) (0.0171) TAXRATEi,t-1 + - - -0.0061*** - - -
- - (0.0019) - - - MKT-TO-BOOKi,t - 0.0093** -0.0013** 0.0000 -0.0458*** -0.0008 -0.0367***
(0.0037) (0.0007) (0.0017) (0.0092) (0.0006) (0.0079) MKT-TO-BOOKi,t-1 - - - -0.0023** 0.0260*** - 0.0085***
- - (0.0010) (0.0067) - (0.0023) FIXASSETS i,t + 0.1334*** 0.0911** 0.0259 0.1215*** 0.2215*** -0.2784***
(0.0397) (0.0437) (0.0165) (0.0480) (0.0678) (0.0751) FIXASSETS i,t-1 + - - - - -0.1612*** 0.2270***
- - - - (0.0586) (0.0608) SIZE i,t + 0.0456*** 0.0337*** 0.0386*** 0.0781*** 0.0417*** 0.0284**
(0.0141) (0.0114) (0.0096) (0.0200) (0.0110) (0.0126) SIZEi,t-1 + -0.0430*** -0.0344*** -0.0344*** -0.0734*** -0.0388*** -0.0239**
(0.0137) (0.0111) (0.0093) (0.0199) (0.0105) (0.0122) LIQUIDITY i,t - -0.0038 -0.0007 -0.0051** -0.0090 -0.0005 -0.0078*
(0.0042) (0.0005) (0.0025) (0.0057) (0.0005) (0.0045) LIQUIDITY i,t-1 - - - - - - -
- - - - - - EARNINGS VOLi,t - 0.0001 0.0000 0.0001 0.0002 0.0000 -0.0003
(0.0004) (0.0001) (0.0002) (0.0011) (0.0001) (0.0003) EARNINGS VOLi,t-1 - - - 0.00005** - - -
- - (0.00002) - - - EQUITY PREMIUM - 0.0002** -0.0001 0.0000 0.0003*** 0.0001 -0.0003***
(0.0001) (0.0001) (0.0000) (0.0001) (0.0001) (0.0001) TERM-STRUCTR - -0.0045*** -0.0010 -0.0017*** -0.0110*** -0.0005 -0.0047***
(0.001) (0.0007) (0.0002) (0.0014) (0.0008) (0.0004) �SHARE PRICE - -0.0093 -0.0115** -0.0125*** -0.0506*** -0.0517*** -0.0175*** (0.0066) (0.0055) (0.0020) (0.0071) (0.0066) (0.0033) Constant -0.0048 0.0284 0.0301** 0.0900** 0.0107 0.1411*** (0.0286) (0.0257) (0.0128) (0.0396) (0.0235) (0.0295) Correlation1 -6.614*** -8.851*** -18.78*** -7.196*** -9.792*** -22.69*** Correlation2 1.125 -0.449 1.411 -1.416 0.629 3.672***
Sargan Test (df) 275 (479) 286.9 (271) 867 (679)*** 276 (479) 338 (271)*** 1178(679)*** Wald Test-1 (df) 899.6 (13)*** 753 (12)*** 4091 (16)*** 2513 (14)*** 2031 (13)*** 5054 (15)***
Wald Test-2 (df) 36.05 (15)*** 32.50 (14)*** 39.84 (15)*** 38.32 (15)*** 26.29 (14)** 65.06 (15)*** R2 0.8016 0.7953 0.6774 0.8050 0.8305 0.6728 Firms / Observations 323 / 2647 530 / 5082 2190 / 29738 323 / 2647 530 / 5082 2335 / 31714 Estimation Period 1985-2000 1989-2000 1972-2000 1985-2000 1989-2000 1971-2000 See notes in Table 2 for variable definitions. Asymptotic standard errors robust to heteroscedasticity are in the parentheses. Instruments used for the UK start from lag (t-3) and from lag (t-2) for France and Germany. Correlation 1 and 2 are first and second order autocorrelation of residuals, respectively; which are asymptotically distributed as N(0,1) under the null of no serial correlation. Sargan Test is test of the overidentifying restrictions, asymptotically distributed as ÷2(df) under the null of instruments' validity. Wald Tests 1 and 2 test the joint significance of estimated coefficients, and of industry dummies, respectively; asymptotically distributed as ÷2(df) under the null of no relationship. (*), (**) and (***) indicates that coefficients are significant or the relevant null is rejected at 10, 5 and 1 percent level, respectively.
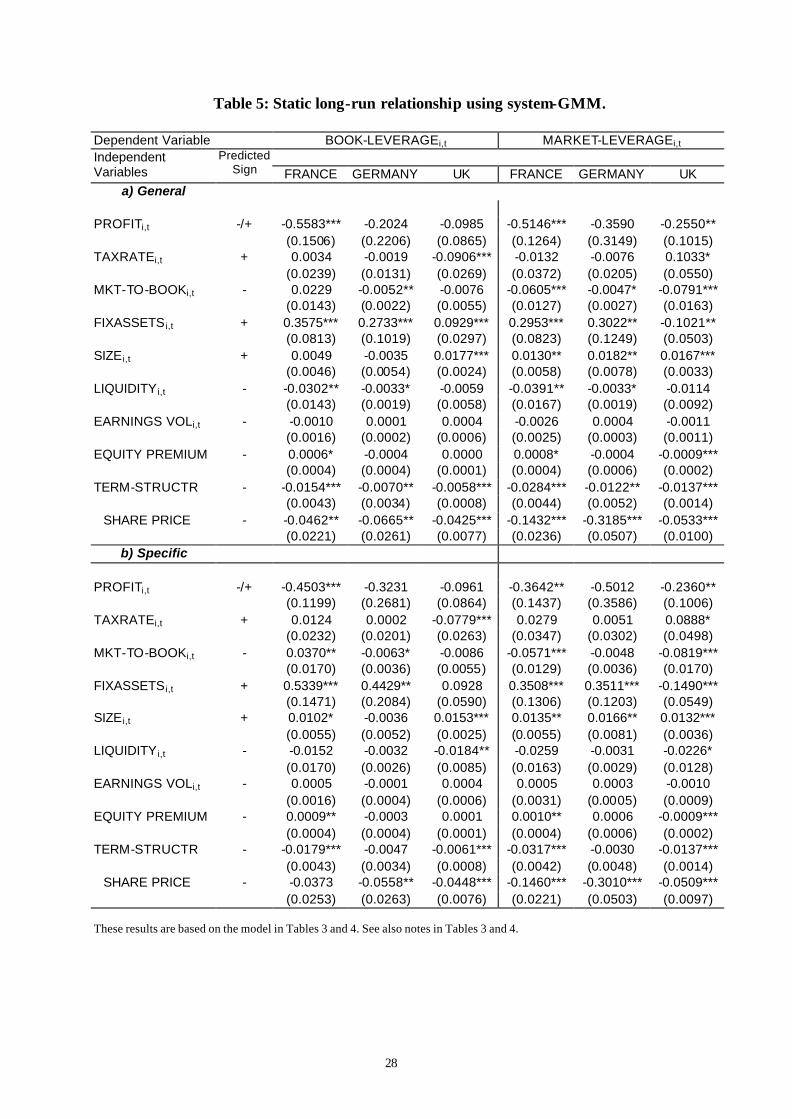
28
Table 5: Static long-run relationship using system-GMM.
Dependent Variable BOOK-LEVERAGEi,t MARKET-LEVERAGEi,t Independent
Variables Predicted
Sign FRANCE GERMANY UK FRANCE GERMANY UK a) General
PROFITi,t -/+ -0.5583*** -0.2024 -0.0985 -0.5146*** -0.3590 -0.2550**
(0.1506) (0.2206) (0.0865) (0.1264) (0.3149) (0.1015) TAXRATEi,t + 0.0034 -0.0019 -0.0906*** -0.0132 -0.0076 0.1033*
(0.0239) (0.0131) (0.0269) (0.0372) (0.0205) (0.0550) MKT-TO-BOOKi,t - 0.0229 -0.0052** -0.0076 -0.0605*** -0.0047* -0.0791***
(0.0143) (0.0022) (0.0055) (0.0127) (0.0027) (0.0163) FIXASSETS i,t + 0.3575*** 0.2733*** 0.0929*** 0.2953*** 0.3022** -0.1021**
(0.0813) (0.1019) (0.0297) (0.0823) (0.1249) (0.0503) SIZE i,t + 0.0049 -0.0035 0.0177*** 0.0130** 0.0182** 0.0167***
(0.0046) (0.0054) (0.0024) (0.0058) (0.0078) (0.0033) LIQUIDITY i,t - -0.0302** -0.0033* -0.0059 -0.0391** -0.0033* -0.0114
(0.0143) (0.0019) (0.0058) (0.0167) (0.0019) (0.0092) EARNINGS VOLi,t - -0.0010 0.0001 0.0004 -0.0026 0.0004 -0.0011
(0.0016) (0.0002) (0.0006) (0.0025) (0.0003) (0.0011) EQUITY PREMIUM - 0.0006* -0.0004 0.0000 0.0008* -0.0004 -0.0009***
(0.0004) (0.0004) (0.0001) (0.0004) (0.0006) (0.0002) TERM-STRUCTR - -0.0154*** -0.0070** -0.0058*** -0.0284*** -0.0122** -0.0137***
(0.0043) (0.0034) (0.0008) (0.0044) (0.0052) (0.0014) �SHARE PRICE - -0.0462** -0.0665** -0.0425*** -0.1432*** -0.3185*** -0.0533***
(0.0221) (0.0261) (0.0077) (0.0236) (0.0507) (0.0100) b) Specific
PROFITi,t -/+ -0.4503*** -0.3231 -0.0961 -0.3642** -0.5012 -0.2360**
(0.1199) (0.2681) (0.0864) (0.1437) (0.3586) (0.1006) TAXRATEi,t + 0.0124 0.0002 -0.0779*** 0.0279 0.0051 0.0888*
(0.0232) (0.0201) (0.0263) (0.0347) (0.0302) (0.0498) MKT-TO-BOOKi,t - 0.0370** -0.0063* -0.0086 -0.0571*** -0.0048 -0.0819***
(0.0170) (0.0036) (0.0055) (0.0129) (0.0036) (0.0170) FIXASSETS i,t + 0.5339*** 0.4429** 0.0928 0.3508*** 0.3511*** -0.1490***
(0.1471) (0.2084) (0.0590) (0.1306) (0.1203) (0.0549) SIZE i,t + 0.0102* -0.0036 0.0153*** 0.0135** 0.0166** 0.0132***
(0.0055) (0.0052) (0.0025) (0.0055) (0.0081) (0.0036) LIQUIDITY i,t - -0.0152 -0.0032 -0.0184** -0.0259 -0.0031 -0.0226*
(0.0170) (0.0026) (0.0085) (0.0163) (0.0029) (0.0128) EARNINGS VOLi,t - 0.0005 -0.0001 0.0004 0.0005 0.0003 -0.0010
(0.0016) (0.0004) (0.0006) (0.0031) (0.0005) (0.0009) EQUITY PREMIUM - 0.0009** -0.0003 0.0001 0.0010** 0.0006 -0.0009***
(0.0004) (0.0004) (0.0001) (0.0004) (0.0006) (0.0002) TERM-STRUCTR - -0.0179*** -0.0047 -0.0061*** -0.0317*** -0.0030 -0.0137***
(0.0043) (0.0034) (0.0008) (0.0042) (0.0048) (0.0014) �SHARE PRICE - -0.0373 -0.0558** -0.0448*** -0.1460*** -0.3010*** -0.0509*** (0.0253) (0.0263) (0.0076) (0.0221) (0.0503) (0.0097) These results are based on the model in Tables 3 and 4. See also notes in Tables 3 and 4.
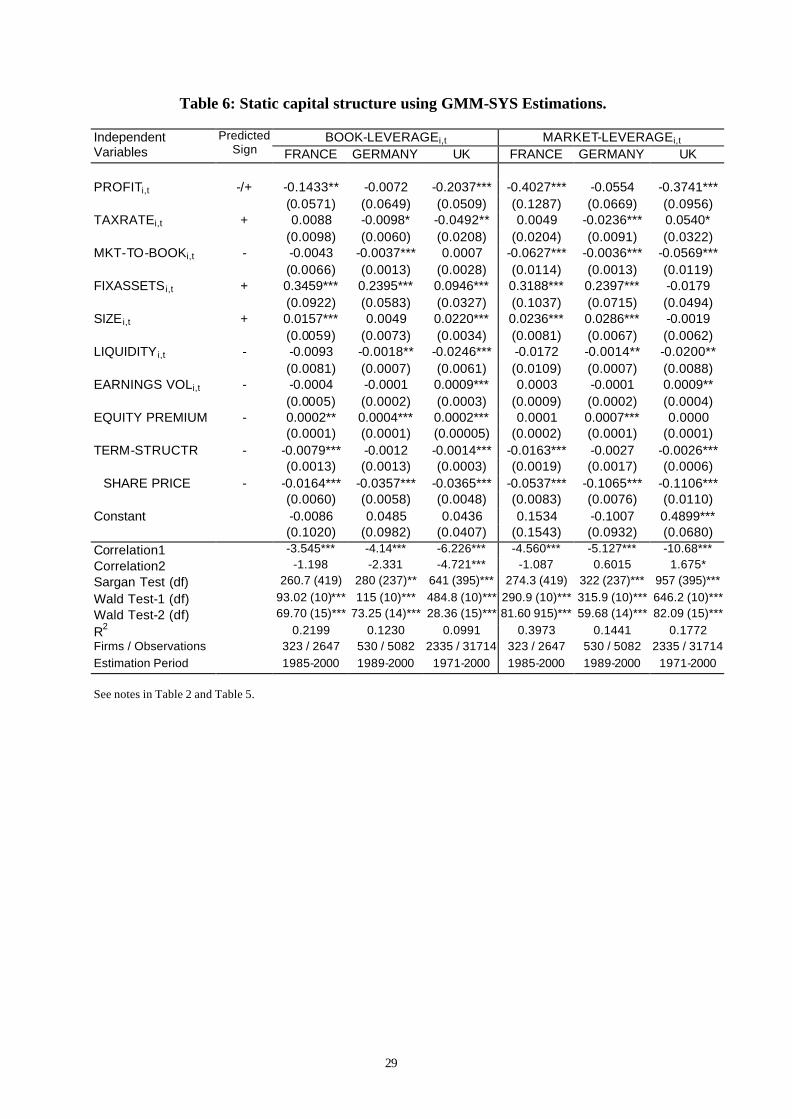
29
Table 6: Static capital structure using GMM-SYS Estimations.
BOOK-LEVERAGEi,t MARKET-LEVERAGEi,t Independent Variables
Predicted Sign FRANCE GERMANY UK FRANCE GERMANY UK
PROFITi,t -/+ -0.1433** -0.0072 -0.2037*** -0.4027*** -0.0554 -0.3741***
(0.0571) (0.0649) (0.0509) (0.1287) (0.0669) (0.0956) TAXRATEi,t + 0.0088 -0.0098* -0.0492** 0.0049 -0.0236*** 0.0540*
(0.0098) (0.0060) (0.0208) (0.0204) (0.0091) (0.0322) MKT-TO-BOOKi,t - -0.0043 -0.0037*** 0.0007 -0.0627*** -0.0036*** -0.0569***
(0.0066) (0.0013) (0.0028) (0.0114) (0.0013) (0.0119) FIXASSETS i,t + 0.3459*** 0.2395*** 0.0946*** 0.3188*** 0.2397*** -0.0179
(0.0922) (0.0583) (0.0327) (0.1037) (0.0715) (0.0494) SIZE i,t + 0.0157*** 0.0049 0.0220*** 0.0236*** 0.0286*** -0.0019
(0.0059) (0.0073) (0.0034) (0.0081) (0.0067) (0.0062) LIQUIDITY i,t - -0.0093 -0.0018** -0.0246*** -0.0172 -0.0014** -0.0200**
(0.0081) (0.0007) (0.0061) (0.0109) (0.0007) (0.0088) EARNINGS VOLi,t - -0.0004 -0.0001 0.0009*** 0.0003 -0.0001 0.0009**
(0.0005) (0.0002) (0.0003) (0.0009) (0.0002) (0.0004) EQUITY PREMIUM - 0.0002** 0.0004*** 0.0002*** 0.0001 0.0007*** 0.0000
(0.0001) (0.0001) (0.00005) (0.0002) (0.0001) (0.0001) TERM-STRUCTR - -0.0079*** -0.0012 -0.0014*** -0.0163*** -0.0027 -0.0026***
(0.0013) (0.0013) (0.0003) (0.0019) (0.0017) (0.0006) �SHARE PRICE - -0.0164*** -0.0357*** -0.0365*** -0.0537*** -0.1065*** -0.1106*** (0.0060) (0.0058) (0.0048) (0.0083) (0.0076) (0.0110) Constant -0.0086 0.0485 0.0436 0.1534 -0.1007 0.4899*** (0.1020) (0.0982) (0.0407) (0.1543) (0.0932) (0.0680) Correlation1 -3.545*** -4.14*** -6.226*** -4.560*** -5.127*** -10.68*** Correlation2 -1.198 -2.331 -4.721*** -1.087 0.6015 1.675* Sargan Test (df) 260.7 (419) 280 (237)** 641 (395)*** 274.3 (419) 322 (237)*** 957 (395)***
Wald Test-1 (df) 93.02 (10)*** 115 (10)*** 484.8 (10)*** 290.9 (10)*** 315.9 (10)*** 646.2 (10)*** Wald Test-2 (df) 69.70 (15)*** 73.25 (14)*** 28.36 (15)*** 81.60 915)*** 59.68 (14)*** 82.09 (15)***
R2 0.2199 0.1230 0.0991 0.3973 0.1441 0.1772 Firms / Observations 323 / 2647 530 / 5082 2335 / 31714 323 / 2647 530 / 5082 2335 / 31714 Estimation Period 1985-2000 1989-2000 1971-2000 1985-2000 1989-2000 1971-2000 See notes in Table 2 and Table 5.

30
Appendix: A
The Definitions of the Variables
(Numbers or Text in brackets [ ] indicate to variable identifier in Datastream)
• Operating profit: Net profit derived from normal activities after depreciation and operating provisions [137] plus depreciation [136].
• Total sales: The amount of sales of goods and services to third parties, relating to the
normal activities of the company [104]. • Depreciation: Provisions for amounts written-off (AWO) and depreciation of fixed assets and
assets leased in [136]. For industrials in Germany the figure includes AWO intangibles. • Total Taxable Income: Pre-tax profit as disclosed by the company; no adjustments are
made to exclude items of an exceptional/extraordinary nature [154]. • Total tax charge: This is the company’s published charge for taxation [203]. • Book value of debt: It is the total of all long and short-term borrowings, including any
subordinate debt and 'debt like' hybrid finance instruments [1301]. • Net tangible assets: It shows the net total of land and buildings, plant and machinery,
construction in progress and any other fixed assets excluding assets leased out [339]. • Current assets : It includes stocks, work in progress, trade and other debtors, cash and
equivalent, and any other current assets [376]. • Current Liabilities: It includes current provisions, creditors, borrowing repayable within one
year, trade accounts payable after one year and any other current liabilities [389]. • Total Assets: Total assets employed by the company [392]. Book value of equity: Total
share capital and reserves [307]. • Market value of equity: Share price multiplied by the number of ordinary shares in issue
[MV]. • Size of the firm is measured by total assets (and total sales) and is deflated by the Producer
Price Index taking the earliest year in the sample as the base year, which are 1969, 1983 and 1987 for the UK, France and Germany, respectively.
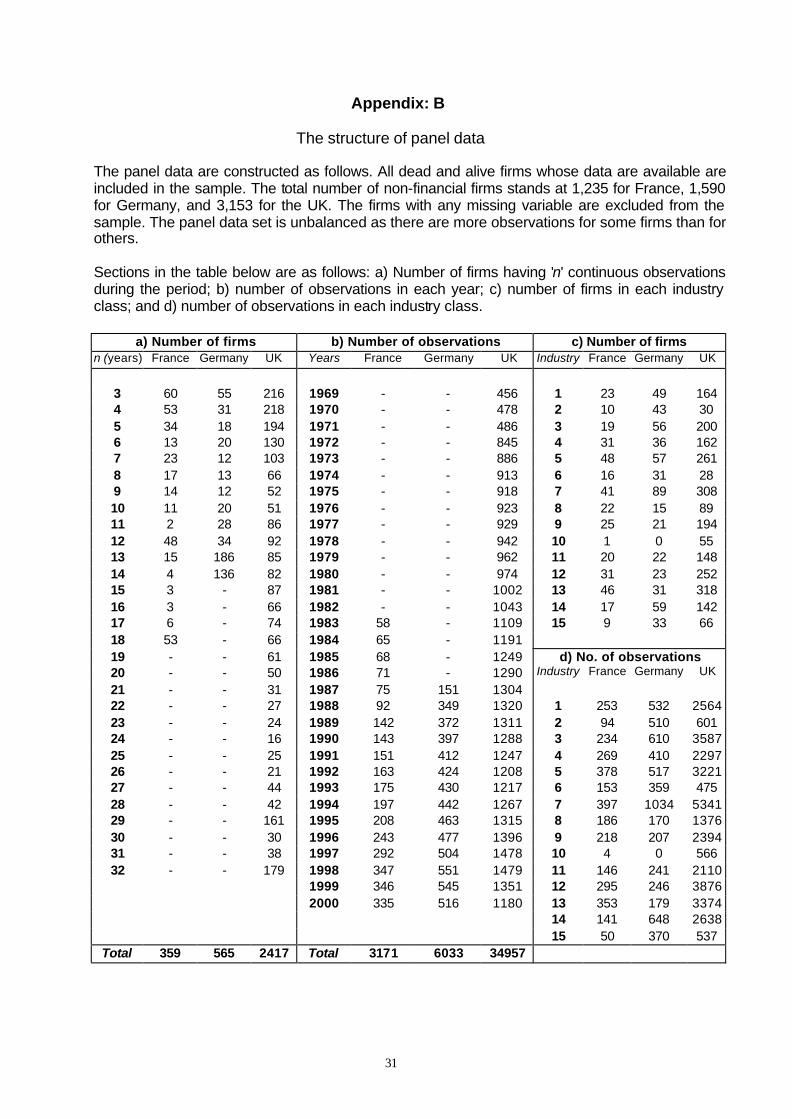
31
Appendix: B
The structure of panel data The panel data are constructed as follows. All dead and alive firms whose data are available are included in the sample. The total number of non-financial firms stands at 1,235 for France, 1,590 for Germany, and 3,153 for the UK. The firms with any missing variable are excluded from the sample. The panel data set is unbalanced as there are more observations for some firms than for others. Sections in the table below are as follows: a) Number of firms having 'n' continuous observations during the period; b) number of observations in each year; c) number of firms in each industry class; and d) number of observations in each industry class.
a) Number of firms b) Number of observations c) Number of firms n (years) France Germany UK Years France Germany UK Industry France Germany UK
3 60 55 216 1969 - - 456 1 23 49 164 4 53 31 218 1970 - - 478 2 10 43 30 5 34 18 194 1971 - - 486 3 19 56 200 6 13 20 130 1972 - - 845 4 31 36 162 7 23 12 103 1973 - - 886 5 48 57 261 8 17 13 66 1974 - - 913 6 16 31 28 9 14 12 52 1975 - - 918 7 41 89 308 10 11 20 51 1976 - - 923 8 22 15 89 11 2 28 86 1977 - - 929 9 25 21 194 12 48 34 92 1978 - - 942 10 1 0 55 13 15 186 85 1979 - - 962 11 20 22 148 14 4 136 82 1980 - - 974 12 31 23 252 15 3 - 87 1981 - - 1002 13 46 31 318 16 3 - 66 1982 - - 1043 14 17 59 142 17 6 - 74 1983 58 - 1109 15 9 33 66 18 53 - 66 1984 65 - 1191 19 - - 61 1985 68 - 1249 d) No. of observations 20 - - 50 1986 71 - 1290 Industry France Germany UK
21 - - 31 1987 75 151 1304 22 - - 27 1988 92 349 1320 1 253 532 2564 23 - - 24 1989 142 372 1311 2 94 510 601 24 - - 16 1990 143 397 1288 3 234 610 3587 25 - - 25 1991 151 412 1247 4 269 410 2297 26 - - 21 1992 163 424 1208 5 378 517 3221 27 - - 44 1993 175 430 1217 6 153 359 475 28 - - 42 1994 197 442 1267 7 397 1034 5341 29 - - 161 1995 208 463 1315 8 186 170 1376 30 - - 30 1996 243 477 1396 9 218 207 2394 31 - - 38 1997 292 504 1478 10 4 0 566 32 - - 179 1998 347 551 1479 11 146 241 2110 1999 346 545 1351 12 295 246 3876 2000 335 516 1180 13 353 179 3374 14 141 648 2638 15 50 370 537
Total 359 565 2417 Total 3171 6033 34957