The determinants of corporate debt ownership structure : Evidence from market-based and bank-based...
30
Electronic copy available at: http://ssrn.com/abstract=1517084 The Determinants of Corporate Debt Ownership Structure: Evidence from Market-based and Bank-based Economies Antonios Antoniou FRC Consulting, Durham, DH7 0RW, UK Email: [email protected] Yilmaz Guney * Business School, University of Hull, Hull, HU6 7RX, UK Tel: + 44 (0) 1482 463079, Fax: +44 (0) 1482 463492 E-mail: [email protected] Krishna Paudyal Durham Business School, Durham University, Mill Hill Lane, Durham DH1 3LB, UK Tel: Tel: +44 (0) 191 334 5388; Fax: +44 (0) 191 334 5201 Email: [email protected] Managerial Finance, Vol. 34 No. 12, 2008 * Corresponding author
-
Upload
independent -
Category
Documents
-
view
0 -
download
0
Transcript of The determinants of corporate debt ownership structure : Evidence from market-based and bank-based...

Electronic copy available at: http://ssrn.com/abstract=1517084
The Determinants of Corporate Debt Ownership Structure:
Evidence from Market-based and Bank-based Economies
Antonios Antoniou FRC Consulting, Durham, DH7 0RW, UK Email: [email protected]
Yilmaz Guney* Business School, University of Hull, Hull, HU6 7RX, UK Tel: + 44 (0) 1482 463079, Fax: +44 (0) 1482 463492
E-mail: [email protected]
Krishna Paudyal Durham Business School, Durham University, Mill Hill Lane, Durham DH1 3LB, UK
Tel: Tel: +44 (0) 191 334 5388; Fax: +44 (0) 191 334 5201 Email: [email protected]
Managerial Finance, Vol. 34 No. 12, 2008
* Corresponding author

Electronic copy available at: http://ssrn.com/abstract=1517084
The Determinants of Corporate Debt Ownership Structure: Evidence from Market-based and Bank-based Economies
Abstract
We compare the determinants of the corporate debt ownership structure in a bank-oriented economy (Germany) and market-oriented economy (UK). The results, that are controlled for endogeneity, simultaneity and measurement errors, show that the firms in both countries adjust their debt ownership structure towards their target levels – British firms being the swifter. The evidence supports the predictions of the liquidation and renegotiation, and the flotation cost hypotheses in both countries. However, the moral hazard and adverse selection hypothesis receives support only in the UK. Moreover, the influence of market related factors on the choice of the lender is country dependent. Overall, the debt ownership structure of a firm is influenced by both the firm-specific factors and the financial traditions in which the firm operates.
Keywords: Dynamic debt ownership structure, Panel data, GMM JEL Classification: G20, G32
1
The Determinants of Corporate Debt Ownership Structure: Evidence from Market-based and Bank-based Economies
I. INTRODUCTION
Although firms raise both public and private debts the evidence on what determines the mix
is sparse1. James (1996) shows that a mix of public and private debt allows distressed firms
to alter their capital structure through non-court restructurings and hence the choice of mix is
a complex phenomenon. The literature offers three possible explanations. First, the
‘liquidation and renegotiation’ hypothesis postulates that the renegotiation of public debt is
difficult, costly and is more likely to lead to a liquidation of distressed firms (Chemmanur and
Fulghieri, 1994). Thus, firms with such risks are likely to avoid public debt. Second, the
‘moral hazard and adverse selection’ hypothesis suggests that bank (monitored) loans are
different from public debt as banks have cost advantage in lending and hold more
information about the prospects of borrowing firms (Diamond, 1984). Fama (1985) argues
that bank debt is like inside debt that may mitigate underinvestment problems. Therefore,
firms with potential agency conflicts are contended to benefit from issuing private (e.g., bank)
debt rather than public debt. Finally, the ‘flotation cost’ hypothesis states that there are
economies of scale in issuing substantial amount of public debt and hence only the larger
firms are likely to benefit from the cost-advantageous public debt (Blackwell and Kidwell,
1988). This implies that the option of issuing public debt or bank debt is limited to the larger
firms only.
This paper investigates the determinants of choice between private and public debt and
extends the literature in several ways. First, very few studies allow for the possible
implications of country-specific factors and environment on the choice of the source of debt
[1]. This study offers a unique comparison of the evidence from a bank-based economy
(Germany) and a market-based economy (UK) that should have direct implications on the
choice between the bank debt and public debt. Mayer (1994) argues that dispersed
corporate ownership in the UK is an obstacle to have a long-term relationship between firms
and banks causing firms to rely on stock markets for external financing. Modigliani and
Perotti (2000) argue that strong shareholders’ protection makes equity markets greater and
reduces the dominance of bank lending. These arguments offer further relevance to
1 A related but separate strand of literature examines the firm value effect of public versus private
debt. James (1987) reports that the announcement of issues of bank loan results in positive abnormal stock returns while the issue of non-bank private debt or straight debt to repay bank debt affect the firms' stock prices inversely. Similarly, Datta et al. (2000) find a significantly negative share price response to public debt announcements.

2
examining the corporate debt ownership structure in these two countries. We also control for
the possible effects of relevant economic and financial factors of these countries. Therefore,
this study offers an out of sample tests of the propositions developed in the US by providing
unique comparative evidence from a bank-based economy and a market-based economy.
Second, factors affecting the firms' debt composition change overtime. Firms with long-run
debt ownership target attain it through an adjustment process. To test for this we apply an
autoregressive-distributed lag model that allows for an examination of the determinants of
bank debt use, measure the speed of adjustment to desired private versus public debt ratio,
and to provide the static long-run relationship between this ratio and its possible
determinants. To our knowledge, this is the first debt ownership study to consider all three
issues simultaneously.
Finally, it is likely that random shocks affect both dependent and explanatory variables at the
same time. It is possible that the observed relation between debt-mix and its potential
determinants indicate the effects of debt-mix on the latter rather than vice-versa. We control
for this important issue of endogeneity by using a GMM procedure. This also overcomes the
problems of simultaneity and measurement errors that are known to be common in firm-level
data. We are not aware of any other study on debt ownership that controls for endogeneity.
Our evidence records a few similarities in debt-mix structure of German and UK firms but it
also detects some important differences. Therefore, the paper concludes that the relation
between dependent and explanatory variables is country-dependent. This can be attributed
to the differences in corporate governance mechanisms and institutional features of the
countries.
The remainder of this study is organised as follows. Section 2 describes the variables and
the related debt-mix hypotheses. Section 3 discusses the construction and analysis of data.
Methodology and the model are developed in section 4. Section 5 presents the empirical
results. Last section concludes the paper.
3
II. THEORIES OF CORPORATE DEBT- MIX AND HYPOTHESES DEVELOPMENT
The Dependent Variables
Following Houston and James (1996), among others, we measure the debt ownership
structure by the ratio of bank debt to total debt (hereafter bank-debt ratio). We also examine
the determinants of maturity structure of bank loans. They are defined as (a) short-term bank
debt (payable within one year) to total debt; (b) long-term bank debt (payable after one year)
to total debt.
Explanatory Variables
We model the debt ownership structure as a function of factors that are expected to
influence the debt-mix structure, such as liquidation and renegotiation, moral hazard and
adverse selection, hypotheses and flotation (transaction) costs. We also control for several
factors that represent the market conditions.
Target debt ownership structure
Lagged Dependent Variable
There are some potential costs (hold-up problems, monitoring costs, occurrence of inefficient
liquidations) and benefits (low moral hazard and adverse selection costs, flexible
renegotiations) of bank financing. Berlin and Loeys (1988) argue that firms can obtain an
optimal debt ownership structure by trading-off the inefficiencies of harsh bond covenants of
public debt and the agency costs of hiring a delegated monitor for bank debt. Modelling of
the determinants of the debt ownership structure assumes that the firms have target bank-
debt ratio. The lagged bank-debt ratio in the model serves as a benchmark in testing
whether firms have a target debt ownership structure, and if indeed they do the degree of
divergence (or convergence) from (to) this target level. Any such deviations could be
attributed to the cost of adjustment versus the cost of being away from the target. If firms
optimally determine their debt ownership structure the coefficient of lagged dependent
variable should be (statistically) between 0 and 1. Considering the relatively lower cost of
raising bank debt, the German firms should adjust their debt ownerships structure more
swiftly than the British firms who are likely to face higher transaction costs in adjusting public
debts.
Liquidation and renegotiation
As stated earlier the ‘liquidation and renegotiation’ hypothesis predicts that the renegotiation
of public debt is costly, difficult and likely to cause the liquidation of financially distressed
firms. Thus, companies that are exposed to such risks are likely to opt for bank debt. We use

4
a number of proxy variables to measure the potential risk of liquidation and the need for
renegotiation.
Debt Maturity: Schuhmacher (1998) shows that the choice of debt source depends on
maturity need. Bank (public) debts are suitable for financing the short (long) term needs.
Kanatas and Qi (2001) contend that bank debt is more suitable for financing assets with
shorter economic lives. This is consistent with the notion of maturity matching hypothesis
that firms match the maturity of liabilities with assets to minimise liquidation risk. Hence, we
expect an inverse relation between debt maturity and bank-debt ratio. We measure the debt
maturity by the ratio of long-term debt (maturing after one year) to total debt.
Leverage: (Fama, 1985) argues that bank monitoring generates a public good that reduces
the costs of public debt. As a result, higher bank debt may imply higher leverage owing to a
complementary effect of bank debt on public debt. Similarly, Berlin and Loeys (1988)
suggest that private debt (especially bank debt) provides more emphasis on monitoring than
the public debt does. Thus, a positive association between the bank-debt ratio and the
leverage of the firm is expected. On the other hand, firms with higher debt ratios may limit
their bank borrowings to avoid liquidations (Diamond, 1993). Banks' motivation to monitor
the borrowing firm, on behalf of junior public debtholders, may decline with the increase in
public debt. Hooks and Opler (1993) find that bank borrowing is highest among firms
employing relatively little debt in their capital structure. Hence, a negative relationship
between bank debt and leverage is expected. Thus, how leverage affects the source of debt
remains an empirical question. We measure leverage by the ratio of book value of total debt
to book value of total assets [2].
Liquidity: Bank loans are generally aimed at mitigating short-term liquidity problem of firms.
Therefore, an inverse relation between liquidity and bank loan is expected. Given the close
association between firms and the banks in Germany, the liquidity factor should be of less
importance to German firms than to British companies. The current ratio (current assets to
current liabilities) represents the liquidity level in our model.
Interest Coverage Ratio: Interest coverage ratio can be a proxy of the severity of financial
distress (James, 1996). Chemmanur and Fulghieri (1994) theorise that firms with lower
financial distress probably opt for public debt against bank debt since the lower interest cost
of public debt outweighs the benefits of flexible renegotiations in bank debt. We thus expect
a negative relationship between interest coverage ratio (a proxy for financial distress) and

5
bank-debt ratio. The ratio of EBITD (earnings before interest, taxes and depreciation) to total
interest expense represents this variable in our model.
Moral hazard and adverse selection
This hypothesis suggests that the banks are likely to have more information about the
borrowing firms and cost advantage in lending. Bank loan is similar to inside debt that which
may mitigate underinvestment problems. Therefore, the firms with potential agency conflicts
should benefit more from issuing bank debt instead of public debt. The variables
representing this argument are discussed below.
Growth Opportunities: Owing to information asymmetry outside investors are weakly
informed of the firms' growth options and are concerned about agency problems. Hence,
they demand for higher premium. Yosha (1995) suggest that firms with potentially valuable
future growth projects will not borrow from public debt markets owing to high disclosure
costs of revealing sensitive information [3] Blackwell and Kidwell (1988) argue that less risky
firms are likely to issue public debt that contains less detailed restrictive covenants. MacKie-
Mason (1990) argues that research and development intensive firms (i.e. firms with high
growth potential) should avoid raising public debt. Thus, a positive association between
growth opportunity and bank-debt ratio is anticipated.
On the other hand, Hoshi et al. (1993) show that firms with value-enhancing investment
opportunities will use low cost public debt as it will be costly for such firms to forego positive-
NPV projects because of high financing cost of bank debt. Houston and James (1996) argue
that hold-up problems together with bank information monopolies may lead to a negative
relationship between market-to-book ratio and the reliance on bank debt. Banks can hold up
borrowing firms especially if the firms do not have alternative financing sources [4]. This
implies an inverse relation between bank-debt ratio and growth opportunities of the firm. We
measure growth opportunities (market-to-book ratio) as the ratio of (book value of total
assets less book value of equity plus market value of equity) to (book value of total
assets)[5]. This ratio can be viewed as a proxy for project quality perceived by the market
(Johnson, 1997).
Firm Quality: Diamond (1991) shows that high quality firms issue public debt while medium
and low quality firms issue bank debt [6]. On the supply side, Stiglitz and Weiss (1981) argue
that banks ration credits if they cannot distinguish between good and bad firms. Therefore,
firms that have favourable information but suffer from high information asymmetries should
issue private debt. On the demand side, the hidden-information view contends that when the

6
advantage of hidden information is substantial firms seek better-informed financier (MacKie-
Mason, 1990). James (1987) argues that firms disclose the terms of private financing to the
market in order to signal their true value. Thus, the adverse selection hypothesis expects a
positive relation between firm quality and bank-debt ratio. We measure firm quality by
abnormal earnings. Following Stohs and Mauer (1996) this is defined as the difference
between earnings per share in years (t+1) and (t) divided by share price in year (t).
Dividend Payout Ratio: The dividend policy of a firm is known to reveal information. Hidden-
information problem is likely to be exacerbated for non-dividend paying firms and hence
such firms avoid public debt. Low et al. (2001) show that investors regard small firms'
dividend decision as a function of bank monitoring. They show that the market reaction to
dividend omissions by small firms with high levels of bank debt is much less negative than
that to by firms with little or no bank debt. Thus, we anticipate an inverse relation between
the payout ratio (a proxy of dividend policy) and bank-debt ratio.
Earnings Volatility: Earnings are difficult to forecast. They are even more difficult to forecast
when their volatility is high. MacKie-Mason (1990) argues that managers are likely to have
advantageous information when earnings are volatile. When earnings are volatile issuing
public debt will be costlier as investors will stipulate high 'lemons' premia. As suggested by
Johnson (1997) earnings volatility is also a proxy for observable credit risk and probability of
financial distress. Sy (1999) demonstrates that high credit risk firms issue private debt due to
the benefits of renegotiating tighter restrictions. On the other hand, low credit risk firms will
issue public debt due to benefits from increased flexibility. Thus, a positive relation between
earnings volatility and the bank debt is expected. Following Miguel and Pindado (2001) we
measure earnings volatility with the ratio of the sum of intangible assets and the difference
between the standard deviation and expected value of EBIT (earnings before interest, taxes)
to total assets. This measure (DISTRESS) also considers the probability of financial distress
and asset specificity. High volatility in earnings widens the difference between standard
deviation and expected value of EBIT, which in turn increases the expected financial distress
costs. Therefore, firms with more volatile earnings tend to switch to private debt financing.
Flotation costs
Firm Size: The size of the firm can have several implications on the choice between public
and private debts. The costs of issuing public debt are considerably higher for small firms.
Coase (1937) argues that deterrent transaction and contracting costs discourage small firms
from raising external funding forcing them to rely on their retained earnings. Hence, they are
likely to borrow short-term bank debts in order to avoid diseconomies of scale and the costs

7
of financial distress. Large firms are generally mature, less risky and have relatively low
growth opportunities, thus low potential agency problems. Moreover, large firms tend to have
better reputation and public information leading them to issue cost-efficient public debt
(Diamond, 1991). Mayer and Alexander (1990) show that larger firms in the UK raise less
bank loan. The size effect is more important in market-based countries because of the
higher cost of financial distress and lack of strong support from their banks. Thus, an inverse
relation between bank-debt ratio and firm size is expected. We measure firm size in three
ways, the natural logarithms of: i) total sales, ii) total assets, and iii) total assets minus book
value of equity plus market value of equity. However, the last definition is considered the
main measure of size in our model.
The control factors
Stock Return Volatility: It is likely that under uncertain market conditions firms may face
difficulties in raising public debt. Hadlock and James (2002) state that firms with high stock
return volatility tend to have substantial information asymmetries between outsider and
insiders. They find that undervalued firms tend to use bank debt. Thus, a direct relationship
between bank-debt ratio and stock return volatility is expected. We measure the volatility by
the standard deviation of weekly stock returns over the previous year, matched to the month
of firms' fiscal year-end.
Change in Stock Price: MacKie-Mason (1990) contends that a rising share price of a
company implies that the investors are convinced about the improving prospects of the firm.
Such firms can raise public debt at favourable terms. Thus, a negative relation is expected
between bank-debt ratio and change (increase) in share price. We measure this variable as
the first difference of the log of annual share price, with a six-month lag to allow for a time
gap between the decision making process and the issuance of debt, matched to the month
of firms' fiscal year-end.
Term Structure of Interest Rates: Kashyap et al. (1993) argue that tight monetary policies
increase the cost of banks’ capital, which in turn discourages firms from borrowing from
banks. Oliner and Rudebusch (1996) suggest that lenders would not be funding low-quality
firms under such conditions. UK firms rely on capital markets while German firms on banks
for financing. Thus, as highlighted by Bolton and Freixas (2000), the effect of monetary
policies on corporate sector may not be similar across the sample countries. Mayer (1994)
argues that the credit constraints have much more pronounced impact on the real sector in a
bank-based economy than in a market-based economy. Our models, which incorporate the
term-structure of interest rates, are expected to shed light on these issues. We measure the
8
term structure is as the difference between the month-end yields on long-term government
bond and three-month treasury-bills, with a six-month lag, matched to the month of firms'
fiscal year-end.
Fixed Assets Ratio: Boot et al. (1991) predict that the firms with potential collateral are likely
to issue bank loan. James (1996) emphasises that almost all bank debts of financially
distressed firms are secured while public debts are rarely secured. In addition, Berger and
Udell (1995) argue that some banks specialise in lending to the firms with substantial
asymmetric information problems. These can be reflected in the nature of loan contract
terms such as the rate of interest rate and collateral. Edwards and Fischer (1994) state that
collateral seems to be one of the requirements for the majority of bank loans in Germany
and the UK. We measure the fixed asset ratio (a proxy of collateral) with the ratio of net
tangible assets to total assets and expect a positive relation between this ratio and bank
debt.
III. THE SAMPLE AND DATA
Motivated by the objective of comparing the determinants of debt ownership structure in a
market-oriented economy and a bank-oriented economy we analyse the cases of British and
German firms. The sample includes all non-financial firms (dead or alive) traded in their
domestic stock exchanges. The sample period, guided by data availability, starts from 1969
for the UK, and from 1987 for Germany and ends in 2000. To allow for a dynamic model
estimation firms with less than 6 consecutive observations are excluded from the sample.
The final dataset after some filtering comprises 1,813 UK firms with 33,010 observations and
498 German firms with 6,447 observations. Data are obtained from Datastream.
The descriptive statistics (Table I), as expected in a bank-oriented economy, show that
German firms have substantially higher bank-debt ratio (BANK-TOTAL) (94.5 %) than that of
the UK firms (60.5%). In Germany, the short-term bank debt payable within one year is
45.4% of the total debt (BANK-SHORT) while the long-term bank debt payable after five
years (BANK-LONG>5) is only 16.1% of the total debt. This suggests that the German firms
rely on banks primarily for short-term loan. Comparing the ratios of long-term bank debt
payable after one year to total debt (BANK-LONG>1) in Germany and the UK, one can see
the discernible difference between the ratios as it is 49.4% for the former and 14% for the
latter. This implies relatively lower contribution of the banks in financing the corporate sector
in the UK. However, their importance in short term finance is noticeable.
9
“TAKE IN TABLE I”
Annual average bank-debt ratios in Germany range between 90% and 96%. However, this
ratio has been declining since 1996 and takes its lowest value in 2000. The reduction is
reflected in long-term bank debt ratios. On the contrary, average short-term bank debt ratio
is increasing. This trend implies that the German firms are switching from long-term debts to
short-term debts but not at the same magnitude. In the UK, there is an apparent increase in
the average long-term bank-debt ratio. It reached 26.5% in 2000 from 11.9% in 1983. On the
other hand, the short-term bank debt ratio declined from 45.4% in 1969 to 33.3% in 2000.
The overall bank-debt ratio has two distinct patterns during the sample period. During 1969-
1985, the ratio fluctuated between 42.8% and 74.6% while during 1986-2000 it declined from
72.4% to 59.8%.
IV. THE MODEL AND METHODOLOGY
Unlike most previous studies on corporate debt ownership, we use panel data. Advantages
of using panel data include increase in the degrees of freedom, more variability and
reduction in colinearity among regressors. These advantages provide more efficient
estimations.
The Model
A dynamic model is applied in investigating the potential determinants of corporate debt
ownership structure (bank-debt ratio). In equation (1), a partial adjustment model, (the
constant), , and are parameters to be estimated; i are firm-specific factors which
remain constant overtime (e.g., firm reputation), t are time-varying factors which do not vary
across firms (e.g., economic recession), it is the disturbance term which is assumed to be
serially uncorrelated with mean zero and variance σ2.
it
k k
titkikkitktiit XXDEBTBANKDEBTBANK1 1
)1()1( *** (1)
The vectors of explanatory variables, Xs, in equation (1) are current and lagged values of
potential debt ownership determinants representing the Liquidation and reorganisation
hypothesis (Debt maturity, Leverage, Liquidity and Interest coverage ratio); the Moral hazard
and adverse selection hypothesis (Growth opportunities, Firm quality, Dividend payout ratio
and Earnings volatility); the Flotation costs hypothesis (Firm size). The control factors

10
included in the model are stock return volatility, changes in stock price, term-structure of
interest rates and fixed assets ratio [7].
Estimation Techniques
Recent developments in econometrics confirm the superiority of the Generalised Method of
Moments (GMM) technique in estimating the models such as equation (1) (see, for instance,
Blundell and Bond, 1998). We apply two versions of the GMM technique: (a) difference-
GMM (GMM-DIF) and (b) system-GMM (GMM-SYS). In GMM-DIF, the model is estimated in
first-differences using level regressors as instruments to control for unobservable firm
heterogeneity (see Arellano and Bond, 1991, among others). In GMM-SYS, the model is
estimated in both levels and first-differences, i.e., level-equations are simultaneously
estimated using differenced lagged regressors as instruments. In this way, apart from
controlling for individual heterogeneity, variations between firms could partially be retained.
One of the motivations for using panel data is to control for unobservable firm heterogeneity.
It is also difficult to establish exogeneity between the regressors and error term especially in
company financial data. Thus, owing to potential endogeneity, the direction of causality
between variables might be ambiguous. Consequently, using the contemporaneous
observations for both dependent variable and its determinants may cause spurious results.
We control for this problem by employing a GMM technique.
Optimal Debt Ownership Structure and the Speed of Adjustment
Due to adjustment costs firms may not be able to adjust their financing structure promptly
and a delay is highly likely. We investigate this possibility by adopting a partial adjustment
process. We apply the following procedure to search for the existence of target debt
ownership structure. Assuming that the desired level of*
itDEBTBANK is determined by
several explanatory variables, then:,
1
*
k
itkitkit xDEBTBANK (2)
where ωit is the disturbance term which is serially correlated with mean zero and possibly
heteroscedastic, and ψk's are parameters to be estimated that are common to all firms. The
model assumes that firms adjust their current ratios, BANK DEBTit, with the degree of
adjustment coefficient "θ" to attain the target debt ownership structure.

11
)( 1
*
1 itititit DEBTBANKDEBTBANKDEBTBANKDEBTBANK (3)
A unit of θ suggests that the actual and desired changes in bank-debt ratio are equal and
firms adjust to their target ratio without any delay (θ = 1). This is possible when transaction
costs are negligible. However, θ = 0 implies no adjustment due to unaffordable transaction
costs and firms will set their current bank debt-ratios to its past value. Thus, θ is inversely
proportional to transaction costs. Substituting (2) into (3), we obtain the following equation:
t
k
kitkitit xDEBTBANKDEBTBANK1
1)1( (4)
This adjustment model (equation 4) assumes that the adjustment coefficient θ lies between
zero and unity because of the presence of transaction costs. If the cost of being in
disequilibrium is higher (lower) than the cost of adjustment, θ tends to unity (zero).
V. EMPIRICAL RESULTS
We estimate the above models using three different dependent variables: (a) total bank-debt
ratio (b) short-term bank-debt ratio, and (c) long-term bank-debt ratio (payable after one
year). We also split the UK data into two sub-sample periods: 1969-2000 and 1983-2000.
The comparison of results between the UK and Germany is primarily based on the model of
total bank-debt ratio.
5.1 Dynamic Debt Ownership Structure
The GMM results in panel A of Tables II to V reveal that our model captures the dynamics in
firms’ debt ownership decisions. The significant but less than unit coefficients of the lagged
dependent variables (LDV) imply costly and non-instantaneous adjustment process [8, 9].
The GMM estimates show a common pattern in the adjustment speed [θ=1-(coefficient of
LDV)] for both countries. The adjustment process is quicker for shorter-term bank debt. The
adjustment coefficients of total bank-debt ratio indicate that the UK firms are quicker in
adjusting the debt ownership structure towards their desired level than their German counter
parts. The slower adjustment by German firms could be because of relatively high
adjustment cost or the cost of being off the target is insignificant. Overall, the results show
that firms in these countries attempt to trade-off between the cost of being off-target and the
cost of adjustment.
“TAKE IN TABLE II, TABLE III, TABLE IV AND TABLE V”

12
Liquidation and renegotiation hypothesis
Debt Maturity: As predicted by the liquidation and renegotiation hypothesis the relationship
between debt maturity and bank-debt ratio is negative in both countries. It confirms that firms
tend to borrow short-term loans from banking system.
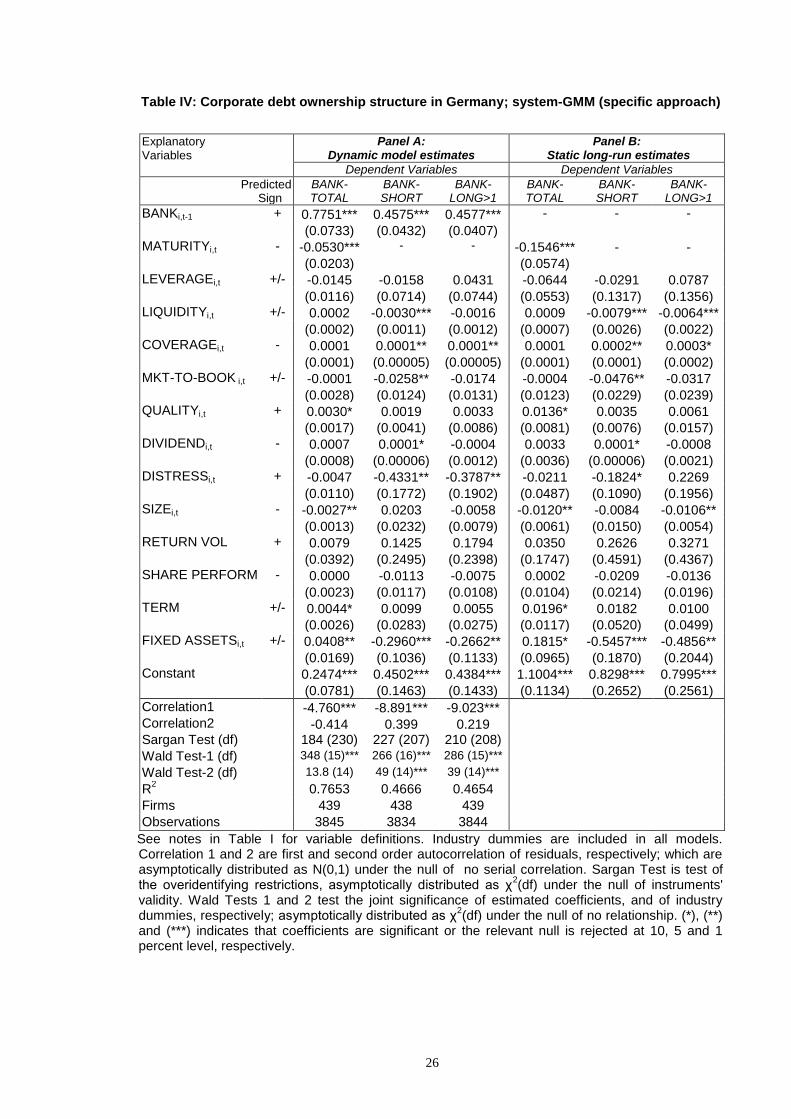
Leverage: In the case of Germany only the lagged leverage in the short-run model is
significantly negatively associated with the bank-debt ratio (BANK-TOTAL) although the
coefficients in other cases are negative. This offers partial support to Drukarcyk et al.'s.
(1985) view that debt-ratio is one of the most important factors in Germany to get bank loan.
Considering the leverage as a proxy of financial distress, these results are not surprising in
terms of prevailing German bankruptcy rules, which allow for liquidation rather than
reorganisation. These findings support Diamond's view that firms with high debt ratios may
restrict their bank borrowing to avoid liquidation and frequent renegotiations. In the UK, the
relationship between leverage and BANK-TOTAL is significant and positive in all cases [10].
This direct association is in line with Hoshi et al. (1993) who imply that highly-levered firms
use private debt.
Liquidity: The estimates show that bank debt is inversely associated with firms' liquidity in
the UK (Tables III and V; and especially for the period 1969-2000). Hence, it seems that
liquid UK firms avoid borrowing from banks possibly due to hold-up problems or monitoring
costs, which are not specific to arm's-length public debt. It is also possible that higher
internal liquidity reduces the need for short-term loans which primarily come from banks. On
the other hand, the liquidity factor does not seem to have any significant impact on German
firms’ debt-mix choice.
Interest Coverage: The interest coverage ratio does not affect firms' debt ownership
decisions in Germany at any meaningful level [11]. It is possible that firms in Germany have
very high coverage ratio (Table I) and hence this factor is not considered as a significant risk
factor by the managers. In the UK, the coefficient estimate of interest coverage is significant
and negative only for the static long-run results (Table V, panel B). This finding lends some
support to Chemmanur and Fulghieri (1994) who argue that firms with low probability of
financial distress prefer to raise public debt to reduce interest expenses.
Overall, the ‘liquidation and renegotiation’ hypothesis receives some support from both the
UK and Germany.

13
Moral Hazard and Adverse Selection hypothesis
Growth Opportunities: Estimates show that there is no meaningful relation between growth
opportunities (MKT-TO-BOOK) and the use of bank debt (BANK-TOTAL) in Germany. It thus
seems that costs related to information asymmetries, agency conflicts and monitoring, and
hold-up problems are not widespread in this country. This is possibly due to their corporate
governance structure that largely mitigates agency and asymmetric information problems
[12]. On the other hand, except for the 1969-2000 (Table V), an inverse relation between
bank debt ratio and MKT-TO-BOOK is found in the UK [13]. This negative relation implies
that banks focus their lending on tangible assets of the firm but not on the firms with
intangible growth opportunities (supply side). Alternatively, firms with profitable growth
opportunities restrict their bank borrowings due to potential hold-up problems in the UK
(demand side) [14].
Firm Quality: The difference-GMM estimates in Tables II and III reveal that the impact of firm
quality on debt replacement decisions is not substantial in any country. The insignificant
effect of firm quality in shaping debt ownership structure may be due to their existing close
relation with the banks and their borrowing tradition for German firms. However, the system-
GMM estimates in Tables IV and V depict a different picture. Firm quality tends to influence
BANK-TOTAL significantly and positively in both countries. This observed positive relation is
possible if the undervalued firms with better future prospects borrow from better informed
private lenders (banks). This largely mitigates the information asymmetry problem and firms
are revalued to their equilibrium levels.
Dividend Payout Ratio: The association between BANK-TOTAL and dividend payout ratios is
country-dependent. It is significantly negative in the UK (Table III, 1969-2000) and
significantly positive in Germany (Table II). This implies that firms in the UK avoid the
adverse consequences of issuing public debt when they cut dividend payments. Hence, the
information content of paying dividends with respect to firms' growth prospects and future
cash stream seems to be prevalent in the UK. On the other hand, the positive relation in
Germany remains a puzzle where banks are both financiers and shareholders. However,
why firms pay dividends (essentially to the banks themselves) and then borrow from the
banks remains a puzzle.
Earnings Volatility: The system-GMM results show that the earnings volatility (DISTRESS)
has a significant and negative effect on BANK-TOTAL in the cases of UK firms (Table V,
1969-2000) while it remains insignificant in Germany. The finding that UK firms with high
volatile earnings issue public debt contradicts the predictions of the adverse selection

14
hypothesis and the findings of Johnson (1997). However, it is possible that firms with high
volatile earnings do not want close monitoring and minimise bank borrowings. Unlike the
German firms, because of well developed public debt market in the UK, British firms may
have the luxury of choosing their lenders.
Overall, the discussion above offers mixed support to the moral hazard and adverse
selection hypothesis. It receives strong support from the UK but not from Germany. The
evidence suggests that corporate governance, the level of development of public debt
market and the degree of information asymmetry affect the choice of the lender.
Flotation costs hypothesis
Firm Size: Consistent with the evidence in the literature our results for both Germany and the
UK (Table III) confirm a significant negative relation between firm size and bank loan. Hence,
the hypothesis that small firms avoid issuing public debt due to high flotation costs receives
strong support [15]. Furthermore, the argument that small firms are immature, riskier, and
have relatively high growth options, thus, tend not to borrow from public debt market are also
confirmed.
The control factors
The estimates show that the association of bank-debt ratio with stock return volatility varies
across countries. It is surprising that UK firms with low volatile stock prices are more likely to
issue bank debt. In Germany, however, BANK-TOTAL is not influenced by return volatility.
An increase in share price (change in stock price) may represent firms' quality and convince
the public debt-holders about their future prospects. However, the association of bank-debt
ratio with share performance is insignificant in Germany. The expected inverse relation is
found for British firms only (Table V). Furthermore, the estimates show that the association
of bank debt use (BANK-TOTAL) with term structure of interest rates is country-dependent.
In Germany, it has a significant positive coefficient while it is negative in the UK. Hence, one
can conclude that when long-term interest rates are relatively higher, UK firms are reluctant
to raise bank debt while German firms tend to issue bank debt. Similarly, the results with
respect to the asset collateral (FIXED-ASSETS) are also country-dependent. The positive
impact of collateral on choosing bank debt use in Germany could be due to banks'
requirements for collateral while lending [16]. The direction of the association of collateral
with BANK-TOTAL in the UK is the opposite of what we found in Germany.
In general, estimates above provide strong empirical support to the liquidation and
reorganisation hypothesis and the flotation costs hypotheses in both the UK and Germany.
15
However, the moral hazard and adverse selection hypothesis receives support only from the
UK evidence.
5.2 Maturity Structure of Bank Debt
We replaced the dependent variable total bank-debt ratio (BANK-TOTAL) by short-term and
long-term bank debt ratios and re-estimated the models [17]. For Germany, the results show
that the choice of dependent variable is important for some explanatory variables. The
association of liquidity with BANK-SHORT and BANK-LONG>1 is significant and negative in
all estimates, which was not the case when the dependent variable was BANK-TOTAL.
Similarly, the coefficient estimate of COVERAGE is significant and positive when the
dependent variable is short-term or long-term bank debt ratio. The coefficient on market-to-
book ratio gets significant with a negative sign (Table IV, BANK-SHORT). Another notable
finding is that size is negatively correlated with BANK-LONG>1 but positively correlated with
BANK-SHORT. It thus seems that larger German firms tend to prefer bank debt with a
shorter maturity. An unexpected negative impact of earnings volatility on short and log-term
bank debt use is found (Table IV, DISTRESS variable). Another unexpected finding is the
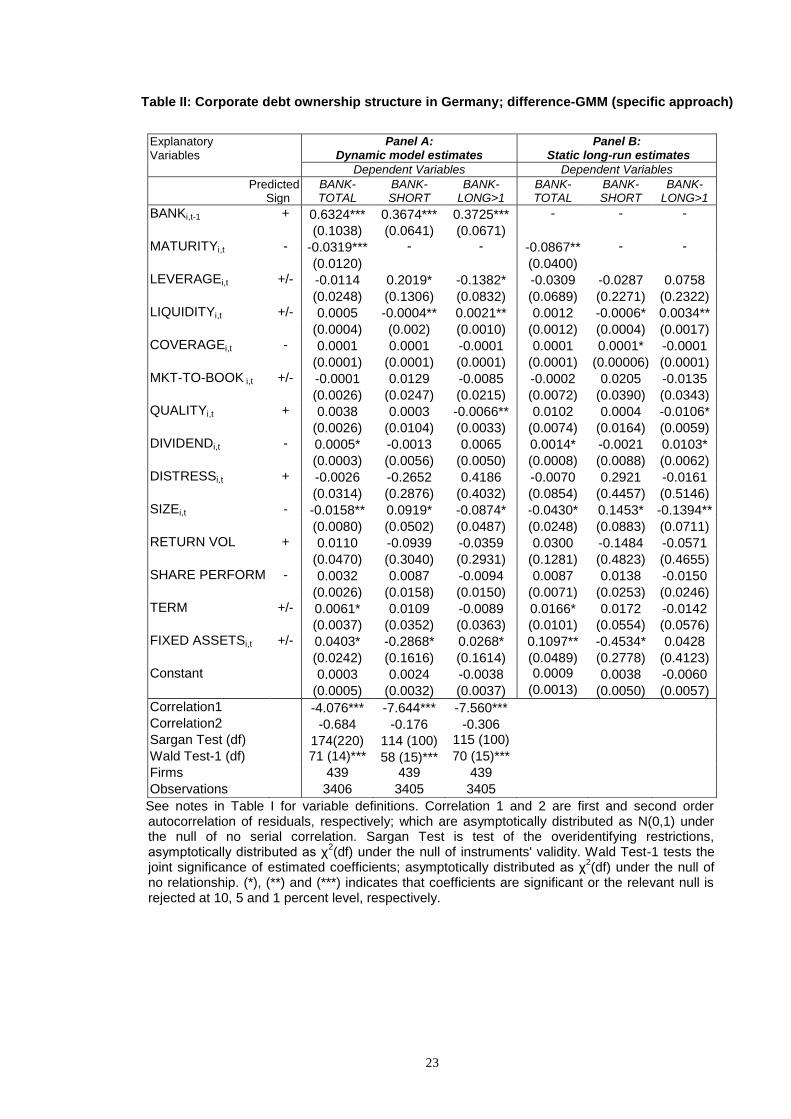
significant and negative correlation between firm quality and BANK-LONG>1 (Table II).
Finally, fixed-assets ratio variable exerts a significant and negative influence on both BANK-
SHORT and BANK-LONG>1.
The estimates from the UK reveal that the results are sensitive to the choice of dependent
variable. The associations of leverage with BANK-SHORT and BANK-TOTAL are the same
for the short-term results (panel A) but they differ for static long-term results (panel B). All
three alternative depend variables produce the same type of association with the market-to-
book ratio with respect to the difference-GMM estimates. However, based on the system-
GMM estimates in Table V, the expected negative influence of future growth opportunities is
consistently prevalent only for the dependent variable BANK-SHORT. Another result
sensitive to dependent-variable choice is due to the firm quality variable, which is significant
and positive for BANK-LONG>1 only (Table III). A rather unanticipated result is the positive
relationship between payout ratio and BANK-SHORT (Table III). As expected, a direct and
significant relation between DISTRESS and BANK-SHORT is found which was insignificant
for the dependent variable BANK-TOTAL. This finding implies that firms with more volatile
earnings tend to prefer shorter-term bank loan. Moreover, an interesting finding is that firm
size is positively correlated with BANK-LONG>1 but negatively correlated with BANK-
SHORT, which is the opposite case in Germany. Hence, larger British firms seem to prefer
bank loan with a longer maturity. Using the short-term and long-term bank debt ratio as
16
dependent variables does not produce any significant coefficient estimates on return
volatility in Table III. However, the results in Table V for this explanatory variable with
respect to the same dependent variables confirm the original findings. There is no any
notable difference regarding the liquidity, fixed-assets ratio, term structure of interest rates,
share price performance and interest coverage variables.
Overall, the estimates for the UK seem to be more robust than for Germany. This shows that
the validity of the theories of debt ownership developed from the US market are more
sustainable in the UK than in Germany indicating the prominent role of the financial structure
of the country.
VI. CONCLUSION
The factors affecting the corporate debt ownership structure in Germany and the UK are
analysed in the context of three hypotheses: (a) liquidation and renegotiation, (b) moral
hazard and adverse selection, and (c) flotation costs. The results suggest that the degree
and type of association of debt ownership structure and firm specific factors are dependent
on country’s financial and corporate governance traditions in which they operate. Several
interesting findings emerge.
First, the evidence from both countries indicates that firms have a target debt ownership
structure and the UK firms adjust their debt ownership structure more quickly. Second, the
results from the UK support the predictions of the renegotiation and liquidation hypotheses.
Maturity of debt, interest coverage, liquidity and leverage ratios always inversely affect the
use of bank debt in at least one country. However, the findings based on the above variables
reveal some country differences. For instance, leverage has a positive impact on bank debt
use in the UK but it has an inverse effect in Germany; while liquidity and bank-debt ratio are
negatively associated in the UK but nor related in Germany. Third, we find an inverse
relation between the use of bank-debt and growth opportunities of the British firms. This
relationship is statistically insignificant in Germany, which may suggest that agency conflicts
and information asymmetries can be mitigated under German corporate governance system.
Fourth, the moral hazard and adverse selection hypothesis receives strong support in the
UK but not in Germany. Firm quality and bank-debt use are strongly and positively correlated
in the UK while the degree of this association is not substantial in Germany. Hence, the
concerns about obtaining a better-informed lender to mitigate adverse selection problems
are not that significant for German firms but very important for the UK firms. In addition, UK

17
non-dividend paying firms or firms cutting their dividends avoid issuing public debt; but the
case is opposite in Germany. Similarly, earnings volatility does not affect debt decisions of
German firms but it positively affects bank-debt ratio of the UK firms. Fifth, confirming the
predictions of the flotation cost hypothesis the evidence suggests that the smaller firms
prefer bank loan against public debt in both countries. Finally, the estimates reveal the
importance of several market related control factors in the model. Stock return volatility and
positive performance in share prices reduce the amount of bank debt used by UK firms,
relatively high (low) long-term interest rates inspires the German (British) managers to
borrow from bank. Overall, the findings confirm that the debt ownership decision of listed
firms is not only the result of their own characteristics but also the outcome of legal and
financial environment and corporate governance traditions in which they operate.

18
ENDNOTES 1. The notable exceptions are Anderson and Makhija (1999) and Hoshi et al. (1993) on Japanese data, Saà-Requejo (1996) on Spanish data and Esho et al. (2001) on international data. 2. An alternative measure of leverage we use is the ratio of book value of total debt to market value of equity plus book value of total debt. 3. Carey et al. (1993) note that US firms with takeover plans rely on private placement to protect the confidentiality of their transactions. 4. Houston and James (1996) document that high-growth US firms relying on a single bank and having no public debt issue have relatively low bank debt. This implies the presence of the hold-up problem and highlights the importance of diversification of debt financing sources for such firms. 5. Alternative measures of growth opportunities used are depreciation expense to total assets (Krishnaswami et al. 1999) and the ratio of intangible assets to total assets. 6. Datta et al. (1999) provide empirical support to Diamond's reputation hypothesis. They find the length of firm-bank relationship significantly reduces the at-issue yield spread, thus, the cost of external debt. 7. We also examine the long-run relation between the dependent variable and the regressors. In
equation (1) the long-run coefficients of the regressor X is ( + )/(1- ) while the short-run coefficients
for the current and lagged values of X are and (not reported in the tables), respectively. The parameters in the model are obtained using a dynamic estimation of equation (1). See Antoniou et al. (2006). 8. As expected, difference-GMM method produces lower LDV coefficients than system-GMM (Blundell and Bond, 1998). 9. Cantillo and Wright (2000), and Hoshi et al. (1993) also report significantly positive estimated coefficients of LDV. 10. The results are based on book-leverage. The use of market-leverage does not qualitatively alter the results. 11. Leverage could also serve as a proxy for financial distress. Thus, we re-estimated the model excluding leverage but the results are qualitatively similar. 12. Easterwood and Kadapakkam (1991), Esho et al. (2001), Hadlock and James (2002) and Hoshi et al. (1993) also report insignificant coefficient of MKT-TO-BOOK. 13. The studies reporting significantly negative MKT-TO-BOOK coefficient include Houston and James (1996) for firms with single bank relation and MacKie-Mason (1990). 14. Qualitatively the results remain the same with alternative measures of growth opportunities (depreciation ratio and intangible-assets ratio). 15. When the firm size is measured by Ln(Total Sales) or Ln(Total Assets), qualitatively the results remain the same. 16.
Esho et al. (2001), among others, report direct impact of collateral on bank debt choice.
17. In this case, the maturity variable is dropped from the model due to its apparent correlation with the dependent variable.
19
REFERENCES Anderson, C.W. and Makhija, A.K. (1999), Deregulation, disintermediation and agency costs of debt: evidence from Japan, Journal of Financial Economics 51, 309-339. Antoniou, A., Guney, Y. and Paudyal K.N. (2006), Determinants of corporate debt maturity structure: evidence from France, Germany and UK, European Financial Management, forthcoming. Arellano, M. and Bond, S. (1991), Some tests of specification for panel data, Review of Economic Studies 58, 277-297. Berger, A. and Udell, A. (1995), Relationship lending and lines of credit in small firm finance, Journal of Business 68, 351-381. Berlin, M. and Loeys, J. (1988), Bond covenants and delegated monitoring, Journal of Finance 43, 397-412. Blackwell, D.W and Kidwell (1988), An investigation of cost differences between public sales and private placements of debt, Journal of Financial Economics 22, 253-278. Blundell, R.W. and Bond, S.R. (1998), Initial conditions and moment restrictions in dynamic panel data models, Journal of Econometrics 87, 115-143. Bolton, P. and Freixas, X. (2000), Equity, bonds, and bank debt: capital structure and financial market equilibrium under asymmetric information, Journal of Political Economy 108, 324-351. Bond, S., Elston, J. A., Mairesse, J. and Mulkay, B. (2003), Financial factors and investment in Belgium, France, Germany and the United Kingdom: a comparison using company panel data, Review of Economics and Statistics 85, 153-165. Boot, A., Thakor, A.V. and Udell, G.F. (1991), Secured lending and default risk: equilibrium analysis and policy implications and empirical results, Economic Journal 101, 458-472. Cantillo, M. and Wright, J. (2000), How do firms choose their lenders? An empirical investigation, Review of Financial Studies 13, 155-189. Carey, M., Prowse, S., Rea, J. and Udell, G. (1993), The economics of the private placement market, Staff Paper #166, Board of Governors of the Federal Reserve System. Chemmanur, T.J. and Fulghieri, P. (1994), Reputation, renegotiation and the choice between bank loans and publicly traded debt, Review of Financial Studies 7, 475-506. Coase, R.H. (1937), The nature of the firm, Economica 4, 386-405. Datta, S., Iskandar-Datta, M. and Patel, A. (1999), Bank monitoring and the pricing of corporate public debt, Journal of Financial Economics 51, 435-449. Datta, S., Iskandar-Datta, M. and Patel, A. (2000), Some evidence on the uniqueness of initial public debt offerings, Journal of Finance 55, 715-743. Diamond, D.W. (1984), Financial intermediation and delegated monitoring, Review of Economic Studies 51, 393-414.

20
Diamond, D.W. (1991), Monitoring and reputation: the choice between bank loans and directly placed debt, Journal of Political Economy 99, 689-721. Diamond, D.W. (1993), Seniority and maturity of debt contracts, Journal of Financial Economics 33, 341-368. Drukarcyk, J., Duttle, J. and Rieger, R. (1985), Mobiliarsicherherheiten, Arten, Verbeitung, Wirksamkeit, Koln: Bundesanzeiger. Easterwood, J.C. and Kadapakkam, P.R. (1991), The role of private and public debt in corporate capital structures, Financial Management 20, 49-57. Edwards, J. and Fischer, K. (1994), Banks, finance and investment in Germany, Centre for Economic Policy Research, Cambridge University Press. Esho, N., Lam, Y. and Sharpe, I.G. (2001), Choice of financing source in international debt markets, Journal of Financial Intermediation 10, 276-305. Fama, E.F. (1985), What is different about banks?, Journal of Monetary Economics 15, 29-37. Hadlock, C.J. and James, C.M. (2002), Do banks provide financial slack?, Journal of Finance 57, 1383-1419. Hooks, L. and Opler, T. (1993), The determinants of corporate bank borrowing, Financial Industry Studies Working Paper, No 1-93, Federal Reserve Bank of Dallas. Hoshi, T., Kashyap, A. and Scharfstein, D. (1993), The choice between public and private debt: an analysis of post-deregulation corporate financing in Japan, NBER Working Paper #4421. Houston, J.F. and James, C.M. (1996), Bank information monopolies and the mix of private and public debt claims, Journal of Finance 51, 1863-1889. James, C. (1987), Some evidence on the uniqueness of bank loans, Journal of Financial Economics 19, 217-235. James, C. (1996), Bank debt restructurings and the composition of exchange offers in financial distress, Journal of Finance 51, 711-727. Johnson, A. S. (1997), An empirical analysis of the determinants of corporate debt ownership structure, Journal of Financial and Quantitative Analysis 32, 47-69. Kanatas, G. and Qi, J. (2001), Imperfect competition, agency, and financing decisions, Journal of Business, 307-338. Kashyap, A., Stein, J. and Wilcox, D. (1993), Monetary policy and credit conditions: evidence from the composition of external finance, American Economic Review 83, 78-98. Krishnaswami, S., Spindt, P.A. and Subramaniam, V. (1999), Information asymmetry, monitoring, and the placement structure of corporate debt, Journal of Financial Economics 51, 407-434.

21
Low, S.H., Glorfeld, L., Hearth, D. and Rimbey, J.N. (2001), The link between bank monitoring and corporate dividend policy: the case of dividend omissions, Journal of Banking and Finance 25, 2069-2087. MacKie-Mason, J.K. (1990), Do firms care who provides their financing? in R.G. Hubbard (ed.), Asymmetric Information, Corporate Finance and Investment, University of Chicago Press, 63-103. Mayer, C.P. (1994), The assessment: money and banking: theory and evidence, Oxford Review of Economic Policy 10, 1-13. Mayer, C.P. and Alexander, I. (1990), Banks and securities markets: corporate financing in Germany and the United Kingdom, Journal of Japanese and International Economies 4, 450-475. Miguel, A. and Pindado, J. (2001), Determinants of capital structure: new evidence from Spanish panel data, Journal of Corporate Finance 7, 77-99. Modigliani, F. and Perotti, E. (2000), Security markets versus bank finance: legal enforcement and investors' protection, International Review of Finance 1, 81-96. Oliner, S.D. and Rudebusch, G.D. (1996), A comment on monetary policy and credit conditions: evidence from the composition of external finance, American Economic Review 86, 300-309. Saà-Requejo, J. (1996), Financing decisions: lessons from the Spanish experience, Financial Management 25, 44-56. Schuhmacher, J. (1998), Choice of maturity and financial intermediation, mimeo, University of Bonn. Schimdt, R.H., Hackethal, A. and Tyrell, M. (1999), Disintermediation and the role of banks in Europe: an international comparison, Journal of Financial Intermediation 8, 36-67. Stiglitz, J.E. and Weiss, A. (1981), Credit rationing in markets with imperfect information, American Economic Review 71, 393-410. Stohs, M.H. and Mauer, D.C. (1996), The determinants of corporate debt maturity structure, Journal of Business 69, 279-312. Sy, A.N.R. (1999), Managerial entrenchment and the choice of debt financing, IMF Working Paper, WP/99/94. Yosha, O. (1995), Information disclosure costs and the choice of financing source, Journal of Financial Intermediation 4, 3-20.

22
Table I: Descriptive Statistics
BANK-TOTAL is the ratio of total bank debt to total debt. BANK-SHORT is bank debt payable within one year; BANK-LONG>1 is bank debt payable after one year; BANK-LONG>5 is bank debt payable after 5 years; all scaled by total debt. MATURITY is the ratio of debt that matures in more than one year to total debt. LEVERAGE1 is the ratio of book value of total debt to book value of total assets. LEVERAGE2 is the ratio of book value of total debt to market value of equity plus book value of total debt. MKT-TO-BOOK is the ratio of book value of total assets less book value of equity plus market value of equity to book value of total assets, matched to the month of firms' fiscal year-end. DEPRECIATION is the ratio of depreciation expenses to total assets. INTANGIBLES is the ratio of intangible assets to total assets. SIZE1 (SIZE2) is the natural logarithm of total sales (total assets). SIZE3 is the natural logarithm of total assets minus book value of equity plus market value of equity. LIQUIDITY is the ratio of current assets to current liabilities. QUALITY is the difference between earnings per share in years (t+1) and (t) divided by share price in (t), matched to the month of firms' fiscal year-end. DIVIDEND is the dividend payout ratio; dividends to net earnings. PROFITABILITY is the ratio of EBITD to total assets. FIXED-ASSETS is the ratio of net tangible assets to total assets. COVERAGE is the ratio of EBITD to total interest expense. DISTRESS is the ratio of the sum of intangible assets and the difference between the standard deviation and expected value of EBIT to total assets (financial distress costs). RETURN VOL is the stock return volatility measured by the standard deviation of weekly stock returns over the previous year (return volatility), matched to the month of firms' fiscal year-end. SHARE PERF is the first difference of log of annual share prices (share performance), with a six-month lag, matched to the month of firms' fiscal year-end. TERM is term structure of interest rates measured as the difference between the month-end yields on long-term (10 years or more) government bond and three-months treasury-bills, with a six-month lag, matched to the month of firms' fiscal year-end.
Germany UK
Variables Mean Median SDev Min Max Mean Median SDev Min Max
BANK-TOTAL 0.945 0.988 0.152 0.000 1.000 0.605 0.694 0.362 0.000 1.000
BANK-SHORT 0.454 0.409 0.311 0.000 1.000 0.463 0.416 0.357 0.000 1.000
BANK-LONG>1 0.494 0.509 0.314 0.000 1.000 0.140 0.000 0.257 0.000 1.000
BANK-LONG>5 0.161 0.080 0.205 0.000 1.000 - - - - -
MATURITY 0.536 0.575 0.310 0.000 1.000 0.455 0.469 0.339 0.000 1.000
LEVERAGE1 0.198 0.151 0.190 0.000 1.000 0.168 0.153 0.140 0.000 0.999
LEVERAGE2 0.248 0.175 0.246 0.000 0.989 0.252 0.201 0.222 0.000 0.998
MKT-TO-BOOK 1.895 1.301 3.557 0.282 90.55 1.383 1.081 1.651 0.121 98.67
DEPRECIATION 0.060 0.053 0.051 0.000 0.967 0.036 0.030 0.032 0.000 1.863
INTANGIBLES 0.028 0.005 0.059 0.000 0.519 0.036 0.000 0.129 0.000 14.97
SIZE1 12.39 12.428 2.296 1.231 18.76 9.102 8.920 1.868 0.016 16.22
SIZE2 12.30 12.19 2.006 4.534 19.13 8.880 8.614 1.823 1.502 16.67
SIZE3 12.75 12.58 1.883 7.482 19.96 9.067 8.789 1.878 3.478 16.78
LIQUIDITY 4.349 1.717 27.91 0.001 82.43 1.680 1.460 1.708 0.016 125.2
QUALITY 0.016 0.000 1.359 -64.5 50.53 0.010 0.006 0.325 -41.7 26.79
DIVIDEND 0.297 0.013 6.13 -125 191.7 0.399 0.366 3.239 -94.3 98.6
PROFITABILITY 0.117 0.117 0.132 -2.92 1.742 0.125 0.129 0.135 -6.89 1.011
FIXED-ASSETS 0.332 0.301 0.208 0.000 0.999 0.349 0.313 0.199 0.000 1.156
COVERAGE 35.45 6.273 293.1 -3778 8936 46.70 7.50 438.4 -8074 37227
DISTRESS 0.049 0.012 0.201 -0.91 3.989 0.136 0.0001 0.779 -3.34 36.15
RETURN VOL 0.042 0.038 0.025 0.000 0.468 0.050 0.044 0.029 0.000 0.681
SHARE PERF 0.008 0.000 0.333 -2.23 2.187 0.056 0.072 0.458 -4.18 3.268
23
Table II: Corporate debt ownership structure in Germany; difference-GMM (specific approach)
See notes in Table I for variable definitions. Correlation 1 and 2 are first and second order autocorrelation of residuals, respectively; which are asymptotically distributed as N(0,1) under the null of no serial correlation. Sargan Test is test of the overidentifying restrictions, asymptotically distributed as χ
2(df) under the null of instruments' validity. Wald Test-1 tests the
joint significance of estimated coefficients; asymptotically distributed as χ2(df) under the null of
no relationship. (*), (**) and (***) indicates that coefficients are significant or the relevant null is rejected at 10, 5 and 1 percent level, respectively.
Explanatory Variables
Panel A: Dynamic model estimates
Panel B: Static long-run estimates
Dependent Variables Dependent Variables
Predicted Sign
BANK-TOTAL
BANK-SHORT
BANK-LONG>1
BANK-TOTAL
BANK-SHORT
BANK-LONG>1
BANKi,t-1 + 0.6324*** 0.3674*** 0.3725*** - - -
(0.1038) (0.0641) (0.0671)
MATURITYi,t - -0.0319*** - - -0.0867** - -
(0.0120) (0.0400)
LEVERAGEi,t +/- -0.0114 0.2019* -0.1382* -0.0309 -0.0287 0.0758 (0.0248) (0.1306) (0.0832) (0.0689) (0.2271) (0.2322) LIQUIDITYi,t +/- 0.0005 -0.0004** 0.0021** 0.0012 -0.0006* 0.0034** (0.0004) (0.002) (0.0010) (0.0012) (0.0004) (0.0017) COVERAGEi,t - 0.0001 0.0001 -0.0001 0.0001 0.0001* -0.0001
(0.0001) (0.0001) (0.0001) (0.0001) (0.00006) (0.0001) MKT-TO-BOOK i,t +/- -0.0001 0.0129 -0.0085 -0.0002 0.0205 -0.0135 (0.0026) (0.0247) (0.0215) (0.0072) (0.0390) (0.0343) QUALITYi,t + 0.0038 0.0003 -0.0066** 0.0102 0.0004 -0.0106* (0.0026) (0.0104) (0.0033) (0.0074) (0.0164) (0.0059) DIVIDENDi,t - 0.0005* -0.0013 0.0065 0.0014* -0.0021 0.0103* (0.0003) (0.0056) (0.0050) (0.0008) (0.0088) (0.0062) DISTRESSi,t + -0.0026 -0.2652 0.4186 -0.0070 0.2921 -0.0161
(0.0314) (0.2876) (0.4032) (0.0854) (0.4457) (0.5146) SIZEi,t - -0.0158** 0.0919* -0.0874* -0.0430* 0.1453* -0.1394** (0.0080) (0.0502) (0.0487) (0.0248) (0.0883) (0.0711) RETURN VOL + 0.0110 -0.0939 -0.0359 0.0300 -0.1484 -0.0571 (0.0470) (0.3040) (0.2931) (0.1281) (0.4823) (0.4655) SHARE PERFORM - 0.0032 0.0087 -0.0094 0.0087 0.0138 -0.0150 (0.0026) (0.0158) (0.0150) (0.0071) (0.0253) (0.0246) TERM +/- 0.0061* 0.0109 -0.0089 0.0166* 0.0172 -0.0142
(0.0037) (0.0352) (0.0363) (0.0101) (0.0554) (0.0576) FIXED ASSETSi,t +/- 0.0403* -0.2868* 0.0268* 0.1097** -0.4534* 0.0428 (0.0242) (0.1616) (0.1614) (0.0489) (0.2778) (0.4123) Constant 0.0003 0.0024 -0.0038 0.0009 0.0038 -0.0060 (0.0005) (0.0032) (0.0037) (0.0013) (0.0050) (0.0057)
Correlation1 -4.076*** -7.644*** -7.560***
Correlation2 -0.684 -0.176 -0.306
Sargan Test (df) 174(220) 114 (100) 115 (100)
Wald Test-1 (df) 71 (14)*** 58 (15)*** 70 (15)***
Firms 439 439 439
Observations 3406 3405 3405

24
Table III: Corporate debt ownership structure in the UK. Panel A: difference-GMM (specific approach)
Explanatory Variables
Predicted Sign
Dependent Variables: 1969-2000 Dependent Variables: 1983-2000
BANK-TOTAL
BANK-SHORT
BANK-LONG>1
BANK-TOTAL
BANK-SHORT
BANK-LONG>1
BANKi,t-1 + 0.6250*** 0.5036*** 0.6844*** 0.4244*** 0.4894*** 0.5292*** (0.0389) (0.0350) (0.0395) (0.0377) (0.0349) (0.0343) MATURITYi,t - -0.6682*** - - -0.1895*** - -
(0.0731) (0.0513)
LEVERAGEi,t +/- 0.4895*** 0.5373*** 0.0569 0.7019*** 0.5072*** 0.1040 (0.1551) (0.1778) (0.0544) (0.1322) (0.1446) (0.0773) LIQUIDITYi,t +/- -0.0205* -0.0699*** 0.0047 0.0074 -0.0367** 0.0151 (0.0120) (0.0231) (0.0128) (0.0121) (0.0186) (0.0161) COVERAGEi,t - 0.0001 0.0001 0.0001 0.0001 0.0002 0.0001
(0.0001) (0.0001) (0.0001) (0.0001) (0.0002) (0.0001) MKT-TO-BOOK i,t - -0.0147* -0.0252** -0.0038* -0.0189* -0.0185** -0.0064* (0.0088) (0.0113) (0.0022) (0.0106) (0.0087) (0.0035) QUALITYi,t + 0.0285 0.0114 0.0242** 0.0104 -0.0061 0.0085** (0.0361) (0.0188) (0.0123) (0.0116) (0.0051) (0.0042) DIVIDENDi,t - -0.0012** 0.0015 -0.0014 0.0048 0.0096** 0.0022 (0.0006) (0.0046) (0.0020) (0.0040) (0.0048) (0.0026) DISTRESSi,t + -0.0020 0.0142** -0.0043 0.0095 0.0136** 0.0139
(0.0102) (0.0063) (0.0083) (0.0262) (0.0068) (0.0142) SIZEi,t - -0.0366* -0.0571*** 0.0569*** -0.0332** -0.0502*** 0.0205* (0.0202) (0.0158) (0.0215) (0.0169) (0.0186) (0.0122) RETURN VOL + -0.1000* -0.0439 -0.0061 -0.1751* -0.0557 -0.0556 (0.0610) (0.1032) (0.0780) (0.1054) (0.1226) (0.0995) SHARE PERFORM - -0.0030 -0.0047** -0.0029* -0.0033 -0.0018 -0.0008 (0.0052) (0.0024) (0.0017) (0.0066) (0.0065) (0.0051) TERM +/- -0.0111* -0.0139** -0.0118** -0.0026* 0.0031 0.0070
(0.0067) (0.0070) (0.0054) (0.0015) (0.0137) (0.0105) FIXED ASSETSi,t +/- -0.1817** -0.3810*** -0.0842 -0.0295 -0.0107 0.0509 (0.0092) (0.1248) (0.0981) (0.1279) (0.1296) (0.0923) Constant 0.0034*** -0.0011 0.0037*** -0.0033 -0.0032** -0.0007 (0.0008) (0.0008) (0.0005) (0.0021) (0.0015) (0.0011)
Correlation1 -13.93*** -15.22*** -15.01*** -12.61*** -14.41*** -13.93*** Correlation2 1.174 1.618 1.347 1.249 1.478 1.336 Sargan Test (df) 241 (292) 260 (267) 257 (266) 254 (285) 282 (257) 255 (259)
Wald Test-1 (df) 1286 (19)*** 432 (16)*** 616 (17)*** 298 (15)*** 273 (16)*** 297(14)***
Firms 1726 1726 1732 1514 1514 1523
Observations 23916 23876 24465 13605 13583 14138
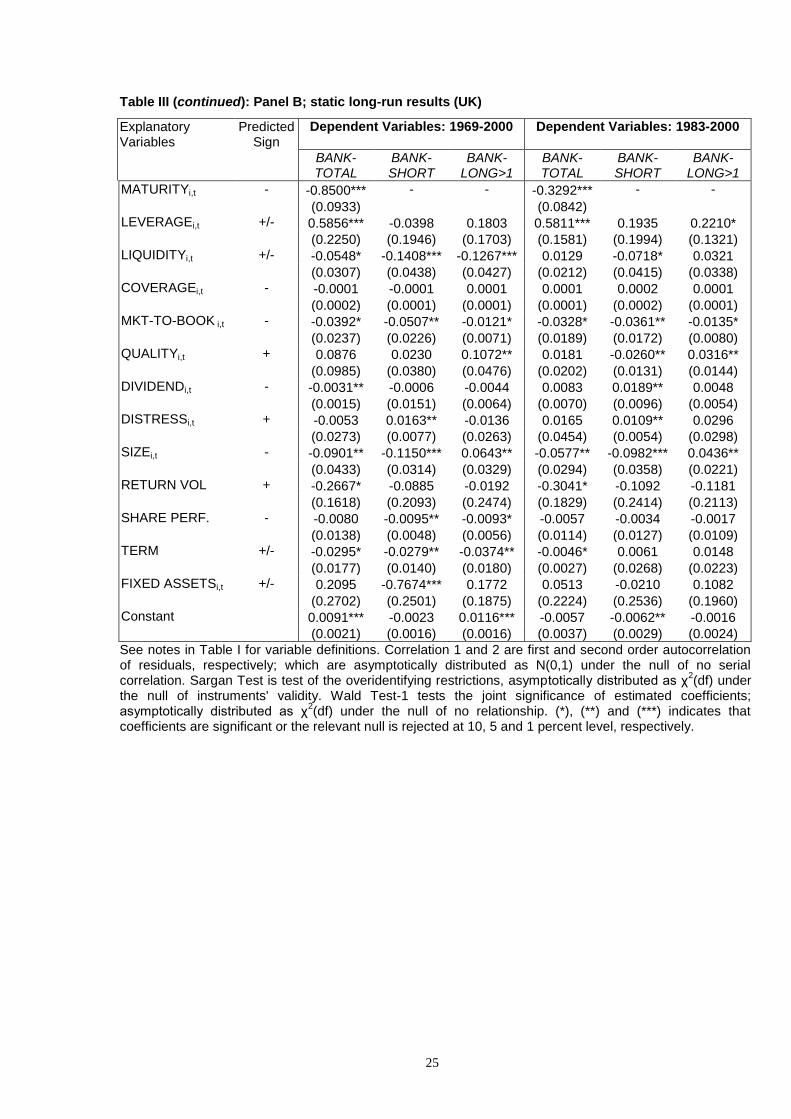
25
Table III (continued): Panel B; static long-run results (UK)
See notes in Table I for variable definitions. Correlation 1 and 2 are first and second order autocorrelation of residuals, respectively; which are asymptotically distributed as N(0,1) under the null of no serial correlation. Sargan Test is test of the overidentifying restrictions, asymptotically distributed as χ
2(df) under
the null of instruments' validity. Wald Test-1 tests the joint significance of estimated coefficients; asymptotically distributed as χ
2(df) under the null of no relationship. (*), (**) and (***) indicates that
coefficients are significant or the relevant null is rejected at 10, 5 and 1 percent level, respectively.
Explanatory Variables
Predicted Sign
Dependent Variables: 1969-2000 Dependent Variables: 1983-2000
BANK-TOTAL
BANK-SHORT
BANK-LONG>1
BANK-TOTAL
BANK-SHORT
BANK-LONG>1
MATURITYi,t - -0.8500*** - - -0.3292*** - -
(0.0933) (0.0842)
LEVERAGEi,t +/- 0.5856*** -0.0398 0.1803 0.5811*** 0.1935 0.2210* (0.2250) (0.1946) (0.1703) (0.1581) (0.1994) (0.1321) LIQUIDITYi,t +/- -0.0548* -0.1408*** -0.1267*** 0.0129 -0.0718* 0.0321 (0.0307) (0.0438) (0.0427) (0.0212) (0.0415) (0.0338) COVERAGEi,t - -0.0001 -0.0001 0.0001 0.0001 0.0002 0.0001
(0.0002) (0.0001) (0.0001) (0.0001) (0.0002) (0.0001) MKT-TO-BOOK i,t - -0.0392* -0.0507** -0.0121* -0.0328* -0.0361** -0.0135* (0.0237) (0.0226) (0.0071) (0.0189) (0.0172) (0.0080) QUALITYi,t + 0.0876 0.0230 0.1072** 0.0181 -0.0260** 0.0316** (0.0985) (0.0380) (0.0476) (0.0202) (0.0131) (0.0144) DIVIDENDi,t - -0.0031** -0.0006 -0.0044 0.0083 0.0189** 0.0048 (0.0015) (0.0151) (0.0064) (0.0070) (0.0096) (0.0054) DISTRESSi,t + -0.0053 0.0163** -0.0136 0.0165 0.0109** 0.0296
(0.0273) (0.0077) (0.0263) (0.0454) (0.0054) (0.0298) SIZEi,t - -0.0901** -0.1150*** 0.0643** -0.0577** -0.0982*** 0.0436** (0.0433) (0.0314) (0.0329) (0.0294) (0.0358) (0.0221) RETURN VOL + -0.2667* -0.0885 -0.0192 -0.3041* -0.1092 -0.1181 (0.1618) (0.2093) (0.2474) (0.1829) (0.2414) (0.2113) SHARE PERF. - -0.0080 -0.0095** -0.0093* -0.0057 -0.0034 -0.0017 (0.0138) (0.0048) (0.0056) (0.0114) (0.0127) (0.0109) TERM +/- -0.0295* -0.0279** -0.0374** -0.0046* 0.0061 0.0148
(0.0177) (0.0140) (0.0180) (0.0027) (0.0268) (0.0223) FIXED ASSETSi,t +/- 0.2095 -0.7674*** 0.1772 0.0513 -0.0210 0.1082 (0.2702) (0.2501) (0.1875) (0.2224) (0.2536) (0.1960) Constant 0.0091*** -0.0023 0.0116*** -0.0057 -0.0062** -0.0016 (0.0021) (0.0016) (0.0016) (0.0037) (0.0029) (0.0024)
26
Table IV: Corporate debt ownership structure in Germany; system-GMM (specific approach)
See notes in Table I for variable definitions. Industry dummies are included in all models. Correlation 1 and 2 are first and second order autocorrelation of residuals, respectively; which are asymptotically distributed as N(0,1) under the null of no serial correlation. Sargan Test is test of the overidentifying restrictions, asymptotically distributed as χ
2(df) under the null of instruments'
validity. Wald Tests 1 and 2 test the joint significance of estimated coefficients, and of industry dummies, respectively; asymptotically distributed as χ
2(df) under the null of no relationship. (*), (**)
and (***) indicates that coefficients are significant or the relevant null is rejected at 10, 5 and 1 percent level, respectively.
Explanatory Variables
Panel A: Dynamic model estimates
Panel B: Static long-run estimates
Dependent Variables Dependent Variables
Predicted Sign
BANK-TOTAL
BANK-SHORT
BANK-LONG>1
BANK-TOTAL
BANK-SHORT
BANK-LONG>1
BANKi,t-1 + 0.7751*** 0.4575*** 0.4577*** - - -
(0.0733) (0.0432) (0.0407)
MATURITYi,t - -0.0530*** - - -0.1546*** - - (0.0203) (0.0574)
LEVERAGEi,t +/- -0.0145 -0.0158 0.0431 -0.0644 -0.0291 0.0787 (0.0116) (0.0714) (0.0744) (0.0553) (0.1317) (0.1356) LIQUIDITYi,t +/- 0.0002 -0.0030*** -0.0016 0.0009 -0.0079*** -0.0064*** (0.0002) (0.0011) (0.0012) (0.0007) (0.0026) (0.0022) COVERAGEi,t - 0.0001 0.0001** 0.0001** 0.0001 0.0002** 0.0003*
(0.0001) (0.00005) (0.00005) (0.0001) (0.0001) (0.0002) MKT-TO-BOOK i,t +/- -0.0001 -0.0258** -0.0174 -0.0004 -0.0476** -0.0317 (0.0028) (0.0124) (0.0131) (0.0123) (0.0229) (0.0239) QUALITYi,t + 0.0030* 0.0019 0.0033 0.0136* 0.0035 0.0061 (0.0017) (0.0041) (0.0086) (0.0081) (0.0076) (0.0157) DIVIDENDi,t - 0.0007 0.0001* -0.0004 0.0033 0.0001* -0.0008 (0.0008) (0.00006) (0.0012) (0.0036) (0.00006) (0.0021) DISTRESSi,t + -0.0047 -0.4331** -0.3787** -0.0211 -0.1824* 0.2269
(0.0110) (0.1772) (0.1902) (0.0487) (0.1090) (0.1956) SIZEi,t - -0.0027** 0.0203 -0.0058 -0.0120** -0.0084 -0.0106** (0.0013) (0.0232) (0.0079) (0.0061) (0.0150) (0.0054) RETURN VOL + 0.0079 0.1425 0.1794 0.0350 0.2626 0.3271 (0.0392) (0.2495) (0.2398) (0.1747) (0.4591) (0.4367) SHARE PERFORM - 0.0000 -0.0113 -0.0075 0.0002 -0.0209 -0.0136 (0.0023) (0.0117) (0.0108) (0.0104) (0.0214) (0.0196) TERM +/- 0.0044* 0.0099 0.0055 0.0196* 0.0182 0.0100
(0.0026) (0.0283) (0.0275) (0.0117) (0.0520) (0.0499) FIXED ASSETSi,t +/- 0.0408** -0.2960*** -0.2662** 0.1815* -0.5457*** -0.4856** (0.0169) (0.1036) (0.1133) (0.0965) (0.1870) (0.2044) Constant 0.2474*** 0.4502*** 0.4384*** 1.1004*** 0.8298*** 0.7995*** (0.0781) (0.1463) (0.1433) (0.1134) (0.2652) (0.2561)
Correlation1 -4.760*** -8.891*** -9.023***
Correlation2 -0.414 0.399 0.219
Sargan Test (df) 184 (230) 227 (207) 210 (208)
Wald Test-1 (df) 348 (15)*** 266 (16)*** 286 (15)***
Wald Test-2 (df) 13.8 (14) 49 (14)*** 39 (14)***
R2
0.7653 0.4666 0.4654
Firms 439 438 439
Observations 3845 3834 3844

27
Table V: Corporate debt ownership structure in the UK. Panel A: system-GMM (specific approach)
Explanatory Variables
Predicted Sign
Dependent Variables: 1969-2000 Dependent Variables: 1983-2000
BANK-TOTAL
BANK-SHORT
BANK-LONG>1
BANK-TOTAL
BANK-SHORT
BANK-LONG>1
BANKi,t-1 + 0.7675*** 0.6431*** 0.9378*** 0.7245*** 0.6304*** 0.7150*** (0.0250) (0.0292) (0.0207) (0.0306) (0.0356) (0.0325) MATURITYi,t - -0.6760*** - - -0.2089*** - -
(0.0538) (0.0634)
LEVERAGEi,t +/- 0.4105*** 0.4124*** -0.0370 0.3986*** 0.4066*** -0.0392* (0.1407) (0.1247) (0.0361) (0.1416) (0.1407) (0.0230) LIQUIDITYi,t +/- -0.0200*** -0.0432*** 0.0005 -0.0041 -0.0214** 0.0043 (0.0070) (0.0165) (0.0073) (0.0123) (0.0101) (0.0117) COVERAGEi,t - -0.0001 0.0001 0.0001 0.0001 0.0001 0.0001
(0.0001) (0.0001) (0.0001) (0.0001) (0.0001) (0.0001) MKT-TO-BOOK i,t - 0.0023 -0.0281*** 0.0076** -0.0252*** -0.0188*** -0.0054 (0.0070) (0.0067) (0.0032) (0.0093) (0.0062) (0.0055) QUALITYi,t + 0.0729** 0.0151 0.0269** 0.0176 0.0082 0.0190*** (0.0369) (0.0224) (0.0127) (0.0175) (0.0181) (0.0066) DIVIDENDi,t - -0.0014 -0.0003 0.0001 0.0025 0.0006 -0.0004 (0.0023) (0.0026) (0.0012) (0.0029) (0.0039) (0.0021) DISTRESSi,t + -0.1246** 0.0042* -0.0900** 0.0159 0.0127** 0.0103
(0.0553) (0.0025) (0.0438) (0.0123) (0.0062) (0.0083) SIZEi,t - -0.0048 -0.0311*** 0.0004** 0.0063 -0.0237*** 0.0145*** (0.0059) (0.0056) (0.0002) (0.0068) (0.0081) (0.0054) RETURN VOL + -0.2125** -0.1288* -0.0709 -0.1237* -0.0923** -0.0237 (0.1027) (0.0775) (0.0575) (0.0074) (0.0470) (0.0815) SHARE PERFORM - -0.0022* 0.0013 -0.0029* -0.0031* 0.0069 -0.0061* (0.0012) (0.0047) (0.0015) (0.0018) (0.0063) (0.0035) TERM +/- -0.0210** -0.0122* -0.0102*** 0.0004 -0.0151* 0.0064
(0.0096) (0.0070) (0.0038) (0.0109) (0.0082) (0.0090) FIXED ASSETSi,t +/- -0.3307** -0.3022** -0.0267* -0.0395 -0.0693 -0.0465 (0.1624) (0.1395) (0.0160) (0.0589) (0.0645) (0.0487) Constant 0.2388*** 0.5171*** 0.0501 0.1571** 0.4291*** -0.0437 (0.0692) (0.0819) (0.0352) (0.0795) (0.1075) (0.0665)
Correlation1 -14.94*** -14.49*** -12.37*** -13.38*** -14.27*** -13.31*** Correlation2 1.681 1.524 1.373 1.418 1.672 1.293 Sargan Test (df) 447 (432) 572 (544) 409 (378) 303 (294) 309 (294) 311 (297)
Wald Test-1 (df) 4078 (19)*** 1218 (19)*** 5255 (17)*** 732 (17)*** 697 (17)*** 623 (14)***
Wald Test-2 (df) 56.7 (15)*** 85.1 (15)*** 9.55 (15) 51.6 (15)*** 68.6 (15)*** 13.9 (15)
R2
0.6203 0.5810 0.4916 0.5659 0.5139 0.4786
Firms 1726 1726 1729 1512 1514 1523
Observations 25613 25602 26035 15056 15091 15661

28
Table V (continued): Panel B; static long-run results (UK)
See notes in Table I for variable definitions. Industry dummies are included in all models. Correlation 1 and 2 are first and second order autocorrelation of residuals, respectively; which are asymptotically distributed as N(0,1) under the null of no serial correlation. Sargan Test is test of the overidentifying restrictions, asymptotically distributed as χ
2(df) under the null of instruments' validity. Wald Tests 1 and 2 test the joint
significance of estimated coefficients, and of industry dummies, respectively; asymptotically distributed as χ
2(df) under the null of no relationship. (*), (**) and (***) indicates that coefficients are significant or the
relevant null is rejected at 10, 5 and 1 percent level, respectively.
Explanatory Variables
Predicted Sign
Dependent Variables: 1969-2000 Dependent Variables: 1983-2000
BANK-TOTAL
BANK-SHORT
BANK-LONG>1
BANK-TOTAL
BANK-SHORT
BANK-LONG>1
MATURITYi,t - -0.7498*** - - -0.1689 - -
(0.1077) (0.1432)
LEVERAGEi,t +/- 0.2463* -0.0158 -0.5939 0.2536* 0.0759 -0.1374 (0.1388) (0.1812) (0.6413) (0.1314) (0.1991) (0.1606) LIQUIDITYi,t +/- -0.0861*** -0.0245* -0.2446* -0.0149 -0.0579* 0.0151 (0.0296) (0.0144) (0.1309) (0.0446) (0.0307) (0.0409) COVERAGEi,t - -0.0003*** -0.0001* -0.0022* 0.0002 0.0002 0.0001
(0.0001) (0.00006) (0.0013) (0.0002) (0.0002) (0.0001) MKT-TO-BOOK i,t - 0.0097 -0.0787*** 0.1227** -0.0914*** -0.0509*** -0.0189 (0.0298) (0.0187) (0.0559) (0.0342) (0.0172) (0.0194) QUALITYi,t + 0.3668** 0.0098 0.7149** 0.0640 -0.0074 0.1097*** (0.1771) (0.0668) (0.3087) (0.0644) (0.0523) (0.0308) DIVIDENDi,t - -0.0060 -0.0114 0.0013 0.0091 -0.0312** -0.0015 (0.0100) (0.0120) (0.0192) (0.0106) (0.0154) (0.0072) DISTRESSi,t + -0.2857** 0.0012* -0.7440** 0.0576 0.0120* 0.0362
(0.1212) (0.0007) (0.3668) (0.0444) (0.0068) (0.0293) SIZEi,t - -0.0205 -0.0872*** 0.0060** 0.0229 -0.0640*** 0.0509*** (0.0252) (0.0138) (0.0030) (0.0244) (0.0199) (0.0183) RETURN VOL + -0.9142** -0.3608** -1.1388* -0.4490** -0.2498** -0.0831 (0.4445) (0.1820) (0.6834) (0.2072) (0.1268) (0.2854) SHARE PERF. - -0.0095* 0.0036 -0.0462* -0.0112* 0.0188 -0.0214** (0.0056) (0.0133) (0.0260) (0.0065) (0.0172) (0.0107) TERM +/- -0.0903** -0.0341* -0.1632** 0.0014 -0.0408** 0.0223
(0.0404) (0.0204) (0.0735) (0.0395) (0.0201) (0.0314) FIXED ASSETSi,t +/- -0.4864* -0.2585* -0.4297 -0.1434 -0.1875 -0.1632 (0.2599) (0.1445) (0.4492) (0.2151) (0.1739) (0.1708) Constant 1.0272*** 1.4491*** 0.8050 0.5705** 1.1611*** -0.1532 (0.2813) (0.1845) (0.6190) (0.2877) (0.2468) (0.2318)