Determinants of Tax Yield in UEMOA Countries: The Effects of Institutions and Economic Structure
21
Determinants of Tax Yield in UEMOA Countries: The Effects of Institutions and Economic Structure KEHO Yaya Ecole Nationale Supérieure de Statistique et d’Economie Appliquée, Abidjan, Côte d’Ivoire Email: [email protected] Paper to be presented at the International Centre for Tax and Development’s 2013 Annual Meeting, 10-12 December in Lomé December, 2013 Abstract Enhancing tax performance is an increasingly relevant topic in economic policy agenda. This study contributes to the empirical analysis on the determinants of tax yield by focusing on the role of institutional factors and economic structure. Results show that the poor quality of institutions and the high share of agriculture and unrecorded economy are among the factors explaining the low tax performance of UEMOA countries. In these countries, the unrecorded economy is sizable and revenue losses through tax evasion are substantial and growing over time. From these findings, the study provides a number of policy recommendations that can help improve domestic tax revenues. Résumé L’amélioration de la performance fiscale est un sujet récurrent dans les discours de politique économique. La présente étude contribue à la réflexion sur les déterminants du rendement fiscal en examinant plus particulièrement le rôle des facteurs économiques et institutionnels. Les résultats montrent que la faible qualité des institutions, la forte part de l’agriculture et du secteur non enregistré sont parmi les facteurs explicatifs du faible rendement fiscal des pays de l’UEMOA. Dans ces pays, la taille de l’économie non enregistrée est assez importante et les manques à gagner du fait de l’évasion fiscale augmentent au fil des années. A partir de ces résultats, l’étude suggère des recommandations pouvant aider à améliorer les recettes fiscales.
-
Upload
enseaabidjan -
Category
Documents
-
view
0 -
download
0
Transcript of Determinants of Tax Yield in UEMOA Countries: The Effects of Institutions and Economic Structure

Determinants of Tax Yield in UEMOA Countries: The
Effects of Institutions and Economic Structure
KEHO Yaya
Ecole Nationale Supérieure de Statistique et d’Economie Appliquée, Abidjan, Côte d’Ivoire
Email: [email protected]
Paper to be presented at the International Centre for Tax and Development’s 2013 Annual Meeting,
10-12 December in Lomé
December, 2013
Abstract
Enhancing tax performance is an increasingly relevant topic in economic policy agenda. This study
contributes to the empirical analysis on the determinants of tax yield by focusing on the role of
institutional factors and economic structure. Results show that the poor quality of institutions and the
high share of agriculture and unrecorded economy are among the factors explaining the low tax
performance of UEMOA countries. In these countries, the unrecorded economy is sizable and revenue
losses through tax evasion are substantial and growing over time. From these findings, the study
provides a number of policy recommendations that can help improve domestic tax revenues.
Résumé
L’amélioration de la performance fiscale est un sujet récurrent dans les discours de politique
économique. La présente étude contribue à la réflexion sur les déterminants du rendement fiscal en
examinant plus particulièrement le rôle des facteurs économiques et institutionnels. Les résultats
montrent que la faible qualité des institutions, la forte part de l’agriculture et du secteur non
enregistré sont parmi les facteurs explicatifs du faible rendement fiscal des pays de l’UEMOA. Dans
ces pays, la taille de l’économie non enregistrée est assez importante et les manques à gagner du fait
de l’évasion fiscale augmentent au fil des années. A partir de ces résultats, l’étude suggère des
recommandations pouvant aider à améliorer les recettes fiscales.

1
1. Introduction
Many Sub-Saharan African countries face serious problems in generating sufficient revenues
for public expenditure. Although there have been calls for a reduction in public expenditures,
this has proven to be difficult and the fact still remains that countries need to spend more on
key sectors. The consistent failure in raising revenues is a serious handicap for the
implementation of homegrown development strategies. It constraints them to an excessive
reliance on external borrowing, which leads in the long term to problems of debt sustainability
and makes economies vulnerable to financial crises. Moreover, reliance on external financial
flow makes governments accountable to donors and not accountable to the people they are
ruling. It is therefore crucial that governments generate more revenues to meet the needs of
their populations. Increased domestic revenue can also help countries mitigate the adverse
impact of volatility and uncertainty in aid flows.
In recent years, a certain number of African countries have benefited from a substantial
reduction in their external debt stock after reaching the Initiative for Heavily Indebted Poor
Countries (HIPC) completion point. This is very good news for Africans. However, it raises
another key challenge: how to strengthen domestic revenues mobilization to help create fiscal
space and avoid debt accumulation in the next 10 or 20 years? This is not an easy task.
Several studies indicate that developing countries have the potential for greater domestic
revenue mobilization. The United Nations Millennium Project (2005) estimated that these
countries could increase their domestic revenue by about 4 % of GDP over the next 10 years.
Similarly, the Commission on Macroeconomics and Health (World Health Organization,
2002) concluded that most countries could raise an additional 1–2 % of GDP for financing
additional health spending.
In this paper we analysis this challenge for the member countries of the West African
Economic and Monetary Union (UEMOA). Faced with the vicious circle of escalating
external debt and persistent budget deficits, UEMOA member countries have embarked on
economic and fiscal reform programs some of which are supported by the International
Monetary Fund. These reform programs have usually included measures to raise tax revenues
and to restructure tax systems. In addition, they have adopted convergence criteria aiming at
explicit targets for public debt and deficits to monitor their fiscal situation. According to these
criteria, the tax revenue to GDP ratio should be greater than or equal to 17%. Despite reforms
and various adjustments of the individual taxes, tax systems fail to generate sufficient revenue
to meet this criterion. Over the period 2005-2009, only Senegal met this criterion out of the
height members of the Union. This clearly shows how weak the tax administration and the tax
system are in terms of collecting tax revenues. In Côte d’Ivoire, tax ratio decreased over the
period and averaged to 15.2%. The country’s needs for spending on social services, such as
education and health, and capital infrastructure are likely to increase in the next future as the
Government pursues a strategy of sustained economic growth. Why UEMOA countries fail to
improve their tax yield? What are the factors explaining their tax performance?
The objective of this study is to analyze the determinants of tax yield in UEMOA countries by
focusing on the role of institutional factors and economic structure. An important hypothesis
we made is that the poor tax performance in UEMOA countries is positively linked to the
weakness of institutions in these countries. Our second important hypothesis is that the
growing unrecorded economy results in considerable losses in tax revenue and competes with
the activities of official firms leading to low tax performance.

2
The remainder of the study is organized as follows. The next section gives a preliminary
analysis of tax performance in UEMOA countries. Section 3 reviews the empirical literature
regarding the determinants of tax yield. Section 4 outlines the econometric methodology.
Section 5 describes the data used in the study and the measurement of tax evasion. Section 6
discusses the empirical results, while Section 7 summarizes the major findings of the study
and gives some policy implications.
2. Tax Performance in UEMOA Countries
2.1 Tax ratio in UEMOA Countries
Table 1 presents the share of tax revenues in GDP for the UEMOA member countries and
other African countries. As can be seen, tax revenue performance varies across the UEMOA
member countries. Senegal is the only country satisfying the convergence criteria regarding
tax ratio, it enjoys tax revenue over 17% of GDP. Because of the conflict, Côte d’Ivoire fails
to increase tax revenue share during the sample period. The share of tax revenue in GDP
averages about 15.08 % in Benin, 110% in Niger. Compared with other African countries,
UEMOA countries lag behind Cameroon, Kenya and Namibia. The failure of the UEMOA
countries to generate sufficient revenue to finance recurrent expenditure has led to large
budget deficits. The area initiated tax reforms with diverse objectives. Unfortunately, the
reform process began at a time when the macroeconomic environment was unstable and Côte
d’Ivoire underwent a political crisis.
Table 1: Tax revenue ratio in UEMOA and some African Countries, 2000-2008
(in percent of GDP)
Countries Total taxes Direct taxes Indirect taxes Trade taxes
UEMOA
Benin 15.08 3.84 3.24 8.01
Burkina Faso 11.39 2.85 6.14 2.40
Cote d’Ivoire 14.98 4.24 3.21 7.53
Mali 14.73 3.00 2.21 9.52
Niger 10.00 2.56 1.92 5.53
Senegal 17.61 4.18 9.52 3.90
Togo 12.12 3.79 1.26 7.07
African Countries
Cameroon 16.32 3.08 5.57 7.67
Kenya 19.14 6.69 8.55 3.89
Madagascar 10.53 2.22 2.87 5.44
Malawi 15.69 6.81 6.87 2.01
Namibia 25.68 9.71 5.90 10.07
Tanzania 11.34 3.20 4.22 3.93
Tchad 12.71 2.71 0.93 9.07
Source : Perspectives Economiques en Afrique (2010) et Banque Mondiale (2010).
Looking at the tax structure, we observe that commodity taxation dominates most African
countries tax system. International trade taxes account for the highest share in total tax
revenues in most countries. This is because trade taxes are easier to collect than other taxes.
However, countries such as Senegal and Burkina Faso rely mainly on indirect taxes including
VAT.

3
2.2 Tax Buoyancy in UEMOA Countries
To assess the productivity of tax systems, we compute the income elasticity of individual
taxes in each of the UEMOA member countries over the period 1996-2008. A desirable
property of a tax system is that income elasticity be equal or greater than unity. Tax systems
of UEMOA countries have undergone major restructuring over that period. The tariff slabs
have been revised over time and maximum tariff rate has been reduced to 20% whereas the
number of tariff slabs has also been reduced to four.
Table 2: Estimates of Tax Buoyancy in UEMOA countries, 1996-2008
(with reference to GDP)
Total Taxes Direct Taxes Indirect Taxes Trade Taxes
Benin 1.249
(48.665)
1.024
(21.491)
1.437
(28.789)
1.296
(24.919)
Burkina Faso 1.098
(22.742)
0.989
(16.924)
1.413
(44.827)
0.621
(3.911)
Côte d’Ivoire 0.677
(7.222)
1.044
(5.425)
0.625
(4.968)
0.493
(2.860)
Mali 0.906
(15.552)
1.317
(10.662)
1.116
(11.819)
0.718
(8.913)
Niger 1.658
(34.294)
2.328
(17.608)
1.729
(13.710)
1.342
(13.416)
Senegal 1.367
(43.030)
1.419
(25.333)
1.719
(12.369)
0.775
(4.313)
Togo 1.458
(6.704)
1.142
(3.317)
-0.921
(-1.989)
2.094
(11.758)
Note: Figures in parentheses are t-ratios.
Results from Table 2 show that the overall tax system is not buoyant in two countries (Côte
d’Ivoire and Mali). Estimates for Côte d’Ivoire suggest that for every 1% increase in GDP
over the period 1996-2008, tax revenue grows by 0.67%. A comparison of the tax handles
reveals that trade taxes are not elastic in four countries. Clearly, the low tax-to-income
elasticity of trade taxes adversely affects the overall elasticity of the tax system in these
counties. In Burkina Faso, direct taxes are not buoyant because of the low base-to-income
elasticity while the low elasticity of trade taxes is due to the low tax-to-base elasticity. In
Mali, the low buoyancy of trade taxes is attributable to the low base-to-income buoyancy. In
Côte d’Ivoire, the low performance of indirect taxes adversely affects the overall tax system’s
yield. The low buoyancies of trade and indirect taxes in Côte d’Ivoire are due to the low tax-
to-base elasticities, indicating that despite the increase in imports and GDP, import taxes are
not being collected accordingly. This low performance reflects the combined effect of tax
evasion and weak overall tax administration.
The existence of generous tax exemptions is also a factor to be accounted for. Indeed, many
African countries grant tax exemptions, most of which being unnecessary or ineffective. In
Côte d’Ivoire, customs exemptions on goods amounted between 0,8% and 1,2% of GDP over
the period 2000–2009. This means that tax yield could be increased by about 1% of GDP if
customs exemptions are removed. In Mali, tax exemptions account for 1.5% of GDP over the
period 2000–2009. The mining sector has been granted for 1% of GDP. While the fiscal cost
of these exemptions is substantial, little is known about their social and economic impacts in
terms of poverty reduction and growth and employment inducing. In some sectors (natural

4
resources specifically), contracts are often opaque and the social or economic impacts of tax
exemptions are unclear. Do tax incentives meet the objectives underlying their adoption? Who
profit from these favors, populations, governments or corporations?
Reducing tax incentives is a dilemma facing many governments in Africa: how to encourage
investment and at the same time collect the revenues necessary to build infrastructure and
reduce poverty? It is well known that tax exemptions do not top the list of reasons why
companies invest in Africa. The most important determinants of private investment include
market size measured by per capita GDP, quality of infrastructures, political stability, rule of
law and human resources capacity. Moreover, some taxpayers are protected by powerful
politicians and they accumulate unpaid taxes over time. This practice distorts taxation equity
by shifting the taxation burden towards “small” honest taxpayers. It is worth to let the
Directors of tax administrations work freely.
3. Literature Review
The empirical literature has identified a number of variables as important determinants of tax
performance. The most traditional explanatory variables are those controlling for a country‘s
economic structure. Per capita income is typically considered as a proxy for the level of
development of a country. A higher level of development goes together with a higher capacity
to pay and collect taxes, as well as a higher relative demand for income elastic public goods
and services (Chelliah, 1971; Bahl, 1971). In general, a higher level of per capita income is
expected to have a positive effect on the tax ratio.
Other structural variables hypothesized to influence tax ratio include the sectorial composition
of output, the degree of trade openness, the urbanization ratio and the financial deepening.
Madhavi (2007) points out that some structural characteristics of developing economies
impede their abilities to raise revenues from certain taxes. One such characteristic is a large
share of the agricultural sector. In developing countries, this sector is characterized by a large
number of small producers who sell their output in informal markets, either to exchange for
other goods, or for self-consumption. Thus a higher agricultural share is expected to have a
negative effect on tax ratio. Unlike the agricultural sector, a higher degree of trade openness is
expected to generate a higher tax ratio. The trade sector has been traditionally a base that is
easier to tax, accordingly, it is a major source of tax revenues for most African countries.
Following an interesting argument developed in Togler (2007), tax compliance is influenced
by the benefits received from government in the form of quantity of public sector services, in
relation to the amount paid by individuals in taxes. Thus, if individuals feel that they are in an
unfair contract and that taxes are not spent adequately, they are less likely to comply.
Therefore, to proxy for tax compliance, the degree of urbanization as measured by the share
of the urban population is used to reflect a country‘s the demand for public services. Higher
urbanization is expected to have a positive effect on tax ratio. Another interesting argument
suggests that tax collection is easier in urban areas than in rural areas.
A number of empirical studies have attempted to assess the importance of these structural
features. Lotz and Morss (1969) found that per capita income and trade share are important
determinants of the tax share. Chelliah et al. (1975) related the tax share in GDP to various
combinations of explanatory variables, using a sample of 47 countries averaged over the
1969-1971 period. They obtained that mining is positively related to the tax share while
agriculture is negatively related and the export ratio is insignificant. Tait and Gratz (1979)
used the same sample of 47 developing countries with data averaged over the 1972-1976

5
period, and did not find the share of agriculture to be significant. Tanzi (1987) examined, for a
sample of 86 developing countries, how the share of tax revenue in GDP is related to per
capita income. He found a positive and significant relationship between these two. In a
subsequent study, Tanzi (1992) extended his analysis to incorporate a sample of 83
developing countries over the period 1978-1988. He found that half of the variation in the tax
ratio is explained by per capita income, import share, agriculture share and foreign debt share.
The share of agriculture in GDP is strongly inversely related to the tax share and its
explanatory power is greater than per capita income.
Several regional studies have been conducted to look into determinants of domestic tax
mobilization. For sub- Saharan Africa, Tanzi (1981) found that shares of mining and non-
mineral export in GDP positively affect the tax ratio. Leuthold (1991) used panel data to
obtain a positive impact from trade share, but a negative one from the share of agriculture. In
a similar study, Stotsky and WoldeMariam (1997) found that both agriculture and mining
share are negatively related to the tax ratio, while export share and per capita income have a
positive effect. Ghura (1998) obtained a similar result for per capita income, degree of
openness, and the share of agriculture in GDP. He also found that other factors like structural
reforms and human capital development affect the tax performance. An increase in the level
of human capital and structural reforms are associated with an increase in tax ratio. In a study
of 16 Arab countries for the period 1994-2000, Eltony (2002) obtained that the main
determinants of the tax share in the GDP are the per capita income, the share of agriculture in
GDP and the share of mining in GDP. Mining share has a negative impact on the tax ratio for
oil exporting countries, but a positive impact for non-oil exporting countries. Other variables
that are also important determinants are the share of exports and imports and in only the non-
oil Arab countries, the outstanding foreign debt was found significant and positively related to
the tax share.
Recently, some studies have looked at the importance of institutional factors as determinants
of tax performance. North (1990) defines institutions as “the rules of the game in a society or,
more formally, the humanly devised constraints that shape human interaction”. He examines
the nature and consequences of institutions for economic performance. Many empirical
studies have shown that the institutional environment has an important impact on tax ratio.
For example, in his study, Ghura (1998) observed that a rise in corruption leads to a decline in
tax ratio. Bird et al. (2008) found that factors such as corruption and rule of law play key roles
in explaining tax performance variation across countries. A country with good institutions
would have a better tax system hence a higher tax ratio. A number of studies mainly attribute
the lack of development, growth and poor tax performance in most African economies partly
to the rampant corruption levels as well as weak institutions (Mauro, 1998; Ghura, 1998; Bird
et al., 2008). In a series of papers, Tanzi and Davoodi (2000), as well as Friedman et al.
(2000) have provided evidence that countries with higher levels of corruption tend to have
lower collection of tax revenues in relation to GDP. Gupta (2007) found that structural factors
such as per capita GDP, share of agriculture in GDP, and trade openness are strong
determinants of revenue performance. He also found that although foreign aid improves
revenue performance, foreign debt does not have a significant effect. Among the institutional
factors, He found that corruption is a significant determinant of a country’s revenue
performance. Political and economic stability matters as well, but this finding is not robust
across specifications. Finally, He also observed that those countries that depend on taxing
goods and services as their primary source of tax revenue, have relatively poor revenue
performance. On the other hand, countries that rely more on income taxes, profit taxes, and
capital gains taxes, perform much better. Bird et al. (2008) postulated that if taxpayers both

6
perceive that their interests are properly represented in political institutions and that the
governance is good, their willingness to contribute by paying taxes increases. Using cross-
section data, they found that corruption and voice and accountability play a significant role in
the determination of tax performance.
Since the beginning of the 90s, another strand of the literature suggests a negative relationship
between the size of the underground economy and tax performance. As underground economy
grows, tax evasion also increases and tax revenue decreases. The unrecorded economy, also
referred to as the “underground economy”, “shadow economy” or “black economy”, remains
difficult to appraise and its size is expected to increase with increasing taxation and
regulation. According to Schneider and Enst (2000), unrecorded activities represent between
40 and 80% of GDP in developing economies. Evidence for African countries shows sizable
unrecorded economy. For instance, at the beginning of the nineties the non-agricultural
unrecorded sector in Senegal represented more than 50% of the GDP (Fall, 1997). In
Tanzania in 1991, the unrecorded urban economy represented 33% of GDP (Ngoi, 1997). The
existence of unrecorded economy implies an underestimation of GDP and affects other
variables whose calculations involve GDP. For instance, an underestimation of GDP implies
an overvaluation of savings to GDP, while GDP per capita is undervalued. Underground
economic activity in the form of tax evasion poses a serious threat for public finance. It
represents a deadweight loss on the economy and distorts taxation equity by shifting the
taxation burden towards honest firms and individuals. In a study in Tanzania, Osoro (1995)
found an inverse relationship between revenue productivity and the existence of the
underground economy. That is, as the size of underground economy grows, tax elasticity is
expected to fall. This is because its growth erodes the tax base. He also showed that
measuring tax elasticity based on official GDP data in an economy in which the size of the
underground economy is significant tends to overestimate these measures of revenue
productivity.
4. Econometric Methodology
4.1 Empirical Model
Based on the literature review presented above, we describe the tax revenue performance
relationship as follows:
itititit
ititititititititit
UEInsTax
IndUrbSbOAgryyTax
111019
8765431210
(1)
where :
Tax is the tax revenue-GDP ratio; y is the GDP per capita (in log) ; Agr is the share of
agriculture in GDP; O is trade openness, measured as ratio of exports plus imports of goods
and services to GDP; Sb is the budget balance in percent of GDP; Urb is the share of the
urban population in a country’s total population; π is the inflation rate; Ind is the share of
indirect taxes in total tax revenues; Ins is the institutional quality and UE is a measure of the
unrecorded economy in percent of GDP.

7
4.2 Estimation Technique
Until recently, many empirical models for panel data generally impose parameter
homogeneity across countries, an assumption that can hardly be defended because of
differences in geographical, institutional, social and economic structures among countries. By
grouping countries that are at different stages of economic development, these studies fail to
address the country-specific effects of explanatory variables on the dependent variable. If a
variable is tax inducing in certain countries and tax retarding in others, forcing a single
coefficient on the entire sample may result in inconsistent and fragile results (Pesaran and
Smith, 1995). Another major concern with previous studies is about the possible endogeneity
stemming from some right-hand side variables, notably per capita GDP, underground
economy and institutions. To deal with the problem of endogeneity, most studies use
instrumental-variable estimation methods like the GMM method or the two stage least square
method. However, the choice of suitable instruments is often problematic and may deteriorate
the quality of estimates.
To overcome these shortcomings and taking advantage of the panel dimension of data we use
recently developed panel data methods that accommodate heterogeneous dynamic adjustment
around the long-run equilibrium relationship, namely the Pooled Mean Group (PMG)
estimators proposed by Pesaran et al. (1999). This method allows the short-run coefficients
and speeds of adjustment to vary across countries, but impose common long-run coefficients.
This hypothesis holds for the countries under study. Indeed, member countries of UEMOA
work to converge in the long-run towards common criteria, but in the short-run each country
can diverge from these long-run criteria.
Following Pesaran et al. (1999), Eq.(1) is viewed as an autoregressive distributive lag
(ARDL) dynamic panel model which can be written as follows:
itijit
n
j
ijjit
m
j
ijit xyy
0
'
1
(2)
Where itx is a 1k vector of explanatory variables; ij are the 1k coefficient vectors; ij
are scalars; and i represents the country-specific effect. From this model, we derive the
long-run relation as follows:
ititiit xy ' (3)
If the variables are cointegrated, then the error term it is an I(0) process for all i, and Eq.(2)
can be reparameterized in the form of an unrestricted error correction model in which the
short-run dynamics of the variables are influenced by the deviation from the long-run
relationship:
itijit
n
j
ijjit
m
j
ijitiitiit xyxyy
1
0
*'1
1
*'
1 (4)
where is the first difference operator defined as 1 ititit zzz . The error-correction speed
of adjustment parameter, i , and the long-run coefficients, i , are of primary interest. One
would expect i to be significantly negative under the prior assumption that the variables

8
exhibit a return to long-run equilibrium. The main interest of ARDL models is that the long
run relationship and the short run parameters are estimated jointly. They also allow to deal
with variables that are possibly of different order of integration, namely I(0) and I(1), and not
simply I(1). In other words, this procedure allows inferences to be made in the absence of any
a priori information about the order of integration of the series under investigation. This
property is extremely useful, given the low power of panel unit root tests in short samples.
Under the restriction i , the PMG estimators are consistent and asymptotically normal
irrespective of whether the underlying regressors are I(1) or I(0).
5. Data Description
The empirical investigation uses annual time series data for a sample countries including six
member countries of the West African Economic and Monetary Union, namely Burkina Faso,
Cote d’Ivoire, Mali, Niger, Senegal and Togo1. Variables under study include tax revenue as
share of GDP, per capita GDP, the share of agriculture in GDP, the trade openness measured
as ratio of exports plus imports of goods and services to GDP, the budget balance as share of
GDP, the share of the urban population in a country‘s total population, the rate of inflation,
the share of indirect taxes in total tax revenues, the currency holdings, the broad money and
the institutional indicators. Data cover the period 1984 to 2008.
5.1 Measurement of Institutional Quality
We follow previous studies and consider six indicators to capture institutional factors,
namely: (i) Quality of bureaucracy, (ii) Corruption, (iii) Rule of law, (iv) Democratic
accountability, (v) Investment profile and (vi) Government stability. The first indicator ranges
from 0 to 4, the following three indicators are scaled from 0 to 6, whereas the last two
variables are scaled from 0 to 12. All data are collected from the International Country Risk
Guide dataset (ICRG, 2009) compiled by the Political Risk Services (PRS Group). These
indicators rely exclusively on polls of experts. To enable comparability variables are rescaled,
so that they range from 0 to 10. Higher values of any institutional variable correspond to
better institutional quality, with the exception being the corruption variable.
As indicated in the guide, bureaucratic quality represents autonomy from political pressure,
strength, and expertise to govern without drastic changes in policy or interruptions in
government services, as well as the existence of an established mechanism for recruitment
and training of bureaucrats. Corruption reflects the likelihood that officials will demand
illegal payment or use their position or power to their own advantage. Rule of law reveals the
degree to which citizens are willing to accept established institutions to make and implement
laws and to adjudicate dispute. Democratic accountability measures how responsive
government is to the demand of its people, on the basis that the less responsive it is, the more
likely it is that the government will fall, peacefully in a democratic society, but possibly
violence in a non-democratic one. Investment profile is an assessment of factors affecting the
risk to investment that are not covered by other political, economic and financial risk
components.
Table 3A and 3B give an overview of the descriptive statistics of all institutional variables
used for countries of the sample. As can be seen, all countries have done effort to reduce
1 Benin and Guinea-Biseau are excluded because of lack of data.

9
corruption. In particular, in Niger corruption index decreased from 6.67 to 1.67. A similar
trend is observed in Togo. However, corruption remains relatively high in Cote d’Ivoire and
Senegal. Quality of bureaucracy exhibits a decreasing picture and it is particularly low in Côte
d’Ivoire, Mali and Togo over the period 2000-2005. Some countries have substantially
increased their investment profile in recent years while others such as Côte d’Ivoire have
experienced a marked decline. Compared with Asia, UEMOA countries lagged behind most
East Asian countries regarding bureaucracy, investment profile and rule of law. But they
performed better than most East Asian countries regarding the aspects of democracy and fight
against corruption (see Tables 3 C and D in appendices).
Table 3A: Quality of institutions in UEMOA Countries
Bureaucracy Investment profile Corruption
84-89 90-99 00-08 84-89 90-99 00-08 84-89 90-99 00-08
Burkina Faso 5.00 2.63 2.50 3.52 5.21 7.33 6.67 4.92 3.33
Côte d’Ivoire 7.50 6.90 0.07 5.36 5.37 4.38 4.79 5.31 4.19
Mali 0.00 0.00 0.00 2.71 5.08 6.39 1.81 3.90 3.77
Niger 7.50 3.38 2.50 3.55 4.01 6.45 6.67 3.53 1.67
Senegal 5.00 4.40 2.50 5.67 5.25 6.49 5.00 5.00 4.44
Togo 2.50 1.90 0.00 4.93 4.79 5.99 3.33 3.33 2.89
Panel 4.58 3.20 1.26 4.29 4.95 6.17 4.71 4.33 3.38
Table 3B: Quality of institutions in UEMOA Countries (continued)
Democracy Rule of law Gouv. Stability
84-89 90-99 00-08 84-89 90-99 00-08 84-89 90-99 00-08
Burkina Faso 1.67 3.58 6.52 5.00 5.99 6.13 4.28 5.43 7.72
Côte d’Ivoire 5.00 5.00 2.85 6.57 4.93 4.40 4.07 5.15 7.06
Mali 1.67 4.31 5.69 3.33 4.50 5.00 3.83 5.48 7.19
Niger 6.67 4.14 8.04 6.67 3.53 3.33 4.27 4.80 7.48
Senegal 3.73 7.18 6.63 3.33 4.11 5.00 6.32 5.94 8.15
Togo 1.67 3.24 3.31 3.33 4.24 5.00 4.18 5.06 7.58
Panel 3.40 4.57 5.51 4.71 4.55 4.81 4.49 5.31 7.53
Using all of these measures in an econometric model may cause problems of multicolinearity
and over-parameterization since the underlying variables may be highly correlated. On the
other hand, using them individually may also lead to omitted variables bias. To deal with
these econometric problems, we conduct of principal components analysis (PCA) to
determine whether these indicators can be measured by a single index2. PCA is traditionally
used to reduce a large set of correlated variables into a smaller set of uncorrelated synthetic
factors called principal components that capture most of the information from the original
dataset (for technical details, see Lebart et al., 1995).
2 Before applying PCA, we test for factorability of the data. Bartlett’s test of sphericity and Kaiser-Meyer-Olkin
measure of sampling adequacy (KMO) are carried out to give an indication concerning the suitability of the data
for PCA. The results justify the use of factor analysis and suggest that the data may be grouped into a smaller set
of underlying factors.

10
Table 4: Principal Component Analysis Results
Principal component
PCA 1 PCA 2 PCA 3 PCA 4 PC5 PC6
Eigenvalues 2.244 1.966 0.747 0.460 0.338 0.244
% of variance 37.40 32.77 12.45 7.67 5.63 4.07
Cumulative % 37.40 70.17 82.62 90.29 95.92 100.00
Correlation coefficients
Variable PCA 1 PCA 2 PCA 3 PCA 4 PC5 PC6
Bur -0.505 0.661 0.385 0.279 -0.192 0.214
Deac 0.399 0.672 0.434 -0.438 0.054 -0.072
Law 0.098 0.746 -0.589 -0.116 -0.272 -0.011
Corrup -0.594 0.646 -0.179 0.114 0.418 -0.102
InvestP 0.824 0.277 0.113 0.398 -0.045 -0.266
Gov. 0.888 0.166 -0.137 0.075 0.218 0.334
Notes: Bur=Quality of bureaucracy, Deac=Democratic accountability, Law=Rule of Law, Corrup=Corruption,
InvestP.=Investment profile, Gov=Government stability.
The results reporting in Table 4 indicate that the first principal component explains 37.40% of
the variance; the second principal component explains another 32.77% and so on. Following
the Kaiser criterion, we extract the first two principal components which explain together
70.17% of the information from the original variables. Next, we compute a weighted average
of these components by adjusting the percentages of variance to make their sum equal to one.
The overall index of institutional quality is obtained from the expression ttt PPF 2211 ,
where jP is the j-th principal component and j the corresponding weight. This index has been
rescaled to assume values between 0 and 10, with higher values indicating better institutional
quality.
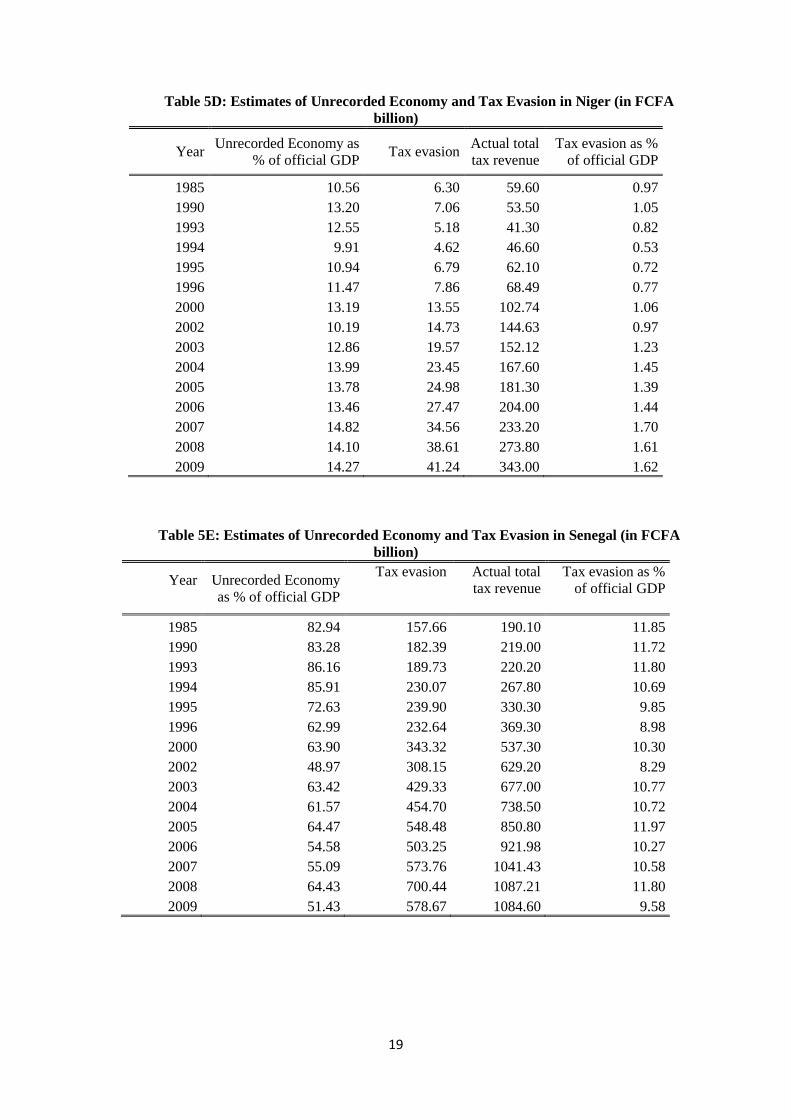
5.2 Measurement of the Unrecorded Economy and Tax Evasion
Different techniques are used to estimate the size of the underground economy. In this study,
we rely on the currency-money ratio method proposed by Tanzi (1983). This method has been
used successfully in the context of other developing countries, especially in Africa (see
Scheneider and Enste, 2000; Chipeta, 2002; Saunders and Loots, 2005; and Ocran, 2009, for
technical details). Table 5A presents the results for Cote d’Ivoire. Tables for other countries
are reported in appendices.
As can be seen from this Table, the unrecorded economy is sizable in Cote d’Ivoire, its share
in the official GDP averages about 45% over the period 2000-2009. In Senegal, the
unrecorded economy represents about 58% of GDP over the same period. In Niger, Mali and
Togo, it averages around 14%, 28% and 43% of GDP respectively. Table 5A also gives the
estimates of tax evasion in absolute terms and as a percentage of GDP. Tax evasion was
determined by multiplying the GDP of the unrecorded economy by the average tax rate in the
official economy. As seen in the table, tax evasion in Cote d’Ivoire is substantial and growing
over time due to the growth of unrecorded economy. Tax evasion varies between 400 and 770
billion over 2000-2009 and average tax evasion stands at about 6.7% of official GDP.
Therefore, the potential tax revenue is beyond FCFA 2 300 billion, which represents around
25% of GDP. In the other countries, revenue loss through tax evasion is also substantial and
growing over time. In Senegal, uncollected taxes are equivalent to about 10.4% of the GDP
and range between FCFA 400 and FCFA 500 billion. This is larger than the total health

11
expenditure. If all the taxes are collected, countries such as Cote d’Ivoire, Senegal and Togo
will reduce greatly their dependence on external aid.
Table 5A: Estimates of Unrecorded Economy and Tax Evasion in Côte d’Ivoire (in FCFA
billion)
Year
Unrecorded Economy
as % of official GDP
Tax evasion
Actual total tax
revenue Tax evasion as %
of official GDP
1985 39.76 246.88 621.00 7.88
1990 39.67 204.74 516.07 6.97
1993 38.95 169.50 435.20 5.42
1994 34.31 232.79 678.50 5.04
1995 36.64 328.81 897.40 5.99
1996 46.54 542.16 1040.70 8.73
2000 39.12 414.29 1077.50 5.59
2002 57.39 722.22 1259.30 9.02
2003 51.89 617.53 1190.10 7.73
2004 47.14 585.14 1241.35 7.15
2005 46.03 576.49 1251.10 6.68
2006 45.42 620.92 1364.00 6.84
2007 35.61 512.37 1438.90 5.40
2008 41.59 662.34 1592.60 6.32
2009 40.46 769.80 1888.70 7.00
Overall, the results suggest that tax reforms through tax rates reduction alone may not be
enough to check the growth of the underground economy. Efforts should aim at removing the
barriers to entry into the formal economy, including the reform of the tax administration
system and the simplification of its complexities. In this study, estimation of the size of the
unrecorded economy is not an end in itself. The results of this exercise will be used to
estimate the impact of unrecorded economy on tax performance. Size of unrecorded economy
will be used as proxy for tax morale and willingness to pay. A high unrecorded economy is
shown to be correlated with low tax moral, partly through lower moral cost of tax evasion and
otherwise weaker motivation to pays taxes. Thus, we expect countries with a large unrecorded
economy to have smaller levels of tax performance.
6. Empirical Results
We estimate the tax ratio model using the Pooled Mean Group estimators as explained in the
section on econometric methodology3. The results are given in Table 6. As shown by this
Table the coefficient on per capita GDP is significantly positive supporting the view that the
capacity to collect and pay taxes increases with the level of development. We find a negative
3 Before proceeding with the estimation we test for the order of integration of the series. The results indicate that
all the variables are non-stationary in their level, but achieve stationary status after first differencing. Next, we
test whether there is a long-run relationship between the variables. Tests statistics significantly reject the null of
no cointegration.

12
relationship between agriculture share and revenue performance. In UEMOA countries, a
large part of the agriculture sector is subsistence and then are hard to tax. Increasing the tax
performance will necessitate a structural transformation towards industrial sector which
contributes more to tax revenue relative to its value added. A positive relationship is obtained
between openness and revenue performance. One explanation for this finding is that trade-
related taxes are easier to impose because the goods enter or leave the country at specified
locations. Results also indicate that countries that rely more on taxes on goods and services as
a source of revenue have lower revenue performance. Although easier to imposed, taxes on
goods and services are subject to evasion, especially VAT and import taxes. This is
particularly true for Cote d’Ivoire where revenue loss on VAT exceeds FCFA 100 billion.
Moreover, most of indirect taxes tend to be regressive in nature and this exacerbates the
inequality in income distribution and reduces the tax base (Yéo, 2009).
Contrary to expectations strong and negative effect is obtained for the rate of urbanization.
This outcome could reflect to some extent that the nature of these economies largely informal.
Informal economy increases with urbanization and this sector is largely under-taxed. The
results indicate that quality of institutions is positively and significantly related to the tax ratio
while the unrecorded economy is negatively related. High share of unrecorded economy and
poor institutions are detrimental to taxes mobilization in UEMOA countries. As seen above,
countries of this area are located at the low side of institutional quality, which suggests that
further improvement of institutional quality is crucial to increase their tax performance. A
well-functioning institutional environment represents a source of comparative advantage for a
country in better mobilizing taxes and in promoting economic performance.
Table 5: Estimates of Tax Ratio Determinants in UEMOA Countries
Variables Coefficient S.E. z-ratio
Real income per capita (log) 31.86* 2.53 12.58
Trade openness 0.17* 0.04 3.76
Budget balance (% GDP) 0.33* 0.08 3.99
Inflation 0.01 0.03 0.16
Urbanisation -0.67* 0.17 -3.81
Share of agriculture in GDP -0.11 0.07 -1.53
Share of indirect taxes in total taxes -0.42* 0.08 -4.99
Institutional quality 1.41* 0.60 2.34
Unrecorded economy (% GDP) -0.02* 0.01 -2.11
The tax evasion of unrecorded activities results in substantial losses in tax revenue and
threatens the official tax collection system. In various sub-Saharan African countries
including UEMOA countries, the official trade for products such as second-hand cars, textiles,
cigarettes or alcohol suffers unfair competition from unrecorded sector, and the tax potential
is highly concentrated at the level of the largest and most honest firms. Tax evasion associated
with the unrecorded economy and ignorance of tax procedure are among major societal

13
factors hindering effective taxation in Côte d’Ivoire and Senegal. Despite liberalization and
tax reforms, the unrecorded economy remains sizable and growing, meaning that as yet these
reforms were not captured the evaded tax. Tax enforcement of large-scale unrecorded
activities should allow collection of indirect tax revenues, especially at the borders.
7. Conclusion
The tax systems of UEMOA member countries have undergone reforms in response to the
growing public sector expenditure requirements and for improving the incentive structure in
order to achieve development goals. The most notable reforms were taken after 1994 when
convergence criteria have been adopted. Despite these reforms, tax systems appear less
productive and dependent mainly on indirect taxes, especially VAT and trade taxes. Tax ratios
fail to reach 17% of GDP for most countries and the productivity of the tax system is
adversely affected by the low elasticity of taxes on domestic goods and services and imports.
In this paper we looked at some important determinants of tax performance of these countries
paying particular attention to institutional and economic factors. Results suggest that
unrecorded economy, poor quality of institutions, high share of agriculture and unrecorded
economy are among the most important determinants of the low tax performance of UEMOA
countries. The unrecorded economy is sizable and revenue losses through tax evasion are
substantial and increasing over time in many countries. Like most previous studies, the
important role played by per capita income and trade openness in improving the tax ratio is
confirmed in the case of UEMOA countries. We also found that greater reliance on taxing
goods and services lower tax performance. This is because taxes on goods and services are
more subject to evasion than income taxes.
Overall, the results provide a number of policy relevant implications. First, to enhance the tax-
generating capacity of their economies, UEMOA countries should make efforts to remove
administrative and tax barriers to entry into the formal economy and reduce the share of
under-taxed economy. Tax procedure and related administrative formalities should be
popularized. For tax fraud can be caused by the ignorance of tax procedure.
Second, efforts should be done to broaden tax bases and improve the tax collection by: i)
reducing exemptions and ineffective tax incentives, ii) improving efficiency of VAT, iii)
reducing fraud and tax evasion and iv) improving tax administration.
Third, governments should also try to improve some institutional aspects such as the rule of
law and governance as well as the responsiveness of governments to the demand of their
people. Governments should demonstrate to the public that tax revenues are being used to
provide high quality public infrastructure. These strategies could help gain the trust of the tax-
paying public and boost tax morale and trust in the fiscal system, all of which will entail
reducing the willingness to stay in the informal and unrecorded economy and widening the
tax base.

14
References
Bahl R.W. (1971), "A Regression Approach to Tax Effort and Tax Ratio Analysis",
International Monetary Fund Staff Papers 18(3), pp.570–612.
BCEAO (2006), Annuaire Statistique, 2006.
BCEAO (2010), Rapport annuel de la BCEAO 2010.
Bird R. M., Martinez-Vazquez J. & B. Torgler (2008), "Tax Effort in Developing Countries
and High Income Countries: The Impact of Corruption, Voice and Accountability", Economic
Analysis and Policy, 38(1), pp.55–71.
Chelliah R. J. (1971), "Trends in Taxation in Developing Countries", IMF Staff Papers 18(2),
pp. 254–325.
Chelliah Raja J., Hessel J. Baas & Margaret R. (1975), "Tax Ratios and Tax Effort in
Developing Countries", Staff Papers International Monetary Fund, 1, pp. 187–205.
Chipeta C (2002), "The Second Economy and Tax Yield in Malawi", African Economic
Research Consortium (AERC) Research Paper 113, Nairobi. Kenya.
Demetriades P. & Fielding D. (2009), "Information, Institutions and Banking Sector
Development in West Africa", University of Leicester Working Paper No.09/04.
Eltony M. N. (2002), "Determinants of Tax Efforts in Arab Countries", Arab Planning
Institute Working Paper Series 207, Kuwait.
Fall B. (1997), Le secteur informel dans la comptabilité nationale : Le cas du Sénégal,
AFRISTAT.
Friedman E., Johnson S, Kaufmann D. & Zoido-Lobaton (2000), "Dodging the Grabbing
Hand: The Determinants of Unofficial Activities in 69 Countries", Journal of Public
Economics, 76, pp.459–493.
Ghura D. (1998), "Tax Revenue in Sub Saharan Africa: Effects of Economic Policies and
Corruption", IMF Working Paper 98/135 (Washington: International Monetary Fund).
Gupta A. S. (2007), "Determinants of Tax Revenue Efforts in Developing Countries", IMF
Working Paper WP/07/184.
Lebart L., A. Morineau & Piron M. (1995), Statistique exploratoire multidimensionnelle,
Dunod, Paris.
Lotz J. R. & Morss E. R. (1969), "Tax Effort in Developing Countries", Finance and
Development 6(3), pp.36–39.
Leuthold J. H. (1991), "Tax Shares in Developing Countries: A Panel Study", Journal of
Development Economics, 35. pp. 173–85.
15
Mahdavi S (2007), "The Level and Composition of Tax Revenue in Developing Countries:
Evidence from unbalanced panel data", International Review of Economics and Finance (17),
pp. 607–617.
Mauro P. (1998), "Corruption and the Composition of Government Expenditure", Journal of
Public Economics, 69(2), pp. 263–279.
North D.C. (1990), Institutions. Institutional Change. and Economic Performance.
Cambridge University Press.
Ngoi G. K. (1997), Enquêtes sur le secteur informel en Tanzanie : méthodes, résultats et
problèmes de collecte de données, AFRISTAT.
Ocran M. K. (2009), "Estimating the size and trends of the second economy in Ghana", Final
report presented at the AERC Biannual Workshop. November 29 – 3 December 2009.
Nairobi. Kenya.
Osoro N. E. (1995), "Tax Reforms in Tanzania: Motivations, Directions and Implications",
AERC Research Paper No. 38, October, Nairobi.
Pesaran M. H. & Smith R. P. (1995), "Estimating Long-run Relationship from Dynamic
Heterogeneous Panel", Journal of Econometrics 68(1), 79–113.
Pesaran M. H., Shin Y. & Smith R. P. (1999), "Pooled Mean Group Estimation of Dynamic
Heterogeneous Panels", Journal of American Statistical Association 94(446), 621–634.
Saunders S & Loots E. (2005), "Measuring the informal economy in South Africa", South
African Journal of Economic and Management Sciences. 8(1), pp. 92 – 101.
Schneider F. & Enste D.H. (2000) "Shadow Economies: Size. Causes and Consequences",
Journal of Economic Literature. 38(1), pp.77–114.
Stotsky J. G. & WoldeMariam A. (1997), "Tax Effort in Sub-Saharan Africa", IMF
WP/97/107 73 (Washington: International Monetary Fund).
Tait A. & Gratz W. (1979), "International Comparisons of Taxation for Selected Developing
Countries 1972-76", Staff papers IMF, 26. pp. 123–56.
Tanzi V. (1981), "A Statistical Evaluation of Taxation in Sub-Saharan Africa", in Taxation in
Sub-Saharan Africa (Washington: International Monetary Fund). pp. 45–50.
Tanzi V. (1983), "The Underground Economy in the United States: Annual Estimates, 1930–
1980", IMF Staff Papers, 30, pp. 283–305.
Tanzi V. (1987), "Quantitative Characteristics of the Tax Systems of Developing Countries",
in The Theory of Taxation for Developing Countries, by David Newbery and Nicholas Stern
(New York: Oxford University Press). pp. 205–41.
Tanzi V. (1992), "Structural Factors and Tax Revenue in Developing Countries: A Decade of
Evidence", in Open Economies: Structural Adjustment and Agriculture, by Ian Goldin and L.
Alan Winters (Cambridge: Cambridge University Press). pp. 267–81.

16
Tanzi V. A. & Davoodi H. R. (2000), "Corruption, Growth and Public Finances", Washington
D.C. The International Monetary Fund, Fiscal Affairs Department, Working Paper No.182.
Togler B. (2007), Tax Compliance and Tax Morale: A Theoretical and Empirical Agenda,
Edward Elgar Publishing.
United Nations Millennium Project (2005), Investing in Development: A Practical Plan to
achieve the Millennium Development Goals (New York: United Nations).
World Health Organization (2002), Mobilization of Domestic resources For Health. Report of
Working Group 3 of the Commission on Macroeconomics and Health (Geneva: World Health
Organization).
Yeo N. (2009), "Evaluation des Effets de la Fiscalité Indirecte sur les Prix et le Bien-être des
Populations en Côte d’Ivoire", Politique Economique et Développement (PED), N° 05/2008,
Avril, CAPEC-CIRES, Abidjan, Côte d’Ivoire.

17
Appendices
Table 3C: Quality of institutions in East Asian Countries
Bureaucracy Investment profile Corruption
84-89 90-99 00-08 84-89 90-99 00-08 84-89 90-99 00-08
China 4.94 5.40 5.00 5.48 5.19 6.44 6.20 5.50 2.50
Hong Kong 7.08 7.30 7.50 5.78 5.31 9.13 8.33 7.43 6.23
Indonesia 0.00 4.02 5.56 4.80 5.64 4.59 0.65 3.63 1.92
Korea 7.55 8.23 7.50 7.03 5.69 7.69 3.56 6.88 4.29
Malaysia 6.60 6.00 7.50 5.00 6.24 6.98 7.31 6.46 4.33
Singapore 8.75 9.05 10.00 6.33 6.64 9.80 9.17 6.67 7.25
Thailand 7.66 7.74 5.00 5.65 5.19 7.31 5.00 4.74 2.75
Panel 6.08 6.82 6.87 5.72 5.70 7.42 5.75 5.90 4.18
Tableau 3D: Quality of institutions in East Asian Countries (continued)
Démocracy Rule of law Gouv. Stability
84-89 90-99 00-08 84-89 90-99 00-08 84-89 90-99 00-08
China 6.67 3.56 1.67 4.96 7.53 7.43 5.69 6.65 9.18
Hong Kong 4.26 3.75 3.56 8.33 8.22 7.81 5.22 5.17 8.03
Indonesia 5.00 4.54 7.21 3.19 5.68 3.80 5.25 6.33 6.73
Korea 3.33 7.46 9.95 3.84 6.96 7.38 5.89 6.57 6.67
Malaysia 8.33 6.71 4.58 7.41 6.85 5.46 4.41 7.58 8.68
Singapore 5.28 4.85 3.33 8.24 9.29 9.21 6.42 7.63 9.17
Thailand 4.00 6.06 6.79 5.49 7.90 6.38 6.05 5.71 8.07
Panel 5.27 5.27 5.30 5.92 7.49 6.78 5.56 6.52 8.07
Table 5A: Estimates of Unrecorded Economy and Tax Evasion in Côte d’Ivoire (in FCFA
billion)
Year
Unrecorded Economy
as % of official GDP
Tax evasion
Actual total tax
revenue Tax evasion as %
of official GDP
1985 39.76 246.88 621.00 7.88
1990 39.67 204.74 516.07 6.97
1993 38.95 169.50 435.20 5.42
1994 34.31 232.79 678.50 5.04
1995 36.64 328.81 897.40 5.99
1996 46.54 542.16 1040.70 8.73
2000 39.12 414.29 1077.50 5.59
2002 57.39 722.22 1259.30 9.02
2003 51.89 617.53 1190.10 7.73
2004 47.14 585.14 1241.35 7.15
2005 46.03 576.49 1251.10 6.68
2006 45.42 620.92 1364.00 6.84
2007 35.61 512.37 1438.90 5.40
2008 41.59 662.34 1592.60 6.32
2009 40.46 769.80 1888.70 7.00

18
Table 5B: Estimates of Unrecorded Economy and Tax Evasion in Burkina Faso (in FCFA
billion)
Year
Unrecorded Economy
as % of official GDP
Tax evasion
Actual total
tax revenue
Tax evasion as %
of official GDP
1985 28.91 14.82 51.26 2.12
1990 41.37 31.62 76.43 3.75
1993 41.41 30.07 72.60 3.32
1994 42.51 44.29 104.20 4.21
1995 57.17 73.15 127.95 6.16
1996 49.82 74.17 148.87 5.61
2000 42.74 86.72 202.92 4.66
2002 23.07 55.59 240.90 2.42
2003 45.72 123.50 270.09 4.98
2004 39.14 121.47 310.35 4.50
2005 30.53 100.72 329.94 3.52
2006 30.43 110.26 362.38 3.65
2007 31.93 129.40 405.20 3.99
2008 29.39 130.70 444.70 3.63
2009 34.29 160.69 494.60 4.18
Table 5C: Estimates of Unrecorded Economy and Tax Evasion in Mali (in FCFA billion)
Year Unrecorded Economy
as % of official GDP Tax evasion
Actual total
tax revenue
Tax evasion as %
of official GDP
1985 24.43 17.16 47.00 2.91
1990 38.54 25.40 65.90 3.85
1993 36.63 30.66 83.70 4.04
1994 23.12 23.86 103.20 2.44
1995 25.95 34.12 131.50 2.77
1996 26.76 51.87 193.80 3.87
2000 35.78 93.49 261.30 5.42
2002 27.28 83.48 306.00 3.58
2003 24.64 86.01 349.10 3.39
2004 26.34 103.61 393.30 4.02
2005 26.01 116.06 446.20 4.15
2006 26.10 122.70 470.20 4.00
2007 26.88 130.97 487.20 3.82
2008 26.12 135.76 519.80 3.48
2009 25.93 136.48 624.30 3.21
19
Table 5D: Estimates of Unrecorded Economy and Tax Evasion in Niger (in FCFA
billion)
Year Unrecorded Economy as
% of official GDP Tax evasion
Actual total
tax revenue
Tax evasion as %
of official GDP
1985 10.56 6.30 59.60 0.97
1990 13.20 7.06 53.50 1.05
1993 12.55 5.18 41.30 0.82
1994 9.91 4.62 46.60 0.53
1995 10.94 6.79 62.10 0.72
1996 11.47 7.86 68.49 0.77
2000 13.19 13.55 102.74 1.06
2002 10.19 14.73 144.63 0.97
2003 12.86 19.57 152.12 1.23
2004 13.99 23.45 167.60 1.45
2005 13.78 24.98 181.30 1.39
2006 13.46 27.47 204.00 1.44
2007 14.82 34.56 233.20 1.70
2008 14.10 38.61 273.80 1.61
2009 14.27 41.24 343.00 1.62
Table 5E: Estimates of Unrecorded Economy and Tax Evasion in Senegal (in FCFA
billion)
Year
Unrecorded Economy
as % of official GDP
Tax evasion
Actual total
tax revenue
Tax evasion as %
of official GDP
1985 82.94 157.66 190.10 11.85
1990 83.28 182.39 219.00 11.72
1993 86.16 189.73 220.20 11.80
1994 85.91 230.07 267.80 10.69
1995 72.63 239.90 330.30 9.85
1996 62.99 232.64 369.30 8.98
2000 63.90 343.32 537.30 10.30
2002 48.97 308.15 629.20 8.29
2003 63.42 429.33 677.00 10.77
2004 61.57 454.70 738.50 10.72
2005 64.47 548.48 850.80 11.97
2006 54.58 503.25 921.98 10.27
2007 55.09 573.76 1041.43 10.58
2008 64.43 700.44 1087.21 11.80
2009 51.43 578.67 1084.60 9.58

20
Table 5F: Estimates of Unrecorded Economy and Tax Evasion in Togo (in FCFA billion)
Year
Unrecorded Economy
as % of official GDP
Tax evasion
Actual total
tax revenue
Tax evasion as %
of official GDP
1985 40.19 30.58 76.09 8.93
1990 61.94 46.63 75.28 10.52
1993 16.45 4.69 28.54 1.34
1994 41.77 22.43 53.69 4.11
1995 36.02 29.60 82.16 4.53
1996 43.08 40.80 94.71 5.44
2000 32.00 33.24 103.87 3.51
2002 52.63 63.36 120.39 6.16
2003 58.23 74.59 128.10 7.30
2004 46.34 64.41 139.00 5.92
2005 58.42 90.11 154.25 8.10
2006 43.82 75.01 171.19 6.47
2007 43.51 82.82 190.37 6.92
2008 30.31 50.72 211.20 3.91
2009 22.62 30.17 229.10 2.24