Detection of red attack stage mountain pine beetle infestation with high spatial resolution...
12
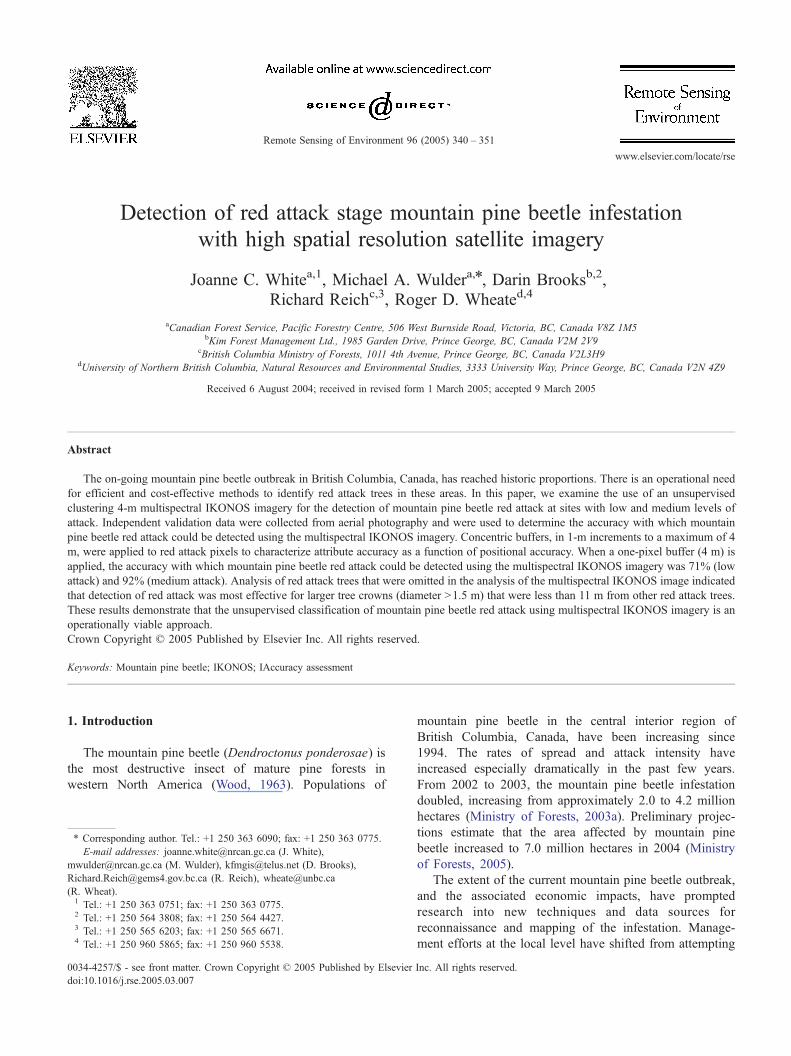
Detection of red attack stage mountain pine beetle infestation with high spatial resolution satellite imagery Joanne C. White a,1 , Michael A. Wulder a, * , Darin Brooks b,2 , Richard Reich c,3 , Roger D. Wheate d,4 a Canadian Forest Service, Pacific Forestry Centre, 506 West Burnside Road, Victoria, BC, Canada V8Z 1M5 b Kim Forest Management Ltd., 1985 Garden Drive, Prince George, BC, Canada V2M 2V9 c British Columbia Ministry of Forests, 1011 4th Avenue, Prince George, BC, Canada V2L3H9 d University of Northern British Columbia, Natural Resources and Environmental Studies, 3333 University Way, Prince George, BC, Canada V2N 4Z9 Received 6 August 2004; received in revised form 1 March 2005; accepted 9 March 2005 Abstract The on-going mountain pine beetle outbreak in British Columbia, Canada, has reached historic proportions. There is an operational need for efficient and cost-effective methods to identify red attack trees in these areas. In this paper, we examine the use of an unsupervised clustering 4-m multispectral IKONOS imagery for the detection of mountain pine beetle red attack at sites with low and medium levels of attack. Independent validation data were collected from aerial photography and were used to determine the accuracy with which mountain pine beetle red attack could be detected using the multispectral IKONOS imagery. Concentric buffers, in 1-m increments to a maximum of 4 m, were applied to red attack pixels to characterize attribute accuracy as a function of positional accuracy. When a one-pixel buffer (4 m) is applied, the accuracy with which mountain pine beetle red attack could be detected using the multispectral IKONOS imagery was 71% (low attack) and 92% (medium attack). Analysis of red attack trees that were omitted in the analysis of the multispectral IKONOS image indicated that detection of red attack was most effective for larger tree crowns (diameter >1.5 m) that were less than 11 m from other red attack trees. These results demonstrate that the unsupervised classification of mountain pine beetle red attack using multispectral IKONOS imagery is an operationally viable approach. Crown Copyright D 2005 Published by Elsevier Inc. All rights reserved. Keywords: Mountain pine beetle; IKONOS; IAccuracy assessment 1. Introduction The mountain pine beetle (Dendroctonus ponderosae ) is the most destructive insect of mature pine forests in western North America (Wood, 1963). Populations of mountain pine beetle in the central interior region of British Columbia, Canada, have been increasing since 1994. The rates of spread and attack intensity have increased especially dramatically in the past few years. From 2002 to 2003, the mountain pine beetle infestation doubled, increasing from approximately 2.0 to 4.2 million hectares (Ministry of Forests, 2003a). Preliminary projec- tions estimate that the area affected by mountain pine beetle increased to 7.0 million hectares in 2004 (Ministry of Forests, 2005). The extent of the current mountain pine beetle outbreak, and the associated economic impacts, have prompted research into new techniques and data sources for reconnaissance and mapping of the infestation. Manage- ment efforts at the local level have shifted from attempting 0034-4257/$ - see front matter. Crown Copyright D 2005 Published by Elsevier Inc. All rights reserved. doi:10.1016/j.rse.2005.03.007 * Corresponding author. Tel.: +1 250 363 6090; fax: +1 250 363 0775. E-mail addresses: [email protected] (J. White), [email protected] (M. Wulder), [email protected] (D. Brooks), [email protected] (R. Reich), [email protected] (R. Wheat). 1 Tel.: +1 250 363 0751; fax: +1 250 363 0775. 2 Tel.: +1 250 564 3808; fax: +1 250 564 4427. 3 Tel.: +1 250 565 6203; fax: +1 250 565 6671. 4 Tel.: +1 250 960 5865; fax: +1 250 960 5538. Remote Sensing of Environment 96 (2005) 340 – 351 www.elsevier.com/locate/rse
-
Upload
independent -
Category
Documents
-
view
0 -
download
0
Transcript of Detection of red attack stage mountain pine beetle infestation with high spatial resolution...
www.elsevier.com/locate/rse
Remote Sensing of Environm
Detection of red attack stage mountain pine beetle infestation
with high spatial resolution satellite imagery
Joanne C. Whitea,1, Michael A. Wuldera,*, Darin Brooksb,2,
Richard Reichc,3, Roger D. Wheated,4
aCanadian Forest Service, Pacific Forestry Centre, 506 West Burnside Road, Victoria, BC, Canada V8Z 1M5bKim Forest Management Ltd., 1985 Garden Drive, Prince George, BC, Canada V2M 2V9
cBritish Columbia Ministry of Forests, 1011 4th Avenue, Prince George, BC, Canada V2L3H9dUniversity of Northern British Columbia, Natural Resources and Environmental Studies, 3333 University Way, Prince George, BC, Canada V2N 4Z9
Received 6 August 2004; received in revised form 1 March 2005; accepted 9 March 2005
Abstract
The on-going mountain pine beetle outbreak in British Columbia, Canada, has reached historic proportions. There is an operational need
for efficient and cost-effective methods to identify red attack trees in these areas. In this paper, we examine the use of an unsupervised
clustering 4-m multispectral IKONOS imagery for the detection of mountain pine beetle red attack at sites with low and medium levels of
attack. Independent validation data were collected from aerial photography and were used to determine the accuracy with which mountain
pine beetle red attack could be detected using the multispectral IKONOS imagery. Concentric buffers, in 1-m increments to a maximum of 4
m, were applied to red attack pixels to characterize attribute accuracy as a function of positional accuracy. When a one-pixel buffer (4 m) is
applied, the accuracy with which mountain pine beetle red attack could be detected using the multispectral IKONOS imagery was 71% (low
attack) and 92% (medium attack). Analysis of red attack trees that were omitted in the analysis of the multispectral IKONOS image indicated
that detection of red attack was most effective for larger tree crowns (diameter >1.5 m) that were less than 11 m from other red attack trees.
These results demonstrate that the unsupervised classification of mountain pine beetle red attack using multispectral IKONOS imagery is an
operationally viable approach.
Crown Copyright D 2005 Published by Elsevier Inc. All rights reserved.
Keywords: Mountain pine beetle; IKONOS; IAccuracy assessment
1. Introduction
The mountain pine beetle (Dendroctonus ponderosae) is
the most destructive insect of mature pine forests in
western North America (Wood, 1963). Populations of
0034-4257/$ - see front matter. Crown Copyright D 2005 Published by Elsevier
doi:10.1016/j.rse.2005.03.007
* Corresponding author. Tel.: +1 250 363 6090; fax: +1 250 363 0775.
E-mail addresses: [email protected] (J. White),
[email protected] (M. Wulder), [email protected] (D. Brooks),
[email protected] (R. Reich), [email protected]
(R. Wheat).1 Tel.: +1 250 363 0751; fax: +1 250 363 0775.2 Tel.: +1 250 564 3808; fax: +1 250 564 4427.3 Tel.: +1 250 565 6203; fax: +1 250 565 6671.4 Tel.: +1 250 960 5865; fax: +1 250 960 5538.
mountain pine beetle in the central interior region of
British Columbia, Canada, have been increasing since
1994. The rates of spread and attack intensity have
increased especially dramatically in the past few years.
From 2002 to 2003, the mountain pine beetle infestation
doubled, increasing from approximately 2.0 to 4.2 million
hectares (Ministry of Forests, 2003a). Preliminary projec-
tions estimate that the area affected by mountain pine
beetle increased to 7.0 million hectares in 2004 (Ministry
of Forests, 2005).
The extent of the current mountain pine beetle outbreak,
and the associated economic impacts, have prompted
research into new techniques and data sources for
reconnaissance and mapping of the infestation. Manage-
ment efforts at the local level have shifted from attempting
ent 96 (2005) 340 – 351
Inc. All rights reserved.
J.C. White et al. / Remote Sensing of Environment 96 (2005) 340–351 341
to address all levels of infestation across the landscape, to
the detection and mitigation of sites with minimal levels of
infestation. The objective of this shift in management
efforts is to reduce or contain the outbreak to a size and
distribution that can be handled within the capacity of the
existing forest industry infrastructure. Detection and map-
ping of current impact enables planning and mitigation
activities, and serves as a driver for parameterizing models
of beetle spread which are designed to reduce future risks
and impacts.
In general, mountain pine beetles in British Columbia
reproduce at a rate of one generation per year (Safranyik
et al., 1974). Adult beetles typically attack trees in
August, and lay eggs that develop into mature adults
approximately one year later. The beetles must attack in
large numbers to overcome the defenses of a healthy tree
and this is referred to as mass-attack. Once killed, but still
with green foliage, the host tree is in the green-attack
stage. The foliage of the host tree changes gradually.
Twelve-months after being attacked, over 90% of the
killed-trees will have red needles (red attack). Three years
after being attacked, most trees will have lost all needles
(gray attack) (Ministry of Forests, 1995). Generally, the
foliage fades from green to yellow to red over the spring
and summer following attack (Amman, 1982; Henigman
et al., 1999). The leaves gradually desiccate and the
pigments break down; initially the green chlorophyll
pigments are lost, then the yellow carotenes and red
anthocyanins (Hill et al., 1967). Slowly, the needles drop
until the tree is completely defoliated.
Knowledge of the spatial locations of mountain pine
beetle infestations is required for a range of management
activities. The identification of mountain pine beetle red
attack occurs at three different scales in British Columbia,
Canada: province-wide, landscape, and local. Over the
entire province, the Ministry of Forests is primarily
interested in the detection of red attack stage trees, as
opposed to green or gray attack (Wiart, 2003). Red attack
indicates mortality, and at the provincial scale, the amount
of mortality caused by mountain pine beetle has implica-
tions for strategic planning (e.g. allocation of mitigation
funding) and timber supply analysis.
At landscape scales, estimates of mountain pine beetle
impact are used for expediting the deployment of field
crews to areas which are eligible for suppression activities,
or which require sanitation harvesting. Surveys at this
scale are typically completed using a helicopter with a
global positioning system (GPS). Another method of
detecting and mapping mountain pine beetle red attack at
this scale is with 1 :30,000 aerial photography. At local
scales, field crews complete surveys of red attack trees for
the purposes of designing logging and sanitation plans.
The locations of red attack trees are also used to aid in the
determination of the probable locations of green-attack
trees in support of strategic planning and suppression
activities.
2. Using remotely sensed data for red attack mapping
The three critical data collection requirements for the
detection and mapping of mountain pine beetle red attack
are (Wiart, 2003):
& Accuracy (e.g. Is the resolution of the acquisition
appropriate for the task?)
& Consistency (e.g. Can the detection method be replicated
with a sufficient level of confidence over a variety of
stand and biogeoclimatic conditions?)
& Timeliness (e.g. Can the detection method be used to
acquire and deliver large amounts of data to satisfy beetle
management plan timelines for probing, layout, and
treatment?)
These three critical factors cannot be considered without
also weighing the costs associated with data acquisition.
Several remotely sensed data sources are currently used
operationally to detect and map red attack. Detection and
mapping of red attack have also been demonstrated with
other sources of remotely sensed data such as medium and
high spatial resolution satellite imagery; these data sources
may provide information where operational methods are
unavailable, logistically difficult to execute (e.g. weather,
accessibility), or where retrospective analyses are required
and historical data has not been collected.
2.1. Existing detection and mapping methods
In order to gather synoptic information on forest health at
the provincial scale, an aerial sketch-mapping program is
conducted on an annual basis. This broad survey encom-
passes several pests and forest health issues, including
mountain pine beetle red attack (Westfall, 2003). The red
attack detection information from the aerial sketch mapping
program is primarily used for strategic planning, the
identification of areas requiring more intensive survey, and
for the allocation of mitigation resources (Ministry of
Forests, 2003b). In addition, this information is used to
adjust the annual allowable cut and timber supply forecasts
(Ministry of Forests, 2003a). Due to its cost effectiveness
and the speed with which the data can be collected and
made available to forest managers, aerial overview sketch
mapping is unparalleled in the broad, provincial-scale
detection and mapping of mountain pine beetle red attack
damage.
At the landscape scale, helicopter GPS surveys are used
to identify red attack trees in areas that are eligible for
suppression activities (e.g. areas with low levels of
infestation). The helicopter is positioned over a cluster of
red attack trees and GPS location information is collected at
the centroid of the infestation cluster. For each cluster, the
number of infested trees is estimated and the infesting insect
species recorded. The size of the clusters may vary;
however, the maximum cluster size is considered to have
J.C. White et al. / Remote Sensing of Environment 96 (2005) 340–351342
a radius of 100 m. Cluster area, shape, and compactness are
not recorded (Nelson et al., 2004). Field crews will
subsequently use the position of cluster centroids to conduct
large sweeps (approximately 100 m wide) for identifying
green-attack trees. These green-attack trees will then be
removed in an effort to mitigate the infestation.
Both aerial overview sketch mapping and helicopter GPS
surveys rely heavily on the interpreter’s ability to make
instantaneous decisions regarding tree species, damage
agent, location, and severity of observed disturbances.
These survey approaches are subjective and the accuracy
with which red attack damage may be detected and mapped
can vary considerably based on the interpreter’s experience
and preferences (Ministry of Forests and Canadian Forest
Service, 2000). In addition, the collected data cannot easily
be statistically analyzed due to the nature of the attributes
collected (e.g. qualitative or estimated quantitative), and in
the case of aerial overview sketch mapping — the coarse
nature of the polygon delineation.
Aerial photography is also used to detect and map
mountain pine beetle red attack at the landscape scale. There
are several advantages to the use of air photos for red attack
mapping. Firstly, air photos provide a permanent record of the
survey, so unlike other survey methods (i.e. overview surveys
and helicopter GPS), the data (image) is captured and then the
attack interpreted. In this way, the air photos facilitate
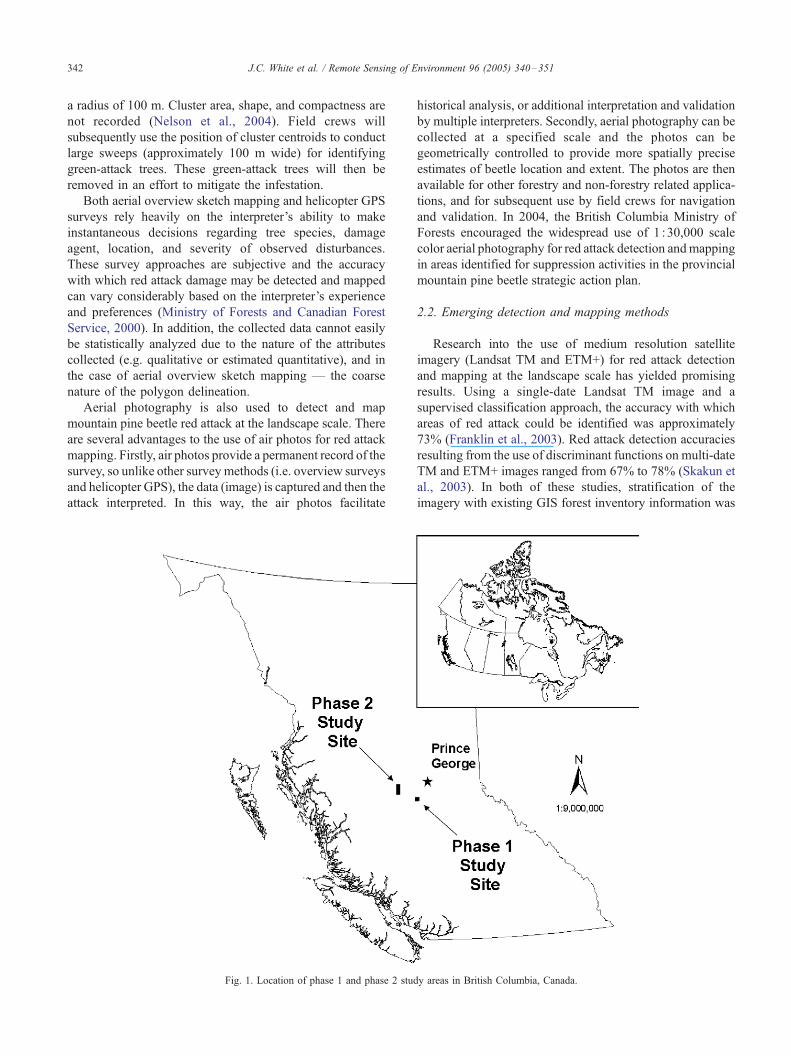
Fig. 1. Location of phase 1 and phase 2 stud
historical analysis, or additional interpretation and validation
by multiple interpreters. Secondly, aerial photography can be
collected at a specified scale and the photos can be
geometrically controlled to provide more spatially precise
estimates of beetle location and extent. The photos are then
available for other forestry and non-forestry related applica-
tions, and for subsequent use by field crews for navigation
and validation. In 2004, the British Columbia Ministry of
Forests encouraged the widespread use of 1 :30,000 scale
color aerial photography for red attack detection andmapping
in areas identified for suppression activities in the provincial
mountain pine beetle strategic action plan.
2.2. Emerging detection and mapping methods
Research into the use of medium resolution satellite
imagery (Landsat TM and ETM+) for red attack detection
and mapping at the landscape scale has yielded promising
results. Using a single-date Landsat TM image and a
supervised classification approach, the accuracy with which
areas of red attack could be identified was approximately
73% (Franklin et al., 2003). Red attack detection accuracies
resulting from the use of discriminant functions on multi-date
TM and ETM+ images ranged from 67% to 78% (Skakun et
al., 2003). In both of these studies, stratification of the
imagery with existing GIS forest inventory information was
y areas in British Columbia, Canada.
J.C. White et al. / Remote Sensing of Environment 96 (2005) 340–351 343
used to constrain the natural variability in the stand, thereby
reducing spectral edge effects occurring along cut-block,
road, river, and lake edges, and enhancing the difference in
spectral response between red attack and non-attack. The 30-
m spatial resolution of Landsat TM/ETM+ resulted in more
accurate detection of larger areas of red attack; however,
while smaller, dispersed patches of red attack were also
detectable with a reasonable level of accuracy (Franklin et al.,
2003; Skakun et al., 2003), these results indicate that a higher
spatial resolution data source could be more effective at
identifying small and dispersed areas of red attack damage.
The availability of commercially delivered, high spatial
resolution satellite data offers a potential source for cost-
effective collection of accurate, consistent, and timely data
regarding mountain pine beetle impacts at both landscape
and local scales. The imagery has a high level of spatial
detail combined with a large spatial extent. For example,
the spatial extent of IKONOS and QuickBird images are
121 and 272 km2 respectively, compared to a spatial extent
of 47 km2 for a 1 : 20,000 air photo. Unsupervised
classification algorithms may be used to isolate red attack
damage, reducing issues of inconsistency in photo inter-
pretation. High spatial resolution imagery (e.g. 4-m multi-
spectral IKONOS) has smaller pixels than medium
resolution imagery (e.g. 30-m Landsat TM/ETM+); these
smaller IKONOS pixels are closer to the size of the target
object of interest (individual tree crowns). Fewer objects
(trees) are found within each multispectral IKONOS pixel,
reducing the effect of mixed pixels. A 30-m Landsat pixel
will encompass multiple tree crowns (at various stages of
infestation), resulting in a weakened spectral response
when the red attack occurs in small patches dispersed
across the landscape. In contrast, a single multispectral
IKONOS pixel may contain only two or three tree crowns,
depending on the size of the tree crowns.
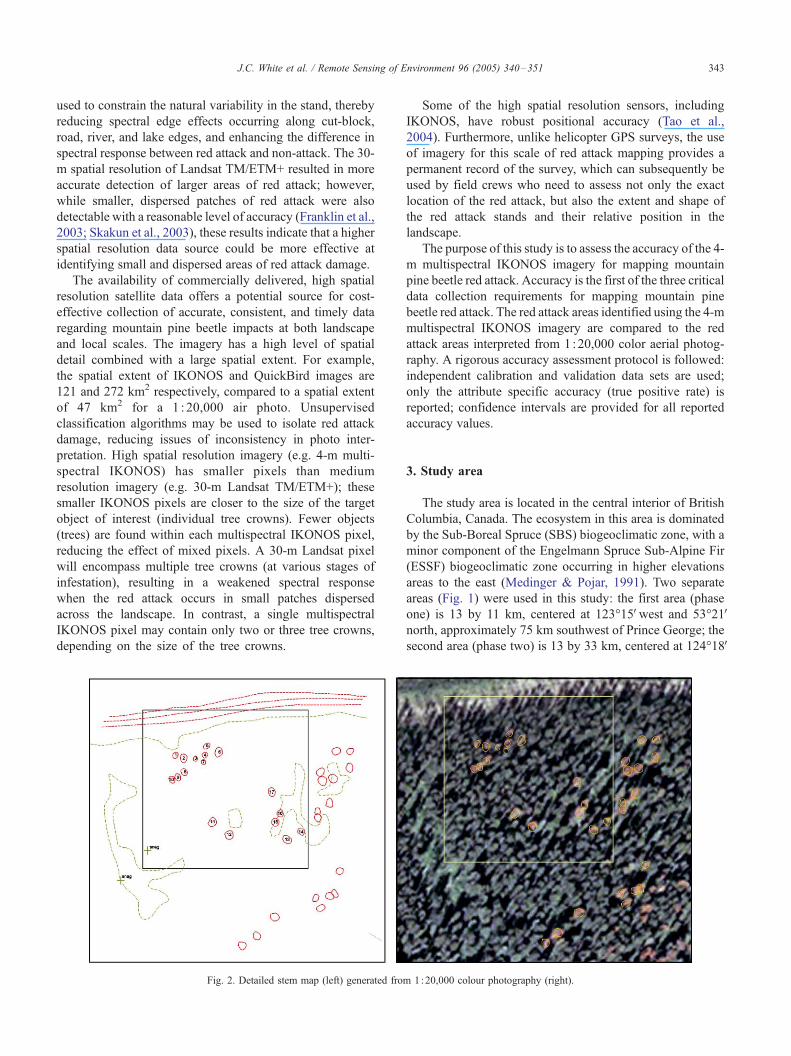
Fig. 2. Detailed stem map (left) generated from
Some of the high spatial resolution sensors, including
IKONOS, have robust positional accuracy (Tao et al.,
2004). Furthermore, unlike helicopter GPS surveys, the use
of imagery for this scale of red attack mapping provides a
permanent record of the survey, which can subsequently be
used by field crews who need to assess not only the exact
location of the red attack, but also the extent and shape of
the red attack stands and their relative position in the
landscape.
The purpose of this study is to assess the accuracy of the 4-
m multispectral IKONOS imagery for mapping mountain
pine beetle red attack. Accuracy is the first of the three critical
data collection requirements for mapping mountain pine
beetle red attack. The red attack areas identified using the 4-m
multispectral IKONOS imagery are compared to the red
attack areas interpreted from 1:20,000 color aerial photog-
raphy. A rigorous accuracy assessment protocol is followed:
independent calibration and validation data sets are used;
only the attribute specific accuracy (true positive rate) is
reported; confidence intervals are provided for all reported
accuracy values.
3. Study area
The study area is located in the central interior of British
Columbia, Canada. The ecosystem in this area is dominated
by the Sub-Boreal Spruce (SBS) biogeoclimatic zone, with a
minor component of the Engelmann Spruce Sub-Alpine Fir
(ESSF) biogeoclimatic zone occurring in higher elevations
areas to the east (Medinger & Pojar, 1991). Two separate
areas (Fig. 1) were used in this study: the first area (phase
one) is 13 by 11 km, centered at 123-15Vwest and 53-21Vnorth, approximately 75 km southwest of Prince George; the
second area (phase two) is 13 by 33 km, centered at 124-18V
1 :20,000 colour photography (right).
J.C. White et al. / Remote Sensing of Environment 96 (2005) 340–351344
west and 53-39Vnorth, approximately 120 km west of Prince
George. Elevations in the first area range from 640 to 1280
m, while elevations in the second area range from 850
to 1500 m.
The provincial forest inventory data indicates that the
leading species in both study areas are dominated by mature
lodgepole pine (Pinus contorta), which comprises 77% of
the productive forest area. The second most common
leading species is spruce (Picea spp.), comprising 19% of
the productive forest area. Other minor leading species
include alpine fir (Abies lasiocarpa) (at higher elevations)
and aspen (Populus tremuloides). The lodgepole pine stands
are characterized by an average age of 105 years, an average
height of 19 m, and an average crown closure of 48%.
Average stand density for these lodgepole pine stands is
1600 stems per hectare, with an average stand volume of
171 m3, or a total volume of 270,857 m3.
4. Data
4.1. Field data
Field crews were dispatched to validate the location and
confirm the status of each of the red attack trees delineated
on the photo interpreter’s detailed stem map. Six field sites
were visited; two of the sites were surveyed on April 28,
2003 and the remaining four sites were surveyed on May 12,
2003. For each tree at each test site, field crews collected the
following information: tree species, species of bark beetle
present, attack severity, diameter at breast height, and
foliage color. Errors of omission (red attack trees missed
by the photo interpreters) and commission (trees errone-
ously identified as red attack that were not red attack) were
also noted by the field crew.
4.2. Aerial photography
Standard color aerial photography, at 1 :20,000 scale,
was used as a source of validation data in this project. The
color aerial photography was collected on October 16, 2002.
The aerial photography was orthorectified using an auto-
mated aerotriangulation process (ImageStation Automatic
Triangulation).
4.3. High spatial resolution remotely sensed data
The high spatial resolution remotely sensed data used for
this project was the 4-m multispectral IKONOS data,
acquired the same day as the aerial photography (October
16, 2002). The multispectral IKONOS image was a
georeferenced product with a positional accuracy of 15 m
(Dial et al., 2003). The IKONOS satellite, launched in 1999,
collects 1-m panchromatic and 4-m multispectral images
concurrently. The IKONOS instrument has global coverage,
a consistent acquisition schedule, and the capability to
acquire imagery with near nadir viewing angles. The
resolution of the sensor is suitable for high accuracy
photogrammetric processing and mapping applications
(Tao et al., 2004). With the robust geometric accuracy of
the IKONOS sensor, 1 : 10,000 scale mapping can be
produced without ground control and 1 :2400 scale mapping
with ground control (Dial et al., 2003). The 4-m multi-
spectral data has similar spectral properties in the visible and
near infrared wavelengths as Landsat ETM+ (Goward et al.,
2003). With these spectral and spatial properties, IKONOS
offers potential for natural resource applications (Goetz et
al., 2003; Hurtt et al., 2003).
5. Methods
The project was completed in two phases, with each
phase conducted in a separate geographic area (Fig. 1). The
phase one area was used to confirm that 1 :20,000 color
aerial photography was a suitable surrogate for ground data
for validating the presence of mountain pine beetle red
attack. In the phase two area, a 4-m multispectral IKONOS
image was classified, and areas of red attack were identified.
The red attack areas identified from the IKONOS image
were then validated against detailed stem maps of red attack
trees, which were generated by photo interpreters using
1 :20,000 color aerial photography.
5.1. Phase 1: Aerial photography as a surrogate for field
data collection
The first phase of the project assessed the suitability of
1 :20,000 color aerial photography to serve as a surrogate
for ground validation data. A strong correspondence
between the number and location of red trees identified
by ground survey, and the number and location of red trees
identified through the interpretation of air photos would
greatly reduce the costs and time associated with the
collection of validation data. (Field surveys cost approx-
imately $11.00 CAD/ha, while surveys using 1 :30,000 air
photos cost approximately $0.15 CAD/ha.) Six 1-ha test
sites were selected at random using a numbered grid
overlaid on the phase one study area. A map of the six test
site locations, and the air photos associated with each test
site, were provided to an independent third party photo-
grammetric specialist (with extensive experience in air
photo interpretation and local knowledge of the study
area). Red attack tree crowns were identified and
delineated with stereo pairs of air photos using DiAP
Viewer, a Microstation compatible digital photogrammetric
system. Each attacked tree was given a unique identifier
and a distance and bearing from a known feature in the
test site. With this method, a detailed stem map was
compiled for each of the six test sites (see example in Fig.
2). The photo interpreter was certified and had local
knowledge of the study area.
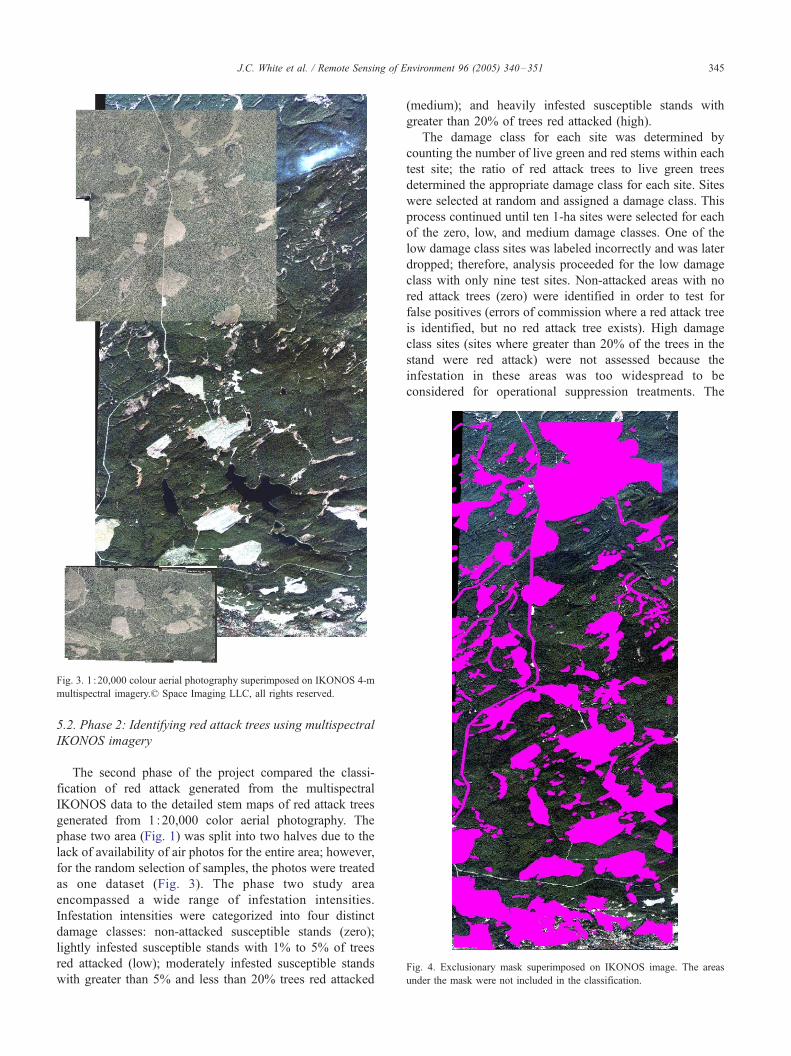
Fig. 4. Exclusionary mask superimposed on IKONOS image. The areas
under the mask were not included in the classification.
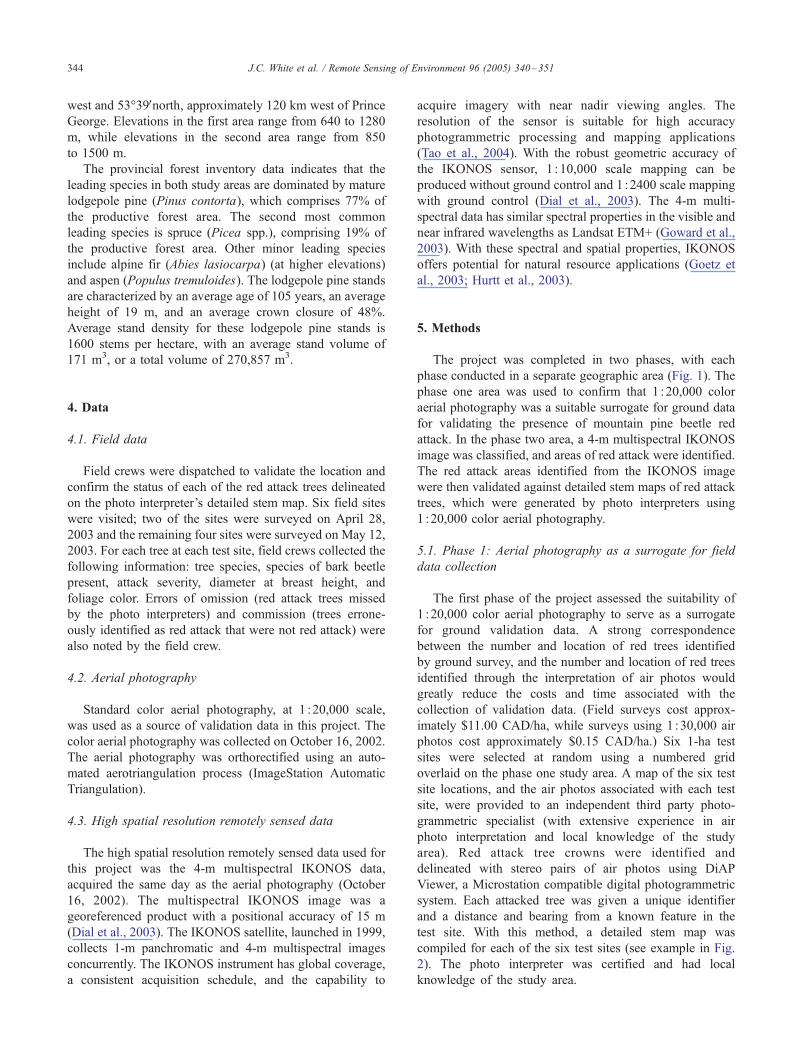
Fig. 3. 1 :20,000 colour aerial photography superimposed on IKONOS 4-m
multispectral imagery.* Space Imaging LLC, all rights reserved.
J.C. White et al. / Remote Sensing of Environment 96 (2005) 340–351 345
5.2. Phase 2: Identifying red attack trees using multispectral
IKONOS imagery
The second phase of the project compared the classi-
fication of red attack generated from the multispectral
IKONOS data to the detailed stem maps of red attack trees
generated from 1:20,000 color aerial photography. The
phase two area (Fig. 1) was split into two halves due to the
lack of availability of air photos for the entire area; however,
for the random selection of samples, the photos were treated
as one dataset (Fig. 3). The phase two study area
encompassed a wide range of infestation intensities.
Infestation intensities were categorized into four distinct
damage classes: non-attacked susceptible stands (zero);
lightly infested susceptible stands with 1% to 5% of trees
red attacked (low); moderately infested susceptible stands
with greater than 5% and less than 20% trees red attacked
(medium); and heavily infested susceptible stands with
greater than 20% of trees red attacked (high).
The damage class for each site was determined by
counting the number of live green and red stems within each
test site; the ratio of red attack trees to live green trees
determined the appropriate damage class for each site. Sites
were selected at random and assigned a damage class. This
process continued until ten 1-ha sites were selected for each
of the zero, low, and medium damage classes. One of the
low damage class sites was labeled incorrectly and was later
dropped; therefore, analysis proceeded for the low damage
class with only nine test sites. Non-attacked areas with no
red attack trees (zero) were identified in order to test for
false positives (errors of commission where a red attack tree
is identified, but no red attack tree exists). High damage
class sites (sites where greater than 20% of the trees in the
stand were red attack) were not assessed because the
infestation in these areas was too widespread to be
considered for operational suppression treatments. The

Table 1
Parameters used for unsupervised clustering algorithm (ISODATA)
Parameter Value
Mask Exclusionary mask
Desired number of clusters 255
Minimum number of clusters 255
Maximum number of clusters 255
Maximum iterations 10, 50, 100, 200, 500, 1000
Movement threshold 0.01
Lumping threshold 1
Number of samples 262144
J.C. White et al. / Remote Sensing of Environment 96 (2005) 340–351346
objective of the detection and mapping exercise presented in
this paper was to identify small, scattered infestations
suitable for suppression activities. The process for generat-
ing the detailed stem maps from the stereo air photo pairs
was identical to that described in under the methods for
phase one of this project.
An image mask was generated from features in an
ancillary GIS database. The mask was designed to exclude
features such as logged areas, water bodies, and cloud
cover from the classification (Fig. 4). The purpose of using
the mask was to reduce the spectral variability inherent to
forest stands (Franklin et al., 2003). An unsupervised
classification (ISODATA) of the multispectral IKONOS
imagery was then used to delineate the red attack trees.
The unsupervised approach was selected to diminish the
requirement for training data (Franklin et al., 2003). The
parameters used in the clustering algorithm are provided in
Table 1. An independent set of calibration data was used to
identify which clusters corresponded to red attack loca-
tions. The calibration data consisted of four 1-ha sites
where red attack trees were identified and detailed stem
maps were created — as per the phase one component of
this study. Three of the calibration sites were of the
medium damage class and one was of the low damage
class. The four calibration sites had a total of 274 red
attack trees. Fig. 5 illustrates an example of the red attack
Fig. 5. Red attack tree crowns delineated from aerial photographs (left) and IKONO
(right).
trees identified by photo interpretation and those red attack
trees identified by the unsupervised clustering of the
multispectral IKONOS imagery.
5.3. Accuracy assessment
In order to account for slight differences in spatial
location and to facilitate the accuracy assessment process,
the air photos were spatially adjusted to match the
IKONOS data. Landscape features were used to align the
two data sources to a sufficient level of spatial corre-
spondence to facilitate comparison of the photo-derived
vectors (stem maps) and the red attack pixels identified
from the IKONOS image. To further compensate for
positional errors and differences in spatial resolution
between the aerial photography and the multispectral
IKONOS data, a series of buffers were generated around
the 4-m multispectral IKONOS pixels identified as red
attack (Fig. 6). Buffers, increasing in size by 1-m incre-
ments to a maximum of 4 m, were generated to
characterize attribute accuracy as a function of positional
accuracy.
From an operational perspective, a buffer corresponding
to the dimensions of a single pixel (for multispectral
IKONOS imagery, this distance is 4 m) is a logical choice
for characterizing attribute accuracy. The consideration of
buffers greater than 4 m in size is not practical (this
suggests gross misregistration errors and results in unreal-
istic estimates of accuracy). Since accuracy will continue to
increase with increasing buffer size, the estimates of
accuracy for buffer sizes greater than the image pixel size
will be impractical and may misrepresent the efficacy of
the both the classification methods and the data source
itself.
Three accuracy measures were used to enumerate the
correspondence between the red attacked trees identified in
the aerial photography and those identified with the
S pixels identified as red attack trees by the unsupervised clustering process
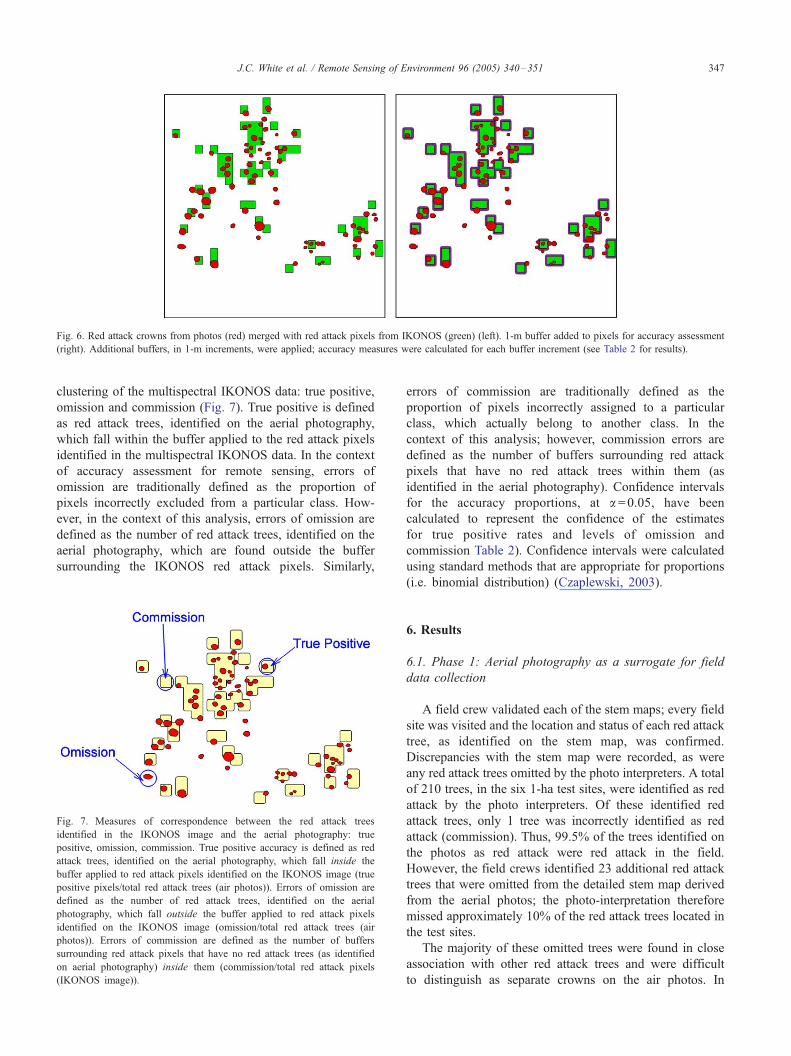
Fig. 6. Red attack crowns from photos (red) merged with red attack pixels from IKONOS (green) (left). 1-m buffer added to pixels for accuracy assessment
(right). Additional buffers, in 1-m increments, were applied; accuracy measures were calculated for each buffer increment (see Table 2 for results).
J.C. White et al. / Remote Sensing of Environment 96 (2005) 340–351 347
clustering of the multispectral IKONOS data: true positive,
omission and commission (Fig. 7). True positive is defined
as red attack trees, identified on the aerial photography,
which fall within the buffer applied to the red attack pixels
identified in the multispectral IKONOS data. In the context
of accuracy assessment for remote sensing, errors of
omission are traditionally defined as the proportion of
pixels incorrectly excluded from a particular class. How-
ever, in the context of this analysis, errors of omission are
defined as the number of red attack trees, identified on the
aerial photography, which are found outside the buffer
surrounding the IKONOS red attack pixels. Similarly,
Fig. 7. Measures of correspondence between the red attack trees
identified in the IKONOS image and the aerial photography: true
positive, omission, commission. True positive accuracy is defined as red
attack trees, identified on the aerial photography, which fall inside the
buffer applied to red attack pixels identified on the IKONOS image (true
positive pixels/total red attack trees (air photos)). Errors of omission are
defined as the number of red attack trees, identified on the aerial
photography, which fall outside the buffer applied to red attack pixels
identified on the IKONOS image (omission/total red attack trees (air
photos)). Errors of commission are defined as the number of buffers
surrounding red attack pixels that have no red attack trees (as identified
on aerial photography) inside them (commission/total red attack pixels
(IKONOS image)).
errors of commission are traditionally defined as the
proportion of pixels incorrectly assigned to a particular
class, which actually belong to another class. In the
context of this analysis; however, commission errors are
defined as the number of buffers surrounding red attack
pixels that have no red attack trees within them (as
identified in the aerial photography). Confidence intervals
for the accuracy proportions, at a =0.05, have been
calculated to represent the confidence of the estimates
for true positive rates and levels of omission and
commission Table 2). Confidence intervals were calculated
using standard methods that are appropriate for proportions
(i.e. binomial distribution) (Czaplewski, 2003).
6. Results
6.1. Phase 1: Aerial photography as a surrogate for field
data collection
A field crew validated each of the stem maps; every field
site was visited and the location and status of each red attack
tree, as identified on the stem map, was confirmed.
Discrepancies with the stem map were recorded, as were
any red attack trees omitted by the photo interpreters. A total
of 210 trees, in the six 1-ha test sites, were identified as red
attack by the photo interpreters. Of these identified red
attack trees, only 1 tree was incorrectly identified as red
attack (commission). Thus, 99.5% of the trees identified on
the photos as red attack were red attack in the field.
However, the field crews identified 23 additional red attack
trees that were omitted from the detailed stem map derived
from the aerial photos; the photo-interpretation therefore
missed approximately 10% of the red attack trees located in
the test sites.
The majority of these omitted trees were found in close
association with other red attack trees and were difficult
to distinguish as separate crowns on the air photos. In
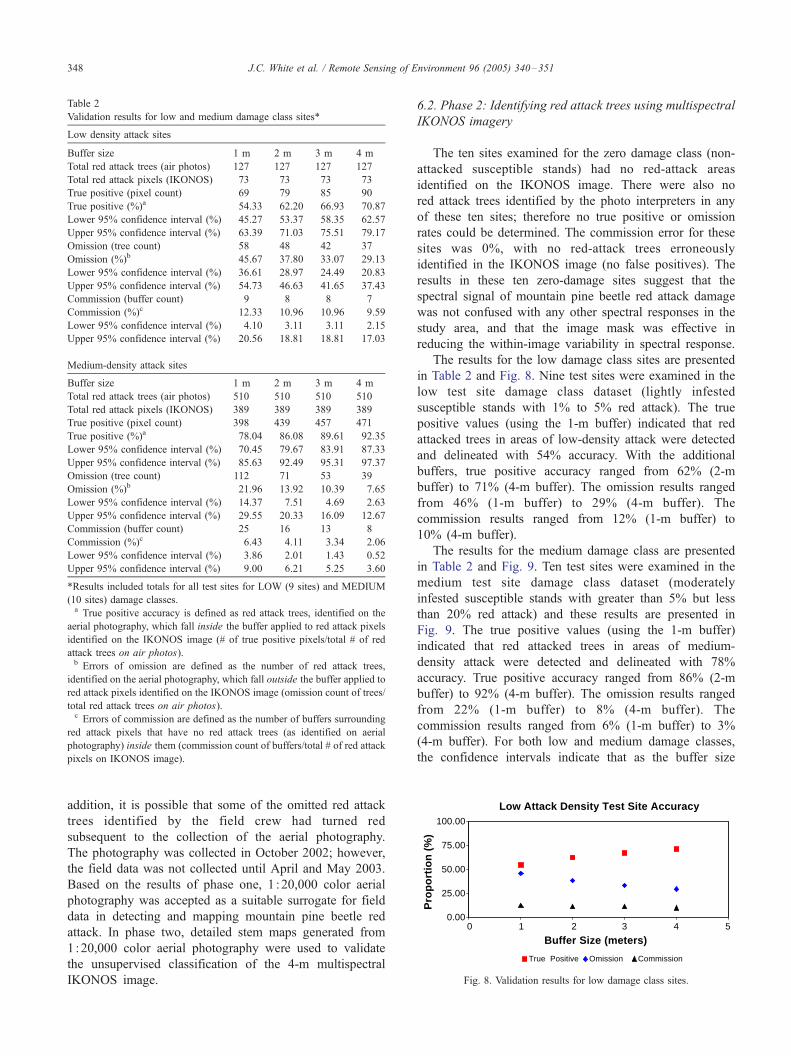
Table 2
Validation results for low and medium damage class sites*
Low density attack sites
Buffer size 1 m 2 m 3 m 4 m
Total red attack trees (air photos) 127 127 127 127
Total red attack pixels (IKONOS) 73 73 73 73
True positive (pixel count) 69 79 85 90
True positive (%)a 54.33 62.20 66.93 70.87
Lower 95% confidence interval (%) 45.27 53.37 58.35 62.57
Upper 95% confidence interval (%) 63.39 71.03 75.51 79.17
Omission (tree count) 58 48 42 37
Omission (%)b 45.67 37.80 33.07 29.13
Lower 95% confidence interval (%) 36.61 28.97 24.49 20.83
Upper 95% confidence interval (%) 54.73 46.63 41.65 37.43
Commission (buffer count) 9 8 8 7
Commission (%)c 12.33 10.96 10.96 9.59
Lower 95% confidence interval (%) 4.10 3.11 3.11 2.15
Upper 95% confidence interval (%) 20.56 18.81 18.81 17.03
Medium-density attack sites
Buffer size 1 m 2 m 3 m 4 m
Total red attack trees (air photos) 510 510 510 510
Total red attack pixels (IKONOS) 389 389 389 389
True positive (pixel count) 398 439 457 471
True positive (%)a 78.04 86.08 89.61 92.35
Lower 95% confidence interval (%) 70.45 79.67 83.91 87.33
Upper 95% confidence interval (%) 85.63 92.49 95.31 97.37
Omission (tree count) 112 71 53 39
Omission (%)b 21.96 13.92 10.39 7.65
Lower 95% confidence interval (%) 14.37 7.51 4.69 2.63
Upper 95% confidence interval (%) 29.55 20.33 16.09 12.67
Commission (buffer count) 25 16 13 8
Commission (%)c 6.43 4.11 3.34 2.06
Lower 95% confidence interval (%) 3.86 2.01 1.43 0.52
Upper 95% confidence interval (%) 9.00 6.21 5.25 3.60
*Results included totals for all test sites for LOW (9 sites) and MEDIUM
(10 sites) damage classes.a True positive accuracy is defined as red attack trees, identified on the
aerial photography, which fall inside the buffer applied to red attack pixels
identified on the IKONOS image (# of true positive pixels/total # of red
attack trees on air photos).b Errors of omission are defined as the number of red attack trees,
identified on the aerial photography, which fall outside the buffer applied to
red attack pixels identified on the IKONOS image (omission count of trees/
total red attack trees on air photos).c Errors of commission are defined as the number of buffers surrounding
red attack pixels that have no red attack trees (as identified on aerial
photography) inside them (commission count of buffers/total # of red attack
pixels on IKONOS image).
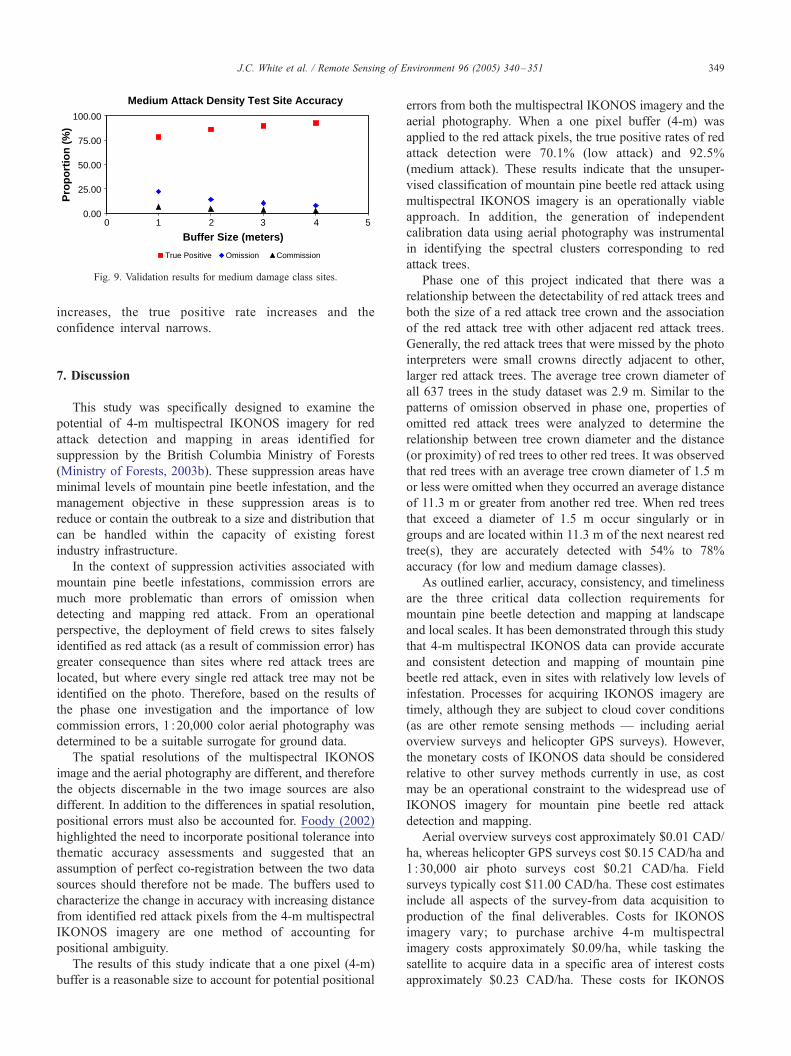
Low Attack Density Test Site Accuracy
0.00
25.00
50.00
75.00
100.00
0 1 2 3 4 5
Buffer Size (meters)
Pro
po
rtio
n (
%)
True Positive Omission Commission
Fig. 8. Validation results for low damage class sites.
J.C. White et al. / Remote Sensing of Environment 96 (2005) 340–351348
addition, it is possible that some of the omitted red attack
trees identified by the field crew had turned red
subsequent to the collection of the aerial photography.
The photography was collected in October 2002; however,
the field data was not collected until April and May 2003.
Based on the results of phase one, 1 :20,000 color aerial
photography was accepted as a suitable surrogate for field
data in detecting and mapping mountain pine beetle red
attack. In phase two, detailed stem maps generated from
1:20,000 color aerial photography were used to validate
the unsupervised classification of the 4-m multispectral
IKONOS image.
6.2. Phase 2: Identifying red attack trees using multispectral
IKONOS imagery
The ten sites examined for the zero damage class (non-
attacked susceptible stands) had no red-attack areas
identified on the IKONOS image. There were also no
red attack trees identified by the photo interpreters in any
of these ten sites; therefore no true positive or omission
rates could be determined. The commission error for these
sites was 0%, with no red-attack trees erroneously
identified in the IKONOS image (no false positives). The
results in these ten zero-damage sites suggest that the
spectral signal of mountain pine beetle red attack damage
was not confused with any other spectral responses in the
study area, and that the image mask was effective in
reducing the within-image variability in spectral response.
The results for the low damage class sites are presented
in Table 2 and Fig. 8. Nine test sites were examined in the
low test site damage class dataset (lightly infested
susceptible stands with 1% to 5% red attack). The true
positive values (using the 1-m buffer) indicated that red
attacked trees in areas of low-density attack were detected
and delineated with 54% accuracy. With the additional
buffers, true positive accuracy ranged from 62% (2-m
buffer) to 71% (4-m buffer). The omission results ranged
from 46% (1-m buffer) to 29% (4-m buffer). The
commission results ranged from 12% (1-m buffer) to
10% (4-m buffer).
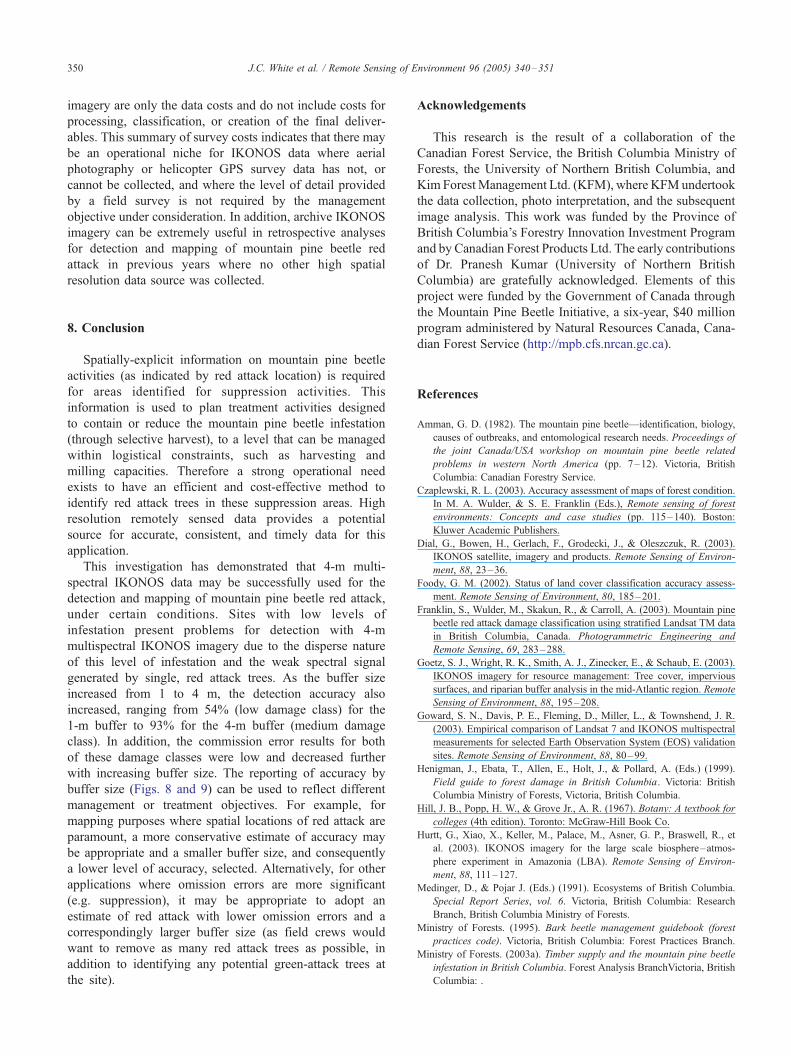
The results for the medium damage class are presented
in Table 2 and Fig. 9. Ten test sites were examined in the
medium test site damage class dataset (moderately
infested susceptible stands with greater than 5% but less
than 20% red attack) and these results are presented in
Fig. 9. The true positive values (using the 1-m buffer)
indicated that red attacked trees in areas of medium-
density attack were detected and delineated with 78%
accuracy. True positive accuracy ranged from 86% (2-m
buffer) to 92% (4-m buffer). The omission results ranged
from 22% (1-m buffer) to 8% (4-m buffer). The
commission results ranged from 6% (1-m buffer) to 3%
(4-m buffer). For both low and medium damage classes,
the confidence intervals indicate that as the buffer size
Medium Attack Density Test Site Accuracy
0.00
25.00
50.00
75.00
100.00
0 1 2 3 4 5
Buffer Size (meters)
Pro
po
rtio
n (
%)
True Positive Omission Commission
Fig. 9. Validation results for medium damage class sites.
J.C. White et al. / Remote Sensing of Environment 96 (2005) 340–351 349
increases, the true positive rate increases and the
confidence interval narrows.
7. Discussion
This study was specifically designed to examine the
potential of 4-m multispectral IKONOS imagery for red
attack detection and mapping in areas identified for
suppression by the British Columbia Ministry of Forests
(Ministry of Forests, 2003b). These suppression areas have
minimal levels of mountain pine beetle infestation, and the
management objective in these suppression areas is to
reduce or contain the outbreak to a size and distribution that
can be handled within the capacity of existing forest
industry infrastructure.
In the context of suppression activities associated with
mountain pine beetle infestations, commission errors are
much more problematic than errors of omission when
detecting and mapping red attack. From an operational
perspective, the deployment of field crews to sites falsely
identified as red attack (as a result of commission error) has
greater consequence than sites where red attack trees are
located, but where every single red attack tree may not be
identified on the photo. Therefore, based on the results of
the phase one investigation and the importance of low
commission errors, 1 :20,000 color aerial photography was
determined to be a suitable surrogate for ground data.
The spatial resolutions of the multispectral IKONOS
image and the aerial photography are different, and therefore
the objects discernable in the two image sources are also
different. In addition to the differences in spatial resolution,
positional errors must also be accounted for. Foody (2002)
highlighted the need to incorporate positional tolerance into
thematic accuracy assessments and suggested that an
assumption of perfect co-registration between the two data
sources should therefore not be made. The buffers used to
characterize the change in accuracy with increasing distance
from identified red attack pixels from the 4-m multispectral
IKONOS imagery are one method of accounting for
positional ambiguity.
The results of this study indicate that a one pixel (4-m)
buffer is a reasonable size to account for potential positional
errors from both the multispectral IKONOS imagery and the
aerial photography. When a one pixel buffer (4-m) was
applied to the red attack pixels, the true positive rates of red
attack detection were 70.1% (low attack) and 92.5%
(medium attack). These results indicate that the unsuper-
vised classification of mountain pine beetle red attack using
multispectral IKONOS imagery is an operationally viable
approach. In addition, the generation of independent
calibration data using aerial photography was instrumental
in identifying the spectral clusters corresponding to red
attack trees.
Phase one of this project indicated that there was a
relationship between the detectability of red attack trees and
both the size of a red attack tree crown and the association
of the red attack tree with other adjacent red attack trees.
Generally, the red attack trees that were missed by the photo
interpreters were small crowns directly adjacent to other,
larger red attack trees. The average tree crown diameter of
all 637 trees in the study dataset was 2.9 m. Similar to the
patterns of omission observed in phase one, properties of
omitted red attack trees were analyzed to determine the
relationship between tree crown diameter and the distance
(or proximity) of red trees to other red trees. It was observed
that red trees with an average tree crown diameter of 1.5 m
or less were omitted when they occurred an average distance
of 11.3 m or greater from another red tree. When red trees
that exceed a diameter of 1.5 m occur singularly or in
groups and are located within 11.3 m of the next nearest red
tree(s), they are accurately detected with 54% to 78%
accuracy (for low and medium damage classes).
As outlined earlier, accuracy, consistency, and timeliness
are the three critical data collection requirements for
mountain pine beetle detection and mapping at landscape
and local scales. It has been demonstrated through this study
that 4-m multispectral IKONOS data can provide accurate
and consistent detection and mapping of mountain pine
beetle red attack, even in sites with relatively low levels of
infestation. Processes for acquiring IKONOS imagery are
timely, although they are subject to cloud cover conditions
(as are other remote sensing methods — including aerial
overview surveys and helicopter GPS surveys). However,
the monetary costs of IKONOS data should be considered
relative to other survey methods currently in use, as cost
may be an operational constraint to the widespread use of
IKONOS imagery for mountain pine beetle red attack
detection and mapping.
Aerial overview surveys cost approximately $0.01 CAD/
ha, whereas helicopter GPS surveys cost $0.15 CAD/ha and
1 :30,000 air photo surveys cost $0.21 CAD/ha. Field
surveys typically cost $11.00 CAD/ha. These cost estimates
include all aspects of the survey-from data acquisition to
production of the final deliverables. Costs for IKONOS
imagery vary; to purchase archive 4-m multispectral
imagery costs approximately $0.09/ha, while tasking the
satellite to acquire data in a specific area of interest costs
approximately $0.23 CAD/ha. These costs for IKONOS
J.C. White et al. / Remote Sensing of Environment 96 (2005) 340–351350
imagery are only the data costs and do not include costs for
processing, classification, or creation of the final deliver-
ables. This summary of survey costs indicates that there may
be an operational niche for IKONOS data where aerial
photography or helicopter GPS survey data has not, or
cannot be collected, and where the level of detail provided
by a field survey is not required by the management
objective under consideration. In addition, archive IKONOS
imagery can be extremely useful in retrospective analyses
for detection and mapping of mountain pine beetle red
attack in previous years where no other high spatial
resolution data source was collected.
8. Conclusion
Spatially-explicit information on mountain pine beetle
activities (as indicated by red attack location) is required
for areas identified for suppression activities. This
information is used to plan treatment activities designed
to contain or reduce the mountain pine beetle infestation
(through selective harvest), to a level that can be managed
within logistical constraints, such as harvesting and
milling capacities. Therefore a strong operational need
exists to have an efficient and cost-effective method to
identify red attack trees in these suppression areas. High
resolution remotely sensed data provides a potential
source for accurate, consistent, and timely data for this
application.
This investigation has demonstrated that 4-m multi-
spectral IKONOS data may be successfully used for the
detection and mapping of mountain pine beetle red attack,
under certain conditions. Sites with low levels of
infestation present problems for detection with 4-m
multispectral IKONOS imagery due to the disperse nature
of this level of infestation and the weak spectral signal
generated by single, red attack trees. As the buffer size
increased from 1 to 4 m, the detection accuracy also
increased, ranging from 54% (low damage class) for the
1-m buffer to 93% for the 4-m buffer (medium damage
class). In addition, the commission error results for both
of these damage classes were low and decreased further
with increasing buffer size. The reporting of accuracy by
buffer size (Figs. 8 and 9) can be used to reflect different
management or treatment objectives. For example, for
mapping purposes where spatial locations of red attack are
paramount, a more conservative estimate of accuracy may
be appropriate and a smaller buffer size, and consequently
a lower level of accuracy, selected. Alternatively, for other
applications where omission errors are more significant
(e.g. suppression), it may be appropriate to adopt an
estimate of red attack with lower omission errors and a
correspondingly larger buffer size (as field crews would
want to remove as many red attack trees as possible, in
addition to identifying any potential green-attack trees at
the site).
Acknowledgements
This research is the result of a collaboration of the
Canadian Forest Service, the British Columbia Ministry of
Forests, the University of Northern British Columbia, and
Kim Forest Management Ltd. (KFM), where KFM undertook
the data collection, photo interpretation, and the subsequent
image analysis. This work was funded by the Province of
British Columbia’s Forestry Innovation Investment Program
and by Canadian Forest Products Ltd. The early contributions
of Dr. Pranesh Kumar (University of Northern British
Columbia) are gratefully acknowledged. Elements of this
project were funded by the Government of Canada through
the Mountain Pine Beetle Initiative, a six-year, $40 million
program administered by Natural Resources Canada, Cana-
dian Forest Service (http://mpb.cfs.nrcan.gc.ca).
References
Amman, G. D. (1982). The mountain pine beetle—identification, biology,
causes of outbreaks, and entomological research needs. Proceedings of
the joint Canada/USA workshop on mountain pine beetle related
problems in western North America (pp. 7–12). Victoria, British
Columbia’ Canadian Forestry Service.
Czaplewski, R. L. (2003). Accuracy assessment of maps of forest condition.
In M. A. Wulder, & S. E. Franklin (Eds.), Remote sensing of forest
environments: Concepts and case studies (pp. 115–140). Boston’
Kluwer Academic Publishers.
Dial, G., Bowen, H., Gerlach, F., Grodecki, J., & Oleszczuk, R. (2003).
IKONOS satellite, imagery and products. Remote Sensing of Environ-
ment, 88, 23–36.
Foody, G. M. (2002). Status of land cover classification accuracy assess-
ment. Remote Sensing of Environment, 80, 185–201.
Franklin, S., Wulder, M., Skakun, R., & Carroll, A. (2003). Mountain pine
beetle red attack damage classification using stratified Landsat TM data
in British Columbia, Canada. Photogrammetric Engineering and
Remote Sensing, 69, 283–288.
Goetz, S. J., Wright, R. K., Smith, A. J., Zinecker, E., & Schaub, E. (2003).
IKONOS imagery for resource management: Tree cover, impervious
surfaces, and riparian buffer analysis in the mid-Atlantic region. Remote
Sensing of Environment, 88, 195–208.
Goward, S. N., Davis, P. E., Fleming, D., Miller, L., & Townshend, J. R.
(2003). Empirical comparison of Landsat 7 and IKONOS multispectral
measurements for selected Earth Observation System (EOS) validation
sites. Remote Sensing of Environment, 88, 80–99.
Henigman, J., Ebata, T., Allen, E., Holt, J., & Pollard, A. (Eds.) (1999).
Field guide to forest damage in British Columbia. Victoria: British
Columbia Ministry of Forests, Victoria, British Columbia.
Hill, J. B., Popp, H. W., & Grove Jr., A. R. (1967). Botany: A textbook for
colleges (4th edition). Toronto’ McGraw-Hill Book Co.
Hurtt, G., Xiao, X., Keller, M., Palace, M., Asner, G. P., Braswell, R., et
al. (2003). IKONOS imagery for the large scale biosphere–atmos-
phere experiment in Amazonia (LBA). Remote Sensing of Environ-
ment, 88, 111–127.
Medinger, D., & Pojar J. (Eds.) (1991). Ecosystems of British Columbia.
Special Report Series, vol. 6. Victoria, British Columbia’ Research
Branch, British Columbia Ministry of Forests.
Ministry of Forests. (1995). Bark beetle management guidebook (forest
practices code). Victoria, British Columbia’ Forest Practices Branch.
Ministry of Forests. (2003a). Timber supply and the mountain pine beetle
infestation in British Columbia. Forest Analysis BranchVictoria, British
Columbia’ .
J.C. White et al. / Remote Sensing of Environment 96 (2005) 340–351 351
Ministry of Forests. (2003b). Provincial bark beetle management technical
implementation guidelines. Victoria, British Columbia’ Forest Practices
Branch.
Ministry of Forests. (2005). 2004 aerial overview survey esti-
mates (preliminary). Available online. Site accessed January
24, 2005. URL:http://www.for.gov.bc.ca/ftp/HFP/external/!publish/
Aerial_Overview/2004/2004_overviewFeb23.xls.
Ministry of Forests and Canadian Forest Service. (2000). Forest health
aerial overview survey standards for British Columbia, version 2.0 The
B.C. Ministry of Forests adaptation of the Canadian Forest Services’s
FHN Report 97-1 ‘‘Overview of aerial survey standards for British
Columbia and the Yukon’’. Victoria, British Columbia’ Resources
Inventory Committee.
Nelson, T., Boots, B., & Wulder, M. A. (2004). Point-based, aerial surveys
of mountain pine beetle infestations: Exploring survey accuracy and
data representation. Victoria, British Columbia’ Mountain Pine Beetle
Initiative Report.
Safranyik, L., Shrimpton, D., & Whitney, H. (1974). Management of
lodgepole pine to reduce losses from the mountain pine beetle. Victoria,
British Columbia’ Environment Canada, Forestry Service.
Skakun, R. S., Wulder, M. A., & Franklin, S. E. (2003). Sensitivity of the
thematic mapper enhanced wetness difference index (EWDI) to detect
mountain pine needle red attack damage. Remote Sensing of Environ-
ment, 86, 433–443.
Tao, C. V., Hu, Y., & Jiang, W. (2004). Photogrammetric exploitation of
IKONOS imagery for mapping applications. International Journal of
Remote Sensing, 25, 2833–2853.
Westfall, J. (2003). 2002 Summary of forest health conditions in British
Columbia. Victoria, British Columbia’ Forest Practices Branch.
Wiart, R. J. (2003). Detecting and mapping mountain pine beetle
infestations: Defining the role of remote sensing and establishing
research priorities. Workshop Summary Report, June 26–27, 2003.
Vancouver, British Columbia. Victoria, British Columbia’ R.J. Wiart and
Associates.
Wood, S. L. (1963). A revision of bark beetle genus Dendroctonus Erickson
(Coleoptera: Scolytidae). Great Basin Naturalist, 23, 1–117.