Anatomical Injury Induced by the Eriophyid Mite Aceria anthocoptes on the Leaves of Cirsium arvense
Upload
khangminh22Category
view
0download
0
RESPONSE OF HOP CULTIVARS TO TWO-SPOTTED SPIDER MITE
INFESTATION .
Apichart Lawanprasert, B.Sc. (Agr.), M.Sc. (Agr.)
Kasetsart University, Bangkok
Submitted in fulfilment of the requirements
for the degree of
Doctor of Philosophy
Department of Agricultural Science
University of Tasmania
July, 1994

This thesis contains no material which has been accepted for the award of
any other degree in any University or Institute and to the best of my
knowledge and belief the thesis contains no material previously
published or written by another person except where due reference is
made in the text of the thesis.
Apichart Lawanprasert

This thesis may be made available for loan. Copying of any part of this
thesis is prohibited for two years from the date this statement was signed;
after that time limited copying is permitted in accordance with the
Copyright Act 1968.
Apichart Lawanprasert

iv
ABSTRACT
The two-spotted spider mite (TSSM), Tetranychus, urticae Koch, is one of the most serious pests in regions where hops,Humu/us lupulus L., are grown. Resistant cultivars would be ideal to reduce plant damage caused by this pest. Studies on the biological interaction between cultivated hop cultivars and TSSM were conducted over three growing seasons to gain a greater understanding of plant mechanisms involved in the response to mite attack under both natural and controlled environmental conditions.
In field observations, the results revealed a generalised pattern of growth and decline in naturally occurring mite populations infesting commercial hops during the growing season. The mites peaked after hops had formed the visible bases of inflorescences. Eggs were the predominant stage for most of the season and stage-specific percentages changed as the season progressed. The spatial and vertical distributions of the mites for each stage also varied with time. Natural enemies did not appear at levels sufficient to give control.
Studies on the susceptibility of different hop genotypes to artificial and natural infestations by the mites indicated that all the genotypes tested expressed an intermediate to highly susceptible reaction, with M26 (Huller Bitterer) being the most susceptible. Despite no outstanding evidence of antibiosis, there were significant differences in susceptibility among hop genotypes in terms of tolerance, non-preference and plant avoidance in which plant growth exceeds the mite dispersive capacity. Significant differences in mite densities between the hop cultivars of European and American parentage were also detected in that the European cultivar was more susceptible than the American.
Morphological variation in external and internal characteristics of hop leaves were found among the genotypes studied. Significant differences were found in ventral gland size, trichome density, trichome size, length of trichomes, stomatal density, stomatal size and moisture content. The morphological characteristics of the hop leaves collected from the same genotype may vary significantly according to leaf age and growing conditions. Under controlled conditions, none of these morphological characteristics were found to influence TSSM population reproductive parameters.

In addition to genotypic effects, the findings demonstrated that environmental factors did influence life history traits of TSSM. These factors included temperature, relative humidity, light intensity and plant variables.
Physiological and chemical responses of hop genotypes to mite feeding damage were examined in field and glasshouse experiments. Feeding damage by mites increased hop leaf resistance to CO2 uptake through stomatal closure and decreased photosynthetic rates. The stomatal response to infestation differed between cultivars. Analysis of chemicals extracted from hop leaves indicated that phenolics, alkaloids and volatile compounds in infested leaves were qualitatively and quantitatively similar to those detected in undamaged control leaves.
Hop-canopy microenvironments do play an important role in seasonal population development of two-spotted spider mites. This role was amplified by hop susceptibility to the mites. For the hop genotypes studied; the populations of mites, and 'their predators, tended to increase more rapidly on sparsely leaved canopies than on densely leaved canopies. The overall results gtrongly suggest that TSSM performance was mainly regulated by the microenvircinments that exist within the canopies of different cultivars with (1) sparsely leaved canopies favouring population increase and (2) reduced temperature and light and increased humidity within dense canopies limiting population increase.

vi
TABLE OF CONTENTS
Contents Page
DECLARATION ii
ABSTRACT iv
TABLE OF CONTENTS vi
LIST OF TABLES - xi i i
LIST OF FIGURES- xix
LIST OF PLATES )oor
LIST OF APPENDICES "ooc
ACKNOWLEDGEMENTS xxxix
CHAPTER 1 INTRODUCTION 1
Research objectives 4
CHAPTER 2 LITERATURE REVIEW 6
2.1. Biology and production of hops 6
2.1.1. Phylogenesis of cultivated hops 6
2.1.2. Occurrence and main components °Chop plants 8
2.1.3. Idiotype of hop varieties 12
• 2.1.4. Utilization of hop cones 14
2.1.5. Crop protection in hop yards 14
2.1.5.1. Cultural practices 15
2.1.5.2. Resistant varieties 16
2.1.5.3. Legal control 17
• 2.15.4. Biological control • 17
• 2.1.5.5. Chemical control • 18
2.2. Life history and ecology of the two spotted-spider mite 19
2.2.1. Economic status 20
2.2.2. Food plants 21
• 2.2.3., Stages of development 22
2.2.4. Behaviour and reproduction 25
2.2.4.1. Social behaviour 25
2.2.4.2. Dispersal 26
2.2.4.3. Diapause 27
2.2.4.4. Reproduction 27
2.2.5. -Natural enemies 28•
2.2.6. Relationships with environmental factors 30

vii
2.3. Plant responses to herbivory 31
2.3.1. Mechanisms of plant defences against herbivores 31
2.31.1. Morphological defences 31
2.3.1.2. Chemical defences 33
2.3.2. Role of plant defences in population dynamics of herbivores 37
2.3.3. Plant compensation to herbivory 38
2.3.4. Induced responses in plants 41
2.3.4.1. Induction of plant resistance by non-herbivores 42
2.3.4.2. Primary physio-chemicals involved in induced 44
defences
2.4. Mite population analyses 45
24.1. Life tables 46
2.4.2. Population growth 47
2.43. Population dispersion 50
2.5. Screening of plant varieties for resistance to spider mite damage 52
CHAPTER 3 SEASONAL ABUNDANCE AND DISTRIBUTION OF TSSM 56
INFESTING COMMERCIAL HOPS IN TASMANIA
3.1. Introduction 56
3.2. Materials and Methods 57
3.2.1. The study area 57
• 3.22. Growing season 1990/91 58
3.23. Growing season 1991/92 60
3.2.4. Growing season 1992/93 61
3.2.5. Data analyses 61
3.3. Results 62
3.3.1. Seasonal abundance 62
3.3.1.1. Growing season 1990/91 62
3.3.1.2. Growing season 1991/92 66
• 3.3.13. Growing season 1992/93 70
3.3.2. Climatic effects 73
3.3.2.1. Growing season 1990/91 73
3.3.2.2. Growing season 1991/92 75
33.23. Growing season 1992/93 75
3.3.3. Feeding damage 75
3.3.3.1. Growing season 1990/91 75
333.2. Growing season 1991/92. 87
3333. Growing season 1992/93 91
3.3.4. Spatial distribution • 97

viii
3.35. Vertical distribution 100
335.1. Growing season 1990/91 100
335.2. Growing season 1991/92 106
3353. Growing season 1992/93 113
3.4. Discussion 114
3.4..1. Seasonal abundance 114
3.4.2. Climatic effects 118
3.43. Feeding damage 119
3.4.4. Spatial distribution 122
3.45. Vertical distribution 123
CHAPTER 4 DIFFERENCES IN SUSCEPTIBILITY OF HOP GENOTYPES TO 126
INFESTATIONS BY TSSM
4.1. Introduction
4.2. Materials and Methods
4.2.1. Artificial infestations
126
126
127
4.2.1.1. Sources of plant material 127
4.2.1.2. Mite culture 127
4.2.1.3. Under glasshouse conditions 128
4.2.1.4. Under field conditions 129
4.2.2. Natural infestations 131
4.2.2.1. Under glasshouse conditions 131
4.2.2.2. Under field conditions 131
4.2.2.2.1. Hop yard No. 1 at Bushy Park 131
4.2.2.2.1.1. Growing season 1990/91 131
4.2.2.2.1.2. Growing season 1991/92 132
4.2.2.2.13. Growing season 1992/93 132
4.2.2.2.2. Hop yard No. 2 at Bushy Park 132
4.2.3. Data analyses 132
4.3. Results 133
4.3.1. Fluctuations of mite populations among hop genotypes 133
4.3.1.1. Artificial infestations under glasshouse
conditions
133
43.1.2. Artificial infestations under field conditions 137
43.13. Natural infestations under glasshouse 138
conditions
4.3.1.4. Natural infestations under field conditions 139
4.3.2. Leaf-feeding damage (Tolerance test) 143
43.2.1. Glasshouse studies 143

ix
4.3.2.2. Field studies 143
4.3.3. Plant characteristics 150
4.33.1. Hopq, in the glasshouse 150
4.3.3.2. Hops in the field 160
4.3.4. Cone production 162
4.4. Discussion 165
4.4.1. Fluctuations of mite populations among hop genotypes 165
4.4.2. Feeding damage 166
4.4.3. Plant characteristics 167
4.4.4. Cone production 168
CHAPTER 5 DEMOGRAPHIC ANALYSIS OF HOP SUSCEPTIBILITY TO 170
SPIDER MITE INFESTATIONS
5.1. Introduction 170
5.2. Materials and Methods 171
5.2.1. Mite culture 171
5.2.2. General procedures 171
5.2.2.1. Experiment 1 172
5.2.2.2. Experiment 2 173
5.2.2.2.1. Test 1 173
5.2.2.2.2. Test 2 173
5.2.2.2.3. Test 3 173
5.2.2.2.4. Test 4 174
5.2.2.3. Experiment 3 174
5.2.3. Data analyses 174
5.3. Results 175
5.3.1. Experiment 1 175
5.3.1.1. Hatchability 175
5.3.1.2. Survival of inunatures 175
5.3.1.3. Sex ratio 175
53.1.4. Generation mortality 176
5.3.1.5. Survival of adult stage 177
5.3.1.6. Fecundity 178
53.1.7. Other parameters 180
5.3.2. Experiment 2 182
5.3.2.1. Effects of genotypes 182
5.3.2.2. Effects of experimental conditions 184
5.33. Experiment 3 189
5.4. Discussion 193

5.4.1. Genotypic effects 193
5.4.2. Environmental effects 195
CHAPTER 6 INFLUENCE OF ENVIRONMENTAL FACTORS ON 199
POPULATION INCREASE OF TSSM
6.1. Introduction 199
6.2. Materials and Methods 199
6.2.1. Plant and spider mite culture 199
6.2.2. Experimental procedures 199
62.2.1. Experiments at 20°C 200
6.2.22. Experiments at 25°C 201
62.2.3. Experiments at 30°C 202
6.2.3. Data analyses 202
6.3. Results 203
6.3.1. Temperature 203
6.3.1.1. The first series of experiments 203
6.3.1.2. The second series of experiments 208
6.3.2. Humidity 218
6.32.1. The first series of experiments 218
6.3.2.2. The second series of experiments 223
6.3.3. Light intensity 234
6.3.3.1. Open containers 234
• 6.3.32. Closed containers 240
6.3.4. Plant variables 248
6.3.4.1. Leaf ages 248
• 6.3.42. Leaf regions 258
6.4. Discussion 264
6.4.1. Temperature 264
6.4.2. Humidity 268
6.4.3. Light intensity 270
6.4.4. Plant variables 272
6.4.4.1. Leaf age 272
6.4.4.2. Leaf regions 273
CHAPTER 7 RELATIONSHIP BETWEEN HOP LEAF MORPHOLOGY AND 274
SUSCEPTIBILITY TO TSSM
• 7.1. Introduction 274
7.2. Materials and Methods 274•
7.2.1. Morphological features 274

xi
7.2.1.1. Plant material 274
7.2.1.2. External characteristics of hop leaves 275
7.2.13. Histological examinations 275
7.2.1.4. Leaf moisture content 276
7.2.2. Morphological responses of hop leaves to mite 276
infestations
7.23. Data analyses 277
7.3. Results 277
7.3.1. Hop leaf morphology 277
7.3.1.1. Different genotypes 277
7.3.1.2. Different sources of leaves 290
7.3.2. Leaf morphological characteristics and hop susceptibility 292
to TSSM
7.3.3. Morphological responses of hop leaves to mite infestations 301
7.4. Discussion 309
• 7.4.1. Leaf morphology 309
7.4.2. Leaf morphological characteristics and hop susceptibility 312
to TSSM
7.4.3. Morphological responses of hop leaves to mite infestations 314
CHAPTER 8 EFFECTS OF HOP-CANOPY MICROENVIRONMENTS ON MITE 315
POPULATION DYNAMICS
8.1. Introduction 315
8.2. Materials and Methods 315
8.2.1. Under field conditions 315
8.2.2. Under glasshouse conditions • 317
8.2.3. Data analyses 318
8.3. Results 318•
8.3.1. Under field conditions 318
83.2. Under glasshouse conditions 344
8.4. Discussion 354
8.4.1. Under field conditions 354
8.4.2. Under glasshouse conditions 357
CHAPTER 9 PHYSIOLOGICAL AND CHEMICAL RESPONSES OF HOP 358
PLANTS TO FEEDING OF TSSM •
•9.1. Introduction 358•
9.2. Materials and Methods 359
• 9.2.1. Physiological response 359

xii
9.2.1.1. Under glasshouse conditions 359
9.2.1.2. Under field conditions 360
9.2.1.3. Statistical analyses 360
9.2.2. Chemical response 360
9.23. Preliminary studies on damage caused by TSSM to the 362
quality of hop leaves and hop cones
93. Results 363
9.3.1. Physiological response to mite damage 363
9.3.2. Chemical response to mite damage 371
9.4. Discussion 377
9.4.1. Physiological response to mite damage 377
9.4.2. Chemical response to mite damage 379
CHAPTER 10 SUMMARY 383
BIBLIOGRAPHY 392
APPENDICES 432

Table
LIST OF TABLES
Title Page
2.1. Development time in hours of TSSM reared at 15°, 18°, and 21°C. 25
2.2. Up-to-date review of the literature on resistance to TSSM. 55
3.1. Mite densities in the middle region of hop plants in early 1991/92 66
growing season.
3.2. Average number of mites in each cage after re-infestation 10/2/93 73
and 24/2/93.
3.3. Mite-day accumulations of TSSM at active stages during 1990/91
growing season.
3.4. Distribution of TSSM in each block during 1990/91 growing season. 98
3.5. Mean numbers of mites per leaf among different foliage heights. 102
3.6. Mean numbers of mites per cm.2 among different foliage heights. 103
3.7. Mean numbers of mites per gram among different foliage heights. 103
3.8. Differences in mite densities per leaf between different foliage 104
heights.
3.9. Differences in mite densities per cm.2 between foliage heights. 105
3.10. Differences in mite densities per gram between different foliage 106
heights.
4.1. Mean numbers of mites on each genotype infested artificially under 134
glasshouse conditions.
4.2. Mean numbers of mites on each genotype grown at the Horticultural 138
Research Centre.
4.3. . Mean numbers of mites on each genotype infested naturally under 139
glasshouse conditions.
4.4. Mean density of TSSM on leaves of 24 genotypes in hop yard No.1 141
during 1991/92 season. (all leaves collected at 1.8 and 3.6 m. heights)
4.5. Mean density of TSSM on leaves at node No5 of 24 genotypes in hop 142
yard No.1 during 1992/93 season.
4.6. Damage ratings at 42 days after infestation of hop -cultivars in 144
replications 1 and 2 and at 84 days after infestation of those in
replications 3 and 4 under glasshouse conditions.
4.7. Mean intemode lengths of each hop genotype grown under 155
glasshouse conditions, measured at 6 weeks after establishment.
4.8. Mean leaf areas of each hop genotype grown under glasshouse 156
conditions.
4.9. Mean numbers of leaves on plants of each hop genotype grown under 157

xi v
glasshouse conditions.
4.10. Mean number of tillers per plant of each hop genotype grown under 158
glasshouse conditions.
4.11. Average plant height of each hop genotype grown under. glasshouse 159
conditions.
4.12. Average surface areas and dry weights of hop leaves as well as 161
the growth habit of hop plants for each genotype under field
conditions.
4.13. Cone production for each genotype grown at the Horticultural 163
Research Centre during 1991/92 season.
4.14. Cone production for each genotype grown at the Horticultural 163
Research Centre during 1992/93 season.
5.1. Hatchability, survival of immature and sex ratio of TSSM on 175
four genotypes of hops.
5.2. Goodness of fit procedure for male and female adults. 176
5.3. Life table of TSSM on four genotypes of hops. 176
5.4. Cumulative numbers of eggs laid by adult female mites on four 180
genotypes of hops.
5.5. Life history analysis of TSSM on four genotypes of hops. 181
5.6. Pooled life table of TSSM on 27 hop genotypes under different 183
conditions.
5.7. Average total number of eggs and longevity of TSSM under different 186
environmental conditions.
5.8. Life history analysis of TSSM under different rearing conditions. 188
5.9. Life history analysis of TSSM on different surface areas of leaf 192
discs.
6.1. Environmental conditions proceeding within a series of experiments 200
to investigate their effect on TSSM inCrease.
6.2. Life table of TSSM on two hop genotypes at 76%RH under constant 203
illumination (16L: 8D; 171 lux) and at three temperatures.
6.3. Sex ratio of TSSM at 76%RH, constant illumination (16L : 8D; 171 lux) 204
and three temperatures.
• 6.4. Determination of the developmental threshold temperature (°C) 207
for TSSM at 76%RH and 171 lux.
6.5. Percentages representative of developmental periods for all 210
immature stages of TSSM under various conditions.
6.6. Analysis of variance of the developmental periods for eggs of TSSM 214
on two hop genotypes at 43 lux. •
6.7. Analysis of variance of the developmental periods from eggs to 215

XV
adults ofTSSM on two hop genotypes at 43 lux.
6.8. Analysis of variance of the pre-reproductive periods of TSSM on 216
two hop genotypes at 43 lux.
6.9. Analysis of variance of the intrinsic rates of increase of TSSM on 217
two hop genotypes at 43 lux.
6.10. Analysis of variance of the mean generation times of Tssm on two 218
hop genotypes at 43 lux.
6.11. Life table of TSSM on two hop genotypes at 20-30°C under constant 219
illumination (16L : 8D; 171 lux) and at two humidities.
6.12. Sex ratio of adult TSSM at 20-30°C under constant illumination 219
(16L : 8D; 171 lux) and at two humidities.
6.13. Life table of TSSM on two hop genotypes at 20-30°C, constant 224
illumination (16L : 8D; 46 lux) and three humidities.
6.14. Analysis of variance of the developmental periods for eggs of TSSM 229
on two genotypes of hops at three humidities.
6.15. Analysis of variance of the developmental periods from eggs to 230
adults of TSSM on two genotypes of hops at three humidities.
6.16. Analysis of variance of the pre-reproductive periods of TSSM on 231
two genotypes of hops at three humidities.
6.17. Analysis of variance of the intrinsic rates of *Tease of TSSM on 232
two genotypes of hops at three humidities.
6.18. Analysis of variance of the mean generation times of TSSM on two 233
genotypes of hops at three humidities.
6.19. Life table of TSSM on two genotypes of hops at 25°C and three levels 234
of light intensity.
6.20. Sex ratio of TSSM in open containers at 20°C, and three levels of 235
• light intensity.
6.21. Life table of TSSM on two hop genotypes at 20°C, 76%RH and two 241
light intensities.
6.22. Life table of TSSM on two hop genotypes at 20°C, 100%RH and 242
two light intensities.
6.23. Life table of TSSM on two hop genotypes at 30°C, 76%RH and two 243
light intensities.
6.24. Life table of TSSM on two hop genotypes at 30°C, 100%RH and two 244
light intensities."
6.25. Sex ratio of ISSM at 20° and 30°C; 76% and 100% RH at light 245
intensities of 43 and 171 lux.
6.26. • Analysis of variance of the developmental periods for eggs of TSSM 246
on two hop genotypes at 20°-30°C and 76%-100%RH.

xvi
6.27. Analysis of variance of the developmental periods from eggs to 246
adults of TSSM on two hop genotypes at 20°-30°C, and 76%-100%RH.
6.28. Analysis of variance of the pre-reproductive periods of TSSM on 246
two hop genotypes at 20°-30°C and 76%-100%RH.
6.29. Analysis of variance of the intrinsic rates of increase of TSSM on 246
two hop genotypes at 20°-30°C and 76%-100%RH.
6.30. Analysis of variance of the mean generation times of TSSM on two 246
hop genotypes at 20°-30°C and 76-100%M.
6.31. Life table of TSSM on two hop genotypes at 20°C, 76%RH and a 249
• light intensity of 171 lux for old and young leaves.
6.32. Sex ratio of ISSM reared on young and old leaves at 20°C, 76%RH 249
and a light intensity of 171 lux.
6.33. Life table of TSSM on two hop genotypes at 20°C, 55-100%RH and a 254
• light intensity of 43 lux for old and young leaves.
6.34. Sex ratio of TSSM reared on young and old leaves at 20°C, 55-100%RH 255
and a light intensity of 43 lux.
6.35. Analysis of variance of the developmental periods for eggs of 255
TSSM on young and old leaves of two hop genotypes at 20°C,
55-100%RH and a light intensity of 43 lux.
6.36. Analysis of 'variance of the developmental periods from eggs to
adults of TSSM females on young and old leaves of two hop
genotypes at 20°C, 55-100%RH and a light intensity of 43 lux.
6.37. Analysis of variance of the pre-reproductive periods of TSSM 256
females on young and old leaves of two hop genotypes at 20°C,
55-100%RH and a light intensity of 43 lux.
6.38. Analysis of variance of the intrinsic rate of increase of TSSM on 256
young and old leaves of two hop genotypes at 20°C, 55-100%RH
and a light intensity of 43 lux.
6.39. Analysis of variance of the mean generation time of TSSM on young 256
and old leaves of two hop genotypes at 20°C, 55-100%RH and a light
intensity of 43 lux.
6.40. • Life table of TSSM on distal and basal regions of leaves of two hop 259
genotypes at 25°C, and the relative humidity of the ambient air
• in a incubator.
7.1. Average number of ventral glands and gland diameters found on each 279
genotype tested.
7.2. Average number of trichomes and trichome basal diameters found 280
on each genotypes tested. _ 7.3. Average length of trichome on leaves of 27 hop genotypes studied. 285

xvii
7.4. Average number of stomata per mm2 and stoma tat size found on 287
leaves of 27 hop genotypes.
7.5. Thickness of cuticle, upper and lower epidermis in leaves of each 289
genotype studied.
7.6. Mean ratio of dry : wet weight in leaves of 27 hop genotypes 290
(expressed as a percentage).
7.7. Comparison of morphological characteristics between field and 291
glasshouse hop leaves.
7.8. Comparison of morphological characteristics between young and 292
old hop leaves.
7.9. Linear regression of intrinsic rates of increase (Y) on morphological 293
characteristics of leaves (X) for 27 hop genotypes.
7.10. Linear regression of pre-reproductive period (Y) on morphological 294
characteristics of leaves 00 for 27 hop genotypes.
7.11. Linear regression of net reproductive rates (Y) on morphological 295
characteristics of leaves (X) for 27 hop genotypes.
7.12. Linear regression olintrinsic rates of increase (Y) on morphological 296
characteristics of leaves (X) for four hop genotypes.
7.13. Linear regression of pre-reproductive period (Y) on morphological 297
characteristics of leaves (X) for four hop genotypes.
7.14. Linear regression of net reproductive periods (Y) on morphological 298
characteristics of leaves 00 for four hop genotypes.
7.15. Linear regression of tolerance test under glasshouse conditions in 299
1990/91 (Y) on morphological characteristics of leaves (X) for
26 hop genotypes
7.16. Linear regression of preference test under glasshouse conditions in 300
1990 (Y) on morphological characteristics of leaves (X) for 26 hop
genotypes.
7.17. Linear regression of avoidance test under field conditions in 1991/92 301
season (Y) on morphological characteristics of leaves (X) for 24
hop genotypes.
7.18. Analysis of variance of number of eggs laid per female per day on 303
two hop genotypes under different densities.
7.19. Analysis of variance of number of yellow specks on hop leaves 305
between different genotypes under various densities.
7.20. Analysis of variance of number of open stomata on hop leaves 306
between different genotypes under various densities.
7.21. Analysis of variance of length of stomata on hop, leaves between 307

xviii
different genotypes under various densities.
7.22. Analysis of variance of width of stomata on hop leaves between
different genotypes under various densities. 8.1. Average numbers of total mites per leaf on two genotypes of hops 320
at three vine densities on January 13, 1993.
8.2. Average numbers of total mites per adhesive tape on two genotypes 323
of hops at three vine densities on January 27, 1993.
8.3. Average .numbers of total mites per leaf on two genotypes of hops at 324
three vine densities on February 10, 1993.
8.4. Average numbers of predatory mites per leaf on two genotypes of 324
hops at three vine densities on February 10, 1993.
8.5. Average numbers of total mites per leaf on two genotypes of hops at 325
three vine densities on February 17, 1993.
8.6. Average numbers of predatory mites pea- leaf on two genotypes of 325
hops at three vine densities on February 17, 1993.
8.7. Average numbers of total mites per leaf on two genotypes of hops at 328
three vine densities on February 24, 1993.
8.8. Average numbers of predatory mites per leaf on two genotypes of 328
hops at three vine densities on February 24, 1993.
8.9. Average numbers of total mites per leaf on twp genotypes of hops at 331
three vine densities on March 3, 1993.
8.10. Average numbers of predatory mites per leaf on two genotypes of 332
hops at three vine densities on March 3, 1993.
8.11. Average numbers of total mites per cm2 on two genotypes of hops at
three vine densities on January 13, 1993.
8.12. Average numbers of total mites per cm2 on two genotypes of hops at 337
three vine densities on February 10, 1993.
8.13. Average numbers of total mites per cm2 on two genotypes of hops at 337
three vine densities on February 17, 1993.
8.14. Average numbers of total mites per cm2 on two genotypes of hops at 338
three vine densities on February 24, 1993.
8.15. Average numbers of total mites per cm2 on two genotypes of hops at 338
three vine densities on March 3, 1993.
8.16. Hop plant growth of M25 and M26 at different foliage densities. 339
8.17. Average relative humidity (%) within plant canopy of two 341
genotypes of hops at three vine densities on March 3, 1993.
8.18. Average temperature (T) within plant canopy of two genotypes 341
of hops at three vine densities on March 3, 1993.
8.19. Average dry weights of hop cones per string (gm.) from genotypes 342

M25 and M26 at three vine densities.
8.20. Average dry weights of hop cones per vine (gm.) from genotypes 343
M25 and M26 at three vine dens,;ties.
8.21. Average cone weights (mg.) of genotypes M25 and M26 at three 343
vine densities.
8.22. Average percentage content of alpha acid (%) from genotypes M25 344
and M26 at three vine densities.
8.23. Average numbers of total mites per leaf on four genotypes of hops 345
at two vine densities on the first occasion of sampling under
glasshouse conditions.
8.24. Average numbers of total mites per cm2 on four genotypes of hops 345
at two vine densities on the first occasion of sampling under
glasshouse conditions.
8.25. Average numbers ottotal mites per leaf on four genotypes of hops 349
at two vine densities on the second occasion of sampling under
glasshouse conditions.
•8.26. Average numbers of total mites per cm' 2 on four genotypes of hops 349
at two vine densities on the second occasion of sampling under
glasshouse conditions.
8.27. Average light intensity (TrticroEinsteins/m2/sec) within the plant 353
canopy of four hop genotypes at two foliage densities under
glasshouse conditions.
•8.28. Average relative humidity (%) within the plant canopy of four 353
hop genotypes at two foliage densities under glasshouse conditions.
8.29. Average temperature (°C) within the plant canopy of four hop 353
genotypes at two foliage densities under glasshouse conditions.
9.1. Rivalues of moderately polar extracts in HOAc-CH3C13 (1:9) 372
solvent system for four hop genotypes bver five occasions.
LIST OF FIGURES
Figure
Title L'age
2.1. Diagram of the annual cycle of hop plants. 9
2.2. Growth habits of the above-ground parts of hop plants: 1 - umbrella 13
(hat-type), 2 - cylindrical, 3 - conical.
2.3. Structure of current infochemical terminology. 34
2.4. Generalized response curve to infestation. " 39

2.5. Variations in yield response to infestation. 40
2.6. Biosynthetic relationships between carbon and nitrogen based 45
ser2ndary plant products.
3.1. The layout of the experimental plot at Bushy Park. 57
3.2. Average heights of hop plants in the experimental plot (I). 63
Population trends of TSSM and other arthropods (II, Ill, IV, V, and
VD during the 1990/91 growing season.
3.3. Proportion of infested leaves at the height of 1.8 m. in Block D
during the 1990/91 season.
3.4. Relationship between proportion of infested leaves and mite
66
density in block D during the 1990/91 season.
3.5. Average heights of hop plants in the experimental plot (I). 68
Population trends of TSSM and other arthropods (II, DT, IV, V.
and VD during the 1991/92 growing season.
3.6. Relationship between the average number of adult females per 69
leaf in the middle region of the plant on 28 November and the
average number of total mites per leaf at the height of 1.8 in. on
(A) 12 December, (B) 26 December, and (C) 9 January for hops in
different blocks during the 1991/92 season.
3.7. Relationship between the percentage of infested leaves in the 71
middle region of the plant on 28 November and the percentage
of 1.8 m. mainstem leaves infested on (A) 12 December, (B) 26
December, and (C) 9 January for hops in different blocks during the
1991/92 season.
3.8. Average heights of hop plants in the experimental plot a). 72
Population trends of l'SSM and other arthropods (11, III, IV, V. and
VD during the 1992/93 growing season.
3.9. TSSM population performance relative to temperatures and 74
precipitation during the 1990/91 growing season. -
3.10. TSSM population performance in each block relative to
76
temperature and precipitation during the 1991/92 growing.season.
3.11. TSSM population performance relative to temperatures and
precipitation during the 1992/93 growing season.
3.12. Seasonal accumulation of mite-days in each block during the 79
1990/91 growing season.
3.13. Linear regressions of mite-days obtained from total numbers of
81
mites (Y) on those obtained from numbers of mites in various stages
00 during the 1990/91 season. ,
3.14. Linear regressions of transformed mite-days obtained from total 81

numbers of mites (Y) on those obtained from numbers of mites in
various stages 00 during the 1990/91 season.
3.15. Linear regression of total numbers of mites per leaf at time t (Y) 83
on numbers of females per leaf at time t 00.
3.16. Linear regression of mite-days obtained from total numbers of nil tes 83
per leaf at time t (Y) on those obtained from numbers of females
per leaf at time t 00.
3.17. Linear regression of total numbers of mites per leaf at time t+1 (Y) 84
on numbers of females per leaf at time t (X).
3.18. Linear regression of mite-days obtained from total numbers of mites 84
per leaf at time t+1 (Y) on those obtained from numbers of females
per leaf at time t 00.
3.19. Linear regression of total numbers of mites per leaf at time t+2 (Y)
on numbers of females per leaf at time t (X).
3.20. Linear regression of mite-days obtained from total numbers of mites 85
per leaf at time t+2 (Y) on those from numbers of females per leaf •
at time t (X).
3.21. Differences in average leaf area (A) and dry weight (B) of hops 86
among blocks at various time intervals during the 1990/91
growing season. (Significance indicated by different letters).
3.22. Linear regressions of surface areas and dry weights of leaves (Y) 87
on cumulative mite-days in each block (X) during the 1990/91
growing season.
3.23. Seasonal accumulation of mite-days in each block during the 88
1991/92 growing season.
3.24. Linear regressions of mite-days obtained from total numbers of 89
mites (Y) on those obtained from numbers of mites in various stages
00 during the 1991/92 season.
3.25. Linear regressions of transformed mite-days obtained from total 89
numbers of mites (Y) on those obtained from numbers of mites in
various stages 00 during the 1991/92 season.
3.26. Differences in average leaf area (A) and dry weight (B) of hops 90
among blocks at various time intervals during the 1991/92 growing
season.
3.27. Linear regressions Of surface areas and dry weights of leaves (Y) 90
on cumulative mite-days in each block (X) during the 1991/92
growing season.
3.28. Seasonal accumulation of mite-days in each block during the 92
1992/93 growing season.

3.29. Linear regressions of mite-days obtained from total numbers of
mites (Y) on those obtained from numbers of mites in various stages
(X) guying the 1992/93 season.
3.30. Linear regressions of transformed mite-days obtained from total 93
numbers of mites (Y) on those obtained from numbers of mites in
various stages (X) during the 1992/93 season.
3.31. Relationship between leaf area and the product of leaf length and 94
width at the widest point.
3.32. Surface area and dry weight of leaves collected from the fourth node 94
of hop mainstems during the 1992/93 growing season.
3.33. Differences in average leaf area (A) and dry weight (B) among block 95
at various time intervals during the 1992/93 growing season.
3.34. Linear regressions of surface area and dry weight of leaves (Y) on 95
cumulative mite-days in each block (X) during the 1992/93 growing
season. •
3.35. Cumulative mite-days at the height of 1.8 m. in each block over 96
the 3-yr study (1990/91, 1991/92, and 1992/93).
3.36. Relationship between Green coefficients and mite densities in each 99
block.
3.37. Percentages representative of various stages of TSSM arid its major 101
predators at different levels within plants.
3.38. Average surface area and dry weight of leaves at each foliage 102
height.
3.39. Relationship of log variance to log mean values of mites between 104
different foliage heights.
3.40. Densities of TSSM and its major predators at diffferent plant 107
• foliage heights.
3.41. Mean numbers of TSSM at various stages in different foliage 108
heights during the 1991/92 growing season: (I) Females; (11) Males;
(III) Immatures; and (IV) Eggs.
3.42. Average numbers of total mites per leaf (I) and surface areas (II) 110
and dry weights (III) of leaves among different foliage heights
during the 1991/92 growing season.
3.43. Mean numbers of TSSM per cm.2 among different foliage heights 111
• during the 1991/92 growing season: a) Females; (II) Males; (III) Immatures; (IV) Eggs; and (V) Total mites.
3.44. Mean numbers of TSSM per grain leaf biomass among different 112
foliage heights during the 1991/92 growing season: (I) Females; (II)
Males; (III) Inunatures; (IV) Eggs; and (V) Total mites.

3.45. Average mite densities in various stages on leaves from the fourth 113
node and the middle region of hop plants in each block on the first
and second sampling occasion during the 1992/93 season.
4.1. Layout of the experimental plot at Horticultural Research Centre. 131
4.2. Comparison of transformed mean numbers of mites per leaf between 135
different genotypes at different sampling time.
4.3. Total numbers of mites counted on each genotype in the first 136
artificial infestation experiment under glasshouse conditions.
4.4. Mean numbers of mites on each genotype in the second artificial 137
infestation experiment under glasshouse conditions.
4.5. Total number of mites per czn.2 of leaves counted in hop yard No. 2 143
during the 1991/92 season.
4.6. Cumulative mite-days on each genotype grown in hop yard No.1 146
during the 1990/91 season.
4.7. Cumulative mite-days on each genotype grown in hop yard No.1 147
during the 1991/92 season.
4.8. Cumulative mite-days on each genotype grown in hop yard No.1 148
during the 1992/93 season.
4.9. Kruskal-Wallis mean ranks of cumulative mite-days for each 149
genotype grown in hop yard No.l.
4.10. Cumulative mite-days on each genotype grown in hop yard No.2 151
during the 1990/91 season.
4.11. Cumulative mite-days on each genotype grown in hop yard No.2 152
during the 1991/92 season.
4.12. Cumulative mite-days on each genotype grown in hop yard No.2 153
during the 1992/93 season.
4.13. Mann-Whitney mean ranks of cumulative mite-days for each 154
genotype grown in hop yard No.2.
4.14. Relationships between leaf feeding damage and plant 160
characteristics: leaf area (A), no. of leaves per plant (B), no. of
tillers per plant (0, and plant height (D).
4.15. Average plant height of 26 hop genotypes grown in the field on 162
each occasion of sampling during the 1991/92 season.
4.16. Cone production in each block at the Horticultural Research 164
Centre: no. of cones per vine (A), average weight of cones per vine
(B) and dry weight per cone (0.
5.1. Survivorship of TSSM on four genotypes of hops. 177
5.2. Average longevity of TSSM on four genotypes of hops. 178
5.3. Fecundity of TSSM on four genotypes of hops. . 179

xxi v
5.4. Relationship between rm (Birch) and rm (Wyatt and White) of 184
TSSM.
5.5. Survivorship and average number of eggs laid per day per ferclle 185
on various hop genotypes under different conditions.
5.6. Survivorship of TSSM on different sizes and source of leaves. 190
5.7. Average number of eggs laid per day per living female TSSM on 190
different sizes and sources of leaves.
5.8. Average total number of eggs of Tssm on different surface areas of 191
leaf discs.
5.9. Average longevity of TSSM on different surface areas of leaf discs. 191
6.1. Developmental period for eggs of 15SM on M4(A) and M27(B) at 204
76%RH and 171 lux.
6.2. The regression of the reciprocal of the development period for eggs 205
in days (Y) on temperature QQ.
6.3. Developmental period from active larva to quiescent deutonymph 206
of TSSM on M4 and M27 at 76%RH and 171 lux.
6.4. Developmental period from eggs to adults of TSSM females on 207
M4(A) and M27(B) at 76%RH and 171 lux.
6.5. Pre-reproductive periods of TSSM on M4(A) and M27(B) at 76%RH 208
and 171 lux.
6.6. Developmental time of TSSM on M4 and M27 at a light intensity of 209
43 lwc.
6.7. Pre-reproductive period of TSSM on two hop genotypes between 211
different temperatures at 55% RH(A), 76%RH(B), and 85%RH(C)
at a light intensity of 43 lux.
6.8. Intrinsic rates of increases of TSSM on different hop genotypes at 212
55%RH(A), 76%RH(B) and 85%RH(C) at a light intensity of 43 lux
•and three temperatures.
6.9. Mean generation times of 15SM on different hop genotypes at 213
•.55%RH(A), 76%RH(B) and 85%RH(C) at a light intensity of 43 lux
and three temperatures.
6.10. Developmental periods for eggs of TSSM at 20°, 25°, and 30°C. 214
6.11. Developmental periods from eggs to adults of TSSM at 20°,.25°, 215
and 30°C.
6.12. Pre-reproductive periods of TSSM at 20°, 25°, and 30°C. 216
6.13. Intrinsic rates of increase of TSSM at 20°, 25°, and 30°C. 217
6.14. Mean generation time of TSSM at 20°, 25°, and 30°C. 218
6.15. Developmental period for eggs of TSSM on M4(4) and M27(B) at• 220
arc and 171 lux. •

XXV
6.16. Developmental period from active larva to quiescent deutonymph 221
• of females (A) and males (B) on M4 and M27 at 30°C and 171 lux.
6.17. Developmental period from eggs to adults of TSSM females r 222
M4(A) and M27(B) at 30°C and 171 lux.
6.18. Pre-reproductive period of TSSM females on M4(A) and M27(B) at 222
30°C and 171 lux.
6.19. Intrinsic rates of increases of TSSM on two genotypes of hops at 30°C 223
and 171 lux.
6.20. Mean generation time of TSSM on two genotypes of hops at 30°C and 223
171 lux.
6.21. Developmental time of TSSM females on M4 and M27 at 20°C(A), 225
25°C(B) and, 30°C(C) at a light intensity of 43 lux.
6.22. Pre-reproductive period of TSSM on two genotypes of hops at 226
20°C(A), 25°C(B) and 30°C at a light intensity of 43 lux.
6.23. Intrinsic rates of increase of TSSM on two genotypes of hops at 227
20°C(A), 25°C(B) and 30Pc(c) at a light intensity of 43 lux and three humidities.
6.24. Mean generation times of TSSM on two genotypes of hops at 228
20°C(A), 25°C(B) and xrao at a light intensity of 43 lux and three humidities.
6.25. Developmental periods for eggs of TSSM at 55%, 76%, and 85%RH. 229
6.26. Developmental periods from eggs to adults of TSSM at 55%, 76%, 230
and 85% RH.
6.27. Pre-reproductive periods of TSSM at 55%, 76%, and 85%RH. 231
6.28. Intrinsic rates of increase of TSSM at 55%, 76%, and 85%RH. 232
6.29. V Mean generation time of TSSM at 55%, 76%, and 85%RH. 233
6.30. Developmental period for eggs of TSSM on M4(A) and M27(B) at 235
25°C and the relative humidity of thiambient air in the incubator.
6.31. Average developmental period for eggs of TSSM at 25°C and the
relative humidity of the ambient air in the incubator.
6.32. Developmental period from active larva to quiescent deutonymph 236
of females(A) and males(B) on M4 and M27 at 25°C and the
relative humidity of the ambient air in the incubator.
6.33. Developmental period from eggs to adults of TSSM females on 237
M4(A) and M27(B) at 25°C and the relative humidity of the
ambient air iri the incubator.
6.34. Average developmental period from eggs to adults of TSSM females 238
at 25°C and the relative humidity of the ambient air in the
incubator.

xxvi
6.35. Pre-reproductive period of TSSM females on M4(A) and M27(B) at 239
25°C and the relative humidity of the ambient air in the incubator.
6.36. Average pre-reproductive period of TSSM females at 25°C and 239
the relative humidity of the ambient air in the incubator.
6.37. Intrinsic rates of increases of TSSM on different hop genotypes at 240
25°C and the relative humidity of the ambient air in the incubator.
6.38. Mean generation times of TSSM on different hop genotypes at 240
25°C and the relative humidity of the ambient air in the incubator.
6.39. Developmental period for eggs of TSSM at 43 and 171 lux. 247
6.40. Developmental periods from eggs to adults of TSSM at 43 and 171 247
lux.
6.41. Pre-reproductive periods of TSSM at 43 and 171 lux. 247
6.42. Intrinsic rates of increase of TSSM at 43 and 171 lux. 248
6.43. Mean generation time of TSSM at 43 and 171 lux. 248
6.44. Developmental period for eggs of TSSM on young and old leaves of 250
M4(A) and M27(B) at 76%RH and 171 lux.
6.45. Developmental period from eggs to adults of TSSM females on 251
young and old leaves of M4(A) and M27(B) at 76%RH and 171 lux.
6.46. Pre-reproductive period of TSSM on young and old leaves of M4(A) 252
and M27(B) at 76%RH and 171 lux.
6.47. Intrinsic rates of increases of TSSM on young and old leaves of 253
different hop genotypes at 20°C, 76%RH and a light intensity of
• 171 lux.
6.48. Mean generation times of TSSM on young and old leaves of 253
different hop genotypes at 20°C, 76%RH and a light intensity of
171 lux.
6.49. Developmental periods for eggs of TSSM on young and old leaves. 257
6.50. Developmental periods from eggs to adults of TSSM females on 257
young and old leaves.
6.51. Pre-reproductive periods of TSSM females on young and old leaves. 257
6.52. Intrinsic rates of increase of TSSM on young and old leaves. 258
6.53. Mean generation time of TSSM on young and old leaves. 258
6.54. Developmental period for eggs of TSSM on distal and basal regions 260
of leaves of M4(A) and M27(B) at 25°C under the relative humidity
of the ambient air in the incubator.
6.55. • Developmental period from eggs to adults of TSSM females on 261
distal and basal regions of leaves of M4(A) and M27(B) at 25°C
under the relative humidity of the ambient akin the incubator.
6.56. - Pre-reproductive period of TSSM females on distal and basal regions 262

xxvii
of leaves of M4(A) and M27(B) at 25°C and the relative humidity
of the ambient air in the incubator.
6.57. Intrinsic rates of increase of TSSM on distal and basal regions of 263
leaves of different hop genotypes at 25°C under the relative
humidity of the ambient air in the incubator.
6.58. Mean generation time of TSSM on distal and basal regions of 263
leaves of different hop genotypes at 25°C under the relative
humidity of the ambient air in the incubator.
7.1. Total number of ventral glands and trichomes within 1 nun2 of hop 281
leaves for each genotype studied.
7.2. Average areas of ventral glands (A) and trichome bases (B) found 282
on each genotype tested.
7.3. Percentage of ventral gland areas (A) and trichome areas (B) 283
within 1 rnm2 of hop leaves for each genotype studied.
7.4. Pooled percentage of gland and trichome areas within 1 rrun2 of hop 284
leaves for each genotype studied.
7.5. Trichome density and length of 27 hop genotypes and the respective 286
trichome profile region: (A) few-short trichomes; (B) few-long
trichomes; (C) many-short trichomes; and (D) many-long trichomes.
7.6. Thickness of leaves (A) and major leaf veins (B) of 27 hop genotypes 288
studied.
7.7. Average number of eggs on each genotype (A) under different 303
densities (B).
7.8. Average number of yellow specks on hop leaves for each genotype 305
(A) under different densities (B).
7.9. Average number of open stomata on hop leaves for each genotype
(A) under three different densities (B).
7.10. Average length of stomata on hop leaires for each genotypes 307
(A) under different densities (B).
7.11. Average width of stomata on hop leaves for each genotype (A) 308
under three. different densities (B).
8.1. Average numbers of adult females per leaf on two genotypes of 319
hops at three different foliage densities on December 30, 1992.
8.2. Average numbers of adult females per leaf on two genotypes of 321
hops at three different foliage densities on January 13, 1993.
8.3. Average numbers of adult males per leaf on two genotypes of hops 321
at three different foliage densities on January 13, 1993.
8.4. Average numbers of inunatures per leaf on two genotypes of hops 322
at three different foliage densities on January 13, 1993.

8.5. Average numbers of eggs per leaf on two genotypes of hops at 322
three different foliage densities on January 13, 1993.
8.6. Average numbers of total mites per leaf on two genotypes of hops 326
at two height intervals on February 17, 1993.
8.7. Average numbers of total mites per leaf at three height intervals 326
of three vine densities on February 17, 1993.
8.8. Average numbers of predatory mites per leaf on two genotypes of 327
hops at two height intervals on February 17, 1993.
8.9. Average numbers of predatory mites per leaf at three height 327
intervals of three vine densities on February 17, 1993.
8.10. Average numbers of total mites per leaf on the leaves at each 329
height interval for the two hop genotypes (A) and the three
foliage densities (B) on February 24, 1993.
8.11. Average numbers of predatory mites per leaf on the leaves at
each height interval for the two hop genotypes (A) and the
three foliage densities (B) on February 24, 1993.
8.12. Average numbers of total mites per leaf on the leaves at each 333
height interval for the two hop genotypes (A) and the three
foliage densities (B) on March 3, 1993.
8.13. Average numbers of predatory mites per leaf on the leaves at
each height interval for the two hop genotypes (A) and the
three foliage densities (B) on March 3, 1993.
8.14. Leaf surface areas of M25 and M26. 335
8.15. Leaf surface areas of hop plants at different vine densities. 336
8.16. Plant growth of M25 and M26 at Bushy Park during the 1992/93 340
growing season.
8.17. Average numbers of adult females per leaf on four genotypes of 346
hops at two different foliage densities. on the first occasion of
sampling under glasshouse conditions.
8.18. Average numbers of adult males per leaf on four genotypes of 346
hops at two different foliage densities on the first occasion of
sampling under glasshouse conditions.
8.19. Average numbers of immatures per leaf on four genotypes of hops 347
at two different foliage densities on the first occasion of
sampling under glasshouse conditions.
8.20. Average numbers of eggs per leaf on four genotypes of hops at two 347
different foliage densities on the first occasion of sampling under
glasshouse conditions.
8.21. Average numbers of adult females per leaf on four genotypes of

hops at two different foliage densities on the second occasion
of sampling under glasshouse conditions.
8.22. Average numbers of adult males per leaf on four genotypes of hops 350
at two different foliage densities on the second occasion of
sampling under glasshouse conditions.
8.23. Average numbers of immatures per leaf on four genotypes of hops 351
at two different foliage densities on the second occasion of
sampling under glasshouse conditions.
8.24. Average numbers of eggs per leaf on four genotypes of hops at two 351
different foliage densities on the second occasion of sampling under
glasshouse conditions.
8.25. Linear regression of total numbers of TSSM per leaf (Y) on total 352
numbers of TSSM per adhesive tape 00.
9.1. Gas exchange characteristics of hop leaves collected from three 364
genotypes: (A) photosynthesis; (B) stomata' conductance.
9.2. Gas exchange characteristics of leaves on hop plants propagated 365
from different planting materials: (A) photosynthesis; (B)
stomatal conductance.
9.3. Gas exchange characteristics of hop leaves affected by the sticky
barrier: (A) photosynthesis; (B) stomatal conductance. •
9.4. Comparisons of gas exchange characteristics between uninfested 368
and infested hop leaves 3 days after inoculation: (A)
photosynthesis; (B) stomatal conductance.
9.5. Comparisons of gas exchange characteristics between uninfested 369
and infested glasshouse hop leaves 2 weeks after inoculation:
(A) photosynthesis; (B) stomatal conductance.
9.6. Comparisons of gas exchange characteristics between uninfested 370
and infested field hop leaves 10 days 'after inoculation: (A)
photosynthesis; (B) stomata' conductance.
9.7. Linear relationship between photosynthesis and stomatal 371
conductance for combined data in the present study; n = 52.
9.8. Chromatogram of volatile compounds of uninfested hop leaves 373
collected from M4. 0
9.9. Chromatogram of volatile compounds of infested hop leaves 373
collected from M4.
9.10. Chromatogram of volatile compounds of uninfested hop leaves 374
collected from M27.
9.11. Chromatogram of volatile compounds of infested hop leaves 374
collected from M27.

9.12. Chromatogram of volatile compounds of urtinfested hop cones
375
collected from M27.
9.13. Chromatogram of volatile compcinds of infested hop cones
375
collected from M27.
9.14. Chromatogram of volatile compounds of uninfested hop leaves
376
collected from M27 separated using the steam distillation
technique.
9.15. Chromatogram of volatile compounds of infested hop leaves
377
collected from M27 separated using the steam distillation
technique
9.16. Monoterpenoids in hop oil and beer (after Sharpe, 1988). 380
LIST OF PLATES
Plate
Title Edge
1. The developmental stages of TSSM. 23
2. Hop plants in the experimental plot during the early part of the
growing season.
59
3. Hop plants in the experimental plot during the later part of the
growing season.
59
4. Hop plants infested by TSSM under glasshouse conditions: 145
M4(left) and M26(right).
5. The lower surface of hop leaves at 212X. 278
6. The upper surface of leaf discs infested by TSSM at 287X. 302
7. The lower surface of leaf discs infested by TSSM at 163X. 302
LIST OF APPENDICES
Appendix. Title Page
3.1. Unpaired t-tests for mite densities in the middle region of treated - 432
and untreated hop plants in the early 1991/92 growing season.
3.2. Unpaired t-tests for total numbers of TSSM (all stages) after 432
re-infestation on 10/2/93 and 24/2/93.
3.3. One-factor ANOVA for surface areas of hop leaves at the height of 432
1.8 m. among different blocks during the 1990/91 growing season.

3.4. One-factor ANOVA for dry weights of hop leaves at the height 432
of 1.8 m. among different blocks during the 1990/91 growing season.
3.5. One-factor ANOVA for surface areas of hop leaves at the height 433
of 1.8 in. among different blocks during the 1991/92 growing season.
3.6. One-factor ANOVA for dry weights of hop leaves at the height
of 1.8 m. among different blocks during the 1991/92 growing season.
3.7. One-factor ANOVA for surface areas of hop leaves at the fourth 433
node among different blocks during the 1992/93 growing season.
3.8. One-factor ANOVA for dry weights of hop leaves at the fourth 433
• node among different blocks during the 1992/93 growing season.
3.9. One-factor ANOVA for surface areas of hop leaves at the height 434
of 1.8 m. among different blocks during the 1992/93 growing season.
3.10. One-factor ANOVA for dry weights of hop leaves at the height 434
of 1.8 m. among different blocks during the 1992/93 growing season.
3.11. One-factor ANOVA for log (1+x) of adult female numbers per leaf 434
among different foliage heights.
3.12. One-factor ANOVA for log (1+x) of adult male numbers per leaf
among different foliage heights.
3.13. One-factor ANOVA for log (1+x) of immature numbers per leaf 435
among different foliage heights.
3.14. One-factor ANOVA for log (1+x) of egg numbers per leaf among 435
different foliage heights.
3.15. One-factor ANOVA for log (1+x) of total mite numbers per leaf 435
among different foliage heights.
3.16. One-factor ANOVA for log (1+x) of Stethorus numbers per leaf
among different foliage heights.
3.17. One-factor ANOVA for log (1+x) of predatory mite numbers per 436
leaf among different foliage heights.
3.18. One-factor ANOVA for log (1+x) of adult female numbers per cm.2
among different foliage heights.
3.19. One-factor ANOVA for log (1+x) of adult male numbers per cm2 436
among different foliage heights.
3.20. One-factor ANOVA for log (1+x) of immature numbers per cm.2
among different foliage heights.
3.21. One-factor ANOVA for log (1+x) of egg numbers per cm.2 among 437
different foliage heights.
3.22. One-factor ANOVA for log (1+x) of total mite numbers per cm.2 437
among different foliage heights.
3.23. One-factor ANOVA for log (1+x) of Stethorus numbers per cm.2 437.

among different foliage heights.
3.24. One-factor ANOVA for log (1+x) of predatory mite numbers per cm.2 437
among different foliage heights.
3.25. One-factor ANOVA for log (1+x) of adult female numbers per gm. 438
• among different foliage heights.
3.26. One-factor ANOVA for log (1+x) of adult male numbers per gm. 438
among different foliage heights.
3.27. One-factor ANOVA for log (1+x) of immature numbers per gm. 438
among different foliage heights.
3.28. One-factor ANOVA for log (1+x) of egg numbers per gm. among 438
different foliage heights.
3.29. One-factor ANOVA for log (1+x) of total mite numbers per gm. 439
among different foliage heights.
3.30. One-factor ANOVA for log (1+x) of Stethorus numbers per gm. 439
among different foliage heights.
3.31. One-factor ANOVA for log (1+x) of predatory mite numbers per gm. 439
among different foliage heights. s
4.1. One-factor ANOVA for total numbers of mites per leaf among 439
• different genotypes infested artificially on the 1st- sampling
• occasion under glasshouse conditions.
4.2. One-factor ANOVA for log (1+x) of mite numbers per leaf among 440
different genotypes infested artificially on the 1st- sampling
occasion under glasshouse conditions.
4.3. One-factor ANOVA for total numbers of mites per leaf among 440
different genotypes infested artificially on the 2nd- sampling
occasion under glasshouse conditions.
4.4. One-factor ANOVA for log (1+x) of mite numbers per leaf among 440
different genotypes infested artificially on the 2nd- sampling
occasion under glasshouse conditions.
4.5.
One-factor ANOVA for total numbers of mites per leaf among •440
different genotypes infested artificially on the 3rd- sampling
occasion under glasshouse conditions.
4.6. One-factor ANOVA for log (1+x) of mite numbers per leaf among 441
different genotypes infested artificially on the 3r1- sampling
Occasion under glasshouse conditions.
4.7. One-factor ANOVA for total numbers of mites per leaf among 441
different genotypes infested artificially on the 4th- sampling
occasion under glasshouse conditions.
• 4.8. One-factor ANOVA for log (1+x) of mite numbers per leaf among 441

different genotypes infested artificially on the 4t11- sampling
occasion under glasshouse conditions.
4.9. The mean size of eggs, adult males and adult females reared on 26 442
genotypes of hops under glasshouse conditions.
4.10. One-factor ANOVA for total mite numbers per leaf among different 443
genotypes in the first experiment of artificial infestations under
glasshouse conditions.
4.11. One-factor ANOVA for numbers of mites among different genotypes 443
in the second experiment of artificial infestations under glasshouse
conditions.
4.12. One-factor ANOVA for numbers of mites among different genotypes 443
grown at the Horticultural Research Centre during 1991/92 season.
4.13. One-factor ANOVA for numbers of mites among different genotypes 443
grown at the Horticultural Research Centre during 1992/93 season.
4.14. One-factor ANOVA for numbers of mites per leaf among different
genotypes infested naturally under glasshouse conditions.
4.15. One-factor ANOVA for numbers of mites per cm.2 among different
genotypes infested naturally under glasshouse conditions.
4.16. One-factor ANOVA for log (x+1) of mite numbers per cm.2 among 444
24 genotypes of hops infested naturally in Hop Yard No. 1 on
February 6, 1992.
4.17. One-factor ANOVA for log (x+1) of mite numbers per cm.2 among. 444
24 genotypes of hops infested naturally in Hop Yard No. 1 on
February 20, 1992.
4.18. One-factor ANOVA for log (x+1) of mite numbers per an.2 among 445
24 genotypes of hops infested naturally in Hop Yard No. 1 on
March 5, 1992.
4.19. One-factor ANOVA for log (x+1) of total mite numbers per cm.2 445
among 24 genotypes of hops infested naturally in Hop Yard No. 1
during 1991/92 season.
4.20. One-factor ANOVA for mite numbers per cm.2 among 24 genotypes 445
of hops infested naturally in Hop Yard No. 1 on November 4, 1992.
4.21. One-factor ANOVA for mite numbers per cM.2 among 24 genotypes 445
of hops infested naturally in Hop Yard No. 1 on November 18,1992.
4.22. One-factor ANOVA for total mite numbers per an.2 among 24 446
genotypes of hops infested naturally in Hop Yard No. 1 during
1992/93 season.
4.23 One-factor ANOVA for damage ratings among 26 hop genotypes 446

xxxiv
following the infestations under glasshouse conditions.
4.24. Kruskal-Wallis test for mean ranks of cumulative mite-days 446
among 24 hop genotypes grown in Hop Yard No. 1 during three
growing seasons.
4.25. Mann-Whitney U test for mean ranks of cumulative mite-days 446
between two hop genotypes grown in Hop Yard No. 2 during
three growing seasons.
4.26. One-factor ANOVA for intemode lengths among 26 hop genotypes 447
grown under glasshouse conditions.
4.27. One-factor ANOVA for surface areas of hop leaves among 26 447
genotypes grown under glasshouse conditions.
4.28. One-factor ANOVA for numbers of leaves among 26 hop genotypes 447
grown under glasshouse conditions.
4.29. One-factor ANOVA for numbers of tillers among 26 hop genotypes 447
grown under glasshouse conditions.
4.50. One-factor ANOVA for plant heights among 26 hop genotypes 448
grown under glasshouse conditions.
4.31. One-factor ANOVA for surface areas of hop leaves among 26 448
genotypes grown under field conditions.
4.32. One-factor ANOVA for dry weights of hop loaves among 26 448
•genotypes grown under field conditions.
4.33. One-factor ANOVA for numbers of cones per vine among 26 hop 448
genotypes grown at the Horticultural Research Centre during
the 1991/92 season.
4.34. One-factor ANOVA for dry weight per cone among 26 hop 449
genotypes grown at the Horticultural Research Centre during
the 1991/92 season.
4.35. One-factor ANOVA for dry weights of cones per vine among 26 hop 449
genotypes grown at the Horticultural Research Centre during
the 1991/92 season.
4.36. One-factor ANOVA for numbers of cones per vine among 26 hop 449
genotypes grown at the Horticultural Research Centre during
• the 1992/93 season.
4.37. One-factor ANOVA for dry weight per cone among 26 hop 449•
genotypes grown at the Horticultural Research Centre during
•the 1992/93 season.
4.38. One-factor ANOVA for dry weights of cones per vine among 26 449
• hop genotypes grown at the Horticultural Research Centre during
•the 1992/93 season. •

4.39. One-factor ANOVA for dry weights of cones per vine between 450
different blocks of hops grown at the Horticultural Research
Centre during the 1992/93 season.
4.40. One-factor ANOVA for dry weight per cone between different 450
blocks of hops grown at the Horticultural Research Centre during
the 1992/93 season.
4.41. One-factor ANOVA for the number of cones per vine between 450
different blocks of hops grown at the Horticultural Research
Centre during the 1992/93 season.
5.1. One-factor ANOVA for hatchability of TSSM among four genotypes 450
of hops in Experiment 1.
5.2. One-factor ANOVA for survival of TSSM immatures among four 451
genotypes of hops in Experiment 1.
5.3. One-factor ANOVA for sex ratio (F/M) of TSSM among four 451
genotypes of hops in Experiment 1.
5.4. One-factor ANOVA for longevity of TSSM among four genotypes 451
of hops in Experiment 1.
5.5. One-factor ANOVA for the cumulative number of eggs laid by 451
TSSM among four genotypes of hops during the first fourth days of
ovipositon in Experiment 1.
5.6. Daily record of the numbers of TSSM females and their eggs on four 452
genotypes of hops in Experiment 1.
5.7. Life-fecundity table for TSSM on four genotypes of hops in 453
Experiment 1.
5.8. Reproductive parameters of TSSM on 27 hop genotypes in Test 1 of 454
• Experiment 2.
5.9. Reproductive parameters of TSSM on 27 hop genotypes in Test 2 of 455
Experiment 2.
•5.10. Reproductive parameters of TSSM on 27 hop genotypes in Test3 of 456
Experiment 2.
5.11. Reproductive parameters of TSSM on 27 hop genotypes in Test 4 of 457
Experiment 2.
5.12. Reproductive parameters of TSSM reared on three different surface 458
areas of leaf discs cut from 24 hop genotypes.
6.1. Daily record of numbers of TSSM reaching each stage on M4 and M27 459
at 76%R1-1 and three temperatures with a light intensity of 171 lux.
6.2. One-factor ANOVA for developmental period from eggs to adults of 462
TSSM on M4 at 76ToRH and a light intensity of 171 lux among
• different temperatures.

xxxvi
6.3. One-factor ANOVA for developmental period from eggs to adults 462
of TSSM on M27 at 76%RH and a light intensity of 171 lux among
different temperatures.
7.1. One-factor ANOVA for the number of ventral glands among 27 463
genotypes of hops.
7.2. One-factor ANOVA for the number of trichomes among 27 genotypes 463
of hops.
7.3. One-factor ANOVA for the diameters of ventral glands among 27
genotypes of hops.
7.4. One-factor ANOVA for the basal diameters of trichomes among 27 463
genotypes of hops.
7.5. One-factor ANOVA for the length of trichomes among 27 genotypes 463
of hops.
7.6. One-factor ANOVA for the number of stomata per mm2 among 27 464
genotypes of hops.
. 7.7. One-factor ANOVA for stomatal length among 27 genotypes of hops. 464
7.8. One-factor ANOVA for stomatal width among 27 genotypes of hops. 464
7.9. One-factor ANOVA for the thickness of leaves among 27 genotypes 464
of hops.
7.10. One-factor ANOVA for thickness of leaf veiris among 27 genotypes
of hops.
7.11. One-factor ANOVA for cuticle thickness of leaves among 27
• genotypes.
7.12. One-factor ANOVA for percent thy weight of leaves among 27
genotypes.•
7.13. One-factor ANOVA for upper epidermis of leaves among 27
genotypes.
7.14. One-factor ANOVA for lower epidermis of leaves among 27
genotypes.
8.1. Two-factor ANOVA for the number of adult females per leaf
between two hop genotypes at three foliage densities under field
conditions on December 30, 1992.
8.2. Two-factor ANOVA for the total number of mites per leaf between 466
two hop genotypes at three foliage densities under field conditions
on January 13, 1993.
8.3. Two-factor ANOVA for the total number of mites per adhesive 466
tape between two hop genotypes at three foliage densities under
field conditions on January 27, 1993.
8.4. Two-factor ANOVA for the total number of mites per leaf between

two hop genotypes at three foliage densities under field conditions
on February 10, 1993.
8.5. . Two-factor ANOVA for the total number of mites per leaf between
two hop genotypes at three foliage densities under field conditions
on February 17, 1993.
8.6 Two-factor ANOVA for the total number of mites per leaf between 467
two hop genotypes at three foliage densities under field conditions
on February 24, 1993.
8.7. Two-factor ANOVA for the total number of mites per leaf between 467
two hop genotypes at three foliage densities under field conditions
on March 3, 1993.
8.8. Two-factor ANOVA for the total number of predatory mites per leaf 467
between two hop genotypes at three foliage densities under field
conditions on February 17, 1993.
8.9. Two-factor ANOVA for the total number of predatory mites per 467
•leaf between two hop genotypes at three foliage densities under
field conditions on February 24, 1993.
8.10. Two-factor ANOVA for the total number of predatory mites per 468
leaf between two hop genotypes at three foliage densities under
field conditions on March 3, 1993.
8.11. Two-factor ANOVA for the total number of mites per leaf among
four hop genotypes at two foliage densities on the first sampling
occasion under glasshouse conditions.
8.12. Two-factor ANOVA for the total number of mites per leaf among
four hop genotypes at two foliage densities on the second sampling
occasion under glasshouse conditions.
9.1. One-factor ANOVA for the photosynthesis rate of hop leaves
among three genotypes.
9.2. One-factor ANOVA for the stomatal conductance of hop leaves 469
among three genotypes.
9.3. One-factor ANOVA for the photosynthesis rate of hop leaves 469
•between cutting and rootstock plants.
9.4. • One-factor ANOVA for the stomatal conductance of hop leaves 469
between cutting and rootstock plants.
9.5. One-factor ANOVA for the photosynthesis rate of hop leaves 469
between plastic treated and untreated plants.
9.6. One-factor ANOVA for the stomatal conductance of hop leaves 469
between plastic treated and untreated plants.
9.7. • One-factor ANOVA for the photosynthesis rate of hop leaves 470

between TSSM infested and uninfested plants for the first
measurement under glasshouse conditions.
9.8. One-factor ANOVA for the stomatal conductance of hop leaves 470
between TSSM infested and uninfested plants for the first
measurement under glasshouse conditions.
9.9. One-factor ANOVA for the photosynthesis rate of hop leaves 470
between 15SM infested and uninfested plants for the second
measurement under glasshouse conditions.
9.10. One-factor ANOVA for the stomatal conductance of hop leaves 470
between TSSM infested-and uninfested plants for the second
measurement under glasshouse conditions.
9.11. One-factor ANOVA for the photosynthesis rate of hop leaves 471
between TSSM infested and uninfested plants under field conditions.
9.12. One-factor ANOVA for the stomata( conductance of hop leaves 471
between TSSM infested and uninfested plants under field conditions.

ACKNOWLEDGEMENTS
I wish to express sincere gratitude to Dr. John L. Madden, Reader in
Entomology at the Department of Agricultural Science, for his
encouragement, valuable suggestions, and constructive criticism throughout
the period of research and during the writing of this thesis.
The financial support provided by the Australian Government under
the Equity and Merit Scholarship Scheme helped make this study possible.
Thanks are extended to Mr. D. Salier and Mr. G. Leggett (Australian Hop
Marketers Pty Ltd.) who graciously provided experimental materials used in
the study. An expression of thanks is also due to Royal Thai Government for
the study-leave permission.
Appreciation is expressed to the following individuals who provided
help during the various stages of the study: Dr. J. Beattie, Mr. D. Bradford,
Prof. R. Clark, Dr. R. Cruickshank, Ms. L. Dow, Mr. N. Hanson, Ms. S. Jones,
Mr. M. Lee, Dr. H. Li, Prof. B. Menary, Dr. N. Mendham, Dr. R. Mensah, Mr.
D. Metcalf, Ms. L. Oxley, Mr. B. Peterson, Ms.. P. Prayurnproh, Dr. L.
Readshaw, Mr. C. Street, Dr. S. Suwanbutr, Ms. M. Williams and Mr. T.
Young. Special• thanks is also addressed to all those who helped me in
several ways either directly and indirectly.
The skillful assistance of Dr. C. Beadle and Mr. W. Jablonski in some
parts of the work is gratefully acknowledged.
Finally, I am greatly indebted to my parents, aunt, brothers and sisters
for their constant encouragement and support during the course of this
study.

1
CHAPTER 1 INTRODUCTION
In pest management systems, development bf resistant cultivars
represents a fundamental means of reducing the damaging effects of pest
infestation on crop plants (Adkisson and Dyck, 1980). The resistant
cultivars can be applied as an ecologically compatible alternative to the
use of chemical pesticides and enhance biological control. Considering
the obvious economic and environmental advantages, several studies on
plant resistance to pests have well been expanded to realize these benefits
(Gallun, 1972; Gallun et al., 1975). Evidently sufficient genetic variation is
present in breeding populations of some crop plants to effectively select
for resistance to the pests. However, there is only fragmentary
information available regarding the mechanisms in the plant that
condition pest biology. Until the morphological and biochemical factors
of plant mechanisms are better understood, screening and selection for
resistance must be based on actual plant responses to the attacking pests.
The ultimate objective will be to genetically alter those plant
characteristics responsible, thereby maximizing the production of the crop
plants to meet growing demands imposed by future needs.
In addition to the benefits, genetically changing the biochemical or
morphological characteristics of crop plants for developing host plant
resistance to their pests has some risks. These include chemical toxicants,
nutritional effects, effects of crop yields, effects on beneficial invertebrates
and microorganisms, increased susceptibility to other pests, effects on
other crops, and loss of resistance by evolution in the pest (Pimentel,
1986). It is likely that the plants use many different characteristics as
defences against pest attack, and some of these characteristics contribute to
these risks. For example, some plants can contain compounds that are
toxic not only to the pests but also to livestock and humans.

With regard to the historical view of plant resistance, the first
extensive work on plant resistance to the pests was published by Painter
in 1951 (Ortman and Peters, 1980). He'included a comprehensive review
of the literature to that time and the principles of plant resistance to pests.
The subsequent review papers were reported by Painter (1958), Beck
(1965), Maxwell et al. (1972), Gallun et al. (1975), and Farrell(1977). Several
other reseachers have reported on various aspects of plant resistance to
pests (Jermy, 1976; Russell, 1978; Rosenthal and Janzen, 1979; Maxwell
and Jennings, 1980; Hedin 1983). Recently, empirical studies of
interactions between plants and herbivores have increased exponentially,
but progress toward a unifying and organizing theory of plant defence has
not kept pace (Herms and Mattson, 1992).
• According to Russell (1978) and Gallun and Khush (1980), plant
resistance is the heritable ability of the host plant to reduce infestation
and/or damage by their pests. The interaction of a suite of genetically
based chemical and structural traits causes plant resistance to the pests.
Phenotypic variation in herbivore resistance, however, results primarily
from variation in plant nutrient and secondary metabolite concentrations
(Herms and Mattson, 1992). Numerous plants in nature have evolved to
limit the feeding of the pests on them (Pimentel, 1968; Pimentel et al.,
1975; Hedin, 1977). Through careful selections and breeding, genes
resistant to particular pests can be incorporated into a commercial plant
type and provide the plant with effective pest control (Pimentel, 1986).
Breeding crop plants for genetic resistance to the pests may be
classified into two main types: vertical and horizontal resistance (van der
Plank, 1963). Vertical resistance occurs when a crop is very resistant to
only certain genetic variants of a specific pest, whereas horizontal
resistance is generally polygenic and effective against a greater number of
pests. Selection of resistance can be accelerated if specific resistance

3
• mechanisms are identified (Pillemer and Tingey, 1976). Successful
identification of sources of resistance is directly related to the.diversity of
germplasm available and the probability of resistance occurring in the
host populations (Ortman and Peters, 1980).
The role of plant resistance to the pests in a breeding or pest
management program varies with each crop and each pest. The pest
which obtains its nutrition from the plant may encounter an array of
physical and chemical defences designed to protect the survival of plant
host tissues (Tallamy, 1986). Furthermore, the plant resistance to the pest
may shift with age from an obvious mechanical barrier to a chemical
characteristic (Johnson, 1975).
. In describing pest-plant interactions, one often overlooks the
influence of environmental conditions which may favour the plant or
- the pest unequally and unpredictably, or may alleviate or aggravate
damage, and therefore affect the expression of resistance (Horber, 1980).
Environmental conditions can influence plant genetic expression of
plants which may induce plant resistance. These prospects make an
appreciation of environmental influence in breeding for pest resistance
essential, because knowledge of the influence . of environment on genetic
and induced plant resistance may facilitate (1) manipulation of the
cropping environment for maximum levels and expression of resistance
within the range of environmental variation considered optimum for
other aspects of crop production, and (2) use of induced resistance as an
adjunct to genetic resistance in management of plant pests (Tingey and
Singh, 1980).
At present the two-spotted spider mite, Tetraliychus urticae Koch;
is one of the most serious pests on numerous cultivated plants, among
which are hops, Humulus lupulus L. If left uncontrolled, this key pet
can cause complete crop loss annually (Sites and Cone, 1985). Various

4
attempts have been made in the past to assess hops of different genetic
background for resistance against the mites (Regev and Cone, 1975; Peters :
and Berry, 1980a; Lesezynsky et al., 1986). Very little is known about
structural and physiological changes of hops which occur during mite
attack. Additional information on this subject is needed, particularly as it
related to a better understanding of population dynamics and factors
regulating field populations of these spider mites.
In Australia, the majority of hops grown is in Tasmania, with a
total of 810 hectares of 'Pride of Ringwood', located in the South (Bushy
Park and Huon Valley, 328 ha.), Scottsdale (320 ha.) and Gunn's Plains
(162 ha.). The production of hops accounted for 6.5% of gross value for all
crops in Tasmania (Anonymous, 1985). The pioneers of hop growing in
Tasmania brought not only their cultivars but their cultural methods
from the hop-growing county of Kent, in England. The first hop yards
were established at Glenorchy, but soon afterwards others were planted
farther up the Derwent Valley and by the 1830s there was a flourishing
hop growing industry (Davies, 1973). Pride of Ringwood, released in 1958,
was a seedling of one of open-pollinated seedlings of the variety Pride of
Kent, crossed with a Tasmanian male hop plant; subsequently, this
variety came to dominate the Australian hop industry, reaching over
90% of the acreage (Neve, 1991).
The overall objective of the research reported herein was to gain a
greater understanding of resistance mechanisms in hop cultivars in a
system including the two-spotted spider mites as their pests. This overall
objective was divided into seven subobjectives:
1. determine the seasonal abundance and the distribution of the
two-spotted spider mites infesting commercial hops in Tasmania;

5
2. evaluate some hop genotypes for their resistance to the two-
spotted spider mites;
3. adapt a standard life table to bioassay activity Of the two-spotted
spider mites on different hop genotypes;
4. characterize the effects of environmental factors on the biology
of the two-spotted spider mites;
5. examine the morphological features of different hop genotypes
and evaluate the relationship of these features to mite life histories;
6. assess the effects of hop leaf canopy on the two-spotted spider
mites and their predators;
7. determine the morphological, physiological and chemical
responses of hop cultivars to infestations of the two-spotted spider mites.

6
CHAPTER 2 LITERATURE REVIEW
2.1. BIOLOGY AND PRODUCTION OF HOPS
2.1.1. Phylogenesis of cultivated hops
The genus Humulus (Urticales: Cannabinaceae) comprises three
species, viz. H. lupulus L., H. japonicus Sieb. & Zucc. and H.
yunnanensis. All cultivated hops are varieties of H. lupulus which
normally have a diploid chromosome number of 20 in both male and
female plants. In contrast, H.' japonicus has 16 chromosomes in the
female and 17 in the male. Since there are very few herbarium
specimens and no plants in cultivation, the cytology of H. yunnanensis is
still obscure. The occurrence of these species in China suggests very
strongly that this area may be the centre of origin of the genus. Expansion
eastwards into America and westwards into Europe would have caused
distinct populations within these two areas and this is in agreement with
observations of the differences in Y chromosomes between European and
American hops and the similarity in morphological characters between
wild hops from America and Japan (Neve, 1991).
The historical development of cultivated hops began with the
gradual domestication of the wild climbing hop followed by conscious
cultivation (Rybacek, 1991). These activities subsequently led to the
greater homogeneity of the hop, and once this happened, commercial
varieties were obtained by selection based upon the suitability of different
types for brewing, i.e. aroma hops and bitter hops (Neve, 1991). In
addition, the types of commercial varieties may be distinguished on the
basis of the following criteria (Rybacek, 1991):

7
Method of selection : there are original local varieties, cultivated local
varieties, collective selections from a local variety, selected clones, and
hybrid clones.
The length of the period of vegetative growth : there are early, half-early,
half-late, and very late varieties.
Genetic origin : these groups include genetically related varieties which
may have different territorial origins such as Czech and Slovac hops,
German hops, English hops, American hops and French-Belgian hops.
These varieties have been named according to the name of the
region where they are cultivated or, in some cases, from the name of the
the person who first introduced them (Verzele and de Keukeleire, 1991).
In the past, developing hop varieties aimed specifically at improving pest
resistant cultivars and the new varieties to be discovered were very
different in aroma from their parents. The origins of most of the old
parent varieties are obscure but several of them are almost certainly
clonal selections that differ from one another in only one or two
characters. Some hop varieties, for which improvements in aroma have
been made, are grouped according to the original regions as follows:
English hops such as Keyworth's Midseason, Keyworth's Early,
Bramhing-Cross, WGV, Density, Defender, Janus, Progress, Alliance,
Fuggle N and Fuggle 37;
German hops such as Hallertau Anfang, Hallertau Start, Hallertau
Fortschritt, Hallertau Bitterer and Perle;
American hops such as Cluster, Gold, Cascade, Williamette, Columbia
and Mt. Hood;
Czech and Slovac hops such as Saaz, Zatec, Zlantan and Aromat;
Russian hops such as Serebrianka, 38/19 and Zitomia 8;
Japanese hops such as Kirin and Golden Star.

8
As is the case with aroma hops, the following varieties of bitter hop have
been improved:
English hops such as Brewer's Gold, Bullion, Northern Brewer, Wye
Northdown, Wye Target and Yeoman;
German hops such as Orion;
American hops such as Comet, Galena, Eroica, Nugget, Olympic and
Chinook;
Japanese hops such as Toyomidori;
Australian hops such as Pride of Ringwood and
New Zealand hops such as Smoothcone, Green Bullet and Roborgh
Super alpha (Neve, 1991).
2.1.2. Occurrence and main components of hop plants
The cultivated hop is a dioecious perennial climbing plant with
unisexual male and female flowers growing op separate plants (Burgess,
1964). These plants needs a fertile soil and specific climatic conditions,
especially in terms of the length of the days and the summer
temperature. Hop growing areas are restricted to the temperate zone of
the northern and the southern hemisphere. The amount of rain and
ground water is also significant for the successful cultivation of hops.
Hence, the hop is one of the most difficult plants to raise (Verzele and de
Keukeleire, 1991).
According to Rybacek (1991), hop plants can be divided into four
parts on the basis of• the organ systems, namely: two underground
systems and two _above-ground systems. These organ systems are
different in their morphology and main functions. The two
underground organ systems of hop plants are the underground stem
organs, i.e. the so-called rootstock, and the root system. The underground
stem organs are important not only because theyare situated between the

9
root system and above-ground parts but also, primarily, for the key
function of their dormant buds providing the basis for the perennial life
of the hop plant. The root system used to obtain water and nutrients
from the soil comprises all roots, regardless of the underground part of
the stem from which they develop. Two separate organ systems; namely
vegetative and generative organs emerge successively in the above-
ground part of the hop plant. The vegetative organ system, consisting of
vines and leaves, has as its main function the production of organic
substances by photosynthesis and connected procedures. The generative
organs, i.e. flowers and cones, arise from terminal buds of the vegetative
system and inhibit any further growth of the vine and its branches in the
fertile parts of the plant. From both the biological and the industrial
viewpiont, vegetative growth and reproductive development are vitally
important processes for the formation of above-ground and underground
parts of hop plants which have the annual cycle as shown in Fig. 2.1. In
addition, each individual system of a hop plant contains the main groups
of substances, i.e. crude fibre, ether-extractable substances, nitrogenous
substances, nitrogen-free substances and mineral substances or ash.
4 Shooting —410. Catkins stage-4w Inflorescence stage
Establishment
Linear growth of vines
Underground germination fi growth
The period of cryptovegetation
Fig. 2.1. Diagram of the annual cycle of hop plants.
Postdormancy 4
The period of vegetation
Cone fomation
4 Decaying vines
Predonnancy
Dormancy

10
Commercially the hop cone produced by female plants without
fertilization is the most important part of the hop plant (Burgess,1964). •
From the brewing point of view, lupulinic resins are the most valuable
substances in this organ, as they provide the bitter taste (Rybacek, 1991).
These resins belong only to the hop and have not been found in any
other plant species (Neve, 1991). They are produced in the golden-yellow
lupulin glands which occur on the undersides of the leaves and the
entire surface of the cones (Burgess, 1964). The bitter acids, essential oils
and tannins are the commercially important constituents of the lupulin
glands. Other components of the lupulin - glands are saccharides, nitrogen
compounds, lipids, waxes, sulphur dioxide and heavy metals (Rybacek,
1991).
The hop bitter acids, which are the main components of lupulinic
resins, consist of a mixture of the alpha and beta acids. At present, five
homologues of alpha acids, as well as of beta acids, have been identified,
namely: humulone, cohumulone, adhumulone, prehumulone and
posthumulone for alpha acids; lupulone, colupulone, adlupulone,
prelupulone and postlupulone for beta acids. As mixtures they show
themselves as soft resins which are soluble in hydrocarbon solvents.
Through air oxidation the hop bitter acids are transformed into hard
resins which are no longer soft and soluble in hydrocarbons (Rybacek,
1991; Verzele and de Keukeleire, 1991). The hop resins impart to beer its
bitterness which is affected largely through alpha acids. The final
bitterness is not due directly to humulones but mostly to isohumulones
derived from the alpha acids during boiling with wort (Anonymous,
1974; Verzele, 1986).
In Rybacek (1991), it was reported that the percentage of
cohumulone in the total alpha acids was used to classify the well-known
hop varieties into four groups, viz, cones with 20 % cohumulone (all

11
Czech and Slovac varieties and German varieties 'Tetnang', 'Spale and
'Hallertauer'), those with 30 % cohumulone (English varieties in the
groups of 'Fuggles', 'Goldings' and 'Northern brewer' and American
varieties 'Oregon Fuggles', 'Oregon Seedless' and 'Canadian Pride'), those
with 40 % cohumulone (varieties 'Brewers Gold', 'Early Promise', 'Oregon
Cluster' and 'Washington Seedless') and those with more than 40 %
cohumulone (varieties 'Bullion Hop', 'Yalcima Seedless' and 'California
Seedless'. Additionally, it appears that most of the hop varieties grown
on the European continent contain approximately equal amounts of two
homologous beta adds, namely lupulone and colupulone. In most cases
lupulone is present in slightly greater proportion. British, American and
Australian hops contain, in general, higher colupulone. Actually, there
is no main individual beta add as is the case for the alpha acids (Verzele
and de Keukeleire, 1991):
The essential oil of hops comprises a mixture of hydrocarbons and
oxygenated complexes of terpene series which contain such important
oils as humulene, myrcene, farnesene, caryophyllene and selinene. The
synergistic mixtures of these compounds endow beer with its aroma and
flavour (Rybacek, 1991; Neve, 1991). The ratios of humulene to
caryophyllene and humulene to selinene appear to be a specific trait of
individual varieties and are useful for their identification (Green, 1986).
Lupulinic tannin is a mixture of water soluble polyphenolic
compounds which react with proteins in the wort or beer to form
• insoluble precipitates, which are removed by filtration. The main
substances of tannin are the group of anthocyanins and
leucoanthocyanins, flavonols and catechins. 'Not all of the polyphenol
substances in beer come from hops but are derived mainly from malt
(Rybacek, 1991; Neve, 1991).

12
2.1.3. Idiotype of hop varieties
Growth habits of the above-ground parts of hop plants can be
separated into three basic types, namely; conical (steeple), cylindrical and
reverse cylindrical (umbrella) with intermediate phases (Fig. 2.2). The
conical type is the best type of growth habit with regard to balanced cone
production. However, the short length of side branches of this type
produces a very low yield of cones. Having top branches occasionally
over-growing and shadowing the lower ones, the umbrella form, by
contrast, produces not only a lower yield but also lower quality cones.
The cylindrical shape, which has approximately the same length.of fertile
branches in the central and top region of the whole plant is the best habit
with regard to overall yield and quality of cones. Therefore, the growth
type of the above-ground parts of the hop plant highly affects both the
yield of plant and the quality of cones. The yield of hop plants depends
on the number of cones produced. The quality of cones is assessed by
three different evaluations, namely: organoleptic indicators,
morphological analysis and chemical quality. The organoleptic indicators
comprise the structure and the scent of cones. The percentage of strigs (a
part of the axis of a cone) in the total mass of cones, and the regularity of
strigs are used for analysis of the morphology. The content of humulone,
lupulone and tannin are the main indicators of chemical quality
(Rybacek, 1991).
In addition, pests and diseases have also been suggested to have
^ significant effects on the yield and the quality of hops (Neve,1991). The
severity of pest problems is influenced by plant resistance which depends
on several factors including physical environmental variables such as
temperature, relative humidity, and light intensity (Tingey and Singh,
1980). These factors are affected by differences in the habit of above-
ground plant parts (Rybacek, 1991).

13
Fig. 2.2. Growth habits of the above-ground parts of hop plants : 1 - umbrella (hat-type),
2- cylindrical, 3 - conical (from Rybacek, 1991).

14
2.1.4. Utilization of hop cones
At present, hops or hop-derived products are normally boiled with
wort for precipitating wort proteins, sterilizing the wort, removing
volatile off-odours by steam distillation and transforming the alpha acids
into beer-soluble and bitter iso-alpha adds. The amount of hops added in
the wort depends on the wort density, the hop variety and its alpha acid
content. This addition is not necessarily made at the beginning of the
wort boiling process. Bitter hop is usually added at the start, while a
smaller amount of aroma hop is added before the end of wort boiling.
After fermentation, some hops or hop essential oil may be added to
accentuate the hop aroma. Additionally, bittering of beer can be achieved
by using pre-isomerized hop extracts, in which the alpha acids have been
already isomerized into iso-alpha adds. Hence, wort boiling of the alpha
adds is unnecessary and these preparations can be added at a later stage in
the brewing process (Verzele and de Keukeleire, 1991).
There are several modifications of hop cones used in the brewery.
Such modifications include ground hops, granulated hops and hop
extracts (Rybacek, 1991). Rabak (1950) reported that hop powder from
hops dispersed more readily in the boiling wort and this accelerated the
isomerization reaction. Hop pellets or granulated hops not only break up
readily in the boiling wort but also can be handled easily (Schwartz and
Grant, 1974). Another formulation of hop cones is the 'hop extract' which
contains practically all the substances important in brewing. It can,
therefore, be used to replace a large proportion of the hop cones normally
used (Rybacek, 1991).
2.1.5. Crop protection in hop yards
In addition to some hop diseases caused by abiotic factors such as
poor nutrition and unfavourable meteorological conditions (Rybacek,

15
1991), hops are vulnerable to attack by several pests and diseases which, if
uncontrolled, are capable of completely destroying the crop (Neve, 1991).
The two most important pests damaging the hops are the damson-hop
aphid (Phorodon humuli Schrank) and the two-spotted spider mite
(Tetranychus urticae Koch) (Cranham, 1985). Furthermore, the cultivated
hop is very prone to attack by certain fungal and virus diseases (Burgess,
1964). Adequate control of these pests and diseases is of primary
importance in hop yards, to prevent any decrease in marketable value
and to avoid undesirable visible residues (Neve, 1991).
According to Rybacek (1991), integrated protection involving all
methods economically, ecologically and toxicologically appropriate to
maintain pests and diseases below the threshold of damage, becomes
gradually, more significant as it includes natural limiting factors. In
general, methods of pest protection in hop yards can be divided into two
groups, namely: direct and indirect methods. The direct methods of
protection involve both the biological and chemical controls for the
suppression of pests. The indirect methods, which are mainly
preventive, involve cultural practices, resistant varieties and legislation,
and these will be dealt with first.
2.1.5.1. Cultural practices
Cultural control includes such measures as time of planting, plant
spacing, choice of location, irrigation, green manuring, crop rotation,
sanitation, and roguing. Many of these methods have been used to
prevent the occurrence of pests and diseases' in various crops (Sill, 1982).
Sanitation or hygiene is always used to protect the hops from several
kinds of diseases (Neve,1991). Keyworth (1942) showed that the potential
sources of infection of verticillium wilt,Verticillium albo-atrum, were all
diseased vines or leaves and the soil from around diseased plants. The
spread of this disease, which cannot be chemically controlled, can be

16
checked by careful hygiene (Neve, 1991). Coley-Smith (1963) suggested
that identifying and grubbing the rootstocks contaminated by downy
mildew, Pseudoperonospora humuli, helped to reduce the amount of
primary infection in gardens. The stripping of the base of the vine is also
helpful in the control of this disease (Glasscock, 1956). In the case of
powdery mildew,Sphaerotheca humuli, the same techniques as for
downy mildew can be applied to the infected area (Neve,1991).
Pitcher and McNamara (1976) reported that a two-year fallow could
eliminate Arabis Mosaic Virus from infected areas although it did not
destroy the dagger nematode population that was its vector. In addition,
correct ploughing of soil and the provision of optimum nutrition to the
crop protect hops from damage (Rybacek,1991).
2.1.5.2. Resistant varieties
Recently, the greatest use of host plant resistance has been for the
control of plant pathogens, and varying degrees of resistance to disease
have been incorporated into most major crop varieties (Pimentel, 1986).
For hops, resistance to pests and diseases was an important attribute of
hop varieties before pesticides were extensively used (Campbell, 1983).
Research on development of varieties resistant to disease was one of the
principal reasons for the founding of the Hop Research Institutes in
several countries such as Germany, the USA, and other countries (Zattler,
1951; Smith, 1937; Neve, 1991). Successful control of downy mildew of
hops was an outstanding example of using resistant varieties (Rybacek,
1991). Fuggle was found to be one of the most resistant varieties to
downy mildew (Magie, 1942). This variety, however, was affected
seriously by verticillitun wilt; and new varieties such as Huller Bitterer
• and Perle with resistance to both diseases were released (Maier and
Narziss, 1979). In England powdery mildew is proving very difficult to
—control by • chemical methods, giving rise to— much interest in the

17
development of resistant varieties. Although Australia and New
Zealand have escaped most of the diseases that are detected in the
northern hemisphere, they have suffered considerable problems with
black root rot caused by Phytophthora citricola. No effective control
measures are available against this disease except through breeding
programmes which have produced resistant cultivars (Neve, 1991).
2.1.5.3. Legal Control The plant quarantine and plant material introduction divisions of
world governments are one area of plant protection which has always
received a considerable amount of cooperation from regulatory bodies
(Sill, 1982; Dent, 1991). Salmon and Ware (1931) reported that the
introduction of hop downy mildew into Australia was prevented due to
strict quarantine measures. At present, this disease has spread through
almost all of the hop growing areas of the northern hemispere and also
into South America (Neve, 1991). The control of virus diseases is
another example. In this case, an official certificate indicates that
materials used when planting up a new hop garden have been tested and
shown to be virus-free (Keyworth, 1945; Jary, 1955).
2.1.5.4. Biological Control The manipulation of any living organism for pest control purposes
can be defined as biological control (Beirne, 1967). There have been a
number of efforts toThse biological control to protect hops from important
pests, i.e. damson-hop aphid, two-spotted spider mites and Verticillium
wilt (Neve,1991). Recently, a large number of natural enemy species of
Anthocoridae, Coccinellidae, Chrysopidae, Syrphidae and Cecidomyidae
have been recorded from hops (Zeleny et al., 1981; Cranham, 1982).
Parker (1913) reported that the appearance of ladybird larvae
•delayed the damage of hops heavily infested with aphids in North
America. Mohl (1924) observed that under conditions of high

18
temperature and strong sunlight, ladybirds, lacewings, hoverflies and
birds were more effective against the aphids in Czech and Slovac Federal
Republic's. Blattny and Osvald (1950) indicated that natural enemies had
important effects on aphid populations. Later, increasing problems of
aphids resistant to many insecticides have led to increased attention on
the potential of natural enemies to control them (Neve,1991). Most
studies involving anthocorid bugs (Anthocoridae) and ladybirds
(Coccinellidae) have succeeded in reducing the numbers of aphids
effectively (Campbell, 1978; Zeleny et at, 1981; Ruzicka et al., 1986).
The important predators of two-spotted spider mite on hops
include the coccinellids Stethorus punctillum Weise and Scymnus spp.,
the staphylinid Oligota flavicornis Boisduval, and probably the bugs
Anthocoris and Onus spp (Cranham, 1985). Blattny and Osvald (1950)
reported that S. punctillium was the most significant predator destroying
large numbers of the mite at all stages. In addition, several species of
predatory mites, e.g. Phytoseiulus persimilis and Typhlodromus pyri ,
have been introduced to control the spider mites. P. persimilis has
occurred at levels high enough to give control; however, T. pyri is less
promising, as the webbing which the two-spotted spider mites create
reduces its efficiency (Solomon and Cranham, 1980; Neve, 1991).
Studies on three possible approaches to biological control of
verticillium wilt were initiated by Wilderspin et al. in 1983 (Neve, 1991).
Firstly, the resistance of hops was elicited by treating the roots with heat-
killed conidia or with culture filtrates. Secondly, the antagonism of other
organisms was increased by organic soil amendments supplemented with
chitin, Laminaria or yeast waste. Finally, an investigation of the 'wilt-
suppressive' effect that was observed in some gardens.
2.1.5.5. Chemical control

19
Pesticides, once believed to be a panacea for the control of pests,
have resulted in the resurgence of pest populations, the development of
resistance to pesticides and residues in environment and commodities.
Therefore, the ideal- pesticide would be the chemical which is effective
against the target species but has little or no side-effects on human beings,
livestock, crop plants, or beneficial and other non-target organisms.
Selective chemicals have been of paramount importance in weed control,
where harm to crops must be avoided, but most other groups of pesticides
have had a broader spectrum of activity (Matthews, 1984).
Since the widespread use of non-selective insecticides over the past
100 years has seriously depleted natural predator populations, any effort
to produce hops today without the use of insecticides probably results in
even greater losses than those of the prespray era (Neve,1991). Generally
in commercial hops in Europe, the frequent use of broad-spectrum
pesticides to maintain aphids and mites at low levels also minimizes
biological control (Cranham, 1985). Although Cone (1975) reported the
occurrence of Typhlodromus occidentalis Nesbitt, in which
organophosphate insecticide resistant strains occur on tree fruits, it is
usually absent from commercial hop yards. The probability for
permanent establishment of predatory mites in hop yards seems low
considering the annual nature of regrowth, the total weed control
commonly practised, and the lethal effects of aphicides and certain
fungicides (Cranham, 1985). Various alternative products have been
introduced as miticides but all appear to be subject to the risk of resistance
developing, while some have been found to be phytoto)dc (Neve,1991).
2.2. LIFE HISTORY AND ECOLOGY OF THE TWO-SPOTTED
SPIDER MITE

20
2.2.1. Economic status
The two-spotted spider mite (TSSM),Tetranychus urticae Koch
(Acari: Tetranychidae) often reported inaccurately as T. bimaculatus ,T.
telarius (Unwin, 1971; Bellotti, 1985) and Epitetranychus althaeae (var.
Hanst) (Neve, 1991) is a serious pest of more than 150 economically
important plants throughout the world ( Jeppson et al., 1975). This spider
mite damages plants by feeding mainly on tissues on the undersides of
the leaves (Russell, 1978; Tomczyk and Kropzyncka, 1985). Chlorophyll
from plant tissue is removed, resulting in a decrease in photosynthesis
and transpiration. Under slight attack, foliage becomes covered with pale
silver specks, which eventually turn necrotic. Under severe attack,
foliage becomes covered with silk webbing produced by the mites.
Furthermore, the leaves turn bronze Sand then drop from the plant.
Fruit, produced from the plants or trees damaged by these spider mites,
may be reduced in both size and quality (Pedigo, 1989).
The general upsurge of mite problems have been explained by two
main hypotheses, namely: predator inhibition and reproductive
stimulation (Huffaker et al., 1969). The spider mite was not recognized as
a serious pest until the general use of synthetic organic pesticides, such as
DDT. These pesticides upgraded the pest status of this species by
suppressing naturally occurring predators, and eliminating the need for
oil additives mixed with lead arsenate insecticides, which formerly acted
to keep mite populations under control (Unwin, 1971; Pedigo, 1989).
Secondly, by inducing improved nutrition or growth factors in the foliage
(Huffaker and Spitzer, 1950; Fleschner, 1952; Klostermeyer and
Rasmussen, 1953; Rodriguez et al., 1957; Rodriguez et al., 1960; Saini and
Cutkomp, 1966) such pesticides can indirectly increase the mite fecundity .
(Huffaker et al., 1969; Unwin, 1971).

21
2.2.2. Food plants Undoubtedly TSSM is the most polyphagous species of the
Tetranychids (van de Vrie , 1985a) feeding on a wide variety of crops,
including fruits, vegetable crops, forage crops and ornamentals
(Kantaratanakul and Rodriguez, 1979). It is also commonly found on
many weeds (van de Vrie et al., 1972) and hedgerow plants (Cranham,
1985). According to Belloti and Kawano (1980), there are more than 400
host plants for this pest. Unwin (1971) described TSSM as the most
wide-spread, common, and destructive mite of world agriculture.
In the United States, the most common spider mite infesting
strawberries is TSSM (Wysoki, 1985). Outbreaks have been reported in
California (Oatman et al., 1977a;b;1981;1982), in Florida (Poe, 1976), in the
midwestem states (DabroWsld and Rodriguez, 1971; Rodriguez et a., 1971)
and in the Pacific northwest (Shanks and Barritt, 1975). Oat-man and
McMurtry (1966) found that yield reductions in strawberry plantings
commonly occur when mite populations were allowed to increase.
Smith and Mozingo (1983) reported that TSSM has regularly caused
severe damage to the peanut, Arachis hypogea L. in the Virginia-Carolina
area. Growers often apply acaricides to this pest otherwise they encounter
possible yield and economic loss. In the Central Valley 'of California,
TSSM is considered to be a major pest of almond trees, Prunus amygdalus
Batsch (Andrews and Barnes, 1981). Leaves, branches, and entire trees can
become webbed over from high densities of the mites; hence, it is difficult
to achieve thorough spraying with an acaricide (Hoy, 1985).
In Southern England, overwintering female spider mites begin to
invade the strawberries protected by glass cloches or low polythene
tunnels from late February onwards. The crop may become heavily
infested before .fruiting unless control measures are applied during April
(Gould and Vernon, 1978).

22
In South Africa, Smith Meyer (1981) studied the tetranychids found
on strawberries. The results showed that TSSM was one of the most
important pests of this crop.
In Asia, the most important species of mites identified as feeding
on cassava is TSSM. Information about other Tetranycluts species on
cassava reported from Asia is scarce ( Bellotti and Byrne, 1979).
In Australia, hops do not suffer from serious fungal diseases or
insect pests which break out in the major hop growing regions of the
Northern Hemisphere. Therefore TSSNI is the only pest for which
regular control measures are essential (Legget, 1987). Other crops
commonly damaged by TSSM include pome fruit, stonefruit, cotton and
bananas (Unwin, 1971).
2.2.3. Stages of development
TSSM develops through an egg stage, three immature stages and
the adult stage (Plate 1). Each of the immature stages has an active and a
resting phase of equal duration (Anon, 1976). The active immature stages
of typical tetranychids are called larva, protonymph and deutonymph and
each stage is followed by intervening periods of quiescence called the
protochrysalis or nymphochrysalis, deutochrysalis and teleiochrysalis,
respectively (Crooker, 1985). During these inactive periods, the mite
anchors itself and moults to the succeeding stage (Boudreaux, 1963).
The egg of TSSM is spherical and approximately 0.13 mm. in
diameter. The newly deposited egg is clear but turns yellow and
subsequently, becomes yellow-orange as embryonic development
progresses (Rybacek,1991). There are two types of eggs, namely three and
six chromosome eggs. Males develop from unfertilized eggs and are
haploid, whereas females develop from fertilized eggs and are diploid
(van de Vrie et al., 1972). The newly hatched larva with 6 legs and bright

Deutochrysalis
Deutonymph
Teleiochrysalis
Imago
Egg
Protonymph
Larva
Nymphochrysalis
23
Plate 1. The developmental stages of TSSM (from Zoebelein and Kniehase, 1985).

24
carmine red 'eye' spots is nearly spherical in shape, colourless and
measures 0.15 x 0.11 mm. Feeding begins immediately and the colour
charges to grey-green. After a short feeding period, the larva enters the
protochrysalis stage, after which it moults to the protonymph stage which
has four pairs of legs. This, in turn, moults to the deutochrysalis and,
after casting the old exuvium, the deutonymph and the teleiochrysalis
stage occur to complete juvenile development and the mite enters the
adult stage. The female adult is approximately 0.48 mm. long and 0.28
mm. wide. The male is smaller and slimmer, 0.35 mm. long and 0.18
mm. wide: Both males and females have the same general morphology.
Their oval bodies are inconspicuously articulated. They have long setae
on a convex dorsum set in six transverse rows: The mouthparts act as a
piercing and sucking apparatus. The final section of the chelicerae is
modified into .a long piercing seta. The red 'eyes' are placed on the sides •
of the cephalo thorax which is separated from the rest of body only by an
indistinct seam. The adult TSSM has four pairs of single articulated legs.
The distal segment possesses in comblilce structure called the empodium,
the shape of which is useful for the identification of the species (Rybacek,
1991):
Herbert (1981) studied the developmental time for each life stage of
female and male TSSM: The results showed that the developmental•
period of the egg stage was greater, by a factor of approximately 2, than the
individual immature stages. For the male, the developmental period for
each immature stage was roughly equal and almost one-half of the time
of the stages were inactive period. For the female, developmental periods
for larvae and protonymphs were similar but duration of the active and
resting phases of these stages showed a slight difference. The duration of
the female deutonymph stage was similar or slightly longer than larval
or protonymphal stages. A comparison between sexes showed that the

25
developmental periods for the active and resting phases were similar for
larvae and protonymphs. The active deutonymphal period was
significantly longer in the female than in the male but the resting phases
were similar. Hence, female immatures take longer than males to
become adults. In addition, female adults live longer than males.
The duration of the embryonic and juvenile development of the
tetranychids depends on many factors such as temperature and humidity
(Crooker, 1985)- Herbert (1981) reported that the development time, in
hours, for each life stage of female and male TSSM differed significantly
for the three rearing temperatures (Table 2.1). Nickel (1960) observed that
TSSM developed faster, with higher egg production, at low humidities
(25-30%) than at high humidities (85-90%).
Table 2.1. Development time in hours of TSSM reared at 15°, 18°, and 21°C (from Herbert, 1981).
•Female Male • .tage
15° 18° 21° 15° 18° , 21°
Egg 255 172 113 •262 175 116 Larva 140 86 64 134 90 66 Protonymph 124 88 58 116 80 55 Deutonymph 159 111 70 131 89 59
2.2.4. Behaviour and reproduction
2.2.4.1. Social behaviour
The behaviour involved with courtship and mating is the only
form of social behaviour reported for the tetranychids. Nevertheless, the
web-spinning behaviour characteristic of the tetranychids might also be
considered under• either co-operative or altruistic behaviour (Crozier,
1985).

26
Courtship behaviour of TSSM begins with spinning of silk strands
by the female deutonymph into a pad on a leaf surface for settlement
prior to the final molt. This silk webbing, as well as a sex attractant of the
female, influences wandering males to discover the quiescent female
(Cone, 1985). Later, three consecutive reactions of the males to the
females occur. These are hovering, guarding and mating behaviour
respectively (Cone et al., 1971).
In terms of spinning behaviour, the web around the colonies of
TSSM is produced from spinnerets of both males and females and is
intended to protect them against harmful external factors (Rybacek, 1991).
The pattern of webbing is considered to be of . a highly complicated and
irregular type (Saito, 1985).
2.2.4.2. Dispersal
Another significant behaviour of the tetranychids is dispersal
which can be considered as the intra-plant and inter-plant movement of
individual mites away from the colony in which they developed. There
are three means of dispersal, namely: crawling, aerial dispersal and
phoretic dispersal (Kennedy and Smitley, 1985).
The tetranychids which have a wide host range, like TSSM (van de
Vrie et al. 1972), have well-developed dispersal mechanisms which
enable their populations to distribute over large areas and colonize
widely separated plants (Kennedy and Smitley, 1985). Margolies and •
Kennedy (1985) reported that the population movements of TSSM in
maize fields resulted from crawling between plants. It is apparent that
the direction of crawling involved the movement of dispersing mites
towards illumination, as opposed to diapausing mites which move away
from light (Hussey and Parr, 1963). Dispersal by crawling to other plants
or plant parts has also been indicated to happen in response to not only
population density but also the presence of predators (Bernstein, 1984).

27
Under light infestations, populations of the summer form disperse
throughout the unoccupied plant chiefly by crawling (McEnroe and
Dronka, 1971). Under heavy infestations, a change in the behaviour of
individual mites results in dispersal from the plant. The migrating mites
show a positive phototactic response which is absent from sedentary and
non-dispersing mites. The response results in mites moving up the plant
and aggregating around the periphery of the host where, seemingly, they
are more exposed to winds and visiting animals which might cause their
aerial or phoretic dispersal (Kennedy and Smitley, 1985).
2.2.4.3. Diapause
The diapause in TSSM occurs in response to 3 factors, namely:
photoperiod, temperature and nutrition (van de Vrie et al., 1972); for this
reason, the female mite leaves the host plant in search of hibernation
sites. Before migrating from the plant, they feed only very little and,
though mating takes place after the final molt, no eggs are laid. Once the
body colour has changed and the hindgut has been emptied the mite
becomes positively geotactic and negatively phototactic. The negative
photoresponse of the diapausing females is a response not only to red and
green light but also to the ultraviolet region of the spectrum (Veerman,
1985).
Termination of diapause depends. mainly on temperature and the
presence of suitable nutrition. Photoperiod appears to exert little
influence (van de Vrie et al., 1972). Veerman (1977) reported that
diapause development has already ceased at the beginning of the winter,
the mites continuing in diapause until spring under the influence of
prevailing low temperature.
2.2A.4. Reproduction
In addition to their ability to disperse widely, TSSM possess a high
intrinsic rate of increase and reproduce by arrhenotoky, i.e._ a type of

28
haplo-diploidy in which the haploid males result from unfertilized eggs.
The colonizing success of TSSM is appropriately that of an r-strategist
(Rodriquez and Rodriquez, 1987; Sabelis, 1985a). TSSM is a fast
developing organism because the life cycle can be completed in a 10-day
period (Helle and Overmeer, 1973). Wrensch and Young (1975) found
that the rate of physiological development was the most important factor
determining the intrinsic rate of increase. Their results also showed that
fecundity was the most influential character affecting fitness in this
haplo-diploid phytophagous mite, on which the fertilization status of the
female had no effect.
2.2.5. Natural enemies
Several orders of arthropods have been reported to feed on the
tetranychids. These belong to Thysanoptera, Coleoptera, Hemiptera,
Diptera, Neuroptera, Acarina, Araneida (Huffaker et al., 1969) and
Dermaptera (Chazeau,1985). Some pathogens, including the viruses and
fungi, also have potential as control agents of spider mite populations
(van der Geest, 1985b).
Control of TSSM was found to be successful in strawberries when
several species of phytoseiid mites were used, e.g. Phytoseiulus persimilis
Athias-Henriot Typhlodromus occidentalis Nesbitt and Amblyseius
californicus (McGregor) (Oatman and McMurtry, 1966; Oatman et al.,
1967,1968, 1977a, b). Other predators of tetranychid mites which were
found in strawberry fields in California were predaceous thrips,
Scoloth rips sexmaculatus (Pergande), the cecidomyiid Arthrocnodax
occidentalis Felt (Oatman and Voth, 1972), Stethorus picipes Casey, Onus
tristicolor (White), Oligota oviformis (Casey), Geocoris punctipes Stal and
a species of hemerobiid (Wyman et al., 1979; Oatman et al., 1981).

29
Horsburgh and Asquith (1968) found more than 30 predators of
TSSM in apple orchards in Pennsylvania, with the ladybird beetle, : -
Stethorus punctum, the most efficient. Both the adult and larvae of this
beetle prey on mites (van de Vrie, 1985). In cassava, the predator
Stethorus sp. is closely related to populations of TSSM. Surveys of
predator populations in the field under heavy infestions of TSSM have
shown that 98% of the predators were Stethorus spp. and 2% Oligota
minuta (Bellotti, 1985). Both Readshaw (1975) and Schicha (1975) also
reported that Stethorus spp. were the main predators of high mite
populations in Australian orchards.
Chant (1%1) noted that P. persimilis was a specialized predator of
tetranychids. Some success has been achieved with P. persimilis for the
control of TSSM on foliage of tropical plants, particularly on Codiaeum,
Dieffenbachia, Dracaena, Ficus and Hedera spp. used for interior
landscaping (Scopes, 1981). In Japan, TSSM was suppressed by P.
persimilis on soybeans but not on blackberries (Mori and Imbayashi,
1975).
Some disadvantages of P. persimilis, namely its limited capacity to
disperse, lack of alternative prey, natural enemies and susceptibility to
high temperatures, have restricted the use of this predator to control the
tetranychids on outdoor crops (Wysoki, 1985). In terms of their ability for
numerical increase and predation in greenhouses, Sabelis (1981) ranked
predators in the following decreasing order: P. persimilis, Amblyseius
bibens 13lommers, T. occidentalis and Amblyseius pontentillae (German).
With regard to their ability to survive on alternative food, A. potentillae
ranked highest, followed by A. bibens, T. occidentalis and P. persimilis.
Generally, P. persimilis feeds only on living mites and does not take any
alternative food (Wysoki, 1985).

30
2.2.6. Relationships with environmental factors
Spider mite outbreaks associated with prolonged hot weather and
drought have been explained by several hypotheses, namely that: (1)
lifespan, development, reproduction and survival of the mite are
increased under hot and dry environmental conditions; (2) nutritional
intake of mites is more efficient during drought; (3) natural enemies and
their effectiveness are decreased by hot, dry weather; and (4) mites become
more numerous due to the higher nutritional quality of stressed host
plants (Oloumi-Sadeghi et al., 1 -988).
Temperature influences the behaviour and activity of the
tetranychid to a great extent (van der Geest, 1985a). Mori (1961) reported
that the temperature preferences of TSSM varied from 13°C to 35°C.
TSSM exhibits . a negative hygrotaxis; and, when given the choice
between moist and dry areas it avoids areas of high moisture (van der
Geest, 1985a). Mori and Chant (1966) found that TSSM became sluggish
and nearly immobilized under humid conditions.
The photoperiodic response to white light by TSSM is influenced
by its physiological condition (van der Geest, 1985a). However, the degree
of photoresponse to light also depends on the angle of incidence and the
intensity of the light (Suski and Naegele, 1963).
Daily periodicity influences the physiological processes of
organisms. Consequently, TSSM displays periods of activity and inactivity
which are often related to daily environmental fluctuations (van der
Geest, 1985a).
The effects of weather and nutrition on TSSM are interrelated.
Weather may directly affect increases or decreases in the food supply and
• may have indirect effects through its influence on the natural enemies of
TSSM (van de Vrie et al., 1972).

31
2.3. PLANT RESPONSES TO HERBIVORY
2.3.1. Mechanisms of plant defences against herbivores
Various kinds of morphological and chemical characteristics are
involved in the defence mechanisms evolved by plants in response to
herbivory. These characteristics alter herbivore utilization of host plants
(Beck and Schoonhoven, 1980). Morphological defensive traits, such as
tissue toughness, trichomes, surface waxes, colour and shape interfere
physically with herbivore locomotory mechanisms and more specifically
with host selection, feeding, ingestion, digestion, mating and oviposition.
In contrast, chemical defensive traits, including inorganics (e.g.
selenium), primary and intermediary metabolites (e.g. citric acid, cysteine
and certain aromatic amino adds) and secondary substances (e.g.,
alkaloids), affect chemically mediated behavioral and metabolic processes.
Morphological and chemical defences are interrelated with a continuum
of defence (Norris and Kogan, 1980). For instance, glandular trichomes
not only impede the movement of small herbivores but also contain
toxic constituents which spill into the surrounding tissue when the gland
is ruptured, making it unpalatable or toxic (Stipanovic, 1983).
2.3.1.1. Morphological defences
Morphological defences can be classified as remote or contact. The
majority of these plant factors operate on contact with the herbivore
(Norris and Kogan, 1980). In a number of examples, tougher plant tissues
confer greater resistance against herbivores, particularly to the feeding of
neonate forms and tissue penetration by stem borers (Beck and
Schoonhoven, 1980). Tanton (1962) reported that the feeding rates and
larval growth of the Mustard beetles were retarded when they fed on
relatively tough turnip, kale, and Brussels sprout leaves. Bjorkman and
Anderson (1990) showed that Ithorniid larvae fed to a lesser extent on

32
tough leaves of a South American blackberry (Rubus bogotensis) than on
more tender ones. In rice, thicker hypodermal layers have been regarded
as a resistant factor to the rice stem borer, Chilo suppressalis
(Patanakamjorn and Pathak, 1967). Tissue toughness may result from
high fibre or silica (Beck and Schoonhoven, 1980). While hardness of the
rind and fiber content of stalks are responsible for the resistance of sugar
cane to Diatrea saccharalis larvae (Agarwal, 1969; Martin et al., 1975),
Mensah and Madden (1991) pointed out that hardness of the terminal
shoot played a important role in the resistance of Boronia megastigma to
oviposition of the psyllid, Ctenarytaina thysanura Ferris and Klyver.
Silication of rice plants reduces attack by the rice stem borer larvae
(Sasamoto, 1958). Leaf trichomes or hairs can act as physical barriers that
• deter small herbivores such as phytophagous insects (Levin, 1973) and
mites (Stipanovic, 1983). There are several examples of resistance
mechanisms related to the presence of trichomes. Karnel and Elkassaby
(1965) found that a cotton variety that had long, highly branched and
abundant trichomes was more resistant to spider mites and leafhoppers
than other cotton varieties. Length and/or density of trichomes in other
major crops were also reported to be correlated with resistance to various
insect pests (Singh et al,. 1971; Broersma et al, 1972; Turnipseed, 1977;
Khan et al., 1986: Sosa, 1988). Another example of contact defences was
reported by -Woodhead and Padgham (1988) who found that the surface
wax influenced settling and probing of the brown planthopper,
Nilaparvata lugens, on rice.
With respect to flying insects, Kennedy et al. (1961) reported that
alate aphids appeared to be attracted to plants at a physiologically
appropriate stage of growth; being attracted to leaves reflecting light of
approximately 500 nm, regardless of the species of plant. Boller and

33
Prokopy (1976) also found that leaf reflectance as well as tree shape and
size remotely affected host selection behaviour of Rhagoletis sp.
2.3.1.2. Chemical defences
Phytochemicals produced as metabolic by-products with defensive
functions are generally known as "secondary plant chemicals" (Fraenkel,
1959; 1969). Even though primary roles for these secondary metabolites
have been involved in some physiological processes (Seigler and Price,
1976; Seigler, 1977), defence is generally assumed to be their "raison
d'etre" (Fraenkel, 1959; Rhoades, 1985). Later, the term "allelochemics"
was proposed to describe "a non-nutritional chemical that is produced by
an individual of one species and that affects the growth, health,
behaviour, or population biology of another species" (Whittaker, 1970).
According to Whittaker and Feeny (1971), allelochemics can be divided
into 2 effective classes: "allomones", which are allelochemics tending to
give an adaptive advantage to the producing 'organism and
"kairomones", which impart an adaptive advantage to the receiving
organism. The effects of allelochemics on herbivores may be behavioral
or metabolic (Beck and Schoonhoven, 1980). Visser and Nielsen (1977)
showed that volatiles of several solanaceous plants attracted the Colorado
potato beetle by influencing their olfactory orientation. Sinigrin, a
glycoside found in - most crudferous plants, is toxic to the larvae of black
swallowtail butterflies, Papilio polyxenes, which do not normally attack
crucifers. The southern armyworm, a generalist feeder, is also inhibited
by high concentrations of sinigrin. By contrast, this compound stimulates
feeding by the cabbageworm, a crucifer specialist (Blau et al., 1978).
In addition, chemical defence mechanisms can be classified not
only on the chemical properties of the compounds involved, but also on
the way these compounds function in relation to herbivore attacks
(Haukioja, 1980). Levin (1976) distinguished between constitutive

34
compounds, ie. those chemicals present before herbivore attack, and
induced compounds which are chemicals synthesised as a result of attack.
An example of constitutive defences is the cucurbitacins, which are
responsible for bitterness in the cucurbits, thus offering protection from
mites and cucumber beetles (DaCosta and Jones, 1971). Dicke and
Dijkman (1992) indicated that 'volatile "infochemicals", whose
production is induced in detached Lima bean leaves, affected the
behaviour of TSSM and its predator, P. persimilis.
According to Dicke and Sabelis (1988), an infochemical was defined
as "a chemical that, in the natural context, conveys information in an
interaction between two individuals, evoking in the receiver a
behavioural or physiological response that is adaptive to either one of the
interactants or to both". A summary of current infochemical
terminology is shown in Fig. 2.3.
Fig. 23. Structure of current infochemical terminology (Dicke and Sabelis, 1988).
Infochemicals
AllelochernicaLs (between different species)
Allomone
I Pheromones
(within the same species)
L,... ..., pheromone [-,+] pheromone
[+,-1-] pheromone
IThe benefit is to the emitter
IThe benefit is to the receiver Kairomone
Synomone
In recent years, various hypotheses have been proposed to explain
quantitative and qualitative patterns of chemical defence mechanisms

• (Herms and Mattson, 1992). Firstly, Rhoades (1979) summarized the basic
tenets of the optimal defence theory by stating that there is a limited
amount of resources that a plant can devote to defence, and that there are
alternative demands for these limited resources, e.g. growth. Selection is
predicted to favour an optimal defence allocation which maximizes plant
fitness. Defences are costly, and thus will only evolve when and where
their benefits overcome their costs (Rhoades, 1979; Tuomi, 1992). These
costs of defences can be considered to show inverse relationships between
defence and growth because the allocation of resources by plants to
antiherbivore mechanisms decreases growth by diverting resources from
the foliage production area and other vegetative structures (Herms and
Mattson, 1992). For example, Bjorkman and Anderson (1990) presented
evidence for a resource allocation between antiherbivore mechanisms
(i.e. glandular trichomes) and other plant traits (i.e. prickle numbers and
size) by using data from the South American blackberry.
Secondly, Feeny (1976) hypothesized that the type of chemical
defence was influenced by plant apparency. The quantitative defences
(e.g. tannins and resins) are characteristic of the ecologically conspicuous
"apparent" plants, whereas qualitative defences (e.g. alkaloids, cyanogenic
compounds etc), are characteristic of "unapparene' plants (Feeny, 1976;
Rhoades and Cates, 1976). Apparent plants are easily discovered by
herbivores and therefore show a large investment in quantitative
defences • effective broadly. Unapparent plants were predicted to rely on
escaping attack by specialist herbivores and hence needed only to invest
in qualitative defences effective against nonadapted generalist herbivores.
Thus, the defence differences between apparent and unapparent plants
were proposed to reflect differential effectiveness of quantitative and
qualitative defences against specialist and generalist herbivores and

differential selection pressure by generalists and specialists due to plant
apparency (Feeny, 1976; Rhoades and Cates, 1976; Coley et al., 1985).
Thirdly, the resource availability hypothesis, which extends the
optimal defence hypothesis, assumes that both the amounts and types of
plant defences are determined by the resource availablity in the
environment. Natural selection favours plants with faster growth rates
and lower defence levels in environments with high resource
availability, whereas the plants with slow growth rates and high levels of
defence are favored under conditions of low resource availability (Coley
et al., 1985). However, Bryant et al. (1983) suggested that phenotypic
variation in secondary metabolism, which has important implications for
palatability and resistance to herbivores, is regulated by carbon-nutrient
balance. According to this hypothesis chemical defences are largely
carbon-based under nutrient-limited environments because plants store
proportionately more carbon in their leaves. On the other hand, plants
growing under high-nutrient or low-carbon environments store
proportionately more nitrogen and other nutrients and less carbon; hence
• carbon-based defences decline, and nitrogen-based defences become more
• important (Bryant et al, 1983; Karban and Myers, 1989). Not all data are in
agreement with the carbon-nutrient balance hypothesis. For• instance,
Clark and Menary (1980) found that fertilization increased concentrations
of carbon-based secondary metabolites in peppermints.
• In a recent review, Herms and Mattson (1992) proposed that the
plant growth-differentiation balance concept formed a framework that
unified both the evolutionary responses regulated by the optimal defence
theory and the specific phenotypic responses outlined by the carbon-
•nutrient balance model. As a unifying concept, this hypothesis does not
so much create new predictions (Tuomi, 1992); its explanatory power
depends chiefly on specific assumptions in relation to_the physiological

37
and biochemical mechanisms that regulate differentiation processes in
each specific case.
2.3.2. Role of plant defences in the population dynamics of herbivores
There are various case studies indicating that generally it is
important to include plant defences when considering fluctuation in
herbivore numbers (Haukioja, 1980). The term "genetic feedback" was
proposed as the foundation of the mechanism for herbivore population
regulation, stemming from the genetic change of host plants to herbivore
feeding pressure and vice versa (Pimentel, 1968). According to van
Emden and Way (1973), the impact of host plants on colonizing insect
populations leads to changes in the herbivore population. White (1974)
suggested that most herbivores usually remain at low levels of
abundance relative to the apparent abundance of their host plants.
Werner (1979) found that food quality of host plants influenced the
biology of the herbivore, such as survival and development of spear-
• black moth larvae on deciduous plants. Kidd (1985) also showed that the
food quality of host plants determined the population dynamics of the
herbivore. In addition, Karban and English-Loeb (1988) pointed out that
plants varied in their resistance to tetranychid spider mites, and this
could have profound effects on spider-mite population dynamics.
Plants employ several types of defensive strategies for reducing the
chance of their being driven to extinction by herbivores (Hauldoja, 1980).
Among these defensive strategies are ecological mechanisms, such as
escape in time and space (Feeny, 1975), physical and chemical
mechanisms, and even variance of defensive properties within and
between individuals (Haukioja, 1980). These defensive strategies of
plants have a coevolutionary relationship with the offensive strategies of
herbivores. The coevolutionary relationship consists of adaptations of

plants and counteradaptation of herbivores (Rhoades, 1985). Several
studies have shown that herbivores evolve a number of strategies for
circumventing the resistance mechanisms of their hosts, including
physical sabotage of antiherbivore defence systems, and the enzymatic
detoxification of secondary metabolites (Herms and Mattson, 1992). These
strategies can explain why population levels of some species of
herbivores are variable while those of others are relatively invariant.
Thus, herbivore population dynamics are probably better known in terms
of varying quality and quantity of both plants and herbivores than in
terms of only quantitative changes in amount of vegetation and numbers
of herbivores (Rhoades, 1985).
2.3.3. Plant compensation to herbivory
• Due to the compensatory growth responses of plants, many effects
of herbivores upon their host plants that are presently perceived as
deleterious may be less deleterious than presumed (McNaughton, 1983).
This phenomenon is implicit or explicit in several studies of the effects of
herbivores oriplant growth and yield (Kumar and Joshi, 1972; Vickery,
1972; Chew, 1974; Dyer, 1975; McNaughton, 1976; 1979). In nature, plant
species fitness that can compensate for herbivore feeding has obvious
selective advantages that result in the- maintenance of the genotype.
Reports of plant compensation in agricultural crops, however, are mostly
concerned with yields rather than plant fitness (Trumble et al., 1993).
In general, the ability of plants to photosynthesize and transfer
products to the fruits, tubers or other harvested parts is reduced by
damage which is caused to leaves and other parts of plants. Some losses
can be compensated without affecting yield since plants may naturally
produce an excess of photosynthetic products (Matthews, 1984). For
example, when turnips and sugar beet'plant i' suffer defoliation, the

Upper level Compensation
Linear response
Competition
Lower level
Threshold level Severity of -infestation
39
remaining leaves grow larger than comparable leaves on undamaged
plants, and photosynthetic efficiency is enhanced (Taylor and Bardner,
1968; French and Humphries, 1977).
The ability to compensate for damage relies on the growth
characteristics of the plants which are infested. Additionally, the effects of
pests on an agricultural crop need to be assessed carefully for a particular
farming area, because differences in agronomic practices and
environmental factors will influence the severity, of pest damage
(Matthews, 1984).
A generalized response curve (Fig. 2.4) to show the relationship
between severity of infestation and yield was described by Tanunes (1961),
Bardner and Fletcher (1974), Pedigo et al. (1986) and Funderburk et al.
(1993). Tammes (1961) divided the curve into three stages: the first stage
in which the injurious factors have slight influence on yield because of
compensation, the second stage which reveals a yield loss correlated with
an increase in the injurious factor, and the final stage in which a level of
maximum possible injury and the self-limiting effect of the injurious
factor occur. Subsequently, this curve was divided into six types of
relationship, as shown in Fig. 2.5 (Matthews, 1984).
Fig. 2.4. Generalized response curve of plants (from Bardner and Fletcher, 1974).

Yield increase with a light infestation
Logarithrnical response No change in yield
40
Fig. 2.5. Variations in yield response to infestation (from Matthews, 1984).
evere age e to a light infestation
Compensatory mechanisms contribute, to the alleviation of the
potential deleterious effects of tissue damage, both to vegetative and
reproductive organs. The mechanisms that cause compensatory
responses in plants following herbivore damage are complex and
interrelated, but can be divided into intrinsic and extrinsic mechanisms
(McNaughton, 1983).
The intrinsic mechanisms, considered as endogenous factors,
which influence compensatory responses in plants are mainly affected by
allocation or reallocation of resources within the plant (Trumble et al.,
1993). These may involve changes in physiology and development
(MCNaughton, 1983) and include regrowth patterns, photosynthetic
activity, senescence, leaf morphology, and canopy architecture. A
variable distribution of resources can cause major changes in the form of
plant compensatory responses which are strongly affected by source-sink
relationships (Trtimble et al., 1993). A well-known— response of grasses to

41
defoliation is tillering, resulting from the activation of meristerns. These
cells are promoted to divide by cytokinins (McNaughton, 1983).
In contrast the extrinsic mechanisms, known as exogenous factors,
are not directly under the physiological control of the plant (Trumble et
al., 1993). Extrinsic mechanisms that influence compensatory responses
in plants include changes in general environment (McNaughton, 1983),
nutrient and water availability, temperature, intensity and timing of
defoliation and herbivore distribution (Trumble et al., 1993).
2.3.4. Induced responses in plants
Physiological and chemical traits of many plant species have been
found to change in response to real or simulated herbivory (Schultz,
1988). Changes in both current growth and regrowth of plants following
this injury have been called "induced responses" (Rhoades, 1983; Edwards
and Wratten, 1985; Fowler and Lawton, 1985). These changes often have
significant effects on the behaviour, growth, survivorship, feeding and
oviposition of the herbivore (Schultz, 1988), and the mechanism
underlying this phenomenon is frequently referred to as -"induced
resistance" (Karban et al., 1987). Herbivore-induced responses which not
only reduce herbivore preference or performance but also increase plant
fitness are known as "induced defences": Field studies on the impacts of
induced responses on herbivores have given extremely variable results
among plants within, a population, and among populations. Much of
this variation may result from differences in species, age, genotype,
history, and environmental factors (Karban and Myers, 1989).
Numerous studies on the influence of plant responses on
herbivory support the phenomenon of herbivore-induced resistance
(Kogan and Paxton, 1983). Loper (1968) reported that feeding by the pea
aphid on alfalfa induces an increase in coumestrol that may influence._

42
additional feeding by other pea aphids. Under glasshouse conditions,
Karban and Carey (1984) indicated that TSSM and strawberry spider mite, •
T. tttrkestani Ugaroy' and Nikolski, feeding on cotyledons of cotton
seedlings induced resistance to the mites in the true leaves which
appeared later. The practical potential of induced resistance in cotton was
demonstrated by Karban (1986). Karbart and English-Loeb (1988) described
that previous or concurrent feeding by phytophagous herbivores
influenced expression of plant resistance to spider mites. Brown et al.
(1991) showed that an initial infestation of soybean cotyledons yielded a
reduction in subsequent mite populations. However, no evidence for
induced resistance of Phaseoltts vttlagaris to TSSM was detected (English-
Loeb and Karban, 1991). Other related works in this field for commercial
purposes were explained by Day (1993).
Even though the studies mentioned above have tended not to
focus on classification of induced responses,•they can nevertheless be
classified as rapid or long-term responses (Haukioja and Hanhimaki,
1985). Rapid responses occur during the attack such that the attacking
individuals experience the consequences of the changes they induce.
Long-term responses can occur following the attack. Although they have
little impact on the attacking herbivores, long-term responses can affect
herbivores that attack the plant at later times (Karban and Myers, 1989).
2.3.4.1. Induction of plant resistance by non-herbivores
A variety of mechanisms appear to be involved in plant resistance.
These include changes in (1) phenological synchronization between the
plant and its complement of herbivores; (2) the physiological state of the
plant; (3) nutrient concentration; . (4) stimulation' of compensatory
mechanisms; (5) concentrations of allelochemics; and (6) de novo
synthesis of phytoalexins. Other factors, apart from previous or

concurrent herbivore attack, that influence induction of plant resistance
include temperature, light, relative humidity, soil fertility, pesticides, and
plant growth regulators (Kogan and Paxton, 1983).
Temperature, which is a major factor affecting fundamental plant
and pest physiological processes, can modify the level and expression of
genetic resistance in at least three ways (Tingey and Singh, 1980): (1) by
indirectly affecting plant suitability to herbivore performance; (2) by
directly affecting plant physiological and growth responses to herbivore
attack; and (3) by directly affecting the biology of the herbivore. Among
the first to propose that temperature alters plant resistance were Dahms
and Painter (1940) who reported that alfalfa resistance to pea aphids was
modified by temperature.
• Light and relative humidity can also modify fundamental
physiological processes of herbivores and their host• plants (Tingey and
Singh, 1980). Loomis et al. (1957) found that light intensity influenced
levels of chemical resistance factors in maize to the European corn borer,
Ostrinis nubilalis. In the case of relative humidity, Rogers and Mills
(1974) showed responses of sorghum varieties to maize weevil infestation
under different relative humidities.
Quantitative a:nd qualitative variation in soil fertility exerts
striking effects on plant growth and development, which may result in
changes in nutritional suitability of plant tissue for herbivores (Tingey
and Singh, 1980). For example, McMurtry (1962) found that potassium
deficiency led to reduced resistance of alfalfa clones to the spotted alfalfa
aphid, Therioaphis maculata, whereas phosphorus deficiency resulted in
increased resistance.
Pesticides and plant growth regulators influence the expression of
plant resistance due to their stimulatory or inhibitory effects on herbivore
.populations. These can indude (1) effects on 'populations of natural

44
enemies and competing species, (2) direct effects on the physiology of the
herbivore, and (3) effects on the nutritional quality of the host plant
(Tingey and Singh, 1980). Among the first to study the effect of pesticides
and plant growth regulators on insect development, as mediated through
change in host plant condition, were Maxwell and Harwood (1960) who
showed that reproduction of the pea aphid Acyrthosiphon pisum on
broad bean was consistently increased with foliar applications of 2,4-D at
4.1 and 41.0 ppm made 24 hours before infestation.
2.3.4.2. Primary physio-chemicals involved in induced defences
According to Craig et al. (1986), when herbivores feed on a plant
resource three following consequences are possible: resource quality may
increase, resource quality may remain unchanged (Mattson and Addy,
1975; McNaughton, 1976, '1979,1983; Owen and Wiegert, 1976;
Montgomery, 1980; Owen, 1980), or resource quality may decline if there
are induced defences (Green and Ryan, 1972; Hauldoja and Niemela, 1979,
Ryan, 1983). The last consequence to resource quality may result from a
passive rearrangement of resources within the plant (Karban and Myers,
1989).
Carbon and nitrogen are the two primary resources which not only
can be allocated to defensive structures but may also be limiting in a plant
(Mooney et al. 1983). Whether carbon or nitrogen is the limiting resource
may determine the defence type (carbon-based or nitrogen-based)
synthesised by the plant (Bryant et a., 1983). Carbon and nitrogen are
utilized in the construction of secondary compounds or protective
structures, and carbon is also used as an energy source to construct these
components (Mooney et al. 1983). Among defensive compounds derived
from carbon are fibre and carbon-based allelochemics, including terpenes,
resins, tannins, and other other phenolics (Karban and Myers, 1989). In

45
the case of nitrogen, this element is a component of various types of
compounds believed to be important in plant chemical defence,
principally cyanogenic glycosides, glucosinolates, alkaloids, certain
proteins, non-protein amino acids and peptides (Mooney et al. 1983).
Levin (1976) suggested that these compounds are the offshoots of
metabolic pathways with important functions in primary metabolism
(Fig 2.6).
Sugar metabolism (carbon based)
I I
Acetate
Amino acid metabolism (nitrogen based)
Jr Phenolics
\ Q U 21 2 C a
Waxes
Terpenes "4"" Steroids
Cyanogenic glycosides
Fig. 2.6. Biosynthetic relationships between carbon and nitrogen based secondary plant products (from Levin, 1976).
2.4. MITE POPULATION ANALYSES
•The above section (2.3) provides information which indicates that
herbivore populations are influenced by their host plants. For this
reason, analyses of herbivore populations are necessary for the study of
the response of plants to herbivory. In the case of spider mites, these
analyses may be expressed in various ways, including life tables,
population growth rates and population dispersions. These three
approaches have been used in the present study.
Alkaloids -
Glucosinolates

46
2.41 Life tables
- There are basically two types of life tables, namely: time-specific
(static, current, or vertical) and age-specific (cohort, generation, or
horizontal) life tables. The former type is solely calculated on the basis of
the age-grouping, at a specific time, of an imaginary cohort of individuals
collected from a stationary population with overlapping generations, i.e.
a multi-stage population. In contrast, the latter type is calculated on the
basis of a real cohort; conveniently the members of a stationary or
fluctuating population belonging to a single generation. A comparison of
succesive estimates in time is necessary for age-specific life tables. Since
several animals have discrete generations and their populations are
fluctuating, the time-specific life table is not as Applicable to the study of
animal ecology as the age-specific life table (Dempster, 1976; Southwood,
1978).
To construct complete life tables, estimates of three dynamic
features of a population must be available. Firstly, the total number of
individuals which reach the beginning of each stage over the entire
generation is necessary to construct a life table, especially the horizontal
type. Numbers entering each stage either may be measured directly
during the period that recruitment occurs or estimated from data on stage
densities over time using one or more. methods for analysis of stage-
frequency data. Secondly, mortality from spedfic factors in each stage
may be expressed in five ways, namely: real mortality, apparent mortality,
indispensable mortality, marginal attack rates, and k-values. These terms
vary in their ability to express unambiguously the mortality caused by a
factor in ways that allow comparisons. Thirdly, lost fecundity can be a
major factor leading to changes in numbers of individuals between
generations. This factor in life tables is estimated by the difference
between the potential and realized fecundity: Generally, potential

47
fecundity is estimated by reference either to dissection of gravid female
adults, or to oviposition rates of adults held under controlled conditions
intended to yield maximum reproductiOn. Realized fecundity is
estimated by any methods used to assess increased numbers in each stage
(Bellows et al, 1992). Fecundity is a measure of total egg production and
fecundity is the number of viable eggs produced by a female (Southwood,
1978). In most cases, fertility losses have been used in life tables as a
fraction of the potential fecundity (Bellows et al, 1992). Additionally,
either fertility or numbers entering a stage can be considered as natality
(Southwood, 1978).
Several types of graphs may be constructed from life table data,
including mortality rate, life expectancy and survivorship curves (Brower
et al., 1990). The survivorship curve is prepared by plotting the number
of individuals living at a given age against time and is the simplest
description of a life table (Southwood, 1978). This type of graph is most
• widely used among ecologists (Brower et al., 1990).
Life tables, as described by Deevey (1947) and Birch (1948), have
been constructed for TSSM by several investigators including Laing
(1969), Bengston (1969a), Shill et al. (1976), and Carey and Bradley (1982).
Although 'natality and mortality differ to some extent between studies
owing to different experimental conditiOns, under similar temperature
regimes developmental rates as well as the patterns of age-specific
survivorship and fecundity are usually similar. It is also clear that
changes in fecundity tend to have a greater effect on the age profile of a
TSSIVI population than do mortality changes because the role of fertility
in shaping age distribution is simpler than mortality (Carey, 1982a).
2.4.2. Population growth

48
• The growth rate of a population under given constant conditions
of environment, where food and space are not limited, and where there ;,-
are no mortality factors other than physiological ones is defined as the
intrinsic rate of natural increase (rm) of that population (Birth, 1948). This
value can be determined from the life history components of the
organism, including developmental time, fecundity, survivorship, and
sex ratio (Sabelis, 1985a). Snell (1978) reported that developmental time
and fecundity were the two life history components of paramount
importance in determining the intrinsic rate of increase. Short duration
of generations and high fertilities lead to large intrinsic rates of increase
(Gutierrez and HeIle, 1985). Cole (1954) showed that fecundity had a far
smaller effect on rm than did the age of first reproduction. With regard to
increasing rm, Lewontin; in 1%5, also proved that small decreases in the
developmental rate were equal to very large increases in fecundity
(Wrensch, 1985). Furthermore, Tn of the tetranychid depends on the breeding
conditions which basically include the nature of the host plant, the
surface available to each individual, temperature and humidity
(Gutierrez and HeIle, 1985). Rauwerdink et al. (1985), working with
TSSM on cucumber, found rm values ranging from 0.282 per day for
susceptible lines to 0.218 per day for resistant lines under the same
environmental conditions. In the case of the surface available, Wrensch
and Young (1978) indicated that marked reductions in developmental
rate, survivorship and sex ratio of TSSM populations occurred at high,
rather than low density. The effect of temperature on the rm value was
studied by Carey and Bradley (1982) who showed that TSSM on cotton
had rm values at a relative humidity of 65% ranging from 0.219 per day at
23.8°C to 0.293 per day at 29.4°C. Herbert (1980, working with TSSM on
apple, pointed out that developmental time wai "shown to decrease with

49
increasing temperature. For the rm values at different humidities, Nickel
(1960) reported that T. desertorum Banks had an rm at 30°C ranging from
0.46 per day at 25-30% RH to 0.36 per day at 85-90% RH, reflecting the
promotion of fecundity by lower humidities.
According to Lotka (1924) and Birch (1948), the following equation
was derived to estimate rm:
exp(-rmx)kmx = 1
where: x is the pivotal age for the age class in units of time; lx is the age
specific survivorship; and mx is the age specific fecundity.
The age specific survivorship is the fraction of females surviving
from age 0 until at least age which is:
Ix = yx/yo
where: yx is the number of females alive during a given age interval; yo is
the initial population of females.
The age specific fecundity is the number of female offspring born
per female of age x, which is:
mx = Nxs
where: Nx is the mean number of offspring produced per female per age
interval; and s is the proportion of the offspring that are females. In
general, s is assumed to be 0.50 (Southwood, 1978). •
Several workers have attemped to find other methods of
determining the value of rm (Wyatt and White, 1977). Laughlin (1965)
proposed the capacity for increase (rc) as an approximate rm. It is defined:
Tc = loge Ro/T.
where: Ro is net reproductive rate; and Tc is cohort generation time.
The net reproductive rate (Southwood, 1978; Murray, 1979; Brower
et al., 1990) is considered as the number of times a population will
multiply per generation, which is: •
Rc■ =1,1xmk
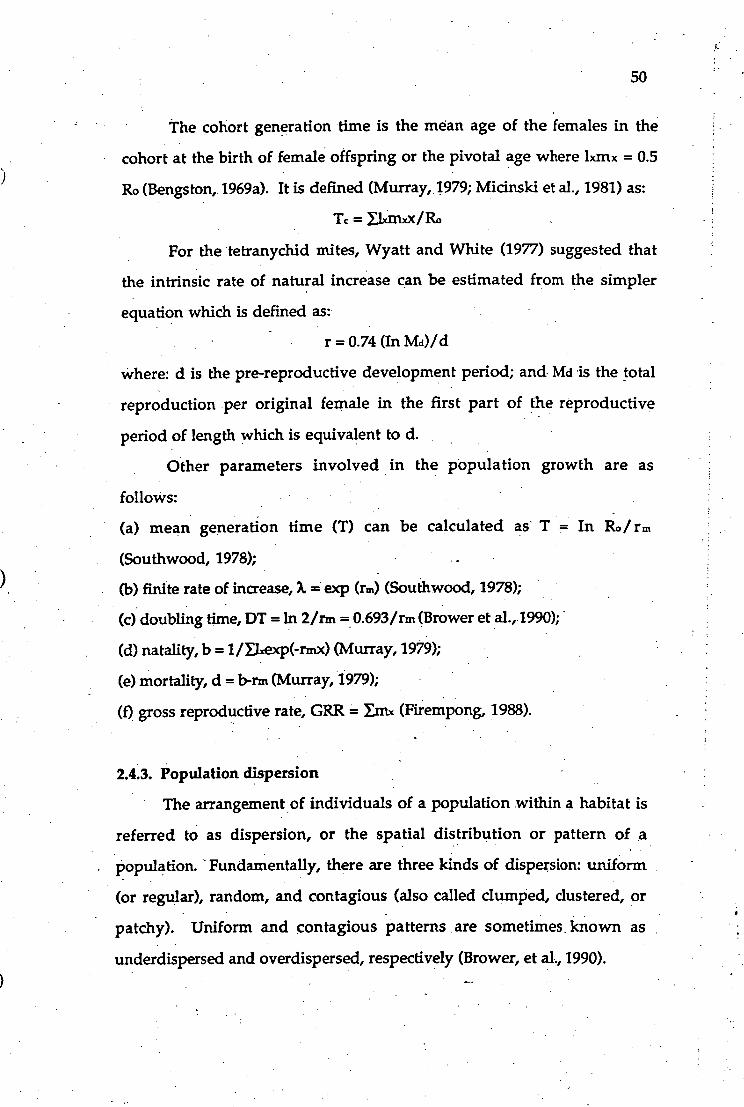
50
The cohort generation time is the mean age of the females in the
cohort at the birth of female offspring or the pivotal age where lxmx = 0.5
Ro (Bengston, 1969a). It is defined (Murray, 1979; Micinsld et al., 1981) as:
Tc = anux/Ro
For the tetxanychid mites, Wyatt and White (1977) suggested that
the intrinsic rate of natural increase can be estimated from the simpler
equation which is defined as: r = 0.74 (In Md)/d
where: d is the pre-reproductive development period; and Ma is the total
reproduction per original female in the first part of the reproductive
period of length which is equivalent to d.
Other parameters involved in the population growth are as
follows:
(a) mean generation time (T) can be calculated as T = In R./ rm
(Southwood, 1978);
(b)finite rate of increase, A. = exp (rat) (Southwood, 1978);
(c)doubling time, DT = In 2/rm = 0.693/rm (Brower et al., 1990);
(d)natality, b = 1/11xexp(-rmx) (Murray, 1979);
(e)mortality, d = b-rm (Murray, 1979);
(f)gross reproductive rate, GRR Enix (Firempong, 1988).
2.4.3. Population dispersion The arrangement of individuals of a population within a habitat is
referred to as dispersion, or the spatial distribution or pattern of a
population. Fundamentally, there are three kinds of dispersion: uniform
(or regular), random, and contagious (also called clumped, dustered, or
patchy). Uniform and contagious patterns are sometimes known as
underdispersed and overdispersed, respectively (Brower, et al., 1990).

51
Sampling is a procedure used to determine the distribution of a
population (Southwood, 1978). Various techniques have been devised
for the sampling of field populations of the tetranychids. These are direct
counting, imprint counting, counting mites dislodged with the aid of a
brushing machine, counting mites washed off their host plant leaves and
counting mites dislodged by beating foliage. Among these techniques,
direct counting is usually assumed to be the most accurate (Sabelis, 1985b).
Some aspects of statistics need to be considered before the data from
the sampling can be analysed. These include the frequency distribution of
data and' transformation. For most statistical methods to be applied to a
set of data the frequency distribution must be normal. This means that
the variance is independent of the mean. In order to overcome the
problem of the variance related to the mean the data are transformed;
therefore, the actual numbers are replaced by a function. Taylor's power
law (Southwood, 1978) can be used not only to choose the transformation
but also to describe the pattern of the dispersion. The relationship
between the mean and variance of series of samples in Taylor's power
law is expressed by: s2 = a)(b
where: a and b are constant; s is the variance; and x is the mean (Taylor,
1961). The value of b which appears to be an index of aggregation
characteristic of the species as well as a component of the transformation.
This value can be found from a linear regression model:
log s2 = log a + b(logx).
This relationship holds over a continuous series of dispersions from
uniform through random to highly aggregated. It will Usually be found
appropriate to transform data from a uniform population by using

52
squares, data from a slightly contagious one by square roots and data from
distinctly aggregated populations by using logarithms (Southwood, 1978). :
An example of the application of Taylor's power law is the work of
Jones (1990), who studied the sampling and dispersion of TSSM and the
western orchard predatory mite (T. occidentalis) on tart cherry. •The result
showed that Taylor's power law was useful to quantify the relationship
between mean and variance and to develop binomial sampling plans.
However, Taylor's power law has been criticized on both
theoretical and statistical grounds (Pickett and Gilstrap, 1986). Iwao (1968)
indicated that the index of aggregation has no theoretical grounds and
Nachman (1981) observed that the independent variable is subject to
error, violating assumptions of least squares regression.
According to Myers (1978), Green's coefficient, (Cx) is considered
one of the more useful dispersion indices because the index varies
independently from the the sample mean.. This index determines
departure from randomness and is calculated by:
Cx = [(s2/m) - 1]/X - 1,
where: s2 is sample variance; m is sample mean; and X is sample total.
Values for the index Cx range from 0.0 (random), to 1.0 (maximun
aggregation) (Green, 1966).
In -addition, variance-to-mean ratio is another approach to the
description and analysis of the spatial distribution of individuals. If the
distribution is random, then the ratio is equal to 1.0; if uniform, the ratio
is less than 1.0; and if aggregated, the ratio is greater than 1.0 (Brower, et
al. 1990).
2.5. SCREENING OF PLANT VARIETIES FOR RESISTANCE
TO SPIDER MITE DAMAGE

53
Inherent resistance to some herbivores is found in every green
plant (Norris and Kogan, 1980). For animal pests, there are three main
_types of resistance that can be expressed by host plants (Russell, 1978).
These are: (a) non-preference, which is displayed by plants that lack the
characteristics to serve as hosts; (b) antibiosis, which includes adverse
effects used by plants on the development or reproduction of pests; (c)
tolerance, which enables a host plant to withstand infestation and to
support pest populations that would severely damage susceptible plants
(Painter, 1951). Besides these types of resistance, Russell (1978) proposed a
fourth type defined as pest avoidance. This type is expressed as a
tendency of the host plant to escape infestation. For example, some apple
cultivars do not become infested by various species of insect pests since
their buds do not break until after the main .hatching or emergence
period of the pest (Briggs and Alston, 1969).
Based on the mode of inheritance, some .types of resistance to pests
are governed by a single gene of major effect on the trait (monogenically),
others by ,a few genes of major effect (oligogenically)) and still others by
many genes each of which has a minor effect (polygenically) (van de
Plank, 1963). Some of the resistance genes are recessive, others are
dominant and their effects may be additive (Russell, 1978),
complementary, or epistatic (Gallun and Khush, 1980).
• Screening for resistance to pests can be carried out in the field or in
the glasshouse. Experimental errors of field tests can be very high when
the tests are conducted under natural, uncontrolled erivironmental
•conditions. These errors may subsequenay result in spurious differences
in pest. resistance between genotypes or vaguely real differences in
resistance. Nevertheless, field tests have several advantages since they
are conducted under the real conditions of the infestation and greater
numbers of host genotypes can usually be screened in the field than in

the glasshouse with the same amount of labour. In contrast,
experimental procedures in the glasshouse can be standardized and
controlled; because of this, reproducible results can often be achieved
quickly and easily (Russell, 1978). Although artificial tests are often
preferred, field tests still remain part of each study on resistance to
confirm the results of artificial tests (De Ponti, 1977b).
For artificial tests of resistance to pests that attack the aerial parts of
plants, large numbers of the pest are often reared on appropriate host
plants in insectaries (Russell, 1978). Singh and Charles (1977) reported
that lima beans (Phaseolus lunatus) were suitable food plants for rearing
TSSM. Transferring a predetermined number of individuals either to
each tested plant or to susceptible 'spreader' plants which have been
planted uniformly among the tested plants is a simple but effective
method of inoculating plants with pests, in field or glasshouse tests
(Russell, 1978). Dahms (1972) suggested that resistance may be measured
by (a) visual observation, (b) the effect of pests on plants, (c) the effect of
plants on pests, or (d) indirect methods.
In the literature on resistance to TSSM, reviewed by van de Vrie et
al. (1972) and De Ponti (1977a), reference is commonly made to the use of
artificial tests. These tests have been investigated almost exclusively by
measuring reproduction of the mites or by rating the extent of damage of
infested plants. In most cases, the suitability of plants for the mites is
detemined by measuring the reproduction during 24, 48 or 72 hours after
inoculation. Occasionally all developmental stages of the progeny of the
inoculum are watched, however mostly the observations are restricted to
the eggs. These observations can be made by using leaf cage or leaf disc
techniques (De Ponti, 1977b). To economize on labour, the latter
technique is to be preferred (De Ponti and Inggamer, 1976). Helle and
Overmeer (1985) also suggested that the leaf disc technique is a

55
convenient and efficient method for studying tetranychid biology. The
biology of the mites on excised plant parts, like detached leaves and leaf
discs, may differ from the normal pattern on an intact plant (Storms,
1969). Nevertheless, leaf discs have been popularly used to determine
differences in reproduction of the two spotted spider mite (Rodriquez,
1953; Bengston, 1970; Dabrowski et al., 1971; Macdonald et al., 1971;
Dabrowski, 1972; Aina et al., 1972; Tulisalo, 1972; Soans et al., 1973a, 1973b;
Schalk et al.,, 1975; Al-Abbasi et al., 1987; Wilde et al., 1991; East et al.,
1992).
Resistance to TSSM has been found in several plants as listed in Table 2.2.
Table 2.2. Up-to-date review of the literature on resistance to TSSM.
Host plant
References -
Apple Cassava Castorbean Chrysanthemum Corn Cotton
Cucumber
Eggplant •Geranium Grape Hop
Irnpatien Ivy .
Muskmelon Pepper Potato Raspberry Soybean
Strawberry
•Sugarbeet Tobacco •Tomato Watermelon
Bengston (1970); Keppel (1989). Saradamma and Des (1974); Bellotti and Guerrero (1977); Bellotti anciByrne (1979). Chandrasekharan et aL (1964) Markkula et at (1969). ' ICamali et at (1989). ICamel and Elkasseby (1965); Schuster et aL (1973); Childress et aL (1976); Schuster and Maxwell (1976); Bailey et al. (1978); Trichilo and Leigh (1985); Botha et aL (1989); Pavlova and Egamberdiev (1990). Dacosta and Jones (1971); Kooistra (1971). Tulisalo (1972); Soans et at (1973a); ICnipping et aL (1975); De Ponti (1977b); Gould (1978); De Ponti (1980). Soans et aL (1973b); Schalk et al. (1975). Snetsinker et aL (1966); Potter et aL (1981); Walters et aL (1991). Duschin (1967). Mayberry (1968); Regev and Cone (1975); Peters and Berry (1980a); GUM= and Hutchins (1982); Leszcynski et aL (1988). AI-Abbasi and Weigle (1982); Al-Abbasi etal. (1987). Osborne and Chase (1985). East et aL (1992). Zatyko and Martinovich (1986). Gentile et aL (1969); Macdonald et. (19'72). Labanowska and Pala (1986); Wilde et al. (1991). Rodriguez and Freeman (1959); Carlson (1969); Pararneswarappa et at (1974); Bailey and Furr (1975); Rodriguez a aL (1983); Mohammad and Rodriguez (1985); Hildebrand et aL (1986); Wheatley and Boethel (1987); Wheatley and Boethel (1992). Leska et at (1964); Chaplin et at (1968; 1970); Dabrowski et al. (1971); Shanks and Barritt (1975); Schuster et aL (1980); Shanks and Barrit (1984); Masis and Aguilar (1990). Bush and Brewbaker (1956). Patterson et at (1974). •
Gilbert et at (1966); Stoner and Stringfellow (1967); Stoner (1970). East and Edelson (1990).

56
CHAPTER 3 SEASONAL ABUNDANCE AND
DISTRIBUTION OF TSSM INFESTING COMMERCIAL
HOPS IN TASMANIA
3.1. INTRODUCTION
Since early times, hops have been regarded as an important
Tasmanian industry (Wade, 1988). Sixty per cent of annual hop
production in Australia comes from Tasmania (Anonymous, 1988).
Sutton (1982) reported that an estimated six percent loss in yield in the
1959/60 and 1978/79 growing season was due to the infestation of TSSM.
Later, Cao (1989) showed that the damage caused by TSSM feeding on
untreated hop plants, considering that losses up to 30 percent in 1987/88
and 10 percent in 1988/89 occurred in yield and associated deterioration in
quality was also detected.
TSSM was already a pest in Tasmania before the turn of the
Century since it was described as being a problem in the north-west and
north-east regions of the state by Thompson in 1895 (Terauds, 1989).
Ccintrol of TSSM has become increasingly difficult because mites have
developed resistance to most commercially available pesticides (Herne et
al., 1979). The detrimental effects of pesticides on the populations of
natural enemies in commercial hop yards also appeared to be partially
responsible for the. increased populations of TSSM. This disruption in
ecosystems along with the confirmation of pesticide resistance in TSSM
has undoubtedly accelerated the search for alternative control methods.
The first task of the research on TSSM was to• learn about the field
characteristics of this species and to understand the conditions that lead to
high - populations. A thorough knowledge of pest population dynamics
and distribution patterns is necessary for improving control strategies in a
pest management system. Several factors may -have seasonal effects on

57
spider mite populations, including climatic factors, host plant quality, and
agricultural practices. Consequently, the purpose of this study was to
investigate the impact of host plant and seasonal factors on the dynamics
and distribution patterns of TSSM populations on field hops.
3.2. MATERIALS AND METHODS
3.2.1. The study area: Field investigations were conducted in a 2.2
ha commercial hop yard at Bushy Park, Tasmania during the growing
seasons of 1990/91, 1991/92, and 1992/93. An experimental plot was
established in the middle of this hop yard which is surrounded by
improved pasture for sheep grazing. The plot, which consisted of 80 rows
of about 50 hop plants at a plant spacing of 1.8 x 1.8 m., was divided into
approximately equal parts designated block A, B, C, and D (Fig. 3.1). Hop
vines were trained on strings supported from an overhead trellis. There
were three strings to each hill and the trellis was approximately 5 m. in
height. The variety "Pride of Ringwood" was grown on the entire area
under sprinkler irrigation. Maximum and minimum temperatures and
precipitation recorded for the area during the investigation were obtained
from the Australian Bureau of Meter°logy, Hobart, Tasmania.
Fig. 3.1. The layout of the experimental plot at Bushy Park.
Block A
Block .B
Block C
Block D
80 rows

58
3.2.2. Growing season 1990/91: The investigation commenced on
November 21, 1990 and ended on March 7, 1991. The miticides, Apollo
SC (clofentezine) and °mite 300W (propargite), were applied in blocks A
and B in mid-January but blocks C and D were not sprayed throughout
the study period. Therefore, blocks 8 and C became boundary areas for
the treated and untreated areas. Hence, this naturally infested area could
be divided into four levels of mite incidence, viz, very low mite attack
(Block A), low mite attack (Block B), high mite attack (Block C), and very
high mite attack (Block D)..
• Different sampling techniques were used for three. different growth
periods of the plants. Firstly, before the plants grew more than 2 m.
above the ground, one mainstem leaf was collected from the middle
region of each plant (Plate 2). Secondly, after the plants grew more than 2
m. above the ground, two main.stem leaves were collected at a height of
1.8 m. from each plant (Plate 3). Since 1.8-uf leaves could be reached by
hand from the ground, they were chosen as the sampling unit. A similar
•technique was used by Wright et al. (1990) for Phorodon humuli
(Schrank) on hops' was undertaken weekly and the plants
were selected randomly. A total of 10 plants was sampled from each block
on each occasion. Finally, in the harvesting period, the influence of plant
heights was investigated. Four leaves from each of 4 hop plants in Block
D were sampled from the mainstems at: 0-2, 2-3, and 3-5 m. above the
ground.
Samples from each plant were placed into a plastic bag and stored
Under cool conditions before examination. _Leaves were inspected using a
binocular microscope at 10-fold magnification. Microscopic observations
provided more information on the distribution, habits and interactions
of the leaf fauna than leaf brushing technique (Henderson and McBurnie,
1943; Readshaw, 1975).

Plate 3. Hop plants in the experimental plot during the later part of the growing season.
Plate 2. Hop plants in the experimental plot during the early part of the growing season.
J I

60
Numbers of TSSM in various stages were counted and recorded
separately from predators and other arthropods. Variation in the mite
populations was monitored weekly for 16 weeks and was then compared
with degree-days and mite-days calctilated by the following formulae:
Degree-days = Maximum temperature + Minimum temperature - Threshold temperature
(DD.) 2 (Arnold, 1960)
• Mite-days = Average number Of mites per leaf between 2 successive sampling dates x
(MD.) Interval in days between samples (Jones, 1990)
where the threshold temperature of TSSM was taken as 10°C (Herbert,
1981).
Measurements of plant height were taken to monitor the growth
of hop plants on every sampling date. In addition, the effect of mite
attack on foliage under various levels of mite population as mentioned
previously was assessed using leaf areas and dry weights of 20 leaves per
block on the last five sampling occasions.
A planimeter (Paton Electronic Planimeter) was used to measure
the surface area of leaf samples collected on February 7, 13,:21, 27 and
March 7, 1991. For dry weights, all the hop leaves collected were placed in
a 70°C drying oven following examination and area measurement (after
Peters and Berry, 1980). Two days later, the dried leaves were removed
and weighed on an Mettler PC4400 eletrical balance (Delta Range).
3.2.3. Growing season 1991192: The investigation was conducted
from November 14, 1991 to March 5, 1992. All of the blocks were treated
by conventional chemical control. The miticides were applied in Blocks
A, B, and C in mid-January and in Block D in early February. Leaves were
collected randomly every. 14 days, using the same procedure as in the
1990/91 season. In addition, leaf samples were collected at three heights:

61
0.9, 1.8, and 3.6 m, and the differences between the growth rates of leaves
at the 3 positions were studied. The leaf surface areas obtained.by using
the planimeter as well as the dry weights were estimated over the whole
season.
3.2.4. Growing season 1992193: The investigations were conducted
from November 4, 1992 to February 24, 1993. All of the blocks were
sprayed with miticides by late December. Materials and methods were as
employed in 1991/92 season, except that no leaves were sampled at the
height of 3.6 m., and leaf surface areas were measured using a linear
regression model that estimated area from measures of leaf length and
width at the widest point. Furthermore, one mainstem leaf was also
collected from the fourth node of each plant before the plants grew more
than 2 m. above the ground. -
In addition to the field investigation, the study on the effect of hop
plants after spraying the miticides on TSSM populations was also carried
out in Blocks A and D. On February 10 and 24, seven randomly selected
hop plants in each block were infested with five teneral females per plant.
These mites were confined to the dorsal surface of a mainstem leaf at the
height of 1.8 m. using a clip-on cage of 2.0 cm in diameter. Two weeks
after release, the cages (including the leaves) were removed from .the
plants and the number of mites of all stages were counted under a
binocular microscope (20X).
3.2.5. Data analyses: Data were analysed using Staview SE +
Graphics software on Macintosh computer. Taylor's power law was used
to select the appropriate transformation of data by plotting log variance
against log mean. Base 10 logarithms were used for the transformation of
data for computation of the variance and mean. Linear_ regressions were
performed using the curve fit procedure of the Cricketgraph computer .

62
program. The two dispersion indices used to measure mite spatial
distributions were the variance-to-mean ratio and Green's coefficient, C..
3.3. RESULTS
3.3.1. Seasonal abundance
3.3.1.1. Growing season 1990/91: As the majority of hop plants in
the experimental plot had grown more than 2m. above the ground at the
commencement of sampling, there were no leaves collected from the
middle region of hop plants during this growing season. Fig. 3.2
illustrates the growth of hop plants relative to seasonal population trends
of TSSM in various stages and other arthropods on 1.8-m mainstem
leaves. The hops grew to the top of the trellis and started forming visible
bases of inflorescences by the end of December (Fig. 3.2(I)). At this time,
naturally occurring populations of TSSM in Blocks A and B, were still at
low levels, i.e. less than 10 mites of all stages lier leaf (Fig. 3.2(11) and (III)).
In early January, the TSSM populations reached as high as 13.5 and 26.8
mites/leaf for Blocks A and B, respectively. Miticides were then applied
on one occasion for TSSM control in both blocks in mid-January. This
spray appeared to eliminate TSSM from hops in the treated blocks.
Consequently, no mites were found on the leaf samples for
approximately 4 weeks, after which low level infestation was recorded in
late summer and early autumn. This indicated that the mite population
was suppressed after spraying, but began to increase again when the
residual activity of the mitiddes disappeared. For Blocks C and D, TSSM
populations showed a gradual build-up in early summer and then
increased rapidly during the subsequent period (Fig. 3.2(IV) and (V)).
However, Block D had consistently larger populations of mites than
Block C during this period. The initial peaks - in these blocks occurred
when most of the hops were beyond the vegetative growth period.

r71
Block B miticides
13 21 27 7 Feb.91 Mar.91
21 28 5 12 19 26 2 9 16 23 30 Nov.90 Dec.90 Jan.91
Date
Fig. 3.2. Average heights of hop plants in the experimental plot (I). Population trends of TSSM and other arthropods (II, HI, IV, V. and VI) during the 1990/91 growing season.
(I) Hop height
Vegetative 4-- growth
Top trellis
0.4 Reproductive development
Average height (cm.)
500
400:
300:
200—
100—
0
20 (ID Block A
miticides CI Eggs
1012221 Immatures 1=1 Males IN Females
(V)
200 —
100 —
0
1.5
Block C
(VD
Stethorus
—4--• Predatory Mites
Other
r.1
11■1■11
'Untreated blocks

During the period from late January to mid-February, TSSM on 1.8-m
mainstem leaves reached the highest peaks of 118 and 268 mites of all
stages per leaf in Blocks C and D, respectively. The counts of mites in
'different stages on leaves collected from these untreated blocks indicated
that pre-adult stages, that is eggs and immatures, made up the largest
proportion of mite populations throughout the growing season.
Nevertheless, eggs were the predominant stage for most of the season.
For instance, the stage distribution of mite populations, in Block D on
December 26, 1990 in total number of mites per leaf was 6.17% adults and
93.83% eggs while no immatures were found on the leaves sampled.
However, as plant age increased the percentage of eggs relative to the
other stages decreased. In this instance, the stage distribution of mite
populations at the highest peak (February 13, 1991) was 13.65% adults,
27.19% immatures, and 59.16% eggs and on the final sampling date
(March 7, 1991) the proportions of adults, inunatures and eggs were 24.63,
34.26, and 41.11%, respectively. It indicated that the deterioration of host
plants at suitability with time resulted in the reduction of female
fecundities. In addition, the adult females observed in the early autumn
started to change from the green summer form to the bright-orange
overwirttering form, also indicating a termination of egg laying.
Stethorus species, predatory mites and other arthropod
'populations were commonly found at low levels in the 1.8-m leaf
samples of the untreated plot (Fig. 3.2(W)). The average numbers of
predators never exceeded 2 individuals per leaf throughout the study
period. Obviously, predator densities were low in comparison to their
prey and did not respond as well to prey density changes. Stethorus spp
were the most common predators, followed by phytoseiid mites. Other
arthropods found in situ included small spiders, native budworms

total number of mites per leaf on each sampling occasion. To overcome
the problem of the impact of miticides, only the data from Block D is
, o
o Ln 0)
v ci
n
tO
•
cp..
; ri ▪cf ci
ci
f
g
•
c
cic=)
•sanzot papaw! p tiop.uclord
tties
t,„
a) •
tl
*owl > ,..._
••-()
, co
Ili
t50
ra
.ro t -0 •G
'a
E•o
. (73
bo
64' 7-4
"4.1 Lt
0 t.)
r r
•a) @ tt
ri
CL.
t . 2
a' .— a)
_
ol .ro 7:1
ua) •
0 0.) o
tt o
o---..
-a.
--, o a
,a P.
.... , •
far a)
1
.c
t1
v 0 )
•G
t 2
a) o §
a'
If:1i
r, et
et
en
pit a) en
Y‘1:' e '13
14
.k) -t-4
0,)
''' d
I-. 0
E =
a) >..-. tA
C
VI 15.1 o 3
A ea
•
U ,,,0 E to
o -
ni >
..-_,
ei
a.
"g
.9..) F, R-1 a) a)
M a) > 0 V
al.. VI 0 tn
= 4.6
g
•= Z
..4 13
"r0
C
-5. 2 0 .2
"63
c V
(1) 1- ) •
a L.. o
,c
a) o
'4-.'4-.a) 4.,
a) ti)
>c
..E.
a)
0 4 2 0 .-
% a)
VI
3 a
> , a) co 0
1
a s.
8
.... u ,
o•
•-• r 0 = et
V a tu co C
6
L.
V :L.
= v)
E v, 7
:E.
-1 in
tn
LN
8 .
. 4
E E V)
.114
li, ICI
tt
ro a)
•.=
,c
ri -6.,
-m u a)
0) z a) ....
6 o
*-E
•
0 L. P-103
VI
0
ti)
.- (a o lei E
cab °gi.,1" =
=
'@ 2
vl
àeu E
a ro 15 E
.c 4 > _ ,..•
0 a) u = P.,
>
C a g
0 ,
tt'
0) ns = • .a•
u- Cl. (13
E
g v)cl fi e ci)2 g
ocE-.
t.).
04 4-. et
O—
$... E '§ q
04 a) .tti a)
04 .2 0 ;a) .
,c
0)
•••• a) C)
0 ;al
46 1-14 0 a) 1.11
a) a
.0
0) (aIe. ' ir)
0 E 1..
Ti " se.
O't
taA (3
(I)
4
o
a.
0 1-
0 •
a) 7.)
(i)> 4)
Cr, E ea e z _
et
3 ,94 ct
III c 13
a)
ets @ E
•
g a)

1 I I I 1 SO 100 150 200 250
Number of mites per leaf
300
66
Fig. 3.4. Relationship between proportion of infested leaves and mite density in block D during the 1990/ 91'season.
3.3.1.2. Growing season 1991192: During the early season, a
comparison of initial TSSM populations on the leaves collected in the
, middle region of plants between previously treated areas (Blocks A and B)
and previously =treated areas (Blocks C and D) indicated that hops in
untreated areas harboured more mites of all stages than did hops in
treated areas. According to an unpaired t-test, significant differences (p <
0.05) in mite densities between these two areas were detected on the first
two sampling dates (Table 3.1). -
Table. 3.1 Mite densities in the middle region of hop plants in early 1991/92 growing season.
Area (n=20)
No. of mites/leaf No. of mites/cm
14/11/91 28/11/91 14/11/91 28/11/91 (p=0.0474*) (p=0.0335*) (p=0.0459) (p.0343*)
Treated 0.00 + 0.00 0.50 + 0.50 0.000 + 0.000 0.008 + 0.008
Untreated 0.72 ±0.36 73.98 ±33.95 0.016 + 0.008 1.428 + 0.659

67
Changes in population density of TSSM and other arthropods on
1.8-m mainstem leaves in each block compared with the growth of hops
throughout the season are illustrated in Fig. 3.5. During the vegetative
growth period (Fig. 3.5(1)), much higher numbers of TSSM in each block
were found on leaves in this growing season (Fig. 3.5(11), (HI), (IV), and
(V)) than those recorded at the corresponding time in the previous
season. For example, on 26 December 1990 the mean numbers of total
mites per leaf in Blocks A, B, C, and D were 2.4, 4.5, 10.1, and 8.1,
respectively, whereas on the same date in 1991 total mites per leaf
recorded were 3.1, 33.0, 511.5, and 445.5 for Blocks A, B, C, and D,
respectively. From this figure, it can be seen that the mite populations in
blocks C and D in this season were relatively high in comparison to the
previous season, probably because of high numbers of overwintering
mites in the untreated plot. The hops had reached the stage of
reproductive development when the miticidis were applied in blocks A,
B, and C in mid-January, after which the mite populations were seriously
depleted. However, the mite population in Block D continued to build
up to a maximum of 1032 per leaf until miticides were reapplied
approximately 2 weeks later. The average numbers of predators and
other arthropods remained fairly low, ranging from 0.1 to 0.6 per leaf
throughout the study period (Fig.3.5(VI)). Phytoseiid mites were the only
mite predators found during the season.
When the average number of total mites per leaf at a height of 1.8
m. detected on December 12 and 26, 1991 and January 9, 1992, was
regressed against those of adult females per leaf collected in the middle
region of hop plants early in the season (November ,28, 1991), highly
significant linear iegression lines were obtained (r 2 = 1.00, 0.471, and 0.907,
respectively; Fig. 3.6). This indicated that infestations of '1•SM on the
upper part of hop plants found later in the season appeared to be related

(I) Hop height
Top trellis
Reproductive wth develo • ment —4.1 "
• 500,-
—; 400— U ow-
ty 200— ea - P. 100— c .4> 0
20
10—
(11) Cl Eggs
Inunatures
[3 Males
In Females
Block A Miticides
Miticides Block D
(VI)
14 28 12 Nov.91
Dec.91 Jan.92
Date
Stethorus
Predatory mites Other
Malailage
Feb.92 Mar.92
Fig. 3.5. Average heights of hop plants in the experimental plot (I). Population trends of
TSSNI and other arthropods (II, III, IV, V. and VI) during the 1991/92 growing season.
200 (Ill) Block B
Miticides
100—
600
500— (IV) Miticides Block C
300::
200:
100-:
800—
600-
400
200-
0

Average numbers of mites per leaf at the height of 1.8 m.
December 12, 1991
8 December 26, 1991
January 9, 1992
f4
g
g
§
§
P g
g
g
§
8 c)
2 1
o
ab-9 • Ci
ro w. 0 •
0 F.‘
r•P
g" a. •
c o LA "ci cr
z 0 ro
< ro 9 .4.
Mr) M 0. 0-
p4p rt, ID
IA Er ' 4,
o •03 •
(1)
oN :a 0
< 9 cr
n to W
CD
Cr
C7
(t. E
tu 49-
•4-%
r)
•-•
•
pID
• •is
•
- 11) .11
0 ▪
=.•
rD
A) "j
)-). 9:
••-• CL.
•—• •eD
.J.I
•IaIalaIs
•
1■.
1—.
1.
1a
IA
I 1
(A)
y = - 0.72919 + 10.121x -R2 = 1.000
(B)
•
y = 150.68 + 25.267x RA2 = 0.471
(0s . •
km
y = 90594 + 23.720x RA2 = 0.907

70
to the populations which initially infested the lower part. In addition,
the results were confirmed by the highly significant positive relationship
between the initial level of infestation in the middle region of hop plants
and the percentage of 1.8-m. leaves infested on 12 December (r 2 = 0.955),
26 December (r2 = 0.569), and 9 January (r2 = 0.313) (Fig. 3.7).
3.3.1.3. Growing season 1992/93: The seasonal growth of hop plants
and the abundance of TSSM and other arthropods on 1.8-m mainstem
leaves is presented in Fig. 3.8. The pattern of mite population change in
all blocks was similar (Fig. 3.8(11), (III), (IV), and (V)). Naturally-occurring
populations of TSSM began to increase in early December. Eggs were the
predominant stage during this period. The TSSM population density in
each block was less than that recorded at the corresponding time in the
1991/92 season. This revealed that elimination of mites by miticides in
the previous year resulted in low numbers of overwintering mites in the
following year. After the hops grew to the fop of the trellis (Fig. 3.8(I)),
miticides were sprayed over the entire area No TSSM were detected
during the rest of the study period. The population densities of predators
and other arthropods were recorded in extremely low numbers, ranging
from 0.10 to 0.15 per leaf over the course of the season (Fig. 3.8(W)).
In addition, a comparison of the number of mites in the cages after
re-infestation between Blocks A and D is presented in Table 3.2.. It was
found that the mites released on February 10, 1993 were not able to
survive in both blocks, whereas those infested on February 24, 1993
ranged from 11.43 to 5.57 individuals per cage in Block A and D,
respectively. The results obtained in the field investigation during the
time prior to miticide application indicate that the number of mites in
Block A was much smaller than in Block D (Fig. 3.8). This revealed that
after re-infestation the mite population on slightly damaged hop plants
tended to increase faster than that on heavy damaged hop plants.

•etcif.:.
1■1
•
ti)
Er 144
cr
: 4
CA fb :3 0 po
(t)
'V' co ET
p
„
•o a g F
n 9 -t3 cr
•eD co
cr " 7
ca
4's
el) p
•(f) -a
n
o a cro
•fl) crg
o•
o (to
bo
—•
o.•
tv
o -a 9 ar
Cr, 11)0.
•ft)
fa. hr
::•■•• 9
(I) •—•
rD
fp a)
•<
cr •
n 7r th 0.
Cti F.D
•o
"
09 5
co: ' NJ cr: 9:
.m
11.
1.
11
mti
I • I • I - I I •
0 20 40 60 80 • 10
(A)
•
y = 11.945 + 0.57754x RA2 = 0.955
(B)
• •
y = 49.231 + 0.62934x RA2 = 0.569
(0 •
1
y 69.068 + 0.38968x RA2 = 0.313
•
I 1
December 12, 1991
•ti
8
% Leaves infested at the height of 1.8 m.
December 26, 1991
cD
. 8
8
January 9, 1992 8

Average number of mites per leaf at the height of 180 cm.
Average height (cm.)
0 g g t §
I •
I i I i I

Table 3.2. Average number of mites in each cage after re-infestation on 10/2/93 and 24/2/93.
73
Average number of mites per cage (Mean ± SE)
• Block • (n=7) Released on . Released on
10/2/93 24/2/93 (p=02467 ns)
A . 11.429 ±4.628 (slight damage)
D - 5.571 ±1.307 (heavy damage)
3.3.2. Oimatic effects
3.3.2.1. Growing season 1990191: The effects of heat sum and
precipitation on TSSM infestation are shown in Fig. 3.9. On a degree-day
basis, weekly fluctuations in mite populations for all blocks during the
early part of the growing season (November 21, 1990- January 16, 1991)
gradually increased as the accumulation of heat units progressed (Fig.
3.9(1) and (III)). Abundant rainfall during this part of the season was
probably responsible for, the slow increases of TSSM populations (Fig.
3.9(11) and (111)). For the treated blocks, mite populations declined soon
after spraying with miticides as mentioned previously, whereas the
infestations of TSSM in the untreated blocks steadily increased during
this time. A rapid population decline of TSSM on untreated hops,
especially in Block D, occurred when the rains resumed in late January.
The TSSM population in this block rebounded as the rains Subsided.
Thereafter, the infestations declined due to the relatively low
temperatures in the latter part of the season. However, some increases in
population levels were observed before harvest

Fig. 3:9. TSSM population performance relative to temperatures and precipitation during the 1990/91 growing season.
25
(0
.5
8 15-
5-
Threshold level
30
— 0--- 131ock .A
••••• 131cck B
--0 — 131cck C
[Hock D
1: 0
0-
•
0
300
•
0-
74
21 28 5 12 19 26 2 9 16 23 30 7 13 21 27 7
1av.90 Dec 90 jan.91 Feh91 M2r.91
Date

75
3.3.2.2. Growing season 1991192: Fig. 3.10 shows the daily changes
in degree-days and rainfall relative to the growth and decline of TSSM
populations at biweekly intervals. Because of the effect of miticide as•
mentioned above, only Block D was used for observations. A rapid
population decline in Block D was observed on 9 January 1992 possibly
due to continuous rains during early January (Fig. 3.10 (H) and (M.
• Afterwards, the mite populaton in this block increased to a maximun
level because of high degree-days and the absence of rain during mid-
January (Fig. 3.10 (I), (II) and (III)).
• 3.3.2.3. Growing season 1992/93: The daily changes in degree-days
and rainfall as well as the biweekly changes of the TSSM population in
each block are shown in Fig. 3.11. Since miticides had been applied to all
blocks before any observations were made, it was not possible to
generalise on the effects of these two weather variables on the seasonal
abundance of TSSM during this season.
• 3.3.3. Feeding damage
3.3.3.1. Growing season 1990/91: Mite-day accumulations obtained
from active stages of TSSM per leaf in each block are presented in Table
3.3. From this table, it can be seen that the seasonal accumulation of
mite-days was 59.85, 183.48, 1660.48 and 4541.56 in Blocks A, B, C, and D,
•respectively. In treated blocks (A and B.), 6.42-13.83 and 86.19-93.56% of
the total number mite-days were accumulated in the November-
December and January-February periods, respectively, with the highest
percentage (81.58-82.20%) occurring in January. In untreated blocks (C
and D), 1.70-20.84 and 79.16-98.29% were accumulated in the November-
December and January-February periods, respectively, with the highest
percentage (55.19-57.60%) occurring in February.

Ave. no:of mites/ Leaf
g
.§
Degree-days (>10'C) on each date
UI
Daily rainfall (mm.)
0 I -

Ave. no. of mites/leaf
Degree-days (>10'C) on each date
Daily rainfall (mm.)
f•J
"C8
0
t

78
Table 3.3. Mite-day accumulations of TSSM at active stages during 1990/91 growing season.
Cumulative mite-days of active stages per lea
No. miticide Block November December January February
Season application
Block A 0.36 3.50 49.21 6.80 59.85 1 Block B 0.00 25.38 149.46 8.45 183.48 ' 1 Block C 0.00 28.36 715.78 916.35 1660.48 0 Block D 0.36 20.48 190458 2616.15 4541.56 0
The plots of cumulative mite-days at the various stages in time are
presented in Fig. 3.12. Cumulative mite-days for the total population are
also shown at the top of the graph. During the first six weeks of the study,
the cumulative mite-days for the total mites in each block were less than
100. However, mite populations had increased to 219.83, 530.88, 4116.11,
and 9598.39 mite days for Blocks A, 13, C, and D, respectively,it the end of
the study. From these values, the percentage of cumulative mite-days
(percent) in treated blocks ranged from 65.44 to 72.77 for eggs, 22.38 to
30.68 for immatures, 0 to 2.3 for adult males and 3.45 to 4.85 for adult
females. In the untreated blocks the percentage varied from 52.68 to 59.66
for eggs, 28.82 to 34.44 for immatures, 5.80 to 8.46 for males and 4.42 to 5.72
for females. Obviously, mite day accumulation levels for eggs were
highest in all blocks, followed by inunattires. Although mites at the adult
stage were found at relatively low levels, the female adult was the
dominant factor in population recovery from miticides of the mite
population, and they continued to deposit eggs later. Adult male mites
were at low to almost non-existent levels on treated hops, especially in
Block A. Meanwhile, they were found to be relatively abundant several
times in the untreated plot throughout the study period. Thus, the males
were very, sensitive to miticide and were not able to survive under
chemical spraying.

• • • •
_ •
10 11 12 13 14 15 16
• 50- E
tO • en • e..4
en to en CS:
1-• Cs1
en CO In M en
Ci C S 0
mt. Lel sá sc
▪
i •o ,0
,
•
200 > Block A
150 -
• Ice- —0_-- >
Females Males Irmnatures Eggs
Cumulative mite-days
sO 02 43 .0 42 ...
01 0 Os CC er er.: .-• ttl .-. NI 72 cri Ci el; Pi ( N("4 46
Cs. NI en a .i. ....
en in 0 4 2 enen
oo
c4
>,70 2300 Blcdc C •zauo
1500 - a)
1000 -
E
•
500
a
11■•
10 11 12 13 14 13 16
•••••
mr -
5 6 7 8 9 10 11 12 13 14 13 16
Time (weekly intervals frcrn 21 Nov. 1990)
6000
5000 -
4000 -
3000 -
2000
1000
0
79
Fig. 3.12. Seasonal accumulation of mite-days in each block during the 1990/91 growing
season.
Total cumulative mite-days
c73 400 >. 303. Bled: B
• 200 -
5.
•
100-
ci-
E
a .?
X in en •
• en s-C en .t to
g
q tij to .6 •• ecir V' -0 en
..4; (.
▪
4 ,,— en •
▪
see
I 2 3 4

80
• Relationships between mite-days per week obtained from the
mean number of total mites per leaf and those obtained from the mean
numbers of mites in various stages per leaf are shown in Fig. 3.13. There
was a significant linear regression of the mite-days of total mites on that
of females [r2 = 0.705; Fig. 3.13(1)1. When the raw data was transformed by
log (X+1), the coefficient of determination was increased to 0.874 [Fig.
3.14(1)]. Similar results were also obtained for the regression of the total
mite-days on the mite-days of eggs with the coefficient of determination
ranging from 0.945 to 0.988 for untransformed data [Fig. 3.13(W)] and
transformed data [Fig. 3.14(1V)], respectively. For males and irnmatures,
the relationships between untransformed data, as shown in Fig. 3.13(11)
and 3.13(111), were highly significant (r2 = 0.834 and 0.954, respectively), as
the coefficients of determination of transformed data were reduced [(r2 =
0.671) for males [Fig. 3.14(11)] and (r2 = 0.853) for immatures [Fig. 3.14(III)]).
It was noted that females and eggs were the stages most commonly found
in mite populations throughout the study period. This was confirmed by
data points on the y-axis representing the relationships between
transformed mite-days of total populations and those of females [Fig.
3.14(1)) and eggs (Fig. 3.14(11)] being fewer than the data points
representing the relationships between the transformed mite-days of total
populations and those of males [Fig. 3.14(111)] and immatures [Fig.
3.14(W)]. However, eggs are not the destructive stage. For this reason,
adult females could be the most appropiate group for estimating mite-
days of total mite population.
Linear regression models describing the relationship between the
numbers of all stages of mites and numbers of adult female mites for
actual untransformed numbers of mites per leaf and mite-days per leaf
had coefficients of determination (r2) ranging from 0.498 to 0.813,
respectively, as compared with the range 'Of 0.606-0.924 for the

I- WO 200 300 400 500 600 Mite-days d imrnatures
250 500 730 Mite-days of eggs
1000
Fig. 3.13. Linear regressions of mite-days obtained from total numbers of mites (Y) on those obtained from numbers of mites in various stages (X) during the 1990/91 season.
Fig. 3.14. Linear regressions of transformed mite-days obtained from total numbers of mites (Y) on those obtained from numbers of mites in various stages (X) during the 1990/91 season.
1 2 Log (mite-days Cl fernales+1)
0 • . 1 2. 3 Log (mite-days d irnmalures+1)
1 2 Log (mite-days cf malesi-1)
1 2 Log (mite-days Cl eggs+1)
81
150 50 100 Mite-days of fesnales
200 50 100 150 Mite-days d maks
1500
g410130
-g 500 8
1500
1000 -
t
.1g 500 -
.1
y = 14576x + 90.400 rA2=0.705, p < 001
C

82
transformed data (Fig. 3.15 and 3.16). In addition, the relationships
between numbers of adult females at time t and total mite numbers at
time f+1 in terms of both actual untransformed numbers of mites per leaf .„ per week and mite-days per week are presented in Fig. 3.17A and 3.18A,
respectively. Each of the relationships were obtained from the data
collected in Block D at weekly interval. The reason for using Block D was
mentioned previously. Significant linear regressions were obtained
between these variables (r2 = 0.578 and 0.757 for actual numbers of mites
and mite-days, respectively). When the data was transformed by log
(X+1), the coefficients of determination for actual numbers of mites (Fig.
3.17B) and mite-days (Fig. 3.18B) were increased to 0.755 and 0.833,
respectively. However, these coefficients decreased for the relationships
between the adult females at time t and the total mites at time t+2, i.e. r 2 = 0.359, 0.675, 0.582, and 0.670 for actual numbers, mite-days, transformed
actual numbers and transformed mite-days, respectively (Fig. 3.19 and
3.20). Hence, it would seem reasonable to use the numbers of adult
female at time t as a predictor of total mite populations in future studies,
particularly those at time t+1.
Highly significant differences in surface areas and dry weights of
hop leaves among blocks with different levels of mite incidence were
found (p < 0.01, Fig. 3.21). There were significant differences in mean
surface areas and dry weights of foliage between the heavily attacked area
(Block D) and treated areas, i.e. Blocks A and B (p <0.05). The foliage
from the moderate to highly attacked area (Block C), had a mean dry
weight significantly lower than that from Block A only, whereas the
surface area of the foliage was significantly smaller than that from Blocks
A and B (p < 0.05). These results indicated foliage injury of hops with
uncontrolled mite populations compared to hops on which nearly
complete control of mites had been obtained.

1 Log (females at 0
10 20 Females/leaf at t
30
300 3
A. for actual data 2000
S 1500-
.2 loco- °
soo-
B. for transformed data 4
.g 3'
bo 3
.
• I • I • 0 . / 1 200 0 1 2
Log (mite-days for females at t) 3 50 100 150
Mite-days for females at t
Fig. 3.15. Linear regression of total numbers of mites per leaf at time t (Y) on numbers of females per leaf at time t (X).
A. for actual data B. for transformed data
Fig. 3.16. Linear regression of mite-days obtained from total numbers of mites per leaf at time t (Y) on those obtained from numbers of females per leaf at time t (X).
83

0 I
2 4 6 8 Females/leaf at t
A. for actual data
0 I I I I I - 0.0 0.2 0.4 0.6 0.8 1.0 12
Log (females + 1) at t
0
10
B. for transformed data
3
A. for actual data
Fig. 3.17. Linear regression of total numbers of mites per leaf at time t+1 (Y) on numbers of females per leaf at time t 00.
84
Fig. 3.18. Linear regression of mite-days obtained from total numbers of Mites per leaf at time t+1 (Y) on those obtained from numbers of females per leaf at time t (X)
0 10 20 30 40 50 Mite-days for females/leaf at t
2
B. for transformed data
4 •-•
6 3
a I. 2
>, • ea
1 ;
to • 3
o 60 0 1
Log (mite-days for females+1) at t

B. for transformed data A. for actual data
Fig. 3.19. Linear regression of total numbers of mites per leaf at time t+2 (Y) on numbers of females per leaf at time t (X).
1.2 0 I I I I
10 0.0 02 0.4 0.6 0.8 1.0 Log (females+1) at t
/4 /6 g Females/leaf at t
0
• Fig. 3.20. Linear regression of mite-days obtained from total numbers of mites per leaf at time t+2 (Y) on those from numbers of females per leaf at time t (X).
A. for actual data
Cl ..t
'1 150
B. for transformed data
csi 4
.1
0
-g 100 2 - 15 oL*
a
0 10 20 30 40 50 60 Mite-days for females/leaf at t
0 1 2 Log (mite-days for females+1) at t
85

21:10 A
• a . 413
p=0.0001" PLSD=8.89
0.0 1 I 1 I I 1 2 3 4 . 5
Time (weekly intervals from 7/2/91)
86
Fig. 3.21. Differences in average leaf area (A) and dry weight (B) of hops among blocks at various time intervals during the 1990/91 growing season. (Significance indicated by different letters).
0 1 2 3 4 5
Time (weekly intervals from 7/2/91)
Block A Block E *Block C Block C
The relationship between the average surface areas of foliage and
the cumulative mite-days in each block, as shown in Fig. 3.22A, clearly
indicates that the regression of leaf surface areas against cumulative mite-
days was highly significant (p < 0.01). The blocks with high cumulative
mite-days had smaller leaf surface areas than those with low cumulative
mite-days. A similar result was also obtained for the dry weights of
foliage (Fig. 3.22B).

ao 1 r i I 1 I 2500 5000 7500 10000 0 2500 5000 7500 10000
Cumulative mite-days (CMD) Cumulative mite-days (DAD)
87
Fig. 3.22. Linear regressions of surface areas and dry weights of leaves (Y) on cumulative mite-days in each block (X) during the 1990/91 growing season.
3332 Growing season 1991/92 The seasonal accumulation of
mite-days in each block is presented in Fig 3.23. From this figure, it was
found that the cumulative mite-days of total mite populations during
this season were 24150, 243t80, 15590.15, and 22816.70 mite-days for
Blocks A, B, C, and D, respectively. Eggs converted to mite-days ranged
from 58.30 to 83.30% of total mite-days; immatures ranged from 13.60 to
23.80%; males ranged from 0.01 to 1110%; and females ranged from 2.20
to 6.80%. Again, linear regressions of total mite populations on mites at
each stage in terms of both actual mite-days and tranformed mite-days
revealed that females and eggs were the stages most commonly found in
the mite population (Fig. 3.24 and 3.25).

2
25
Block A
Tctal cumulative mite-days = n .
CNI .-• 0.1
Cumulative mite• days
125-
1
—1:1— Females Males
—0-- Irnrnatures — A-- Eggs
ci 2 3 8
88
Fig. 3.23. Seasonal accumulation of mite-days in each block during the 199l/92 growing
season.
•cr
15000
03
•
Block C
10300 E
5000
8'
>.
6
e
ni 3 E
150G0
tr: Lf, X
•tri X cr: . N In .•0 •tr
• • 1-• Cti C•4 fel f•1
10000-
5000-
cdc D
I
3 4 5 6 7
Time (biweekly intervals fran 14 Nov. 1991)
9
EC"

y = 0.913x + 1.649
02= 0473p< 0.01
y = 1.177x + 0.946
02= 0.849 p < 0.01
30 1 2 3 Log (mite-days of males+1)
4 1 • 2 Log (mite-days of females+1)
• •
•
Log (mite-days of eggs+1) . 1 2 3 40 1 2 3
Log (mite-days ci immatures+1)
Fig:3.24. Linear regressions of mite-days obtained from total numbers of mites (Y) on those
obtained from numbers of mites in various stages (X) during the 1991/92 season.
500 1000 Mite-days of males
1300
- Mite-days cl eggs Mite-days of immatures
100130
7500-
g. 8 5000-
! 2500-
1
17.0 5000
2500
200 4;30 6413
Mite-days of females
y = 3.671x + 454: T/7
02= 0.852 p < 0.01
y = 5.608x +1019.113
rA2= 0343 p< CLO1
KO 0
500 1000 1500 2000 2500 0 1000 2000 3000 41300 5000 6000
•
•
y= I.473x - 24.730
02= 0.899p < 0.01
Fig. 3.25. Linear regressions of transformed mite-days obtained from total numbers of mites
(Y) on those obtained from numbers of mites in various stages.(X) during the 1991/92 season.
4
3-
2- •
oco °
0
a
e0
y = 0.869x + 1.069 rA2= 0.789 p < 0.01
1
0
89

90
There were no significant differences in the surface areas and dry
weights of leaves among blocks during this season (Fig 3.26). The
number of cumulative mite-days was again significantly related to the
surface areas and dry weight of leaves (r2 = 0.942 and 0.996, respectively,
Fig. 3.27).
Fig. 3.26. Differences in average leaf area (A) and dry weight (B) of hops among blocks at various time intervals during the 1991/92 growing season.
25 1.5
, g I 1 - 5r 150
5tt tb
•a
763 ia .5 8 . 3
'4 100 cra t as-
0
I 2 3 4 5 6 7 8 9
Time (biweekly intervals frcrn 14/11/92)
III 1 2 3 4 5 6 7 8 9
Time (biweekly intervals frcm 14/11/92)
Fig. 3.27. Linear regressions of surface areas and dry weights of leaves (Y) on cumulative mite-days in each block (X) during the 1991/92 growing season. 2e0 1.5
y= -0.060007x + 0.916 r = 0.996
i i i a 1 1 t i 0
0 5000 10000 15000 20000 25000 0 5000 10000 15000 20000 25000
Cumulative mite-clays (CMD) Cumulative mite-days (CMD)

91
3.3.3.3. Growing season 1992/93 The pattern of cumulative mite-
days in all blocks was similar to that in the previous season (Fig. 3.28).
Populations of all stages of TSSM in each block failed to develop after the
miticide application and the mean population level stabilized over the
remainder of the season. Regression analyses of total mite-days on mite-
days - for each stage were similar to those mentioned earlier (Fig. 3.29 and
3.30).
According to the leaf area data in the 1990/91 season, the product of
leaf length and width at the widest point was found to correlate
, significantly with the surface area of leaves (p < 0.01; Fig. 3.31). A linear
regression model was obtained and subsequently used to estimate leaf
areas in this study.
Statistical analyses of the surface areas and dry weights of leaves
collected from the fourth node of the plants during the early season
revealed that average surface areas and dry weights of =infested hop
•leaves did not differ significantly between blocks (p > 0.05; Fig. 3.32).
No significant differences in surface areas and dry weights of 1.8-m
mainstem leaves among these blocks were detected when the data was
pooled over the season (Fig. 3.33A and B). There was a significant linear
regression of the surface areas and dry weights of leaves on the
cumulative mite-days (r2 = 0.895 and 0.738, respectively; Fig. 3.34).
Fig. 3.35 shows the cumulative mite-days recorded for each block
•over the 3-year study. In the first year, mite populations, the smallest
being on treated hops in Block A and the largest on untreated hops in
Block D, are dearly illustrated in this figure. The boundary areas, i.e.
Block B and C, showed intermediate situations. In the second year,
during the early part of the season mites accumulated most quickly in
Block C followed by Block D. After mitiddes were applied, almost no
increase in mite populations was observed in all blocks and especially in •

4 8 9 6 7
• 6 8 9
1500
Blodc C
;
92
Fig. 3.28. Seasonal accumulation of mite-days in each block during the 1992/93 growing
season.
Total cumulative mite-days o o = en = o o o '-"--• cri n: r•:
10 , vl Block A >, mi Ts —0-- Fe males di
-...--"::>-•'—' Males -E a) 5-, ...-0. —.-. Irranatures - > i —6 — Eggs "5 E d
2500,
t 2000- Blcck D di
1500 a.1
1000
E 500-
0
tit LI': CNI
X CNI Cr .-- Cs ......
Cr
IL II Lt:
csi esa •- CN
Cr.
3 4 5 6 7 Time (biweekly intervals from 4 Nov. 1992)

2000
p.100
•13
0
2000
15013 -
t • 1g 1000
500 -
100 150 200 250 Mite-days of females
y = 3.260x + 44.854 rA2= 0.985 p < 0.01
4
30 • 1 2 Log (mite-days cf males+1)
•-
r2 0.998 yA= 1.075x p<0. + 0.0020i
1 2 , te-days cf fema1es+1)
3
y= 1.214x + 0.508 02= 0.977p < 0.01
0
4Log (
3-
20
1
° o 8
y = 0.9136x +.0.848
TA2= 0.838 p <0.01
•
4 y = 20.734x +97.450
•
rA2= 0.921 p < 0.131
25 50 A -too 11,5 te-days cf males
a z /
rig= 0.990p < 0.01 y = 1.847x -24.991
93
Fig. 3.29. Linear regressions of mite-days obtained from total numbers of mites (Y) on those obtained from numbers of mites in various stages (X) during the 1992/93 season.
J i l l 100 200 300 400 500 600 0
250 5013 750 1000 1250
Mite-days cf immature;
Mite-days cf eggs
Fig. 3.30. Linear regressions of transformed mite-days obtained from total numbers of mites (Y) on those obtained from numbers of mites in various stages (X) during the 1992/93 season.
0 1 2 30 I 2 3 Log (mite-days cf irranahires+1) Log (mite-days ci eggs-i-1)
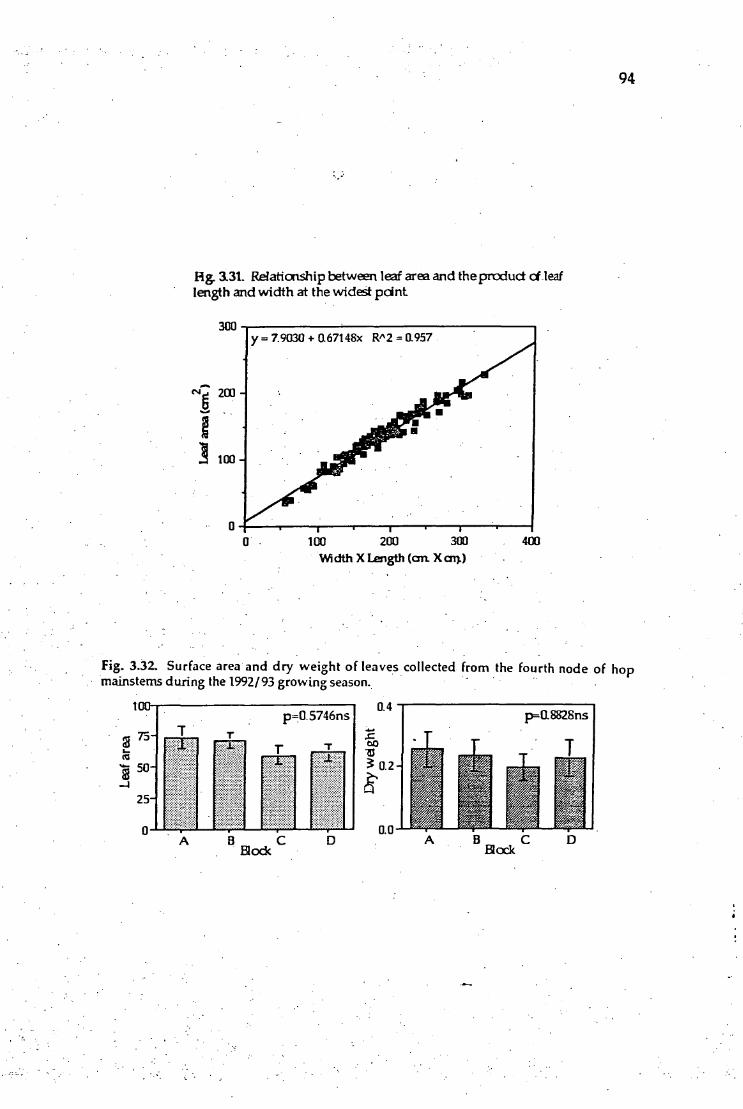
100 0.4 p=0.5746ns
to
0.2
0.0
Elod< c
Fig. 3.31 Relationship between leaf area and the prcduct cf leaf length and width at the widest point
100 200 300 Width X Length (an. X cn).)
Fig. 3.32. Surface area and dry weight of leaves collected from the fourth node of hop mainstems during the 1992/93 growing season.
94

250
200-
8 100-
131cck A
— 0-- Blcxk 8 Block C
Blcdc D
. I 1 I I I 1 2 3. 4 • 5 67 8 9 Time (biweekly from 4/11/92)
5
0
0.0
95
Fig. 3.33. Differences in average leaf area (A) and dry weight (B) among block at various time intervals during the 1992/93 growing season.
1 2 3 4 5 6 7 8 9 Time (biweekly frcrn 4/11/92)
Fig. 3.34. Linear regressions of surface area and dry weight of leaves (Y) on cumulative mite-days in each block (X) during the 1992/93 growing season.
200 1.0-
y = -0.00002x + a 861 r2= 0.738
0 1000 2000 3000 4000
1000 2000 3000 4000
Cumulative mite-days (CM D)
Cumulative mite-days (CMQ

(aks13) shP-alltu aArie Irani°
96

97
Block A. However, the mean population levels over the entire period in
treated blocks were higher than those of the first year, indicating that the
absence of chemical restraints in the 1990/91 season led to a severe
infestation of mites in the following year. In the final year, i.e. the
1992/93 season, the infestion of TSSM in all blocks was less than that of
the two previous year since mitiddes had been sprayed over the entire
area in the preceding year. This also indicates that an outbreak of TSSM
can occur despite the employment of intensive chemical control.
3.3.4. Spatial distribution Since the application of miticides in the
1991/92 and 1992/93 affected mite distribution in all blocks, only the data
from mite populations during 1990/91 growing season was employed.
Aggregation indices obtained from the variance-to-mean ratio and
Green's coefficient, Cx, were in general agreement (Table 3.4). The
populations of adult females in all blocks were uniformly distributed
between hop plants during early summer (19/12/90) and became
aggregated as the season progressed. After spraying with mitiddes, the
dispersion of the females in treated blocks (A and B) ranged again from
uniform to aggregated. For adult males, immatures and eggs, the
dispersion was found to be aggregated throughout the study period. In
each block, the average values of both indices were greater for eggs than
for the population as a whole. Hence, eggs were the most highly
aggregated stage. When all stages of mites were considered, their
distribution in each block, except Block B on 21 February, was aggregated.
Changes in the pattern of aggregation during the growing season
are presented in Fig. 3.36. Mite populations were most aggregated, i.e. Cx
was highest, during the early growing season when the number of TSSM
per leaf was lowest. The values of C x dropped sharply when mite
populations increased. This indicates that as the number of mite-infested
plants increased mite dispersion became more random.

Table 3.4. Distribution of TSSM in each block during 1990/91 growing season.
Date Block (n=20)
Variance-mean ratio Green's coefficient
Fe-nales Maks lmmatuxes Eggs Total Females Maks limmaiu.xes Eggs Total
19/12/90 A 0,95 13.75 14.70 -0.0526 - - 0.4555 0.4567 B 0.89 8.17 8.82 -0.0526 - - 0.3584 0.3402 C 0,98 11.41 12.32 -0.0025 - 0.1225 0.1231 D 0.95 - 17.65 18.60 .0.0526 - 0.4626 0.4630
26/12/90 A 0.95 - 22.20 23.13 -0.0526 - 0.4711 0.4709 • B 1.09 1.00 4.68 10.68 14,35 0.0175 0.0000 0.1752 0.1614 0.1500 C 1.05 20.04 21.04 0.0048 - 0.1002 0.0997 D 1.16 - 16.96 18.09 0.0175 - 0.1057 0.1061
2/1/91 A 1.52 8.55 19.90 24.95 0.2583 0.9438 0.2739 0.2957 B 2.36 14.52 16.50 22.87 0.2274 0.1852 0.0665 0.0697 C 432 24.88 79.18 8337 0.1276 0.1769 0.1367 0.1126 D 1,89 9.69 444.93 446.18 0.0740 0.2414 0.3974 0.3815
9/1/91 A 233 32.11 55.33 60.93 0.1388 0.3419 0.3313 0.2236 B 1.60 16.28 25.77 31.36 0.2982 - 0.3057 0.1720 0.1533 C 5.14 3.89 29.87 34.40 29.87 0.1534 0.3216 0.2139 0.0612 0.0788 D 6.05 20.04 39.01 32.8.5 60,29 0,0971 0.2139 0.0603 0.0447 0.0399
21/2/91 A 0,95 2.00 2.42 -0.0526 - - 1.0000 0.4737 B 0.95 - 0.95 -0.0526 - - -0.0526 C 1.78 4.76 31.44 23.73 55.53 0.0277 0.1214 0.1253 0.1697 0.1242 D 5.40 15.62 50.21 112.93 138.29 0.0531 0.0599 0.0530 0.1320 0.0652
7/3/91 A 1.79 - - 14.79 15.89 0.1579 - 0.1533 0.1551 B 1.05 1.00 2.39 14.75 13.61 0.0048 0.0000 0.1388 0.0854 0.0685 C 8.78 6.23 19.13 18.89 41.65 0.0695 0.0488 0.0366 0.0566 0.0393 D 79.98 61.30 227.34 489.19 799.00 0.1381 0,1256 0.1545 0.2777 0.1865

20
—gP 21/11 28/11 5/12 12/12 19/12 26/12 2/1 9/1 21/2 7/3
1990 1991 Date
Fig. 3.36. Relationship between Green coefficients and mite densities in each block.
J.. a

100
3.3.5. Vertical distribution
3.3.5.1. Growing season 1990/91 The within-plant distribution of
TSSM and their predators over three foliage heights of hops was
examined in Block D during the last week of sampling. As cart be seen
from Fig 3.37, the greatest percentages of TSSM in various stages and their
predators were found on upper leaves. Of the total number of mites from
sample leaves, 66.4% were recorded on upper leaves, 21.6% on middle
leaves, and 12.0% on lower leaves. This indicates that the mites moved
up the hop plants and concentrated on the upper portions of the host.
Over 60% of the total Stethorus spp. and predatory mite populations were
detected on upper leaves. On middle leaves, the percentage of Stethorus spp. was less than on lower leaves, whereas the percentage of predatory
mites was higher than on lower leaves. This result suggested a
competitive relationship between Stethorus spp and predatory mites,
particularly in an area with low-density prey populations.
According to the nonparametric Kruskal-Wallis test, the mean
number of eggs did not vary significantly among different foliage heights
(p > 0.05, Table 3.5). There were highly significant differences in mean
numbers of inunatures and adult females (p < 0.01) as well as significant
differences in adult males among different foliage heights (p < 0.05).
The average surface area and dry weight per leaf at each foliage
height is presented in Fig. 3.38. The lower leaves had the smallest surface
areas and dry weights. For upper leaves, the surface areas were larger
than those of middle leaves, whereas the dry weights were less than those
of middle leaves, indicating that the old-growth foliage from the middle
portion of the hop plant had a greater leaf biomass per unit area than the
younger growth from the upper portion.


: 21:13 50 um 150 2
Surface area per leaf (an)
00
'Cot Middle L
Laver L
0.3 1.0 1.5
thy weight per leaf (gm.)
.&"*.f,f4:2;1•14,2'4:7242::,
102
Table 3.5. Mean numbers cf mites per If among different foliage heights.
Foliage Stages
(Meansf-SE) heights (n=16) Eggs
(p=0.0565ns) Ernmatures (F0.0003)
Adult males (p=0.03231
Adult females (p=0. pair
Upper (>3m) 99.44 + 35.44 44.06 + 15.44 6.81 + 259 4.50 + 1.12
Middle (2-3m.) 31.25 + 7.79 14.75 + 2.91 294 + 0.92 1.50 + 0.66
Lower (0-2m.) 17.37 + 7.36 a25±3.14 1.50+035 WI + 0.21
Fig. 3.38. Average surface area and dry weight of leaves at each foliage height.
• The densities of mites of various stages, expressed as the mean
numbers of mites/cm.2, are presented in Table 3.6. These results were
obtained using the same statistical procedure as was used to analyse the
mean number of mites per leaf (Table 3.5). The mean numbers of eggs
and adult males per unit area did not differ significantly among different
foliage heights (p > 0.05). There were highly significant differences in
immatures and adult females among different foliage heights (p < 0.01).
Similar results were found when the densities of eggs, immatures and
adult mites were expressed as mean numbers of mites per gram leaf
biomass (Table 3.7).

103
Table. 3.6. Mean numbers of mites per cm2 among different foliage heights.
• Stages Foliage (Means+S.E.) heights (n=16) Eggs Immatures Adult males Adult females
• (p4.1053ns) (p.0.0007'1 (p=0.0997ns) (p=0.0012")
Upper (>3m.) 0.536 + 0.191 0.238 + 0.083 0.037 + 0.014 0.024 + 0.006
Middle (2-3m.) 0.169 + 0.042 0.080 + 0.016 0.016 + 0.005 0.008 + 0.004
Lower (0-2m.) 0.107 + 0.045 0.051 + 0.019 0.009 + 0.002 0.005 + 0.001
Table. 3.7. Mean numbers of mites per gram among different foliage heights.
Stages Foliage (Means+S.E.) heights . (n=16) • Eggs Inunatures Adult males Adult females
(p4.1189ns) (p=0.00131 (p=0.0589ns) (p.0.0004**)
Upper (>3m.) 73.33 + 26.14 32.49 + 11.39 5.02k 1.91 3.32 + 0.83
Middle (2-3m.) 21.48 + 5.35 10.14 + 2.00 2.02 + 0.63 1.03 + 0.45
Lower (0-2m.) 15.84 + 6.71 7.52 + 2.86 1.37 + 0.32 0.74 + 0.19
A one-way analysis of variance with Fisher's protected least
significant difference test (PLSD) was subsequently used to separate means
of mite densities in each foliage stratum. Since the slope (b) values of the
regression equations of log variance versus log mean values in each
comparison (as shown in Fig. 3.39) are more than 1, the log (x+1)
transformation of data was employed in the analyses (Southwood, 1978).

104
Fig. 3.39. Relationship of log variance to log mean values of mites between different
foliage heights.
8
0 1 2-3 -2 - 1 0- 1,
0 1 2 log mean (no./leaf) log mean (no./ art)
log mean (na /gm)
From Table 3.8 it can be seen that the differences in the
transformed mean numbers of mites per leaf among different foliage
heights agree with the results obtained from the nonparametric
procedure for untransformed data, except that significant differences i n
eggs densities were detected (p < 0.05). It was also evident that the
numbers of eggs, immature and adult mites on upper leaves were
significantly higher than on lower leaves. Additionally, there were
significant differences between the density of immatures on middle and
upper leaves, adult females on middle and upper leaves, and immatures
on lower and middle leaves.
Table 3.8. 13fferences in mite densities per leaf between different fdiage heights.
Stages
Fd i a ge (Log mean (x+1)+SE)
heights
(n=16) Eggs lmmatures Adult males Adult females
(10.0372') 43=0.0001") (p=0.0188*) (1:0.0001)
Upper (>3m) 1.47+ 0.20b 1.43 +0.11c 0.68 +0.1123 0.64 +0.07b
!Addle (2-3m.) 1.21 + 0.15ab 1.08 ±0.09b 0.45 + 0.09ab 0.26 + 0.08a
Lower (0-2m.) 0.83 + a 16a 0.70 + 0.12a 0.33 + 0.07a 0.21 +0.05a
Means fcilowed by same letter not significantly different at alpha =1105 (PLSD)
J.- •

105
Analyses of variance using transformed mean numbers of mites
per cm.2 indicated that there were significant differences in eggs and
immatures among different foliage heights (p < 0.05, Table 3.9). Highly
significant differences were found in adult female densities (p < 0.01).
The mean numbers of adult males did not differ significantly among
different foliage heights (p > 0.05). However, significant differences in
adult males were apparent between lower and upper leaves. For eggs,
immatures and adult females, the mean numbers of mites on upper
leaves were significantly higher than on both lower and middle leaves.
Table. 3.9. Differences in mite densities per all between different foliage heights.
Stages Foliage (Log mean (x+D±S.E.) heights (n=16)• Eggs Immatures Adult males Adult females
(p=0.02831 (p=0.0105*) (p4.0676ns) (p=0.0035")
Upper (>31n.) 0.147 + 0.045b 0.082 + 0.023b 0.015 + 0.005b 0.010 + 0.003b
Middle (2-3m.) 0.064 + 0.015a 0.033 + 0.006a 0.007 + 0.002ab 0.003 + 0.002a
Lower (0-2m.) 0.040 + 0.015a 0.020 + 0.007a 0.004 + 0.001a 0.002 + 0.001a
Means followed by same letter not significantly different at alpha = 0.05 (PLSD)
For transformed mean numbers of mites per gram leaf biomass,
there were highly significant differences in numbers of immature and
adult female mites/gm. among different" foliage heights (p < 0.01, Table
3.10). Significant differences in adult males were detected also(p < 0.05).
The mean numbers of eggs did not differ significantly (p > 0.05).
Significant differences in eggs and adult males were apparent between
lower and upper . leaves. For immatures and adult females, the mean
numbers of mites on upper leaves were significantly higher than on both
lower and middle leaves.

106
Table. 3.10. Differences in mite densities per gram between different foliage heights.
Stages Foliage (Log mean (x+1)+S.E.) heights (n=16) Eggs Immatures Adult males Adult females
(p4.0699ns) (p=0.0004) (p=0.0358") (p—A.0002")
Upper (>3m.) 1360 ±0.192b 1.302 + 0.105b 0.59 + 0.094b 0344 + 0.0686
Middle (2-3m.) 1.080 + 0.144ab 0.935 + 0.083a 0.37 + 0.077ab 0.212 + 0.066a
Lower (0-2m.) 0.801 ±0.159a 0.671 + 0.121a 0.31 + 0.062a 0.201 + 0.049a
Means followed by same letter not significantly different at alpha = 0.05 (PLSD)
Even though the data was analysed in different ways, the results
for adult females remained consistent, indicating that this stage provided
the most accurate estimater for statistical analyses.
When the same statistical procedures were repeated with the mean
numbers of total mites and their predators, it was found that the vertical
distribution patterns of total TSSM were more similar to those of the
corresponding densities of predatory mites than those of Stethorus spp.
(Fig.3.40). For example, there were significant differences in population
densities of TSSM and predatory mites between lower and upper leaves,
whereas no significant differences in the densities of Stethorus spp. between lower and upper leaves were detected.
3.3.5.2. Growing season 1991192 The within-plant distribution of
TSSM of various stages prior to the miticide application during this
season is presented in Fig. 3.41. During the first three occasions of
sampling, the majority of the mite population at each stage was on lower
leaves. On the fourth occasion, most of the males and immatures were
still detected on lower leaves, whereas the females and eggs were mostly
found on middle leaves. Because of the stripping of the lower leaves, no
leaves at this foliage height were collected during the remainder of the

Stethorus spp. Predatory mites TSSM
I p4.0618ns p=0.1067ns
mos 3sms
a rbi
0.3 p4.1052ns - PLSD=0.07
0.2.
p=0.0451* PLSD=0.124
rb
•:•:•:•:-
0.1
p=-0.1052ns PLSD=0.001
ab a
0
Lower, Middle Upper
Foliage heights
p0.0589ns PLSI34.108
0.1-
I I I I I I Lower Middle Upper Lower Middle Upper
Foliage heights Foliage heights
a
flab,
0.5-
p=0.0509ns
0.5-
13
0 0.00F
0 1
p4.088Ons
sr
300
200.
100
1.5
p=0.0139*
—
. i
pA.0965ns PLSD=0.054
p4.0481• p=0.1067ns
M
107
Fig. 3.40. Densities of TS.Sisif and its major predators at different plant foliage heights.

Ave. no. of Immatures per leaf
Ave. no. of females per leaf
IS
w en
A
11 i8 '41
014 ..■
E 0 4
n = rt.
, cm)
rp ri, p
A.
2
TB R a --. o
Ave. no of eggs per leaf
8
8
(will) saeal 9IPP!41 --4:3...
Ave. no. of males per leaf
8
8 8
a.

109
study. For the final two occasions of sampling, males and immatures
were most numerous on middle leaves, whereas the majority of females
and eggs were on upper leaves. This indicates that mites at each stage
were found on the lower leaves early in the season then progressed up
the plant as it grew, and that the migration of males and inunatures was
slower than that of females.
When the total number of mites of various stages were combined
together, similar patterns of upward movement were obtained (Fig. 3.421).
Mite populations on lower leaves comprised from 86.33 to 100% of the
total population during the first three occasions of sampling. On the
fourth occasion of sampling (26 December), the percentages of the total
population were 34.73, 56.22, and 9.05% for mites on the lower, middle
and upper leaves, respectively. This indicates that mites became less
abundant on lower leaves and the majority of mites were on middle
leaves by the end of December. As the plants continued to grow, TSSM
became more abundant on upper leaves; the percentage of mites on the
upper leaves was 49.27% on the fifth occasion of sampling (9 January),
whereas this had risen to 62.54% on the sixth occasion (23 January).
The frequency of mites at each foliage height was related to changes
in average surface areas and dry weights of leaves (Fig. 3.42 I, II, and III).
The majority of mites were found on lower leaves, when the foliage at
this height had the largest surface area and dry weights. Similar results
-were also obtained for middle and upper leaves. This indicated that leaf
size could be associated with the movement of mite populations.
The pattern of increase and dedine for the mite densities per unit
area and per unit dry weight in each stage between different foliage
heights is presented in Fig. 3.43 and 3.44. The density of females and eggs
on each foliage height increased during the first four occasions of
sampling followed by a rapid density decline, while the males and

• ... ...Nfiddleleaves (180 cm) Upper leaves (90cm. ) —Q---- Lower leaves (360 an.)
0.0 1 2 3 4 5 6 7 8 9 1 2 3 4 5 6 7 8 9
Time (biweekly intervals frcm 14/11/91) Time (biweekly intervals frcm 14/11/91)
(I) D Lower leaves (0.9m.)
El fvb ddle leaves (1.8m.)
Upper leaves (3.6m.)
' 2 • 3 4 5 Time (biweekly intervals fran 14/11/91)
110
Fig. 3.42. Average numbers of total mites per leaf (I) and surface areas (II) and dry weights (III) of leaves among different foliage heights during the 1991/92 growing season.

111
Fig. 3.43. Mean numbers of TSSM per cm.2 among different foliage heights during the 1991/92 growing season: (I) Females; (II) Males; (III) Inunatures; (IV) Eggs; and (V) Total mites.
2 3 4 5 Time (biweekly intervals from 14/11)91)

(IV) cEo
(I) —0— Lower leaves (0.9m)
-0— Middle leaves (1.8m) —0-- Upper leaves (3.6m)
60
0
ci
(10
25-
30-
112
Fig. 3.44. Mean numbers of TSSM per gram leaf biomass among different foliage heights during the 1991/92 growing season: (I) Females; (II) Males; (III) Inunatures; (IV) Eggs; and (V) Total mites.
2 3 4 5
6 lime (biweekly interv-als frcrn 14111/11)

113
immatures continually increased throughout the study. period. However,
females on middle height leaves were denser on the final occasion of
•sampling due to the reduction in leaf surface area For total mites, the
population density in each foliage height increased .until the fifth
orrasion of sampling and declined on the final occasion of sampling
This result indicates that the upward distribution of TSSM within hop,
plants, especially females and eggs, lowers the density of mites at the
lower heights and results in higher densities at the upper heights.
3.3.53. Growing season 1992/93 Early in the season, the mite
populations of all stages were relatively abundant on lower leaves in the
middle region of the plant, whereas oil upper leaves at the fourth node of
plants, populations were very low (Fig. 3.45). Obviously,, eggs were the
predominant stage in both foliage strata during this period
Fig. 3.45. Average mite densities in various stages on leaves from the fourth node and the middle region of hop plants in each block on the first and second sampling occasion during the 1992/93 season.
• .-.1
, I ,..■ „I r.: ,,,,I 1 ,,,I ,I __I __I .... 7 - . . . - . . . . . . . . . . . . . . .
•: r . 1 ; 1 Li Z 1. 3' Z 1 $ :Ci Ti Ti Id ti Ti ti 1:1
zz zz zz z< coo ca muc
U 0 < 0
BI ock Rositi on/Time (4 Nov. 92 and 18 Nov. 92)
v•-•
.tr

114
3.4. DISCUSSION
3.4.1. Seasonal abundance
This study demonstrated a generalised pattern of growth and
decline in TSSM populations on commercial hops during the growing
season. The normal pattern of population change on the 1.8-m
mainstem leaves, as shown in untreated areas, indicated that the mites
peaked after hops had formed the visible bases of inflorescences and
peaks were generally followed by a population decline due to mite
migration and plant maturity. For treated areas, an application of
miticides upset the normal pattern of infestation development; mites of
all stages were depleted. In both areas, the adult females observed at the
end of season began to change from the green summer form to the bright-
orange overwintering form in •response to seasonal changes, i.e.
daylength, temperature and plant quality. Among these variables,
daylength has been proved to be the major factor for the regulation of
diapause in TSSM (Veerman, 1985). In general, overwintering mites on
hops are produced when daylength is less than fourteen hours (Moreton,
1964). Thereafter, TSSM overwinters in the hollow cavities of hop twigs
in the litter around hop rootstocks (Cao, 1989) and the numbers of female
progeny from overwintered mites have an influence on seasonal
population development in the following season (Cone et al., 1986).
The relationship between TSSM population size and the
proportion of leaves infested in the untreated area showed that all the
leaves sampled at the height of 1.8 m. could be infested when the average
number of mites per leaf was more than 100. This relationship is a key to
the development of a monitoring program for TSSM on hops based on
presence-absence sampling, which has been developed effectively for
pests of cotton and brussels sprouts (Wilson and Room, 1983; Wilson et
al., 1983).

115
In the treated areas, it was found that 75SM continued to infest the
hop plants and were detected at low levels several times after the miticide
application. According to van de Vrie (1985b), there are two possible
sources of TSSM reinfestation; (1) reproduction of mites which escaped
control on the host plant and (2) mites from secondary host plants within
the area or in close proximity. Since TSSM has a wide range of host
plants, their reinfestation is related to other host plants. Cao (1989)
observed that overwintered 1SSM moved from thistle to nearby growing
hops during the early part of growing season.
In addition, the application of miticides is known to be one of
various factors affecting the abundance of spider mites (Huffaker et al.,
1969). The suppression of mite populations in treated areas over the 3-yr
study provides evidence to support this concept. The rniticide application
contributed to initial infestation levels of mites on treated and untreated
hops in the following season. The initial infestation largely determines
the potential for TSSM populations to develop early (Wilson and
Morton, 1993). For example, naturally-occurring populations of TSSM in
treated areas of the 1990/91 season were low in the early season of
1991/92, whereas those in untreated . areas were relatively abundant.
Similar results were obtained by Terauds (1989) who indicated that the
absence of chemical restraints for some growing seasons in apples caused
a large build-up of pests in the following season.
It is widely believed that the application of some pesticides
enhances the intrinsic power of increase of the mites, and may cause
outbreaks, regardless of the presence of mite predators (van de Vrie et al.,
1972). Carey (1982a) suggests that mite populations treated with pesticides
may attain a 1.4- to a 4.2- fold difference in population size compared to
an untreated population after 2 generations and a 1,300-fold potential
difference after 10 generations. Further, Mansour— (1990) observed that the

116
tetranychid mite populations were larger and the phytoseiid populations
smaller in sprayed apple orchards, whereas mite populations in
unsprayed orchards were very small. The results of the present study
indicate that the average numbers of predators were too small to
influence the population of TSSM on commercial hops. This appears to
be related to the application of miticides in the previous season.
Natural enemies found in all 3 yrs of the study were Stethorus spp.
and phytoseiid mites, ranging from 0.1 to 1.0 per leaf. Terauds (1989)
reported that Stethorus vagans and Stethorus nigripes were the most
important natural controls of pest mites in Tasmania. According to Cao
(1989), the effect of Stethorus spp. on TSSM populations in hop yards was
less significant than that of the native phytoseiid mite, Amblyseius
longispinosus Evans, which actively depleted TSSM in the early stages of
overwintering and in the spring immediately after overwintering.
However, the numbers of this phytoseiid mite were not sufficient to
suppress the subsequent build up of 15SM populations. In contrast, the
introduced phytoseiid mite, P. persimilis , has been proved to be effective
in controlling TSSM populations, but this predator cannot survive the
cold winter conditions of Tasmania.
In the present investigation it was also noted that variation in
damage of hop plants could affect mite populations reinfested after
spraying miticides. Heavily damaged plants became less suitable for
survival and oviposition, while slight damage resulted in the plants
being more suitable. This may be due to inducible resistance in hop
plants for mite infestations. The results from this study confirm the
earlier reports for several herbivore-plant associations (Karban and Carey,
1984; Hildebrand et al., 1986; Karban and Myers, 1989).
In addition, the results of this study indicated that eggs were the
predominant stage for most of the season, and that the stage-specific

117
percentages changed as the season progressed. Carey (1982a) proposed
that a stable stage distribution for TSSM is approximately 66% eggs, 26%
immatures and 8% adults and ! -Flat natural mite populations are often
quite close to this stable stage distribution. At the peak density of mite
populations in untreated areas during the 1990/91 season, the percentage
of eggs, immatures, and adult mites averaged approximately 60%, 27%.
and 13%, respectively, not too different from the distribution just
described.
The decrease in the proportion of eggs during the latter part of the
season was probably related to the lack of nutrients in the aging plant, a
factor in the induction of diapause. Trichilo and Leigh (1985) suggest that
the availability of leaf nutrients, as affected by plant age, may influence
mite population growth rates. Mitchell (1973) also reported that any
factors that affect leaf quality resulted in changes in TSSM egg production.
In addition to nutrients, Krainacker and Carey (1991) indicated that the
proportion of eggs in the mite population was positively correlated with
the proportion of females in an adult population in which the sex ratio
became less female biased as mite populations per plant increased.
The relatively high growth rates of TSSM populations on young
leaves, especially on young plants (Watson, 1964), suggests a species
capable of capitalizing on ephemeral respurces, such as hop plants. It has
been pointed out by Sabelis (1985a) that r m-selected tetranychid
populations eventually collapse because the life span of their host is
short, their host is overexploited, other hervivores competitively exclude
them, they are attacked by natural enemies or pathogens, or reduced by
inclement weather. In Tasmania, where both the pest and the host plant
are exotic species, there is no evidence that other herbivores, natural
enemies or pathogens are significant factors in limiting population

118
growth rates of these mites. This leaves host plant effects and inclement
weather as possible factors.
3.4.2. Climatic effects
The dynamics of mite populations on field hops may have been
influenced by climatic conditions, including temperature, humidity, rain,
light and wind. Very little precise information is available showing the
quantitative impact of climatic factors involved in population dynamics
of spider mites (van de Vrie et al., 1972). The present study addresses only
temperature and rain.
The results of this study indicated that mite populations increased
as the accumulation of heat units progressed; however the effects of other
seasonal factors, such as day length and declining nutrient status caused
population decline late in the season. Abundant rainfall during some
parts of the season could have been responsible for the retardation of
some mite infestations. It was also observed that mite populations
developed more quickly during the periods of little or no rainfall and
high temperatures.
Mite outbreaks are favoured by hot, dry weather (Neve ,1991); for
this reason, TSSM infestation is a serious problem of hop production in
Australia. Cao (1989) suggested that climatic factors play a very important
role in the development of both TSSM and hops due to the differences in
the initial development of mite populations and the growth of hop
plants. Kac (1963) studied the influence of temperature on the population
dynamics of TSSM on hops in former Yugoslavia and found that the
effects of high February temperatures on overwintering mites created the
potential for high-density populations during summer. Cold wet
weather possibly caused considerable mortality of overwintering mites
and greatly reduced any build-up in spring (Cranham, 1985).
Simpson and Connell (1973) analysed peipulation data for mites in
soybean fields over a seven-year period and found that low precipitation

119
was more highly correlated with mite densities than was high
temperature in the field. The effect of free water in retarding population
build-up has been reported by Fkrne (1968), and confirms common field
experience of the suppression of mite outbreaks by rainfall.
In general, heavy rains might be expected to create severe losses,
particularly in spider mites that inhabit the upper surfaces of leaves and
are not heavy webbers, and the effect may be intensified if heavy rains
occurred with turbulent wind, which would also tend to expose the lower
surface of the foliage (van de Vrie et al., 1972). TSSM usually feeds on the
lower surfaces of hop leaves (Neve, 1991) and constructs a complicated
web (Saito, 1985); for this reason, rains may have little influence on this
species. Linke (1953) reported that the beating force of rainfall on plant
leaves does not entirely explain the decrease in TSSM populations on
hops in Germany during rainy periods and that the webs protect TSSM
and entire colonies on hop leaves from being blown off by winds and
wetted by rains. In his experiments, rainfall was simulated by immersing
infested hop leaves in water for 2-4 hr daily. However, such a technique
seemingly does not simulate characteristics of rainfall which would cause
dislodgement from impact (Simpson and Connell, 1973). Klubertanz et
al. (1990) also demonstrated that precipitation applied with a rainfall
simulator was not found to significantly affect mite intensity in soybean
plots.
• Thermal degree-day (DD) summation has been widely used for
more than a century as a means of predicting time of harvest, and for
scheduling planting dates of crops (Wang, 1960). It is also utilized in
programs for disease and weed control, pest control, analysis of biological
control, and agricultural loss assessment (Worner, 1988).
3.4.3. Feeding damage

120
Feeding damage can be estimated by calculating the number of
mite-days (Hoy, 1985). It is generally recognized that mite-days, which
provide accurate estimates of the mean population level of mites over
the period of infestation of pest, are more useful than determining
whether numbers are greater or less than a practicular mean number of
mites per leaf (Jones, 1990).
The results of this study reveal the effect of different densities of
TSSM on hop foliage: the surface areas and dry weights of leaves in the
area with high seasonal mite-day accumulations were less than those in
the area with low seasonal mite-day accumulations. As reported earlier,
inverse relationships between cumulative mite-days and surface areas as
well as dry weights of leaves were detected in all three years of the study.
However, there were significant differences in surface areas and dry
weights of leaves between blocks only in the 1990/91 season, whereas
those in the 1991/92 and 1992/93 seasons did not differ significantly. This
may have resulted from early miticide applications which resulted in the
recovery of leaves during the latter part of the season.
Atlthough feeding damage in terms of relationships between
cumulative mite-days and yields has been examined on several crops,
including apples (Hoyt et al., 1979), strawberries (Oatman et al., 1981;
1982), almonds (Welter et al., 1984), red . raspberries (Raworth, 1989), and
hops (Cao, 1989), a detailed study of the impact on plant foliage, especially
on hop leaves has not yet been conducted. According to Peters and Berry
(1980a), mite-induced foliar damage weakens the hop plants, and feeding
injury on the cones reduces market value of the crop. Tomczyk and
Kropczynska (1985) suggested that changes in dry matter and leaf area of
plants may be observed as a consequence of plant injury caused by spider
mites. Reductions in leaf area associated with spider mite injury have
121
been reported for almonds (Summers and Stocking, 1972) and
peppermint leaves (DeAngelis et al., 1983a).
According to Unwin (171), TSSM causes significant damage to
foliage and reduction in yield on a wide variety of host plant. The mites
feed by rasping and piercing surface tissue of leaves (Davis, 1961;
Anonymous, 1965). Liesering (1960) found that, during feeding, TSSM
punctured and extracted the contents from 18-22 parenchymal and
palisade cells per minute. Mechanical injury and desiccation of the leaf
tissue is indicated by a characteristic leaf mottling, yellowing and
withering.. Symtoms will vary somewhat on different plants (Cant, 1960;
Fenner, 1962).
The increasing water stress caused by mite feeding may have a
effect on surface areas and dry weights of hop leaves. Water stress almost
immediately elicits a reduction in cell division and enlargement, the
basic growth processes (Kramer, 1983); for this reason, smaller plant and
plant parts result.
The effect of mite feeding damage may contribute to a reduction in •
the following year's crop. For instance, Lienk et al. (1956) found that a
64.8 percent reduction in apple yield occurred in the year following
infestation with TSSM and Metatetranychus u/mi.
The results of relationships between total mite numbers and
numbers of mites at each stage in terms of both 'mite-days and
transformed mite-days indicate that the estimate of the actual mite-days
of all stages of mites from only the mite-days of any stage results in
significant linear regression. However, it was noted that adult females
were found more commonly in total mite populations than were the
other destructive stages. For this reason, the numbers of mite-days for
the female stage alone may be more meaningful than those from the
other stages. In agricultural acarology, the female is the stage preferred

122
for counting because the adult female is the largest stage and the only
stage seen with the naked eye, and its proportion in the total population
is generally small (Cao, 1989). Furthermore, adult females are usually
used to estimate the population that contributes to leaf injury (De Angelis
et al., 1982) and the significant linear regression relationships between
this stage and total mite numbers have been found by Jones and Parrella
(1984) for Panonychus citri on lemons, Mollet and Sevacherian (1984) for
T. cinnabarinus on cotton, Perring et al. (1987) for T. urticae on cantalope
and Coa (1989) for T. urticae on hops. The results of this study also
indicate that feeding damage may be predicted using the relationship
between females at time t and total mites at time t+1 in terms of both the
number of mite-days and the original number of mites and that best
estimate of total damaging populations was obtained seven days after
female estimate.
3.4.4. Spatial distribution
The results from this study revealed changes in TSSM dispersion
patterns during the growing season. The populations of adult females
were uniformly distributed between hop plants during the early part of
the growing season and became aggregated as the season progressed. For
adult males, immatures and eggs, the dispersion was found to be
aggregated throughout the study period. Eggs were the most highly
aggregated stage. When the number of all stages of mites was considered,
the distribution was aggregated throughout the study period and this is in
agreement with the observations made by So (1991) for TSSM on roses.
Jones (1990) suggested that knowledge of the between-plant dispersion is
necessary to determine the number of plants per plot to sample.
According to Green's coefficient, mite dispersion became more
random as the number of mite, infested plants increased. The dispersion

123
of TSSM in this study was similar to what Pickett and Gilstrap (1986) and
Krainacker and Carey (1990) reported in spider mites infesting corn.
In this study, the impact of mitiddes on the distribution of TSSM
was also found and this is similar to the finding by Trumble (1985) that
insecticides created changes in the population dispersion of TSSM which
invalidated sampling plans based on data from untreated fields. A very
minor effect of miticides on TSSM populations infesting cotton was also
reported by Wilson and Morton (1993). However, this is in contrast to the
result from Mollet et al. (1984) who found no such effects for T.
cinnabarinus (Boisduval) on cotton.
3.4.5. Vertical distribution
The results from this study indicated that mites in each stage were
found on the lower leaves early in the season but then progressed up the
plant as it grew and that approximately 66% of total mite populations in
early March before harvest were detected on the upper leaves, whereas
only 12% of the total were found on the lower leaves. Similar results
were demonstrated by Sites and Cone (1985), who noted that TSSM were
primarily found on the lower half of the hop plants during the early
season and the majority of the mites were found on the upper half of the
plants in late season. Cao (1989) suggested that the within-plant
distribution patterns of TSSM on hops Kary with time and mite stage.
The vertical dispersal of TSSM was described by Foott (1964) and
Unwin (1971) as follows: in early spring, the Overwintering females seek
out oviposition sites on the new season's foliage and exhibit a negatively
geotactic orientation; following generations disperse throughout the
remainder of the plant; and in late summer, the diapausing generation
reacts positively geotactically and migrates downwards towards the lower
part of the plant and beyond. This is in agreement with the observation

124
made by Cao (1989) that the mites moved downwards along hop vines to
seek overwintering refuges in early to mid-March.
This study also found that the migrations of males and im .-natures
were slower than those of females and that the upward distribution of
TSSM, especially females and eggs, within hop plants shifted the
subsequent density of active mites from the lower to the upper foliage.
Mitchell (1973) demonstrated that TSSM females migrated before
movement of the other mobile life stages. Perring et al. (1987) found that
the distribution of eggs corresponded to location of the females on the
plant and TSSM females moved away from the area in response to
increasing mite density. However, intraplant-dispersal results from a
tendency for a portion of the pre-reproductive females to emigrate from
the leaf on which they developed, regardless of population density on
that leaf (Hussey and Parr, 1963). The positive phototactic response of
mites in the dispersal phase under conditions of high density and plant
damage also results in mites moving up the plant and concentrating •
around the periphery of their host (Kennedy and Smitley, 1985). Collins
and Margolies (1991) observed that TSSM females exhibited an aerial
dispersal posture that helped them become airborne, and allowed them to
disperse long distances under crowded conditions and deteriorating
resource quality. Boyle (1957) considered that TSSM is normally
disseminated by wind carriage at all life cycle stages under field
conditions. In terms of leaf age, TSSM tend to be more fecund on young
leaves (Henneberry, 1962; Watson, 1964; Oloumi-sadeghi et al., 1988).
Carey (1982b) suggested that the age of leaves on the mainstem are always
constant: all of the primary leaves below a particular node will be older,
and all above it younger. Spider mites have been reported to disperse
upward toward younger, presumably more nutritious leaves
(Hollingsworth and Berry, 1982; Rodriguez et al:, 1983). Changes in both

125
leaf microenvironment and food resources as mite infested plants age is
strongly involved in these mite behavioural changes (Rodriguez and
Rodriguez, 1987).
Furthermore, it was found that actual counts of adult females
provided accurate estimates for statistical analysis, although the data were
transformed when considering various types of mite densities. The
results indicated that significant differences in densities of adult females
between foliage heights were consistent, whereas those of the other stages
were intermediate.
In a more recent study, Krainacker and Carey (1990) related the
within-plant distribution of TSSM on field corn to sampling and reported
that early season sampling should focus solely on the number of females
on the lowest foliage while mid-season sampling should concentrate on
the foliage in the middle of the plant. This is similar to the results as
stated earlier.
This study provides an additional piece of evidence to support the
• concept which suggests that an understanding of the role of dispersal in
the population dynamics of TSSM will enhance the population
management of this agriculturally important mite species, allowing both
•more efficient and more effective management over the long term.

126
CHAPTER 4 DIFFERENCES IN SUSCEPTIBILITY OF
HOP GENOTYPES TO INFESTATIONS BY TSSM
4.1. INTRODUCTION
The increasing problems with strains of TSSM resistant to
chemical control in commercial hop yards have focused attention upon
non-chemical ways of controlling these phytophagous mites. According
to Trichilo and Leigh (1985), increased plant resistance to mites could
reduce the need for miticides and thereby result in slower development
of pesticide resistance in mites, less damage to natural enemies, reduced
levels of chemicals in the environment, and a more economically
produced crop.
Several attempts have been made in the past to assess hop
genotypes for resistance to TSSM. Mayberry (1968) observed that the
fecundity of TSSM was affected by different hop genotypes. Regev and
Cone (1975) indicated that hop varieties grown both in the field and in
the glasshouse differed in susceptibility to TSSM. Peters and Berry (1980a)
confirmed varietal differences in susceptibility to the mites under
glasshouse conditions and also obtained information indicating highly
significant differences in developmental rates of TSSM reared on
different hop varieties. Leszcynski et al. (1988) subsequently
demonstrated differences in intrinsic rafes of increase between mites on
different hop cultivars.
The purpose of the present study is two fold: to evalulate levels of
susceptibility and/or tolerance of a range of hop genotypes to TSSM
infestations, and to conduct preliminary studies on the mechanisms of
resistance involved.
4.2. MATERIALS AND METHODS

127
4.2.1. Artificial infestations
4.2.1.1. Sources of plant material: The rootstocks of 26 hop
genotypes, as shown in the following list, were selected from a collection
made by Australian Hop Marketers Pty Ltd.
No. Code Genotype Parent (F. * M.) 1 M1 A-86-21 Hallerian*Open
2 M2 AB-82-64 J78*Open
3 M3 B-86-13 YF-81-80*Open
4 M4 EG-86-23 YD-81-102*YM-81-22
5 M5 EP-86-20 YR-81-113*29/70/54
6 M6 EQ-86-30 YR-81-113*YD-81-50
7 M7 E-85-20 21055*Open
8 M8 G-87-60 J-83-46*Open
9 M9 J-83-5 YS-81-37*Open
10 M10 LA-85-68 J78*29/70/SH
11 Mll L-86-17 LQ-82-38*Open
12 M12 MD-86-11 96-76-44*28/68/65
13 M13 N-86-27 Al3-82-33*Open
14 M14 S-87-9 TA-84-50*Open
15 M15 TA-85-22 (4178)*64037M
16 M16 TB-82-5 (4178)*18/67/20
17 M17 TC-85-26 (4*J78)*29/70/54 18 M18. TD-85-35 (4178)*Y8-81-77
19 M19 TD-86-1 (4178)*YA-81-61 20 M20 TE-86-11 (4178)*YD-81-50 21 M21 TF-84-15 . (4*J78)*YM-81-22 22 M22 TG-86-19 (4178)*AF-81-148 23 M23 TH-86-10 (4*J78)*TC-81-12 24 M24 X-86-20 L-83-14*Open 25 M25 Aquila American cultivar 26 M26 Huller Bitterer German cultivar.
4.21.2. Mite culture: TSSM were reared on dwarf bean plants in an
isolated chamber maintained at' an average temperature of 25°C and a 16:8
(L:D) photoperiod.

128
4.2.1.3. Under glasshouse conditions: Two experiments were
conducted to investigate the effect of hop genotype on mite population
build-up.
In the first experiment (free choice), all 26 genotypes were planted
into pots aligned in a completely randomized pattern on a glasshouse
floor. Duplicate plants of each genotype were studied at an average
temperature of 25°C with natural lighting conditions. The study
commenced on October 9, 1990 when the hop plants were 45 days old.
Each plant was artificially infested with 10 adult female mites onto one of
its mature leaves. Six weeks after release, the number of all
developmental stages of mites except eggs on each of four leaves, two in
the middle region and two on the top of each plant, was counted on 4
occasions at weekly intervals. Damage caused to plants by mites was also
observed on the final occasion of sampling and plants were scored on a
scale of 1 to 5 where 1 = no leaf yellowing and 5 = leaves dry (after Al-
Abbasi and Weigle, 1982). In addition, size measurements of 10 each of
eggs, adult females, and adult males on the plants of each genotype were
made using an eyepiece micrometer.
In the second experiment (no choice), the hop rootstocks of the 26
genotypes kept in the cool room at 4°C were set out in the glasshouse to
grow on January 17, 1993. Five weeks later, two teneral female mites
from the culture were placed into and allowed to oviposit in a small
plastic leaf cage (Hughes et al., 1966) designed to provide some basic
requirements, i.e. having easy removable lids for observation, light
weight, good ventilation, convenient installation, ability to withstand
variable climate, and low cost. The materials used for making the cages
were: polyurethane foam, plastic tubing, pins, fine nylon mesh, Kwik
Grip adhesive, nail varnish, acetate sheet, and sponge. The cage body was
comprised of a 1 cm. section of tubing (ca. 1.8 cm. diam.) with one smooth

129
surface end and the other glued with a sponge strip. Two nails were
embedded in opposite sides of the tubing. The cage lid was made with a
disc of acetate sheet (ca. 2.3 cm. diam.) and in it a hole (ca. 1.0 cm. diam.) „- was drilled for ventilation. A fine nylon mesh was glued over the
ventilation hole using Kwik Grip adhesive. The acetate strips were cut to
form rings which were used to assist the lids to fit snugly to the cage
bodies. The backing plates were composed of polyurethane foam divided
into the same dimensions (3.0 X 3.0 x 0.6 cm. 3). The cages were affixed to
the underside of the fifth or sixth node (from the terminal) mainstem
leaf of plants by pushing the pins, coated with nail varnish to prevent
rust, through leaf tissue into the backing plates. Furthermore, pure
lanolin was applied to the inner surface of the cages to prevent mites
escaping from them. One week after release, the cages (including the
leaves) were removed from the plants and the number of mites of all
stages were counted under a binocular microscope (20X). This procedure
was repeated four times for each hop genotype.
In addition, the number of leaves on each plant, surface areas of
mature leaves, plant heights, numbers of tillers and lengths of the first
four internodes from terminal shoots were also recorded for each
genotype when the plant was six weeks old. The leaf surface area was
determined by using a linear regression model that estimates area from
measures of leaf length and width at the widest point: leaf area (cm.2) =
7.903 + 0.67148 (width x length) r2 = 0.957; n=93.
4.2.1.4. Under field conditions: An experimental plot was
established at Horticultural Research Centre, University of Tasmania.
Twelve hop genotypes were selected, based on the results of the first
experiment reported in 1.3 (free choice), to represent varying levels of
mite susceptibility from highly to slightly susceptible. The genotypes
studied were M2, M4, M9, M10, M11, M14, M15, M18, M21, M23, M25 and

130
M26. The rootstocks of these genotypes were planted on October 9, 1991,
in a randomized complete block design with six replications. Inter-row
and inter-plant spacing at 1.0 m. x 0.7 m. was employed. Two strings
supported from a 5-m. high trellis were tied down at each hill, and 2
vines were trained up each string. A total of 72 plants was used in the
experimental plot. Twelve weeks after planting, mite-infested bean
plants were placed uniformly among the experimental plants. Eleven
weeks later, four leaves, two upper (3.6 m.) and two middle (1.8 m.)
leaves on each plant, were collected at random and the number of all
stages of mites was counted. The leaf surface areas were also measured by
using a planimeter (Paton Electronic Planimeter, Paton Industries Pty
Ltd.). At the end of the season, the hop cones were harvested and the
numbers of cones as well as cone weights were determined for each
genotype. In the 1992/93 growing season, no naturally-occurring TSSM were
detected on hop plants in this experimental 'plot even though the hop
plants had reached the top of the trellis. Subsequently, the area was
divided into three equal parts designated blocks A, B, and C (Fig. 4.1).
Duplicated plants of the same genotype were grown in each block. All of
the hop plants in Block A were inoculated with TSSM on January 5, 1993,
whereas no mites were released in Blocks B and C. For this reason, hop
plants in Blocks A, B, and C were regarded as infested, boundary, and
uninfested plants, respectively. Inoculation was carried out by attaching
one bean leaf disc which contained 10 teneral female mites from the
culture to each plant. Eight weeks after release, two upper (3.6 m.) and
two middle (1.8 m.) leaves on each plant were collected at random and
the number of mites counted. The remaining steps of this procedure
were similar to those in the previous season.

Block A Block B Block C (Infested) (Boundary) (Uninfested)
Fig. 4.1. Layout of the experimental plot at Horticultural Research Centre.
131
4.2.2. Natural infestations
4.2.2.1. Under glasshouse conditions: Cuttings from hop plants, of
26 genotypes, used in the first experiment (free choice) of 1.3 were
propagated and grown from September 19, 1990. Duplicate plants were
used for each genotype. After 20 weeks, the young plants were removed
into the glasshouse in which TSSM populations had already been
established. Consequently, the plants became infested naturally with
TSSM from the glasshouse population. This technique was similar to
that used by Shanks and Barritt (1984). Twelve weeks later, the total
number of mites (except eggs) on each of the six leaves, three in the
middle region, and three on the top of each plant was counted. Surface
areas of leaves were measured using a planimeter. In addition, the
damage ratings of hop genotypes were also observed in a similar manner
to that described previously.
4.2.2.2. Under field conditions
4.2.2.2.1. Hop yard No. 1 at Bushy Park: In this hop yard, the
following genotypes were studied: MI, M2, M3, M4, M5, M6, M7, M8, M9,
MIO, M11, M12, M13, M14, M15, M16, M17, M18, M19, M20, M21, M22,
M23, and M24. Data on varietal differences in natural mite infestation
were monitored in the three growing seasons, i.e. 1990/91, 1991/92 and
1992/93.
4.2.2.2.1.1. Growing season 1990/91: The leaves were sampled at
weekly intervals from November 21, 1990 to February 27, 1991. One

132
mainstem leaf at a height of 1.8 m. was taken randomly from each plant
on each sampling date and a total of 4 leaves was collected for each
genotype. Leaf samples were examined under a binocular microscope
(20X) and the numbers of mite eggs, immatures and adults were
separately counted. This hop yard was sprayed with miticides in early
January, 1991.
4.2.2.2.1.2. Growing season 1991/92: The leaves were sampled at
fortnightly intervals from November 28, 1991 to March 5, 1992. As in the
previous growing season, 4 leaves were sampled at a height of 1.8 m.. In
addition, samples for each genotype on the final three sampling
occassions consisted of one leaf which was collected at a height of 3.6 m.
from the ground. Surface areas of mature leaves were measured using
the planimeter. Dry weights of leaves, plant heights and growth habits of
the above-ground parts of hop plants for each genotype were also
recorded and it appeared that no miticides were applied to the hop plants
throughout this season.
4.2.2.2.1.3. Growing season 1992/93: The leaves were sampled at
fortnightly intervals from November 4, 1992 to February 24, 1993. On the
first two occasions of sampling, sample leaves were collected at the fifth
node from the terminal shoot of hop plants. A total of 4 leaves was taken
from each genotype. The remaining steps of the procedure were similar
to those in 1990/91 growing season.
4.2.2.2.2. Hop yard No. 2 at Bushy Park: In hop yard No.2, the
cultivars M25 (Aquila) and M26 (Huller Bitterer) were studied. The
methods used were similar to those in hop yard No. 1, except that the
phytoseiid mites were released in 1990/91 season and the miticides were
applied in both 1991/92 and 1992/93 seasons.
4.2.3. Data analyses

133
All statistical analyses were carried out using Staview SE +
Graphics software on a Macintosh computer. A one-way analysis of
variance was used to detect differences in plant characteristics and mite
responses. Means were separated by least significant difference analysis
with an alpha level of 5%. A log (x+1) transformation was used when
necessary. Nonparametxic procedures were also performed using Mann-
Whitney U test for two group tests and the Kruskal-Wallis test for 3 or
more group tests. In addition, linear regressions were performed using
the procedure of the Cricketgraph computer program.
4.3. RESULTS
4.3.1. fluctuations of mite populations among hop genotypes
4.3.1.1 Artificial infestations under glasshouse conditions: The
mean number of mites per leaf on hop genotypes tested in the first
experiment (free choice) is presented in Table 4.1. Analysis of variance of
the transformed data showed highly significant (p < 0.01) differences
- among genotypes on the first, second, and fourth sampling date (Fig. 4.2).
It was apparent that M4 had consistently fewer mites whereas M26 had
consistently more mites on all sampling dates. Most of the other
genotypes were intermediate between the high and low levels exhibited
by these two genotypes. When the total number of mites counted on all 4
dates were considered together, highly significant differences (p < 0.01) in
mean numbers were also detected among hop genotypes (Fig. 4.3). This
clearly revealed that the least preferred genotype was M4, and the most
preferred was M26.
In addition, it was found that the mean egg sizes ranged from 0.14
to 0.15 mm., mean female sizes ranged from 0.36 to 0.60 ram., and mean
male sizes ranged from 0.24 to 0.36 mm.. No differences in the sizes of

134
eggs, adult males, and adult females were noted between different
genotypes.
Table 4.1. Mean numbers of mites on each genotype infested artificially under glasshouse conditions.
Genotype
Numbers of mites per leaf (mean + SE)
1st. sampling date
2nd. sampling date
3rd. sampling date
4th. sampling date
M1 48.25 ± 15.50 51.25 ± 10.74 130.75 ± 15.76 480.00 ± 96.08 hf2 146.50 ± 38.74 145.00 ± 37.53 242.00 ± 76.14 183.25 ±. 34.86 M3 57.75 ± 22.50 43.75 ± 10.59 215.25 ± 119.70 697.75 ± 285.57 M4 12.25 ± 8.34 31.25 ± 12.51 52.25 ± 27.29 14650 ± 72.99 M5 95.00 ± 68.26 151.00 ± 60.71 346.75± 163.24 1075.25 ± 264.75 M6 15.50 ± 7.86 70.00 ± 13.52 320.00 ± 141.86 69650± 208.05 lvf7 12250 ± 46.84 124.50± 24.03 124.75 ± 43.99 325.00 ± 179.16 M8 50.50 ± 37.81 115.00 ± 42.56 203.00± 42.44 438.00 ± 79.46 M9 55.00 ± 13.67 53.75 ± 26.86 62.50± 19.86 11650 ± 47_54 M10 33.50 ± 17.78 28.50 ± 12.82 172.00± 10833 443.50 ± 164.23 Mll 82.25 ± 37.62 75.75 .± 10.61 120.50 ± 111.51 400.00 ± 224.96 M12 23.25 ± 13.12 18.25 ± 2.90 264.50± 154.93 589.25 ± 18333 M13 84.73 ± 21.83 90.00 ± 31.85 149.25± 36.00 258.25 ± 49.18 M14 110.00 ± 44.38 113.75± 22.07 244.00± 78.59 48950 ± 23552 M15 35.00 ± 8.16 25.25 ± 3.64 71.73 ± 37.98 289.00 ± 139.78 M16 110.75 ± 55.86 198.75 ±137.64 258.50± 6133 529.50 ± 159.51 M17 126.75 ± 58.80 153.50 ± 44.93 78.25 ± 41.96 39.75 ± 11.90 M18 170.25 ± 65.37 128.50 ± 31.48 223.75 ± 102.82 433.25 ± 118.46 M19 105.75 ± 46.08 118.00 ± 52.70 170.75 ± 70.45 462.00 ± 146.63 M20 91.00 ± 28.88 181.75 ± 86.84 242.00 ± 104.13 355.50 ± 128.11 M21 176.50 ± 79.16 198.50 ± 69.58 346.75 ± 102.22 518.50 ± 135.60 M22 184.25 ±146.12 230.25 ± 56.97 155.25± 68.46 635.50 ± 153.97 M23 48.25 ± 17.86 41.50 ± 13.96 93.00± 18.63 7950± 9.91 M24 88.50 ± 25.71 127.00 ± 28.73 110.00± 18.27 211.75 ± 42.41 M25 148.50 ± 43.19 154.25 ± 57.98 207.00± 102.22 393.75 ± 141.64 M26 247.00 ± 46.78 414.75 ± 25.96 469.00 ± 63.22 1752.75± 28830
p-value 0.1060ns 0.0001** 0.1322ns 0.0001** PLSD 137.19 130.66 24151 450.21

135
Fig. 4.2. Comparison of transformed mean numbers of mites per leaf between different genotypes at different sampling time.
1 2 3 4 5 6 7 8 9 10 11 12 13 14 15 16 17 18 19 20 21 22 23 24 25 26 Genotype
• 1 Sampling 1 p=0.0068" (Fisher PLSD = 0.729)
M4M6M10M12M8M5M3M15M23M1M9M11M16M19M22M24M20M17M13M14M7M25M21M2M18M26
I Sampling 2 p=0.0001" (Fisher PLSD 0.523) Ml0M12M4M15M23M9M3M1M6M13M9M11M19M16M14M5M25M24M7M18M20M17M2M21N122M26
Sampling 3 1:0.0749ns • Ml1M4M15M9M17M10M23M22M7M24M19M1M13M25M3M6M5M18M12M20M2M14M8N116M21M26
• Sampling 4 p=0.0001" (Fisher PLSD = 0.545) M17M23M4M11M9M2M24M15M7M13M20M25M19M10M14M18M3M8M1M16M21M123422M6M5M26

136
Fig. 4.3. Total numbers of mites counted on each genotype in the first artificial infestation experiment under glasshouse conditions.
8
E-4
0 1 2 3 4 5 6 7 8 9 10 11 12 13 14 15 16 17 18 19 20 21 22 23 24 25 26
Genotype M4M23M9M17M15M24M13M10M11M7M1M2M8M19M20M12M25M18M14M3M16M6M22M21M5M26
In the second experiment (no choice), numbers of mites in leaf
cages did not differ significantly among genotypes (p > 0.05; Fig. 4.4). This
indicated that TSSM could survive equally on all genotypes used in these
studies. The average number of mites varied from 5.5 to 15.0 with M2
having the highest mean value.

137
Fig. 4.4. Mean numbers of mites on each genotype in the second artificial infestation experiment under glasshouse conditions.
Ave
rag e
total
mite
s per
cage
0 1 2 3 4 5 6 7 8 9 10 11 12 13 14 15 16 17 18 19 20 21 22 23 24 25 26 -
Genotype
4.3.1.2. Artificial infestations under field conditions: When twelve
genotypes selected from the first experiment in the glasshouse were
infested with mites from bean plants and evaluated in the field during
the 1991/92 growing season, there were highly significant differences in
mean numbeis of mites per cm. 2 among genotypes (Table 4.2). After 11
weeks, M26 had the highest mite density followed by M2. M4 had the
lowest density compared with other genotypes, which showed an
intermediate situation.

138
Table 4.2. Mean numbers of mites on each genotype grown at the Horticultural Research Centre.
Genotype
Susceptibility obtained from the results of glasshouse experiment
Average numbers of mites per crn2 (Mean + SE)
1991/92 1992/93 season season 1:0.0028** p=0.7616ns PLSD=0.65 PLSD=0.094
M4 M23 M9 M15 M10 Mll M2 M25 M18 M14 M21 M26
The least
The highest
0.055 ± 0.044 0.084 ± 0.073 0.582 + 0.531 0.213 ± 0.109 0.079 ± 0.045 0.167 ± 0.079 0.852 ± 0.351 0.077 ± 0.031 0.056 ± 0.016 0.098 + 0.045 0.217 ± 0.153 1.323 ± 0.418
0.059 ± 0.012 0.017 ± 0.006 0.026 ± 0.019 0.064 ± 0.013 0.061 ±0.042 0.078 ± 0.047 0.017 ± 0.012 0.007 ± 0.006 0.086 ± 0.076 0.056 ± 0.037 0.033 ± 0.025 0.019 ± 0.012
•
However, analysis of variance of the data for 1992/93 growing
season showed no significant differences (p > 0.05) in mean numbers of
mites per cm2 among hop genotypes infested with the same number of
mites on leaf, discs (Table 4.2). The mite number per cm2 varied from
0.007 to 0.086 per cm2 with M18 having the highest density.
4.3.1.3. Natural infestations under glasshouse conditions: Highly
significant differences (p <0.01) in mean numbers of mites per leaf were
found among hop genotypes infested naturally in the glasshouse (Table
4.3). M26 had the highest density compared to the other hop genotypes,
followed by M20. The least infested genotypes were M2, M4, M7, M8, M9,
M14, and M16. When the mite density was transformed to numbers of
mites per cm2, similar results were also obtained.

Table 4.3. Mean numbers of mites on each genotype infested naturally under glasshouse conditions.
Genotype Average number of mites per leaf (p=0.0062")
Average number of mites per c:d. (p=0.0003**)
M1 32.33 '1' 9.39 bcde 6.14 ± 1.79 ab M2 4.17± 1.64 a 0.84 ± 0.33 a M3 18.67± 8.68 abc 3.01 ± 1.40 ab M4 6.00± 2.49 a 0.82 ± 0.34 a M5 14.33± 839 abc 2.40 ± 1.40 ab M6 10.17± 3.74 abc 1.81 ± 0.67 ab M7 6.50± 2.63 a 1.19 ± 0.48 a M8 4.33± 2.01 a 0.80 ± 0.37 a M9 7.67± 3.95 a 1.38 ± 0.71 ab
M10 25.33 ±13.78 abed 5.11 ± 2.78 ab Mll 24.17± 8.52 abcd 3.92 ± 1.38 ab M12 17.83± 6.01 abc 3.22 ± 1.09 ab M13 8.00± 2.13 ab 2.35 ± 0.62 ab M14 4.50± 1.91 a ' 0.80 ± 0.34 a M15 22.50'1' 4.53 abcd 3.28 ± 0.66 ab M16 7.17± 2.46 a 157 ± 0.54 ab M17 12.67± 3.14 abc 2.53 ± 0.63 ab M18 13.33 ± 2.85 abc 2.16 ± 0.46 áb M19 20.17± 5.71 abcd 4.00 ± 1.13 ab M20 43.83'1'20.66 de 6.97 ± 3.29 be M21 23.50± 10.40 abed 5.18 ± 2.29 ab mn 33.17± 7.68 cde 5.27 ± 1.22 ab M23 18.50± 8.40 abc 430 ± 1.95 ab M24 11.00± 5.23 abc 1.83 ± 0.87 ab M25 12.83± 2.55 abc 2.62 ± 0.52 ab M26 53.17± 24.91 e 17.07 ± 8.00 c
Means with the same letter in a column are not significantly different (P>0.05) using Fisher PLSD.
4.3.1.4. Natural infestations under field conditions Two .
measurements were used to evaluate differences in susceptibility of hop
139

140
genotypes to TSSM. These were the average number of mites on upper
(3.6 m.) and middle (1.8 m.) leaves and the numbers of mites on leaves of
the same age.
In hop yard No.1, there were significant differences (p < 0.05) in
average numbers of mites per sq.cm on leaves at the two foliage heights
among hop genotypes on all sampling dates (Table 4.4). Among all
genotypes studied, M13 was found to have significantly higher mite
densities than the rest (p <0.05) on the first sampling date (February 2,
1992). There was no statistically significant difference in mite densities
among the genotypes studied after deletion of M13 (p > 0.05). On the
second and third sampling date (February 20, and March 5, 1992), it was
found that significant differences in mite densities between hop
genotypes had increased, indicating that mites showed a preference to
feed on some genoytypes. In terms of the total number of mites counted
on all three sampling dates, M13 had the highest mite density, followed
by M2, M7, and M12 with MI, M19, M4, M10, M16, M15, M17, and M24
recording the lowest number of mites. When mean numbers of mites
per cm.2 on leaves at the same age were used to evaluate for susceptibility
during 1992/93 season, Similar results were also obtained (Table 4.5). It
was found that M12 and M13 had significantly higher total mites counted
on both sampling dates than did the other genotypes. M2, M6 and M5
also had higher total mite counts. Nevertheless, total numbers of mites
on the remaining genotypes did not differ significantly from each other.
In hop yard No.2, a comparison of average numbers of mites on
the 2 foliage heights indicated that M25 had consistently fewer mite
densities than M26 during 1991/92 season (Fig. 4.5). This reveals that
mites showed a lower degree of preference for M25 than to M26.
However, no mites were detected on leaves at the fifth node below the
terminal shoot of both genotypes in the early seiion.

141
Table 4.4. Mean density of TSSM on leaves of 24 genotypes in hop yard
No.1 during 1991/92 season. (all leaves collected at 1.8 and 3.6 m. heights)
' Average number of mites per cm.2
Total Genotype 6/2/92 20/2/92 5/3/92
M1 0.000 a 0.015a . 0.014 a 0.029 a M2 0.111 a 0.852de 0.696 cd 1.659 i M3 0.270 a 0.223 abc 0.550 bat 1.042 fghi M4 0.000 a 0.050a 0.075 ab 0.124 abc M5 0.000 a 0.169 ab 0.495 abcd 0.665 bcdefg M6 0.063 a - 0.510bcd 0.612 cd 1.185 fghi
0.200 a 0.313 abcd 1.002d 1.515 hi M8 0.000 a 0.082a 0.737 bcd 0.819 cdefgh M9 0.150 a 0.233 abed 0.636 bat 1.019 efghi M10 0.000 a 0.036a 0.195 abc 0.231 abed Mll 0.034 a 0.278 abcd 0.299 abed 0.611 bcdefg M12 0.300 a 0.078a t156 d 1.535 ghi M13 2.172 b 1.062e 2.969 e 6.203 j M14 0.035 a 0204 abc 0.974 d 1.212 fghi
M15 0.003 a 0.092 ab 0.211 abc 0.306 abcde M16 0.072 a 0.044a 0.166 abc 0.282 abed M17 0.001 a 0.071a 0.432 abed 0.504 abcdef
M18 0.261 a 0-553 cde 0.324 abed 1.139 fghi
M19 0.000 a 0.004 a 0.087 ab 0.091 ab
M20 0393 a 0.058a 0.628 bcd 1.079 efghi
M21 0.053 a 0.108 ab 0.639 cd 0.800 defghi
M22 0.051 a 0216 abc 0.557 bat 0.824 defghi
M23 0.010 a 0.141 ab 0.837d 0.988 fghi M24 0.000 a 0.176abc 0.331 abed 0.507 abcdef
p-value (Transformed data)
0.0280* 0.0004** 0.0001" 0.0001**
Means with the same letter in a column are not significantly different (P>0.05) using Fisher PLSD.

Table 4.5. Mean density of TSSM on leaves at node No.5 of 24 genotypes in hop yard No. 1 during 1992/93 season.
Average number of mites per cm Total Genotype
4/11/92 18/11/92
MI 0.000 a 0.000 a 0.000 a M2 0.022 a 0.883 d 0.905 c M3 0.011 a 0.040 ab 0.050 a M4 0.000 a 0.013 a 0.013 a M5 0.084 b 0.403 Ix 0.486 b M6 0.023 a 0.464 c 0.487 b M7 0.007 a 0.043 ab 0.050 a M8 0.006 a 0.033 ab 0.038 a M9 0.000 a 0.052 ab 0.052 a M10 0.000 a 0.089 abc 0.089 a M11 0.010 a 0.146 abc 0.156 ab M12 0.083 b 1.435 e 1.518 d M13 0.112 b 1.402 e 1.514 d M14 0.000 a 0.015 ab 0.015 a M15 0.000 a 0.003 a 0.003 a M16 0.010 a 0.014 ab 0.024 a M17 0.000 a 0.098 abc 0.098 a M18 0.000 a 0.043 ab 0.043 a M19 0.006 a 0.000 a 0.006 a M20 0.000 a 0.000 a 0.000 a M21 01000 a 0.000 a 0.000 a M22 0.000 a 0.004 a 0.004 a M23 0.000 a 0.329 abc 0.329 ab M24 0.000 a 0.053 ab 0.053 a
p-value 0.0006" 0.0001 0.0001" PLSD 0.059 0.389 0.382
Means with the same letter in a column are not significantly different (P>0.05).using Fisher PLSD.
142
;

143
Fig. 4.5. Total number of mites per cm.2 of leaves counted in hop yard No. 2 during the 1991/92 season.
1.5
0.0 M25
M 26
Genotype
4.3.2. Leaf-feeding damage (Tolerance test)
4.3.2.1. Glasshouse studies: This test was performed by pooling the
data of damage ratings in the first of the two artificial infestation
experiments and that of damage ratings in the natural infestation under
glasshouse conditions. According to ANOVA, these genotypes showed
highly significant differences (p < 0.01) in susceptibility to the pest (Table
4.6). The genotype M4 and M9 Were the least susceptible, while the
• genotypes M21 and M26 were the most susceptible (Plate 4). All other
genotypes were intermediate.
4.3.2.2. Field studies: In hop yard No. 1, the seasonal accumulation
of mite-days per leaf for adult females, adult males, immatures, motiles,
eggs, and total mites on each genotype in 1990/91, 1991/92, and 1992/93
growing seasons is illustrated in Fig. 4.6,. 4.7, and 4.8, respectively.
According to the Kruskal-Wallis test, pooling all data for the season over
the 3-yr study showed no significant differences (p > 0.05) in accumulated
mite-days among genotypes in this hop yard (Fig. 4.9). On average M2,
M6, M9, M12, and M13 were highly preferred genotypes, whereas MI, M4,
Mb, M16, and M19 were least preferred.

144
Table 4.6. Damage ratings at 42 days after infestation of hop cultivars in replications 1 and 2 and at 84 days after infestation of those in replications 3 and 4 under glasshouse conditions.
Genotype
Damage rating (1-5) Average
Artificial infestations Natural infestations p=0.0006" PLSD=0.971
Rep. 1 Rep. 2 Rep. 3 Rep. 4
M1 2 2.5 3 3 2.625 bcd M2 3 3 2.5 2 2.625 bcd
M3 3 2.5 3 5 3.375 de M4 1 1 2 2 1.500 a M5 4 3.5 3 3 3.375 de M6 - 3 2.5 2 3 2.625 bcd M7 3 2 3 3 2.750 bcd M8 3 3 2 3 2.750 bcd M9 2 2 2 2 2.000 ab M10 2 2.5 3 4 2.875 bcd Mll 2 2.5 2 3 2.375 abc M12 2.5 _ 1.5 5 . 3 3.000 cd M13 3 3 3 3 3.000 cd M14 3 2.5 3 2 2.625 bcd M15 3 2.5 3 3 2.875 bcd M16 3.5 3 2 3 2.875 bcd M17 2 3 3 3 2.750 bcd
M18 4 3 2 3 3.000 cd
M19 2 3 3 3 2.750 bcd
M20 3 2 3 5 3.250 cde M21 4 4 5 5 4.5001
M22 2 3 3 3 2.750 bcd •
M23 3 2 3 3 2.750 bcd
M24 3 2 '4 3 3.000 cd
M25 3 3 3 3 3.000 cd
M26 . 5 5 3 3 4.000 ef
Means with the same letter in a column are not significantly different (P>0.05) using Fisher PL5D.

Plate 4. Hop plants infested by TSSM under glasshouse conditions:
M4 (left) and M26 (right).

1 2 3 4 5 6 7 8 9 10 11 12 13 14 13 16 17 18 19 20 21 22 23 24 1500
2 3 4 5 6 7 8 9 10 11 12 13 14 13 16 17 18 19 20 21 22 23 24
6000 5000—
mi • 4000— d) 3000—
2-= 2000—
•1000—
146
Fig. 4.6. Cumulative mite-days on each genotype grown in hop yard No.1 during the
1990/91 season.
hninatures
16co-
PTI[ePITIr;lgir [ ▪ 53)-
Ef39 liT"ia4 17 II" 7. 1 2 3 4 5 6 7 8 9 10 11 12 13 14 15 16 17 18 19 20 21 22 23 24
lb,
1500 Mctiles
0 P[;194E;IT[PPP5f;IfFIrillF1;10/71)97°
1000—
500 —
1 2 3 4 5 6 7 8 9 10 11 12 13 14 15 16 17 18 19 20 21 22 23 24
1 2 3 4 5 6 7 8 9 10 11 12 13 14 13 16 17 18 19 20 21 22 2324 8000
6000—
13 4000—
▪2000j ›.."'
eb
—
1 2 3 4 5 6 7 8 9 10 11 12 13 14 13 16 17 18 19 20 21 22 2324 • Genotype
[J. 1st. sampling El 4th. sampling IN 7th. sampling 010th. sampling RE 13th. sampling
tal
13
Total mites
•0 2nd. sampling la Rh. sampling ED 8th. sampling
M 3rd sampling 06th. sampling [219th. sampling
11th. sampling
14th. sampling
12th. sampling 15113th. sampling

0 -0001
-OGOZ
7 OBOE -0001'
0009
0
0001 3:
a 000?
r.6
000E
efe a 111
2u0Lues 1116
guetues
gutidules I419 0 Sulldwes pic
gugdules-q19 2u!idules -put D Sunclums NIL 0 guildules Ant E suoilles 1St 0
adifyoua9 tz
60EZ6irtiEkill kAith zz IZ OZ 61 81 LI 91 SI 1,1 El Z1 11 01 6 8 9
81 LI 91 ci VI El Zt It 01 J,„. 0 .7,....
...
61, .
ril
1 .., 1 I
....Y
...
' . 0.5ctig.
i=i
A NI 17Z EZ ZZ 1? OZ 61 81 a 91 SI 1,1 El Z1 11 01 68L9 EZ1
66t htift t hr h616kt hIg664'61
-DOSI
- 0001
-
Se MON
17? CZ ZZ IZ OZ 61 81 LI 91 SI tI El ZI II DI6 8 L 9 S E I
.s. -L-r 1 0666 6106.4a61-._ oos 4 2
S3laieuzaq
EZ ZZ 12 OZ 61 81 Li 91 SI 171 El El 11 01 68L9 S EZ I
th614211111 ' ° -cot -00z
FP" -WE a
-OOP
salPx Ie401
17? EZ ZZ tZ OZ 61
o. 000?
00St
ato 2upnp
17? EZ ZZ 1? OZ 61 81 LI 91 St 171 im66th.hr
saletuad .
-mot EL,
OS? voseas Z6/1661
yoN peA dog tg umoi2 adf1oua2 yea uo sArp-a!w anReinwnD *L37 *SM
kL4 ;■%.
NI
■■-•
rrIpet ik $$
EIZIII 01 6 8 L 9 St EZI 009
Lt

tZ EZ ZZ LZ OZ 61 81 Ll 91 F.I tl El ZI 11 01 68 L 9 St EZ -L
sg23
tZ EZ ZZ IZ OZ 61 81 LI 91 SI 1,1 Et ZI 11 01 6 8 L 9 S
III al
salgoVi
1■10 ..:
EZ U 1? OZ 61 81 LI 91 SI
17Z EZ U 1Z OZ 61 81 LI 91 SI 0
K
-MOT a
MM 1 0
-MS
—0001 ITIL
—00cCV,
000Z
-00S
tiZ U 1? OZ 61 81 LI 91 SI Fl El Z1 11 01 6 8 L 9 E Z
gu!Kfules PIE M
2u!lciamt -puz El
2utickues
gunckues .446 Ei sulickuEs -1.9. 0
Suudwes -418 10 Sulicitues -418 111
gu!ickues 'LIM 0 sugcluies .4117 M adX)ouaD
tZ EZ ZZ 1? OZ 61 81 Ll 91 El tl El Z1 11 01. 6 8 L 9 St E Z 1
lig6oi l42826111
1
iiiiiiiii60 6111iligi -000S K
-M0011,1,
0
7
m 000E1
.IMSPaS £6/Z661 alp Supnp l'oN pieA cloy ui umoi2 addfioua2 (pea uo sAep-aip.0 anpeintunD -81
salltu ,I1101
811,

p=0.761 ins
149
Fig. 4.9. Kruskal-Wallis mean ranks of cumulative mite-days for each genotype grown in hop yard No.l.
p=0.2485ns
2
..Ne
,... .
al
co 0 6 —
2 1
so
40-
0 T
Females
123
10.3343ns
4 5 6 78 9 10 11 12 13 14 15 16 17 18 19 20 21 22 23 24
o')
; : gl
80 Males
i
▪
a
2
40—
20 —BIPOI
0 III
c a
1 2 3 4 5 6 7 8 9 10 11 12 13 14 15 16 17 18 19 20 21 22 23 24 80
Immatures
ifill11,1111111 1 2 3 4 5 6 :7 8 9 10 11 12 13 14 15 16 17 18.19 20 21 22 23 24
Miles
8 9 10.11 12 13 14 15 16 17 18 19 20 21 22 23 24
5 6 7 8 9.10 11 12 13 14 15 16 17 18 19 20 21 22 23 24
1 2 3 4 5 6 7 8 9 10 11 12 13 14 13 16 17 18 19 20 21 22 23 24
Genotype

150
In hop yard No.2, the seasonal accumulation of mite-days per leaf
for adult females, adult males, immatures, motiles, eggs, and total mites
on M25 and M26 in each growing season is presented in Fig. 4.10, 4.11,
and 4.12. According to the Mann-Whitney U test, there were significant
differences (p < 0.05) in those accumulated mite-days between these
genotypes (Fig. 4.13).
4.3.3. Plant characteristics
The following results were obtained for leaf areas, leaf numbers,
tiller numbers and plant heights of hops in the glasshouse as well as
surface areas and dry weights of leaves, plant heights and the growth
habit of the above-ground parts of hop plants in the field.
4.3.3.1. Hops in the glasshouse: For all of the plant characteristics
studied, there were no significant differences (p > 0.05) in length of
internodes among different genotypes (Table 4.7), whereas highly .
'significant differences (p < 0.01) in surface areas of mature leaves,
numbers of leaves on hop plants, numbers of tillers and plant heights
were found among genotypes (Table 4.8, 4.9, 4.10 and 4.11). It was
apparent that leaf damage ratings of the hop genotypes were negatively
correlated with their leaf areas, leaf numbers, tiller numbers and plant
heights (b = -0.35, -10.76, -0.97, and -9.46, respectively); however, these
relationships (r2 = 0.152, 0.093, 0.068, and 0.02, respectively) were not
statistically significant (p > 0.05; Fig. 4.14).
In addition, significant differences in plant heights between the
least susceptible genotype M4 and the most susceptible genotype M26
demonstrated that M4 grew faster than M26 at the same points in time
(Table 4.11). Leaf surface areas and the number of leaves on the plant also
differed significantly between these genotypes (Table 4.8 and 4.9), whereas
the number of tillers did not differ significantly (Table 4.10).

151
Fig. 4.10. Cumulative mite-days on each genotype grown in hop yard No.2 during the
1990/91 season.
so 1=1•NIMI■ 1=1=MI•MM•1•INII•IN
MIMM••••1 ■ •••••=1.1M■ MOM ••■■•■■•••••1”=•■••••■•• aro law i m g mTa •
•a m mInsoo m mo m mi m a m mo m mi..... = ■■■••••■•■■■•••■••• •ImimmommommIN•mosanommon
0:XXXXV. X KV:KA:KW/4:
tn 60 — >,
40 —
20 —
25
20 —
.6% 15 -
10 —
5 —
0
300
• 250 —
ta
•
200 —
150 -
• 100 -
0
400
300 —
a; e 200
• 100 -
o- 1250
1000 7
›.0:1 750-
500
• 250 —
o
1300
4.S11000— .0
500 —
IllI llIllIll
1,10
MM=11===11=1•1•M••■••=1== IM■IMP■■■••••••■••■ 1== MIIONIMI=111•••••••=111•1=1===
"MOM ONION M•111••••••••••• a . •••••••11===•/=1•101=1=1= •••••••■ / M1=1=1=I M M I M MO 1•••••■ •••••••■ •■••■•=1M as OIM•111••••••••■ ••1•••■=1=1. =I= 0••=1a GI•ONIMI •1•11M1==
le le 'le le AS ••■• 11.. 'Ile le lie le le •
I= MI MI VW •10■ 11M —MNIM-1•1•IM I MII Mr nr n •I • 1 • • ■ 11••••■•=1=1M■ 1=MM•••••••••
•MMII••••■••■••••1•1•1••••••11MIM• M=IIIM•■•••■•••=111MMIMI I= =EU 31=MIMI•M••••••••••••111M/M• = MIIIII MEI M M••• ■••■ ••••••11 =•• = MI = MONO
•41,...V..0•■••
••■•11===.1=M1•11•111••••••1••11= =MIN MN MINIUM •M■1■1•1•411•1=11111 =111•111•1•O=II=MI•M=MI•li MONO
INIIMIIMMIIIIMUI•••••••••1 •••11•11•M•IIIMIMMINDI=• IMMIM••••••••••■ •••••••1110•1•11 •MI N ME NI M M•I•I MI M•••
=I Man MR I= •MI 1•111•••• ••I•• 1•• ME IM MMI1M •IIIIMEN••••••11M•IN
mu m no•I muu me m mi...... •a a a a a a a a a a a a a. ••••■••■■■•■■••1•■■=1 OM imow•
Males
Huller Bitterer
'
Genotype
0 6th. sampling 11th. sampling
7th. sampling 12th. sampling
0 8th. sampling El 13th. sampling
El 9th. sampling • a 14th. sampling
10th sampling a 13th. sampling
Aquila
ID 1st. sampling
1:3 2nd sampling
3rd sampling
M 4th sampling
5th. sampling

Females
300-
>' .61 200 —
100 —
0
2000
t•1500—
6 1000'
2 son -
2500
v.s WOO- 41=1 1500—
t 1000—
500—
Tctal mites •
g$$$$$$$$$$$$$$$$$$$$$§1
sesosiWW"esisev•vy VV WVS" WoSr %""o We ■Weseso W.esev VW.".".••■■••••■"",""ey Nev %• %• W W","",""0
REEMBER 50 —
10.0
7.5 —
5.0 —
2.5—
2130 col >, 150 — t1 di 100
WS0%/Se% V W W W W W W V
Wsev*V■Ises"""~ --WoN".-""MAO■W_r. Wl7J71)7MMMA WJJJJ1 re m w wl meginhineirte
0.0 125
100
75
50
25
9313112331
Eggs
152
Fig. 4.11. Cumulative mite-days on each genotype grown in hop yard Nio.2 during the
1991/92 season.
• Aquila
1st. sampling
2nd. sampling
Genotype m 4th. sampling
Il 5th. sampling
Huller Bitterer
7th. sampling
F53 8th. sampling
9th. sampling ling El 3rd sampling 0 6th. sampling

F:R-=F:RzFEF 0 0 0 0 / 0 / / e / 0 0 0 0 r • % % % % % • % % % % % % •• • I • • • • • • • • I •
2000 Eggs
1010 04.0 SI.sre■W__ IN,S./NoSr!,
222Z222ZZIZZZ22Z22222Z224
vs 1300 —
13 d, 1000-
• 500 -
5000
ut 4000-
43 3eno-
f2000-
.1000-
.
MOUNIPIIMNIPBOVIIIMMIIIIMMPIMPENPUMINOM
ctsics-sttsisis-tsitsi Total mites
153
Fig. 4.12. Cumulative mite-days on each genotype grown in hop yard No.2 during the 1992/93 season.
Aquila , Genotype
Huller Bitterer
El 1st. sampling M 4th sampling 7th. sampling
El 2nd. sampling E 5th. sampling 10 8th, sampling
E I'd sampling 0 6th sampling 0 9th. sampling

' 154
Fig. 4.13. Mann-Whitney mean ranks of cumulative mite-days for each genotype grown in hop yard No.2.
Aquila
Huller Bitterer
Aquila
Huller Bitterer
Aquila
Huller Bitterer
Aquila
Huller Bitterer
Aquila Huller Bitterer Aquila Huller Bitterer Genotype
Genotype

.£86T GS1c1
su191.0 aniek-d
5f1 T- 601-
tZt LL:9 -(71V
990; L.C5 tZIV 1Z1 -T LL.9 Cal
991 T- Z11 ZZI1
0L1 T- t5-9 1av 9t7. T-
LUZ T- Z9-9
801 T- 815 811N
101 T- 051 LAN
91.0 517, 911X
L.5.1 T- 0C9 5IIN
litT- 88-9 t1IN
£9.0 T- WZ EIJN
8Z1-T £6.9 ZIPSI
650 T- £5'8 11J
ELi T- £9-9 01IN
890; t1,1' 61N
£01 T- 061 8I1
WI T- Z9S LN
61.0 ; LO-6 9YSI
T- 60-9 SIN
110; £91, 1141
861 T- 18.9 EN
V9-0 T- 161 ZN
581 T- ZI1 IN
as ; sueatu (qua) sqtgual apcnuam ad4ouao
luaunisffcieisa Jaue want 9 le parnseaw tuompuoa asnogsseig
Japun umad ad/Ciouag dog tpea Jo stpguai apoulaiu! ueaw •ft appi
SSI

Table 4.8. Mean leaf areas of each hop genotype grown under glasshouse conditions.
Genotype 2
Leaf area (cm. ) means + SE
M1 4.72 ± 0.34 cdefghi
M2 4.71 ± 0.38 cdefghi
M3 4.36 ± 0.35 abcdefg
M4 4.80 ± 0.27 defghij
M5 3.91 ± 0.33 abc •
M6 4.60 ± 0.38 bcdefghi
M7 4.97 ± 0.35 efghij
M8 5.14 ± 0.35 ghij
M9 4.46 ± 0.25 abcdefgh
M10 450 ± 0.30 bcdefgh
-M11 5.01 ± 0.26 fghij
M12 4.36 ± 0.24 abcdefg
M13 3.67 ± 0.19 a
M14 4.21 ± 0.23 abcdef
M15 4.71 ± 0.31 cdefghi
M16 4.17 ± 0.17 abcde
M17 5.11 ± 0.30 ghij
M18 5.18 ± 0.31 hij
M19 4.15 ± 0.29 abcd
M20 4.71 ± 0.20 cdefghi
M21 4.11 ± 0.30 abcd
M22 5.39 ± 0.38 ij
M23 4.36 ± 0.27 abcdefg
M24 5.61 ± 0.29 j
M25 4.08 ±- 0.28 abcd
M26 3.70 ± 0.17 ab
p-value 0.0001" PLSD 0.819
Means with the same letter in a column are not significantly different (P>0.05) using Fisher PLSD.
156

157 •
Table 4.9. Mean numbers of leaves on plants of each hop genotype grown
under glasshouse conditions.
GendYPe Number cf leaves per plant means + SE
M1 63.0 ± 414 abcdef
M2 • 92.5 ± 8.33 efg
M3 51.8 ± 7.69 abed
M4 748 ± 8.99 abcdefg
Iv5 53.3 ± 7.35 abcd
M5 81.5 ±2413 abcdefg
M7 50.3 -±12.55 abc M8
106.5±16.13
M9
105.8 ±16.31
M10 78.5 ±16.52 abcdefg
Mll 90.8 -±19.75 dg
• M12 60.5 ± 5.12 abcde
M13 46.5±2491 ab
M14 65.5±12.09 abcdef.
M15 70.8 ± 7.39 abcdefg
M16 42_5 -±19.12 a
M17 843 ±-12.44 bcdefg
M18 83.3 ±15.01 lxdefg
M19 47.3 ± 6.42 ab
M20 440 ± 8.78 a
M21 86.8 -±12.46 criefg
M22 70.0 ±-13.44 abcdefg
1v23 101.0 ±15.59 fg
M24 • 78.0 ± 21.09 abcdefg
1V25 52.8 ± 3.25 abcd
M26 50.3 ± 7.78 abc
p-value 0.0095" PLSD 39.11
Means with the same letter in a column are not significantly
different (P>0.05) using Fisher PLSD.

Table 4.10. Mean number of tillers per plant of each hop genotype grown under glasshouse conditions.
Genotype Number of tillers per plant means + SE
M1 6.25 ± 0.48 cdefg
M2 6.50 ± 1.76 cdefgh •M3 425 ± 0.25 abcd •M4 7.25± 0.25 defgh
M5 5.50± 0.65 bcdef •M6 4.50 ± 0.65 abcd
M7 350 ± 0.29 abc
M8 950 ± 236 hi
M9 9.25 ± 1.75 ghi
M10 9.00 ± 2.04 ghi •Mll . 7.25± 1.11 defgh
M12 5.50± 1.19 bcdef
M13 225 ± 0.63 a
M14 6.75 ± 0.95 defgh •M15 7.25 ± 1.65 defgh
M16 2.75 ± 0.75 ab
M17 10.75± 1.60 i •M18 8.00 ± 1.08 efghi
M19 • 5.00± 1.00 abcde
M20 • 4.75 ± 0.75 abcd
M21 • 6.75 ± 1.25 defgh
M22 650± 050 cdefgh
M23 850± 0.87 fghi •M24 4.75± 0.75 abcd
M25 550 ± 1.41 bcdef
M26 550 ±'0.29 bcdef
p-value
0.0001** PLSD
3.219
Means with the same letter in a column are not significantly different (P>0.05) using Fisher PLSD.
158

Table 4.1L Average plant height of each hop genotype grown under glasshouse conditions.
Genotype Plant height (cm.) means + SE
M1 90.2 ± 639 efghi M2 1463 ± 13.42 kIrn M3 76.7 ± 1333 cdefgh M4 131.0 ± 2.65 jklm M5 873 ± 31.99 defghi M6 122.3 ± 1534 ijklm M7 131.7 ± 3.93 jklm M8 43.7 ± 6.17 abc M9 68.3 ± 4.26 bcdef M10 71.3 ± 636 bcdef Mll 88.0 ± 24.03 defghi M12 156.7 ± 12.02 m M13 10.0 ± 5.51 a M14 74.7 ± 3.18 cdefg M15 65.7 ± 20.19 bcd M16 35.2 ± 10.83 ab M17 111.7± 833 hijk M18 50.7 ± 5.81 bgd M19 150.0 ± 15.01 lm M20 104.0 ± 17.93 fghij M21 108.7 ± 6.39 ghij M22 1083 ± 1424 ghij M23 743 ± 8.83 bcdefg M24 443 ± 13.25 abc M25 1143± 7.17 ijkl M26 65.0 ± 9.07 bcde
p-value 0.0001** PLSD 36.69
Means with the same letter in a column are not significantly different (P>0.05) using Esher PLSD.
159

(B) 0
B
a O a a De
DO El a
B a
= 3.4932 - 8.6378e-3x RA2 = 0.093
40
60 80 1[110
no a leaves per Fiant
0 0
120
160
Fig. 4.14. Relationships between leaf feeding damage and plant.characteristics: leaf area (A), no. of leaves per plant (B), no. of tillers per plant (C), and plant height (D).
4 5 2
Leef area (cm )
(0 • •
• (D)
•
II• •
•
▪
• • •
•
= 3.3209 - 6.9484e-2x 102 = 0.068 y = 10723 - 10966e-3x RA2 =0.020
[i 10 12 0 100 na cf tillersper plant Plant height (cm)
2 0
43.3.2 Hops in the field: There were highly significant differences
in surface areas and dry weights of leaves (p < 0.01) among genotypes
studied (Table 4.12). M18 had the greatest mean values of these
characteristics, whereas M13 had the least. The growth habit of the above-
ground parts of hop plants for each genotype is also presented in Table
4.12_ The majority of the genotypes studied showed a cylindrical type of
growth habit. The habit of the highly susceptible genotype M13 is quite
conical, whereas those of the slightly susceptible genotypes M1 and M4
are rather umbrella like.

161
Table 4.12. Average surface areas and dry weights of hop leaves as well as the growth habit of hop plants for each genotype under field conditions.
Genotype 2
Leaf area (an.) p=0.0001" (PLSD=42304)
Dry weight (gm.) p=0.0001" (PLSD=0.230)
Growth habit
M1 213.609 ± 20.792 ijk 1.269 ± 0.086 ghij Umbrella+Cylindrical 157.308 + 6.252 cdef 1.038± 0.045 cde Conical+Cylindrical
M3 124.668± 2.9511x 0.924 ± 0.062 bcd Conical M4 191.951 ±19593 fghij 1.107 ±0.089 efg Umbrella+Cylindrical M5 136.685 + 18.174 bcde 0.825 ± 0.082 bcd Umbrella M6 109.783 ±10.745 b 0.720 ± 0.061 t:c Cylindrical
204.349 ± 15.051 ghijk 1.372 ± 0.051 hij Cylindrical+Conical M8 102.932 + 17.560b 0.648 ± 0.124 Conical+Cylindrical M9 165.945 + 11532 cdefgh 1.186 ± 0.067 fghi Cylindrical M10 135.422 + 15.614 Ixd 0.943 ± 0.079 cde Conical+Cylindrical Mll 187.171 + 24.877 fghij 1.426 ± 0.137 Cylindrical+Conical M12 174.006 + 14.792 defghi 1.148 ± 0.062 efgh Cylindrical+Umbrella M13 55.686± 3.495 a 0377 ± 0.015 a Conical M14 208.229 + 24.777 hijk 1.479 ± 0.122 Conical+Cylindrical M15 225580± 9.772 jk 1.450 ± 0.057 Cylindrical+Urnbrella M16 178.748 ± 12.469 efgh 1.187 ± 0.066 fghi Cylindrical+Umbrella M17 200.896 ± 17.349 ghij . 1.406 ± 0.101 ij Conical+Cylindrical M18 244322 + 21.897 k 1.928 ± 0.119 Cylindrical M19 188.418 ± 6.354 fghij 1.340 ± 0.084 hij . Conical+Cylindrical M20 183.797 + 10.818 fghij 1311 ± 0.025 ghij Cylindrical M21 127.570 + 12.166h 0.771 ± 0.054 lx Umbrella M22 193.392 ± 4.803 fghij 1.283 ± 0.059 ghij Cylindrical+Conical M23 170368± 15.737 defgh 1.258 ± 0.077 fghij Umbrella+Cylindrical M24 165.271 + 22.562 cdefg 1.095 ± 0.146 efg Cylindrical M25 201.818 ± 10.627 ghij 1.384 ± 0.017 ij Cylindrical+Umbrella M26 154.676 + 8.386 cdef 1.181 ± 0.073 fghi Cylindrical
. Means with the same letter in a column are not significantly different (P>0.05) using Fisher PLSD.
• In addition, the growth rate of hop plants measured as changes in
height from one observation to the next is showed in Fig. 4.15. It was
apparent that MI5 had the highest growth rate compared with other
genotypes, whereas M13 had the lowest.

IS
1 162
Fig. 4.15. Average plant height of 26 hop genotypes grown in the field on each occasion of sampling during the 1991/92 season.
500
400
G 300
ce "Z 200
100
1:1
O 8th. O 7th.
O 6th. El 5th.
O 4th. O 3rd. O 2nd. O 1st.
1 2 3 4 5 6 78 9 10 11 12 13 14 15 16 17 18 19 20 21 22 23 24 25 26 Genotype
43_4_ Cone producticm
Numbers of cones per vine, dry weights of cones per vine and dry
weight per cone for each genotypes tested at the Horticultural Research
Centre during 1991/92 season . are presented in Table 4.13. There were
highly significant differences in these parameters among genotypes (p <
0.01). The highest number of cones per vine, dry weignt of cones per vine
and dry weight per cone were found on M11, M15 and M25, respectively.
It was also found that M4 and M14 did not produce any hop cones during
their first year.
During 1992/93 season, highly significant differences (p < 0.01) in
numbers of cones per vine, dry weights of cones per vine, and city weight
per cone among genotypes were also detected (Table 4.14). The highest
number of cones per vine, dry weignt of cones per vine and dry weight
per cone were found on M15, M18 and M10, respectively. However, there
were no significant differences in these parameters between the highly
susceptible genotype M26 and the slightly susceptible genotype M4 (p >
0.05).

163
Table 4.13. Cone production for each genotype grown at the Horticultural Research Centre during 1991/92 season.
Genotype • Number of cones per vine
.!•Dry weight of cones per vine
(gm-)
Dry weight per cone
(gm.)
M2 102.00 + 32.89 13.70 ± 4.69 0.093 ± 0.033 M4 0.00 ± 0.00 0.00 ± 0.00 0.000 ± 0.000 M9 35.00 ± 35.00 8.02 ± 8.02 0.038 ± 0.038 M10 12.17 ± 7.88 2.10 ± 1.36 0.058 ± 0.036 Mll 663.67 ±357.75 65.15 ± 37.05 '0.089 ± 0.022 M14 0.00 ± 0.00 0.00 ± 0.00 0.000 ± 0.000 M15 398.17 + 110.42 65.47 ± 19.48 0.179 ± 0.019 M18 137.83 ± 63.39 26.08 + 11.76 0.165 ± 0.042 M21 20.50 ± 20.50 2.38 ± 2.38 0.019 ± 0.019 M23 42.00 + 27.01 8.92 ± 5.65 0.072 ± 0.046 M25 203.00 ± 104.21 29.95 + 13.42 0.136 ± 0.030 M26 74.33 + 34.21 14.02 ± 6.43 0.094 + 0.042
p-value 0.003" 0.0037** 0.0005" PLSD 326.42 38.633 0.088
Table 4.14. Cone production for each genotype grown at the Horticultural Research Centre during 1992/93 season.
Genotype Number of cones per vine
Dry weight of cones per vine
(gm)
Dry weight per cone
(gm-)
M2 515.21 + 42.85 58.62 + 14.03 0.113 ± 0.028 M4 472.53 + 81.94 62.10 + 13.78 0.127 ± 0.009 Ni9 418.76 + 81.45 42.58 + 9.68 0.099 ± 0.007 Mb. + 58.44 112.01 + 1537 0.285± 0.02,3 Mll 377.94 + 55.96 32.89 + 9.70 0.081 ± 0.017 M14 227.91 + 75.45 40.19 + 14.83 0.168 ± 0.008 M15 1052.96 + 239.28 176.05 + 48.58 0.158 ± 0.017 M18 1021.24 + 238.05 188.86 ±39.84 0.203 ± 0.027 M21 252.20 + 64.71 17.23 + 5.49 • 0.065 ± 0.006 M23 561.45 + 74.53 120.17 + 13.13 0.226 ± 0.028 M25 696.60 + 127.12 114.65 + 19.70 0.169 ± 0.019 M26 340.75 + 59.20 63.16 ± 16.56 0.174 ± 0.018
p-value 0.0001** 0.0001** 0.0001** PLSD 337.47 62.43 0.054
In addition, there were no significant differences (p > 0.05) in cone
production among blocks (Fig. 4.16). The mean values varied from 592.75
to 461.29 for numbers of cones per vine (Fig. 4.16A), 104.70 to 69.97 for dry

Average weig ht per vine (g m.)
164
weights of cones per vine (Fig. 4.16B) and 0.163 to 0.156 for dry weights per
cone (Fig. 4.16C).
Fig. 4.16. Cone production in each block at the Horticultural Research Centre: no. of cones per vine (A), average weight of cones per vine (B) and dry weight per cone (C).
Infested
Bamdary
tininfested
Block

165
4.4. DISCUSSION
4.4.1. Fluctuations of mite populations among hop genotypes
The results from this study support those presented by others and
strongly suggest the existence of a genetic component that determines the
suitability of the hop plant for mite population build-up. The study by
Regev and Cone (1975) indicated significant differences in mite densities
between the hop varieties with European parentage and the American
clusters. Similar results have been reported by Peters and Berry (1980a).
In the present study, an American cultivar M25 (Aquila) proved to be less
susceptible to infestation by TSSM than the German cultivar M26 (Huller
Bitterer) under both field and glasshouse conditions.
It was notable that M26 was particularly susceptible to TSSM.
Under glasshouse conditions, the results of both artificial and natural
infestations showed that M26 was significantly more susceptible than any
other genotype tested (p < 0.05), indicating that M26 could be useful as a susceptible standard in future screening involving TSSM.
Comparison of mite population levels between different genotypes
under glasshouse conditions shows that M26 had consistently more mites
on all sampling dates whereas M4 had consistently fewer mites. This
indicates a large difference in susceptibility to TSSM among these
genotypes.
The results also indicated that M4 (EG-86-23) displayed a low degree
of susceptibility in both glasshouse and field studies. Since the response
of mites to this genotype was not consistent from test to test, it requires
further evaluation before definite conclusions can be drawn concerning
its levels of susceptibility.
Among genotypes grown in hop yard No.1 at Bushy Park, M13,
M12, and M2, which were the most susceptible genotypes based on

166
average mite densities at the 2 foliage strata in late season, were also
among the most susceptible genotypes in mite densities on leaves of the
same age in early season. This indicates that field evaluation is capable of
providing consistent results in many, albeit not all, cases. In addition, it
is desirable to assess the susceptibility of hop genotypes at several
different stages of growth, because tests at one stage may give results that
do not apply to others. Even though differences in susceptibility of hop genotypes studied
were fairly consistent, plant growth stage, plant physiology, or
environment might influence susceptibility to mite infestations at
various times during the growing season and therefore need to be
investigated further. In addition, a feeding preference test, which
indicated the possibility that resistance is present in a nonpreferred plant,
does not provide a final judgement of the susceptibility in the plant (Al-
Abbasi et al., 1987). Other tests should be performed to prove the fact that
a particular plant is resistant (Painter, 1951). •
4.4.2. Feeding damage
Feeding damage rating is one of the most common tests conducted
by plant breeders to measure susceptible levels to a pest (Russell, 1978).
The test reveals tolerance of a plant to feeding damage. For this reason, it
•was not surprising that the ranking among the genotypes for damage
ratings varied somewhat from those for feeding preference. M9, which
had a relatively low score in the mite damage test under glasshouse
conditions, was among the genotypes that were highly preferred in the
test using seasonal accumulations of mite-days to evaluate the feeding
damage under field conditions. However, uncontrollable adverse
environmental factors often seriously, decrease the effectiveness of
screening tests under natural conditions in the field, and these are absent
in the controlled experiments in the glasshouse. Additionally, the

167
seasonal accumulation of mite-days may be • affected by miticide
application in some growing seasons.
There are some reports of hop cultivar screening under field
conditions. For example, Kremheller (1988) in Germany observed
differential population levels of both aphids and TSSM on 125 hop
genotypes which were collected from the wild and grown in an untreated
hop yard. This author reported the genotypes observed as aphid free but
none as mite free. In the present study, all the 26 hop genotypes selected
were also attacked by TSSM. Nevertheless, Neve (1991) states that the
wider the range of hop genotypes available for screening, the greater the
chances of finding a hop with the required character.
Under glasshouse conditions, the damage ratings reported
indicated that a male parent YM-81-22 could produce not only the least
susceptible progeny M4 but also the highest susceptible progeny M21
when crossed with female parents YD-81-102 and 41-78, respectively. The genotype J78 when open-pollinated and crossed with 29/70/SH, can
produce intermediate progenies M2 and M10, respectively. This suggests
that J78 may be the susceptible source of these genotypes and the
controlling factors for susceptibility to TSSM in hop plants may be
polygenic and dominant.
4.4.3. Plant characteristics
The negative relationships between damage ratings and some
plant characteristics (i.e. leaf areas, leaves per plant, tillers per plant and
plant heights) were detected among hop genotypes studied, although
statistically not significant. The growth rate of plants can be measured by
using these characteristics. The results indicate that fast-grown genotypes
• may be less susceptible than slow-grown genotypes due to a tendency to
escape infestations.

168
The results of this study also showed that the slightly susceptible
genotypes with the umbrella shape of the above-ground parts, such as
M4, had significantly lower mite densities than the highly susceptible
genotypes with the conical shape, such as M13, under field conditions.
This suggests that the type of growth habit of hop plants may affect both
the population build-up and the behaviour of TSSM by modifying the
microclimate in hop yard. Jesiotr et al. (1979) pointed out that
microclimate in the canopy of host plants might affect a mite population.
However, the characteristics of any hop genotype vary considerably
from season to season and from location to location (Neve, 1991). In this
study, it was apparent that the rankings of leaf areas and plant heights
among genotypes' for glasshouse-grown plants differed from those for
field-grown plants.
4.4.4. Cone production
The experimental plot in this study was a newly planted hop area.
For this reason, a small yield of so-called baby hops (Brooks, 1962) or
virgin hops (Rybacek, 1991) was obtained for each genotype. Brooks (1962)
found that the length of time required for Fuggle hops to reach
-maximum production was the fourth season after planting, or the third
year of production.
The results from this study indicated that there were significant
differences in cone production among genotypes tested (p <0.05) and the
least susceptible genotype M4 had relatively low yields, indicating an
undesirable character for this genotype.
In addition, it was also found that slight infestions of TSSM either
had no effect or even increased the cone production of hop plants. This
suggests that hop plants can tolerate and compensate for feeding damage
of TSSM. Working under field conditions with TSSM, Bailey (1979)
showed that a healthy peach tree was able to compensate for moderate

169
mite feeding. Sances et al. (1981), working with TSSM on strawberry,
reported that the number of fruit produced was significantly increased
from lants experiencing low level stress from mite populations. Thus,
low levels of mite populations may be kept within hop yards for
supporting populations of natural enemies.

170
CHAPTER 5 DEMOGRAPHIC ANALYSIS OF HOP
SUSCEPTIBILITY TO TSSM INFESTATIONS
5.1. INTRODUCTION
Using resistant genotypes of many crops has been found to be an
effective method of controlling TSSM, particularly in cassava, cotton,
cucumber, strawberry (De Ponti, 1985)), and tomato (Stoner and
Stringfellow, 1967; Aina et al., 1972). However, the improvement of hop
genotypes for mite resistance remains obscure. Regev and Cone (1975)
suggested that the hop genotypes evaluated so far were not resistant to
spider mites but differed in their susceptibility to the pest. The previous
Chapter indicated differences in TSSM population increase on different
hop genotypes grown both in the field and in the glasshouse. The
explanation for this phenomenon is still under investigation.
According to Huffaker et al. (1969), the condition of the host plant
was recognised as an important factor affecting the abundance of spider
mites. It is generally considered that this factor has an influence on the
reproductive parameters, such as fecundity, hatchability, oviposition
period, longevity, developmental rate, survivorship, and sex ratio, as
well as the magnitude of the intrinsic rate of increase (Wrensch, 1985).
These parameters have been suggested to be more appropriate measures
of the impact of a resistant plant on the mite's life history (Trichilo and
Leigh, 1985).
The major objective of this present investigation was to assess the
effects of susceptibility of hop genotypes on the reproductive biology of
TSSM under different rearing conditions. In addition, attempts were
made to compare two sources of leaves used in the studies: glasshouse vs.
field hop leaves.

171
5.2. MATERIALS AND METHODS
5.2.1. Mite Culture: Mites used in these experiments were reared
on the abaxial surface of detached bean leaflets in petri dishes placed in a
controlled temperature room under a photoperiod of 16:8 (L:D) at ca. 25°C
and 30-40%R.H.. Adult female mites had been transferred to these
leaflets and left undisturbed to oviposit for 48 hrs. Development of these
eggs resulted in a cohort of evenly aged mites.
5.2.2. General Procedures: Twenty-seven genotypes of hops, grown
in the glasshouse or in the field, were used in this study on antibiosis.
These genotypes comprised all the genotypes mentioned in the previous
chapter and an Australian cultivar "Pride of Ringwood" coded as M27.
Mite response on these genotypes was assessed by cutting 1.35-cm
diameter leaf discs from mature leaves of each genotype with a test tube,
the mouth of which had been sharpened by grinding and randomly
placing them, abaxial side up, on filter papers surrounded by water soaked
cotton pads in petri dishes. These leaf, discs were examined under a
binocular microscope (10X) before use and all contaminating material
removed by using a fine camel's hair brush. Marked transparent plastic
rings smeared with lanolin were placed around the discs to identify the
positions and to prevent the escape of the mites. One mated female mite
obtained from the culture was placed on each disc before oviposition took
place. The design was completely random and a total of 4 females was
used for each genotype. After 24 hrs, all mites were removed and the eggs
were counted. No adjustment of the number of mites was taken during
the development time because immature mites are too fragile to handle.
The discs were observed daily to determine survival, developmental
time, and sex ratio of progeny.
When the majority of the mites had reached the quiescent
deutonymph stage, the number of females was adjusted to one per disc.

172
The leaf discs were replaced with new ones every 4 days. Female mites
were observed throughout their lifetime and daily egg production
recorded until the . cohort became extinct. The total number of females
tested on each genotype relied on the number of females alive in the
quiescent deutonymph stage. Horizontal life tables were constructed using reproductive
parameters, as follows: age specific survivorship (l x), age specific fecundity
(mx), net reproductive rate (R0), age of mean cohort reproduction (T c),
capacity for increase (rc), intrinsic rate of increase (rm) according to the
methods of both Birch (1948) and Wyatt and White (1977), mean
generation time (T), gross reproductive rate (GRR), finite rate of increase
(A.), doubling time, natality and mortality. In addition, the survival rate
was also calculated: sx = 1 - qx where sx is the survival rate and qx = the
ratio of the number of individuals in the population that die during
interval x to the number of individuals alive at the beginning of age class
x (Brower et al., 1990). For the purposes of this study the sex ratio was
considered as unity (after Watson, 1964)
Using these basic techniques, the following comparisons were
made: 5.2.2.1. Experiment - 1: The variation in mite life history due to
varietal effects alone was assessed by . selecting hop genotypes in the
glasshouse, based on the preliminary results to represent varying levels
of mite susceptibility. The following genotypes were studied: M4(slightly
susceptible), M9(moderately susceptible), M26(highly susceptible), and
M27(local susceptible). The experiment was conducted in a growth
• chamber at ca. 25°C with a 16:8 (L:D) photophase from November 21, 1991
to December 31, 1991. Illumination, ca. 700 lux at the disc level measured
with a photometric sensor, (Lambda Instruments Corporation, model LI-
210S, Lincoln, Nebr.), was provided inside the chamber by two fluorescent
173
lamps. Each petri dish was covered with a plastic lid containing a 7-cm-
diameter hole for ventilation. The holes were covered by a fine nylon
mesh using Kwik Grip(Selleys) contact adhesive. The relative humidity
inside the dish, therefore, was higher than the outside environment.
5.2.2.2. Experiment 2: Four separate tests were conducted to
determine differences in life table parameters on various hop genotypes
under different conditions.
5.2.2.2.1. Test 1: All 27 genotypes were evaluated in the growth
chamber from December 15, 1991 to February 14, 1992. In this test, leaf
discs were arranged under the same conditions described previously. The
mature hop leaves used were collected from the glasshouse.
5.2.2.2.2. Test 2: Following an unexpected electrical malfunction,
the test was removed from the growth chamber to the controlled
temperature room of 25°C with a 16:8 (L:D) photophase from January 14,
1992 to March 14,1992. The illumination at the level of the discs was ca.
350 lux. Leaf discs of the same twenty seven genotypes in Test 1 were cut
from the field hop leaves. The remaining steps of this test were similar
to those in the previous test.
5.2.2.2.3. Test 3: In this test, plastic lids were not placed on petri
dishes, resulting in a more moderate humid condition, while the
treatment in Tests 1 and 2 was designated as humid condition. The mites
utilized in the experiment on the effect of disc area, as described below,
were tested on leaf discs cut from mature field leaves. Because of
chemical residues on leaf surfaces of some genotypes, all the genotypes
except M25, M26, and M27 were reevaluated from January 21, 1992 to
April 1, 1992. The discs were held in a transparent cage inside the
controlled temperature room and the fluorescent lamps provided light at
an intensity of 460 lux. The remaining steps were conducted in the same
manner (described previously).

174
5.2.2.2.4. Test 4: The test was repeated with mites reared under
identical conditions as described in Test 3 from February 16, 1992 to April
12, 1992 except that leaves were collected from hops in the glasshouse.
5.2.2.3. Experiment 3: In this study, mature hop leaves were
collected from all the genotypes shown in the list except M25, M26, and
M27. Three leaf discs of different surface areas (1.0, 1.35, 2.70 cm. diam.)
were cut from the same leaf of field-hops with sharp mouthed test tubes.
Adult female mites were held singly on each disc overnight. The
• following day, the mites were removed and the eggs were retained on the
discs. The design was completely random and a total of 3 females was
used on each genotype. As mites in the quiescent deutonymph stage
appeared, one female was maintained on a disc of each surface area. The
rest of the mites were adjusted to one per medium disc for use in Test 3 of
Experiment 2. Additionally, the conditions and period of time were the
same as that test.
The experiment was repeated during the same period as Test 4 of
Experiment 2 by using the method described above except that leaves
from the glasshouse were used and the test performed. In addition, leaf
discs from genotypes M25, M26, and M27 were also used in this study
which was conducted from February 2, 1992 to May 8, 1992.
5.2.3. Data analyses
Statistical analyses were calculated using one-factor ANOVAs with
replication to detect differences in the data. Means were separated by
Fisher's protected least significant differences (PLSD) test with an alpha
level of 5%. Rankings of significance at p=0.05 were determined using
the Kruskal-Wallis test. Sex ratios were compared using the CM-square
test. Linear regressions were performed using the curve fit procedure of
the Cricketgraph computer program.

175
5.3. RESULTS
5.3.1. Experiment 1: The values of each of the life table parameters
are shown separately and compared in order to investigate that
parameter(s) mainly affected by any hop resistance to mites.
5.3.1.1. Hatchability: The percentage of eggs hatching on each
genotype is shown in Table 1. No statistically significant differences were
apparent in the hatchability of eggs among these hop genotypes (p > 0.05).
5.3.1.2. Survival of immatures: Although the percentage survival
on M26 was the lowest, the survival rates of immature mites did not vary
significantly among these hop genotypes (Table 5.1).
Table 5.1. Hatchability, survival of immature and sex ratio of TSSM on four genotypes of hops.
Genotype Hatchability(%) p=0.5651ns
Survival of Immature p=0.1291ns
Sex Ratio(F./M.) p=0.7351ns
M4 83.10 + .070 0.874 + .044 0.817 + 0.193
M9 96.10± .039 0.813 + .098 1.096 + 0.401
M26 94.70 + .029 0.626 + .062 1.800 ±1.170
M27 88.90 + .111 0.859 + .072 0.933 + 0.472
Means in columns followed by same letter are not significantly different (p>0.05; Fisher LSD) .
5.3.1.3. Sex Ratio: Differences in the sex ratio of female to male
mites between these hop genotypes were not significant at the 5% level of
probability (Table 5.1). However, the ratio on M26 was much higher than
the ratio on the other 3 genotypes studied. According to the goodness of
fit procedure, males and females were considered to occur with the same
frequency in this experiment (Table 5.2).

Table 5.2. Goodness of fit procedure for male and female adults.
Ho = Males and females occurred with the same frequency (0.500.50). Ha = Males and females did not occur with the same frequency.
Sex Number of mites Chi-Square (cal.) Chi-Square (table)
Female 77 0.6061
3.841(.=0.05) Male 88 _ Accept Ho
5.3.1.4. Generation mortality: In the life table, mortality (egg to
adult) showed no consistent relationship with host susceptibility to attack
(Table 5.3). Generation mortality varied from 36.36% on M26 to 24.19%
on M9.
Table 5.3. Life table of TSSM on four genotypes of hops.
Genotype Xa i„b dxc qxd .sxe Generation mortality (%)
Egg 80 13 0.1625 0.8375
Immature 67 8 0.1194 0.8806
Adult& 59 26.25
Egg 62 1 0.0161 0.9839
Immature 61 14 0.2295 0.7705
Adult 47 24.19
M26 Egg 33 1 0.0303 0.9697
Immature 32 11 0.3438 0.6562
Adult 21 36.36
M27 Egg 51 6 0.1177 0.8823
Immature 45 7 0.1556 0.8444
Adult 38 25.49
a = Stage of life cycle. b = Number living at beginning of stage in the x column.. c = Number dying within stage in the x column. d = Probability oidying during x. e = Probability of surviving interval x. f = Larva + Protonymph + Deutonytnph. g = Female + Male.
176

177
5.3.1.5. Survival of adult stage: Since the present studies
emphasized the adult stages, and since no significant differences were
detected among mites on any of the hop genotypes during the juvenile
stage, survivorship was considered to be 100% at the onset of adulthood
and two levels of survival, namely 75% and 50% levels were selected for
analysis. The period of time required for each population to reach these
two levels is shown in Fig. 5.1. Survival at both the 75% and 50% levels
was greatest on the local susceptible genotype M27, and decreased in turn
for M4, M9 and M26. Average longevity of female mites on M27 was the
longest, followed by M4, M9, and M26, but differences among genotypes
were not statistically significant (p > 0.05; Fig. 5.2).
Fig. 5.1. Survivorship of TSSM on four genotypes of hops.
M4 75% = : 19.0 days M26:75% =17.5 days
50% = 25.0 days 50% = 19.0 days
75% M9 : = M27:75% = 22.0 days
50% = 19.0 days 233 days 50% =25.0 days
1.0 -
0.9 -
0.8
0. 0.7 - :a . 04 0.6
0.5
0.4 -
0.3
0.2:
0.1
0.0
0 I IV I I I
5 10 15 20 25 Days
30
35

178
Fig. 5.2. Average longevity of TSSM on four genotypes of hops.
5.3.1.6. Fecundity: In this experiment, there were only slight
differences in the average number of eggs laid per day on the four
genotypes (Fig. 5.3), although the highest average peak in oviposition
(ca.14.18 eggs/female/day) occurred on M27. During the first 12 days of
oviposition, significant differences in the cumulative number of eggs laid
by each cohort were detected between genotypes (Table 5.4). The number
of eggs laid was in agreement with the degree of susceptibility. The
greatest number of eggs was oviposited on M27, and the least on M4. On
the 4th. day of oviposition, the highest differences in the cumulative
progeny were found among the four genotypes. The mites laid more
than 1/3 of the total eggs produced in an average cohort lifetime on all
genotypes (>33.33%) with the exception of the slightly susceptible
genotype M4 (22.13%). Statistical testing indicated that the number of
eggs was significantly greater on M27 than on M4 and M9 in descending
order, but was not significantly greater than on M26. In turn, the number
of eggs was significantly greater on M26 than on M4, but was not
significantly greater than on M9. Beyond this 12-day period, the
convergence of fecundity curves resulted in very little difference in total

15
--0---- M4
--e — M9
—0--- M26
M27
179
fecundity among these genotypes. At the end of oviposition, average
total fecundity per female did not differ significantly among the hop
genotypes. Genotype M27 had higher total eggs than did M4, M9 and
M26. Additionally, the increased standard error associated with later-laid
eggs was likely associated with an increased variation in viability of
parent females during this period; that is, some females stopped laying
eggs while others were still in their prime.
Fig. 5.3. Fecundity of TSSM on four genotypes of hops.
0
10 15 20 25 30 35 40
45
Days

180
Table 5.4. Cumulative numbers of eggs laid by adult female mites on four genotypes of hops.
Time p-value
Genotype (Means + S.E.) •
M4 M9 M26 M27
1 0.0220* • 0.438 + 0.203 a 0.812 + 0518 a Z143 + 0.882 ab 3.417 + 1.145b 2 0.0170* 4.750 + 1.101 a 7.000 ± 1145 a 9.786 + 2.162 ab 1333 ±3.048b 3 0.0055** 12.19 + 1.761 a 17.63 + 1.779 ab 22.50 ±3.465 be 26.67 + 4.463 c 4 0.0030** 19.75 ±2.756 a 2638 + 2.297 ab 30.71± 4.230 bc 40.92 + 5.949 c 5 0.0034** 26.69 ±4.032 a 3356 + 2.965 a 39.71 ±5.569 ab 53.58 + 7.212 b 6 0.0049" 33.88 +5.299 a 3856 + 3.601 a 48.00 ±7.111 ab 65.33 + 8.675 b 7 0.0038" 40.88 + 6.492 a 42.63 + 4.135 a 5537 + 8.745 ab 78.33 + 10.38 b 8 0.0038" 45.81 ±7.481 a 46.13 + 4.852 a 60.64± 9.967 a 87.58 + 11.49 b 9 0.0073" 51.25 j8.606 a 51.88 + 5.927 a 66.43 + 11.49 a 96.42 + 12.69 b 10 0.0142* 56.00 + 9.672 a 56.69 + 6.984 a 72.00 + 13.03 ab 103.2 + 13.66 b 11 0.0237* 59.69 + 10.50 a 61.00 + 7.759 a 74.64 + 13.90 ab 107.8 + 14.42 b 12 0.0366* 63.06 ±11.31a 64.75 + 8550 a 76.92 + 14.76 ab 111.6 + 14.98 b 13 0.0688ns 68.13 + 12.52 68.81± 9557 7950 + 15.81 115.0 + 15.35 14 0.1069ns 72.31 + 13.60 71.63 + 10.28 80.50 ±1611 116.8 + 15.57 15 0.1492ns 75.81 + 14.49 7338 + 10.77 81.64 + 16.72 117.8 + 15.70 16 0.1911ns 78.63 + 15.24 75.19 + 11.28 82.93 + 17.27 118.9 + 15.82 17 02458ns. 81.50 + 16.07 77.63 + 11.99 84.21 + 17.89 120.1 + 15.92 18 02798ns 84.25 + 16.91 7856 + 12.24 84.21 + 17.89 120.6 + 15.94 19 0.3080ns 86.00 + 1737 78.94 + 12.37 8457 + 18.08 120.6 + 15.94 20 03166ns 87.13 + 17.67 78.94 + 12.37 8437 + 18.08 120.7 + 15.94 21 03249ns 88.06 + 17.92 78.94 + 12.37 8457 + 18.08 120.7 ±15.94 22 03289ns 8836 + 18.05 78.94 + 12.37 8457 + 18.08 120.7 + 15.94 23 0.3317ns 88.94 + 18.14 78.94 + 12.37 8457 + 18.08 120.7 + 15.94 24 0.3334ns 89.19 + 18.20 78.94 + 1237 8457 + 18.08 120.7 ±15.94 25 0.3339ns ' 89.25 + 18.21 78.94 + 1237 8457 + 18.08 120.7 + 15.94 26 0.3339ns 89.25 + 18.21 78.94 + 12.37 8457 + 18.08 120.7 ±15.94 27 0.3339ns 89.25 + 18.21 78.94 + 1237 8457 + 18.08 120.7 + 15.94 28 0.3339ns 89.25 + 18.21 - 78.94 + 1237 8457 + 18.08 120.7 + 15.94 29 0.3339ns 89.25 + 18.21 78.94 + 12.37 8457 + 18.08 120.7 + 15.94 30 0.3339ns 89.25 + 18.21 78.94 + 12.37 8457 + 18.08 120.7 + 15.94
*M in rows followed by same letter are not significantly different (p>0.05; Fisher LSD)
5.3.1.7. Other parameters: A summary of the effect of genotype on
other reproductive parameters are shown in Table 5.5. Comparisons of
these parameters are based on the 25% difference criterion of Southwood
(1978). The intrinsic rates of increase (rm) of calculations using Wyatt and
White's formula and Birch's equation on M4 was the smallest, followed
by M9, M26 and M27 in ascending order. There were no significant
differences between these genotypes. However, the gross reproductive
rate was significantly greater on M26 than on M9. The net reproductive
rate (Ro) revealed that this ratio of the total number of female births in
one generation to the number in the previous generation was

Table 5.5. Life history analysis of TSSM on four genotypes of hops.
Reproductive parameters Genotypes
M4 (n=16)
M9 (n=16)
M26 (n=14)
M27 (n=12)
Intrinsic Rate of increase 0.2435a 02450a 0.2710a 0.2712a (Wyatt and White) Intrinsic Rate of increase 02250a 0.2322a 0.2472a 0.2697a (Birch) Gross Reproductive Rate 74.100ab 59.886a 77.599b 68.826ab
Net Reproductive Rate 44.656a 39.469a 41.964a 60.333b
Capacity for Increase 0.1969a 0.2077ab 0.2272ab 0.2471b
Mean Generation Time (days)
16.884a 15.829a 15.117a 15.202a
Cohort Generation Time (days)
19.293a V 17.698a 16.444a 16.592a
Pre-reproductive Period (days)
11.800a 11.750a 11.500a 11.500a
Finite Rate of Increase 1.2520a 1.2610a 1.2800a 1.3100a
Doubling Time (days)
3.0800a 2.9840a 2.8030a 2.5700a
Natality 2.7855a ' 3.0277a 4.1887b 4.7897b
Mortality 2.5605a 2.7956a 3.9415b 45201b
Means followed by the same letter in the same row are not significantly different using the 25% difference criterion of Southwood (1978).
181

182
significantly higher on M27 than on the other genotypes. The capacity for
increase (rc) on M27 was significantly higher than M4, but no differences
between M27 and M26 or M9 were found. The corresponding rm values
• were all slightly greater than rc values. The rms', as a percentage of rcs',
were 114.27, 111.80, 108.80, and 109.15 for mites on M4, M9, M26, and M27
respectively. No significant differences were found in both generation
times of the mites on these genotypes. The pre-reproductive period did
not differ significantly among these genotypes. Again, the finite rate for
increase was highest on M27, followed by M26, M9, and M4 in descending
order. Doubling time (DT) conformed to the reverse order of rm and
there were no significant differences between genotypes in both
parameters. Natality and mortality varied, with mites on M27 having the
highest rates and M4 having the least.
5.3.2. Experiment 2: The influences of different factors on each
reproductive parameter of TSSM were shown separately in this study.
5.3.2.1. Effects of genotypes: The following comparisons of the
reproductive parameters of mites on each genotype were obtained by
pooling data taken from all tests in this experiment. The results are
presented in Table 5.6. Pre-reproductive period, defined as days to first
reproduction, was nearly identical on all 27 genotypes tested. The range
was 10.5-12.8 days with an average of 12.00 days. The mites on M4 had the
slowest rate of development and those on M11, M25, and M26 had the
highest rates. According to the Kruskal-Wallis test, there were no
significant differences in intrinsic rate of increase, net reproductive rate,
mean generation time, capacity for increase, cohort generation time,
finite rate of increase, doubling time and natality among the hop
genotypes (p > 0.05). Nevertheless, the variation in net reproductive rate
among mites on these genotypes was higher than the variation in other
parameters. Results of regression analysis of the intrinsic rate of increase

Table 5.6. Pooled life table of TSSM on 27 hop genotypes under different conditions.
Genotypes (total no. of mites)
Reproductive Parameters (Means + S.E.)
Pre-reproductive period p=1.00Ons
rm (Birch) p=0.9997ns
Ro F=0.1356ns p=1.0000ns
rc Tc
p=0.9912ns p=0.9500ns
Finite rate for increase p=0.9997ns
Doubling time Natality p=0.998Ons p=0.6952ns
M1 (n=21) 12.2 + 1.47 .214 + .036 39.62 + 14.42 16.7 j1.70 .189 + .025 18.6± 1.7 1.24± .045 353 + 587 2.77 ±0.67 M2 (n=22) 12.0 j1.48 .248 ± .027 40.93 ± 3.82 15.4 + 1.52 .226 + .026 16.9 + 1.7 1.28 + .035 2.91 ±.342 3.98 +.057 M3 (n=19) 12.1 j1.85 .236 ± .039 33.98j 5.29 15.9 ±2.16 .215 + .032 17.1 ±2.1 1.26± .050 3.22 + 580 3.81 ± 0.60 M4 (n=19) 12.8 j 1.44 .204 .024 33.93j 9.15 17.1 ± 1.51 .184 + .018 18.8 + 1.6 1.23 + .030 357 .491 2.83 ± 051 M5 (n=22) 12.1 ±1.79 .255 + .039 6638 ± 15.73 17.3 + 259 .211.± .026 20.6 + 2.8 1.29 + .050 2.93 + .474 431 + 0.85 M6 (n=19) 12.8 j1.68 .223± .028 48.95j 9.25 17.9 + 1.96 .183 + .014 21.2 + 1.6 1.25 + .036 3.25 +379 3.16 + 0.07 M7 (n=20) 12.0,j 1.62 .250 ± .031 60.78 j 10.67 17.0 ± 2.53 .216 + .022 19.6 + 2.9 1.29 + .039 2.90 j.363 3.83 ± 0.45 M8 (n=20) 11.8 + 1.91 .256 ± .036 50.10 ± 2.81 162 + 2.40 .215 + .022 18.8 + 2.1 1.29 + .047 2.88 + .430 3.75 + 0.56 M9 (n=21) 11.9 ± 1.69 .237 ± .033 37.98j 5.25 16.4 ± 2.93 .218 + .030 17.9 + 3.4 1.27 + .041 3.14 + .513 3.13 + 0.25 M10(n=19) 11.7±1.71 .244 .036 3529 5.53 15.4 ± 2.44 .225 + .030 16.7 + 2.7 1.28 + .046 3.04± .448 3.71 ± 0.70 M11(n=15) 103 ± 1.28 .292± .038 67.78111.63 14.9 + 222 .257 + .044 17.4 + 3.2 1.34 + .052 2.45 ± .281 531 j 1.05 Ml 2(n=22) 11.4 ± 1.85 .221.± .055 32.3311036 152 ± 2.63 .1% + .045 16.9 + 3.2 1.25 + .071 3.72 + .815 3.76 + 1.09 M13(n=20) 12.1 ±2.00 .247 j .036 53.47± 6.81 17.3 + 2.95 .213 ±.029 19.8 + 3.1 1.28 + .047 3.02 + .483 3.62 ±0.60 M14(n=16) •11.9 ± 1.45 .260 ± .035 60.13 ± 18.34 16.1 + 2.11 .224 + .027 18.6 + 2.4 1.30 + .045 2.85 + .470 4.44 ± 079 M15(n=18) 12.0 ± 151 .236 + .037 40.89 j 12.10 15.7 ± 2.11 .209 + .027 175 + 2.3 1.27 + .047 3.18 + .509 3.65 ± 056 M16(n=16) 11.9 ± 1.67 .2601 .036 54.67+, 6.47 162 + 2.38 .231 + .029 18.1 ±25 1.30 + .048 2.82 ± 397 4.45 + 052 M17(n=31) 12.6 ± 1.73 219 j.032 39.731 4.81 17.7± 2.22 .189 + .024 20.2 + 2.3 1.25 + .040 3.41 ±5 2.87 ± 0.49 M18(n=12) 12.2 + 1.73 .257 ± .034 53.21 ± 4.40 16.4 + 2.55 .232 + .029 18.2 + 2.9 1.30 + .044 2.87 + .442 4.28 ± 0.60 M19(n=16) 12.3 ± 1.64 231± .043 44.84 ± 16.70 16.2 ± 1.87 .199 + .030 18.5 + 2.0 1.26± .054 3.37 + .695 3.17 + 0.62 M20(n=12) 12.2 I 2.07 .238 ± .043 39.56j 7.61 163 + 3.02 .221± .036 17.3 + 2.9 1.27 + .056 3.09 + .495 3.14 ± 0.40 M21(n=16) 123 ± 1.44 .1% ± .035 25.44 ± 937 15.6 + 1.45 .181 ±.027 16.6± 1.4 1.22 + .043 3.89 + .660 2.77 + 0.61 M22(n=15) 12.7 ± 1.47 226 ± .026 53.96j 9.36 18.1 ± 2.01 .184 + .018 21.9 + 1.8 1.25 + .032 3.21 j.418 3.74 jO.36 M23(n=18) 11.9 + 1.82 244 ± .038 39.38 ± 9.49 15.4 + 1.65 .223 + .027 165 + 1.2 1.28 + .049 3.09 + .543 3.73 + 0.60 M24(n=16) 12.1 ±2.00 .254 ± .049 46.48 ± 10.05 16.2 + 2.40 .220 + .032 18.0 + 2.1 1.29± .064 3.08 + .624 4.14± 1.12 M25(n= 7) 11.4 + 1.58 .229 ± .008 66.89 ± 29.61 17.9 + 2.67 .180 + .003 22.8 + 3.1 1.26± .010 3.02 + .101 3.07 + 0.49 M26(n=12) 115 + 1.50 .241 ± .036 84.05 + 31.45 18.7 + 4.40 .186 + .030 24.4 + 6.1 1.27 + .045 2.94 + .435 3.42 + 0.75 M27(n=19) 11.3 + 1.25 256 + .045 64.60± 6.10 17.1 + 2.27 .200 + .033 21.7 + 2.8 1.29 + .059 2.86 + .430 3.98

184
among hop genotypes studied indicated that a positive linear relationship
existed between calculations using Wyatt and White' formula and Birch's
equation (Fig: 5.4).
Fig. 5.4. Relationship between rm(Birch) and rm(Wyatt and White) of TSSM. 0.4
0.0 y = 1.0056x - 1.1449e-2 RA2 = 0.954
0.0 0.1 0.2 • 0.3 rm(Wyatt and White)
0.4
5.3.2.2. Effects of experimental conditions: Since there was no
significant difference in the intrinsic rate of increase among the genotypes
used (Table 5.6), it is likely that, in general, mite responses are the same
on these genotypes. Consequently, data were grouped according to
rearing conditions, and comparisons of the data were repeated.
When survival of female adult mites on leaf discs of various hop
genotypes were compared under different environmental conditions,
similar survival curves of the adults were observed. The time required
for population survival to decline to the 75 and 50 per cent levels in all
the tests employed for this comparison are graphically depicted in Fig. 5.5.
Survival was greater on field hop leaf discs under humid conditions than
under any other rearing conditions at the 75 per cent survival level. -
However, greatest survival was on glasshouse hop discs under
moderately humid conditions at the 50 per cent survival level. As
indicated in Table 5.7, rearing conditions significantly affected the

5
30 40 Age (Days)
10 60 70
Test 1. humid conditions, glasshouse hop leaves of young plants, and light intensity = 700 lux
75% = 13.5 Days 50% =245 Days
Survival
Fecundity
1.0• -
0.8 -
0.6 -
0.4 -
0.2 -
0.0
Test 2. humid conditions, field hop leaves, and light intensity = 350 lux
75% = 20.5 Days 50% = 233 Days
15
10 0.4
a 0.2 0.0
Test 3. moderately humid conditions, field hop leaves, and light intensity = 460 lux
75% = 163 Days 50% = 20.5 Days
0.6 10
0.4
0.2
0.0
Test 4. moderately conditions, glasshouse hop leaves of old plants, and light intensity = 460 lux
75% = 19S Days 50% = 26.5 Days
0.4
0.2
- 20
-5 •••■•••••■ ••6111..........
0.8
0.6
0.8
0.6
15
10
0
Fig 5.5. Survivorship and average number of eggs laid per day per female on various hop genotypes under different conditions.
185

Glasshouse Humid 22.919 + 1.26 bc
Field Humid 28.718 + 1.13 d
Moderately 21.261 + 0.72 ah
•Glasshouse Moderately
17.709 + 1.99 a • Humid
Field Humid
186
longevity of reprodudng females. The average lifetime of adult females
was significantly longer on field hop leaf discs under humid conditions
in Test 1 than when kept at the environmental regimes in the other three
tests. It was notable that the mites on both glasshouse and field leaf discs
were able to survive longer under high humid conditions than under
moderately humid conditions.
Table 5.7. Average total number of eggs and longevity of TSSM under different environmental conditions.
Source Average life time/female of Conditions (days)
Average no.eggs/fernale
P= leaves
103.28 + 4.52 b
75.773 + 7.07 a
66.036 + 6.00 a
121.38 + 10.3 b
Means in columns followed by same letter are not significantly different (p >0.05; Fisher LSD).
The egg-to-egg developmental period of female mites in each
environmental regime is presented in Fig. 5.5. It was found that this total
developmental period of mites took longer on field hop leaf discs at the
•lowest light intensity (350 lux) under humid conditions than in the other
environmental regimes, whilst the mites reared on glasshouse hop leaf
discs at the highest light intensity (700 lux) under humid conditions had
the shortest period. The total numbers of eggs for leaf type under
different rearing conditions are given in Table 5.7. Highly significant
differences in average total number of eggs were apparent among these
environmental conditions. • Mites laid significantly more eggs on

187 -
glasshouse hop leaf discs than on field hop leaf discs. The daily egg-laying
curves of the mites under different conditions are shown in Fig. 5.5. Each
point on the ,curves represents the mean number of eggs per day. The
first peak of each curve varies according to different rearing conditions.
Under humid conditions, the maximum daily egg production on
glasshouse hop leaf discs was reached on the 12th. day after the first
deposition of the eggs, while the mites on field hop leaf discs were still
immature and the mites under moderately humid conditions had just
entered the reproductive stages. The mites reared under moderately
humid conditons had stopped producing eggs after a total of 58 days and
41 days of oviposition on field and glasshouse hop leaf discs, respectively.
The highest average peak oviposition for mites on glasshouse hop leaf
discs under humid conditions, field hop leaf discs under humid
conditions, field hop leaf discs under moderately humid conditions and
glasshouse hop leaf discs under moderately humid conditions were 15.87,
10.39, 10.79 and 12.34 eggs/female/day, respectively. This indicated that
the daily fecundity of mites reared under both humid conditions and
moderately humid conditions was lower on field hop leaf discs than on
glasshouse hop leaf discs, especially on the glasshouse hop leaves of
young plants.
Data presented earlier shows the effects of rearing conditions upon
survival and fecundity rates. These two reproductive parameters can be
used to estimate other more meaningful parameters (Table 5.8).
According to the analysis of variance, highly significant differences were
found in all of the parameters of this life table (p < 0.01). The intrinsic
rate of increase for the mites reared on the discs from glasshouse hop
leaves was higher than that from field hop leaves under both humid
conditions and moderately humid conditions. Values for the gross
reproductive rate calculated for each condition indicated that this ,

Reproductive Parameters • Glasshouse
and Humid
Field and
Humid
Field and
Moderately Humid
Glasshouse and
Moderately Humid
Source of Leaves and Conditions (Means + SE.)
188
Table 5.8. Life history analysis of TSSM under different rearing conditions.
Intrinsic Rate of 0.330± .007d 0.177± .003a 0.229 + .007b 0.257+ .008c Increase (Wyatt and White) p=0.0001" Intrinsic Rate of 0.322 + .007d 0.158± .003a 0.220 + .006b 0.253 + .007c Increase (Birch) p=0.0001" Gross Reproductive 71.91 + 3.18b 68.76 + 5.20b 51.75 + 5.07a 70.84 ±5.34b Rate p=0.0099" Net Reproductive 51.63 + 2.26b 37.89 + 3.54a 32.85 + 2.99a 60.69± 5.14b Rate p=0.0001" Capacity for 0.268 ± .007d 0.145 ± .003a 0.201 ± .005b 0.225 + .007c Increase p=0.0001" Mean Generation 12.29 ± .295a 22.38 ± .337c 15.30± .207b 15.74 + .361b Time (days) p=0.0001" Cohort Generation 14.9.3 + .504a 24.44 + .517c 16.73 + .408b 17.81 + .59513 Time (days) p=0.0001" Pre-reproductive 8.726 + .165a 16.68 + .105d 11.79 + .098c 11.28 + .125b Period (days) p=0.0001" Finite Rate of 1.381 + .009d 1.171 + .004a 1246 + .007b 1.288 + .009c Increase p=0.0001" Doubling Time (days) p?--0.0001"
2.171 + .048a 4.430 + .090d 3217 + .104c 2.821 + .13013
Natality p=0.0001"
4.536 + .252c 2.5%± .114a 3201± .185b 4.328 + .237c
Mortality 4.214 + .247b 2.438 + .112a 2.981 + .180a 4.075 + .231b pr--0.0001"
Means in the same row followed by the same letter are not significantly different (p > 0.05; Fisher PLSD)

189
summation of fecundity was significantly less on field hop leaf discs
under moderately humid conditions than under the other conditions
and there were no statistically significant differences among them. Under
different conditions, the net reproductive rates of mites on the discs cut
from glasshouse hop leaves were significantly higher than those from
field hop leaves. Significant differences of mites reared on different
sources of leaves were also found in the capacity for increase. Similarly,
significant differences in both mean generation time and cohort
generation time for mites reared under different conditions were
detected. The longest times were found in the mites on discs from field
leaves under humid conditions and shortest on glasshouse hop leaf discs
under the same conditions. The variation in pre-reproductive periods
among these environmental regimes were highly significant (p < 0.01).
The finite rate of increase on field hop leaf discs under humid conditions
was the smallest, followed by field hop leaf discs under moderately
humid conditions, on glasshouse hop leaf discs under moderately humid
conditions and on glasshouse hop leaf discs under humid conditions in
ascending order. On the other hand, doubling time (DT) was the reverse.
The mites reared on field hop leaves under humid conditions had lower
natality and mortality rates than under other conditions.
5.3.3. Experiment 3: The survival and fecundity of mites reared on
3 different surface areas of leaf discs cut from 24 genotypes grown in the
glasshouse and the field are shown in Fig. 5.6 and 5.7. It was apparent
that the longevity and oviposition of mites reared on leaf discs cut from
field leaves were greater than those on leaf discs from glasshouse. The
results also showed that survival and age-specific fecundity rates of the
female mites tended to be proportional to the surface area of the leaf disc
used, i.e., the longest periods of both survivorship and oviposition were
obtained on the largest surface area.

so 0 10 20 30 40 SO 60 70 80
0.8
0.6
0.4
0.2
0.0
0 20
Fig. 5.6. Survivorship of TSSM on different sizes and source of leaves.
1.0
0 10 20.30 40 50 600 10 20 30 40 50
Age (Days)
—a — Large
Medium
42*
Small
Fig. 5.7. Average number of eggs laid per day per living female TSSM on different sizes and sources of leaves.
190
Age (Days)

191
Throughout this experiment, no significant differences (p > 0.05) in
average number of progeny per female mite were found between
different surface areas of leaf discs (Fig. 5.8 and 5.9). However, average
total number of progeny per female was significantly lower on small than
on large surface areas. There were no significant differences in the
longevity of mites among these surface areas of leaf discs (p > 0.05). For
other reproductive parameters of the mites except gross reproductive rate,
natality and mortality, no significant differences (p > 0.05) among these
surface areas of leaf discs were found (Table 5.9).
Fig. 5.8. Average total number of eggs of TSSM on different surface areas of leaf discs.
200
a
Medium
Small Size
Fig. 5.9. Average longevity of TSSM on different surface areas of leaf discs.
Medium Small Size

192
Table 5.9. Life history analysis of TSSM on different surface areas of leaf discs.
•
Reproductive
Areas (Means + S.E.)
Parameters •
Large (2.70 an. diam.)
Medium (135 cm. diam.)
Small (1.00 cm. diam.) •
Intrinsic Rate of Increase (Wyatt) p=0.459Ons Intrinsic Rate of Increase (Birch) p=0.162Ons
0.286k .015
0.268 + .007
0.265 + .020
0.247± .015
0.253 + .013
0.230 + .007
Gross Reproductive 1193 + 1.40c 80.90 + 7.45b 54.30 + 2.25a Rate p=0.0048** Net Reproductive 83.42 + 2.61 53.91 + 15.2 36.61 + .050 Rate p=0.0735ns Capacity for 0.220 + .009 •0.213 + .008 0.208 + .007 Increase p=0.6022ns Mean Generation 16.52 + 346 15.98 + .234 15.70 + .453 Time (days) p=0.3767ns Cohort Generation 20.14 + .690 18.51 + .688 17.36 + .578 Time (days) p=0.1234ns Pre-reproductive 11.32 + 315 11.38 + .290 11.55 + .200 Period (days) p=0.8304ns Finite Rate of 1.307± .010 1.280± .019 1.258 + .008 Increase p=0.1672ns Doubling Time (days) p=0.1653ns
2.589± .073 2.818 + .166 3.022 + .088
Natality p=0.0048"
4.134 + .158c 3.208 + .097b 2597± .026a
Mortality 3.866 + .165c 2.961 + .083b • 2.367± .033a p=0.0052"
Means followed by the same letter in the same row are not significantly different using Fisher PLSD of Statview (p>0.05). .

193
5.4. DISCUSSION
5.4.1. Genotypic effects.
It is generally accepted that the susceptibility of the host plant is
reflected in the life history of the mite, i.e. greater susceptibility should
proportionately increase mite reproductive fitness (Trichilo and Leigh,
1985). The results reported here appear to support this hypothesis as
there were differences in life history statistics among the genotypes
studied, although they were not significant (p > 0.05). It was found that
the highly susceptible genotype M26 resulted in a faster growth rate of the
mite population than did the slightly susceptible genotype M4. This may
be due to slight differences in various interrelated life history parameters,
which led to somewhat lower or higher intrinsic rates of increase (rm) of
mites on these genotypes.
Reproduction of organisms with a high rm such as spider mites,
seems highly dependent on the variation in developmental rates
(Caswell, 1982; Lewontin, 1965; Snell, 1978), whilst fecundity becomes
more important in changing population growth rate of organisms with
low rm (Romanow et al., 1991). For this reason, it was likely that slight
differences in the value of rm among all genotypes studied, may be due to
the influence of developmental rates of mites. Similar observations were
made by Peters and Berry (1980a), who indicated that there were highly
significant differences in• developmental rates of TSSM between hop
genotypes.
Even though the results from this study indicated that pre-
reproductive periods of TSSM on the slightly susceptible genotype were
longer than those on the highly susceptible genotype, none of these
differences was significant (p > 0.05). Nevertheless, the effect of different
hop genotypes on mite development was apparent during the first 12
days of the reproductive period and the highest differences in the

194
cumulative number of eggs were found on the fourth day of oviposition.
The rankings of the number of eggs laid for each genotype were in
agreement with those of the degree of susceptibility and the pre-
reproductive periods. This indicates that adult females on highly
susceptible genotypes may be older than those on slighly susceptible ones.
Li and Harmsen (1993), working in the laboratory with TSSM on leaf discs
of lima beans, found that the maternal age of TSSM had significant effects
on fecundity. In addition, Wrensch and Young (1975), working with
TSSM on kidney beans, indicated that the cumulative egg laying for 18
days may have been used as a predictor of total egg production.
Peters and Berry (1980a) reported that the variation in mean
number of eggs laid on leaf discs of four hop varieties by unmated TSSM
females during five days was not significant. This does not appear to be
in agreement with the present studies, which indicated that highly
significant differences in the number of eggs were apparent on the 4th.
day of oviposition. However, these authors' data represented mainly the
average fecundity rate over the five-day period, while the data of the
present studies represent the cumulative rate for a one-day period. Other
reasons, such as the hop genotypes employed, also may have been
responsible for the discrepancies between these two results.
Although the oviposition of mites described above seem to be a
useful parameter, the age-specific fecundity was a variable criterion due to
differences in ranking for these genotypes between the earlier and later
reproductive periods. In this study, the average numbers of eggs laid on -
the 4th. day on M4, M9, M26 and M27 were 19.75, 26.38, 30.71 and 40.92,
respectively, while those on the final date of oviposition test were 89.25,
78.94, 84.57, and 120.7 for M4, M9, M26 and M27, respectively (Table 4).
Several investigators (Arcanin, 1958; Bohm, 1961; Gasser, 1951;
Williams, 1954; Lehr and Smith, 1957; Rambi&', 1958; Shih et al., 1976)

195
showed egg production per female in the range 30-312 eggs at a rate of 2-12
per day. An average number of 70 eggs per female over a biweekly period
can be suggested as typical of the species. Unwin (1971) stated that the
reproduction of the mite population may be affected by host genotype.
For example, the population potential on Queensland apples was
observed to be greatest on Delicious and least on Gravenstein (Bengston,
1970).
In addition, the results from this study show that the survival
trends of female adults were fairly similar on all genotypes tested. Using
the 25% difference criterion of Southwood (1978), significant differences
were found in values of gross reproductive rate, net reproductive rate,
• capacity for increase, natality and mortality between some genotypes,
indicating variation in mite survival and reproduction on different hop
genotypes. It was also apparent that the higher mortality associated with
higher intrinsic rate of increase may be due to reproductive exhaustion.
Birch (1948) defined the intrinsic rate of increase (rm ) as the
• constant 'r' in the differential equation for population increase in an
unlimited environment. The equation combines several biological
components and has immense value in the biological components and
ecological understanding of tetranychid mites. In the present study, the
equation of Wyatt and White (1977) . proved to be more convenient
method of assessing the intrinsic rate of increase obtained from the
equation of Birch (1948). Birch's equation resulted in part from survival
data, which were not required for the intrinsic rate equation of Wyatt
and White.
5.4.2. Environmental effects
• In addition to genotypic effects, several environmental factors
affected mite population growth rate in these studies, for example
humidity, light intensity, plant age, source of leaves and leaf surface.

196
areas. Changes in these factors may contribute to the variation in mite
population build-up on the plant.
The environmental iactors may have a profound effect on the
expression of• resistance. It is known that the environment may have a
controlling effect on the expression of many genetic characters, thus it
might be expected that a plant could display a varying degree of resistance
or susceptibility under different environmental conditions. This has
been pointed out by Painter (1954), who cited several examples of this
phenomenon.
At the optimum level, humidity and light intensity may in some
way affect TSSM directly so that the mites are better able to -survive and
reproduce on the plants. On the other hand, both factors may affect
certain physiological or other processes of the plant itself so that it
becomes more favorable for mite feeding and survival.
The results obtained from Tests 2 and, 3 show that humidity may
have been responsible for the differences in mite survival and
reproduction between humid and moderately humid conditions. Using
the mature leaves of field hop plants, humid conditions resulted in
greater longevity and lower fecundity than moderately humid
conditions. This is in accordance with the data presented by Boudreaux
(1958) who found that mites oviposited at a higher rate in a dry
atmosphere than in a wet atmosphere and attributed this to their ability
to ingest and utilize larger amounts of food in a dry atmosphere through
the elimination of body moisture by evaporation from the cuticle.
However, Boudreaux's findings that mites also lived longer under dry
conditions were not supported by the above longevity data. It is well
known that humidity is a critical factor which strongly affects the value of
m in mite life history studies (Carey, 1982a). In addition, Tulisalo (1974),
- whb studied the effect of relative humidity on survival and reproduction•

197
of TSSM under laboratory conditions, showed that conditions of constant
high relative humidity resulted in the production of fewer eggs, and
shorter longevity for egg-laying females than at a constant low relative
humidity.
For light intensity, an acceleration of mite growth rate was due to a
decrease in the pre-reproductive period, which may in turn result from
high light intensity. This indicated that greater levels of susceptibility to
TSSM in plants as light intensity increased. This is in accordance with
the results of numerous studies of the influence of light intensity on
arthropod performance which have shown loss of resistance of plants
with decreasing light intensity (Tingey and Singh, 1980).
The results from the present study also indicated that the fecundity
of mites reared on glasshouse hop leaves was higher than those on field
hop leaves. This may have been due to differences in nutrient content
and leaf texture and hardness between these hop leaves. Campbell et al.
(1990) working with apple and peach leaves, showed similar results; that
is, greenhouse-grown leaves are more susceptible to mite feeding than
field-grown leaves.
With regard to plant age, the results obtained from Tests 1 and 4
show significant differences in growth rates of mites between glasshouse
hop leaves of young plants and those of old plants. The growth rate of
mites was greater on leaf discs of the young plant than on those of the old
plant. This indicated that the growth rate of TSSM decreased with the
chronological age of the host plant. Watson (1964), working with TSSM
on bean plants, reported that fecundity was reduced on older plants but
survival was not affected. The growth rates of tetranychids depend not
only on the age of the host plant but also on the phase of the plant
nitrogen cycle (Yaninek et al., 1989). In general, the ratios of carbon to
nitrogen in hop plants vary at different Hines in the annual cycle

198
(Rybacek, 1991). Howeler and Cadavid (1983), working with cassava,
stated that aging leaves have reduced leaf nitrogen. A subsequent
investigation by Wermelinger et al. (1985) showed that the reduction of
leaf nitrogen influenced development rates and fecundity in TSSM.
In the feeding surface area study, there were significant differences
in gross reproductive rates, natality and mortality of mite populations
among the three feeding surface areas studied. Although no significant
differences were recorded in the-other parameters at the 0.05 level, the
trend in survivorship indicated that the mortality rate for mites confined
on the smallest area was significantly affected during the initial period
when mite numbers were high. This would indicate density related
competitive effects on mite activity. Mitchell (1973) found that the
available area of TSSM feeding was approximately 9.4 + 0.97 mm2
although Li and Harmsen (1993) found that female density was not an
important factor in determining fecundity.

199'
CHAPTER 6 INFLUENCE OF ENVIRONMENTAL
FACTORS ON POPULATION INCREASE OF TSSM
6.1. INTRODUCTION
In general, environmental factors which permit economic pests to
increase to destructive numbers are of particular interest in agricultural
entomology. These factors include temperature, humidity, plant
variables and light intensity. For TSSM, the effects of temperature,
relative humidity and plant variables on the ability to increase have been
explored most extensively by several workers (Nickel, 1960; Watson, 1964;
Herbert, 1981; Carey and Bradley, 1982), whereas those of light intensity
have not been investigated.
As the results in the previous chapter demonstrated the influence
of rearing conditions on reproductive parameters of TSSM, the present
study was designed to characterize the effects of the environmental
factors on TSSM population increase and to determine whether the
degree of hop susceptibility to TSSM was related to the environmental
factors.
6.2. MATERIALS AND METHODS
6.2.1. Plant and spider mite culture: The two genotypes of hops
used, M4 and M27, were grown under both field and glasshouse
conditions. Cultures of TSSM were maintained on dwarf bean leaves in a
controlled temperature room under a photoperiod of 16:8 (L:D) at ca. 25°C
and 30-40%R.H.
6.2.2. Experimental procedures: Procedures employed in these
studies were the same as those described in Chapter 5 except for the
modifications necessary to maintain controlled temperatures, humidities
and light intensities. All experiments were conducted in a Contherm
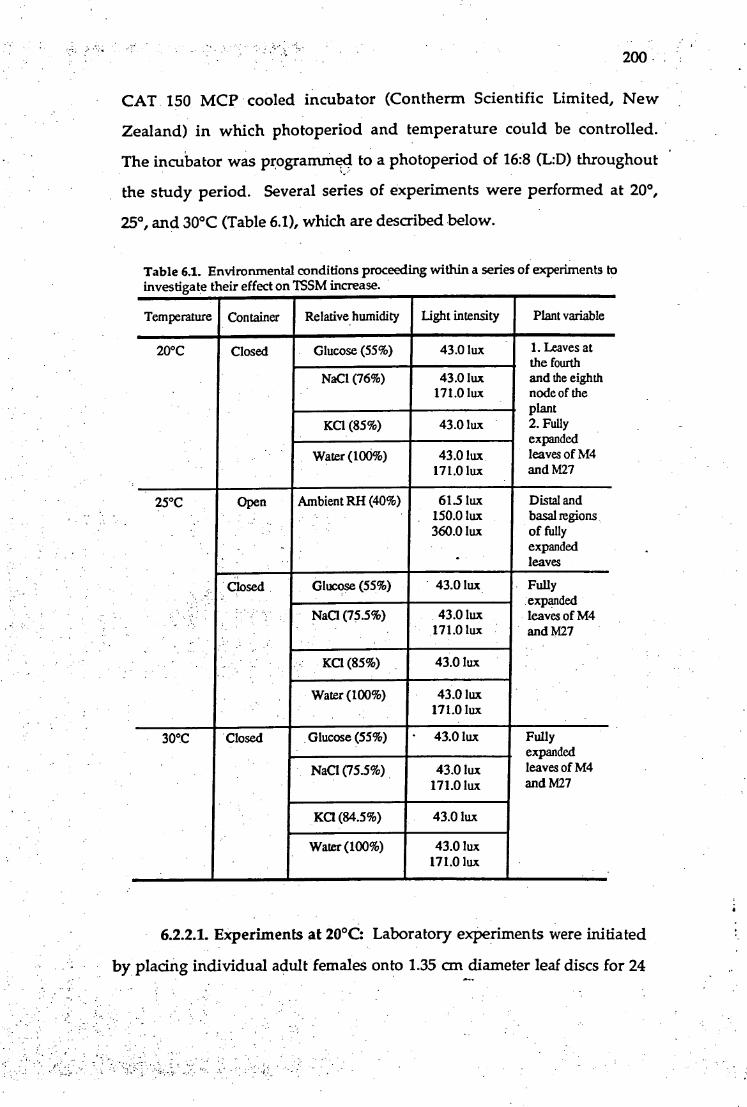
200
CAT 150 MCP cooled incubator (Con therm Scientific Limited, New
Zealand) in which photoperiod and temperature could be controlled.
The incubator was programmed to a photoperiod of 16:8 (L:D) throughout
the study period. Several series of experiments were performed at 20°,
25°, and 30°C (Table 6.1), which are described below.
Table 6.1. Environmental conditions proceeding within a series of experiments to investigate their effect on TSSM increase.
Temperature Container Relative humidity Light intensity Plant variable
20°C
•
•
Closed Glucose (55%) 43.0 lux 1.Leaves at , the fourth
NaC1 (76%) 43.0 lux 171.0 lux
and the eighth node of the plant
KG (85%) 43.0 lux 2.Fully expanded
Water (100%) 43.0 lux 171.0 lux
leaves of M4 and M27
25°C
•
Open
.
Ambient RH (40%) 613 lux 150.0 lux 360.0 lux
Distal and basal regions of fully expanded leaves
Closed Glucose (55%) 43.0 lux Fully expanded leaves of M4 and M27
NaC1 (75.5%)
,
43.0 lux 171.01ux
KG (85%) 43.0 lux
Water (100%) 43.0 lux 171.0 lux
30°C Closed Glucose (55%) . 43.0 lux Fully , expanded leaves of M4 and M27
NaC1 (75.5%) 43.0 lux 171.01ux
Ka (84.5%) 43.0 lux
Water (100%) 43.0 lux 171.0 lux
6.2.2.1. Experiments at 20°0 Laboratory experiments were initiated
by placing individual adult females onto 1.35 cm diameter leaf discs for 24

201
h to allow oviposition. The females were then removed and eggs were
either added, removed, or transferred to bring the total number to five
eggs per leaf disc. A rearing unit consisted of leaf discs placed in a petri
dish ranging from 2 to 13 discs depending on the number of eggs laid.
The leaf discs were cut from fully expanded mature leaves of hop plants
under field conditions. In addition, leaves at the fourth node and the
eighth node of the hop plant under glasshouse conditions were also
employed for studying the effect of leaf age on the mite populations. The
rearing units rested on hardware platforms in plastic food containers, 28 x
21 x 7 cm, with tight fitting lids. Humidity was controlled by the use of
various saturated solutions in the bottom of the container (Winston and
Bates, 1%0). The four main relative humidity levels used were low (55.0
percent), moderate (76.0 percent), high (85.0 percent) and very high (100
percent). The solutions used in maintaining these levels were: low-
glucose, moderate-sodium chloride, high-potassium chloride, and very
high-water. At each humidity level, the rearing units were illuminated
by fluorescent lamps at a light intensity on the rearing unit of about 43
lux. Furthermore, another intensity of illumination at approximately 171
lux was provided for rearing units at both moderate and very high
humidities by covering the container with glass held in place with
petroleum jelly.
6.2.2.2. Experiments at 25°C: Two types of containers were used in
this series of experiments. The first type used was open containers in
which relative humidity was similar to that of the ambient air in the
incubator (ca. 40% RH). The container consisted of a petri dish covered
with a plastic lid containing a hole for ventilation. Four leaf discs cut
from distal and basal regions of the fully expanded leaves of M4 and M27
(i.e., one from the distal and one from the basal for each genotype) were
placed in each petri dish and three eggs of TSSM were allowed to remain

202
on a leaf disc. Three intensities of illumination employed at the level of
the leaf disc included 61.5, 150, and 360 lux. A total of 36 eggs was tested at
each light intensity.
The other type of container used was those previously described in
the series of experiments at 20°C. Only the full expanded leaves of M4
and M27 were employed for cutting leaf discs in this container. The
remaining steps of this procedure were similar to those in the previous
experiment.
6.2.2.3. Experiments at 30°C: All experiments for closed containers
were performed as at 25°C. Open container experiments were omitted.
6.2.3. Data analyses
Three life-history traits of TSSM on different genotypes of hops
were examined. They were the length of egg and egg to adult
development time, and age at first oviposition. In addition, the intrinsic
rate of natural increase (rm) of a culture was calculated from the equation
(Wyatt and White, 1977), as follows: -
rm = 0.74 (loge Md)/d
where d is minimum pre-reproductive time (birth to first reproduction)
and Md is the number of progeny produced in an equal time of the pre-
reproductive time.
Also calculated were the mean generation time (T) as given by the
following formula (Wyatt and White, 197):
T = 4d/3.
Data from the experiments were analyzed separately as completely
randomized designs with unpaired t-test for two group tests and analysis
of variance (ANOVA) for 3 or more group tests. Means were compared
using least significant difference analysis with an alpha level of 5%.
Linear regressions were performed using the curve fit procedure of the
Cricketgraph computer program.

203
6.3. Results
6.3.1. Temperature
6.3.1.1. The first series of experiments: Table 6.2 presents the
number of TSSM individuals alive at each age interval when reared on
two genotypes of hops at 76%RH, a light intensity of 171 lux and three
temperatures. As can be seen from the table, generation mortality (egg to
adult) varied from 30% on M4 to 10% on M27 at 20°C, 0% to 16% at 25°C
and 27.69% to 36.92% at 30°C. At all temperatures, the mortality rate of
the immature stage was higher than that of the egg stage. For both stages,
the mites reared at 30°C suffered the highest mortality.
Table 6.2. Life table of TSSM on two hop genotypes at 76%RH under
constant illumination (16L:8D; 171 lux) and at three temperatures.
Temperature Genotype Xa 1xb dxc d . . sxe Generation mortality (%)
20°C M4 Egg 20 2 0.100 0.900 Immature f 18 4 0.222 0.778 Adultg 14 30.00%
M27 Egg 20 0 0.000 1.000 Inunature 20 2, 0.100 0.900 Adult 18 10.00%
25°C M4 Egg 25 0 0.000 1.000 Immature 25 0 0.000 1.000 Adult 25 0.00%
M27 Egg 25 0 0.000 1.000 Immature 25 4 -0.160 0.840 Adult 21 16.00%
30°C M4 Egg 65 5 0.077 0.923 Immature 60 13 0.217 0.783 Adult 47 27.69%
M27 Egg 65 11 0.169 0.831 Immature 54 13 0.241 0.759 Adult 41 36.92%
a = Stage of life cycle. b = Number living at beginning of stage in the x colurrm. c = Number dying within stage in the x column. d = Probability of dying during x. e = Probability of surviving interval x. f = Larva + Protonymph + Deutonymph. g = Female + Male.

204
When the mites reached adulthood, sex ratios were observed to
favour females for all 3 temperature regimes (Table 6.3). Nevertheless,
sex ratio determinations indicated a shift towards a smaller female:male
ratio with an increase in temperature.
Table 6.3. Sex ratio of TSSM at 76%RH, constant illumination (16L:8D;
171 lux) and three temperatures.
Temperature
Adult females Adult males
20°C 23 9
25°C 33 13
30°C 57 31
• The developmental time in days for eggs of TSSM on both M4 and
M27 varied significantly (p < 0.01) for the three rearing temperatures (Fig.
6.1). The length of egg development was longest at 20°C and shortest at
30°C.
Fig. 6.1. Developmental period for eggs of TSSM on M4(A) and M27(B) at 76% RH and 171 lux. Columns with the same letter are not significantly different (p > 0.05; PLSD). 10
8
25
30
Tempezature (°C)

y = - 5.4713e-2 + 9.3121e-3x RA2 = 0.996 Threshold temperature for eggs = 5.88°C
Rec ip
roca
l of e
gg p
erio
ds
205
From the regression of the reciprocal of the development time on temperature the threshold of development where x = -a/b was calculated.
The rate of development through the egg stage was expressed by y =
9.3121e-3x - 5.4713e-2 (r2 = 0.996) with a threshold temperatue of 5.88°C
(Fig. 6.2).
Fig. 6.2. The regression of the reciprocal of the developmental period for eggs in days (y) on temperature (x) .
For females and males, the developmental periods of the active
and quiescent periods for larva, protonymph and deutonymph reared on
M4 and M27 within each of the temperature ranges are presented in Fig.
6.3A and B, respectively. Comparisons of the three rearing temperatures
show that the length of the developmental periods for females and males
on both genotypes decreased with increasing temperature levels. At 20°C,
the developmental period from active larva to quiescent deutonymph of
the female on both genotypes was longer than that of the male.
However, the developmental periods were nearly identical for both
female and male at 25° and 30°C. A comparison between the hop
genotypes also shows that the developmental periods for females and

M4 (30°C)
M27 (30°C)
M4
M27 M4 M27 (20°C)
(20°C) (25°C) (25°C)
Genotype
(Temperature)
go Quiescent deutcmymph 0 Active deutonymph
12] Quiescent protonymph
El Active protonymph
Es Quiescent larva Active larva
'
-;077 r -
•
8
_AO:43
•E-KaniaZii • /
IVAN°
12
10
.S 2
206
males on M4 were longer than those on M27 at 20°C, but the
developmental periods of the mites at 25° and 30°C were nearly identical
for both genotypes.
Fig. 6.3. Developmental period from active larva to quiescent deutonymph of TSSM on M4 and M27 at 76% RH and 171 lux.
The threshold temperature of development (x at y = 0) varied from
8.13° to 15.16°C and 5.680 to 15.68°C for active and quiescent immature
stages of female and male TSSM, respectively (Table 6.4). When the data
for the postembryonic stages were pooled the temperatures for threshold
of development for females and males were 10.99° and 11.33°C,
respectively.

25 Temperature (°C)
20
Arezow,a
d/WW,A. Witi/SA
oft
d 7W, /OS;
(274Wff:/
yr..777470/0„, Am • /- •
207
Table 6.4 Determination of the developmental threshold temperature(°C) for TSSM at 76%RH and 171 Lux
Stage
Threshold temperature (°C)
(X(Y))
Female Male
Active larva 8.41 5.68
Quiescent larva 1236 1232
Active protony-mph 8.13 10.71
Quiescent protonymph 15.16 15.68
Active deutonymph 10.15 12.16
Quiescent deutony-mph 10.59 7.51
Postembryonic stages 10.99 11.33
For both M4 and M27, there were highly significant differences (p <
0.01) in the developmental period from eggs to adults of TSSM females
among the three temperatures selected (Fig. 6.4). The shortest periods of
the total pre-adult development occurred at 30°C and the longest at 20°C
Fig. 6.4. Developmental period from eggs to adults of TSSIVI females on M4(A) and Is/127(B)
at 76% RH and 171 lux.

208
In addition, temperature had a significant influence on the pre-
reproductive period (egg-to-egg developmental period) of TSSM on M4
and M27 (Fig. 6.5A and B). The longest and shortest periOds were found
to occur at 200 and 30°C, respectively.
Fig. 6.5. Pre-reproductive periods of TSSM on M4(A) and M27(B) at 76%RH and 171 lux. Columns with the same letter are not significantly different (p > 0.05; PLSD).
30
20
25
30 Temperature (°C)
6.3.1.2. The second series of experiments To determine whether
the effects of temperature on the duration of immature stages under
various conditions would give different results from each other, a series
of observations for the three rearing temperatures as mentioned
s previously were conducted at a light intensity of 43 lux under. low

20
10
30
20
10
30
20
10
30
20
10
209
(55%RH), moderate (76%RH), high (85%RH) and very high (100%RH)
humidity conditions. The results of these observations are illustrated in
Fig. 6.6. Although developmental periods of the immature stages were
shortest at 30°C, the duration within each immature stage does not show
a consistent trend at the three temperatures under these conditions. At
each temperature, most of the mites could not reach adulthood under
very high humidity (100%RH).
Fig. 6.6. Developmental time of TSSM on M4 and M27 at a light intensity of 43 lux.
30 Glucose (55%R1-1)
• . e. /A V A ....,...,.
-•
,a.....t,',..-..\..
/..!- "=.
•- - - - - ......
", 2 ,.. -,> . " el.; • ..u.....;.ft.,.( k: '-, .,--,••••-e e - e
•:. '...Y4A: .:35': %.:.-.V ' -14q*...
NaC1 (76%RI-1)
— ......---..
...:,.;;,....:.,
1::::::,":":4•FN•fri
-,...:;.-";-. • i•'•••<\••‘N.'" -
• .... < •••"-.., :•: . : .. :::::::::
... .-.•:•••\.•
....ft ..• .,•••••::.:::::::::
..%. • ,•.•A -.> \ ••••::-, z --Vw:i. •."'kV.:::::M.
KC1 (85%RH) ,:•••,,..„:::...
A
... . . ..._ -v.v..-- ..-,......,
: : .........,,,,,,,..• ---,--- - -,„„.
•,..1v.::.::•,........, .- -------- -- . ... ..: ..: ... )....1:::1,i:',4, . .:.'"■,;, „ ., , ,,,,,.• , , .:':;:. :::'. l4 A
Water (100%RH)
--- --.,..1'.• • -
.;rs./.1."7/ • :•:::,.;f::;:r:*:*:::::::‘: •••:;•.r...9',./ :::;::02%;:4.1:0.1.•::•':
'. ' ' ./. ./4.• .--, s o,
, :::::',.:$:•••••:.• .::••••:::•Z ..
.. ::•::::::•• :.:•••••::: s. :s.• ••::%ii:?•§:::::?::!:
qiii:::•":.g...i:::4E+
::::',:ii:::.:N§::•::1%.‹:
Genotype/Temperature
fl Quiescent deutonymph
III Active deu to nymph
0 Quiescent pro tonymph
El Active pro tonymph
M Quiescent larva
El Active larva
Egg
The time spent in development represents approximately 39.20,
20.60, 19.37 and 20.83% of the juvenile stage for eggs, larvae, protonymph
and deutonymph, respectively (Table 6.5). The longest time was spent in
the egg stage. It was also found that the proportion of the egg period

210
• increased with an increase in temperature from 20° to 25°C and began to
level off between 25° and 30°C.
Table 65. Percentages representative of developmental periods for all immature stages of TSSM under various conditions.
Temperature Genotype Humidity Stages
Egg Larva Pro tonymph Deutonymph
20°C M4 55%RH 27.83 18.55 26.67 26.95 76%RH 36.04 24.02 18.62 21.32 85%RH 26.82 22.99 28.35 21.84
100%RH
M27 55%RH 33.61 15.96 27.74 22.69 76%RH 36.50 19.46 19.46 24.58 85%RH 38.54 23.02 21.53 16.92
100%RH 28.85 23.08 21.16 26.92
25°C M4 55%RH 37.50 31.25 12.50 18.75 76%RH 43.25 10.66 17.17 21.80 85%RH 50.00 14.00 14.00 22.00
100%RH
M27 55%RH 39.74 23.95 21.77 14.53 76%RH 46.36 16.43 17.02 20.19 85%RH 46.68 16.92 2334 13.07
100%RH 40.74 25.93 11.11 22.23
30°C M4 55%RH 39.31 18.84 21.29 20.56 • 76%RH 43.36 15.93 17.71 23.01
85%RH 48.34 12.33 18.96 20.38 100%RH 33.33 38.89 16.67 11.12
M27 •55%RH 31.08 22.30 20.95 25.67 76%RH 50.61 14.30 14.30 20.79 85%RH 44.62 16.61 16.61 22.13
• 100%RH
Average 39.20 20.60 19.37 20.83
The duration of the pre-reproductive period of TSSM females on
different hop genotypes in various environments is presented in Fig. 6.7.
It was apparent that the average time of egg-to-egg developmental periods
decreased with increasing temperature levels. The pre-reproductive

211
periods for the 3 constant temperature regimes fluctuated between 10.90
and 31.00 days.
Fig. 6.7. Pre-reproductive period of TSSM on two hop genotypes between different temperatures at 55%RH(A), 76%RH(B), and 85%RH(C) at a light intensity of 43 lux.
20 25
30 Temperature (°C)
Values of the intrinsic rate of natural increase (rm) calculated for
cohorts of TSSM females at each tempera hire level within any given
conditions are presented in Fig. 6.8. The value of rm was lowest on M4 at

212
20°C and highest on M27 at 30°C. This larger rm was related to shorter
generation times (Fig. 6.9 A, B, and C). It can be seen from the figures that
the mean length of generations decreased as constant temperatures
increased. These estimates of reproductive indices indicate that of the
temperatures tested, the most favourable temperature for population
increase is 30°C. Fig. 6.8. Intrinsic rates of increases of TSSM on different hop genotypes at 55%RH(A), 76%RH(B) and 85%RH(C) at a light intensity of 43 lux and three temperatures.
20 25
30 Temperature (°C)

213
Fig. 6.9. Mean generation times of TSSM on different hop genotypes at 55%R1-1(A), 76%RH(B) and 85%RH(C) at a light intensity of 43 lux and three temperatures. ao
20 25
30 Temperature (°C)
Using the average values of the developmental periods for eggs
under various conditions as mentioned previously, a two-way analysis of
variance was performed (Table 6.6). Highly significant differences in egg
Mean genera tion time (day s)

214
periods were detected among different temperatures (p < 0.01). However,
there were no significant differences in these periods among different
genotypes and no significant interaction between genotypes and
temperatures was found (p > 0.05). According to Fisher's protected least
significant differences test, the duration of egg periods at 30°C was
significantly shorter than that at 200 and 25°C (Fig. 6.10).
Table 6.6. Analysis of variance of the developmental periods for eggs of TSSM on two hop genotypes at 43 lux.
Source: df: Sum of Squares: Mean Square: F-test P value:
Temperature (A) 2 29.097 14.549 22.409 .0001
Genotype (B) 1 0.363 0.363 0.559 .4650
AB 2 0.415 0.207 0320 .7307
Error 17 11.037 0.649
Fig. 6.10. Developmental periods for eggs of TSSM at 20°, 25°, and 30°C.
20 25
30 Temperature (°C)
Because of the high mortality in rearing the mites within very
high humidity conditions (100%RH), information other than that

Fig. 6.11. Developmental periods from eggs to adults of TSSM at 20°, 250, and 30°C 30
.E 0 20
4
215
regarding duration of the egg stage is incomplete. The other three
conditions (55%, 76% and 85%RH) were tested for the developmental
period from eggs to adult, the pre-reproductive period, the intrinsic rate
of increase and the mean generation time.
Analysis of variance of the developmental period showed highly
significant differences between temperature levels (Table 6.7). Immature
mites developed faster at 30°C than at 20° and 25°C in this series of
experiments (Fig. 6.11). The developmental period of mites reared on
different genotypes did not vary significantly (Table 6.7). Furthermore,
there was no significant interaction between temperatures and genotypes.
Table 6.7. Analysis of variance of the developmental periods from eggs to adults of TSSM on two hop genotypes at 43 lux.
Source: dl: Sam of Squares: Mean Square: F-test.: P value:
Temperature (A) 2 334.359 167.179 9.982 .0018
Genotype (B) 1 1.084 1.084 0.065 .8026
AB - 2 38.688 19.344 1.155 .3415
Error 15 251.210 16.747
20 25
30 Temperature (°C)

Fig. 6.12. Pre-reproductive periods of TSSM at 20°, 25°, and 30°C. 30
.S 20
20
25
30 Temperature (°C)
216
Table 6.8 shows that the pre-reproductive period of female mites
under various conditions varied significantly among temperature
regimes, whereas no significant differences between genotypes as well as
no significant interaction between temperatures and genotypes were
detected (p > 0.05). It was apparent that the mites at 30°C had the shortest
period and the mites at 20°C had the longest period (Fig. 6.12).
Table 6.8. Analysis of variance of the pre-reproductive periods of TSSM on two hop genotypes at 43 lux.
Source: df: Sum of Squares: Mean Square: F-test: P value: Temperature (A) 2 468.723 234.361 10.753 .0013 Genotype (B) 1 0.016 0.016 0.001 .9790 AB 2 49.984 24.992 1.147 .3440 Error 15 326.917 21.794
According to analysis of variance, intrinsic rates of increase of
mites reared at different temperatures varied significantly whilst
variation among genotypes was not significant (Table 6.9). There was no

217 .
significant interaction of this value between temperatures and genotypes.
The highest value was found at 30°C and the lowest value was found at
20°C (Fig. 6.13).
Table 6.9. Analysis of variance of the intrinsic rates of increase of TSSM on two hop genotypes at 43 lux.
Source: df: Sum of Squares: Mean Square: F-test: P value:
Temperature (A) 2 0.089 0.045 13.727 .0004 Genotype (B) 1 3.442E-4 3.442E-4 0.106 .7496 AB 2 0.009 0.005 1.395 .2781 Error 15 0.049 0.003
Fig. 6.13. Intrinsic rates of increase of TSSM at 20°, 25°, and 30°C.
03
0.1
0.0
25
30 Temperature (°C)
For mean generation times, analysis of variance showed significant
differences among the given temperatures (Table 6.10). In addition, it can
be seen from the table that there were no significant differences in the
mean generation time between genotypes selected and no significant
interaction between genotypes and temperatures was found. Populations

218
of TSSM at 30°C had the shortest mean generation time, whereas those at
20°C had the longest. The mean generation was greatest at 20°C and least
at 30°C (Fig. 6.14).
Table 6.10. Analysis of variance of the mean generation times of TSSM on two hop genotypes at 43 lux.
Source: df: Sum of Squares: Mean Square: F-test P value: Temperature (A) 2 699.279 349.640 8.924 .0028
Genotype (B) 1 1.383 1.383 0.035 .8535 AB 2 40.876 20.438 0.522 .6039 Error 15 587.720 39.181
Fig. 6.14. Mean generation time of TSSM at 20°, 25°, and 30°C.
20 25
30 Temperature (°C)
6.3.2. Humidity
6.3.2.1. The first series of experiments: Comparison of the juvenile
survival between mites reared under conditions of controlled relative
humidity with the NaC1 solution (76%RH) and those reared at a
humidity near saturation without the salt (100%RH) at 20°-30°C and a
light intensity of 171 lux shows that the percentage of immatures
reaching adulthood on both M4 and ilM27 was higher at 76%RH than at
100%RH (Table 6.11). Generation mortality varied from 30.91% on M4 to

219
27.27% on M27 at 76%RH and 78.13% to 44.74% at 100%RH. Sex ratios of
immatures becoming adults were observed to favour females for both
humidity regimes (Table 6.12). This favovrability was most evident at
100%RH which averaged about four females to one male. At 76%RH, sex
ratio determinations indicated a shift towards a smaller female:male
ratio.
Table 6.11. Life table of TSSM on two hop genotypes at 20-30°C under
constant illumination (16L:8D; 171 lux) and at two humidities.
Humidity Genotype Xa. lb „L. sxe Generation mortality (%)
75%RH M4 Egg 110 7 0.0636 0.9364
Immature 103 17 0.1650 0.8350
Adultg 86 30.91%
M27 Egg 110 11 0.1000 0.9000
Immature 99 19 0.1919 0.8081
Adult 80 27.27%
100%RH M4 Egg 64 17 0.2656 0.7344
Immature 47 33 0.7021 0.2979
Adult 14 78.13%
M27 Egg 76 6 0.0790 0.9210
Immature 70 28 0.4000 0.6000
Adult 42 44.74%
a = Stage of life cycle. b = Number living at beginning of stage in the x column. c = Number dying within stage in the x column. . d = Probability of dying during x. e = Probability of surviving interval x. f = Larva + Protonymph + Deutonymph. g = Female + Male.
Table 6.12. Sex ratio of adult TSSM at 20-30°C under constant
illumination (16L:8D; 171 lux) and at two humidities.
Relative humidity
Adult females Adult males
75% • 113 53
100%
46 10

7
.4 6
.E
E .a 4
220
Because of the high mortality of mites reared at 200 and 25°C under
very high humidity conditions, all the following results in this section
are based on the data collected on mites reared at 30°C and a light
intensity of 171 lux under moderately and very high humidity
conditions. According to an unpaired t-test, there were highly significant
differences (p < 0.01) in developmental period for eggs between these two
humidity conditions (Fig. 6.15). The duration of egg stage varied from
4.45 at 76%RH to 5.84 days at 100%RH and 4.46 at 76%RH to 5.44 days at
100%RH for the mites on M4 and M27, respectively.
Fig. 6.15. Developmental period for eggs of TSSM on M4(A) and M27(B) at 30°C and 171 lux.
76% 100% 76% 100% Relative humidity Relative humidity
The developmental times for each postembryonic stage of both
female and male immatures on M4 and M27 at 76% and 100%RH are
illustrated in Fig. 6.16A and B. On both genotypes, the mites reared at
76%RH developed faster than those reared at 100%RH. At each stage the
mites at 100%RH took longer to develop than those at 76%RH.

10
7 h V ,e liNEEMME ..EMEMBE '427 %/*
ir0:41W4 M27 (76%) M4 (100%) M27 (100%)
Lr =7 . / --./ /
M4(76%) M27 (76%) M4 (100%) M27 (100%)
Genotype (Relative humidity)
0
E
M4(76%)
221
Fig. 6.16. Developmental period from active larva to quiescent deutonymph of females (A) and males(B) on M4 and M27 at 30°C and 171 lux.
111 Quiescent deutonymph
In Active protonymph 0 Active deutonymph
Ei Quiescent larva
Quiescent protonymph
Active larva
Developmental periods from eggs to adults of TSSM females on
M4 and M27 at the different relative humidity were presented in Fig.
6.17A and B, respectively. Highly significant decreases in the total
developmental time of juvenile stages at 76%RH compared with
100%RH were detected on both genotypes (p < 0.01). The duration of the
juvenile stages from egg to adult varied from 8.77 at 76%RH to 15.13 days
at 100%RH and 9.04 at 76%RH to 13.06 days at 100%RH for the mites on
M4 and M27, respectively.

76% 100% Relative humidity
76% 100% Relative humidity
Fig. 6.17. Developmental period from eggs to adults of TSSM females on M4(A) and M27(B) at 30°C and 171 lux. 20
.q
10
0
76% 100%
76% 100% Relative humidity
Relative humidity
Fig. 6.18. Pre-reproductive period of ISSM females on M4(A) and M27(B) at 30°C and 171 lux. 20
.5
10
222
According to the unpaired t-test, pre-reproductive periods of mites
reared at 76% and 100%RH varied significantly (Fig. 6.18). The duration
of egg-to-egg developmental period ranged from 9.53 at 76%RH to 15.67
days at 100%1U-1 and 9.60 at 76%RH to 13.93 days at 100%RH for the mites
on M4 and M27, respectively.
The intrinsic rate of increase (rm) of TSSM population on both M4
and M27 was higher at 76%RH than at 100%RH (Fig. 6.19). In contrast,
the mean generation time (T) of the same mite population was higher at
100%RH than at 76%RH (Fig. 6.20). Therm values ranged from 0.331 on

223
M4 to 0.378 days on M27 and 0.182 on M4 to 0.236 days on M2. the
mites reared at 76%RH and 100%RH, respectively (Fig. 6.19). For both
genotypes, the T values varied from 9.33 days at 76%RH• to 14.67 days at
100%RH (Fig. 6.20).
Fig. 6.19. Intrinsic rates of increases of TSSM on two genotypes of 'hops at 30°C and 171 lux.
.s 0
.4
0.4
0.3
0.2
o.t
0.0
76% Relative humidity
100%
Fig. 6.20. Mean generation time of TSSM on two genotypes of hops at 30°C and 171 lux.
76%
100% Relative humidity
6.3.2.2. The second series of experiments: To determine whether
the humidity levels controlled by the use of salt solutions would give
different results from each other, a series of observations were conducted
at 20°-30°C and a light intensity of 43 lux. The three humidity levels used
were 55%, 76% and 85%RH. Comparisons of the survival of the mites
reared at these humidity levels revealed that the percentage alive from ,

224
egg to adult varied with humidity (Table 6.13). The lowest and highest
overall survival occurred at 55% and 76%RH, respectively. The survival
of egg stage at 55% and 85%RH was nearly identical, whereas that of
immatures was higher at 85%RH than at 55%RH. Nevertheless, at
76%RH the survival for both eggs and immatures was higher than at 55%
and 85%RH. Generation mortality ranged from 71.43 to 81.43%, 58.57 to
34.28% and 65.71 to 55.71% at 55%, 76% and 85%RH, respectively.
Table 6.13. Life table of TSSM on two hop genotypes at 20-30°C, constant illumination (16L:8D; 46 lux) and three humidities.
Humidity Genotype Xa lb dxc clxd se Generation mortality (%)
55%RH M4 Egg 70 37 .5286 .4714 immature f 33 13 .3939 .6061 Adu1tg 20 71.43%
M27 Egg 70 31 .4429 .5571 Immature 39 26 .6667 .3333 Adult 13 81.43%
76%RH . M4 Egg 70 14 .2000 .8000 . Immature 56 27 .4821 .5179 Adult 29 • 58.57%
M27 Egg 70 9 '.1286 .8714 Immature 61 15 .2459 .7541 Adult 46 34.28%
85%RH M4 Egg 70 36 .5143 .4857 Immature 34 10 - .2941 .7059 Adult 24 65.71%
M27 Egg •70 30 .4286 .5714 Immature 40 . 9 .2250 .7750 Adult 31 55.71%
a = Stage of life cycle. b = Number living at .beginning of stage in the x tolumn. c = Number dying within stage in the x column. d = Probability of dying during x. e = Probability of surviving interval x. f = Larva + Protonymph + Deutcmymph. g = Female + Male.
• Developmental time for each stage of the female juvenile stages on
M4 and M27 under different relative humidity conditions is illustrated in
Fig. 6.21. At 20°C the mites on both genotypes developed faster at 76%RH

Fig. 6.21. Developmental time of TSSM M27 at 20°C(A), 25°C(B) and 30°C(C) at lux.
30
10
- 30
B Quiescent deutonymph
• Active cleutonymph
EJ Quiescent protonymph 123 Active protonymph
• Quiescent larva
ka Active larva
EJ Egg
females on M4 and a light intensity of 43
. s
10 • —,,,Orme.
teXPIN=M1 2=C01355a2
OW, 4 Is. Ma 544111MM 5ati,:4" _ME Z////,
225
than at 55% or 85%RH. At 25° and 30°C the humidity used in this study
had little effect on the total developmental period of mites.
M4(55%) M27(55%) M4(76%) M27(76%) M4(85%) M27(85%) Genotype (Relative humidity)
• The duration of egg-to-egg developmental period in the various
• humidity within each temperature is presented in Fig. 6.22. The
difference in these pre-reproductive period due to humidity levels was

55% 76% Relative humidity
85%
50
40
30
20
10
0 30
20
30
20
10
226
similar to those found in the developmental time of the juvenile stage as
mentioned above.
Fig. 6.22. Pre-reproductive period of TSSM on two genotypes of hops at 20°C(A), 25°C and 30°C at a light intensity of 43 lux.
The intrinsic rate of increase of TSSM at the various conditions is
presented in Fig.6.23. At 20°C moderate relative humidity was shown to

55% 85% 76% Relative humidity
0.0 0.4
03
0.2
0.1
0.0
227
be superior to high and low relative humidity. At 25° and 30°C little
difference was shown among these humidity regimes.
Fig. 6.23. Intrinsic rates of increase of TSSM on two genotypes of hops at 20°C(A), 25°C(B) and 30°C(C) at a light intensity of 43 lux and three humidities.

228
The mean generation times of TSSM for the three humidity levels
are shown in Fig. 6.24. These results tend to confirm those obtained from
the life table parameters presented earlier.
Fig. 6.24. Mean generation times of TSSM on two genotypes of hops at 20°C(A), 25°C(B) and 30°C at a light intensity of 43 lux and three humidities. 40
30
20
10
40
30
20
10
0
55% Relative
85%

229
A two-way analysis of variance was carried out using the average
values of each of the egg periods for each of different combinations of
temperature and humidity as mentioned previously (Table 6.14). The
duration of egg periods among these humidity levels did not vary
significantly (p > 0.05). Furthermore, there were no significant differences
among different genotypes and no significant interaction between
genotypes and temperatures was found (p > 0.05). The average egg
periods of the mites reared at each humidity level ranged from a
minimum of 6.37 days at 76%RH to a maximum of 7.12 days at 85%RH
(Fig. 6.25).
Table 6.14. Analysis of variance of the developmental periods for eggs of TSSM on two genotypes of hops at three humidies.
Source: •df: Sum of Squares: NMean Square: F-test P value:
Humidity (A) 2 2.195 j 1.098 0.501 .6183 Genotype (B) 1 0.264 0.264 0.120 .7346 AB 2 0.647 0.323. 0.147 .8644 Error 12 26.313 2.193
Fig. 6.25. Developmental periods for eggs of TSSM at 55%, 76%, and 85% RH.
55%
76%
85% Relative humidity

230
Table 6.15 shows that under various conditions the developmental
period from egg to adult for females among humidity regimes did not
differ significantly and that differences between genotypes as well as the
interaction between temperatures and genotypes were not significant (p >
0.05). It was apparent that the mites at 76%RH had the shortest period
(14.63 days) whilst the mites at 55%RH°C had the longest period (18.55
days; Fig. 6.26).
Table 6.15. Analysis of variance of the developmental periods from eggs to adults of TSSM on two genotypes of hops at three humidities.
Source: df: Sum of Squares: Mean Square: F-test P value:
Humidity (A) 2 46.207 23.103 . 0.703 .5142 Genotype (B) 1 0.360 0.360 0.011 .9184
AB 2 2.617 1309 0.040 .9611 Error 12 394.117 32.843
Fig. 6.26. Developmental periods from eggs to adults of TSSM at 55%, 76%, and 85%RI-I.
55%
76%
85% Relative humidity

231
Analysis of variance of the pre-reproductive period showed no
significant differences between humidity levels (Table 6.16). The
duration of egg-to-egg developmental period at 20-30°C varied from a
minimum of 15.74 days at 76%RH to a maximum of 20.32 days at 55%RH
(Fig. 6.27). It was also apparent that the developmental period of mites
reared on different genotypes did not vary significantly and that there-was
no significant interaction between temperatures and genotypes (Table
6.16).
Table 6.16. Analysis of variance of the pre-reproductive periods of TSSM on two genotypes of hops at three humidities.
Source: df: Sum of Squares: Mean Square: F-test P value:
Humidity (A) 2 63.068 31.534 0.665 .5320 Genotype (B) 1 • 2.494 2.494 0.053 .8224 AB 2 4.677 2.339 0.049 .9520 Error 12 568.693 47.391 .
Fig. 6.27. Pre-reproductive periods of TSSM at 55%, 76%, and 85% RH.
30
55%
76%
85% Relative humidity

0.3
C.)
0.1
0.0
232
According to the analysis of variance, the intrinsic rate of increase
of mites reared on both M4 and M27 at different humidity levels did not
vary significantly (Table 6.17). In addition, there was no significant -
interaction of this value between humidities and genotypes. The highest
value (0.217) was found at 76%RH and the lowest (0.170) at 55%RH (Fig.
6.28).
Table 6.17. Analysis of variance of the intrinsic rates of increase of TSSM on two genotypes of hops at three humidities.
Source: df: Sum of Squares: Mean Square: F-test: P value:
Humidity (A) 2 0.007 0.0035 0.496 .6209
Genotype (B) 1 0.001 0.0010 0.113 .7425
AB 2 0.001 0.0005 0.071 .9323
Error 12 0.089 0.0074
Fig. 6.28. Intrinsic rates of increase of TSSM at 55%, 76%, and 85% RH.
55%
• 76%. 85% Relative humidity

233
For mean generation times, analysis of variance showed no
significant differences among the test humidity levels (Table 6.18). In
addition, it can be seen from the table that there were no significant
differences in the mean generation time between genotypes selected nor
between genotypes and temperatures. Populations of TSSM at 76%RH
had the shortest mean generation time, wheareas those at 55%RH had
the longest (Fig. 6.29).
Table 6.18. Analysis of variance of the mean generation times of TSSM on two genotypes of hops at three humidities.
Source: df: Sum of Squares: Mean Square: F-test P value: Humidity (A) 2 108.050 54.025 0.893 .4348
Genotype (B) 1 1.578 1.578 0.026 .8743 AB 2 3.724 1.862 0.031 .9698 Error 12 725.618 60.468
Fig. 6.29. Mean generation time of TSSM at 55%, 76%, and 85% RH.
55%
76% •
85% • Relative humidity

234
6.3.3. Light intensity
6.3.3.1. Open containers: Table 6.19 presents the number 'of TSSM
individuals alive at each age interval when reared on two genotypes of
hops at 25°C, and at three levels of light intensity. As can be seen from
the table, the survival of the egg stage varied with the levels of light
intensity. At all light intensities, the mortality rate of the egg stage was
higher than that of the immature stage. For both stages, the mites reared
at 61.5 lux suffered the highest mortality whilst those reared at 150 and
360 lux had nearly indentical mortalities. Generation mortality ranged
from 54.17% on M4 to 41.67% on M27 at 61.5 lux, 33.33% to 25.00% at 150
lux and 33.33% to 20.83% at 360 lux.
Table 6.19. Life table of TSSM on two genotypes of hops at 25°C and three levels of light intensity.
Illumination Genotype Xa 1xb chtc qxd Generation mortality (%)
61.5 lux M4 Egg 24 11 0.4583 0.5417 Inunaffiref 13 2 0.1539 0.8461 Adultg 11 54.17%
M27 Egg 24 6 0.2500 0.7500 Immature 18 4 0.2222 0.7778 Adult 14 41.67%
150 lux M4 Egg 24 7 0.2917, 0.7083 Immature 17 1 0.0588 0.9412 Adult 16 33.33%
M27 Egg 24 6 0.2500 0.7500 Immature 18 0 0.0000 1.0000 Adult 18 25.00%
360 lux M4 Egg 24 5 '0.2083 0.7917 Immature 19 3 0.1579 0.8421 Adult 16 33.33%
M27 Egg 24 3 0.1250 0.8750 Immature 21 2 0.0952 0.9048 Adult 19 20.83%
a = Stage of life cycle. b = Number living at beginning of stage in the x column. c = Number dying within stage in the x column. d = Probability of dying during x. e = Probability of surviving interval x. f = Larva + Protonymph + Deutonymph. g = Female + Male.

235
Sex ratios of immatures reaching adulthood were observed to
favour females• for all 3 illumination regimes (Table 6.20). This
favourability was most evident at 61.5 and 360.0 lux, which averaged
approximately 4 females to one male. At 150.0 lux, sex ratio
determinations indicated a shift towards a smaller female:male ratio.
Table 6.20. Sex ratio of TSSM in open containers at 20°C, and three levels
of light intensity.
Illumination
Adult females Adult males
61.5 lux 19 6
150.0 lux 22 12
360.0 lux 28 7
The developmental time in days for eggs of TSSM on both M4 and
M27 did not vary significantly (p > 0.05) for the three levels of light
intensity (Fig. 6.30). When the data taken from both genotypes was
pooled together, the average time required for egg hatch at these light
intensities was nearly identical (Fig. 6.31).
Fig. 6.30. Developmental period for eggs of TSSM on M4 (A) and M27 (B) at 25°C and the relative humidity of the ambient air in the incubator. Columns with the same letter are not significantly different (p > 0.05; PLSD). 8
61.5 150 360 61.5
150
360 Light intensity (Lux)

236
Fig. 6.31. Average developmental period for eggs of TSSM at 25°C and the relative humidity of the ambient air in the incubator. Columns with the same letter are not significantly different (p > 0.05; PLSD).
ea
•-• ea)
C16 2
8 61.5 150 360
Light intensity (Lux)
For females and males, the developmental periods of the active
and quiescent periods for larva, protonymph and deutonymph reared on
M4 and M27 within each light intensity are presented in Fig. 6.32A and B,
respectively. Comparisons of the three rearing light intensities show that
the length of the developmental periods for females and males on both
genotypes was similar. At all light intensities, the developmental period
from active larva to quiescent deutonymph of females on both genotypes
was longer than that of males.
Fig. 6.32. Developmental period from active larva to quiescent deutonymph of females(A) and males(B) on M4 and M27 at 25°C and the relative humidity of the ambient air in the incubator.
Quiescent deutonympt IN Active protonyrnph 1:=1 Active deutonymph MI Quiescent larva 123 Quiescent protonymph =I Active larva
6
4
ga 2
M4 M27 M4 M27 M4 M27 M4 M27 M4 M27 M4 M27 (61.5) (61.5) (150) (150) (360) (360) (61.5) (61.5) (150) (150) (360) (360)
Genotype (light intensity)

237
Developmental periods from eggs to adults of TSSM females on
•M4 and M27 at the different light intensities are presented in Fig. 6.33A
and B, respectively. There were significant differences in the
developmental period of the mites on M27, whereas that of the mites on
M4 did not differ significantly. Highly significant decreases in the total
developmental time on juvenile stages at 360 lux compared with 61.5 and
150 lux were detected on M27 (p < 0.01). It was apparent that the average
duration of the juvenile stages varied significantly (p < 0.01) for the three
light intensities when the data taken from both genotypes was pooled
together (Fig. 6.34). At 61.5, 150, and 360 lux females took 13.21, 12.50, and
11.46-days, respectively, to reach adulthood.
Fig. 6.33. Developmental period from eggs to adults of TSSM females on M4 (A) and M27 (B) at 25°C and the relatiiie humidity of the ambient air in the incubator. Columns with the same letter are not significantly different (p > 0.05; PLSD). 2
•E
'3
ita) 0 >
61.5
150
360 61.5
150
360 Light intensity (Lux)

Fig. 6.34. Average developmental period from eggs to adutls of TSSM females at 25°C and the relative humidity of the ambient air in the incubator. Columns with the same letter are not significantly different (p > 0.05; PLSD).
615 150 360 Light intensity (Lux)
According to analysis of variance, the pre-reproductive period of
mites reared at these light intensities varied significantly (Fig. 6.35). At
61.5 lux the duration of egg-to-egg developmental period of the mites on
both M4 and M27 was significantly longer than at 150 and 360 lux. It was
also found that this period of mites on M4 was significantly shorter at 360
lux than at 150 lux. When the data taken from both genotypes was
pooled, highly significant differences in average pre-reproductive periods
were detected for the three light intensities (p <0.01; Fig. 6.36). The pre-
reproductive periods of the mites at 61.5, 150 and 360 lux were 14.24, 13.27
and 12.52 days, respectively.
238

20
r>,
.5
10
0
>
Develop mental time in day
20
10
239
Fig. 6.35. Pre-reproductive period of TSSM females on M4 (A) and M27 (B) at 25°C and the relative humidity of the ambient air in the incubator. Columns with the same letter are not significantly different (p > 0.05; PLSD).
61.5 150 360 61.5
150
360 Relative humidity (Lux)
Fig. 6.36. Average pre-reproductive period of TSSM females at 25°C and the relative humidity of the ambient air in the incubator. Columns with the same letter are not significantly different (p > 0.05; PLSD).
61.5 150 360 Light intensity (Lux)
The intrinsic rate of increase of TSSM on M4 and M27 at the
various light intensities is presented in Fig. 6.37. At all light intensities
the mites on M27 were shown to increase at a greater rate than those on
M4, with the greatest difference occurring at 150 and 360 lux.

240
Fig. 6.37. Intrinsic rates of increases of TSSM on different hop genotypes at 25°C and the relative humidity of the ambient air in the incubator.
0.4
0.3
0.2
0.0
61.5
150
360 Light intensity (Lux)
The mean generation time (T) at the three light intensities at 25°C
is shown in Fig. 6.38. Slight decreases in the T values resulted from an
increase in light intensities.
Fig. 6.38. Mean generation times of TSSM on different hop genotypes at 25°C and the relative humidity of the ambient air in the incubator.
20
a 15
1 10 E-4
0
613
150
360 Light intensity (Lux)
6.3.3.2. Closed containers: The following results show the effect of
light intensity within given temperature and humidity environments on
mite populations on different hop genotypes. Life tables were constructed
at light intensities of 43 and 171 lux from the data collected on TSSM at

241
200 and 30°C under moderate (76%RH) and very high (100%RH) relative
humidity conditions.
In the first life table, a comparison between the two light intensities
at low temperature (20°C) under moderate humidity conditions (76%RH)
indicated that the survival of immatures reaching adulthood incraesed
with an increase in light intensity (Table 6.21). Generation mortality
ranged from 60% on M4 to 30% on M27 and 30% on M4 to 10% on M27 at
43 and 171 lax, respectively.
Table 6.21. Life table of TSSM on two hop genotypes at 20°C, 76%RH and two light intensities.
Illumination Genotype Xs lb d)tc clxd se Generation mortality (%)
43.0 lux M4 Egg 10 0 0.00 1.00 immature f 10 6 0.60 0.40 Adultg 4 60.00%
M27 Egg 10 0 0.00 1.00 Immature 10 3 0.30 0.70 Adult 7 30.00%
171.0 lux M4 Egg 20 2 0.10 0.90 Immature 18 4 0.22 0.78 Adult 14 30.00%
M27 Egg 20 0 0.00 1.00 Immature 20 2 0.10 0.90 Adult 18 10.00%
a = Stage of life cycle. b = Number living at beginning of stage in the x colunut. c = Number dying within stage in the x column. d = Probability of dying during x. e = Probability of surviving interval x. f = Larva + Prottmymph + Deutonymph. g = Female + Male.
In the second life table, comparison between the two light
intensities at low temperature under very high humidity conditions
(100%RH) also shows that the overall survival (birth to adult) increased
as the light intensity increased (Table 6.22). In addition, it was found that

242
the survival of the mites on M4 and M27 at both light intensities was
lower in this life table as compared to the first because of the increase in
relati-re humidity. Generation mortality ranged from 100% on M4 to 80%
on M27 and 80% on M4 to 70% on M27 for the mites reared at 43 and 171
lux, respectively.
Table 6.22. Life table of TSSM on two hop genotypes at 20°C, 100%RH and two light intensities.
Illumination Genotype Xa lb dxc cixd se Generation mortality (%)
• 43.0 lux M4 Egg 10 1 .1000 .9000 immature f 9 9 1.000 0.000 Adultg 0 100%
M27 Egg 10 1 .1000 .9000 - Immature 9 7 .7778 .2222 Adult 2 80%
171.0 lux M4 Egg 10 1 .1000 .9000 Immature 9 7 .7778 .2222 Adult 2 80%
M27 Egg 10 4 .4000 .6000 Immature 6 3 ..5000 .5000 Adult 3 70%
a = Stage of life cycle. = Number living at beginning of stage in the x column.
c = Number dying within stage in the x column. d = Probability of dying during x. e = Probability of surviving interval x. f = Larva + Protonymph + Deutonymph. g = Female + Male. •
In the third life table, comparison between the two light intensities
indicated that the survival of the mites was not related to the effect of
light intensity at high temperature (30°C), under moderate humidity
conditions (Table 6.23). Generation mortality ranged from 30% on M4 to
15% on M27 and 27.69% to 36.92% at 43 and 171 lux, respectively.

243
Table 6.23. Life table of TSSM on two hop genotypes at 30°C, 76%R1-1 and two light intensities.
Illumination Genotype Xa lxb dxc qxd se Generation mortality (%)
43.0 lux M4 Egg 20 1 .0500 .9500 immature f 19 5 .2632 .7368
Adults 14 30.00%
M27 Egg 20 0 .0000 1.000 Immature 20 3 .1500 .8500
Adult 17 15.00%
171.0 lux M4 Egg 65 5 .0769 .9231
Immature 60 13 .2167 .7833 Adult 47 27.69%
M27 Egg 65 11 .1692 .8308
Immature 54 13 .2407 .7593
Adult 41 36.92%
a = Stage of life cycle. b = Number living at beginning of stage in the x column. c = Number dying within stage in the x column. d = Probability of dying during x. e = Probability of surviving interval x. f = Larva + Protonymph + Deutonymph. g = Female + Male.
In the fourth life table, comparison between the two light
intensities at high temperature under very high humidity conditions still
shows that the survival of the mites increased as the light intensity
increased (Table 6.24). Generation mortality, varied from 95% on M4 to
100% on M27 and 56% on M4 to 24% on M27 at 43 and 171 lux,
respectively.

244
Table 6.24. Life table of TSSM on two hop genotypes at 30°C, 100%RH and two light intensities.
Illumination Genotype Xa 413 dxc cbcct sxe Generation mortality (%)
43.0 lux M4 Egg 20 5 .2500 .7500
Immaturef 15 14 .9333 .0667
Adultg 1 95%
M27 Egg 20 7 .3500 .6500
Immature 13 13 .0000 1.000
Adult 0 100%
171.0 lux M4 Egg 25 0 .0000 1.000
Immature 25 14 .5600 .4400
Adult 11 56%
M27 Egg 25 0 .0000 1.000
Immature 25 6 .2400 .7600
Adult 19 24%
a = Stage of life cycle. b = Number living at begirming of stage in the x collunn. c = Number dying within stage in the x column. d = Probability of dying during x. e = Probability of surviving interval x. f = Larva + Protonymph + Deutonymph. g = Female + Male.
The sex ratios of immatures becoming adults were biased in favour
of females for both light intensity regimes under controlled conditions
(Table 6.25). This bias was most evident for the lower light intensity at
moderate relative humidity, which averaged approximately four females
to one male. It was also found that at a light intensity of 43 lux the male

245
immatures were not able to reach adulthood at both 20 0 and 30°C under
very high relative humidity conditions.
Table 6.25. Sex ratio of TSSM at 20 0and'300C; 76% and 100%RH at light intensities of 43 and 171 lux.
Illumination (lux) Temperature (°C) Humidity (%RH) Adult females Adult males
43.0
171.0
20
30
20
30
76 100 76
100 76
100 76
100
9 2
24 1
23 5
57 24
2 0 7
0 9 0
31 6
Under the rearing conditions described above, two-way analysis of
variance of average values obtained from the data collected on TSSM
showed that there were no significant differences (p > 0.05) in
developmental periods for eggs, overall developmental periods of female
imrnatures, pre-reproductive periods, intrinsic rates of increase (r m) and
mean generation times (T) between the mites reared at light intensities of
43 and 171 lux (Table 6.26, 6.27, 6.28, 6.29 and 6.30). Furthermore,
variation between the mites on different genotypes and interaction
between the light intensity and genotypes were not significant (p > 0.05).
Within these experimental regimes, means for egg stage duration and
developmental period from egg to adult were approximately 6.5 and 16.5
days, respectively (Fig. 6.39 and 6.40). Mite populations demonstrated
mean generation times ranging from 17.66 to 16.51 at 43 and 171 lux,
respectively (Fig. 6.41). As can be seen in Fig. 6.42, the rm value was
higher at 171 lux (0.213) than at 43 lux (0.169). The mean generation times
varied from 22.67 to 19.43 days at 43 and 171 lux, respectively (Fig. 6.43).

Table 6.26. Analysis of variance of the developmental periods for eggs of TSSM on two hop genotypes at 20°-30°C and 76%-100%RH.
Source: df: Sum of Squares: Mean Square: F-test .-P value:
Illumination (A) 1 5.063E-6 . 5.063E-6 1.899E-6 .9989 Genotype (B) 1 0.055 0.055 0.021 .8881 AB 1 0.402 0.402 0.151 - .7045 Error 12 31.984 2.665
Table 6.27. Analysis of variance of the developmental periods from eggs to adults of TSSM on two hop genotypes at 20°-30°C and 76%-100%RH.
Source: df: Sum of Squares: Mean Square: F-test P value:
Illumination (A) 1 0.357 0.357 0.008 .9316
Genotype (B) 1 0.339 0.339 0.007 .9333 AB 1 7.608 7.608 0.165 .6932 Error 10 461.424 46.142
Table 6.28. Analysis of variance of the pre-reproductive periods of TSSM on two hop genotypes at 20°-25°C and 76-100%RH.
Source: df: Sum of Squares: Mean Square: F-test P value:
illumination (A) 1 5.537 5.537• 0.116 .7408 Genotype (B) 1 11.527 ' 11.527 0.242 .6344 AB 1 0.586 0.586 0.012 .9141 Error 9 428.252 47.584
Table 6.29. Analysis of variance of the intrinsic rates of increase of TSSM on two hop genotypes at 20°-30°C and 76-100%RH.
Source: df: Sum of Squares: Mean Square: F-test _P value:
Illumination (A) 1 0.006 Q.006 0.405 .5402
Genotype (B) 1 1.284E-6 1.284E-6 8.371E-5 .9929 AB 1 8.889E-8 8.889E-8 5.797E-6 .9981 Error 9 0.138 0.015
Table 6.30. Analysis of variance of the mean generation times of TSSM on two hop genotypes at 20°-30°C and 76-100%RH.
Source: df: Sum of Squares: Mean Square: F-test P value: Illumination (A) 1 37.941 37.941 . 0.432 .5258 Genotype (B) 1 17.422 17.422 0.200 .6653 AB 1 0.992 0.992 0.011 , .9174 Error 9 783.964 87.107
246

247
Fig. 6.39. Developmental periods for eggs of TSSM at 43 and 171 lux. 8
43 171 Light intensity (lux)
Fig. 6.40. Developmental periods from eggs to adults of TSSM at 43 and 171 lux.
20
.S
10
0
43 171 Light intensity (lux)
Fig. 6.41. Pre-reproductive periods of TSSM at 43 and 171 lux. 25
43 171 Light intensity (lux)

248
Fig. 6.42. Intrinsic rates of increase of TSSM at 43 and 171 lux. 0.3
• 0.1
0.0
Fig. 6.43. Mean generation time of TSSM at 43 and 171 lux. 30
.
1 0
43 171 Light intensity (lux)
43 171 Light intensity (lux)
6.3.4: Plant variables
6.3.4.1. Leaf ages: The first series of experiments in this study was
carried out at 20°C, 76%RH and a light intensity of 171 lux. A comparison
of the mite survival between young and old leaves showed that the
overall survival of juvenile stages did not vary with leaf age (Table 6.31).
Under these controlled conditions, generation mortality was
approximately 10%. Sex ratios of mite populations on young and old
leaves were similar, which averaged about 4 females to one male (Table
6.32). The developmental times for the eggs of TSSM to hatch were

249
nearly identical for both young and old leaves of M4 and M27 (Fig. 6.44).
According to unpaired t-tests, variation in the developmental period of
juvenile stages as well as the pre-reproductive period between mites on
young and old leaves of M4 was not significant, but variation between
young and old leaves of M27 was highly significant (Fig. 6.45 and 6.46).
The intrinsic rate of increase ranged from 0.165 on M4 to 0.160 on M27
and 0.128 on M4 to 0.106 on M27 for young and old leaves, respectively
(Fig. 6.47), whereas the mean generation time varied from 22.7 days on
M4 to 24.0 days on M27 and 26.7 days on M4 to 28.0 days on M27 for young
and old leaves, respectively (Fig. 6.48).
•Table 6.31. Life table of TSSM on two hop genotypes at 20°C, 76%RH and
a light intensity of 171 lux for old and young leaves.
Leaf age Genotype xa lb d-Ac cbtd se Generation mortality (%)
Young M4 Egg 10 0 0.000 1.000 Inunanuef 10 0 0.000 1.000 Adultg 10 • 0%
M27 Egg 10 0 0.000 1.000 Immature 10 1 0.100 0.900 Adult 9 10%
Old M4 Egg 10 0 0.000 1.000 Immature 10 1 0.100 0.900 Adult 9 10%
M27 Egg 10 0 0.000 1.000 Immature 10 1 0.100 0.900 Adult 9 10%
a = Stage of life cycle. b = Number living at beginning of stage in the x Column. c = Number dying within stage in the x coltunn. d = Probability of dying during x. = Probability of surviving interval x.
f = Larva + Protonymph + Deutonymph. g = Female + Male.
Table 6.32. Sex ratio of TSSM reared on young and old leaves at 20°C,
76%RH and a light intensity of 171 lux.
Leaf age .Adult females Adult males
Young • 15 4
Old. 14 4

Fig. 6.44. Developmental period for eggs of TSSM on young and old leaves of M4(A) and M27(B) at 76% RH and 171 lux.
Young
Old Leaf age
250

Young Old
25
20
15
10
0
251
Fig. 6.45. Developmental period from eggs to adults of TSSM females on young and old leaves of M4(A) and M27(B) at 76%RH and 171 lux.
Leaf age -

Fig. 6.46. Pre-reproductive period of TSSM on young and old leaves of M4(A) and M27(B) at 76%1ZEI and 171 lux.
25
20
15
10
5
Young
10
0 Young
Old
Old Leaf age
252

0.0
Develop mental time in day s
20
10
30
253
Fig. 6.47. Intrinsic rates of increases of 'TSSM on young and old leaves of different hop genotypes at 20°C, 76%RH and a light intensity of 171 lux.
Young
Old Leaf age
Fig. 6.48. Mean generation times of TSSM on young and old leaves of different hop genotypes at 20°C, 76%RH and a light intensity of 171 lux.
Young
Old Leaf age
The second series of experiments in this study was carried out at
20°C, 55-100%RH and a light intensity of 43 lux. A comparison of mite
survival between young and old leaves also showed that the overall
survival of juvenile stages was not related to leaf age (Table 6.33).

254
Nevertherless, generation mortality of mite populations in this series
was higher than that in the first run because the data used was collected
on TSSM held at lower light, intensities under various relative humidity
conditions. On M4 the generation mortality varied from 65 to 45% for
young and old leaves, respectively, whilst on M27 the mortality ranged
from 30 to 45 for young and old leaves, respectively. The sex ratios of
immatures becoming adults were observed to favour females for both
leaf ages (Table 6.34). This favourability was most evident for the old
leaves, which averaged about six females to one male. On older leaves,
sex ratio determinations indicated a shift towards a smaller female:male
ratio.
Table 6.33. Life table of TSSM on two hop genotypes at 20°C, 55-100%RH and a light intensity of 43 lux for old and young leaves.
Leaf age Genotype Xa 1xb dxc cbEd sxe Generation mortality (%)
Young M4 Egg 20 0 .0000 1.000
Immature 20 13 .6500 .3500
Aclultg 7 65% M27 Egg 20 2 .1000 .9000
Immature 18 4 .2222 .7778
Adult 14 30%
M4 • Egg 20 4 .2000 .8000 • Immature 16 5 3125 .6875
Adult 11 45%
M27 Egg 20 3 .1500 .8500
Immature 17 6 .3529 .6471
Adult 11 45%
a = Stage of life cycle. b = Number living at beginning of stage in the x column. c = Number dying within stage in the x column. d = Probability of dying during x. e = Probability of surviving interval x. f = Larva + Protonymph + Deutonymph. g = Female + Male.

255
Table 6.34. Sex ratio of TSSM reared on young and old leaves at 20°C, 55-
100%RH and a light intensity of 43 lux.
leaf age
Adult females Adult males
Young 14 7
Old 19 3
Using average values obtained from the data collected on mite
•populations in the environmental regimes mentioned above, two-way
analyses of variance were performed. No significant differences (p > 0.05)
in developmental periods for eggs, overall developmental periods of
female immatures, pre-reproductive periods, intrinsic rates of increase
(rm) and mean generation times (T) between the mites on young and old
leaves were detected (Table 6.35, 6.36, 6.37, 6.38 and 6.39). Furthermore,
variation between the mite populations on different genotypes and
interaction between leaf ages and genotypes were not significant (p > 0.05).
The means for duration of egg stage ranged from 8.20 to 7.68 days for
young and old leaves, respectively (Fig. 6.49), whilst the developmental
period from egg to adult varied from 22.63 to 21.27 days for young and old
leaves, respectively (Fig. 6.50). The mean generation time for the mite
population was approximately 24 days (Fig. 6.51). As can be seen in Fig.
6.52 and 6.53, the rm value and mean. generation times were nearly
indentical for both young and old leaves.
Table 6.35. Analysis of variance of the developmental periods for eggs of TSSM on young and old leaves of two hop genotypes at 20°C, 55-100%RH and a light intensity of 43 lux.
Source: cif: Sum of Squares: Mean Square: F-test: P value:
Age (A) .1 1.076 1.076 1.029 .3304
Genotype (B) 1 1.238 1.238 1.183 .2981
AB 1. • 0.238 0.23-8 0.227 .6422
Error 12 12.554 1.046

Table 6.36. Analysis of variance of the developmental periods from eggs to adults of TSSM females on young and old leaves of two hop genotypes at 20°C, 55-100%RH and a light intensity of 43 lux.
Source: dl: Sum of Squares: Mean Square: F-test: P value: Age (A) 1 5.535 5.535 0.223 .6494 Genotype (B) 1 42.225 42.225 1.701 .2284 AB 1 0.330 0.330 0.013 .9110 Error 8 198.575 24.822
Table 6.37. Analysis of variance of the pre-reproductive periods of TSSM females on young and old leaves of two hop genotypes at 20°C, 55-100%RH and a light intensity of 43 lux.
Source.: df: Sum of Squares: Mean Square: F-test P value: Age (A) 1 0.521 0.521 0.022 .8868 Genotype (B) 1 50.021 50.021 2.073 .1879 AB 1 0.521 0.521 0.022 .8868 Error 8 193.064 24.133
Table 6.38. Analysis of variance of the intrinsic rate of increase of TSSM on young and old leaves of two hop genotypes at 20°C, 55-100%RH and a light intensity of 43 lux. •
Source: dl: Sum of Squares: Mean Square: F-test P value: Age (A) 1 5.333E-8 5.333E-8 5.221E-5 9944 Genotype (B) 1 0.002 0.002 1.668 .2326 , AB 1 4.014E-4 4.014E-4 0.393 .5483 Error 8 0.008 0.001
Table 6.39. Analysis of variance of the mean generation time of TSSM on young and old leaves of two hop genotypes at 20°C, 55-100%RH and a light intensity of 43 lux.
Source: df: Sum of Squares: Mean Square: F-test P value: Age (A) 1 7.254 7.254 0.190 .6746 Genotype (B) 1 78.285 78.285 2.049 .1902 AB 1 33.300 33300 0.871 .3779 Error 8 305.716 38.214
256

Fig. 6.49. Developmental periods for eggs of TSSM on young and old leaves.
Young
Old Leaf age
Fig. 6.50. Developmental periods from eggs to adults of TSSM females on young and old leaves.
Young
Old Leaf age
Fig. 6.51. Pre-reproductive periods of TSSM females on young and old leaves.
Young
Old Leaf age
257

0.2
0.0
258
Fig. 6.52. Intrinsic rates of increase of TSSM on young and old leaves.
Young
Old Leaf age
Fig. 6.53. Mean generation time of TSSM on young and old leaves.
.s
•a
40
30
20
10
Young
Old Leaf age
, 6.3.4.2. Leaf regions: The survival of the juvenile stage on distal
and basal regions of hop leaves is presented in Table 6.40. Comparison
between the two regions of leaves shows that the percentage survival of
the egg stage for both regions was similar, whereas that for the immature
stages was higher on the basal regions.

259
Table 6.40. Life table of TSSM on distal and basal regions of leaves of two
hop genotypes at 25°C, and the relative humidity of the ambient air in a
incubator.
Portion Genotype Xa lb c qd sxe Generation mortality (%)
Distal M4 Egg• 36 9 .2500 .7500 immature f 27 11 .4074 .5926 Adultg 16 55.56%
M27 Egg 36 9 .2500 .7500 Immature 27 11 .4074 .5926 Adult 16 55.56%
M4 Egg 36 14 .3889 .6111 Immature 22 6 .2727 .7273 Adult 16 55.56%
M27 Egg 36 6 .1667 .8333 Immature 30 8 .2667 .7333 Adult 22 38.89%
= Stage of life cycle. b = Number living at beginning of stage in the x column. c = Number dying within stage in the x column. d = Probability of dying during x. e = Probability of surviving .interval x. f = Larva + Protonymph + Deutonymph. g = Female + Male.
According to the unpaired t-tests, no significant differences in
developmental periods for eggs occurred between these two regions of
hop leaves for M4 and M27 (Fig. 6.54). it was also found that there were
no significant differences in developmental periods from egg to adult as
well as pre-reproductive periods occurred on M4, whereas significant
differences were found on M27 (Fig. 6.55 and 6.56). For intrinsic rates of
increase and mean generation times, nearly identical values were found
on distal and basal regions of hop leaves of both M4 and M27 (Fig. 6.57
and 6.58).

Fig. 6.54. Developmental period for eggs of TSSM on distal and basal regions of leaves of M4(A) and M27(B) at 25°C under the relative humidity of the ambient air in the incubator.
8
6
4
Distal
2
Distal Leaf regions
Basal
260

Fig. 6.55. Developmental period from eggs to adults of TSSM females on distal and basal regions of leaves of M4(A) and M27(B) at 25°C under the relative humidity of the ambient air in the incubator.
Distal
Basal Leaf regions
261

Distal Basal
15
10
10
5
0 Distal Basal
Fig. 6.56. Pre-reproductive period of TSSM females on distal and basal regions of leaves of M4(A) and M27(B) at 25°C and the relative humidity of the ambient air in the incubator.
Leaf regions
262

0.4
0.3
.2
0.1
0.0
Fig. 6.57. Intrinsic rates of increase of TSSM on distal and basal regions of leaves of different hop genotypes at 25°C under the relative humidity of the ambient air in the incubator.
Distal Basal Leaf regions
Fig. 6.58. Mean generation time of TSSM on distal and basal regions of leaves of different hop genotypes at 25°C under the relative humidity of the ambient air in the incubator.
25
20
i 15
10
5
0
Distal Basal Leaf regions
263

264
6.4. DISCUSSION
6.4.1.Temperature
Since temperature is known to affect several physiological
processes in plants and animals, it is not surprising that it should also
affect the expression of resistance of plants to arthropod pests (McMurtry,
1962). The influence of environmental temperature on the resistance of
plants has been the subject of several reports. Dahms and Painter (1940)
demonstrated that the pea aphid had a higher reproductive capacity on
resistant plants at low temperatures. Significant loss in expression of
resistance in sorghums to the greenbug has also been reported at reduced
temperatures (Wood and Starks, 1972). Nevertheless, Sosa and Foster
(1976) working with four races of the Hessian fly on four wheat cultivars,
showed that race-specific resistance of these cultivars generally decreased
with rising temperature, as measured by per cent infestation.
According to Tingey and Singh (1980), the level and expression of
genetic resistance in plants can be modified by temperature, i.e. either
increased or reduced temperature can result in loss of resistance.
Consequently, measurements of pest resistance and assessment of
resistance mechanisms are frequently made in controlled environments
at constant temperatures and it becomes necessary to include temperature • records when presenting data indicating resistance in certain cultivars.
In the present study, the two hop genotypes selected generally had
less resistance to mites with increasing temperature. However, there was
no significant interaction between temperature and susceptibility,
indicating that in general mites responded the same on these genotypes
as far as temperature was concerned. The slightly susceptible genotype
M4 could not be distinguished from the local susceptible genotype M27 at
all constant temperature regimes studied. By the procedures employed,
both genotypes appeared susceptible at these temperatures. It is therefore •

265
likely that M4 and M27 are identified as susceptible genotypes. Sosa and
Foster (1976) showed that infestation levels of the Hessian fly in
susceptible wheat cultivars were unaffected by temperature.
From the economic point of view, the tendency of mites to survive
better on resistant plants at low temperatures would not be expected to be
of serious consequence, since at low temperatures TSSM populations
build up relatively slowly and usually do not reach outbreak proportions.
At higher temperatures, when populations have a greater tendency to
reach economic levels, resistance would be displayed to a' higher degree,
• making the resistant plants unfavourable for rapid increase in the mite
populations.
Regardless of the influence on plant resistance, the present study
supports the hypothesis that developmental rates in high-temperature
environments contributed to TSSM outbreaks. The results show an
increase in rate of development with increased temperature as is the rule
for poikilothermous animals within the favourable temperature range
(Nickel, 1960). The three temperatures studied appear to be insidethe
favourable range, as evidenced by the increased rates of development for
all pre-adult stages at these temperatures. In addition, all the
temperatures studied are within the range of summer temperatures at
which mite outbreaks normally occur. Lewontin (1965) suggests that
developmental rate is the single most important variable influencing the
intrinsic rate of increase of colonizing species. Considering the
relationship between temperature and developmental rates observed in
this study, the importance of temperature as a factor involved in TSSM
population explosions is apparent.
Furthermore, the series of experiments at constant temperatures
provide useful information about the general life history of TSSM and
the approximate duration of the various stages for each temperature

166
regime. It was found that growth rates of the mites was considerably
higher at high than at low temperatures. Much recent work has shown
that temperature is a dominant factor affecting the growth rate and
development of many arthropod populations including tetranychids,
especially in temperate climates (Tanigoshi et al., 1975; Perring et al.,
1984).
• Predicting the seasonal occurrence of pests is essential for
accurately scheduling census samples and control tactics. The thermal
requirements of development are often used as a basis for these
predictions (Wagner et al., 1984).
The present study shows that the lower thermal threshold for
TSSM development, can be estimated at 5.88°, 10.99° and 11.33°C for egg
stage, female and male postembryonic stages, respectively. This is i n
agreement with the findings of other authors. In Japan, Mori (1961)
demonstrated that the activity zone of temperature for TSSM ranged
from 5-9°C to 41-44°C In mainland Australia and Canada, the threshold
temperature obtained from the regression of the developmental rates of
TSSM at different temperatures was found to be ca. 10°C by Readshaw
(1975) and Herbert (1981), respectively. In the United States, Carey and
Bradley (1982) reported the threshold temperature for the development of
TSSM to• be 11.7°C. It is probable that the different threshold
temperatures have been established because geographically separated
populations of mites may differ with respect to the influence of
temperature on developmental rates.
The present study demonstrated that the lengths of the egg stage,
the egg to adult stage and the age at first oviposition varied with
temperature. Similar phenomena have been observed by several
researchers. Cagle (1949) reported that the incubation period of eggs
ranged from 3 days at an average temperature 23.9°C to 21 days at 11.1°C

267
Ferro and Chapman (1979) also showed that there was a decrease in
incubation time for mean egg hatch with an increase in temperature.
More precise temperature studies were performed by Herbert (1981), using
degree-days (above 10°C). This author found that the durations from the
beginning of the egg stage to adult for females were 141.3, 152.3, and 139.8;
for males 134.2, 144.7, and 135.2 at 15°, 18°, and 21°C, respectively. Carey
and Bradley (1982) reported a similar relationship between temperature
and time required for TSSM development.
The developmental time required for egg hatch was approximately
40 percent of the total juvenile developmental time at the temperature
regime studied. Shih et al. (1976) reported the longer time spent in the
egg stage not only contributed to a longer period for predation by egg-
feeding phytoseiid predators in a predator-prey interaction but also
provided more time for the older stages to remain free of predation.
For survivorship and reproduction of TSSM, the present study
confirmed that temperature influenced these two parameters. Among
the temperatures studied, generation mortality was found to be the least
at 25°C. This is in agreement with the statement by Boudreaux (1963) that
the optimal temperature of many spider mite species occurs between 24°
and 29°C In general, both development and reproduction of TSSM are
summarized by the value of rm which was positively correlated with the
temperature range employed. It was ascertained that values of r m
increased as generation times decreased.
In the present study, no effect of temperature on the ratio of
females to males for mite populations reaching adulthood was observed.
This indicated that survival of males was similar to that,of females at the
temperature regime used. Nevertherless, Hazan et al. (1973) reported that
the numbers of adult males and females which emerged from tetranychid
eggs was affected by temperature.

268
6.4.2. Humidity
Of the environmental factors studied, it appears that humidity is
the second most important factor in modifying the growth rate of mite .„
populations. Studies on the humidity relationships of TSSM by Andres
(1957) showed this species to be favoured by low humidity. Nickel (1960),
working with TSSM on cotton, also reported that the mites had a lower
rate of reproduction and a slower rate of development at high, as
compared with low, relative humidity. In terms of hygrokinetic
behaviour, Mori and Chant (1966) found that TSSM chose dry conditions
over moist ones, and that mite activity was reduced when they were
placed in high humidities.
The results in the present study indicated that the embryonic
development was influenced by humidity. A explanation may be in the
physiology of the mite egg. Dittrich (1971) described the morphology of
TSSM eggs as it relates to respiration. This author stated that a narrow
duct system is present in the egg through which i embryo respiration takes
place. If the air flow system is saturated with water vapor, resistance to
the Movement of oxygen and carbon dioxide may contribute to the
mortality of the embryo. By using saturation deficit (SD) as an index of
humidity, Ferro and Chapman (1979) also demonstrated the effect of
varying humidities at different temperatures on hatchability of TSSM.
• Similar results have been reported in other members of the
tetranychidae. Nickel (1960), working with T. desertorum Banks on
cotton, found that the differences due to humidity level were most
pronounced in the egg stage. Perring et aJ. (1984), working with
Oligonychus pratensis (Banks) on corn, also indicated that humidity was
an important variable in egg survival.
In addition to the effect of very high humidity, the results from the
present work showed that the egg stage suffered high mortality at low

269
humidity (55%RH). This appeared to be due to the effect of desiccation on
egg survival. There are apparent contradictions between the results
reported in this study and the results reported by Nickel (1960), who
reported that the mortality of the egg stage was lower at low humidities
(25-30%RH) than at high humidities (85-90%RH). It appears possible that
the temperature, as well as light intensity, used in these two studies
might be involved. Nickel's observations related to saturated solutions
however temperature and light intensity were not controlled Results of
this study is based on the use of three temperature levels and two light
intensities.
In the present study, survival of postembryonic stages was affected
by humidity. Boudreaux (1958) also reported a much higher nymphal
mortality at very high humidity. This suggests that TSSM may be more
easily controlled in glasshouses if a high relative humidity is maintained
everything else being equal.
For the developmental time for each juvenile stage studied, there
were significant differences in egg period, total juvenile developmental
period and pre-reproductive period between moderately humid
conditions (70-80%) and water-saturated atmospheres. However, no
significant differences in these periods were detected among humidity
conditions which were controlled by the use of the saturated solutions.
Similar results were reported for TSSM on cotton by Boudreaux (1958)
and Nickel (1960).
Using the value of rm as the criterion for favourability, the most
favourable humidity of those studied was shown to be 76%RH. The r m
determined at this humidity level was slightly greater than those
recorded at the other humidity levels. In addition, at 76%RH a slight
decrease in the mean generation time occurred.

270
The results from this study show that the sex ratio of immatures
reaching adulthood was affected by humidity. At very high humidity, sex
ratio determinations indicated a shift towards a higher female : male
ratio, indicating that females were more tolerant to humidity than males.
Furthermore, the interaction between humidity and susceptibility
was not significant. This indicated that as far as humidity was concerned,
mites generally responded similarly irrespective of the genotype tested.
6.43. Light intensity
As with other variables of the physical environment, light
intensity Can modify fundamental physiological processes of pests and
their host plants. Low light intensity has the greatest influence on
expression and magnitude of plant resistance (Tingey and Singh, 1980).
For example, Lowe (1974) reported that fecundity and population levels of
iWzus persicae were significantly reduced on resistant and susceptible
lines of sugar beets grown at light intensities reduced about 75 percent
from incident intensities in a glasshouse environment.
For the plants, light has long been implicated as a factor in nitrate
metabolism. In 1888, A.F.W. Shimper reported that shaded leaves
contained a higher concentration of nitrate than leaves grown in the sun
(Knipmeyer et al., 1962). Burstrom (1943) obtained evidence that wheat
leaves might reduce nitrate in the light but not in the dark Delwiche
(1951), working with isotopic nitrogen, indicated that tobacco plants
metabolized nitrate or ammonia in the dark as well as in the light. Other
reseachers stated that some plant species can metabolize nitrate or
hyponitrite in both light and dark; however, the rate is accelerated in the
light (Mendel and Visser, 1951; Frear and Burrell, 1958). Candella et al.
(1957) and Hageman and Flesher (1960) demonstrated that light was
needed to maintain the enzyme nitrate reductase in an active state.

271
Since the variation in susceptibility of the two genotypes tested was
not significant, the light intensity employed could not be shown to affect
the mite populations on both genotypes of hops. In addiii9n, the
interaction between susceptibility and light intensity was not significant,
indicating that mites generally responded the same on the genotypes
tested as far as light intensity was concerned.
For the life-history parameters, the present study showed that light
intensity had an influence on survival, development and reproduction
of TSSM populations, especially those in open containers. It was noted
that generation mortality of mites was generally greater at low light
intensities than at high light intensities. There were significant
differences in total juvenile development and pre-reproductive periods
of mites reared at different light intensities. The intrinsic rate of increase
tended to be greater for mites reared at higher light intensities, while the
mean generation time tended to be longer for mites reared at lower light •
intensities. Wyatt and White (1977) and Wrensch (1985) stated that light
intensity is a factor influencing fecundity. However, it was evident that
the time required for egg hatch was not affected by the light intensity
employed
In the present study, the results obtained in open containers did
not conform to those in closed containers. It seems probable that fresh air
or purified air circulating in the rearing incubator enhanced the
production of the mite. This may partly be the result of more favourable
conditions for food utilization brought about by air change. Munger
(1955; 1956), working with the citrus red mite on lemons in rearing
rooms, found a similar effect.
Sex ratio of immatures becoming adults were observed to favour
females for mites reared in both open and closed containers. It was found
that at a light intensity of 43 lux the male immatures were not able to

272
reach adulthood at both 200 and 30°C under very high relative humidity
conditions, whereas adult mites reared at the other environmental
. regimes consisted of males and females. This indicated that an
interaction between light intensity, temperature and humidity affected
mite populations.
6.4.4. Plant variables
6.4.4.1_ Leaf age The influence of leaf age on expression of genetic
resistance could not be shown in this study because there were no
significant differences in varietal susceptibility and the interaction
between leaf ages and genotypes was not significant. However,
numerous other observations of leaf age-related shifts in pest
performance and levels of resistance have been reported (Henneberry,
1962; McMurtry, 1962; Watson, 1964; Tingey and Singh, 1980).
The results from the present study also show that very little
difference occurred between survival, development and reproduction of
mites on old and young leaf discs. There appeared to be no consistent
pattern in generation mortality for mites reared on leaf discs cut from
hop leaves at different ages. In general, the developmental period of
mites on young leaf discs was very similar to that on old leaf discs.
Nevertheless, it was apparent that total juvenile developmental time
between young and old leaf discs of M27 differed significantly. The
intrinsic rate of increase tended to be higher on young leaf discs than on
old ones, indicating an apparent effect of leaf age upon fecundity. This
was probably due to the decreasing availability of nitrogen in the older
leaves. Similar results were reported by Watson (1964). However, Cates
(1980) suggested that there is a general trend for young leaves to have
higher toxin levels than mature leaves, and for nonspecialized
herbivores to prefer mature leaves over young expanding leaves.

;173
Sex ratio of immatures reaching adulthood were observed to
favour females for mites reared on both young and old leaf discs. From
the present data it can be seen that sex ratio determinations on old leaf
discs showed a shift towards a smaller female : male ratio. Wresnsch and
Young (1983) suggested that the sex ratio of tetranychids is sensitive to
leaf quality.
6.4.t2. Leaf regions: Since the size of major veins in the basal zone
of a hop leaf is usually larger than those in the distal region, the study on
possible effects of leaf vein size on life history of mite populations was
carried out using leaf discs cut from different regions of a leaf. Mitchell
(1973) suggested that the feeding area of TSSM often lies 'close to a leaf
vein. The results from this study show that survival and reproduction of
mites were not signicantly affected by the size of leaf veins, whereas
development was found to be influenced by this variable, especially on
M27. This indicated that the possitively or negatively influence of leaf
veins studied might depend on genotypes of hop plants. Some genotypes
may have larger veins than other ones.

274
CHAPTER 7 RELATIONSHIP BETWEEN HOP LEAF
MORPHOLOGY AND SUSCEPTIBILITY TO TSSM
7.1. INTRODUCTION .
In continuing efforts to elucidate the parameters of hop genotypes
which account for their TSSM resistance, roles of morphological factors
in such resistance have been studied (Peters and Berry, 1980b). There is
much evidence that plant morphological factors such as tissue toughness
and trichomes (hairiness) act as barriers to some pests (Norris and Kogan,
1980). Several pest species, however, may respond differently to a given
plant morphological trait (Chiang and Norris, 1985). Past research.
these characteristics as they relate to TSSM has focussed mainly on
trichomes.
This chapter, therefore, presents the results of a study designed to
examine leaves from various hop genotypes for morphological
differences and evaluate the relationshiP of the morphological
characteristics to mite fitness traits. The morphological features studied
were ventral trichomes, lupulin glands, stomata, cuticle thickness, leaf
thickness, leaf veins and leaf moisture content. In addition, the effect of _
mite damage on leaf surface was examined and related to stomatal
opening and stomatal size.
7.2. MATERIALS AND METHODS
7.2.1. Morphological features
7.2.1.1. Plant material: Leaves were collected from hop genotypes
grown in the field at Bushy Park or in a glasshouse at the Department of
Agricultural Science. All the 27 genotypes of hops mentioned in Chapter
5 were employed. For each genotype, the leaves were divided into two

275
portions; the first one for the bioassay test in Chapter 5 and the second
one for the examination of morphological factors.
7.21.2. External characteristics of hop leaves: Fully expanded
mature leaves of the 27 genotypes sampled from hop plants in the field or
in the glasshouse were used in this study. In addition to the mature
leaves, a leaf at the fourth node from the plant tip of each genotype in the
field was also collected for comparing the morphological characteristics of
young leaves with those of old ones.
Hop leaf surfaces were examined by scanning electron microscopy
(Philips SEM505) at 1.5 kv and a spot size of 20 nm. Before the
examination, samples were prepared as follows: (1) whole leaves were
submerged into 4% gluteraldehyde in phosphate buffer (pH7) and the
sample (ca. 0.75 cm. diam.) were cut out while being submerged to insure
maximum penetration of the fix agent; (2) the samples placed abaxial side
up were fixed on aluminum stubs with silver liquid paint; (3) the
samples were then critically point dried, ultra-pure gold coated in a
Balzers Union splutter coater to give a film thickness of 25 nm., and
examined at 60X, 300X, 925X, and 5000X for densities of lupulin glands
and ventral trichomes, diameters of gland and trichome bases, stomatal
densities, and stomatal sizes, respectively. Images were recorded with
Polaroid 667 and Ilford FP-Y120 Film. A total of eight samples was taken
from each genotype. These samples included six from the mature leaves
of field hop plants, another from the mature leaves of glasshouse hop
plants, and the other from the young leaves of field hop plants.
7.2.1.3. Histological examinations: A razor blade was used for
removing tissue samples from the basal regions of hop leaves. Then the
tissue samples were sectioned using a plant microtome (Cat. No. 1225;
Lab-Line Instruments, Inc.). These sections were stained with Sudan IV
prior to microscopic examination. Using an ocular micrometer in a

276
binocular microscope, the measurement for trichome length, major vein
size, upper and lower epidermal layer, and leaf thickness was carried out
at 125X and for cuticle thickness at 500X. A total of six samples were
examined for each genotype. These samples included three from the
young leaves of glasshouse hops, two from the mature leaves of
glasshouse hops, and the other from the mature leaves of field hops.
7.2.1.4. Leaf moisture content: Six fresh mature leaves collected
from each genotype of field hop plants were weighed and placed in a 70°C
drying oven. Two days later, the dried leaves were removed and
reweighed to obtain a ratio of dry to wet weight.
7.2.2. Morphological responses of hop leaves to mite infestations
Feeding injuries caused by. various levels of TSSM infestations
between different hop genotypes was studied using the leaf disc
technique. Mature leaves were collected from the genotypes M4 (slightly
susceptible) and M26 (highly susceptible) under field• conditions at
Horticultural Research Centre. Four plants of each genotype were
sampled, and one leaf of similar age was removed from each plant.
Immediately after collection, three discs (1.35 cm. diam.) were cut from
each leaf with a sharp mouth test tube. These three discs were placed
abaxial side up on a filter paper surrounded by a water soaked cotton pad
in the same petri dish. Mite densities of 0, 5, and 10 teneral females per
disc, representing control, low, and high densities, respectively were
randomly assigned to one disc on each petri dish. The experimental
design then may be described as a two (genotypes) X three (densities)
factorial experiment with 12 leaf discs tested on each genotype. The mite
culture was kept in a constant temperature room maintained at 25°C,
with a 16:8 h. L:D photoperiod. Each disc was observed daily under a
binocular microscope (10X) and the number of eggs was counted. During
this time, the number of females was adjusted to maintain those

277
densities in each disc. Three days after infestation all the mites and eggs
were removed and the leaf discs were examined to estimate leaf area
scarred in terms of the number of yellow specks occurring on the adaxial
side under a binocular microscope (10X). Additionally, the number of
open stomata and their sizes at four positions were determined using the
electron microscopy at 925X and 5000X, respectively.
7.2.3. Data analyses
Analysis of variance was used to detect differences not only in
morphological characteristics between different hop genotypes but also in
mite daily fecundity among different densities. Means were compared
-using Fisher's protected least significant differences (PLSD) test with an
alpha level of 5%. For the morphological features of leaves collected
from different sources, the differences were analysed by the t-test. All the
analyses were completed on Macintosh Classic II with MacSoftware
Statview SE + Graphics. Linear regression employed to define the
relationship of the morphological factors to mite fitness traits was
obtained from the curve fit procedure of the Cricketgraph computer
program. Since group variances tended to be proportional to the means,
the daily egg comas were transformed as square root of x + 0.5 for
statistical analysis (Zar, 1984), where x is the number of eggs per female
per day.
7.3. RESULTS
7.3.1. Hop leaf morphology
7.3.1.1. Different genotypes: Scanning electron microscopy showed
external morphological characteristics on the lower surface of hop leaves.
These characteristics included ventral glands, trichomes and stomata
(Plate 5).

278
Plate 5. The lower surface of hop leaves at 212X.
The mean density of ventral glands as well as the average diameter
of the gland for each genotype is presented in Table 7.1. It was apparent
that there were no significant difference's in gland densities among the 27
hop genotypes studied (p < 0.05), whereas gland diameters between these
genotypes differed significantly (p > 0.05). Maximum numbers of ventral
glands per mm2 were found on M16, M9, and M21 and minimum
numbers on M6, M2, and M7. The diameters of ventral glands on M20
were significant longer than those on other genotypes with the exception
• of M18 and M22, whereas M1 had the shortest diameter compared with
other genotypes.

Table 7.1. Average number of ventral glands and gland diameters found on each genotype tested.
279
Genotype
Means ± S.E.
Number of ventral glands per nuT?
Gland diameters (micron.)
M1 3.038 + 0.538 128.72 + 4.160 a M2 2.333 + 0.518 131.79 + 3.785 ab M3 3.472 + 0.743 153.60 + 3.930 efg M4 4.178 + 0.613 152.03 + 3.895 def M5 3.689 + 0.348 132.01 + 3.887 ab M6 2.116 + 0.224 134.47 + 4.102 abc M7 2.387 + 0.492 144.10 + 5.101 bcde M8 2.767 + 0.505 132.69 + 4.059 ab M9 5.046 + 0.608 141.82 + 5.189 abcde M10 3.309 + 0.357 141.64 + 4.093 abcde Mll 2.930 + 0.256 15051 ±2.885 def M12 4.340 + 1.397 S 15150 + 6353 def M13 4.829 + 1.026 138.22 + 2379 abcd M14 3.581 + 1.330 149.07 + 6.242 cde M15 2.658 + 0.445 138.18 + 4.995 abcd M16 5.642 + 1.806 143.90 + 9.397 bcde M17 3.961 + 0.810 154.10 + 5.132 efg M18 3.092 + 0.265 167.21 + 3.870 gh M19 3.309 + 0.434 144.79 + 4.501 bcde M20 2.767 + 0.384 170.74 + 8.349 h M21 4.991 ±1.437 153.82 + 8.780 efg M22 3.689 + 1.205 16458 + 2.946 fgh M23 3.364 + 1.171 153.17 + 4.243 efg M24 2.441 ± 0.705 13253 + 4.281 ab M25 4.395 ± 1.0% 148.00 + 7.254 cde M26 4.557± 1.252 155.81 + 4.195 efg M27 2.984 + 0.380 144.67 + 7.871 bcde
p-value
0.276ns 0.0001"
Means with the same letter in a column are not significantly different (p0.05) using Fisher PLSD.
• For both densities and basal diameters of trichomes, significant
differences (p < 0.01) were detected among the genotypes studied (Table
7.2). M4 had the highest number of trichomes per mm2 followed by M9
and MI9 with M7, M13 and M27 having the lowest densities. In terms of
trichome basal diameters, MI had the longest diameter followed by M20
and M18 with M12 having the shortest.

Table 7.2. Average number of trichomes and trichome basal diameters found on each genotype tested.
Means ± S.E Genotype
Number of trichomes 2 per ITIM
Trichome basal diameters (micron.)
M1 3.147 + 1.283 def 73.593 + 7319 f M2 1.465 + 0.646 abcd 58.578 + 2.165 abcdef M3 0.814 + 0.397 ab 49.778 + 2.288 abcd M4 5.371 + 1.166 g 59.722 + 7.553 bcdef M5 1.356 + 0.638 abcd 58.056 + 6.672 abcdef M6 1.139 + 0.832 abcd 63.704 + 5.342 cdef M7 0.217 + 0.082 a 54.444 + 1.111 abcd M8 0.977 + 0.732 abc 57.778 + 4.157 abcdef M9 3.%1 + 1.261 efg 57.569 + 2.909 abcde M10 1.139 + 0.580 abed 55.208 + 2.446 abcde Ml!. 2.170 + 0.782 abcde 62.593 + 5.931 cdef M12 0.814 + 0322 ab 41.667 + 8.813 a M13 0.597 + 0.357 oh -49.409 + 2.319 abed M14 2.170 + 0.608 abcde 65.903 + 8.840 def M15 1.899 + 0.676 abcde 45.694 + 4.626 ab M16 1.573 + 0.824 abed 53.333 + 2.222 abed M17 1.031 + 0.666 abed 64.333 + 6.948 cdef M18 2.984 + 0.896 cdef 72.476 + 6.535 ef M19 3.743 + 1.124 efg 53.397 + 2.918 abed M20 4.449 + 1.010 fg 73.056 + 4.188 f M21 1.085 + 0.525 abed '61.852 + 6.244 cdef M22 2.170 + 1.079 abcde 58.444 + 8.802 abcdef M23 1.031 + 0.492 abed 54.519 + 5.160 abed M24 0.760 + 0365 ab 61.244 + 6.590 bcdef M25 1.085 + 0358 abed 49.286 + 4.979 abc M26 2.4%± 1.069 bcdef 54.756± 7.611 abed M27 0.543 + 0.304 ab 55.556 + 0.000 abcde
p-value
0.0001** 0.0113**
Means with the same letter in a column are not significantly different (p>0.05) using Fisher PLSD.
• When the numbers of ventral glands and trichomes per unit area
were pooled, it was found that there were highly significant differences (p
< 0.01) in the density among these genotypes (Fig. 7.1). The highest
density of these morphorlogical characteristics was found on M4 followed
by M9, M16 and M20 with M7, M24 and M27 having the lowest density.
280

Fig. 7.1. Total number of ventral glands and trichomes within 1 mmi of hop leaves for each genotype studied.
1 2 3 4 5 6 7 8 9 10 11 12 13 14 15 16 17 18 19 20 21 22 23 24 25 26 27 Genotype
The sizes of ventral glands and trichome bases, expressed as surface
areas, are presented in Fig. 7.2. It was apparent that the surface area for
each ventral gland and trichome base among the 27 genotypes differed
significantly (p < 0.05). The average surface areas varied from 23287.598 to
13225.018 p.m 2 and 4477.401 to 1669.239 gm 2 for ventral glands and
trichome bases, respectively. Fig. 7.3 shows the percentages of hop leaf
surface areas within 1 mm 2 for ventral glands and trichome bases.
Significant differences were detected in the percentage of ventral gland
areas on each genotype (Fig. 7.3A), M26 having the highest and M6 the
lowest percentage, respectively. The percentage of trichome basal areas
also varied significantly among these genotypes, with M20 having the
highest percentage, followed by M18 and M4. M7 had the lowest
percentage compared with other genotypes (Fig. 7.3B).
281

Tric
hom
e ba
sal a
rea
(mic
roa )
Fig. 7.2. Average areas of ventral glands (A) and trichome bases (B) found on each genotype tested.
1 2 3 4 5£ 7 8 9 10 11 12 13 14 15 16 17 18 19 20 21 22 23 24 25 26 27
Genotype
282
1 2 3456 7 8 9 10 11 12 13 1415 16 17 1819 20 21 22 23 24 25 26 27
Genotype

3 p=0.0001** PLSD=0.68
B)
0
Fig. 7.3. Percentage of ventral gland areas (A) and trichome areas (B) within lnun2 of hop leaves for each genotype studied.
15
Perc
enta
g e o
f gla
n d a
reas
123 4 5 67 8 9 10 11 12 13 14 15 16 17 1819 20 21 22 23 24 25 26 27 Genotype
1 2 3 4 5 6 . 7 8 9 10 11 12 13 14 15 16 17 18 19 20 21 22 23 24 25 26 27 Genotype

When the percentages of surface area found on hop leaves within
1 mm2 for ventral glands and trichome bases were pooled, highly
significant differences (p < 0.01) were detected among the genotypes
studied (Fig. 7.4). M20 had the highest percentage of gland and trichome
areas, followed by M4 and M9, with M6 and M7 having the lowest
percentage.
Fig. 7.4. Pooled percentage of gland and trichome areas within 1 ram2 of hop leaves for each genotype studied.
u, 15
Ou 1
0
ect
R4
1 2 3 45 6 7 8 9 10 11 12 13 14 15 16 17 18 19 20 21 22 23 24 25 26 27 Genotype
From studying the cross sections of hop leaves, the length of
trichomes on each genotypes is presented in Table 7.3. Significant
differences (p < 0.05) in the trichome length were found among the 27
genotypes, with M2 having the longest trichomes followed by M6, M15,
and M26. M10 had shorter trichomes than other genotypes, although not
differing significantly from trichome lengths of M23, M4, M8, M25, M16,
M24, M21, M7, M12, M9, M19, M5, M22, M14, M3, M13, M27, and M20 (p >
0.05).

Table 73. Average length of trichome on leaves of 27 hop genotypes studied.
Genotype Trichome length (micron.)
Means + S.E.
M1 387.10 + 42.63 bcde M2 468.77 + 56.89 e M3 346.27 + 57.79 abcde M4 262.97 + 35.01 ab M5 328.30 + 35.67 abcd M6 452.43 + 69.41 de M7 311.97+ 24.98 abc M8 274.40 + 46.99 ab M9 325.03 + 4153 abcd M10 223.77+29.88 a Mll 377.30 + 47.39 bcde M12 323.40 + 22.63 abcd M13 351.17 + 66.25 abcde M14 343.00 + 63.71 abcde M15 419.77 + 46.34 cde M16 280.93 + 68.44 ab M17 377.30 + 42.02 bcde M18 372.40 + 45.62 bcde M19 326.67 + 6155 abcd M20 354.43 + 44.80 abcde M21 295.63 + 23.25 abc M22 338.10± 38.69 abcde M23 256.43 + 36.62 ab M24 287.47 + 56.68 abc M25 276.03 + 34.18 ab M26 419.77 + 62.16 cde M27 352.80 + 14.97 abcde
p-value 0.0465*
Fig. 7.5 shows the plots of hop trichome density to length of 27
genotypes. From this figure, it can be seen that four basic trichome
profiles were observed: (1) few-short trichomes represented by M10, M23,
M8, M25, M16, M24, M21, M7, M12, M5, M14, M22, and M3; (2) few-long
trichomes by M27, MI3, MI7, Ml 1, M26, M15, M6, and M2; (3) many-short
trichornes by M4, M9, and M19; and (4) many-long trichomes by M20, M18
and MI. According to the results obtained from the preference test in
Chapter 4, it was found that most of the hop genotypes in few-long and

286
many-short trichomes were identified as highly susceptible and slightly
susceptible genotypes, respectively.
Fig. 7.5. Trichome density and length of 27 hop genotypes and the respective trichome profile region: (A) few-short trichomes; (B) few-long trichomes; (C) many-short trichomes; and (D) many-long trichomes.
6
5 -
(C) (D)
-1 -
0 (A)
20
9
19 1
18
21 11 14E1
16 N 5
10 25 21 N N 23
II I 1 12 3 17 I
8 N ti 1627
247 ' 13 I 1
1
26
15
2
61
(B)
200 300 400 500
Trichorne length (micron.)
There were highly significant differences (p <0.01) in stomatal
density and stomatal size (based on the length and width of stomata!
pores) among the 27 genotypes studied (Table 7.4). The highest number
of stomata per mm2 was found on M13, followed by M9, M8 and M10.
M7 and M14 had the lowest density compared with other genotypes.

287
Table 7.4. Average number of stomata per rrun2 and stomatal sizes found on leaves of
27 hop genotypes.
Genotype Means ± S.E.
Number of stomata per mm2
Stomatal length (micron.)
Storrtatal width (micron.)
M1 548.212 + 36.547 abcdef 11.70± 1.01 abc 4.95 ±018 hi
M2 548.212 + 44.880 abcdef 11.11 ± 0.84 ab 3.13 ± 0.39 abc M3 572.577 + 56582 abcdefgh 11.35 ± 134 abc 3.46 ± 0.44 abcde M4 548.212 + 51.891 abcdef 1158 ±0.99 abc 4.36 ± 0.41 efghi
M5 523.847 + 55.062 abed 14.08 ± 0.39 cdef 4.41 ± 0.25 efghi M6 572.577 + 42.948 abcdefgh 12.54 ± 0.74 abed 3.99 ± 032 bcdefgh
M7 426.387 + 17.833 a 15.68 ± 1.39 ef 5.17± 0.49 i M8 694.402 + 72.366 fgh 10.64 ±059 a 2.93 ± 0.25 a M9 706.584 + 63.134 gh 11.98 ± 0.72 abc 3.73 ± 0.29 abcdef M10 682.219 + 36.836 efgh 13.25 ± 0.63 abcde 4.12 ± 0.37 cdefgh MI 1 487.300 + 31.901 ab 1259 ±0.75 abed 3.85 ± 0.47 abcdefg MI2 487.300 + 61.086 ab 11.46 ± 1.09 abc 3.82 ± 0.33 abcdefg M13 718.767 + 51.891 h 11.15 ±0.83 abc 3.06 ± 027 ab MI4 426.387± 44280 a 13.92 ± 0.94 bcdef 3.96 ± 0.47 bcdefgh MI5 670.037 + 74.673 defgh 1132 ± 1.09 abc 3.18 ± 0.27 abed M16 657.854 + 44.165 cdefgh 1119 ± 0.73 abc 3.13 ±0.19 abc M17 572577 + 83265 abcdefgh 1214 ± 1.65 abcd 326 ±0.45 abed MI8 487.300 + 68.915 ab 15.16 ± 0.90 def. 4.79 ± 030 ghi M19 548.212 + 82210 abcdef 1351± 0.88 abcdef 4.51 ± 0.13 fghi
M20 523.847± 55.062 abed 12.07+ 1.19 abc 3.66 ± 0.45 abcdef M21 511.664 + 35.667 abc 1352 ± 1.08 abcdef 434 ± 037 efghi M22 511.664 + 44.165 abc 16.35± 1.53 f 4.05 ± 033 bcdefgh M23 560.394 + 51274 abcdefg 15.71± 1.34 ef 4.13 ± 0.49 defgh M24 560.394 + 24.365 abcdefg 1255 ± 0.74 abcd 3.75 ± 0.23 abcdef M25 584.759 + 45.115 bcdefgh 13.87 ± 1.04 bcdef 4.08± 0.25 cdefgh M26 536.029 + 52.095 abcde 15.05 ± 0.86 def 3.65 ± 0.41 abcdef M27 670.037± 22.083 defgh 13.44 ± 1.90 abcdef 3.47 ± 039 abcde
•
p-value
0.0004**
0.0006**
0.0001**
Means with the Same letter in a column are not significantly different (p>0.05) using Fisher PLSD.
In addition, the histological eZaminations displayed internal
morphological characteristics of hop leaves for each genotype. No
significant differences in thickness of leaves (Fig. 7.6A), major veins (Fig.
7.6B), cuticle layer, upper and lower epidermis (Table 7.5) among the 27
genotypes were detected (p > 0.05). The thickness ranged from 94.733 to
111.067 gm., 0.503 to 0.761 mm., 2.480 to 2.687 gm., 9.637 to 14.21 gm., and
8.003 to 10.13 gm. for leaves, major veins, cutide, upper and lower
epidermis, respectively.

Fig. 7.6. Thickness of leaves (A) and major leaf veins (B) of 27 hop genotypes studied.
1 2 3 4 5 6 7 8 910 11 12 13 14 15 16 17 18 19 20 21 22 23 24 2526 27 Genotype
1 2 3 4 5 6 7 8 9 10 11 12 13 14 15 16 17 18 19 20 21 22 23 24 25 26 27 Genotype

289
Table 7.5. Thickness of cuticle, upper and lower epidermis in leaves of each genotype studied.
Means ± S.E. Genotype
Cutical thickness (micron.)
Upper epidermis (micron.)
Lower epidermis (micron.)
•M1 2.687 + 0.207 12.25± 1.67 9.147 + 0.41 M2 2521 + 0.041 11.43 + 1.63 9.473 + 0.33 M3 2.521 + 0.041 14.21 + 1.86 9.473 + 0.33 M4 2.480 + 0.000 •11.43 + 1.63 8.657± 0.78 M5 2.687 + 0.207 12.25 + 1.67 9.473± 0.33 M6 2521 + 0.041 11.43 + 1.63 9.637 + 0.16 M7 2.521 ±0.041 10.94± 0.82 9.310 + 0.34 M8 2.563 + 0.083 13.07 + 2.07 9.637 + 0.16 M9 2.480 + 0.000 10.94 + 0.82 9.800 + 0.00 M10 2.480 + 0.000 11.43± 1.63 9.473 + 0.21 M1 1 2.480 + 0.000 13.88 + 1.97 9.473 + 0.33 M12 2.480 + 0.000 9.637 + 0.16 9.310 + 0.33 M13 2.480 + 0.000 13.88 + 1.97 8.003 + 0.99 •M14 2.480 + 0.000 13.07 + 2.07 9.228 + 0.41 M15 2521 + 0.041 12.25± 1.67 9.147 + 0.49 M16 2.563 + 0.083 11.27± 1.67 8.738 + 0.48 M17 2321 + 0.041 11.43 + 1.63 10.13 + 1.03 M18 2521 + 0.041 9.800 + 0.0G 9.637 + 0.16 M19 2.521 + 0.041 9.800± 0.00 9.473 + 0.33 M20 2.687 + 0.207 12.25± 1.67 9.800 + 0.00 M21 2563 + 0.083 11.43± 1.63 9.147 + 0.41 M22 2.480 + 0.000 10.62 + 0.82 9.800 + 0.00 M23 2.687 + 0.207 11.43 + 1.63 9.473 + 0.33 M24 2.480 + 0.000 11.43 + 1.63 9.392 + 0.41 M25 2.480 + 0.000 9.800 + 0.00 9.800 + 0.00 M26 2.480 + 0.000 10.62 + 0.82 9.637 + 0.16 M27 2.480 + 0.000 10.62 + 0.82 9.800 + 0.00
p-value 0.8846ns 0.8272ns 0.4356ns
Table 7.6 shows mean dry : wet weight ratios for each hop
genotype. Highly significant differences in moisture content were found
among these genotypes studied (p < 0.01). M2 had the highest percentage
followed by M6, M13 and M24, with M22 having the lowest percentage
compared with other genotypes.

290
Table 7.6. Mean ratio of dry : wet weight in leaves of 27 hop genotypes (expressed as a percentage).
Genotype
Percent dry weight
(Means + S.E.)
M1 25.832 + 0.678 ab M2 30.276 + 0.939 k M3 28.540 + 0.322 defghijk M4 26.744 + 0.556 abcde M5 26.256 + 0.411 abc M6 29.919 + 1.116jk M7 26.431 + 1.193 abcd M8 26.769 + 1.184 abcde M9 29.158 + 0.879 ghipc M10 27.809 + 0.871 bcdefghij Mll 26.711 + 0.610 abcde M12 28.9% + 0.891 till* M13 29.665 + 1.110 ijk M14 27.264 + 0.503 abcdefg M15 27.401 + 1.020 abcdefgh M16 28.646 + 0.507 efghipc M17 27.081 + 0.766 abcdefg M18 28531 + 0.508 defghijk M19 28.251 + 0.369 cdefghijk M20 26.161 + 0.573 abc M21 29.137 + 0.929 gbiPc M22 25.457 + 0.419 a M23 27.746 + 0.600 bcclefghi M24 29.441 + 0.476 hi* M25 26.900 + 0.768 abcdef M26 27.830 + 0.751 bcdefghij M27 27.216 + 0.728 abcdefg
p-value 0.0001**
7.3.1.2. Different sources of leaves: A comparison of morphological
characteristics between field and glasshouse hop leaves is summarized in
Table 7.7 which shows the means for each feature. According to t-tests,
significant differences (p < 0.05) between these two sources of leaves were
found for ventral gland density, trichome density, total density of glands
and trichomes, percentage of trichome areas, total percentage of gland and
trichome areas, stomata' density, stomatal sizes, leaf thickness, vein
thickness, and thicknesses of both the upper and lower epidermis. It was
also apparent that there were no significant differences in gland

291
diameters, gland areas, tric.home basal diameters, trichome basal areas,
percentage of gland areas, trichome lengths and cuticle thickness between
glasshouse anc,,field hop leaves (p > 0.05).
Table 7.7. Comparison of morphological characteristics between field and glasshouse hop leaves.
Morphological Source of leaves (Means + S.E.)
p-value characteristics Glasshouse Field
Density2of ventral glands per mm
3.745 ± 0.369 2.867 ± 0.109 0.0046**
Density of trichomes per mm2
3.424 ± 0550 1546 ± 0.180 0.0002**
Gland diameter (micron.) 143.222 ± 3.448 148389 ± 1.426 0.1717ns Gland area (micron.) 16359.931 ± 775.829 17558.085 + 340.899 0.1815ns Trichome basal diameter (micron.)
62.863± 2.379 59.722 + 1561 0.3704ns
Trichome basal area 3211.730± 245.285 3015.092 ± 162.540 0.5894ns 2 (micron.)
Number of ventral glands and trichomes per nun2
7.169± 0.618 4.413 + 0.217 0.0001**
Percentage of gland area per mm2
6.092 ± 0.583 5.044 ± 0.212 0.0677ns
Percentage of trichome area per rnm2
4330 ± 0.758 1.833 ± 0.234 0.0002**
Pooled percentage of gland and trichome area per mat2
10.422± 1.011 6.877 ± 0.331 0.0001**
Density of stomata per mm2
418.717± 23.156 600.401 ±12.157 0.0001**
Length of stomata (micron.)
16.492± 0537 12.451 + 0.239 0.0001**
Width of stomata 4.295± 0.173 3.766± 0.089 0.0228* -(micron.) Leaf thickness (micron.) 101.72± 1.036 113.244 + 2359 0.0001** Vein thickness (mm) 0.735 ± 0.018 1.127 + 0.032 0.0001** Thickness of upper epidermis (micron)
9.963 0.112 15.970 ± 0.721 0.0001**
Thickness of lower epidermis (micron.)
8.902 + 0.127 9.981 ± 0.181 0.0001**
Trichome length (micron.) 362.963 16.669 376.756 + 22.652 0.6298ns Cuticle thickness (micron.)
2344± 0.019 2.664 ±0.086 0.0754ns
Between old and young leaves, significant differences (p < 0.05)
were detected for ventral gland density, gland diameters, gland area,
trichome basal area, total density of glands and trichomes, percentage of

292
gland area, total percentage of gland and trichome areas, stomata! density,
vein thickness, trichome length, cuticle thickness, and thicknesses of both
the upper and lower epidermis (Table 7.8). Nevertheless, the variation in
trichome density, stomata! size and leaf thickness was not significant (p >
0.05).
Table 7.8. Comparison of morphological characteristics between young and old hop leaves.
Morphological • Source of leaves (Means + S.E.) p-value characteristics Young Old
Density of ventral glands 7.459 ± 0.778 2.867 ± 0.109 0.0001" ? Per mn •
Density of trichcimes per 2.170± 0.425 1.546 ± 0.180 0.1889ns !run' Gland diameter (micron.) 137.901 ± 2.543 148.389 ± 1.426 0.0045** Gland area (microg.) 15073.866 ± 571.794 17558.085 ± 340.899 0.0047** Trichome basal diameter (micron.)
48.356± 2.005 59.722 ± 1.561 0.0012**
Trichome basal area (micror) •
1913.030 ± 142.896 3015.092 ± 162.540 0.0021"
Number of ventral glands and trichomes per nu!?
9.629 ± 0.716 4.413 ± 0.217 0.0001"
Percentage of gland area per ma?
11.148 ± 1.176 .5.044 ± 0.212 0.0001"
Percentage of trichome area per mrn2 .
1.641 ± 0345 1.833 ± 0.234 0.7443ns
Combined percentage of gland and trichome area per nut.?
2 Density of stomata per mm
12.789 ± 1.095
523.3% ± 27.599
6.877 ± 0.331
600.401 ± 12.157
0.0001"
0.0166* Length of stomata (micron.)
12.238 ± 0.494 12.451 ±0.239 0.7305ns
Width of stomata (micron-) 4.192 ± 0.195 3.766 ± 0.089 0.0692ns Leaf thickness (micron.) 102.719 ± 0.863 ' 101.720 ± 1.036 0.4621ns Vein thickness (mm) 0.384 ± 0.010 0.735 ± 0.018 0.0001** Thickness of upper epidermis (micron.)
11.191 ± 0378 9.963 ± 0.112 0.0103*
Thickness of lower epidermis (micron.)
9.558 ± 0.111 8.902 ± 0.127 0.0002"
Trichcime length (micron.) • 309.002 ± 12.918 362.963 ± 16.669 • 0.0108* Cuticle thickness (micron.) • 2.480 ± 0.000 2.544 ± 0.019 0.0001"
7.3.2. Leaf morphological characteristics and hop susceptibility to
TSSM

293
The relationships between leaf morphological characteristics of the
hop genotypes studied and their susceptibility to TSSM were investigated
by using the results fr,-.)m the present work to correlate with those from
Chpters 4 and 5. Table 7.9 presents the linear regression equations for
•each leaf morphology and the intrinsic rates of increase from the
antibiosis test of the 27 genotypes in Chapter 4. It was found that these
relationships were not significant.
Table 7.9. Linear regression of intrinsic rates of increase (Y) on morphological characteristics of leaves (X) for 27 hop genotypes.
Morphological characteristics
Equation (Y =a+ bX)
Coefficient of determination (r 2)
Density of ventral glands per inn? Denlily of trichomes per mm
Y = 0.25726 - 5.0907e-3X
Y = 0.24572 - 35150e-3X
0.066
0.062
Gland diameter Y = 0.27335 - 2.3329e-4X 0.019 Gland area Y = 025629 - 1.0003e-6X 0.020 Trichome basal diameter. Y = 0.23962 - 7.4520e-6X 0.000 Trichome basal area Y = 0.24250 - 2.9622e-7X 0.002 Number of ventral glands and trichomes per inn?
Y = 025905 - 3.6725e-3X 0.112
Percentage of gland area per rim?
• Y = 0.25704 - 3.0063e-3X 0.084
Percentage of trichome area per nun2
Y = 0.24205 - 1.3521e-3X 0.016
Combined percentage of gland and trichome area per nud
• Y = 0.25433 - 1.8796e-3X 0.074
Density of stomata per mm2
Y = 0.23082 + 1.4725e-5X 0.004
Length of stomata Y = 0.22625 + 1.0006e-3X 0.008 Width of stomata Y = 026875 - 7.6091e-3X •0.058 Leaf thickness Y = 0.12975 + 1.0509e-3X 0.045 Vein thickness Y = 0.22569 + 2.1600e-2X 0.005 Thickness of upper epidermis
Y = 0.19040 + 42133e-3X 0.081
Thickness of lower epidermis
Y = 0.22531 + 1.4743e-3X 0.001
Trichome length Y = 0.23653 + 7.8495e-6X 0.001 Cuticle thickness Y = 028130- 1.6633e-2X 0.004 Percentage of weight ratio Y = 024207- 1.0388e-4X 0.000
When the leaf morphology of the 27 genotypes were correlated
with pre-reproductive period and net reproductive rates, similar , results

294
were also obtained (Table 7.10 and 7.11). The relationships between these
reproductive parameters of TSSM and the leaf morphology of hops were
not significant. The coefficient of determination (r 2) ranged from 0.000 to
0.108 and 0.000 to 0.193 for the pre-reproductive period and net
reproduction rates, respectively.
Table 7.10. Linear regression of pre-reproductive period (Y) on morphological characteristics of leaves (X) for 27 hop genotypes.
Morphological characteristics
Equation (y=a+bX)
Coefficient of determination (112 )
Density of ventral glands per 'nil? Density of trichomes per mm2
Y = 12.068 - 1.7997e-2X
Y = 11.807 + 0.10576X
0.001
0.076
Gland diameter Y = 11.397 + 4.1426e-3X 0.008 Gland area Y = 11.666 + 1.9749e-5X '0.010 Trichome basal diameter Y = 10.776 + 2.1167e-2X 0.108 Trichome basal area Y= 11.422 + 5.1918e-5X 0.102 Number of ventral glands and trichomes per inn?
Y = 11.689 + 5.8245e-2X 0.038
Percentage of gland area per mn?
Y =11.962 + 7.0986e-3X 0.001
Percentage of trichome area per nun2
Y =11.844 + 7.5370e-2X 0.067
Combined percentage of gland and trichome area per mn?
Y = 11.727 + 3.4320e-2X 0.034
Density of stomata per nun2
Y = 12.247 - 4.2747e-4X 0.005
Length of stomata Y = 11.944 + 4.5859e-3X 0.000 Width of stomata Y = 11A10 + 0.15280X 0.032 Leaf thickness Y = 13.007 - 9.6379e-7X 0.005 Vein thickness Y.= 13.522 - 2.4296X 0.083 Thickness of upper epidermis
Y = 12.392 - 3.3531e-2X 0.007
Thickness of lower epidermis
Y =12.972 - 0.10288X 0.008
Trichome length Y = 11.832 + 5.0854e-4X 0.004 Cuticle thickness Y = 7.8423 + 1.6435X 0.054 Percentage of weight ratio Y= 11.490 + 1.8478e-2X 0.002

295
Table 7.11. Linear regression of net reproductive rates (Y) on morphological characteristics of leaves (X) for 27 hop genotypes.
Morphological characteristics
Equation (Y = a + bX)
Coefficient of determination (ii)
Density of ventral glands per nm? Density of trichomes per nun
Y = 48.708 - 3.0682e-2X
Y = 51594- 1.6116X
0.000
0.024
Gland diameter Y = 51.276 - 1.8281e-2X 0.000 Gland area Y = 50.423 - 1.0671e-4X 0.000 Trichome basal diameter Y = 51560 - 5.1063e-2X 0.001 Trichome basal area Y = 52.784 - 3.7374e-4X 0.007 Number of ventral glands and trichomes per tnn?
Y = 53.903 - 0.98055X 0.015
Percentyge of gland area per mm
Y = 47.288 + 0.22081X 0.001
Percentage of trichome area per mm
Y = 50.714 - 0.99715X 0.016
Combined percentage of gland ad trichome area per mm
Y = 51.147 - 0.31618X 0.004
Dellity of stomata per mm
Y = 61.142 - 2.2081e-2X 0.018
Length of stomata Y = 1.1176 + 3.6723X 0.193 Width of stomata Y = 47.487 + 0.28611X (moo Leaf thickness Y = -36.273 + 0.81498X 0.051 Vein thickness Y = 13522 - 2.4296X 0.083 Thickness of upper • epidermis
Y = 56.065 - 0.64485X 0.004
Thickness of lower epidermis
Y = 11.174 + 3.9772X 0.016
Trichome length Y = 33.626 + 4.4261e-2X 0.038 Cuticle thickness Y = 129.96 - 32.133X 0.029 Percentage of weight ratio Y = 127.63 - 2.8443X 0.077
Using the data of only four genotypes, M4, M9, M26, and M27 to
represent varying levels of mite susceptibility, the relationships between
the leaf morphology and the three reproductive parameters mentioned
above were found to be better than those for all the 27 genotypes (Table
7.12, 7.13, and 7.14). The coefficient of determination (r2) varied from
0.040 to 0.981, 0.004 to 0.983, and 0.001 to 0.964 for intrinsic rates of
increase, pre-reproductive period and net reproductive rates, respectively.
Nevertheless, the cuticle thickness could not be correlated with these

296
reproductive parameters because the four genotypes selected had the
same thickness of cuticle layers It was evident that trichome density was
positively correlated with the pre-reproductive period and was negatively
correlated with the intrinsic rates of increase as well as the net
reproductive rates, indicating that TSSM populations grew faster on
genotypes with sparse trichomes than on those with dense trichomes.
Other morphological characteristics showed no consistent relationships
with the three reproductive parameters.
Table 7.12. Linear regression of intrinsic rates of increase (Y) on morphological characteristics of leaves (X) for 4 hop genotypes.
Morphological characteristics
Equation (Y = a + bX)
Coefficient of 2 determination (r )
Density of ventral glands per inn? Density of trichomes per nurt2
Y = 0.29757 - 9.5179e-3X
Y = 0.27839 - 6.6973e-3X
0.291
0.795
Gland diameter Y = 0..16246 + 6.4082e-4X 0.071 Gland area Y = 0.19683 + 3.4696e-6X 0.104 Trichome basal diameter Y = 0.62344 - 6.4281e-3X 0.848 Trichome basal area Y = 0.35133 - 8.9608e-6X 0.737 Number of ventral glands and trichomes per ring
Y = 0.29294 - 4.8420e-3X 0.723
Percentine of gland area per mm
Y = 0.27275 - 2.0347e-3X 0.044
Percentage of trichome area per mm -
Y = 0.27809 - 7.1466e-3X 0.792
Combined percentage of gland ad trichome area per mm
Y = 0.29286 - 3.4272e-3X 0.453
Deniity of stomata per Y = 0.27220 - 2.3607e-5X 0.017
Length of stomata Y = 0.14199 + 8.8906e-3X 0.817 Width of stomata Y = 0.37289 - 3.0301e-2X 0.569 Leaf thickness Y = -0.14891 + 3.9670e-3X 0.858 Vein thickness Y 3.6243e-2 +0.35571X 0.981 Thickness of upper epidermis -
Y = 0.64136 - 3.5192e-2X 0.765
Thickness of lower epidermis .
Y = 0.11107 + 1.5475e-2X 0.301
Trichome length Y = 0.19016 + 1.9848e-4X 0.692 Cuticle thickness Percentage of weight ratio Y = 0.33993 - 2.9655e-3X 0.040

Table 7.13. Linear regression of pre-reproductive period (Y) on morphological characteristics of leaves (X) for 4 hop genotypes.
Morphological characteristics
• Equation (Y = a + bX)
Coefficient of determination (?)
Density of ventral glands per mrr? Density of trichomes per ITUll
2
Gland diameter Gland area Trichome basal diameter Trichome basal area Number of ventral glands and trichomes per md Percentige of gland area per mm
Y = 011.259 +9.0316e-2X
Y = 11.420 + 7.0346e-2X
Y = 12.416 - 5.2415e-3X Y = 12.156 - 2.9573e-5X Y = 7.7450 + 6.8409e-2X Y = 10.626 + 9.6745e-5X Y = 11.274 + 4.9852e-2X
Y= 11.497+ 1.8990e-2X
0.246
0.824
0.045 0.071 0.902
•0.807 •0.720
0.036
Percentage of trichome area per rrun2
Y = 11.422 + 7.5338e-2X 0.826
Combined percentage of gland aird trichome area per mm
Y = 11274 + 3.5455e-2X 0.456
D9ity of stomata per mm
Y= 11.561 + 1.2396e-4X 0.004
Length of stomata Y = 12.837 - 9.2206e-2X 0.825 Width of stomata Y = 10.367 + 033416X 0.649 Leaf thickness Y = 15.945 - 4.2026e-2X 0.904 Vein thickness Y = 13.924 - 3.6735X 0.983 Thickness of upper epidermis
Y =7.5004 + 0.37946X 0.836
Thickness of lower epidermis
Y = 13.344 - 0.18015X 0.383
Trichome length Y= 12.360 - 2.130e-3X 0.744 Cuticle thickness Percentage of weight ratio Y= 11.153+ 1.7456e-2X 0.013
297

Table 7.14. Linear regression of net reproductive periods (Y) on morphological characteristics of leaves (X) for 4 hop genotypes.
Morphological characteristics
Equation (Y = a + bX)
Coefficient of2 determination (r )
Density of ventral glands per inn? Density of trichomes per mm Gland diameter
Y = 90.547- 10.484X
Y = 56.962 - 3.3488X
Y = 100.90 - 0.36545X
0.964
0.542
0.063 Gland area Y = 68.972 - 1.2754e-3X 0.038 Trichome basal diameter Y =118.72 - 1.2673X 0.090 Trichoine basal area Y = 60.432 - 1.3228e-3X 0.044 Number of ventral glands and trichomes per mrg
Y = 68.589 - 3.0182X 0.766
Percentige of gland area per MITI
Y = 86.886 - 5.4371X 0.851
Percentage q trichome area per mm
Y = 56.478 - 3.4558X 0.505
Combined percentage of gland ad trichome area per mm
Y = 76.123 - 2.8754X 0.870
Density of stomata per mm
Y = 29.950 + 2.7074e-2X 0.061
Length of stomata Y = 35.217 + 0.8752X 0.022 Width of stomata Y = 84.00 - 9.8349X 0.163 Leaf thickness Y = -105.70 + 1.4860X 0.328 Vein thickness Y = -12.257 + 94359X 0.189 Thickness of upper epidermis
Y = 142.34 - 8.7814X 0.130
Thickness of lower epidermis
• Y = 15.416 + 3.2923X 0.037
Trichome length Y = 44.931 +4.9242e-3X 0.001 Cuticle thickness Percentage of weight ratio Y =179.90 - 4.8058X 0.287
In addition, the relationships between the leaf morphology and the
results from the screening of hop genotypes for resistance to TSSM in
Chapter 5 are presented in Table 7.15, 7.16, and 7.17. It was apparent that
298

299
relatively poor fits to the linear regression equations were noted for each
test of resistance type and the leaf morphology. The coefficient of
determination (r2) ranged from 0.001 to 0.163, 0.000 to 0.124, and 0.003 to
0.271 for a tolerance test under glasshouse conditions, a preference test
under glasshouse conditions, and an avoidance test under field
conditions, respectively.
Table 7.15. Linear regression of tolerance test under glasshouse conditions in 1990/91 (Y) on morphological characteristics of leaves (X) for 26 hop genotypes.
Morphological characteristics
Equation = a + bX)
Coefficient of determination (r
Density of ventral glands per crun2 Density of trithomes per mm2
Y = 2.4827 + 0.11249X
Y = 3.2138 - 0.17243X
0.036
0.163
Gland diameter Y = 1.4349 + 9.8959e-3X 0.040 Gland area Y = 2.1060 + 4.5504e-5X 0.047 Trichome basal diameter Y = 3.2119 - 5.6340e-3X 0.006 Trichome basal area Y = 3.1011 - 1.9237e-5X 0.012 Number of ventral glands and trichomes per nun2
Y = 32646 - 6.9319e-2X 0.043
Percentage of gland area per nurt2
Y = 2.3868 + 8.3451e-2X 0.073
Percentage of trichome area per mm2 _
Y = 3.0558 - 7.8416e-2X 0.029
Combined percentage of gland and trichome area per nurF
Y = 2.8425 + 5.1747e-3X 0.001
Density of stomata per mm2
Y = 3.4447 - 9.9284e-4X 0.020
Length of stomata Y = 1.8564 + 7.9643e-2X 0.055 Width of stomata Y = 3.0053 - 3.0943e-2X 0.001 Leaf thickness Y = -1.7547 + 4.4583e-2X 0.092 Vein thickness Y = 3.1793 - 0.47242X 0.003 Thickness of upper epidermis
Y = 3.0105 - 1.0835e-2X 0.001
Thickness of lower epidermis
Y = 1.9493 + 9.9558e-2X 0.006
Trichome length Y = 2.6787 + 6.0985e-4X 0.004 Cuticle thickness Y = -1.1093 + 15761X 0.041 Percentage of weight ratio Y = 1.2437 + 5.9015e-2X 0.020

300
Table 7.16. Linear regression of preference test under glasshouse conditions in 1990 (Y) on morphological characteristics of leaves (X) for 26 hop genotypes.
Morphological characteristics
Equation (Y =a+ bX)
Coefficient of determination (i2)
Density of ventral glands per mn?
Y = 456.87 + 116.12X 0.043
Density of trichomes per Y =924.38- 27.595X 0.005 2 mrn
Gland diameter Y -265.18 + 7.7602X 0.028 Gland area - Y = 290.57 + 3.3964e2X 0.029 Trichome basal diameter Y = 931.17- 1.0238X 0.000 Trichome basal area Y = 994.29 - 1.0892e-2X 0.004 Number of ventral glands and trichomes per mix?
Y = 762.13 +19.988X 0.004
Percentage of gland area per
Y = 324.47 + 91.743X 0.100
Percentage of l trichome area per rnm
Y = 898.29- 12.186X 0.002
Combined percentage of gland and trichome area per Inn?
Y= 576.90 +36.180X 0.035
Density of stomata per Y = 1825.4 - 1.6906X 0.067 MITI
2
Length of stomata Y = -585.75 + 112.89X 0.124 Width of stomata Y = 731.81 + 35.851X 0.002 Leaf thickness Y = -582.10 + 13.970X 0.010 Vein thickness Y = 1452.6- 931.20X 0.012 Thickness of upper epidermis
Y = 1566.6 - 59.830X 0.021
Thickness of lower epidermis
Y = -907.01 + 189.33X 0.024
Trichome length Y = 92.825 + 2.3062X 0.071 Cuticle thickness Y = 569.52 + 119.24X 0.000 Percentage of weight ratio Y = 1410.3 - 19.369X 0.002

301
Table 7.17. Linear regression of avoidance test under field conditions in 1991/92 season (Y) on morphological characteristics of leaves (X) for 24 hop genotypes.
Morphological characteristics
Equation = a + bX)
Coefficient of determination (r2 )
Density ofventral glands per mm Density of trichomes per mm2
Y = 0.13880 + 0.25066X
Y = 1.5626 - 0.28511X
0.039
0.103
Gland diameter Y = 1.8794 - 5.9161e-3X 0.003 Gland area Y = 1.4962 - 2.8270e-5X 0.004 Trichome basal diameter Y = 3.1872 - 3.7063e-2X 0.062 Trichome basal area Y = 2.1085 - 9.5223e-5X 0.063 Number of ventral glands and trichomes per mrd
Y = 1.5576 - 0.10010X 0.021
Percentige of gland area per 'TIM
Y = 059933 + 7.1849e-2X 0.011
Percentage ci trichome area per mm
Y = 1.3841 - 0.16535X 0.083
Combined percentage of gland aid trichome area per mm
Y = 1.3455 - 4.1153e-2X 0.009
Denlity of stomata per mm
Y = -0.71533 + 3.0662e-3X 0.046'
Length of stomata Y = 2.1808 - 9.1189e-2X 0.016 Width of stomata Y = 3.2160 - 0.56356X 0.084 Leaf thickness Y = -2.5138 + 3.3949e-2X 0.013 Vein thickness Y = -2.7954 + 6.1626X 0.095 Thickness of upper epidermis
Y = -2.4998 + 0.29961X 0.096
Thickness of lower epidermis
Y = 14.456 - 1.4347X 0.271
Trichome length • Y = -0.11818 + 33649e-3X 0.028 Cuticle thickness Y = 9.0930 - 3.1820X 0.038 Percentage of weight ratio Y = 40492 + 032556X 0.142
7.3.3. Morphological responses of hop leaves to mite infestations
The upper and lower surface of leaf discs infested by TSSM are
presented in Plate_ 6 and 7, respectively. A two-way analysis of variance
showed no significant differences (p > 0.05) in mean daily egg deposition
between different hop genotype (Table 7.18). It was also found that the
mite density studied had no significant effects on fecundity and the
interaction between genotype and density was not significant (p > 0.05).

eAmmlAtkW1,63E2 see0,011,266 ON
302
Mean number of eggs per female per day ranged from 9.271 on M4 to
10.133 on M26 (Fig. 7.7A). Under different densities, the mean number of
eggs was 9.238-10.167 at densities of 10-5 mites per leaf disc, respectively
(Fig. 7.7B).
Plate 6. The upper surface of leaf discs infested by TSSM at 287X.
Plate 7. The lower surface of leaf discs infested by TSSM at 163X.

Fig. 7.7. Average number of eggs on each genotype (A) under different densities (B).
12
M4
12
0
M26' Genotype
5 Density
10
303
Table 7.18. Analysis of variance of number of eggs laid per female per day on two hop genotypes under different densities.
Source: df: Sum of Squares: Mean Square: F-test: P value:
Genotype (A) 1 0.113 0.113 0.176 .6768
Density (B) 1 0.203 0.203 0.317 .5763
AB 1 - 0.003 0.003 0.005 .9454
Error 44 28.199 0.641
For external leaf scarring, there were significant differences (p <
0.05) in mean number of yellow specks between the two hop genotypes

304
studied (Table 7.19). Highly significant differences among different mite
densities were detected for the number of yellow specks (p <0.01).
However, the interaction between genotypes and densities was not
significant (p, > 0.05). Average number of yellow specks varied from
64.583 to 83.250 on M4 and M26, respectively (Fig. 7.8A). It was evident
that a significantly greater number of scarred leaf surface resulted from
each increase in mite density (Fig. 7.8B).
According to analysis of variance, significant differences in
stomatal opening stemming from the underlying tissue injury were
found between M4 and M26 (Table 7.20). However, the average number
of open stomata did not vary significantly (p > 0.05) among different mite
densities. Fig. 7.9A shows that the average number of open stomata was
approximately three times greater on leaf discs of M4 than on those of
M26. Even though mean stomatal opening decreased with an increase in
mite density (Fig. 7.9B), none of these differences were significant (p >
0.05), indicating that mite density is not- an important factor in
determining stomata! opening.
Two types of stomata! size studied include stomata' pore length
and stomatal pore width. There were no significant differences in
stomata! pore length between the genotypes selected (Table 7.21). It was
also found that the variation in stomata! pore length among different
mite densities was not significant. The average length of stomata ranged
from 9.233 to 10.749 gm on M4 and M26, respectively (Fig. 7.10A). Mean
stomata! pore lengths was 10.618, 10.341, and 8.964 at densities of 0, 5, and
10 mites per leaf disc, respectively. (Fig. 7.10B). For stomata' pore width,
the variation between different genotypes or densities was not significant
(Table 7.22). In addition, average widths of stomata for each genotype or
density are shown in Fig. 7.11.

120
0 M4 M27
Table 7.19. Analysis of variance of number of yellow specks on hop leaves between different genotypes under various dPnsities.
Source: df: Sum of Squares: Mean Square: F-test P value: Genotype (A) 1 2090.67 2090.67 4.542 .0471
Density (B) 2 87827.08 43913.54 95.412 .0001
AB 2 1425.58 712.79 1.549 .2395
Error 18 8284.50 460.25
Fig. 7.8. Average number of yellow specks on hop leaves for each genotype (A) under different densities (B).
Genotype
0
5
10 Density
305
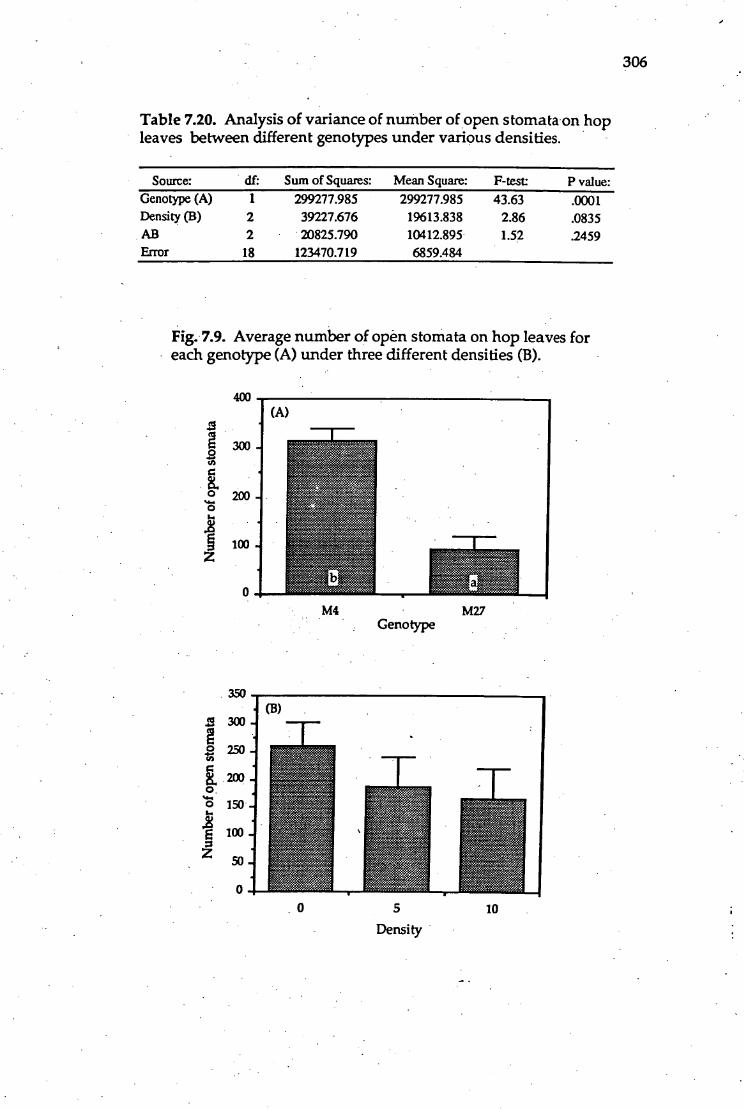
Table 7.20. Analysis of variance of number of open stomata on hop leaves between different genotypes under various densities.
Source: df: Sum of Squares: Mean Square: F-test: P value: Genotype (A) 1 299277.985 299277.985 43.63 .0001 Density (B) 2 39227.676 19613.838 2.86 .0835 AB 2 20825.790 10412.895 1.52 .2459 Error 18 123470.719 6859.484
Fig. 7.9. Average number of open stomata on hop leaves for each genotype (A) under three different densities (B).
400
g 300
2co
1C0
M4
M27 Genotype
350
5 300
2,50
200. o. 0 150
5 100
50
0
5
10
Density
306

Stomatal le ngth (micron.)
12
10
0
2
6
4
8
12
2 10
Table 7.21. Analysis of variance of length of stomata on hop leaves between different genotypes under various densities.
Source: dl: Sum of Squares: Mean Square: F-test: P value:
Genotype (A) 1 13.588 13.588 3.787 .0684
Density (B) 2 12.941 6.471 1.803 .1949
AB 2 4.362 2.181 0.608 .5559 Error 17 60.995 3.588
Fig. 7.10. Average length of stomata on hop leaves for each genotype (A) under different densities (B).
307
M4
M27 Genotype
0
5
10
Density

0
Table 7.22. Analysis of variance of width of stomata on hop leaves between different genotypes under various densities.
Source: df: Sum of Squares: Mean Square: F-test: P value: Genotype (A) 1 0.058 0.058 0.230 .6379 Density (B) 2 1.752 0.876 3.450 .0553 AB 2 2.153 1.076 4.239 .0321 Error 17 4.317 0.254
Fig. 7.11. Average width of stomata on hop leaves for each genotype (A) under three different densities (B).
308
3
.g 2
3
•
M4
M27 Genotype
0
5
10 Density

309
7.4. DISCUSSION
7.4.1. Leaf morphology
The present study has shown that tere is morphological variation
in external and internal characteristics of hop leaves among different
genotypes. Significant differences were found in ventral gland size,
trichome density, trichome size, length of trichomes, stomatal density,
stomatal size and moisture content. Furthermore, it was apparent that
some morphological characteristics of the hop leaves collected from the
same genotype varied significantly according to leaf age and growing
conditions. These were densities of ventral glands and trichomes, sizes of
ventral glands and trichomes, trichome length, stomatal density,
stomatal size, leaf thickness, major vein thickness, thicknesses of upper
and lower epidermis and cuticle thickness.
According to Burgess (1964), ventral glands and trichomes have
been reported to be more dense on some hop cultivars than others. A
subsequent investigation by Peters and Ben)/ (1980b), working with
American and European hops, also confirmed this phenomenon.
Generally, lupulin glands containing resins and essential oils are
found on the underside of hop leaves. These ventral glands vary from
120 to 190 microns in diameter (Brooks and Likens, 1962). This is in
agreement with the results from the present study which show that the
average diameters of ventral glands for the 27 genotypes used ranged
from 128.72 to 170.74 microns.
In addition to the ventral glands, hop leaves are covered with
nonglandular trichomes. These trichomes usually grow on the leaf
surface and/or leaf veins. The venation of the leaves is palmate and the
major veins protrude from the underside of the leaves. For anatomical
structures, the hop leaves have a thin layer of mesophyll with a palisade
parenchyma of only one stratum consisting of dilated cells with a

310
thickness to length ratio of 1: 6. The upper epidermis is made up of large
rectangular cells covered with a thin cuticle. The palisade layer consists
of the cells transferring the assimilates and below it, the layers of spongy
parenchyma have globular cells and large intercellular spaces. The lower
epidermis contains small cells covered with thin cuticle penetrated in
places by cellular pores (stomata). There are approximately 400 stomata
per mm2 on the underside of hop leaves providing for very intensive
metabolism (Rybacek, 1991). In the present study, it was found that the
average number of stomata for the genotypes used varied from 426.37 to
718.74 per mm2. This variation in stomatal density may have resulted
from differences in leaf surface areas among the hop genotypes as
mentioned in Chapter 4.
The results from the present study also show differences in leaves
collected from different sources according to leaf age and growing
conditions. When comparing the morphological characteristics of
glasshouse versus field hop leaves, it was found that the leaves collected
from the glasshouse had more densely occurring ventral trichomes and
glands than the leaves from the field, while the cell-layer thicknesses of
the glasshouse leaves were less than those of the field leaves. For the
comparison of morphological characteristics between young and old
leaves, the numbers of ventral trichomes and glands per unit area were
found more sparsely on old leaves than on young leaves, while the
thicknesses of cell layer with the exception of epidermal cells were less in
the young leaves than in the old ones.
, In addition, it was apparent that the susceptibility of hop plants to
TSSM was lowest on genotypes with the highest density of ventral
trichomes and with the trichomes of the shortest average length, whereas
it was highest on the genotypes with greatest length and the lowest
density of trichomes, i.e., M4 < M9 < M26 < M27: However, other

311
genotypes showed intermediate situation. Hoxie et al. (1975), working
with a cereal leaf beetle, Ote!ma ?nelanopus (L.), on several wheat lines,
demonstrated the relationship betweel.: length and density of wheat
trichomes relative to the survival of newly hatched cereal leaf beetle
larvae and relative to oviposition preference. Subsequently, Campbell et
al. (1984) also found that trichome length and density within species of
wheatgrasses (Agropyron sp.) were negatively correlated with feeding
behaviour of the early instars of black grass bugs, Labops hesperius Uhler.
Esau (1965) suggests that trichomes are unicellular or pluricellular
outgrowths from the epidermis of plant organs. In general, the trichome
cover of individual plants varies in quantity (trichome size and density)
and quality (trichome type) from organ to organ, and from tissue to
tissue. A dense covering commonly develops on young organs. Since
the organs expand through growth, the original trichomes are spaced
further and further apart, and if no more new ones are produced, a sparse
trichome cover of a plant surface will happen at maturity (Johnson, 1975).
Khan et al. (1986) also stated that the number of trichomes per unit
area on the youngest leaves is higher than on their fully expanded older
counterpart leaves because of their smaller size. Pillemer and Tingey
• (1976), working with broad beans Vicia faba L., found that mature leaves
on the lower nodes had fewer hooked trichomes than mature leaves on
the upper nodes and that this difference was consistent with increased
leafhopper capture and capture mortality on the upper nodes. In their
study, trichome density and capture mortality were found to be at a
maximum on the unexpanded terminal leaves. This reveals the greatest
pest protection for the tender and succulent plant tissues.
For hop plants, the young leaves were usually not attacked by
TSSM (Cao, 1989). This may be due to the effect of trichome density as
mentioned above. Johnson (1975) suggests that comparatively little

312
damage by insect pests takes place on young leaves still covered with
pubescence.
7 4.2. Leaf morphological characteristics and hop susceptibility to
TSSM Numerous attempts have been made to establish a statistical
correlation between the morphological characteristics of plants and
resistance to their pests. It has long been assumed that several structural
features of plant surfaces function to give the plant resistance to the attack
of the pests (Gilbert, 1971). The features commonly found among
resistant crop plants include trichomes and leaf toughness (Norris and
•Kogan, 1980). Levin (1973) and Johnson (1975) discussed the ecological functions
of trichomes as defence against plant pests. Dent (1991) suggested that
when pubescence is present the mechanism of resistance may depend on
one or more of four • characteristics of the trichomes, their density,
erectness, length, and shape. In addition soine trichomes also possess
glands, the exudates of which confer resistance against some pests.
Several investigators have identified significant relationships
linking trichome density to pest resistance of crop plants. Gallun et al.
(1973) found that pubescent varieties of wheat having more than 71
•trichOmes/mm2 were less used for egg laying by the cereal leaf beetle
Oulema melanopus L. than the plants with fewer trichomes.
Wannamaker (1957) and Stephens (1959) reported that bud pubescence in
cottons were correlated with both reduced oviposition and feeding
preference in the boll weevil, Anthonomus grandis Boheman. Khan et
al. (1986) demonstrated a negative correlation between trichome density
on soybean leaves and the feeding and oviposition of cabbage looper,
Trichoplusia ni.

313
• The results from the present study show that there was a trend
towards a significant positive correlation between pre-reproductive
periods and trichome density. This is in agreement with the finding by
Peters and Berry (1980b) that developmental time of immature mites was
slowed on hop leaves with a high density of trichomes. There have been
many reports which indicated that trichome differences among varieties
were related to TSSM resistance of crop plants. Glandular hairs have
been associated with resistance in tobacco (Patterson et al., 1974) and
tomatoes (Rodriguez et al., 1972), and foliar pubescence has been related
to resistance in strawberries (Kishaba et al., 1972). Good and Snyder
(1988), working with Lycopersicon hirsutum Humb. & Bonpl., indicated
that Type IV trichorne density was inversely correlated with TSSM
survival.
Leaf toughness reportedly contributed to interference with feeding
and oviposition mechanisms of plant pests (Norris and Kogan, 1980).
There is substantial evidence indicating that the leaf toughness is an
important antiherbivore trait (Coley, 1983; Larsson and Ohmart, 1988).
However, the TSSM susceptibility of hop paints in the present study was
unrelated to the leaf toughness expressed by cuticle thickness and
thicknesses of epidermal cell layers which were similar for all genotypes
used.
With regards to other characteristics of leaf morphology, Schuster
et al. (1972) found that the presence of glands on cotton cultivars was
associated with TSSM resistance. Nevertheless, the results from the
present study showed inconsistent relationships between TSSM
susceptibility of the hop genotypes used and ventral glands as well as
moisture content. For the major vein thickness, there were a positive
correlation with intrinsic rates of increase and a negative correlation with

314
pre-reproductive periods, indicating that hop genotypes with large leaf
veins may enhance the development of TSSM.
7.4.3. Morphological r,!sponses of hop leaves to mite infestations
This study has shown that there is genetic variation in the
morphological response of hop leaves to mites infestations and that this
variation is related to leaf area scarred and stomatal opening. It was
found that the average number of yellow specks was significantly greater
on M27 than on M4, whereas the the mean number of open stomata was
significantly less on M27 than on M4. In addition, there were significant
differences in numbers of yellow specks between different mite densities.
These data were consistent with Sances et al. (1979b) who indicated that
percent leaflet area scarred by mite feeding was correlated with increasing
mite infestation levels and that stomatal closure was an important host-
plant response associated with TSSM infestation on strawberries.
Various densities of spider mites have been shown to strongly
affect basic physiological processes of several plants (Andrews and LePre',
1979; Hall and Ferre, 1975). Sances et al. (1979b) also showed that mite
feeding injury was mechanical and that no toxins were associated with its
feeding.
Since leaves of mature crop plants have no meristematic tissues
(Milthorpe, 1956), the possibility of leaf recovery from spider mite feeding
is unlikely. Consequently, reductions in functional photosynthetic area
caused by spider mite feeding would be permanent and could only be
compensated for by the production of new foliage at the plant level. Such
compensation may occur at low infestation levels, but when high spider
mite populations are present, the reduction in photosynthetic assimilates,
steming initially from stomatal closure and subsequently from internal
injury, would ultimately have a detrimental effect on yield (Sances et al.,
1979b).

315
CHAPTER 8 EFFECTS OF HOP-CANOPY
MICROENVIRON MEN TS ON MITE POPULATION
DYNAMICS
8.1. INTRODUCTION
As shown above, rearing conditions influenced the population
dynamics of TSSM. These conditions can be described by environmental
factors, including temperature, relative humidity, light intensity and
plant variables. The effect of temperature and relative humidity are
clearly important; however light intensity and plant variables appear to
have less effect on TSSM population growth rates. Additionally,
increases in numbers of TSSM on field hops have been noted to be
positively associated with hot and dry weather (Neve, 1991).
Thus, it is reasonable to hypothesise that fluctuations in canopy
microenvironmental factors may be used as a cultural method for
cOntrolling TSSM populations infesting hap plants. Nevertheless,
studies designed to investigate sensitivities of the TSSM and its predatory
mite under different microenvironmental conditions found in hop
plants are lacking. For this reason, the following experiments were
carried out.
8.2. MATERIALS AND METHODS
8.2.1. Under field conditions
Field experiments were carried out in a hop yard at Bushy Park
from November 18, 1992 to March 3, 1993. Two hop genotypes, M25 and
M26, were selected because these genotypes were grown in the same area
and because there was a significant difference in TSSM susceptibility
between the two genotypes as mentioned in Chapter 4. The experiment
was established in a single-hill plot replicated six times for each hop

316
genotype. Three strings were tied down at each hill. The vines of each
hop plant were trained to one of the following foliage densities: 1, 3, and 5
vines per steng. Consequently, the modification of foliage canopies
provided contrasting microenvironments for naturally occurring TSSM.
This experiment was a completely randomized factorial design with hop
genotypes (2 levels) and foliage densities (3 levels) as the two main
treatment factors.
After all the hop plants had been found to be infested with TSSM,
the predatory mites (Phytoseiulus persimilis ), imported from Biocontrol
Ltd. in Queensland, were released onto hop plants at an infestation ratio
of approximately 100 mites to two hills on January 27, 1993.
Subsequently, some miticides (clofentezine and propargite) were applied
in this hop yard during early February.
By using an examination level of one hop leaf per sampling unit,
the assessment of mite infestation levels in each treatment was
performed on the following dates:
On 30 December . 1992, hop leaves at a height of 1.8 m above the
ground were examined very closely with a 5 cm hand lens for adult
females;
On 13 January 1993, the 1.8 m hop leaves were collected randomly
and examined to determine the number of all mite stages under a
binocular microscope (10X);
On 27 January 1993, the basal region of 1.8 m hop leaves were
pressed on adhesive tape (1.2 x 3 cm) attached to pieces of sponge on
microscope slides and the number of mites on the adhesive tape was
counted under a binocular microscope (10X);
On 10 February 1993, both the adhesive tape method and the
method employed to examine the samples on 13 January 1993 were used
on the leaves collected from M26 at five vines per string in order to relate ,

317
the numbers of mites obtained from these two techniques, while the
leaves from the other treatments were only examined using the latter
technique; On 17 February 1993, the hop leaves collected not only at 1.8 m but
also at 3.6 m were examined to determine the number of mites at all
stages under a binocular microscope (10X); On 24 February and 3 March 1993, the examination of hop leaves
was similar to that on 17 February 1993.
For monitoring the growth of hop plants at each foliage density,
measurements of plant height were taken at 14-day intervals. Leaf
surface areas were also determined by using a linear regression model
that estimates area from measures of leaf length and width at the widest
point: leaf area (an.2) = 7.903 + 0.67148 (width x length) r2 = 0.957; n=93.
Additionally, temperatures and relative humidities of plant canopy were
measured with a handheld humidity and temperature meter (Vaisala
HM 34, Vaisala Oy, Helsinki, Finland). The humidity and temperature
measurements were made between 1200 and 1400 hours on March 3, 1993.
After harvesting, cone production as well as percentage alpha acid in
lupulin glands on the cones were also measured in order to evaluate
quality and yield of hops obtained from each treatment.
8.2.2. Under glasshouse conditions
The glasshouse test was conducted in February and March, 1993 at
temperature regime of 20-25°C with natural lighting conditions. Potted
hop plants of four genotypes were placed on a glasshouse bench. The
genotypes used were M7, M16, M17, and M24 and there was only one
plant per genotype. The vines of these genotypes were trained to 1 and 3
vines per string. Each plant was infested with teneral female mites, taken
from a culture maintained on dwarf beans in the growth chamber
mentioned in Chapter 5, by using an infestation level of 6 mites per one

318
vine. This test was a completely randomized factorial design with hop
genotypes (4 levels) and foliage densities (2 levels) as the two main
treatment factors.
Hop leaves on the vines were inspected four and five weeks after
inoculation. Three leaf pairs, one pair from the middle region and the
others from the top, were removed from each string and the total
number of mites at all mite stages on each leaf was counted under a
binocular microscope (10X). Additionally, the leaves collected from M16
at one vine per string at the last inspection were also examined using the
adhesive tape method as mentioned earlier for evaluating the
relationship between the total mites on the leaf and those on the
adhesive tape.
The temperatures and relative humidities of plant canopy were
measured with the handheld humidity and temperature meter (Vaisala
HM 34). The humidity and temperature measurements were made on
March 3, 1993. In addition, the light intensity penetrating plant canopy
was measured with a photometer (LI-185, Lambda Instruments) and the
measurement was made on March 12, 1993.
8.2.3. Data analyses
Factorial analyses of variance provided statistical tests for
differences between treatments. The calculations were completed using
Macintosh software StatView TM SE+. Simple linear regressions were
performed using the curve fit procedure of the Cricketgraph computer
program. In addition, data transformations were employed when
necessary.
8.3_ RESULTS
8.3.1. Under field conditions

1.6
1.4 1.2 1.0 0.8
0.6
0.4 0.2 0.0
1.6 1.4
1.2
1.0 0.8
0.6
0.4 0.2 0.0
319
Fig. 1 depicts graphically the average number of TSSM adult
females on 1.8-m hop leaves of M25 and M26 at the various foliage
densities on the first sampling date (30 December). The mite populations
varied significantly between these two hop genotypes (p <0.05), whereas
there were no significant differences among foliage densities (p > 0.05). It
was apparent that M26 at three vines per string had the highest
populations of TSSM in early the growing season and that M25 at either
one or five vines per string tended to have low population numbers.
Fig. 8.1. Average numbers of adult females per leaf on two genotypes of hops at three different foliage densities on December 30, 1992.

320
Table 8.1 indicates the average numbers of all mite stages per leaf
on the two genotypes of hops at the three foliage densities on the second
sampling date (13 January). Highly significant differences in mite
densities prior to the release of predatory mites and the application of
miticides were detected between these hop genotypes as well as among
different foliage densities studied (p < 0.01). The total numbers of mites
per leaf on M25 were lower than those on M26 at all foliage densities. It
was also found that the average numbers of mites per leaf on M26 were
reduced as the number of vines per string increased.
Table 8.1. Average numbers of total mites per leaf on two genotypes of hops at three vine densities on January 13, 1993.
Genotype (p=0.0001")
Vine density (p=0.0076")
Mean per leaf for each
1 3 5 genotype •
M25 4.333 19.333 . 6.833 10.167
M26 166.333 87.167 31.333 94.944
Mean per leaf for each vine density
85.333 53.250 19.083
(PLSD = 58.348)
•The mite densities of individual stages at each foliage density, the
mean numbers of adult females, adult males, immatures and eggs per
leaf are illustrated in Fig. 8.2, 8.3, 8.4 and 8.5, respectively. Statistically
significant differences in TSSM numbers per leaf were detected between
the two genotypes of hops for all developmental stages of the mites,
while the variation in mite densities among different hop vines per
string was significant only in terms of adult females (p <0.05).

12
10
8 8
6
0 M26
„_Ce/101,,,_ m25 'PV.Oges
04,4t,
• iZ
12
10
321
Fig. 8.2. Average numbers of adult females per leaf on two genotypes of hops at three different foliage densities on January 13, 1992.
Fig. 8.3. Average numbers of adult males per leaf on two genotypes of hops at three different foliage densities on January 13, 1992.

Fig. 8.4. Average numbers of immatures per leaf on two genotypes of hops at three different foliage densities on January 13, 1992.
Fig. 8.5. Average numbers of eggs per leaf on two genotypes of hops at three different foliage densities on January 13, 1992.
322
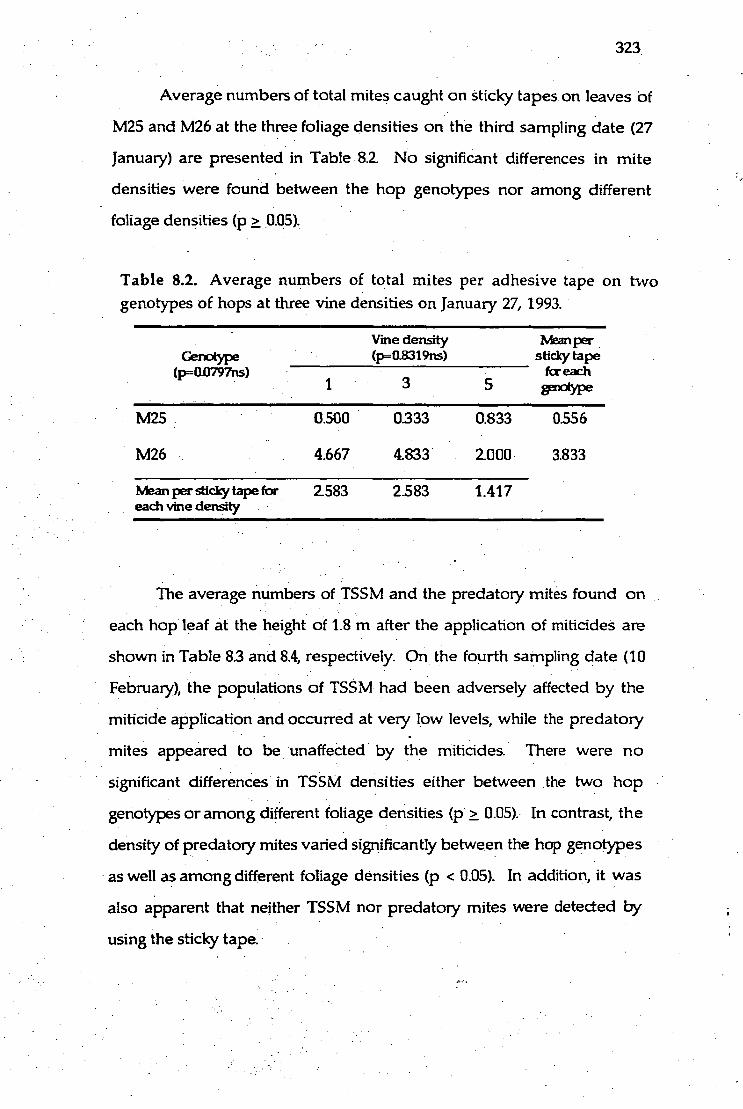
323
Average numbers of total mites caught on sticky tapes on leaves Of
M25 and M26 at the three foliage densities on the third sampling date (27
January) are presented in Table 8.2. No significant differences in mite
densities were found between the hop genotypes nor among different
foliage densities (p > 0.05).
Table 8.2. Average numbers of total mites per adhesive tape on two genotypes of hops at three vine densities on January 27, 1993.
Cnotype Vine density (/118319ns)
Mean sticky tape
(1011797ns) for each 1 3 5 931citYPe
. M25. 0.500 0333 0.833 0.556
M26 4.667 1833 2.000 3.833
Mean per sticky tape for each vine density
2.583 2583 1.417
The average numbers of TSSM and the predatory mites found on
each hop leaf at the height of 1.8 rn after the application of miticides are
shown in Table 8.3 and 8.4, respectively. On the fourth sampling date (10
February), the populations of TSSM had been adversely affected by the
miticide application and occurred at very low levels, while the predatory
mites appeared to be unaffected by the miticides. There were no
significant differences in TSSM densities either between the two hop
genotypes or among different foliage densities (p > 0.05). In contrast, the
density of predatory mites varied significantly between the hop genotypes
as well as among different foliage densities (p <0.05). In addition, it was
also apparent that neither TSSM nor predatory mites were detected by
using the sticky tape.

324
Table 8.3. Average numbers of total mites per leaf on two genotypes of hops at three vine densities on February 10, 1993.
Genotype Viiie density (p=03648ns) Mean per
leaf for each (p=0.3533ns)
1 3 genotype
M25 3.500 1.000 0.167 1.556
M26 3.500 3.333 1.833 2.889
Mean per leaf for each vine density
3.500 2.167 1.000
Table 8.4. Average numbers of predatory mites per leaf on two genotypes of hops at three vine densities on February 10, 1993.
Genotype (p=0.0230*)
Vine density (p=0.0067**) Mean per
leaf for each - 3 5 genotype
M25 2.667 0.500 0.333 1.167
M26 5.833 4.000 0.333 3.389
Mean per leaf for each vine density 4.250 2.250 0.333 (PLSD = 2.501)
Means for the mite numbers found on the leaves at theheight of
1.8 m and 3.6 m on the fifth sampling date (17 February) are given in
Table 8.5 for TSSM and Table 8.6 for the predatory mites. One week after
the previous inspection, TSSM populations had increased. Meanwhile,
• the numbers of predatory mites still • remained fairly static and only
significant differences (p < 0.05) in average numbers of predatory mites
between the genotypes were found (Table 8.6).

325
Table 8.5. Average numbers of total mites per leaf on two genotypes of hops at three vine densities on February 17, 1993.
Genotype Vine density (p=0.3538ns) Mean per
leaf for each (p=0.2739ns)
1 3 5 genotype
M25 5.667 9.500 4.000 6.389
M26 4.667 4.750 3.000 4.139
Mean per leaf for each vine density
5.167 7.125 3.500
Table 8.6. Average numbers of predatory mites per leaf on two genotypes of hops at three vine densities on February 17, 1993.
Genotype Vine density (p.1317ns)
Mean per leaf for each
(p=0.0060**) 1 3 5 genotype
M25 2.167 1.333 0.833 1.444
M26 3.917 2.417 2.750 3.028
Mean per leaf for each vine density
3.042 1.875 1.792
The comparison of TSSM densities between different foliage
heights on M25 and M26 is shown in Fig. 8.6. The average numbers of
mites varied from 2.389 mites per leaf on M26 at the height of 1.8 m to
7.722 mites per leaf on M25 at the height of 3.6 m. With regard to the
foliage densities, the density of TSSM ranged from 3.0 to 10.417 mites per
leaf on the 1.8-m leaves at five vines per string and the 3.6-m leaves at
three vines per string, respectively (Fig. 8.7). For the predatory mites, the
mean densities at different foliage heights is illustrated in Fig. 8.8 for the
two hop genotypes and Fig. 8.9 for the various foliage densities. The
highest average number of predatory mites was detected on the 3.6-m
leaves of M26 at one hop vine per string.

Fig. 8.6. Average numbers of total mites per leaf on two genotypes of hops at two height intervals on February 17, 1993.
Fig. 8.7. Average numbers of total mites per leaf at three height intervals of three vine densities on February 17, 1993.
326

4.0
3.5
3.
2.5
2.0
1.5
1.0
0.5
0.0
0.5
0.0
3.5
3.
2.5 0
1 2.0
I
3.5
3.0
2.5
2.0
1.5
1.0
360 ..42N5 te%
180 01" ‘11)
IC‘e
0.5
0.0
327
Fig. 8.8. Average numbers of predatory mites per leaf on two genotypes of hops at two height intervals on February 17, 1993.
Fig. 8.9. Average numbers of predatory mites per leaf at three height intervals of three vine densities on February 17, 1993.

328
Even though the variation in average numbers of TSSM per leaf
among different foliage densities was significant (p < 0.05) on the sixth
sampling,date (24 February), the variation in TSSM densities between the
two hop genotypes was not significant (p > 0.05; Table 8.7). Significantly
more mites were found on leaves at one vine per string than those at
three and five vines per string. When the numbers of predatory mites
per leaf were averaged over both hop genotypes and foliage densities,
significant differences were detected (p <0.05; Table 8.8). In addition, the
average numbers of TSSM and predatory mites on leaves at each height
interval for both hop genotypes and foliage densities are shown in Fig.
8.10 and 8.11, respectively.
Table 8.7. Average numbers of total mites per leaf on two genotypes of hops at three vine densities on February 24, 1993.
Genotype (p=0.7775ns)
Vine density (p=0.0184*) Mean per
leaf for each 1 3 5 genotype
M25 44.583 17.750 23.000 28.444
M26 38.167 27.833 24.333 30.111
Mean per leaf for each vine density * 41.375 22.792 23.667 (PLSD = 14.188)
Table 8.8. Average numbers of predatory mites per leaf on two genotypes of hops at three vine densities on February 24, 1993.
Genotype (p=0.0075**)
Vine density (p=0.0047**)
Mean per leaf for each
1 3 5 •
genotype
M25 3.917 1.333 1.750 2.333
M26 7.833 4.000 2.917 4.917
Mean per leaf for each vine density
5.875 2.667 2.333

45 40 35 30 25 20 15 10
(A)
40 35
30
25
20 15
10
5
329
Fig. 8.10. Average numbers of total mites per leaf on the leaves at two height intervals for the two hop genotypes (A) and the three foliage densities (B) on February 24, 1993.

Fig. 8.11. Average numbers of predatory mites per leaf on the •
leaves at two height intervals for the two hop genotypes (A) and the three foliage densities (B) on February 24, 1993.
(A)
(B)
330

331
On the final sampling date (3 March), significant differences in
average numbers of TSSM per leaf were detected again among the foliage
densities used in these studies (p < 0.05), whereas the mite populations
between the two hop genotypes did not differ significantly (p > 0.05; Table
8.9). For the predatory mite numbers per leaf, means differed
significantly between the hop genotypes as well as among different foliage
densities (p < 0.05; Table 8.10). Significantly more predatory mites were
found on M26 than on M25 when averaged over hop genotypes.
Meanwhile, the average number of predatory mites over the three foliage
densities showed that hop plants at three and five vines per string had
significantly fewer predatory mites than did those at one vine per string,
even though they were not significantly different from each other.
Table 8.9. Average numbers of total mites per leaf on two genotypes of hops at three vine densities on March 3, 1993.
Genotype (p=03078ns)
Vine density (p.0318''') Mean per
leaf for each • 1 3 5 genotype
M25 40.750 19.917 21.750 27.472
M26 26.667 15.667 25.000 22.444
Mean per leaf for each vine density
33.708 17.792 23.375 (PLSD = 11.967)

Table 8.10. Average numbers of predatory mites per leaf on two genotypes of hops at three vine densities on March 3, 1993.
Genotype (p=0.0176*)
• Vine density (p).0065**)
Mean per leaf for each
1 3 5 genotype
M25 5.250 3.083 2.833 3.722
M26 12.750 5.750 3.667 7.389
Mean per leaf for each vine density
9.000 4.417 3.250
(PLSD = 3.847)
Furthermore, average numbers of TSSM and predatory mites per
leaf at each height interval before harvesting are presented in Fig. 8.12
and 8.13, respectively. The populations of TSSM found on the 3.6-m
leaves of both M25 and M26 were higher than those on the 1.8-m leaves
(Fig. 8.12A). In terms of foliage densities, the numbers of TSSM at all
stages varied from 14.25 to 43.167 individuals per leaf with 3.6-m leaves at
one vine per string having the highest value (Fig. 8.12B). For the
• predatory mites, population densities at the height of 1.8 m ranged from
3.278 on M25 to 8.278 on M26, while those at the height of 3.6 m varied
from 4.167 to 6.5 individuals per leaf on M25 and M26, respectively. (Fig.
13A). It was also found that more than 50% of total predatory mite
populations at both height intervals were detected on the hop plants with
one vine per string (Fig. 13B).
332

(D)
45 40 35 30 25 20 15 10 5
Fig. 8.12. Average numbers of total mites per leaf on the leaves at two height intervals for the two hop genotypes (A) and the three foliage densities (B) on March 3, 1993. (A)
333

Fig. 8.13. Average numbers of predatory mites per leaf on the leaves at two height intervals for the two hop genotypes (A) and the three foliage densities (B) on March 3, 1993. (A)
(B)
334

200
180
160
14
7; 120
100
flt 80
60
20
0
oo 180
60
140
120
100
80
60
40
20
0
M25
6 Get43/1.4 3
335
Means for the leaf surface areas of M25 and M26 on each sampling
occasion are shown in Fig. 8.14. It was apparent that the leaves of M25
had greater surface areas than those of M26. In addition, the surface areas
of leaves_ collected from hop plants at different foliage densities are
presented in Fig. 8.15. From this figure, it can be seen that the leaves
from three hop vines per string were larger than those from one and five
hop vines per string.
Fig. 8.14. Leaf surface areas of M25 and M26.

1 4 3 Time
5
250
200
71 150
1 100
lvine per string M 3vines per string M 5vines per string
50
0
336
Fig. 8.15. Leaf surface areas of hop plants at different vine densities.
The average numbers of TSSM per cm 2 on M25 and M26 at each
foliage density on 13 January, 10, 17, 24 February and 3 March 1993 are
presented in Table 8.11, 8.12, 8.13, 8.14 and 8.15, respectively. Even though
the above-mentioned density of mite populations was expressed as
average numbers of mites per cm2, similar results were also obtained.
Table 8.11. Average numbers of total mites per cm2 on two genotypes of hops at three vine densities on January 13, 1993.
Genotype Vine density (p=0.01979
Mean per an2for each
(p =0.0001") 1 3 5 genotype
M25 0.026 0.080 0.045 0.050
M26 1.513 0.672 0.240 0.808
Mean per an2for each vine density
0.769 0.376 0.143
(PLSD = 0.576)

337
Table 8.12. Average numbers of total mites per cm2 on two genotypes of hops at three vine densities on February 10, 1993.
Genotype
Vine density (p.4209ns) Mean per
cm2for each (p=03468ns)
1 3 5 genotype
M25 0.022 0.005 0.001 0.009
M26 0.021 0.019 0.013 0.018
Mean per an2for each vine density
0.021 0.012 0.007
Table 8.13. Average numbers of total mites per cm2on two genotypes of hops at three vine densities on February 17, 1993.
Genotype
Vine density* (p :11.28,34ns)
Mean per cm2for eac.h
(p=0..3871ns) 1 3 5 genotype
M25 0.035 0.038 0.017 0.030
M26 0.023 0.028 0.018 0.023
Mean per an2for each vine density
0.029 0.033 0.018

Table 8.14. Average numbers of total mites per cm2on two genotypes of hops at three vine densities on February 24, 1993.
Genotype (p=0.1587ns)
Vine density (p=0.0183*) Mean per
an2 for each 1 3 5 genotype
M25 0.213 0.077 0.122 0.137
M26 0.248 0.163 0.145 0.185
Mean per cngfor each vine density
0.230 0.120 0.133
(PLSD = 0.082)
Table 8.15. Average numbers of total mites per cm2 on two genotypes of hops at three vine densities on March 3, 1993.
Genotype (p=0.9953ns)
Vine density (p=0.0497*) Mean per
an2for each 1 3 5 genotype
M25 0.197 0.099 0.104 0.133
M26 0.152 0.097 0.151 0.134
Mean per an2 for each vine density
0.175 0.098 0.128
(PLSD = 0.061)
338

339
Average heights of the two hop genotypes at the various foliage
densities during the growing season are shown in Table 8.16. There were
no significant differences (p > 0.05) in hop heights among different „- treatments on the first occasion of measurement (18 November).
Nevertheless, the variation in hop heights among the hop genotypes at
different foliage densities was significant (p < 0.05) front the second
occasion of measurement (12 December) until hop plants reached the top
of trellis. It was found that M26 at five vines per string had the fastest
growth rate, whereas M25 at one vine per string had the slowest.
Table 8.16. Hop plant growth of M25 and M26 at different foliage densities.
Genotype (Vine density)
Average height of hop plants (cm) (S.E.)
18/11192 2/12/92 16/12/92 30/12/92 13/1193
M25 115.33 178.00a 283.33a 470.00a 500.00 (1 vine) (6.163) (8.489) (10.220) (12.179) (0.000)
M25 128.33 204.33abc 336.67ab 496.67bc 500.00 (3 vines) (9.157) (9.229) (9.888) (3.333) (0.000)
M25 122.83 191.83ab 293.33a 481.67ab 500.00 (5 vines) (3.24) (7.097) (14.063) (7.601) (0.000)
M26 132.33 229.00abc 385.00bc 496.67bc 500.00 (1 vine) (10.055) (23.409) (18.449) (3.333) (0.000)
M26 148.00 246.00bc 395.00bc 500.00c 500.00 (3 vines) (16.155) (31.394) (37.216) (0.000) (0.000)
M26 148.33 256.83c 413.33c 500.00c 500.00 (5 vines) (9.701) (23.267) (25.777) (0.000) (0.000)
p-value 0.1375ns 0.0476* 0.0031** 0.0070**
For each treatment, means within a column followed by same letter not significantly different (p<0.05).

340
A comparison of plant growth between M25 and M26 is illustrated
in Fig. 8.16. Even though M26 grew faster than M25, the beginning of the
flowering period of M26 was found to be slower than that of M25.
Fig. 8.16. Plant growth of M25 and M26 at Bushy Park during the 1992/93 growing season.
Mean relative humidity and temperature within plant canopy of
the two hop genotypes at the three vine densities on March 3, 1993 are
presented in Table 8.17 and 8.18, respectively. Both relative humidity and
temperature within plant canopy among hop genotypes at different
foliage densities did not vary significantly (p > 0.05). This may be due to
cool, cloudy conditions which occurred on the day when temperature and
relative humidity were measured

Table 8.17. Average relative humidity (%) within plant canopy of two genotypes of hops at three vine densities on March 3, 1993.
Genotype (p=0.1241ns)
Vine density (p=0.9138ns)
Overall mean for each genotype 1 3 5
M25
M26
52.389
53.344
52.706
52.861
52.244
53.061
52.446
53.089
Overall mean for each vine density
52.867 52.783 52.653
Table 8.18. Average temperature (°C) within plant canopy of two genotypes of hops at three vine densities on March 3, 1993.
Genotype (p.658Ons)
Vine density Overall (p=0.8305ns) mean for
each 3 genotype
M25 15.356 15.300 15.306 15.320
M26 15.417 15.289 15.428 15.378
Overall mean for each vine density
15.386 15.294 15.367
341

•
•342
After harvesting, statistical analyses of the data obtained from
weighing dried hop cones indicated that there were highly significant
differences (p < 0.01) between the two hop genotypes as well as among the
foliage densities studied for both average dry weights of hop cones per
string and those per vine (Table 8.19 and 8.20, respectively), whereas
average cone weights did not differ significantly (p > 0.05; Table 8.21). It
was apparent that M25 had significantly greater dry weights of hop cones
per string than did M26. When yield per string was converted to yield per
vine, the same differences between these hop genotypes were also
detected. In addition, the average dry weight of hop cones per string
increased for each increase in the number of vines per string, while the
dry weight of hop cones per vine decreased.
•
Table 8.19. Average dry weights of hop cones per string (gm) from genotypes M25 and M26 at three vine densities.
Vine density Overall •Genotype (p =0.0001") mean for (p=0.0001**) each
3 5 genotype
M25 • 232.83 •36283 395.17 330.28
M26 63.50 173.17 265.67 167.44
Overall mean for each vine density
148.17 268.00 330.42
(PLSD = 90.44)

343
Table 8.20. Average dry weights of hop cones per vine (gm) from genotypes M25 and M26 at three vine densities.
Genotype (p=0.0001")
Vine density (p=0.0001") :,:
Overall mean for
1 3 5 each
genotype
M25
M26
232.83
63.50
120.94
57.72
79.03
53.13
144.27
58.12
Overall mean for each vine density (PLSD =48.82)
148.17 89.33 66.08
Table 8.21. Average cone weights (mg) of genotypes M25 and M26 at three vine densities.
Genotype (p=0.3488ns)
Vine density (p=0.5497ns)
Overall mean for
each genotype 1 3 5
M25
M26
184.67
139.33
166.83
159.00
171.67
185.50
174.39
161.28
Overall mean for each vine density
162.00 162.92 178.58
Table 8.22 shows average percentage contents of alpha acid of hop
cones havested from M25 and M26 at the three foliage densities during
the 1992/93 growing season. According to a two-way analysis of variance,
the variation in alpha acid percentage contents between the two hop
genotypes was significant (p < 0.05), whereas the variation among
different foliage densities was not significant (p > 0.05). It was found that
M26 had significantly greater percentage contents of alpha acid than did
M25.

Table 8.22. Average percentage content of alpha acid (%) from genotypes M25 and M26 at three vine densities.
Vine density Overall
Genotype (p=03358ns) mean for
(p=0.0001") each 1 3 5 genotype
M25 7.13 7.42 7.67 7.41
M26 10.67 11.27 11.53 11.16
Overall mean for each vine density
8.90 9.34 9.60
- 8.3.2. Under glasshouse conditions
On the first occasion of sampling, average numbers of TSSM at all
stages per leaf on hop plants of M7, M16, M17 and M24 at either one or
three vines per string under glasshouse conditions are presented in Table
8.23. Significant differences in mean numbers of mites among the four
- hop genotypes were detected (p <0.05), whereas means between different
foliage densities did not vary significantly (p > 0.05). It was apparent that
M16 had significantly more mite counts than did the other genotypes (p <
0.05). When the mite density was expressed as mean numbers of mites
• for all stages per cm2, similar results were also obtained (Table 8.24). For
the mite population at each stage studied, average numbers of adult
females, adult males, immatures and eggs on each genotype at different
foliage densities are illustrated in Fig. 8.17, 8.18, 8.19 and 8.20, respectively.
It was found that M16 at one vine per string had the highest numbers of
adult females, immatures and eggs compared with other treatments,
while M7 at one vine per string and M17 at three vines per string had the
highest adult male population.

Genotype (p=0.0023")
Mean per leaf for each genotype
1 3 (PLSD = 14.8230)
Vine density (p=0.0930ns)
Mean per an2for each genotype.
1 3 (PLSD = 0.3054)
Genotype (p).0024**)
Vine density (p).0596ns)
Table 8.23. Average numbers of total mites per leaf on four genotypes of hops at two vine densities on the first occasion of sampling under glasshouse conditions.
•M7 3.6667 8.0000 5.8333 M16 45.8333 5.3333 25.5833 M17 5.1667 6.0000 5.5833 M24 0.3333 5.5000 2.9167
Mean per leaf for each vine density
13.7500 6.2083
Table 8.24. Average numbers of total mites per an2on four genotypes of hops at two vine densities on the first occasion of sampling under glasshouse conditions.
345
M7 • 0.0707 .0.1489 0.1098 M16 . 0.9530 0.0516 0.5023 M17 M.24
0.0957 0.0059
0.1667 0.0894
0.1312 • 0.0477
Mean per cm2 for each vine density
0.2813 0.1142

4
35
3
. 15
05
0
M16 Genot_ M17
uPes 1424
4
3.5
3
25
2
15
1
05
1
3 e--
<%%‘e
0.35
0.3
0.25
0.2
0.15
0.1
0.05
0
Fig. 8.17. Average numbers of adult females per leaf on four genotypes of hops at two different foliage densities on the first occasion of sampling under glasshouse conditions.
•
Fig. 8.18. Average numbers of adult males per leaf on four genotypes of hops at two different foliage densities on the first occasion of sampling under glasshouse conditions.

Zia M16
Genoh..._ M17 1PPes M24
Fig. 8.19. Average numbers of immatures per leaf on four • genotypes of hops at two different foliage densities on the first occasion of sampling under glasshouse conditions.
Fig. 8.20. Average numbers of eggs per leaf On four genotypes of hops at two different foliage densities on the first occasion of sampling under glasshouse conditions.
347

On the second sampling occasion, average numbers of mites at all
stages per leaf on the four genotypes at the two foliage densities are
shown in Table 8.25. Generally, the mite populations ar,his sampling
occasion were found to be larger than those on the previous one.
Significant differences in the mean mite populations were detected among the hop genotypes (p < 0.05), whereas the means between the two
foliage densities did not differ significantly (p > 0.05). When the mite
densities were expressed as mean numbers of mites at all stages per cm 2,
there were significant differences in mite populations between these two
foliage densities (p < 0.05; Table 8.26). Both mite densities were found to
be highest on M16 at one vine per string. For the mite densities of
individual stages, mean numbers of adult females, adult males,
inunatures and eggs on a leaf are illustrated in Fig. 8.21, 8.22, 8.23 and 8.24,
respectively. The mean numbers of mites per leaf ranged from 0.000 to
2.833 for adult females, 0.000 to 1.667 for adult males, 0.333 to 51.833 for
immatures and 0.667 to 69.667 for eggs. It wis also found that the mite
densities for all stages were highest on M16 at one vine per string.
Fig. 8.25 shows the linear regression relationship between all mite
stages on a leaf and those caught using the adhesive tape. From this
figure, it can be seen that the prediction of numbers of all mite stages on a
leaf can be made from the number of all stages on the adhesive tape (r 2 =
0.619; Fig. 8.25A). When the raw data were transformed by log (x+1), the
coefficient of determination (r2) was increased to 0.858, indicating that the
latter relationship was more reliable (Fig. 8.25B).
In addition, means for light intensity, relative humidity and
temperature within plant canopy of the four hop genotypes at the two
foliage densities are presented in Table 8.27, 8.28 and 8.29, respectively.
These microenvironmental conditions between different foliage densities
did not vary significantly (p > 0.05). Nevertheless, the light intensity of
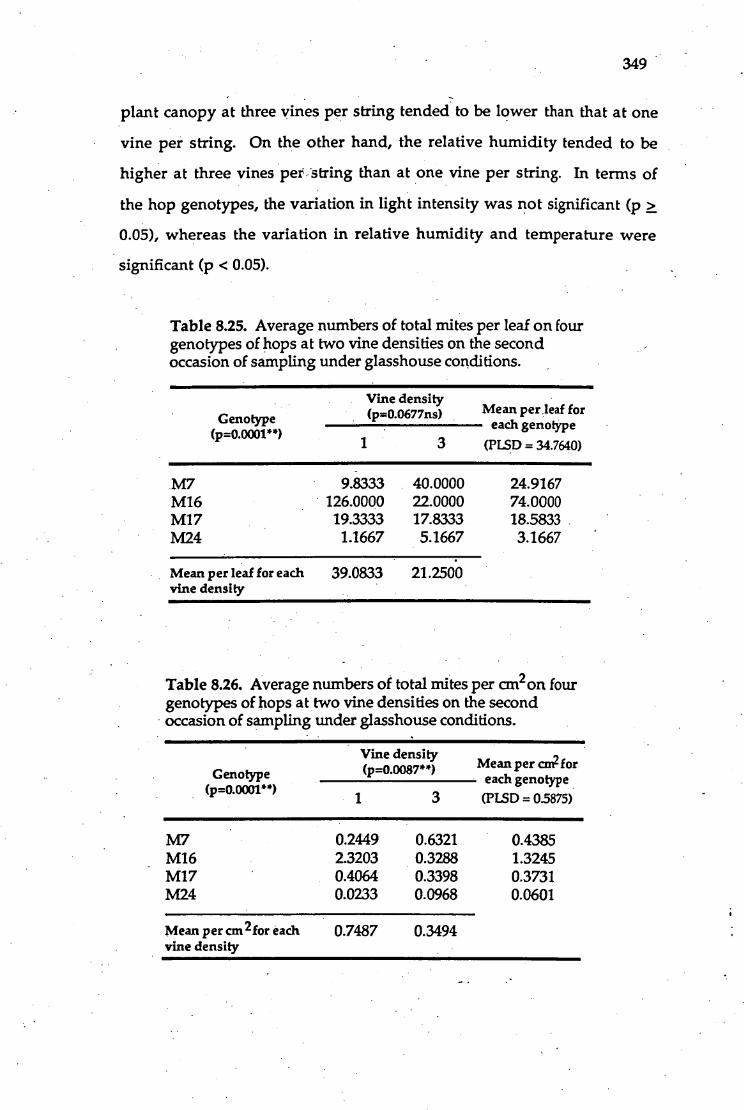
Genotype (p=0•0001")
Mean per ,leaf for each genotype
1 3 (PLSD = 34.7640)
Vine density (p=0.0677ns)
Genotype (p=0.0001**)
Vine density (p=0.0087**) Mean per cm2 for
each genotype
1 3 (PLSD = 0.5875)
349
- plant canopy at three vines per string tended to be lower than that at one
vine per string. On the other hand, the relative humidity tended to be
higher at three vines per -string than at one vine per string. In terms of
the hop genotypes, the variation in light intensity was not significant (p >
0.05), whereas the variation in relative humidity and temperature were
significant (p <0.05).
Table 8.25. Average numbers of total mites per leaf on four genotypes of hops at two vine densities on the second occasion of sampling under glasshouse conditions.
M7 9.8333 40.0000 24.9167 M16 126.0000 22.0000 74.0000 M17 19.3333 17.8333 18.5833 M24 1.1667 5.1667 3.1667
Mean per leaf for each vine density
39.0833 21.2500
Table 8.26. Average numbers of total mites per cm2on four genotypes of hops at two vine densities on the second occasion of sampling under glasshouse conditions.
M7 0.2449 0.6321 0.4385 M16 2.3203 0.3288 1.3245 M17 0.4064 0.3398 0.3731 M24 0.0233 0.0968 0.0601
Mean per an 2 for each vine density
0.7487 0.3494

1.8 1.6 1.4 1.2 1.0 0.8 0.6 0.4 0.2
1.8 1.6 1.4
1.2 1.0 0.8 0.6 0.4 0.2
Fig. 8.21. Average numbers of adult females per leaf on four genotypes of hops at two different foliage densities on the second occasion of sampling under glasshouse conditions.
Fig. 8.22. Average numbers of adult males per leaf on four genotypes of hops at two different foliage densities on the second occasion of sampling under glasshouse conditions.
350

Fig. 8.23. Average numbers of immatures per leaf on four genotypes of hops at two different foliage densities on the second occasion of sampling under glasshouse conditions.
Fig. 8.24. Average numbers of eggs per leaf on four genotypes of hops at two different foliage densities on the second occasion of sampling under glasshouse conditions.
351

10 20 30 40 0 50
352
Fig. 8.25. Linear regression of total numbers of TSSM per leaf (Y) on total numbers of TSSM per adhesive tape (X).
A for the original data
Total number of Tssm per sticky tape
B. for the transformed data
Log ( to tal num ber o f TSSM p er leaf+ 1)
0.4 116 0.8 • 1.0 12 1.4 1.6
1.8
Log (total number of Tssm per sticky tape +1)

353
Table 8.27. Average light intensity (microEinsteins/m 2/sec) within the plant canopy of four hop genotypes at two foliage densities under glasshouse conditions.
Genotype Vine density (ir-0.1615ns) Overall mean for
(10. 1 3
each genotype
M7 610.00 496.67 553.33 M16 536.67 263.33 400.00 M17 656.67 483.33 570.00 M24 633.33 416.67 525.00
Overall mean I cr each vine density
609.17 415.00
Table 8.28. Average relative humidity (%) within the plant canopy of four hop genotypes at two foliage densities under glasshouse conditions.
Vine density Genotype
(p=0.0092") • (10.1138ns) Overall mean fcr
1 3 each genotype
(PLSD = 2.0914)
M7 39.967 40.300 40.133 M16 40.600 43.033 41.817 M17 43.800 44.167 43.983 M24 40.333 41.900 41.117
Overall mean for each vine density
41.175 42.350
Table 8.29. Average temperature (°C) within the plant canopy of four hop genotypes at two foliage densities under glasshouse conditions.
Genotype (1.0.0318*)
Vine density Overall mean fcr
1 3 each genotype (PLSD = 0.1077)
M7 21.50 21.50 21.50 M16 21.53 21.53 21.53 M17 21.63 21.63 21.63 1%.424 21.67 21.67 21.67
Overall mean for each 21.58 21.58 , vine density .

354
8.4 DISCUSSION
8.4.1 Under field conditions
The results from the present study show that hop-canopy
microenvirorunents can play an important role in seasonal population
development of TSSM and that this role was amplified by hop
susceptibility to the mites. For the two hop genotypes studied, naturally
occurring populations of TSSM tended to increase more rapidly on
sparsely leaved canopies than on densely leaved canopies. However, this
is in contrast to the findings of Burdajewicz and Cone (1972) who
reported that TSSM population increase was positively correlated with
the numbers of hop vines per string. This difference in the buildup of
mite populations may be due to the different hop genotypes used as host
plants for comparing high with low foliage densities. In the present
study, the effect of canopy microenvironments on TSSM population
dynamics was found to be more adverse on the susceptible genotype used
than on the resistant one.
Under natural conditions, several variables may have been
responsible for the microenvironmental effect on mite populations. A
few of these are relative humidity, temperature and host plant condition.
During a growing season, the combined effect of all the three variables
has been usually accepted to account for the variation in mite
populations.
Because of transpiration from plant leaves, it is a common
assumption that there is layering of water vapor near the leaf surfaces
resulting in a gradient in humidity such that a high humidity is present
in the region next to the leaf, where the mites live, even when ambient
humidity is low. Nonetheless, the humidity of the air surrounding the
leaves is influenced by plant cover (Nickel, 1960). Thus, the humidity at
the leaf surface on a plant within a densely leaved canopy would tend to

355
be higher than that on a plant with a sparsely leaved canopy. Two
possible mechanisms are suggested through which relative humidity
may produce an adverse effect on mite populations: (1) the dense canopy
may promote and sustain conditions of high relative humidity by a
reduction in air movement and temperature. This would retard the
metabolic processes of spider mites (Boudreaux, 1958); (2) the high
relative humidity could provide optimal conditions for the spread and
growth of fungal parasites of spider mites (Selhime and Muma, 1966).
The former mechanism is demonstrated in the present study. In contrast,
with sparse canopy relative humidity would at most times be equivalent .
to that of the general environment.
According to Simpson and Connell (1973), humidity conditions
having the greatest influence are those in the actual habitat of the spider
mites, i.e., the lower surface of the leaf, but this is an elusive factor to
measure. Relative humidity is closely interrelated with temperature, and
these two factors may be subject to considerable change within variable
periods in this microhabitat. Both factors are influenced by the
surrounding air temperature, as well as by the amount of available water
in the soil, air currents, leaf type, angle and intensity of light to which the
leaf is exposed, and other factors (Miller and Saunder, 1923). Two of these
other factors comprise the exchange of iitfrared radiation between the leaf
and other materials and the amount of water present in the atmosphere
(Curtis, 1936). Gates et al. (1968) showed that leaf temperature frequently
exceeded air temperature by as much as 10°C. Later, Simpson* and
Connell (1973) indicated that the microhabitat of spider mites on plant
leaves attained higher maximum and lower minimum temperatures
than those of the surrounding air. Luczynski et al. (1990) suggested that
modifying the microclimate of leaf surface may affect mite oviposition
indirectly. In the present study, it was found that TSSM and its predatory
356
• mite were present at record low levels in the dense canopy and this may
have been linked to adverse effects of microenvirorunental conditions.
However, the measurement of relative humidity and temperature
influencing the microenvironnient of the hop canopy were not
sufficiently detailed to prove this. -
In addition, the variation in mite abundance is also associated with
host plant condition. Perring et al. (1986) suggested that the condition
which results in plant stress can alter the microenvironment within the
crop canopy. Toole et al. (1984), using a Banks grass mite population
growth model, demonstrated that changed microenvironmental
conditions caused rapid mite density increases on plants during moisture
stress episodes. Perring et al. (1983) found that plant substances important
in spider mite nutrition became more nearly optimal for spider mite
density increase as plants aged and became water stressed. In the present
study, mites were more abundant on the susceptible genotype (M26)
which grew faster and had a longer vegetative period as compared with
the resistant one (M25), indicating that it was not only hop phenology
that influenced TSSM densities, but also conditions experienced by hop
leaves during the vegetative period. Nevertheless, it was apparent that
mite populations on young leaves in the upper part of the hop canopy
were significantly greater than those 6n older lower leaves later in the
season because of a reduction in the suitability of - hop leaves to - favour
mite populations.
With regard to hop production, a positive correlation between the
total dry weight of cones per string and the number of vines per string
was noted. However, actual cone yield per vine decreased with
increasing numbers of vines per string. A consistent percentage content
of alpha acid was found among different foliage densities. Rybacek (1991)
suggested that the reduction of light intensity resulting from shadowed

357
shoots reduces the numbers of flower buds, flowers and cones. It was also
apparent that the resistant genotype (M25) had significantly higher cone
production than did the susceptible genotype (M26) although the percent
alpha acid of M25 was significantly less than that of M26.
In conclusion, the results of the analysis of the mite populations
that show an inverse relationship between mite densities and the
number of hop vines per string appear to conflict with the results of other
investigators as mentioned earlier. However, the results of this study do
provide a better understanding of previously published data on the
microenvironments of hop canopy and TSSM performance.
8.4.2. Under glasshouse conditions
• The results of this study tend to confirm the hypothesis that a
sparsely leaved canopy is more prone to heavy mite infestation than the
densely leaved one. Artificially mite infested plants had a greater density
of mites per unit area on a canopy trained with one vine per string than
on one with three vines per string under controlled conditions. Of the
microenvironmental variables, light intensity and relative humidity
declined slightly as the number of vines per string increased, while
temperature did not vary between different foliage densities. In addition,
•the variation in mite populations appeared to be associated with the
susceptibility of hop genotypes studied, whereas the single reading of
relative humidity within plants suggested that humidity was not related
to hop susceptibility. However, a continuous record of relative humidity
within the canopies, which was not obtained because of the absence of
appropriate equipment, could well have reflected the result obtained
within the laboratory i.e. that high humidity suppressed population
growth. •

358
CHAPTER 9 PHYSIOLOGICAL AND CHEMICAL
RESPONSES OF HOP PLANTS TO FEEDING OF TSSM
9.1. INTRODUCTION
It is generally accepted that physiological and chemical traits of
many plant species change in response to herbivory. For spider mites,
Sances et al. (1979b) found decreased stomatal opening at low levels of
mite infestations to be a primary plant response to mite feeding.
Similarly, transpiration and photosynthesis were affected at low
infestation levels; both were also dependent on stomata' opening.
Photosynthesis was further decreased with increased mite infestations,
indicating additional cellular damage within plant leaves (Sances et al.,
1979a). Mothes and Seitz (1982) reported that unpunctured cells adjacent
to the punctured, collapsed cells show damage including degeneration of
the chloroplasts and loss of chlorophyll. This, damage to =attacked cells
results in marked reductions in photosynthesis and other metabolic
activities. Moreover, mite injury can influence the metabolism of
secondary plant products (DeAngelis et al., 1983c). In the past, loss of
chlorophyll and subsequent loss of photosynthetic activity due to mite
damage has been observed for leaves of apples (Boulanger, 1958; Hall and
Ferree, 1975); cassava (Bellotti and Byrne, 1979); peppermint (DeAngelis et
al., 1983b); beans (Mothes and Seitz, 1982); and soybeans (Carlson et al,
1979). However, adverse effects of mite feeding on physiological and
chemical traits of hop foliage have not been investigated.
The objectives of the present work were to examine the changes in
stomata' conductance and photosynthetic rate of hop leaves to TSSM
injury for gaining a greater understanding of pest resistance mechanisms
in plants and to determine what changes in secondary metabolites may •
have occurred in hops due to mite damage to leaves. This is because a

359
thorough knowledge of the mechanism of resistance is helpful for
developing an effective breeding program (Kennedy, 1978).
9.2. MATERIALS AND METHODS
9.2.1. Physiological response
9.2.1.1. Under glasshouse conditions: The three genotypes of hops
used to determine leaf photosynthesis and stomatal conductance were
M4, M9 and M27. On 16 October 1992, these three genotypes were
propagated from cuttings, except that M9 was planted with either cuttings
or rootstocks. The cuttings were made of a stem and three pairs of leaves
at the apex. All plants were maintained in 21-cm. pots containing a
mixture of sand and peat moss (60:20), and were grown in an unheated
glasshouse under natural lighting conditions. The pots were arranged in
a randomized complete block design with six replications on the floor of
the glasshouse. After eight weeks, one leaf of the fifth pair below the apex
was chosen from each plant for physiological measurements with a Leaf
Chamber Analyzer. No.2 (Analytical Development Co. Ltd., Hoddesdon,
Herts., U.K). These leaves were then paired with the opposite leaf as one
kind of control. An adhesive barrier, composed of transparent plastic
sheet (2 X 2 cm) smeared with lanolin, was placed on cotton wool•
• encircling each leaf petiole to prevent movement of mites between
leaves. In order to determine the effect of the barrier on leaf
photosynthesis or stomatal conductance, the opposite leaf was not treated.
One week later, physiological measurements were taken for each leaf
with the Leaf Chamber Analyzer No.2 (LCA 2). Thereafter, the leaf with
the barrier on each plant was artificially infested -with a single density of
TSSM taken from the culture mentioned in Chapter 6, by using an
infestation level of 15 teneral females per leaf. In addition, the barrier
was placed around the petiole of the opposite leaf which did not receive

360
any mites. Physiological measurements were taken at three days and two
weeks following infestation. Photosynthesis and stomatal conductance
were determined for each leaf with the LCA 2. Mite densities were also
determined at the end of this study by removing the leaf and counting
the number of motile stages under a binocular microscope (10X).
9.2.12. Under field conditions: Field observations were conducted
on hop plants at the Horticultural Research Centre during the 1992/93
growing season. Because of the adverse effect of hot weather and strong
wind on hop leaves in this season, the undamaged genotypes used, and
the number of plants per genotype, were: 'M26' (3), 'M27' (2), 'M23' (1),
'M18' (1). These hop plants were distributed in a completely random
pattern. On 15 January 1993, a leaf pair at the height of 1.8 m was chosen
from each plant and the petiole of each leaf was encircled with the barrier
described above. A single density of TSSM (15 teneral females) was
transferred to one leaf of each pair. Twelve days after innoculation,
photosynthesis and stoma tal conductance were determined for each leaf
with the LCA 2 mentioned above.
9.2.1.3. Statistical analyses: Analysis of variance was used to detect
differences in physiological parameters among different hop genotypes.
Mean comparisons were performed using PLSD at the 5% level. In
addition, an unpaired t-test was also employed to distinguish between
two treatment groups.
9.2.2. Chemical response
Preliminary studies on phenolic compounds and alkaloids in hop
leaves were carried out during the 1992/93 growing season. The
following genotypes grown at the Horticultural Research Centre were
studied: M4, M9, M26 and M27. Fully expanded leaves of these four
genotypes were collected and kept in a cold room at 4°C. For each
genotype, five grams of the fresh leaves were homogenized for 5 min in

361
methanol (Me0H) and water (KO) (4:1) (10 X leaf weight). The mixture
was then filtered through Whatman No.1 filter paper in a glass funnel.
The filtrate was evaporated in a water bath (35°C) until 1/10 of the
original volume remained. This filtrate was acidified with 2M H 2SO4 and
then extracted with chloroform (CHC1 3) (X 3). The CHC13 extract was
dried by evaporation and redissolved with 1 ml methanol for spotting on
0.2 mm 20 X 20 cm pre-coated silica gel 60F254 TLC aluminium sheets
(Merck) in order to detect phenolic compounds. After development in
acetic acid (HOAc) and CH 3C13 (1:9) solvent systems to a distance of 17 cm,
the sheets were dried at room temperature and exposed to short wave UV
light in order to detect the spots of moderately polar extracts. For the
aqueous acid layer, the solution was basified to pH 10 with NH4OH and
then extracted with CHC13 - Me0H (3:1; twice) and CHC13 (once). Next, the
CHC13 - Me0H extract was dried by evaporation and redissolved with 1
ml methanol for spotting on the TLC sheets to determine leaf alkaloids.
The sheets were developed in Me0H - NH4OH (200:3) solvent system to a
distance of 17 cm and dried at room temperature. Subsequently, the dry
sheets were exposed to short wave UV light to detect the spots of the basic
extract (after Harborne, 1984). A total of five runs was performed for each
genotype.
To determine the response of hop foliage to mite infestation, the
following genotypes grown in a glasshouse were studied: M4 and M27..
When potted hop plants were eight weeks old, four fully-expanded leaves
of each genotype were infested with teneral females obtained from the
culture mentioned earlier, by using an infestation level of 15 mites per
leaf. In addition, the adhesive barrier was also placed around the petiole
of each leaf. One week later, the leaves were collected and all mite stages
removed by a small camel's-hair brush. Then, these infested leaves were
used for analysis of phenolic compounds as mentioned above. Because

362
leaves of a pair have similar chemical components, the leaf opposite each
infested leaf was also collected as one kind of control.
9.2.3. Preliminary studies on damage caused by TSSM to the quality
Of hop leaves and hop cones
Two observations were conducted to investigate the effects of mite
feeding on hop leaf volatiles. In the first observation, fresh uninfested
leaves were collected from 9-wk-old field hop plants of M4 or M27 grown
at the Horticultural Research Centre. Both immature and senescent
leaves were avoided, and all the leaves studied were ca. the same age,
size, colour and condition. The leaves were cut at the petiole-limb
intersection. Approximately 20 grams of these leaves for each genotype
were placed separately in 100 ml plastic containers, fitted with a tight
fitting lid. There were two treatments for each genotype: mite-feeding
and untreated control. For the mite-feeding treatment, the leaves in each
container were 'artificially infested with 100 adult females for two hours at
room temperature. Following this treatment, volatiles (5 ml) were
collected from each container using a syringe. The volatiles were
analyzed by gas chromatography (Hewlett Packard-5890 gas
chromatograph) using a 24 meter X 0.32 mm X 0.17 p.m film thickness HP
1 cross linked methyl-silica capillary column (SGE Pty. Ltd.). The gas
chromatograph was programmed from" 35° to 200°C at 6°C/minute and
200° to 290°C at 30°C/minute for 3 minutes using helium as carrier gas
(701(Pa and a flow rate of approximately 2 nil/minute).
In the second observation, only genotype M27 (Pride of Ringwood)
was used to examine the effect of natural mite infestation of hop volatile.
Fresh leaves and cones were collected frcim either infested or uninfested
areas in Hop Yard No.3 at Bushy Park. Then, the volatiles of leaves and
cones obtained from each area were analyzed via gas chromatography as
described above.

363
A preliminary study was also conducted to determine foliage
essential oils using analyses of fresh steam distillates. Again, fresh leaves
of M27 collected from both infested hop and uninfested plants in Hop
Yard No. 3 were used.
9.3. RESULTS
9.3.1. Physiological response to mite damage
A comparision of leaf gas exchange characteristics between
different hop genotypes is presented in Fig. 9.1. Analysis of variance,
showed significant differences (p < 0.05) in photosynthesis among the
three genotypes studied (Fig. 9.1A). The photosynthesis of M4 and M27
was significantly higher than M9. For stomata! conductance, significant
differences (p <0.05) among the three genotypes were also detected (Fig.
9.1B). The leaves of M27 had the highest stomatal conductance, followed
by those of M4 and M9.
Fig. 9.2 shows leaf gas exchange characteristics of hop plants
propagated from different planting materials. According to unpaired t-
tests, there were no significant differences in either photosynthesis or
stomata! conductance between hop plants grown from cuttings and those
planted from rootstocks (p > 0.05). Nevertheless, these two gas exchange
characteristics of plants obtained from cuttings tended to be higher than
those of the rootstock plants.
A comparison of the effect of sticky barriers on leaf photosynthesis
and stomatal conductance for treated and control (uninfested) leaves is
presented in Fig. 9.3. Since the sky was cloudy on the measuring date,
only leaves on hop plants of M9 were used. An unpaired t-test showed
no significant differences in photosynthesis as well as stomatal
conductance between these two leaves (p 0.05).

M27 M9 Genotype '
M27 M9 Genotype
M4
M4
p = 0.0318* PLSD = 0.0395
Fig. 9.1. Gas exchange characteristics of hop leaves collected from three genotypes: (A) photosynthesis; (B) stomatal conductance.
364

12
10
8
6
4
2
p = 0.4902ns (A
Fig. 9.2. Gas exchange characteristics of leaves on hop plants propagated from different planting materials: (A) photosynthesis; (B) stomata' conductance.
365
Cutting Rootstock
Planting materials
Cutting Rootstock
Planting materials

0.15
5 0.12:
.1 0.09 - v -o z 0.06 - 8 3 g 0.03 - o
0.00
(B) p = 0.9831ns
Fig. 9.3. Gas exchange characteristics of hop leaves affected by the sticky barrier: (A) photosynthesis; (B) stomatal conductance.
Without barriers With barriers
Treatment .
Without barriers With barriers
Treatment
366

367
For TSSM feeding damage, the gas exchange characterstics of
infested leaves of hop plants grown under glasshouse conditions at 3 and
14 days after inoculation in comparison with the uninfested ones are
presented in Fig. 9.4 and 9.5, respectively. Due to the cloudy sky, the data
for Fig. 9.4 were obtained from all the rootstock plants of M9, while those
for Fig. 9.5 were obtained from only three rootstock plants of M9. No
• significant differences in photosynthesis or stomata! conductance were
found between infested and uninfested leaves 3 or 14 days after
inoculation. However, the average values of these two gas exchange
characteristics tended to be higher on uninfested leaves than on infested
ones 14 days after inoculation. It was apparent that photosynthesis was
reduced by 8.05 and 60.76% and stomatal conductance by 13.23 and 57.14%
at 45 mite-days per leaf (3 days after inoculation) and 1367.33 mite-days
per leaf (14 days after inoculation), respectively.
The comparison of gas exchange characteristics between infested
leaves and uninfested ones of hop plants grown under field conditions is
shown in Fig. 9.6. Even though the values of photosynthesis or stomata!
conductance between infested leaves and uninfested ones did not differ
significantly (p L. 0.05), these physiological parameters of uninfested
leaves tended to be higher than those of infested ones. It was found that
photosynthesis was reduced by 35.41% ind stomatal conductance by 9.45%
12 days after inoculation.
In addition, a significant, positive, linear regression was observed
between photosynthesis and stomata! conductance (Fig. 9.7). This
regression was obtained by pooling data taken from all the studies
mentioned above.

p = 0.8978ns
Uninfested Infested Treatment
(A)
(B)
p = 0.6795ns
• Fig. 9.4. Comparisons of gas exchange characteristics between uninfested and infested hop leaves 3 days after inoculation: (A) photosynthesis; (B) stomata' conductance.
368
0.15
0.12 -
.1 0.09
g 0.06 3 g 0.03-
9 cn 0.00
Uninfested Infested
Treatment

Stomatal conductance (an/sec
PP
Po
8 a
e
I:
Photosynthesis ( Ltmole/m2 /sec) 1—a
PJ
44.
ON
00
0

••••., (B) p = 0.6787ns
0.15
0.12 -
0.09 -
0.06
0.03 -
0.00
Fig. 9.6. Comparisons of gas exchange characteristics between uninfested and infested field hop leaves 10 days after inoculation: (A) photosynthesis; (B) stomata' conductance.
Uninfested Infested Treatment
370
• Unifested Infested Treatment

0
0.0 0.1 0.2 Stomata! conductance (cm/sec)
03
Fig. 9.7. Linear relationship between photosynthesis and stomatal conductance for combined data in the present study; n = 52.
371
9.3.2. Chemical response to mite damage
Some qualitative variation in chemical compounds of hop leaves
were found. For phenolic compounds, TLC of moderately polar extracts
of hop leaves collected from the four genotypes studied produced a
similar series of spots (Table 9.1). Commonly, the Rf values for these
extracts in solvent system HOAc-CH3C13 (1:9) were 0.50, 0.85, 0.95. In
some extracts of hop genotypes M4 and M26, an unclear spot was also
detected in the region of Rf 0.18. When alkaloids were separated, TLC of
basic extracts of hop leaves collected from all the genotypes used produced
only one spot at the Rf value of 0.78 in Me0H-NJ4OH (200:3) solvent
system. A comparison of phenolic compounds and alkaloids between
infested and uninfested leaves of both M4 and M27 showed no
differences in the series of spots detected using this TLC technique.

Table 9.1 Rf values of moderately polar extracts in HOAc-CH3Cb (1:9) solvent system for four hop genotypes during five running occasions.
RE values
1
2 3 4 5
M4 0.50 0.18 0.50 0.50 0.50
0.85 050 0.85 0.85 0.85
0.95 0.85 0.95 0.95 0.95 0.95
0.50 0.50 0.50 0.50 0.50
0.85 0.85 0.85 0.85 0.85
. 0.95 0.95 0.95 0.95
M26 0.18 0.18 0.50 0.85 0.50
0.50 0.50 0.85 0.95 0.85
0.85 0.85 0.95 0.95
0.95 0.95
• 0.50 0.50 050 050 050
0.85 0.85 0.85 0.85
0.95 0.95 0.95
With regard to volatile compounds of hop foliage, the gas
chromatography separations of these compounds are shown in Fig. 9.8,
9.9, 9.10 and 9.11 for uninfested M4 leaves, infested M4 leaves, uninfested
M27 leaves and infested M27 leaves, respectively. It was noted that the
chromatograms of the uninfested control and leaves infested with mites
were similar for each hop genotype; however the quantity of volatile
compounds in the chromatograms differed between the two genotypes.
For hop cones, the chromatography separation of the volatile compounds
obtained from uninfested and infested plants of M27 are shown in Fig.
9.12 and 9.13, respectively. • No differences in these two chromatograms
were observed. However, the abundance of myrcene in uninfested leaves
was higher than that in infested ones. •
372

TIC of DRTA:HG45U9.D 5.0E5
4.0E5
O 3.0E5 0
m
•
2.0E5
1.0E5
1 .11 e le 12 14 S. 18 20. Time (min.)
Fig. 9.8. Chromatogram of volatile compounds of uninfested hop leaves collected from M4.
Fig. 9.9. Chromatogram of volatile compounds of infested hop leaves collected from M4.
373
TIC of DATR:HG4SI9.D 5.0E5
4.0E5
C 3.0E5 0
A 2.0E5
1.0E5
8 . 10 12 14 18 18 20 O Time (min.)

TIC of DRTR:HG275I5.17 1.0E5
5.0E4
5.0E4
7.0E4
6.0E4
5.0E4
4.0E4
3.0E4
2.0E4
10000
-,10 12
14
16
Le
20 Time (min.)
Abund ance
Fig. 9.10. Chromatogram of volatile compounds of uninfested hop leaves collected from M27.
TIC of DATR:HG276U10.1:1 1.0E5
5.0E4
5.0E4-
O 9.4-U
•
•
5.0E4:,
3
3.0E4
2.0E4-
10000-
li
II,- '')• e / ' . ,
16 18 20
• ,
16 12 14 Time (miri'.)
Fig. 9.11. Chromatogram of volatile compounds of infested hop leaves collected from M27.
374

TIC: HOPPI.0 (-)
12 N4yrccnc
t
4:00 6.00 8:00 10.00 12:00 14:00 16:00 18:00 20:00 22.00 24.00
4000000
3500000
3000000
2500000
2000000'
1500000
1000000
500000
X.Zundanca
3000000
12 Myrcr.ne
TIC: 4CPF4.0 (-)
4.00 6.00 8.00 10.00 12.00 14.00 16.00 18.00 24.00 22.00 20.00
2000000
1500000
1000000
500000
Fig. 9.12. Chromatogram of volatile compounds of hop cones collected from uninfested plants of M27.
375
Fig. 9.13. Chromatogram of volatile compounds of hop cones collected from infested plants of M27.

TIC of ORTR:HG27LUO.D',
9.0E6
7.0E6:
Ab
un
da
nc
e
6. 2S
5.0E6
4.0E6 -
2.0E6 -
2.0E6:
1.0ES:
10 15 Time (mm.)
376
The separation of volatile compounds achieved using the steam
distillation technique, is shown in Fig. 9.14 and 9.15 for uninfested and
infested leaves of M27, respectively. It was observed that there were no
differences in chromatograms between these two foliage treatments due
to the feeding damage of naturally occurring mite populations.
Fig. 9.14. Chromatogram of volatile compounds of uninfested hop leaves collected from M27 separated using the steam distillation technique.

TIC of DATR:HG27LI0.0
J4.0ES-
3.0E6'
2.0E6
L-1-
10 15 Time (min.)
5 20'
377
Fig. 9.15. Chromatogram of volatile compounds of infested hop leaves collected from M27 separated using the steam distillation technique.
9.4. DISCUSSION
9.4.1. Physiological response to mite damage
The results from the present study show that TSSM feeding
damage in both the field and the glasshouse may lead to a decrease in gas
exchange characteristics of hop leaves, including the rate of
photosynthesis and stoma tal conductance. This is in agreement with
Welter et al. (1989) who reported that feeding injury by Pacific spider

378
• mite, T. pacificus (McGregor), or Willamette mite, Eotetranychus
willametti (McGregor), was shown to reduce grape leaf photosynthesis
and stomata! conductance. Moreover, previous studies by Andrews and
LaPre' (1979) and Youngman and Barnes (1986) also showed significant
negative correlations beween mite damage and crop gas exchange
parameters. However, Martens and Trumble (1987) indicated that
undamaged leaves adjacent to leaves damaged by the leafminer,
Liriomyza Wolff (Burgess), had increased photosynthetic rates.
Sances et al. (1981), working with TSSM on strawberry, showed that
adverse effects of mite feeding on photosynthesis and transpiration of
plants caused reductions in quality and quantity of harvestable fruit.
Impaired carbon uptake of mite-infested leaves occurs as a result of
stomata! closure and injury to chlorophyll containing mesophyll cells
within leaf tissue (Sances et al., 1979a, b). Interference with CO2 uptake
•and fixation reduce the availability of simple carbohydrates and other
photosynthates required in the development of vegetative and
• reproductive plant structures. This sequence of events first contributes to
a reduction in fruit size, and, subsequently, to significant decreases in
total yield (Sances et al., 1981).
In addition, foliage and fruit expansion requires turgor from
regulated water balance within healthy . plants (Meidner and Sheriff,
1976). Improper functioning of stomata and the subsequent lack of
internal tissue water balance stemming from a reduction in
transpirational flux from heavily damaged foliage may act concomitantly
with the restraint of available photosynthetic products to reduce growth
and productivity (Sances et al., 1981).
• The results in the present study also show that there were inherent
differences in gas exchange characteristics among the hop genotypes
studied. It was apparent that the gas exchange characteristics of M9 were

379
significantly higher than those of M4 and M27. This may be due to the
variation in stomatal densities between these genotypes. As mentioned
in Chapter 7, M4 had significantly lower numbers of stomata per unit
area than M9 with the exception of M27. Stomata! transpiration may be
associated with measurement of CO2 assimilation by plants because the
transpiration can result in an increase in water vapour concentration and
a dilution of the mole fraction of all other gases, including CO2 (Long and
Hallgren, 1985).
Furthermore, a positive relationship between photosynthesis and
stomatal conductance of hop leaves was noted in the present study.
DeAngelis et al. (1983b), working with TSSM on peppermint, indicated
that photosynthesis was strongly dependent on conductance at lower leaf
conductance (high leaf resistance to gas exchange), whereas
photosynthesis became nearly independent of gas exchange at higher
conductance (low leaf resistance).
9.4.2. Chem ical response to mite damage
This study, conducted in two different parts of hop plants,
demonstrated the chemical responses of hops to TSSM injury. It was
apparent that the volatile and leaf chemical compounds of the =infested
control and leaves infested with TSSM were similar for each genotype
studied by using GC or TLC, however the abundance of volatile
compounds in hop cones of infested plants tended to be lower than that
of uninfested plants, especially for the monoterpene, myrcene. This
compound is one of the most important hydrocarbon fractions in hop
essential oils (Rybacek, 1991). In general, the essential oil is produced in
lupulin glands which are denser on hop cones than on the leaves.
According to Neve (1991), recent biogenetic theory suggests that the
terpene hydrocarbons are formed from oxygenated intermediates. The
synthesis of myrcene appears to be the dominant pathway as the hop

ii
.... CH2OPP oOH 13
Linalol (Floral:40 ppb)
11 Geranyl pyrophosphate
if
12 Myrccne '
(Spicy. resinous: 200 ppb)
380
ripens. Myrcene and other monoterpenoids are believed to be formed
from geranyl pyrophosphate. Currently, many of these intermediates are
thought to result in the hoppy flavour of beers. Fig. 9.16 presents the relationships of some of these compounds, the flavours produced and
their concentrations in beers (Sharpe, 1988).
Fig. 9.16. Monoterpenoids in hop oil . and beer (after Sharpe, 1988).
,CH2 OH
Geraniol (Geranium. floral:
ppb)
16 Nerol 15
Geranyl acetate (Fruity: 15 ppb)
17 a-Terpineol
(Woody. resinous: 5 ppb)
18 Limonene
(Citrus. fruity: 80-100 ppb)
19 Terpinolene
(Woody, resinous: 20 ppb)

381
When the essential oils in uninfested and infested hop leaves were
separated by using the steam distillation method, a similar set of volatile
compounds occurring in similar amounts was observed in thi:' present
study. This would suggest that mites were not significantly affected, at
least directly, by volatile leaf phytochemicals.
Theoretical considerations of herbivore-plant interactions assume
that various chemical parameters of plants influence herbivore feeding,
growth and survival (Marquis, 1984). Secondary metabolites such as
phenolics and monoterpenes can reduce the palatability of plant tissue to
herbivores and reduce herbivore growth rates, hence playing a major role
in host plant resistance to pest (Rhoades and Cates, 1976; Mckey, 1979).
These chemical compounds are not uniformly distributed throughout a
plant; the capacity to synthesize and store them is dependent on tissue
type and age (Mckey, 1979; Burbott and Loomis, 1969; DeAngelis et al.,
1983c). Several phenolic compounds have been reported to be repellent
to TSSM (Dabrowski and Rodriguez, 1972). Larson and Berry (1984)
showed the impact of monoterpenes and phenolic compounds in
different-aged peppermint leaves on TSSM fecundity, development and
dispersal. In a more recent study, Luczynski et al. (1990), working with
beach strawberry under glasshouse conditions, found that TSSM
oviposition was negatively correlated with the concentration of total
foliar phenolics. Nonetheless, Leszcynski et al. (1988), working with
TSSM on hops, indicated that phenolic compounds were not major
factors in the resistance of hops to TSSM, even though amounts of leaf
phenols varied significantly among the hop cultivars studied. From the
present study, it was also noted that both alkaloid and phenolic
compounds were not important chemicals produced in hop leaves in
response to TSSM infestations.

382
Additionally, earlier studies on chemical responses in plants
caused by mite damage were investigated by several other researchers. In
a comparison of resistance of two soybean varieties to TSSM, the cultivar
with more constitutive resistance showed a stronger hypersensitive
response to mite injury (Hildebrand et al., 1986). Similarly, the more
resistant of two strawberry varieties showed a greater induced response to
mite damage, measured in terms of mite-feeding preference (Kielkiewicz,
1988). In a study of lupins, Johnson et al. (1989) reported that leaves with
the highest initial levels of alkaloids were the ones with the greatest
induced increases relative to undamaged controls. Bell (1986) suggested
that most of the compounds which are known to provide resistance in
cotton against mites and other agents can also be induced by damage.
Radioisotope incorporation studies of peppermint showed that
monoterpene metabolism is extremely sensitive to the type and amount
of metabolic substrate available from surrounding photosynthetic cells,
and that gland cells may be deficient in oxidative metabolism (Burbott
and Loomis, 1967, Croteau et a., 1972). Therefore, biosynthesis is highly
dependent, both - qualitatively and quantitatively, on the physiological
state of surrounding photosynthetic tissue for supply of photosynthate,
and thus is subject to the effects of mite-induced plant stress operating on
these cells (DeAngelis et al., 1983c).

383
CHAPTER 10 SUMMARY
The primary objective of the present Study was to gain a better
understanding of mechanisms involved in the plant response to
attacking mites in a system of cultivated hops. Five important aspects of
this. study were: (1) resistance-susceptibility of hop genotypes to TSSM
infestations; (2) effects of environmental factors on the capacity of mite
_ populations to increase; (3) morphological characteristics of hop leaves
and their responses to TSSM infestations; (4) effects of hop leaf canopy on
TSSM and its predatory mite and (5) physiological and chemical
responses of hop foliage to damage caused by TSSM. An additional
purpose of the study was to determine the seasonal abundance and the
distribution of TSSM infesting commercial hops as well as the possibility
of induced defence following reinfestation and this will be dealt with
first.
10.1. Seasonal abundance and distribution of TSSM infesting commercial
hops The results from field observations demonstrated a generalised
pattern of fluctuations in naturally occurring mite populations infesting
commercial hops at Bushy Park, Tasmania, during the three growing
seasons 1990/91 to 1992/93. These hops were grown in either untreated
or treated areas under sprinkler irrigation. In untreated areas, the normal
pattern of population change showed that mites peaked after hops had
• formed the visible bases of inflorescences and that population fluctuated
at peak number to decline in the autumn. The relationship between mite
population size and the proportion of infested leaves indicated that all
leaves sampled at a height of 1.8 m could be infested when the average
number of mites per leaf was more than 100.. For treated areas, the

384
normal pattern of infestation development was interrupted by the
application of miticides. It was found that mites continued to infest hop
plants and occurred at low levels after miticide applications.
Natural enemies did not appear at levels sufficient to give control.
This may have been due to the effects of miticide applications in the
previous season. The natural enemies found were Stethorus spp. and
phytoseiid mites, ranging from 0.1 to 1.0 stages per leaf.
The variation in mite injury to hops was found to affect mite
population reinfestations following spraying. Heavily injured plants
became less suitable, while slightly damaged plants were more suitable
for mite increase. This finding revealed S possible induction of resistance
in hop plants following prior mite infestation.
In addition, it was noted that inclement weather was a potential
factor in limiting mite population build-up. Abundant rainfall during
some parts of the season appeared to be, the possible cause in the
retardation of- some infestations. As pointed out by Lin.ke (1953), rainfall
physically dislodged the active stages of TSSM from hop leaves. It was
also observed that mite populations developed more quickly during
periods of little or no rainfall and high temperatures.
In terms of stage distribution, eggs were the dominant stages for
most of the season and the stage-specifit percent densities changed as the
season progressed. At the peak density of mite populations in untreated
areas during the 1990/91 season, the percentage of eggs, immatures, and
adult mites averaged approximately 60%, 27% and 13%, respectively.
The results from the present study also showed that the spatial and
vertical distribution of the mites for each stage varied with time.
Following emergence from field litter during the early growing season
and dispersal onto plants (Cao, 1989), populations of adult females were
found to be uniformly distributed between hop plants and became

385
aggregated as the season progressed. For adult males, immatures and
eggs, the dispersion was found to be aggregated throughout the study
perircid. Populations of each life stage were found on the lower leaves
early in the season but progressively moved up the plant as it grew.
Approximately 66% of total mite populations occurring in early March
before harvest were detected on the upper leaves, whereas only 12% of
the total were found on lower leaves. The upward distribution of adult
males and immatures was slower than that of adult females.
For feeding damage, the surface areas and dry weights of leaves in
the area with high seasonal mite-day accumulations were significantly
less than those in the areas with low seasonal mite-day accumulations.
Relationships between total mite numbers and numbers of mites of each
stage, in terms of both mite-days and transformed mite-days, indicated
that the estimate of the actual mite-days of all stages of mites from only
the mite-days of any particular stage results in a significant linear
regression and that the numbers of adult female mite-days alone was the
best indicator for the total population of all stages. Moreover, feeding
damage may be predicted using the relationship between females at week
t and total mites at week t+1 in terms of both the number of mite-days
and the original number of mites and the best estimate of potential
population trend was obtained seven days after female census.
10.2. Resistance-susceptibility of hop genotypes to TSSM infestations
Studies on the resistance-susceptibility of hop genotypes to artificial
and natural infestations by TSSM revealed that all the genotypes tested
expressed an intermediate or susceptible reaction to the mites, with M26
(Huller Bitterer) being the most susceptible. Despite no outstanding
evidence of antibiosis,-significant differences in susceptibility among the
- hop genotypes were detected in terms of tolerance, non-preference and

386
plant avoidance. It was also found that there were significant differences
in mite densities between European and American hop cultivars.
German Huller Bitterer (M26) had significantly greater TSSM densities
than did American Aquila (M25). In these studies, M4 (EG-86-23) was
shown to be the cultivar with the genotype most likely to provide mite
resistant hops.
When the effects of different hop genotypes on developmental
time, fecundity, survivorship and intrinsic rate of increase (rm ) of TSSM
were evaluated using age-specific life table statistics, no significant
differences in any of these parameters among genotypes were detected.
Nevertheless, the effect of different hop genotypes on mite development
was apparent during the first 12 days of the reproductive-ovipositibn
period with the greatest differences in the cumulative number of eggs
occurring on the fourth day of oviposition.
10.3. Effects of environmental factors on the capacity of mite populations
to increase
Several environmental factors affected mite population growth
rate. Thus, temperature, relative humidity, light intensity, plant age,
source of leaves and leaf surface areas, singly or together, can determine
the degree of variation in mite population build-up on plants.
It was found that growth rates of the mites were significantly
greater at higher than at lower temperatures. That is, an increase in rate
of development with increased temperature, within the favourable
temperature range, contributes significantly to the realization of r m . The
lower thermal threshold for TSSM development, was estimated at 5.88°,
10.99°, and 11.33°C for egg, female and male postembryonic stages,
respectively. For survivorship and reproduction of TSSM, the present
study confirmed that temperature influenced these two parameters.

387
Embryonic development, as well as the survival of postembryonic
stages, was affected by relative humidity. There were significant
differences in the duration of egg, total juvenile and pre-reproductive
development between moderately humid conditions and water-saturated
atmospheres. In addition, the sex ratio of immatures reaching adulthood
was also influenced by humidity with a shift towards a higher female :
male ratio at a humidity near saturation without the salt.
Light intensity was another environmental factor which had an
influence on survival, development and reproduction of TSSM
populations. Generation mortality of TSSM was found to be greater at
low light intensities than at high light intensities. There were significant
differences in total juvenile developmental and pre-reproductive periods
of TSSM reared at different light intensities. The intrinsic rate of increase
tended to be greater for TSSM reared at higher light intensities, while the
mean generation time tended to be longer, for mites reared at lower light
intensities.
With regard to plant variables, the effects of leaf age and leaf
regions on the biology of TSSM were examined using leaf discs. Very
little difference occurred between survival, development and
reproduction of mites on old and young leaf discs. This study also
indicated that survival and reproducticin of mites were not significantly
affected by the size of leaf veins, but rate of development tended to be
influenced by this variable.
The biological interaction of mites with their host plants appears to
depend on a complex set of environmental factors that collectively
inflUence the behaviour and physiology of mites. Modifications of any of
these factors may influence the suitability of any plant as a host. For
example, photosynthetic activity and related processes in plants can be
highly regulated by environmental factors such as light and temperature.

388
10.4. Morphological characteristics and the responses of hop leaves to
TSSM infestations
Morphological variation in external and internal characteristics of
hop leaves occurs among the genotypes studied. Significant differences
between cultivars were found in ventral gland . size, trichome density,
trichome size, length of trichomei, stomatal density, stomatal size and
moisture content. Moreover, hop genotypes that were more tolerant had
the highest density of ventral trichomes of the shortest average length,
whereas susceptibility was highest on genotypes with a low density of
trichomes of greatest average length.
The morphological characteristics of the hop leaves collected from
the same genotype may vary significantly according to leaf age and
growing conditions. When comparing the morphological characteristics
of glasshouse versus field hop leaves, it was found that leaves collected
from the glasshouse had denser ventrally occurring trichomes and glands
than leaves collected from the field, while the thicknesses of the
glasshouse leaves was less than those of field leaves. In the comparison
of morphological characteristics of young and old leaves, numbers of
ventral trichomes and glands per unit area were more sparse on old
leaves than on young leaves, while the thickness of cellular layers, with
the exception of the epidermal cells, was less in young leaves than in the
old leaves. In young leaves the cuticle was thicker and this allowed for
greater expansion of epidermal cells.
In addition, it was demonstrated that there was genetic variation in
the morphological response of hop leaves to mite infestations and that
this variation was related to the area of the leaf scarred and damaged by
mite feeding and stomatal opening. It was found that the average
number of yellow specks (ruptured cells) was significantly greater on the
highly susceptible genotype M27 than on the'slightly susceptible genotype

389
M4, whereas the the mean number of open stomata was significantly less
on M27 than on M4.
10.5. Effects of hop leaf canopy on TSSM and P. persimilis
Evidence was obtained in the present study that hop-canopy
microenvironments do play an important role in seasonal population
development of TSSM. This role was amplified by hop susceptibility to
the mites. For the hop genotypes studied, the _populations of mites
increased more rapidly on sparsely leaved canopies than on densely
leaved canopies. In turn, the growth of P. persimilis populations was
greater - in sparse canopies. In addition, the effect of canopy
microenvironments on TSSM population dynamics was found to be
more adverse on the susceptible genotype used (M26) than on the
resistant one (M25). Initially M26 grew faster than did M25. TSSM
readily established and grew on M26, whereas population growth was
slow on the slower growing cultivar M25.
• Within a closed canopy, leaves are clustered to create conditions in
which less adis circulated, light intensities and temperatures are reduced
•and relative humidities increased. In contrast, an open canopy has
unrestricted air flow, high light intensities and elevated temperatures as
well as humidities reduced to ambient. levels. Furthermore, potentially
confounding effects of temperature interacting with humidity or light
•intensity can affect mite population growth. High temperatures and light
intensities with low relative humidities tend to increase intrinsic rates of
increase and to decrease mean generation time, whereas low
temperatures and light intensities with high relative humidities tend to
decrease intrinsic rates of increase and to increase mean generation time.
The difference in the size and numbers of yellow specks between
highly and lower susceptible genotypes Whichcarried high and low TSSM

390
populations appear to reflect the water status of the respective plants.
TSSM damage to hop cultivars reflects both mite numbers and the plants
-'response to the feeding lesion. For susceptible cultivars mite numbers
are usually higher resulting in greater feeding while the water stress
induced by excessive feeding will under conditions of average
temperatures and humidities result in water loss from the lession. This
results in a large destructive speck. In contrast lower populations on
more tolerant cultivars, which do not experience high stress because of
the moderately effect of a dense canopy, have fewer and smaller specks
because of the more hydrated leaf condition.
It is postulated that the difference between susceptible and more
tolerant plants relate to the overall water status of individual
plants/cultivars. That is TSSM damage results in direct water loss from
the leaf surface. In actually growing plants with a high water demand the
water deficit resulting from evaporation from the damaged surface leads
to closure of stomata and reduced CO2 uptake. The leaves are then
exploited by TSSM.
In contrast slower growing plants do not experience a high water
deficit with damage. For evaporative losses are adequately met resulting
in small damage specks. These conditions are most often met when
canopy structures are dense which in turn retard TSSM population
growth.
10.6. Physiological and chemical responses of hop foliage to damage
caused by TSSM
A preliminary study of the physiological and chemical responses of
hop genotypes to mite feeding damage was conducted under field and the
glasshouse conditions. It was noted that feeding damage of the mites
tended to not only increase hop leaf resistance to CO2 uptake-but also

391
suppress 'photosynthetic rates in these experiments. Additionally,
chromatographic analyses of chemicals extracted from hop leaves showed
that phenolics and alkaloids as well as volatile •compounds in infested
leaves were qualitatively and quantitatively similar to those detected in
undamaged control leaves. Nonetheless, the abundance of myrcene in
hop cones of infested plants tended to be lower than that of uninfested
plants.. This was caused by reduction of active surface due to feeding
damage.
On the basis of the results reported here it would appear that the
mechanisms involved in hop resistance to TSSM infestations are best
described in terms of either mite population variability or the reaction of
the plant with both these phenomena being strongly influenced by
environmental factors. For a more complete understanding of the
possibilities of TSSM control by use of varietal resistance, further detailed
information is required on genetic, cytological and biochemical aspects
and intensive monitoring of the microhabitats in which the mites live.

392
Bibliography
Adikisson, P.L. and V.A. Dyck. Resistant varieties in pest management systems. In: F.G.
Maxwell and P.R. Jennings (eds.), Breeding plants resistant to insects. pp.233-251.
John Wiley & Sons, Inc., New York.
Agarwal, R.A. 1969. Morphological characteristics of sugarcane and insect resistance.
Entomol. Exp. Appl., 12: 767-776.
Aina, 0.J., J.G. Rodriguez and D.E. Knave!. 1972. Characterizing resistance to Tetranychus
urticae in tomato. J. Econ. Entomol., 65: 641-643.
S.H. and J.L. Weigle. 1982. Resistance in New Guinea Impatiens species and
hybrids to the twospotted spider mite. Hon. Science, 17: 47-48.
Al-Abbasi, S.H., J.L. Weigle and E.R. Hart. 1987. Biological interactions between New
Guinea Impatiens and the twospotted spider mite (Acari: Tetranychidae). J. Econ.
Entomol., 80: 47-50.
Andres, L.A. 1957. An ecological study of three species of Tetranychus (Acarina:
Tetranychidae) and their response to temperature and humidity. University of
• California. Ph.D. dissertation. (cited from Watson, 1960).
Andrews, K.L. and L. LePre'. 1979. The effect of Pacific spider mite on physiological
• procethes of almond foliage. J. Econ. Entomol., 72: 651-654.
Andrews, K.L. and M.M. Barnes. 1981. Spider mites on almond in the southern San Joaquin
Valley of California. Environ. Entomol., 10: 6-9.
Anonymous. 1965. Red spider. Dept. Agric. N.S.W. Insect Leaflet No. 37. (cited from
Unwin, 1971).
Anonymous. 1974. Brewing. The New Encyclophaedia Britannica, Macropaedia.. Vol. 3.
pp.158-162. Encyclopaedia Britannica, Inc., Chicago.
Anonymous. 1976. The biological control of tomato pests. Grower's Bullentin No. 3.
Glasshouse Crops Research Institute, Littlehampton, West Sussex. 23pp.
Anonymous. 1985. Tasmania Year Book No. 19. Australian Bureau of Statistics, Tasmania
Office.

393
Anonymous. 1988.- Hops. The Australian Encyclopaedia. Vol. 4. pp. 1599, Australian
Geographic Society. fifth edition. Griffin Press, South Australia.
• Arcanin, B. 1958. The bionomics of the'.ied spider on beans. Rev. Appl. Entomol. (A),
49(1961): 510.
• Arnold, C.Y. 1960. Maximum-minimum temperatures as a basis for computing heat units.
American Society for Horticultural Science, 76: 682-692.
Bailey, J.C. and R.E. Furr. 1975. Reaction of 12 soybean varieties to the twospotted spider
mite. Environ. Entomol., 4: 733-734.
Bailey, J.C., R.E. Furr, B.W. Hanny and W.R. Meredith JR. 1978. Field populations of
twospotted spider mites on 16 cotton genotypes at Stoneville Mississippi USA
1977. J. Econ. Entomol. 71(6): 911-912.
Bailey, P. 1979. Effect of late season populations of twospotted mite on yield of peach
trees. J. Econ. Entomol., 72:8-10.
Bardner, R. and K.E. Fletcher. 1974. Insect infestations and their effects on the growth and
yield of field crops: A review. Bull. Entomol. Res., 64(1): 141-160.
Beck, S.D. 1965. Resistance of plants to insects. Ann. Rev. Entomol., 10: 207-232.
Beck, S.D. and L.M. Schoonhoven. 1980. Insect behavior and plant resistance. In: F.G.
Maxwell and P.R. Jennings (eds.), Breeding plants resistant to insects. pp.115-135.
John Wiley & Sons, Inc., New York.
Beime, B.P. 1967. Biological control and its potential. World Rev. Pest Control 6(1): 7-20.
Bell. A.A. 1986. Physiology of secondary products. In J.R. Mauney and J.M. Stewart (eds.),
Cotton Physiology. pp597-621. The Cotton Foundation, Memphis, TN.
Bellotti, A.C. 1985. Cassava. J W. Helle and M.W. Sabelis (eds.), Spider mites. Their
biology, natural enemies and control. Vol.1B. pp.333-338. Elsevier Science
Publishing B.V., Amsterdam, The Netherlands.
Bellotti, A.C. and J.M. Guerrero. 1977. Varietal resistance in cassava to Tetranychus
urticae and Mononychellus tanahoa. Revista Colombiana de Entomologia, 3(3/4):
87-91.

394
Bellotti, A.C. and D. Byrne. 1979. Host plant resistance to mite pests of cassava. In: J.G.
Rodriguez (Ed.), Recent Advances in Acarology, Vol.l. pp. 13-21. Academic Press,
New York
Bellotti, A.C. and K. Kawano. 1980. Breeding approaches in cassava. In: F.C. Maxwell
and P.R. Jennings (eds.), Breeding plants resistant to insects. pp.313-335. John
Wiley & Sons, Inc., New York_
Bellows, T.S., van Driesche, R.G. and J.S. Elkinton. 1992. Life-table construction and
analysis in the evaluation of natural enemies. A nnu. Rev. Entomol., 37: 587-614.
Bengston, M. 1969a. Estimating provisional values for intrinsic rate of natural increase in
population growth studies. Aust. J. Sci., 32: 24.
Bengston, M. 1969b. Effect of various temperatures and relative humidities on the
population growth potential of Tetranychus urticae (Koch). Queensland Dept.
Primary Ind. Div. Plant Ind. Bull. No. 497.
• Bengston, M. 1970. Effect_ of different varieties of the apple host on the development of
Tetranychus urticae (Koch). Queensland Dept. Primary Ind. Div. Plant Ind. Bull.
No. 530.
Bernstein, C. 1984. Prey and predator emigration responses in the acarine system
Tetranychus urticae - Phytoseiulus persimilis. Oecologia (Berlin), 61: 134-142.
• Birch, L.C. 1948. The intrinsic rate of natural increase in an insect population. J. Anim.
Ecol., 17: 15-26.
Bjorkman, C. and D.B. Anderson. 1990. Trade-off among antiherbivore defences in a South
. American blockberry (Rubus bogotensis). Oecologia, 85: 247-249.
BIttny, C. and V. Osvald. 1950. Jen. Zdravy a Jakostni Chmel. Brazda. Brazda, Praha,
368pp.
Blau, P.A., P. Feeny, L. Contardo and D.S. Robson. 1978. Allylglucosinolate and
herbivorous caterpillars: a contrast in toxicity and tolerance. Science, 200: 1296-8.
Bohm, H. 1961. Investigations on the spider mite biocoenosis (Tetranychidae) on fruit trees
and bushes in Austria. Rev. Appl. Entomol. (A), 51(1963): 472.

395
Boller, E.F. and R.J. Prokopy. 1976. Bionomics and management of Rhagoletis. Ann. Rev.
Entomol., 21: 223-246.
Botha, J.H., A.I. Greeff and A.J. Scholtz. 1989. Preliminary scre,:ning of cotton plants for
resistance to spider mite damage in South Africa. Phytophylactica, 21(4): 379-
383.
Boudreaux, H.B. 1958. The effect of relative humidity on egg-laying, hatching, and
survival in various spider mites. J. Insect Physiol., 2(1): 65-72.
Boudreaux, H.B. 1963. Biological aspects of some phytophagous mites. Ann. Rev. Entomol.,
8: 137-154.
Boulanger, L.W., 1958. The effect of European red mite feeding injury on certain metabolic
activities on Red Delicious apple leaves. Maine Agric. Exp. Stn. Bull., 570: 1-34.
Boyle, W.W. 1957. On the mode of dissemination of Tetranychus telarius. Proc. Haw.
Entomol. Soc., 16: 261268.
Briggs, J.B. and F.H. Alston. 1969. Sources of pest resistance in apple cultivars. Report of
East Mailing Research Station for 1968. p. 159.
Broersma, D.B., R.L. Bernard and WA-I. Lucicman. 1972. Some effects of soybean pubescence
on populations of the potato leafhopper. J..Econ. Entomol., 65: 78-82.
Brooks, S.N. 1962. Effectiveness of selection within Fuggle hops (Humulus lupsdus L.).
Crop Sci., 2: 5-10.
Brooks, S.N. and S.T. Likens. 1962. Variability of morphological and chemical quality ■
characters in flowers of male hops. Crop Sc., 2:189-192.
Brower, J.E., J.H. Zar and C.N. von Ende. 1990. Field and laboratory methods for general
ecology. 3rd ed. Wm.C. Brown Publishers, IA, USA. 237pp.
Brown, C.C., F. Nurdin, J.G. Rodriguez and D.F. Hildebrand. 1991. Inducible resistance of
soybean (var.'Williams') to twospotted spider mite (Tetranychus urticae Koch).
Journal of the Kansas Entomological Society, 64(4): 388-393.
Bryant, J.P., F.S. Chapin III and D.R. Klein. 1983. Carbon/ nutrient balance of boreal plants
in relation to vertebrate herbivory. Oikos, 40: 357-368.

396
Burbott, A.J. and V.D. Loomis. 1967. Effects of light and temperature on the monoterpenes
of peppermint. Plant Physiol., 42: 20-28.
Burbott, A.J. and W.D. Loomis. 1969. Evidence for metabolic turnover of monoterpenes in
peppermint. Plant Physiol., 44: 173-179.
BurdajeWicz, S. and W.W. Cone. 1972. Dependence on leaf density in hop plants of the
spread and growth of populations of the two-spotted spider mite (Tetranychns
urticae Koch). Roczniki Nauk Rolniczych, 2(2): 43-49. (cited from Rev. Appl.
Entomol. (A), 64(1976): 401).
Burgess, A.H. 1964. Hops botany, cultivation, and utilization. Interscience Publishers Inc.,
New York, 300pp.
Burstrom, H. 1943. Photosynthesis and assimilation of nitrate by wheat leaves. Ann. R.
Agric. Coll. Sweden, 11: 1-50.
Bush, H.L. and H.E. Brewbaker. 1956. Genetic variability of sugar beets in relation to
spider mite injury. J. Amer. Soc. Sugar Beet Tech., 9: 275-276.
Cagle, L.R. 1949. Life history of the two-spotted spider mite. Va. Agric. Exp. Stn., Tech.
Bull., 113: 1-31. (cited from Crooker, 1985).
Campbell, C.A.M. 1983. Antibiosis in hop (Humulus hfindus) to the damson-hop aphid,
Phorodon hiunuli. Entomol. Exp. Appl., 33: 57-62.
Campbell, R.C., K.N. Mobley and R.P. Marini. 1990. Growing conditions influence mite
• damage of apple and peach leaves. Hort. Science, 25: 445-448.
Campbell, W.F., B.A. Haws, K.H. Asay and J.D. Hansen. 1984. A review of black grass bug
resistance in forage grasses. J. Range Management, 37(4): 365-369.
Candella, M.I., E.G. Fisher and E.J. Hewitt. 1957. Molybdenum as a plant nutrient. X: Some
• factors affecting the activity of nitrate reductase in cauliflower plants grown with
different nitrogen sources and molybdenum levels in sand culture. Plant Physiol.,
32: 280-288.
Cant, R.R. 1960. J. Dept. Agric. South Australia, 63(7): 294-295. (cited from Unwin, 1971).
Cao, Y. 1989. Biological and ecological studies of two spotted spider mite and its control on
• hops in Tasmania. Masters thesis. University of Tasmania Hobart, Tasmania.

397
Carey, J.R. I982a. Demographic of the twospotted spider mite, Tetriznychus urticae Koch.
Oecologia, 52: 389-395.
C;arey, J.R. 1982b. Within-plant distribution of tetranychid mites on cotton. Environ.
Entomol., 11(4): 796-800.
Carey, J.R. and J.W. Bradley.1982. Developmental rates, vital schedules, sex ratios, and
life tables for Tetranychus urticae, T. turkestani - and T. pacificus (Acarina:
Tetranychidae) on cotton. Acarologia, 23: 333-345.
Carlson, E.C: 1969. Two varieties of soybeans tolerant of spider mites. Calif. Agric., 23(6):
15.
Carlson, E.C., B.H. Beard, R. Tarailo and R.L. Witt. 1979. Testing soybeans for resistance
to spider mites. Calif. Agric., 33: 9-11.
Caswell, H. 1982. Life history theory and the equilibrium status of populations. Amer. -
Nat., 120: 317-339.
Cates, R.G. 1980. Feeding patterns of monophagous, oligophagous and polyphagous insect
herbivores: the effect of resource abundance and plant chemistry. Oecologia, 46:
• 22-31.
Chandrasekharan, N.R., K. Navakodi, B.K. Shetty and N.M. Ramaswamy. 1964. A
• preliminary study on the varietal resistance in castor to attack by mites. Indian
Oil Seed J., 8: 46-48.
Chant, D.A. 1961. An experiment on the biological control of Tetranychus telarius (L.) in a
green house, using Phytoseizzlus persimilus A.H. Can. Entomologist, 93: 437-443.
Chaplin, C.E.,- L.P. Stoltz and J.G. Rodriguez. 1968. The inheritance of resistance to the
two-spotted spider mite Tetranychus urticae Koch in strawberries. Proc. Amer.
Soc. Hort. Science, 92: 376-380.
Chaplin, C.E., L.P. Stoltz and J.G. Rodriguez. 1970. Breeding behaviour of mite resistant
strawberries. J. Amer. Soc. Hort. Science, 95: 330-333.
Chazeau, J. 1985. Predaceous Insects. In W. Helle and M.W. Sabelis (eds.), Spider mites.
Their biology, natmral enemies and control. Vol.1B. pp. 211-246. Elsevier Science
Publishing B.V., Amsterdam, The Netherlands.

398
Chew, R.M. 1974. Consumers as regulators of ecosystems: and alternative to energetics.
Ohio J. Science, 74: 359-370.
Chiang, H.S. and D.M. Norris. 1985. Expression and stability of soybc,:n resistance to
agromyzid beanflies. Insect Sci. Applic., 6: 265-270.
Childress, J.D., A.G. Douglas and M.F. Schuster. 1976. Inheritance of resistance to
Tetranychus urticae. Proc. 1976. Beltwide Cotton Prod. Res. Conf.
Clark, R.J. and R.C. Menary. 1980. The effect of irrigation and nitrogen on the yield and
composition of peppermint oil (Mentha piperita L). Aust. J. Agric. Res., 31: 489-
498.
Cole, L. 1954. The population consequences of life history phenomena. Q. Rev. Biol., 29:
103-137.
Coley, P.D., J.P. Bryant and F.S. Chapin,III. 1985. Resource availability and plant
antiherbivore defense. Science, 230: 895-899.
Coley-Smith, J.R..1963. Pathology section. Rep. Dept. Hop Res. Wye Coll. for 1962, 17-19.
(cited from Neve, 1991).
Collins, R.D. and D.C. Margolies. 1991. Possible ecological consequences of heterospecific
mating behavi- or ,in two tetranychid mites. Exp. Appl. Acarology, 13(2): 97-105.
Cone, W.W. 1975. Crown-applied systemic acaricides for control of two-spotted spider
mite and hop aphid on hops. J. Econ. Entomol., 68: 684-686.
Cone, W.W. 1985. Mating and chemical communication. In W. Helle and M.W. Sabelis
(eds.), Spider mites. Their biology, natural enemies and control. Vol.1A. pp. 243-
251. Elsevier Science Publishing B.V., Amsterdam, The Netherlands.
Cone, W.W., L.M. McDonough, J.C. Maitlen and S. Burdajewicz. 1971. Pheromone studies of
the two-spotted spider mite, Tetranychus urticae Koch. I. Evidence of a sex
pheromone. J. Econ. Entomol., 64: 355-358.
Cone, W.W., L.C. Wright and T.E. Wildman. 1986. Reproduction by overwintered,
Tetranychus urticae (Acari: Tetranychidae) on hops. Ann. Entomol. Soc. Amer., 79:
837-840.

399
Craig, T.P., P.W. Price and J.K. Itami. 1986. Resource regulation by a stem-galling sawfly
on the arroyo willow. Ecology, 67(2): 419-425.
Crnham, J.E. 1982. Integrated control of damson-hop aphid, Phorodon humuli, on English
hops: a review of recent work. Agric. Environ., 7: 63-71.
Cranham, J.E. 1985. Hop. In W. HeIle and M.W. Sabelis (eds.), Spider mites. Their
biology, natural enemies and control. VoL1B. pp. 367-370. Elsevier Science
Publishing B.V., Amsterdam, The Netherlands.
Crooker, A. 1985. Embryonic and juvenile development. In W. HeIle and M.W. Sabelis
(eds.), Spider mites. Their biology, natural enemies and control. Vol.1A. pp. 149-
163. Elsevier Science Publishing B.V., Amsterdam, The Netherlands.
Croteau, R., A.J. Burbott and W.D. Loomis. 1972. Apparent energy deficiency in mono-and
sesqui-terpene biosynthesis in peppermint. Phytochemistry, 11: 2937-2948.
Crozier, R.H. 1985. Adaptive consequences of male-haploidy. In W. Helle and M.W.
Sabelis (eds.), Spider mites. Their biology, natural enemies and control. VoLlA.
pp. 201-222. Elsevier Science Publishing B.V., Amsterdam, The Netherlands.
Curtis, O.F. 1936. Leaf temperatures and the cooling of leaves by radiation. Plant
Physiol., 11: 343-364.
Dabrowski, Z.T.1972. Methods in the study on plant resistance to spider mites. Zesz. Probl.
post. nauk. Roln., 129: 303-319. (cited from De Ponti, 1977b)
Dabrowski, Z.T. and J.G. Rodriguez. 1971. Studies on resistance of strawberries to mites. 3.
Preference and non-preference responses of Tetranychus urticae and T. turkestani to
essential oils in foliage. J. Econ. Entomol., 64: 387-391.
Dabrowski, Z.T. and J.G. Rodriguez. 1972. Gustatory responses of Tetranych us urticae Koch
to phenolic compounds of strawberry foliage. Zeszyty Prob. Post Nauk Roln., 127:
69-78. (cited from Larson and Berry, 1984).
Dabrowski, Z.T., J.G. Rodriguez and C.E. Chaplin. 1971. Studies in the resistance of
strawberries to mites. IV. Effect of season. J. Econ. Entomol., 64: 806-809.
DaCosta, C.P. and C.M. Jones. 1971. Cucumber beetle resistance and mite susceptibility
controlled by the bitter gene in Cucumis sativus L. Science, 172: 1145-6.

400
Dahms, R.G. 1972. Techniques in the evaluation and development of host-plant resistance.
J. Environ. Qual., 1: 254-259.
Dahms, R.G. and R.H. Painter. 1940. Rate of reproduction of the pea aphid on different
alfalfa plants. J. Econ. Entomol., 33: 482-485.
Davies, J.R. 1973. The hop industry: Part one. Tasmania Journal of Agriculture, 44(3): 151- _
156.
Davis, J.J. 1961. Red spider mites on strawberries. Queensland Agric. J. 87(10): 619-620.
Day, S. 1993. A shot in the arm for plants. New Scientist, 1855: 36-40.
Delwiche, C.C. 1951. The assimilation of ammonium and nitrate ions by tobacco plants. J.
Biol. Chem., 189: 167-175.
De Ponti, O.M.B. 1977a. Resistance in Cuctunis sativus L. to Tetranychus urticae Koch. 1.
The role of plant breeding in integrated control. Euphytica, 26: 633-640.
De Ponti, O.M.B. 1977b. Resistance in Cucumis sativus L. to Tetranychus urticae Koch. 2.
Designing a reliable laboratory test for resistance based on aspects of the host-
parasite relationship. Euphytica, 26: 641-654.
De Ponti, O.M.B. 1980. Resistance of Cuounis sativus to Tetranychus urticae 6. comparison
of near isogenic bitter and non-bitter varieties for resistance. Euphytica, 29(2):
261-267.
De Ponti, O.M.B. 1985. Host plant resistance and its manipulation through plant breeding.
In: W. He lie and M.W. Sabelis (eds.), Spider mites. Their biology, natural
enemies and control. Vol .1B. pp. 395-403. Elsevier Science Publishing B.V.,
Amsterdam, The Netherlands.
De Ponti, O.M.B. and H. Inggamer. 1976. Technical note: an improved leaf disk technique
for biotests. Euphytica, 25: 129-130.
DeAngelis, J.D., R.E. Berry and G.W. Krantz. 1983a. Evidence for spider mite (Acari:
Tetranychidae) injury-induced leaf water deficits and osmotic adjustment in
peppermint. Environ. Entomol., 12(2): 336-339.
DeAngelis, J.D., R.E. Berry and G.W. Krantz. 1983b. Photosynthesis, leaf conductance, and
leaf chlorophyll content in spider mite (Acari: Tetranychidae)-injured
peppermint leaves. Environ. Entomol., 12(2): 345-348.

401
DeAngelis, J.D., A.B. Mann, R.E. Berry and G.W. Krantz. 1983c. Effects of spider mite
(Acari: Tetranychidae) injury on essential oil metabolism in peppermint. Environ.
Entomol., 12(2): 522-527.
Deevey, E.S. 1947. Life table for natural populations of animals. The Quarterly Review of
Biology, 22: 283-314.
Dempster, J.P. 1976. Animal population ecology. Academic Press, London. 155pp.
Dent, D. 1991. Insect Pest Management. CAB International. Oxon, UK. 604pp.
Dicke, M. and H. Dijkman. 1992. Induced defence in detached uninfested plant leaves:
effects on behaviour of herbivores and their predators. Oecologia, 91: 554-560.
Dicke, M. and M.W. Sabelis. 1988. Infochemical terminology: based on cost-benefit
analysis rather than origin of compounds? Functional Ecology, 2: 131-139.
Dittrich, V. 1971. Electron-microscopic studies of the respiratory mechanism of spider
mite eggs. Ann. Entomol. Soc Amer., 64: 1134-1143.
Duschin, , I. 1967. Research into the biology and control of the grape vine spider mite
(Tetranychus urticae Koch). Rev. Hort. Vit., 16(3): 90-93.
Dyer, M.I. 1975. The effects of red-winged blackbirds (Agelaius phoeniceus L.) on biomass
production of corn grain (Zen mays L.). J. appl. Ecol., 12: 719-726.
East, D.A. and J.V. Edelson. 1990. Evaluation of watermelon cultivars for resistance to
spider mites. Research Report- Agricultural Experiment Station, Division of
• Agriculture, Oklahoma State University. 4pp.
East, D.A., J.V. Edelson and M.K. Harris. 1992. Evaluation of screening methods and
search for resistance in muskmelon, Cucumis melo L., to the twospotted spider
• mite, Tetranychus urticae Koch. Crop Protection, 11(1): 39-44.
Edwards, P.J. and S.D. Wratten. 1985., Induced plant defences against insect grazing fact or
artefact?. Oikos, 44: 70-74.
English-Loeb, G.M. and R. Karban. 1991. Consequences of mite feeding injury to beans on the
fecundity and survivorship of the two-spotted spider mite (Acari:
Tetranychidae). Exp. Appl. Acarology, 11: 125-136.
Esau, K. 1965. Plant Anatomy. John Wiley ana Sons, Inc., New York. 767pp.

402
Farrell, J.A.K. 1977. Plant resistance to insects and the selection of resistant lines. N.Z.
Entomol., 6: 244-261.
Feeny, P. 1974. Plant apparency and chemical defense. Recent Adv. Phytochem., 10: 1-40.
Feeny, P.P. 1975. Biochemical coevolution between plants and their insect herbivores. In:
L.E. Gilbert and P.H. Raven (eds.), Coevolution of Animals and Plants. pp. 3-19.
University of Texas Press, Austin.
Fenner, T.L. 1962. J. Dept. Agric. South Australia, 66(3): 116-119. (cited from Unwin, 1971).
Ferro, D.N. and R.B. Chapman. 1979. Effects of different constant humidities and
temperatures on twospotted spider mite egg hatch. Environ. Entomol., 8: 701-705.
Firempong, S. 1988. Components of resistance to Aphis craccivora in some cowpea cultivars.
Entomol. Exp. Appl., 48:241-246.
Fleschner, C.A. 1952. Host-plant resistance as a factor influencing population density of
citrus red mites on orchard trees. J. Econ. Entomol., 45:687-695.
Foott, W.H. 1964. Geotactic responses of the two-spotted spider mite, Tetranychus urticae
Koch (Acarina: Tetranychidae). Proc. Ent. Soc. Ont., 96: 106-108.
Fowler, S.V. and J.H. Lawton. 1985. Rapidly induced defenses and talking trees: the
devil's advocate position. Amer. Nat., 126: 181-195.
Fraenkel, G. 1959. The raison d'etre of secondary plant substances. Science, 129: 1466-70.
Fraenkel, G. 1969. Evaluation of our thoughts on secondary plant substances. Entomol. Exp.
App!., 12: 473486.
Frear, D.S. and R.C. Burrell. 1958. The assimilatipn of N 15 from labeled hyponitrite by
soybean leaves. Plant Physiol., 33: 105.109.
French, S.A.W. and E.C. Humphries. 1977. The effect of partial defoliation on yield of
sugar beet. Ann. Appl, Biol., 87(2): 201-212.
Funderburk, J., L. Higley and G.D. Buntin. 1993. Concepts and directions in arthropod pest
management. In: D.L. Sparks (Ed.), Advances in Agronomy, Vol.51. pp. 125-172.
Academic Press, Inc., San Diego, California.
Gullun, R.L. 1972. Genetic interrelationships between host plants and insects. J. Environ.
Qu I., 1:259-265.

403
Gallun, R.L. and G.S. Khush. 1980. Genetic factors affecting expression and stability of
resistance. In: F.G. Maxwell and P.R. Jennings (eds.), Breeding plants resistant to
insects. pp.63-85. John Wiley & Sons ., Inc., New York.
Callun, R.L., J.J. Roberts, R.E. Finny and F.L. Patterson. 1973. Leaf pubescence of field
grown wheat: A deterrent to oviposition by the cereal leaf beetle. J. Environ.
Qual., 2: 333-334.
Gallun, R.L., K.J. Starks and W.D. Guthrie. 1975. Plant resistance to insects attacking
cereals. Ann. Rev. Entomol., 20: 337-357.
Gasser, R. 1951. Contributions to knowledge of the common spider mite, Tetranychus
tetanus first communication: morphology, anatomy, biology and ecology. Rev.
App!. Entomol. (A), 41(1953): 398.
Gates, G.M., R. Alderfer and E. Taylor. 1968. Leaf temperatures of desert plants. Science
(Wash., D.C.), 159: 994-995.
Gentile, A.G., R.E. Webb and A.K. Stoner. 1969. Lycopersicon and Satan urn spp. resistant to
the carmine and twospotted spider mite. J. Econ. Entomol., 62: 834-836.
Gilbert, J.C., J.T. Chinn and J.S. Tanaka. 1966. Spider mite tolerance in multiple disease
resistant tomatoes. Proc. Amer. Soc. Hort. Science, 89: 559-562.
Gilbert, L.E. 1971. Butterfly-plant coevolution: Has Passiflora adenopoda won the
selectional race with Heliconiine butterflies? Science, 172: 585-586.
Glasscock, H.H. 1956. Diseases, in hop growing and drying (ed. A.H. Burgess). Min. A
Fish and Food, Bulletin 164. HMSO, London, 41-51.
Good, D.E. and J.C. Snyder. 1988. Seasonal variation of leaves and mite resistance of
Lycopersicon interspecific hybrids. Hort. Science, 23(5): 891-894.
Gould, F. 1978. Predicting the future resistance of crop varieties to pest popualations a case
study of mites and cucumbers. Environ. Entomol., 7(5): 622-626.
Gould, H.J. and J.D.R. Vernon. 1978. Biological control of Tetranychus urticae (Koch) on
protected strawberries using Phytoseiulus persimilis Athias-Henriot. Plant
Pathol., 27: 136-139.

404
Green, R.H. 1966. Measurement of non-randomness in spatial distributions. Res. Popul.
Ecol., 8: 1-7.
Green, C.P. 1986. Gas-liquid chromatography, hop oils and variety identification. c: of
Eng. Hops Ltd, 6(3): 10-11.
Green, T.R. and C.A. Ryan. 1972. Wound-induced proteinase inhibitor in plant leaves: a
possible defense mechanism against insects. Science, 175: 776-777.
Gunson, F.A. and R.F.N. Hutchins. 1982. Absence of Farnesol in Strawberry Fragaria
ananassa and Hop Hum ulus lupulus Foliage. J. Chem. Ecol., 8(4): 785-796.
Gutierrez, J. and W. HeIle. 1985. Evolutionary changes in the tetranychidae. In: W. HeIle
and M.W. Sabelis (eds.), Spider mites. Their biology, natural enemies and control.
Vo1.1A. pp. 91-107. Elsevier Science Publishing B.V., Amsterdam, The
Netherlands.
Hageman, R.H. and D. Flesher. 1960. Nitrate reductase activity in corn seedlings as
affected by light and nitrate content of the nutrient media. Plant Physiol., 35: 635-
641.
Hall, F.R. and D.C. Ferree. 1975. Influence of twospotted spider mite populations on
photosynthesis of apple leaves. J. Econ. Entomol., 68: 517-520.
Hamlen, R.A. 1978. Biological control of spider mites on greenhouse ornamentals using
predaceous mites. Proc. Fla. Hortic. Soc, 91: 247-249.
Hamlen, R.A. 1980. Report of Phytoseiulus macropilis management of Tetranychus urticae
ongreenhouse-grown Dieffenbachia. In: N.W. Hussey (Ed.), Proc. Working Group
Integrated Control in Greenhouses, Darmstadt, 1982, Bull. SROP/ WPRS,
1983/ VI/ 3, pp. 65, 74.
Harborne, J.B. 1984. Phytochemical Methods: A guide to modern techniques of plant
analysis. 2nd ed. Chapman and Hall, London and New York. 288pp.
Haukioja, E. 1980. On the role of plant defences in the fluctuation of herbivore
populations. Oikos, 35: 202-213.

405
Haukioja, E. and P. Niemela. 1979. Birch leaves as a resource for herbivores: seasonal
occurrence of increased resistance in foliage after mechanical damage of adjacent
leaves. Oecologia (Berlin), 39: 151-159.
Haukioja, E. and S. Hanhimaki. 1985. Rapid wound-induced resistance in white birch
(Betula pubescens) foliage to the geometrid Epirrita autumnata: a comparison of
trees within and outside the outbreak range of the moth. Oecologia, 65: 223-228.
Hazan, A., U. Gerson and A.S. Tahori. 1973. Life history and life tables of the carmine
spider mite. Acarologia, 15: 414-440.
Hedin, P.A. 1977. Host Plant Resistance to Pests. ACS Symposium Series No. 62. Amer.
Chemical Soc. Washington, D.C. 286pp.
Hedin, P.A. 1983. Plant Resistance to Insects. ACS Symposium Series No. 208. Amer.
Chemical Soc. Washington, D.C. 375pp.
HeIle, W. and W.P.J. Overmeer. 1973. Variability in tetranychid mites. Ann. Rev.
Entomol., 18: 97-120.
HeIle, W. and W.P.J. Overmeer. 1985. Rearing techniques. In: W. HeIle and M.W. Sabelis
(eds.), Spider mites. Their biology, natural enemies and control. Vol.1A. pp. 331-
335. Elsevier Science Publishing B.V., Amsterdam, The Netherlands.
Henderson, C.F. and H.V. !VicBurnie. 1943. Sampling technique for determining populations
. of citrus red mite and its predators. Washington, D.C., U.S.D.A. Cir., 671: 1-11.
(cited from Readshaw, 1975).
Henneberry, T.J. 1962. The effect of host-plant nitrogen supply and age of leaf tissue on the
fecundity of the two-spotted spider mite. J. Econ. Entomol., 55: 799-800.
Herbert, H.J. 1981. Biology, life tables, and innate capacity for increase of the two-spotted
spider mite, Tetranychus urticae (Acarina: Tetranychidae). Can. Entomol., 113:
371-378..
Herrns, D.A. and W.J. Mattson. 1992. The dilemma of plants: to grow or defend. The
Quarterly Review of Biology, 67: 283-335.
Herne, D.C. 1968. Some responses of the European red mite Panonychus ulmi, to immersion
in water. Can. Entomol., 100(5): 540-541.

406
Herne, D.H.C., J.E. Cranham and M.A. Easterbrook. 1979. New acaricides to control
resistant mites. In: J.G. Rodriguez (Ed.), Recent Advances in Acarology, Vol.l. pp.
95-104. Academic Press, New York
Hildebrand, D.F., J.G. Rodriguez, G.C. Brown, K.T. Luu and C.S. Volden. 1986.
Peroxidative responses of leaves in two soybean genotypes injuries by twospotted
spider mites (Acari: Tetranychidae). J. Econ. Entomol., 79(6): 1459-1465.
Hollingsworth, C.S. and R.E. Berry. 1982. Twospotted spider mite (Acari: Tetranychidae)
in peppermint: population dynamics and influence of cultural practices. Environ.
Entomol., 11: 1280-1284.
• Horber, E. 1980. Types and classification of resistance. In: F.G. Maxwell and P.R. Jennings
(eds.), Breeding plants resistant to insects. pp.15-21. John Wiley & Sons, Inc., New
York.
Horsburgh, R.L. and D. Asquith. 1968. Initial survey of arthropod predators of the
European red mite in south-central Pennsylvania. J. Econ. Entomol., 61: 1752-1754.
Howeler, R.H. and L.F. Cadavid. 1983. Accumulation and distribution of dry matter and
nutrients during a 12-month growth cycle of cassava. Field Crops Res., 7: 123-139.
Hoxie, R.P., S.G. Wellso and J.A. Webster. 1975. Cereal leaf beetle response to wheat
trichome length and density. Environ. Entomol., 4: 365-370.
Hoy, M.A. 1985. Almonds (Califonia). In: W. Helle and M.W. Sabelis (eds.), Spider mites.
Their biology, natural enemies and control. Vol.1B. pp. 299-310. Elsevier Science
Publishing B.V., Amsterdam, The Netherlands.
Hoyt, S.C., L.K. Tanigoshi and R.W. Browne. 1979. Economic injury level studies in
relation to mites on apple. In: J.G. Rodriguez (Ed.), Recent Advances in Acarology,
Vol.l. pp. 3-12. Academic Press, New York
Huffaker, C.B. and C.H. Spitzer. 1950. Some factors affecting red mite populations cn
pears in California. J. Econ. Entomol., 43: 819-31.
Huffaker, C.B., M. Van de Vrie and J.A. McMurtry. 1969. The ecology of tetranychid mites
and their natural enemies. Annu. Rev. Entomol., 14: 125-174.

407
Hughes, P.R., R.E. Hunter and T.F. Leigh. 1966. A light-weight leaf cage for small
arthropods. J. Econ. Entomol, 59: 1024-1025.
Hussey, N.W. and N.E.A. Scopes. 1985. Greenhouse Vegetables (Britain). In: W. Helle and
M.W. Sabelis (eds.), Spider mites. Their biology, natural enemies and control.
Vol.1B. pp. 285-297. Elsevier Science Publishing B.V., Amsterdam, The
Netherlands.
Hussey, N.W. and W.J. Parr. 1963. Dispersal of the glasshouse red spider mite
Tetranychus urticae Koch (Acarina, Tetranychidae). Entomol. Exp. Appl., 6: 207-
214.
lwao, S. 1968. A new regression method for analyzing the aggregation pattern of animal
populations. Res. Popul. Ecol., 10: 1-20.
Jary, C.L. 1955. The A-Plus Certification Scheme for hops. Association of Growers of the
New Varieties of Hops, Annual Booklet: 35-37.
Jeppson, L.R., H.H. Keifer and E.W. Baker. 1975. Mites injurious to economic plants. Univ.
of California, Berkeley.. 614pp.
Jermy, T. 1976. The Host-Plant in Relation to Insect Behavior and Reproduction. Plenum
Press, New York. 322pp.
Jesiotr, J., Z.W. Suski and T. Badowska-Czubik. 1979. Food quality influences on a spider
mite population. In: J.G. Rodriguez (Ed.), Recent Advances in Acarology, Vol.l. pp.
189-196. Academic Press, New York.
Johnson, H.B. 1975. Plant pubescence: An ecological perspective. The Botanical Review,
41(3): 233-258.
Johnson, N.D., L.P. Ringney and B.L. Bentley. 1989: The short-term induction of alkaloid
production in lupines: differences between N2 fixing and nitrogen-limited plants. J.
Chem. Ecol., 15: 2425-2434:
Jones, V.P. 1990. Sampling and dispersion of the twospotted spider mite (Acari:
Tetranychidae) and the western orchard predatory mite (Acari: Phytoseiidae) on
tart cherry. J. Econ. Entomol., 83: 1376-1380.

408
Jones, V.P. and M.P. Parrella. 1984. Intratree regression sampling plans for the citrus red
mite (Acari: Tetranychidae) on lemons in Southern California. J. Econ. Entomol.,
77: 810-813.
Kac, M. 1963. Der Einfluss der Februartemperatur auf die Dynamik der
Spinnmilbenpopulation in der Hopfenkultur. Mitt. schweiz. ent. Ges., 36: 58-59.
Kamali, K., F.F. Dicke and W.D. Guthrie. 1989. Resistance-susceptibility of maize
genotypes to artificial infestations by twospotted spider mites. Crop Sci., 29(4):
936-938.
Kamel, S.A. and F.Y. Elkassaby. 1965. Relative resistance of cotton varieties in Egypt to
spider mites, leafhoppers, and aphids. J. Econ. Entomol., 58: 209.
Kantaratanakul, S. and J.G. Rodriguez. 1979. Nutritional studies in Tetranycluis tirticae.
II. Development of a meridic diet. In: J.G. Rodriguez (Ed.), Recent Advances in
Acarology, Vol.l. pp. 405-411. Academic Press, New York.
Karban, R. 1986. Induced resistance against spider mites in cotton: field verification.
Entomol. Exp. Appl., 42: 239-242.
Karban, R. and J.R. Carey. 1984. Induced resistance of cotton seedlings to spider mites.
Science, 225: 53-54.
Karban, R. and G.M. English-Loeb. 1988. Effects of herbivory and plant conditioning on the
population dynamics of spider mites. Exp. Appl. Acarology, 4: 225-246.
Karban, R. and J.H. Myers. 1989. Induced plant responses to herbivory. Annu. Rev. Ecol.
Syst., 20: 331-348.
Karban, R., R. Adamchak and W.C. Schnathorst. 1987. Induced resistance and
interspecific competition between spider mites and a vascular wilt fungus. Science,
235: 678-680. .
Kennedy, C.G. 1978. Recent advances in insect resistance of vegetables and fruit crops in
North America. Bull. Entomol. Soc. Amer., 24: 375-384.
Kennedy, G.G. and D.R. Smitley. 1985. Dispersal. In: W. Helle and M.W. Sabelis (eds.),
Spider mites. Their biology, natural enemies and control. Vol.1A. pp. 233-251.
Elsevier Science Publishing B.V., Amsterdam, The Netherlands.

409
Kennedy, J.S., C.O. Booth and W.J.S. Kershaw. 1961. Host findings by aphids in the field.
111. Visual attraction. Ann. Appl. Biol., 49: 1-21.
Keppel, H. 1989. Pomological description of old cider apple varieties from Styria,
Austria. Mitteilungen Klosterneuburg, Rebe und Wein, Obstbau und
Fruchteverwertung, 39(1): 13-20.
Keyworth, W.G. 1942. Verticillium wilt of the hop (Hum,his Ittpulus). Ann. Appl. Biol.,
29: 346-357.
Keyworth, W.G. 1945. Three important hop diseases. J. Min. Agric., 51: 556-561.
Khan, Z.R., J.T. Ward and D.M. Norris. 1986. Role of trichomes in soybean resistance to
cabbage looper, Trichoplusia iii. Entomol. Exp. Appl., 42: 109-117.
Kidd, NA.C., 51: 556-561. 1985. The role of the host plant in the population dynamics of
the large pine aphid, Cinara pinea. Oikos, 44: 114-122.
Kielkiewicz, M. 1988. Susceptibility of previously damaged strawberry plants to mite
attack. Entomol. Exp. Appl., 47: 201-203.
Kishaba, A.N., V. Voth, A.F. Howland, R.S. Bringhurst and H.1-1. Toba. 1972. Twospotted
spider mite resistance in California strawberries. J. Econ. Entomol., 65: 117-119.
Klostermeyer, E.C. and W.B. Rasmussen. 1953. The effect of soil insecticide treatments on
mite population and damage. J. Econ. Entomol., 46: 910-12.
Klubertanz, T.H., L.P. Pedigo and R.E. Carlson. 1990. Effects of plant moisture stress and
rainfall on population dynamics of the twospotted spider mite (Acari:
Tetranychidae). Environ. Entomol., 19(6): 1773-1779.
Knipmeyer, J.W., R.H. Hageman, E.B. Earley and R.D. Seif. 1962. Effect of light intensity
on certain metabolites of the corn plant (Zea tnays L.). Crop Sci., 2(1): 1-5.
Knipping, P.A., C.G. Patterson, D.E. Knavel and J.G. Rodriguez. 1975. Resistance of
cucurbits to twospotted spider mite (Acari, Tetranychidae). Environ. Entomol., 4:
507-508.
Kooistra, E. 1971. Red spider mite tolerance in cucumber. Euphytica, 20: 47-50.

410
Kogan, M. and J. Paxton. 1983: Natural inducers of plant resistance to insects. In: P.A.
Hedin (ed.), Plant Resistance to Insects. pp.153-171. American Chemical Society,
Washington D.C.
Krainacker, D.A. and J.R. Carey. 1990. Spatial and temporal dynamics of two spotted
spider mites, Tetra. nychus urticae Koch (Acari, Tetranychidae). J. Appl. Entomol.,
109: 481-489.
Kramer, P.J. 1983. Water relations of plants. Academic Press, Orlando, Florida, U.S.A.
Kremheller, H.Th. 1988. Pflanzenschutz im Hopfenbau. Jahresbericht 1987, Hans-Pfulf-
Institut, 62-86. (cited from Neve, 1991).
Kumar, A. and M.C. Joshi. 1972. The effects of grazing on the structure and productivity of
the vegetation near Pilani, Rahasthan, India. J. Ecol., 60: 665-674.
Labanowska, B.H. and E. Pala. 1986. The intensity of red mite Tetranychidae infestation
of some new red raspberry cultivars. Pr. Inst. Sadow. Kwiaciarstwa
Skierniewicach Ser. A, 26(0): 83-88.
Laing, J.E. 1969. Life history and life table of Tetranychus urticae Koch. Acarologia, 9: 32-
* 42.
Larson, K.C. and R.E. Berry. 1984. Influence of peppermint phenolics and monoterpenes on
twospotted spider mite (Acari: Tetranychidae). Environ. Entomol., 13: 282-285.
Larsson, S. and C. Ofunart. 1988. Leaf age and larval performance of the leaf beetle
• Paropsis a totnaria. Ecol. Entomol., 13: 19-24.
Laughlin, R. 1965. Capacity for increase: a useful,population statistic. J. Anim. Ecol., 34:
• 77-91.
Legget, G. 1987. Mite control in Hops. In: W.G. Thwaite (ed.), Proceeding of the
Sympo*Sium on Mite Control in Horticultural Crops. Orange, July 29-30, 1987, pp 6-
7, Department of Agriculture New South Wales.
Lehr, R. and F.F. Smith. 1957. The reproductive capacity of three strains of the two-
spotted spider mite complex. J. Econ. Entomol., 50(5): 634-636.
Leska, W., Z.W. Suski and R. Leski. 1964. The infestation of various strawberry varieties
by the strawberry mite (Steneotarsonetn us pallidus Banks) and by the two-spotted

411
mite (Tetranychus telarius L.) )Polish, English summary). Prace Inst.
Sadownictwa 8: 213-226.
Leszcyns10. B., L.C. Wright, W.W. Cone and S.T. Kenny. 1988. Hop leaf phenolics and
resistance to the twospotted spider mite. J. Agri. Entomol., 5(4): 257-266.
Levin, D.A. 1973. The role of trichomes in plant defense. The Quarterly Review of
Biology, 48: 3-15.
Levin, D.A. 1976. The chemical defences of plants to pathogens and herbivores. Ann. Rev.
Ecol. Syst., 7:121-159.
Lewontin, R.C. 1965. Selection for colonizing ability. In: H.G. Baker and G.L. stebbins
(eds.), The genetics of Colonizing Species. pp. 77-94. Academic Press, New York.
Li, S.Y. and R. Harmsen. 1993. Effects of maternal density and age on the daily fecundity
and offspring sex ratio in Tetranycluis urticae Koch. Can. Entomologist, 125: 633-
635.
Lienk, S.E., P.J. Chapman and O.F. Curtis. 1956. Responses of apple trees to mite
infestations: II. J. Econ. Entomol., 49(3): 350-353.
Liesering, R. 1960. Contribution on the phytopathological mode of action of T. telarius.
Rev. Appl. Entomol. (A), 50(1962): 107.
Linke, W. 1953:Investigation of the biology and epidemiology of the common . spider mite,
Tetranychus althaeae v. Hanst. with particular consideration of the hop as the
host. Hoefchen-Briefe (Eng. Ed.), 6: 181-232.
Long, S.P. and J.E. Hallgren. 1985. Measurement of CO2 assimilation by plants in the field
and the laboratory. In J. Coombs, D.O. Hall, S.P. Long and J.M.O. Scurlock (Eds.),
Techniques in Bioproductivity and Photosynthesis. pp. 62-94. Pergamon Press,.
Oxford.
Loomis, R.S., S.D. Beck and J.F. Stauffer. 1957. The European corn borer, Pyrausta nubilalis
(Hubn.), and its principal host plant. V. A chemical study of host plant resistance.
Plant Physiol., 32: 379-385.
Loper, G.M. 1968. Effect of aphid infestation on the coumestrol content of alfalfa varieties
differing in aphid resistance. Crop Sci., 8: 104-106. —

412
Lotka, A.J. 1924. Elements of Physical Biology. Williams & Wilkins, Baltimore, 460pp.
Lowe; H.J.B. 1974. Testing sugar beet for aphid-resistance in the glasshouse: a method and
some limiting factors. Z. Angew. Entomol., 76: 311-321.
Luczynski, A., M.B. Isman, D.A. Raworth and C.K. Chan. 1990. Chemical and
morphological factors of resistance against the twospotted spider mite in beach
strawberry. J. Econ. Entomol., 83(2): 564-569.
Macdonald, A.J., R. Snetsinger and R. Craig. 1971. Techniques for evaluating host
resistance to the twospotted spider mite, Tetranychus urticae. Melsheimer ent.
Ser., 8: 1-4.
Macdonald, A.J., R. Snetsinger and P. Crum 1972. Inheritance to resistance in Solanium to
the twospotted spider mite. J. Econ. Entomol., 65: 761-764.
Magie, R.O..1942. The epidemiology and control of downy mildew on hops. Tech. Bull.
N.Y. State Agric. Expt. Sta., 267: 1-48.
Maier, J. and L. Narziss. 1979. The hop variety Perle. Brauwelt, 36: 1260-1263.
Mansour, F. 1990. Species presence and density of tetranychid and phytoseiid mites in
unsprayed and sprayed apple orchards in northern Israel. Phytoparasitica, 18(2):
135-141.
Margolies, D.C. and C.C. Kennedy. 1985. Movement of the two-spotted spider mite
Tetranychus urticae Koch (Acari: Tetranychidae), among hosts in a corn-peanut
agroecosystem. Entomol. Exp. Appl., 37: 55-61.
Markkula, M., K. Roukka and K. Tuttanen. 1969. Reproduction of Myzus persicae (Sulz.)
and Tetranychus telarius (L.) on different chrysanthemum cultivars. Ann. Agr.
Fenn., 8: 175-183.
Marquis, R.J. 1984. Leaf herbivores decrease fitness of a tropical plant. Science, 226: 537-
539.
Martens, B. and J.T. Trumble. 1987. Structural and photosynthetic compensation for
leafminer (Diptera: Agromyzidae) injury in lima beans. Environ. Entomol., 16: 374-
378. •

413
Martin, C.A., C.A. Richard and S.D. Hensley. 1975. Host resistance to Diatrara
saccharalis (F.): Relationship of sugarcane internode hardness to larval damage.
Environ. Entomol., 4: 687-688.
Masis, C.E. and H. Aguilar. 1990. Resistance of three varieties of strawberry (Fragaria
sp.) to the mite Tetranychus urticae Koch (Acarina-Tetranychidae). Turrialba,
40(2): 205-208.
Mathews, G.A. 1984. Pest management. Longman, Harlow, United Kingdom. 231pp.pp.
367-370.
Mattson, W.J. and ND. Addy. 1975. Phytophagous insects as regulators of forest primary
production. Science, 190: 515-522.
Maxwell, F.G., J.N. Jenkins and W.L. Parrot. 1972. Resistance of plants to insects. Adv.
Agron., 24: 187-265.
Maxwell, F.G. and P.R. Jennings. 1980. Breeding Plants Resistant to insects. John Wiley and
Sons, New York. 683pp.
Maxwell, R.C. and R.F. Harwood. 1960. Increased reproduction of pea aphids on broad
beans treated with 2,4-D. J. Econ. Entomol., 53: 199-205.
Mayberry, R.W. 1968. Varietal resistance of hops, flumnIrrs lupulus (L.), to the two-
spotted spider mite, Tetranychus urticae (Koch). M.S. Thesis. Oregon State
University, Corvallis. (cited from Peters and Berry, 1980a).
McEnroe, W.D. and K. Dronka. 1971. Photobehavioral classes of the spider mite
Tetranychus firticae (Acarina: Tetranychidae). Entomol. Exp. Appl., 14: 420-424.
Mckey, D. 1979. The distribution of secondary compounds within plants. In: C.A. Rosenthal
and D.H. Janzen (Eds.), Herbivores: their interactions with secondary plant
metabolites. pp. 55-133. Academic Press, New York.
McMurtry, J.A. 1962. Resistance of alfalfa to spotted alfalfa aphid in relation to
environmental factors. Hilgardia, 32: 501-539.
McNaughton, S.J. 1976. Serengeti migratory wildebeest: facilitation of energy flow by
grazing. Science, 191: 92-94.

414
McNaughton, S.J. 1979. Grazing as an optimization process: grass-ungulate relationships in
the Serengeti. Amer. Nat., 113: 691-703.
McNaughton, S.J. 1983. Compensatory plant growth as a response to herbivory. Oikos, 40:
329-336.
Meidner, H. and D.W. Sheriff. 1976. Water and Plants. Halsted Press, New York. 148pp.
Mendel, J.L. and D.W. Visser. 1951. Studies on nitrate reduction in higher plants. Arch.
Biochem. Biophys., 32: 158-169.
Ntensah, R.K. and J.L. Madden. 1991. Resistance and susceptibility of Boronia niegastigma
cultivars to infestations by the psyllid Ctenarytaina Thysanura. Entomol. Exp.
Appl., 61: 189-198.
Nticinski, S., D.J. Boethel and H.B. Boudreaux. 1981. Life tables and intrinsic rates of
increase of the pecan leaf scorch mite. J. Econ. Entomol., 74: 612-616.
Miller, E.C. and A.R. Saunder. 1923. Some observations on the temperature of the leaves of
crop plants. J. Agric. Res., 26: 1543.
Nlilthorpe, F.L. 1956. The growth of leaves. Butterworths Sci. Publ., London. 223pp.
Mitchell, R. 1973. Growth and population dynamics of a spider mite (Tetranychus urticae
K., Acarina: Tetranychidae). Ecology, 54(6): 1349-1355.
Mohammad, A.A.A. and J.G. Rodriguez. 1985. Resistance of selected genotypes to the
twospotted spider mite Tetranychus urticae (Acarina: Tetranychidae). Trans. KY.
Acad. Sci., 46(3-4): 92-98.
J.A., J.T. Trumble and V. Sevacherian..1984. Comparison of dispersion and
regression indices for Tetranychus cinnabarinus (Boisduval) (Acari:
Tetranychidae) populations on 'cotton. Environ. Entomol., 13: 1511-1514.
Mollet, J.A. and V. Sevacherian. 1984. Pesticide and seasonal effects on within-plant
distribution of Tetranychus cinnabarinus (Boisduval) (Acarina: Tetranychidae) in
cotton. J. Econ. Entomol., 77: 925 7928.
Montgomery, W.L. 1980. The impact of non-selective grazing by the giant blue damsel fish,
Microsphathodon dorsalis, on algae communities in the Gulf of California,
Mexico. Bulletin of Marine Science, 30: 290-303.

415
Mooney, H.A., S.L. Cu!mon and N.D. Johnson. 1983. Physiological constraints on plant
chemical defenses. In: P.A. Hedin (ed.), Plant Resistance to Insects. pp.21-36.
American Chemical Sociy, Washington D.C.
Moreton, B.D. 1964. Pest, and spraying programmes. In: A.H. Burgess (ed.), Hops botany,
cultivation, and utilization. pp.165-188. Interscience Publishers Inc., New York.
Mori, H. 1961. Comparative studies of thermal reaction in four species of spider mites
(Acarina: Tetranychidae). J. Fac. Agric., Hokkaido Uni., 51: 574-591.
Mori, H. and D.A. Chant. 1966. The influence of humidity on the activity of Phytoseisilus
persimilis Athias-Henriot and its prey, Tetranychus urticae (C.L. Koch) Acarina:
Phytoseidae, Tetranychidae). Can. J. Zool., 144: 863-871.
Mori, H. and S. Imbayashi. 1975. Suppression of tetranychid populations using the
predaceous mite Phytoseiulus persimilis Athias-Henriot in some agroecosystems
in Hokkaido (Acarina: Tetranychidae: Phytoseiidae). J. Fac. Agric., Hokkaido
Uni., 58: 271-282.
Mothes, U. and K.A. Seitz. 1982. Fine structural alterations of sink removal on
photosynthesis and senescense in leaves of soybean (Glycine max L.) plants. Plant
Physiol., 61: 394-397.
Munger, F. 1955. Rearing citrus red mites in the laboratory. J Econ. Entomol., 48: 72-74.
Munger, F. 1956. Activated-carbon filter for purification of air for rearing citrus red mite. J.
Econ. Entomol., 49: 138.
Murray, B.C. 1979. Population Dynamic. Academic ,Press, New York. 212pp.
Myers, J.H. 1978. Selecting a measure of dispersion. Environ. Entomol., 7: 619-621.
Nachman, C. 1981. Temporal and spatial dynamics of an acarine predator-prey system. J.
Anim. Ecol., 50: 435-451.
Neve, R.A.1991. Hops. Chapman and Hall, London. 266pp.
Nickel, J.L. 1960. Temperature and humidity relationships of Tetranychas desertorwn
Banks with special reference to distribution. Hilgardia, 30: 41-100.

416
Norris, D.M. and M. Kogan. 1980. Biochemical and morphological bases of resistance. In:
F.G. Maxwell and P.R. Jennings (eds.), Breeding plants resistant to insects. pp.23-
61. John Wiley & Sons, Inc., New York.
Oatman, E.R. and J.A. McMurtry. 1966. Biological control of the two-spotted spider mite on
strawberry in southern California. J. Econ. Entomol., 59: 433-439.
Oatman, E.R. and V. Voth. 1972. An ecological study of the two-spotted spider mite on
strawberry in southern California. Environ. Entomol., 1: 339-343.
Oatman, E.R., F.V. Sances, L.F. LaPre, N.C. Toscano and V. Voth. 1982. Effect of different
infestation levels of the two-spotted spider mite on strawberry yield in winter
plantings in southern California. J. Econ. Entomol., 75: 94-96.
Oatman, E.R., J.A. McMurtry, F.E. Gilstrap and V. Voth. 1967. Studies on integrating
Phytoseinlus persimilis releases, chemical applications, cultural manipulations,
• and natural predation for control of the two-spotted spider mite on strawberry in
southern California. J. Econ. Entomol., 60: 1344-51.
Oatman, E.R., J.A. McMurtry, F.E. Gilstrap and V. Voth. 1977a. Effect of releases of
Amblyseius californicus, Phytoseiulus persimilis and Typhlodromus occidentalis
on the two-spotted spider mite on strawberry in southern California. J. Econ.
Entomol., 70: 45-47.
Oatinan, E.R., J.A. McMurtry, F.E. Gilstrap and V. Voth. 1977b. Effect of releases of
Amblyseius californicus on the two-spotted spider mite on strawberry in southern
California. J. Econ. Entomol., 70: 638-640.
Oatman, E.R., J.A. Murtry and V. Voth. 1968. Suppression of the two-spotted spider mite
on strawberry with mass releases of Phytoseiulus persimilis. J. Econ. Entomol., 61:
1517-21.
Oatman, E.R., J.A. Wyman, H.W. Browning and V. Voth. 1981. Effects of releases and
varying infestation levels of the two-spotted spider mite on strawberry yield in
southern California. J. Econ. Entomol., 74: 112-115.
Oitnian, E.E. and D.C. Peters. 1980. Introduction. In: F.G. Maxwell and P.R. Jennings (eds.),
Breeding plants resistant to insects. pp.3-13. John Wiley & Sons, Inc., New York.

417
Oloumi-Sadeghi, H., C.C. Helm, M. Kogan and D.E. Schoenweiss. 1988. Effect of water
stress on abundance of twospotted spider mite on soybeans under greenhouse
conditions. Entomol. Exp. Appl., 48: 85-90.
Osborne, L.S. and A.R. Chase. 1985. Susceptibility of cultivars of English ivy Hedera
helix to twospotted spider mite and Xanthomonas leaf spot. Hort. Science, 20(2):
269-271.
Owen, D.F. 1980. How plants may benefit from the animals that eat them. Oikos, 35: 230-
235.
Owen, D.F. and R.G. Wiegert. 1976. Do consumers maximize plant fitness?. Oikos, 27: 488-
492.
Painter, R.H. 1951. Insect Resistance in Crop Plants. The Macmillan Co., New York. 520pp.
Painter, R.H. 1954. Some ecological aspects of the resistance of crop plants to insects. J.
Econ. Entomol., 47: 1036-1040.
Painter, R.H. 1958. Resistance of plants to insects. Ann. Rev. Entomol., 3: 267-290.
Parameswarappa, R., L.M. Josephon and E.E. Hartwig. 1974. Inheritance of spider mite
damage in soybeans. J. Hered., 65: 379-380.
Parker, W.B. 1913. The hop aphids in the Pacific Region. U.S. Bureau of Entomology,
Bulletin No. 111.
Patanakamjorn, S. and M.D. Pathak. 1967. Varietal resistance of the Asiatic rice borer,
Chao suppressalis (Lepidoptera: Crambidae), and its association with various
plant characteristics. Ann. Entomol. Soc. Amer., 60: 287-292.
Patterson, C.C., R. Thurston and J.G. Rodriguez. 1974. Twospotted spider mite resistance in
,Nicotiana species. J. Econ. Entomol., 67: 341-343.
Pavlova, G. and A. Egamberdiev. 1990. Varieties resistant to Tetranychus articae.
Khlopok, 2: 27-29.
Pedigo, L.P., S.H. Hutchins and L.C. Higley. 1986. Economic injury levels in theory and
practice. Ann. Rev. Entomol., 31: 341-368.
Pedigo, L.P. 1989. Entomology and pest management. Mac Milian Publishing Company,
New York. 646pp.

418
Perring, T.M., T.L. Archer, D.L. Krieg and J.W. Johnson. 1983. Relationships between the
Banks grass mite (Acariformes: Tetranychidae) and physiological changes of
maturing grain sorghum. Environ. Entomol., 12: 1094-1098.
Perrin& T.M., T.O. Holtzer, J.L. Toole, J.M. Norman, and G.L. Myers. 1984. Influences of
temperature and humidity on pre-adult development of the Banks grass mite
• (Acari: Tetranychidae). Environ. Entomol., 13: 338-343.
Perring, T.M., T.O. Holtzer, J.L. Toole and J.M. Norman. 1986. Relationships between corn-
canopy microenvironments and Banks grass mite (Acari: Tetranychidae)
abundance. Environ. Entomol., 15: 79-83.
Perrin& TN., C.A. Farrar and R.N. Royalty. 1987. Intraplant distribution and sampling of
spider mites (Acari: Tetranychidae) on cantaloupe. J. Econ. Entomol., 80: 96-101.
Peters, K.M. and R.E. Berry. 1980a. Resistance of hop varieties to twospotted spider mite.
J. Econ. Entomol., 73(2): 232-234.
Peters, K.M. and R.E. Berry. 1980b. Effects of hop leaf morphology on twospotted spider
mite. J. Econ. Entomol., 73(2): 235-238.
Pickett, C.H. and F.E. Gilstrap. 1986. Dispersion patterns and sampling of spider mites
(Acari: Tetranychidae) infesting corn in the Texas high plains. Environ. Entomol.,
15: 335-341.
Pillemer, E.A. and W.M. Tingey. 1976. Hooked trichomes: A physical plant barrier to a
major agricultural pest. Sc., 193: 482-484.
Pimentel, D. 1968. Population regulation and genetic feedback. Science 159: 1432-1437.
Pimentel, D. 1986. Some aspects of integrated pest management. Department of
Entomology, Cornell University, Ithaca, New York. 367pp.
Pimentel, D., S.A. Levin and A.B. Soans. 1975. On the evolution of energy balance in
exploiter-victim systems. Ecology, 56: 381-390.
Pitcher, R.S. and McNamara. 1976. Nematode vectors of virus diseases. Rep. E. Mailing
Res. Stn. for 1975, 132-133.
Poe, S.L., C.I. Shih and A.J. Overman. 1976. Integrated tactics for management of spider
mite populations on Florida strawberries. Proc. Fla. State Hort. Soc, 89: 147-148.

419
Potter, D.A., R.G. Anderson and D.W. Jackson. 1981. Evaluation of resistance to twospotted
mites Tetranychus :gracile in ivy geranium Pelargonium pelts:I um cultivars. Hort.
Science, 16: 447.
Rabak, F. 1950. Brewers Digest, 25:110 (cited from Verzele and de Keukeleire, 1991)
Rambier, A. 1958. Les tetranyques nuisibles a la vigne en France continentale. Rev. Appl.•
Entomol. (A), 48(1960): 108-109.
Rauwerdink, J.B., M.W. Sabelis and O.M.B. de Ponti. 1983. Life history studies
Tetranychus urticae Koch on a two-spotted spider mite susceptible and resistant
cucumber line. J. Exp. Appl. Acarol. (cited from Sabelis, 1985a).
Raworth, D.A. 1989. Towards the establishment of an economic threshoid for the
twospotted spider mite, Tetranychus :laicize (Acari: Tetranychidae) on red
raspberry, Rubris idaetis. Acta Horticulturae, 262: 223-226. (cited from Rev. Appl.
Entomol. (A), 80(1992): 542).
Readshaw, J.L. 1975. The ecology of tetranychid mites in Australian orchards. J. Appl.
Ecol., 12: 473-495.
Regev, S. and W.W. Cone. 1975. Chemical differences in hop varieties vs. susceptibility to
the two-spotted spider mite. Environ. Entomol., 4: 697-700.
Rhoades, D.F. 1979. Evolution of plant chemical defense against herbivores. In: G.A.
Rosenthal and D.H. Janzen (eds.), Herbivores: their interaction with secondary
plant metabolites. pp. 3-54. Academic Press, New York.
Rhoades, D.F. 1983. Herbivore population dynamics and plant chemistry. In: R.F. Denno
and M.S. McClure (eds.), Variable plants and herbivores in natural and managed
systems. pp. 155-220. Academic Press, New York.
Rhoades, D.F. 1985. Offensive-defensive interactions between herbivores and plants:
their relevance in herbivore population dynamics and ecological theory. Amer.
Nat., 125: 205-238.
Rhoades, D.F. and R.G. Cates. , 1976. Towards a general theory of plant antiherbivore
chemistry. Recent Adv. Phytochem., 10: 168-213.

420
Rodriquez, J.G. 1953. Detached leaf culture in mite nutrition studies. J. Econ. Entomol., 46:
713.
Rodriquez, J.G. and J.F. Freeman. 1959. Results of the research in 1959 by the experiment
station of the university of Kentucky, 72d. Ann. Rep. Agr. Exp. Stn. Uni. Kentucky:
49.
Rodriguez, J.G. and L.D. Rodriguez. 1987. Nutritional ecology of phytophagous mites. In:
F. Slansky, Jr. and J.G. Rodriguez (eds), Nutritional ecology of insects, mites,
spiders, and related invertebrates. pp. 177-208. John Wiley & Sons, Inc., New
York.
Rodriguez, J.G., D.A. Reicosky and C.C. Patterson. 1983. Soybean and mite interaction:
effects of cultivar and plant growth stage. J. Kans. Entomol. Soc., 56: 320-326.
Rodriguez, J.G., D.E. Maynard and W.T. Smith. 1960. Effects of soil insecticides and
absorbants on plant sugars and resulting effect on mite nutrition. J. Econ. Entomol.,
53: 491-495.
Rodriguez, J.G., H.H. Chen and W.T. Smith. 1957. Effects of soil insecticides on beans,
soybeans, and cotton and resulting effect on mite nutrition. J. Econ. Entoillol., 50:
587-593.
Rodriguez, J.G., Z.T. Dabrowski, L.P. Stoltz, C.E. Chaplin and W.O. Smith. 1971. Studies
on resistance of strawberries to mites. 2. Preference and non-preference responses of
Tetranychus urticae and T. turkestani to water-soluble extracts of foliage. J. Econ.
• Entomol., 64: 383-387.
Rodriguez, J.G., D.E. Knavel and O.J. Aina. 1972. Studies in the resistance of tomatoes to
mites. J. Econ. Entomol., 65: 50-53.
Rodriguez, J.G., D.A. Reicosky and C.C. Patterson. 1983. Soybean and Mite interaction:
effects of cultivar and plant growth stage. Journal of the Kansas Entomological
Society, 56(3): 320-326.
Rogers, R.R. and R.B. Mills. 1974. Reactions of sorghum varieties to maize weevil
infestation under three relative humidities. J. Econ. Entomol., 67: 692.

421
Romanow, L.R., O.M.B. de Ponti and C. Mollema. 1991. Resistance in tomato to the
greenhouse whitefly: analysis of population dynamics. Entomol. Exp. Appl., 60:
247-259.
Rosenthal, G.A. and D.H. Janzen. 1979. Herbivores: Their interaction with secondary
plant metabolites. Academic Press, New York. 718pp.
Russell, G.E. 1978. Plant breeding for pest and disease resistance. Buttenvorths, London.
485pp.
Ryan, C.A. 1983. Insect-induced chemical signals regulating natural plant protection
responses. En: R.F. Denno and M.S. McClure (eds.), Variable plants and herbivores
in natural and managed systems. pp. 43-60. Academic Press, New York.
Rybacek, V. 1991. Hop production. Elsevier Science Publishers and State Agricultural
Publishing House, Prague, 286pp. ,
Sabelis, M.W. 1981. Biological control of two-spotted spider mites using phytoseiid
predators. Part I. Modeling the predator-prey interaction at the individual level.
Centre for Agricultural Publishing and Documentation, Wageningen, 242pp.
Sabelis, M.W. 1985a. Reproductive Strategies. In: %V. HeIle and M.W. Sabelis (eds.),
Spider mites. Their biology, natural enemies and control. Vol.1A. pp. 265-278.
Elsevier Science Publishing B.V., Amsterdam, The Netherlands.
Sabelis, M.W. 1985b. Sampling techniques. In: W. HeIle and M.W. Sabelis (eds.), Spider
mites. Their biology, natural enemies and control. VoLlA. pp. 337-350. Elsevier
Science Publishing B.V., Amsterdam, The Netherlands.
Saini, R.S. and L.K. Cutkomp. 1966. The effects of DDT and sublethal doses of dicofol on
reproduction of the two-spotted spider mite. J. Econ. Entomol., 59: 249-53.
Saito, Y. 1985. Life types of spider mites. In: W. Helle and M.W. Sabelis (eds.), Spider
mites. Their biology, natural enemies and control. VollA. pp. 253-264. Elsevier
Science Publishing B.V., Amsterdam, The Netherlands.
Salmon, E.S. and W.M. Ware. 1931. The downy mildew of the hop in 1930. J. Inst. Brew.,
37: 24-31.

422
Sances, F.V., J.A. Wyman and LP. Ting. 1979a. Physiological responses to spider mite
infestation on strawberries. Environ. Entomol., 8: 711-740.
Sances, F.V., J.A. Wyman and I.P. Ting. 1979b. Morphological responses of strawberry
leaves to infestations of twospotted spider mite. J. Econ. Entomol., 72: 710-713.
Sances, F.V., J.A. Wyman, I.P. Ting, R.A. van Steenwyk and E.R. Oatman. 1981. Spider -
mite interactions with photosynthesis, transpiration and productivity of
strawberry. Environ. Entomol., 10: 442-448.
Saradamma, K. and W.M. Das. 1974. Resistance of tapioca varieties to the red spider mite
Tetranychus telarius Linn. Agri. Res. J. Kerala, 12: 108-110.
Sasamoto, K. 1958. Studies on the relation between the silica content in rice plant and the
insect pests. IV. On the injury of silicated rice plant caused by the rice stem borer
and its feeding behavior. Jap. J. Appl. Entomol. Zool., 2: 88-92.
Schalk, J.M., A.K. Stoner, R.E. Webb and H.F. Winters. 1975. Resistance in eggplant,
Solarium rnelongena L., and nontuberbearing Solanum species to carmine spider
mite. J. Amer. Soc. Hort. Sci., 100: 479-481.
Schicha, E. 1975. Phytophagous mites and their predators in an apple orchard at Bathurst
(N.S.W., Australia). H. The influence of a ryania-captan-dinocap spray schedule.
Z. ang. Ent., 78: 397-409.
Schultz, J.C. 1988. Plant responses induced by herbivores. Trends in Ecology & Evolution,
3(2): 45-49.
Schuster, D.J., J.F. Price, F.G. Martin, C.M. Howard and E.E. Albregts. 19S0. Tolerance of
strawberry cultivars to twospotted spider mites Tetranychus urticrie in Florida
USA. J. Econ. Entomol., 73(1): 52-54.
Schuster, M.F. and F.G. Maxwell. 1976. Resistance to twospotted spider mite in cotton.
Bull. Miss. Agr. For. Exp. Stn., 821: 13pp.
Schuster, M.F., F.G. Maxwell and J.N. Jenkins. 1972. Resistance to the twospotted spider
mite in certain Gossypium hirsuturn races, Gossypium species: and glanded-
glandless counterpart cottons. J. Econ. Entomol., 65: 1108-1110.
•-•

423
Schuster, M.F., F.G. Maxwell, J.N. Jenkins, E.T. Cherry, W.L. Parrott and D.C. Holder.
1973. Resistance to twospotted spider mite in cotton. Bull. Miss. Agri For. Exp. Stn., •
802: 25pp.
Schwartz, B.W. and H.L. Grant. 1974. Digest, 49:46. (cited from Verzele and de
Keukeleire, 1991).
Scopes, N. 1981. Tropical foliage in the concrete jungle, but what about insects?. Grower,
August 20: 48-51.
Seigler, D.S. 1977. Primary roles for secondary compounds. Biochem. Syst: Ecol., 5: 195-199.
Seigler, D.S. and P.W. Price. 1976. Secondary compounds in plants: primary functions.
Amer. Nat., 110: 101-105.
Selhime, A.G. and M.H: Muma. 1966. Biology of Entomophthorn floridana attacking
Eutetriznychus bnnksi. Fla. Entomol., 49:161-168.
Shanks, C.H. and B.H. Barritt. 1975. Resistance of strawberries to two-spotted spider
mite. J. Econ. Entomol., 68: 7-10.
Shanks, C.H. and B.H. Barritt. 1984. Resistance of Fragaria chiloensis clones to the
twospotted spider mite. Hort. Science, 19(5): 640-641.
Sharpe, F.R. 1988. Assessment and control of beer flavour. J. Inst. Brew., 95: 301-305.
Shih, C., T. Sidney, L. Poe and H.L. Cromroy. 1976. Biology, life table and intrinsic rate of
increase of Tetranychus urticae. Ann. Entomol. Soc. Amer., 69: 362-364.
Sill, W. 1982. Plant protection (an integrated interdisciplinary approach). The Iowa
State University Press, Ames, Iowa. 297pp. •
Simpson, K.W. and W.A. Connell. 1973. Mites on soybeans: moisture and temperature
relations. Environ. Entomol., 2: 319-323.
Singh, B.B., H.H. Hadley and R.L. Bernard. 1971. Morphology of pubescence in soybeans
and its relationship to plant vigor. Crop Sci., 11: 13-16.
Singh, P. and J.G. Charles. 1975. A list of laboratory cultures and rearing methods of
terrestrial arthropods in New Zealand. Entomological Society of New Zealand
(Inc.), Bull. No.3. 30pp.

424
Sites, R.W. and W.W. Cone. 1985. Vertical dispersion of twospotted spider mites on hops
throughout the growing season. J. Entomol. Soc. B.C., 82: 22-25.
Smith, D.C. 1937. Varietal improvement in hops. U.S. Dept. of Agri. Yearbook for 1937:
1215-41.
Smith, J.C. and R.W. Mozingo. 1983. Effect of the two-spotted spider mite (Acari:
Tetranychidae) on large seeded Virginia type peanuts. J. Econ. Entomol., 76: 1315-
19.
Smith Meyer, M.K.P. 1981. Mite pests of crops in southern Africa. Repub. S. Afr., Dep.
Agri. Fisheries, Sci. Bull., No. 397, p. 59.
Snell, T.W. 1978. Fecundity, developmental time, and population growth rate. Oecologia,
32: 119-125.
Snetsinger, R., C.P. Balderston and R. Craig. 1966. Resistance to the twospotted spider
mite in Pelargonium. J. Econ. Entomol., 59: 76-78.
So, P.M. 1991. Distribution patterns of and sampling plans for Tetranychas urticae Koch
(Acarina: Tetranychidae) on roses. Researches on Population Ecology, 33(2): 229-
243.
Soans, A.B., D. Pimentel and J.S. Soans. 1973a. Resistance in cucumber to the twospotted
spider mite. J. Econ. Entomol., 66: 380-382.
Soans, A.B., D. Pimentel and J.S. Soans. 1973b. Resistance in the eggplant to twospotted
spider mites. J. New York ent. Soc., 81: 34-39.
Sosa, 0. 1988. Pubescence in sugarcane as a plant resistance character affecting oviposition
and mobility by the sugarcane borer (Lepidoptera: Pyralidae). J. Econ. Entomol.,
81(2): 663-667.
Sosa, 0. and J.E. Foster. 1976. Temperature and the expression of resistance in wheat to the
Hessian fly. Environ. Entomol. 5: 333-336.
Southwood, T.R.E. 1978. Ecological methods with particular reference to the study of
insect populations. 2nd ed. Chapman and Hall, New York_ 524pp.
Stephens, S.C. 1959. Laboratory studies of feeding and oviposition preferences of
Anthosionnts grandis Boh. J. Econ. Entomol., 52: 390-396.

425
Stipanovic, R.D. 1983. Function and chemistry of plant trichomes and glands in insect
resistance: Protective chemicals in plant epidermal glands and appendages. In:
P.A. Hedin (ed.), Plant.5esistance to Insects. pp.69-100. American Chemical
Society, Washington D.C. 375pp.
Stoner, A.K. 1970. Selecting tomatoes resistant to spider mites. J. Amer. Soc. Hort. Sci., 95:
78-80.
Stoner, A.K. and T. Stringfellow. 1967. Resistance of tomato varieties to spider mites. Proc.
Amer. Soc. Hort. Sci., 90: 324-329.
Storms, J.J.H. 1969. Observations on the relationship between mineral nutrition of apple
rootstocks in gravel culture and the reproduction rate of Tetranychns urticae
(Acarina: Tetranychidae). Entomol. Exp. Appl., 12: 297-311.
Summers, F.M. and C.R. Stocking. 1972. Some immediate effects on almond leaves of
feeding by Bryobia rubriocnins (Scheuten). Acarologia, 14: 170-178.
Suski, Z.W. and J.A. Naegele. 1963. Light response in the two-spotted spider mite. I.
Analysis of behavioral response. Adv. Acarology, 1: 435-444.
Sutton, J.H. 1982. The potential for the integrated control of the two-spotted mite
(Tetranychus nrticae) Koch in Tasmanian glasshouse. Masters thesis. University
of Tasmania Hobart, Tasmania.
Tallamy, D.W. 1986. Behavioral adaptation in insects to plant allelochemicals. In: L.B.
Bratten and S. Ahmad (eds.), Molecular Aspects of Insect-Plant Associations.
pp.273-300. Plenum Press, New York and London.
Tammes, PALL., 1961. Studies of yield losses II. Injury as _a limiting factor of yield.
Tijdschr. Planteziekten, 67(3): 257-263.
Tanigoshi, L.K., S.C. Hoyt, R.W. Browne and LA. Logan. 1975. Influence of temperature on
population increase of Tetranychus mcdanieli. Ann. Entomol. Soc. Amer., 68: .972-
978.
Tanton, M.T. 1962. The effect of leaf "toughness" on the feeding of larvae of the mustard
beetle Phaedon cochleariae Fab. Entomol. Exp. Appl., 5: 74-78.
Taylor, L.R. 1961. Aggregation, variance and the mean. Nature, 189: 732-735.

426
Taylor, W.E. and R. Bardner. 1968. Effects of feeding by larvae of Phaedon cochleariae
(F.) and Plutella maculipennis (Curt.) on the yield of radish and turnip plants.
Ann. Appl. Biol., 62(2): 249-254.
Terauds, A. 1989. Phytophagous mites on apple in Tasmania under integrated control
conditions. Occasional publications, Department of primary industry, Hobart,
Tasmania. 24pp.
Tingey, W.M. and S.R. Singh. 1980. Environmental factors influencing the magnitude and
expression of resistance. In: F.C. Maxwell and P.R. Jennings, (eds.), Breeding plants
resistant to insects. pp. 87-113. John Wiley & Sons, Inc., New York.
Tomczyk, A. and D. Kropczynska. 1985. Effects of the host plants. In: W. Helle and M.W.
Sabelis (eds.), Spider mites. Their biology, natural enemies and control. VoLlA.
pp. 317-330. Elsevier Science Publishing B.V., Amsterdam, The Netherlands.
Toole, J.L., J.M. Norman, T.O. Holtzer and T.M. Perring. 1984. Simulation Banks grass mite
(Acari: Tetranychidae) population dynamics as a subsystem of a corn canopy
microenvironment model. Environ. Entomol., 13: 329-337.
Trichilo, P.J. and T.F. Leigh. 1985. The use of life tables to assess varietal resistance of
cotton to spider mites. Entomol. Exp. Appl., 39(1): 27-34.
Trumble, J.T. 1985. Implications of changes in arthropod distribution following chemical
application. Researches on Population Ecology, 27: 277-285.
Trumble, J.T., D.M. Kolodny-Hirsch and I.P. Ting. 1993. Plant compensation for arthropod
herbivory. Annu. Rev. Entomol., 38:93-119.
Tulisalo, U. 1972. Resistance to the twospotted spider mite, Tetranychus urticae Koch
(Acari, Tetranychidae) in the genera Cucumis and Citrullus (Cucurbitaceae). Ann.
Entomol. Fenn., 38:60-64. .
Tulisalo, U. 1974. Control of the two-spotted spider mite (Tetranychus urticae Koch) by
high air humidity or direct contact with water. Ann. Entomol. Fenn., 40: 158-162.
J. 1992. Toward integration of plant defence theories. Trends in Ecology &
Evolution, 7(11): 365-367.

427
Turnipseed, S.C. 1977. Influence of trichome variations on populations of small
phytophagous insects in soybean. Environ. Entomol., 6: 815-817.
Unwin, B. 1971. Biology and control of the two-spotted mite, Tetranychus urticae (Koch). J.
Aust. Inst. Agri. Sci., 37:192-211.
van de Vrie, M. 1985a. Greenhouse Ornamentals. In: W. HeIle and I.W. Sabelis (eds.),
Spider mites. Their biology, natural enemies and control. VoL1B. pp. 273:283.
Elsevier Science Publishing B.V., Amsterdam, The Netherlands.
van de Vrie, M. 1985b. Apple. In: W. Helle and M.W. Sabelis (eds.), Spider mites. Their
biology, natural enemies and control. VoL1B. pp. 311-325. Elsevier Science
Publishing B.V., Amsterdam, The Netherlands.
van de Vrie, M., J.A. McMurtry and C.B. Huffaker. 1972. Ecology of Tetranychid mites and
their natural enemies: A review. III. Biology, ecology and pest status and host
plant relations of Tetranychids. Hilgardia, 41: 343-432.
van der Geest, L.P.S. 1985a. Aspects of physiology. In: W. Helle and M.W. Sabelis.(eds.),
Spider mites. Their biology, natural enemies and control. VoLlA. pp. 171-184.
Elsevier Science Publishing BV., Amsterdam, The Netherlands.
van der Geest, L.P.S. 1985b. Pathogens of spider mites. In: W. Helle and M.W. Sabelis
(eds.), Spider mites. Their biology, natural enemies and control. VollB. pp. 247-
258. Elsevier Science Publishing B.V., Amsterdam, The Netherlands.
van der Plank, J.E. 1963. Plant Diseases: Epidemics and Control. Academic Press, Inc., New
York, 206pp.
van Emden, H.F. and M.J. Way_ 1973. Host plants in the population dynamics of insects. In:
H.F. van Emden (ed.), Insect/ Plant Relationships, pp. 181-199. Blackwell
Scientific Publications, Oxford, Great Britain.
Veerman, A. 1977. Photoperiodic termination of diapause in spider mites. Nature, 266:
526-527.
Veerman, A. 1985. Diapause. In: W. Helle and M.W. Sabelis (eds.), Spider mites. Their
biology, natural enemies and control. VoLlA. pp. 279-316. Elsevier Science
Publishing B.V., Amsterdam, The Netherlands.

428
Verzele, M. 1986. 100 Years of hop chemistry and its relevance to brewing. J. Inst. Brew.,
92(1): 32-48.
Verzele, M. and D. de Keukeleire, 1991. Chemistry and analysis of hop and beer bitter
acids. Elsevier Science Publishers, Amsterdam, 417pp.
Vickery, P.J. 1972. Grazing and net primary production of a temperate grassland. J. appl.
Ecol., 9: 307-314.
Visser, J.H. and J.K. Nielsen. 1977. Ent. Exp. & Appl., 21:14-22. (cited from Renwick, J.A.A.
1983. Nonpreference mechanisms: plant characteristics influencing insect
behavior. Plant Resistance to Insects. p.199-213.)
Wade, C.C. 1988. Fifty years of agriculture in Tasmania 1935-1985. Agricultural Science,
The Journal of the Australian Institute of Agricultural Science. New Series Vol.
1(5): 22-29.
Wagner, T.L., 1-1.1. Wu, P.J.H. Sharpe, R.M. Schoolfield and R.N. Coulson. 1984. Modelling
insect development rates: a literature review and application of biophysical
model. Ann. Entomol. Soc. Amer., 77:208-225. •
Walters, D.S., J. Harman, R. Craig and R.O. Mumma. 1991. Effect of temperature on
glandular trichome exudate composition and pest resistance in geraniums. Entomol.
Exp. App!., 60(1): 61-69.
Wang, 1960. A critique of the heat-unit approach to plant response studies. Ecology, 41:
785-790.
Wannamaker, W.K. 1957. The effect of plant hairiness of cotton strains on boll weevil
attack. J. Econ. Entomol., 50: 418-423.
Watson, T.F. 1964. Influence of host plant condition on population increase of Tetranychus
telarius (Linnaeus) (Acarina: Tetranychidae). Hilgardia, 35: 273-322.
Welter, S.C., M.M. Barnes, LP. Ting and J.T. Hayashi. 1984. Impact of various late-season
spider mite (Acari: Tetranychidae) feeding damage on almond growth and yield.
Environ. Entomol., 13: 52-55.

429
• Welter, S.C., D.S. Farnham, P.S. McNally and R. Freeman. 1989. Effect of Willamette
mite and Pacific spider mite (Acari: Tetranychidae) on grape photosynthesis and
stomata! conductance. Environ. Entomol., 18: 953-957.
Wermelinger, B., J.J. Oertli and V. Delucchi. 1985. Effect of host plant nitrogen
fertilization on the biology of the two-spotted spider mtie, Tetranychus urticae.
Entomol. Exp. Appl., 38: 23-28.
Werner, R.A. - 1979. Influence of host foliage on development, survival, fecundity and
oviposition of the spear-marked black moth, Rheumnptern hastatn (Lepidoptera:
Geometridae). Can. Entomologist, 111: 317-322.
Wheatley, J.A.C. and D.J. Boethel. 1987. Fecundity and egg hatchability of twospotted
spider mite. Tetranychus urticae Koch (Acari: Tetranychidae) reared on nine
soybean genotypes. J. Entomol. Sci., 22(2): 147-152.
Wheatley, J.A.C. and D.J. Boethel. 1992. Populations of Phytoseildus persimilis (Acari:
Phytoseiidae) and its host, Tetranychus urticne (Acari: Tetranychidae), on
resistant and susceptible soybean cultivars. J. Econ. Entomol., 85: 731-738.
White, T.C.R. 1974. A hypothesis to explain outbreaks of looper, caterpillars with special
reference to populations of Selidosema sunvis in a plantation of Pin us radiata in
New Zealand. Oecologia (Berlin), 16: 279-301.
Whittaker, R.H. 1970;The biochemical ecology of higher plants. In: Sondheimer and
Simeone . (Eds.), Chemical Ecology, pp.43-70. Academic Press, Inc., New York.
Whittaker, R.H. and P. Feeny. 1971. Allelochmics: Chemical interactions between
species. Science, 171: 757-770.
Wilde, G., W. Thomas and' H. Hall. 1991. Plant resistance to twospotted spider mite
•(Acari: Tetranychidae) in raspberry cultivars. J. Econ. Entomol., 84(1): 251-255.
Williams, A.J. 1954. Biology Of the common red spider. J. Kans. Entomol. Soc., 27: 97-99.
(cited from Wrensch, 1985).
Wilson, L.J. and R. Morton. 1993. Seasonal abundance and distribution of Tetranychus
urticae (Acari: Tetranychidae), the two spotted spider mite, on cotton in Australia
• and implications for management. Bull. Entomol. Res:, 83: 291-303.

430
Wilson, L.T. and P.M. Room. 1983. Clumping patterns of fruit and arthropods in cotton,
with implications for binomial sampling. Environ. Entomol., 12: 50-54.
Wilson, L.T., C. Picket, R.C. Mount and F.G. Zalom. 1983. Presence-Absence sequential
sampling for cabbage aphid and green peach aphid (Homoptera: Aphididae) cn
brussels sprouts. J. Econ. Entomol., 76: 476-479.
Winston, P.W. and D.H. Bates. 1960. Saturated solutions for the control of humidity in
biological research. Ecology, 41(1): 232-237.
Wood, E.A. Jr. and K.J. Starks. 1972. Effect of temperature and host plant interaction on
the biology of three biotypes of the greenbug. Environ. Entomol., 1:230-234.
Woodhead, S. and D.E. Padgham. 1988. The effect of plant surface characteristics on
resistance of rice to the brown planthopper, Nilaparvata Ingots.. Entomol. Exp.
Appl., 47: 15-22.
Worner, S. 1988. Evaluation of diurnal temperature models and thermal summation in
New Zealand. Forum: J. Econ. Entomol., 81: 9-13.
Wrensch, D.L. 1985. Reproductive parameters. In: W. Helle and M.W. Sabelis (eds.),
Spider mites. Their biology, natural enemies and control. VoLlA. pp. 165-170.
Elsevier Science Publishing B.V., Amsterdam, The Netherlands.
Wrensch, D.L. and S.S.Y. Young. 1975. Effects of quality of resource and fertilization status
of some fitness traits in the two-spotted spider mite, Tetfanychus urticae Koch.
Oecologia, 18: 259-267.
Wrensch, D.L. and S.S.Y. Young. 1978. Effects of density and host quality on the rate of
• development, survivorship, and sex ratio in the carmine spider mite. Environ.
Entomol., 7: 499-501.
Wrensch, D.L. and S.S.Y. Young. 1983. Relationship between primary and tertiary sex
ratio in the two-spotted spider mite in different environments. Environ. Entomol.,
10: 1-5.
Wright, L.C., W.W. Cone, G.W. Menzies and T.E. Wildman. 1990. Numerical and
- . binomial sequential sampling plans for the hop aphid (Homoptera: Aphididae)
on hop leaves. J. Econ.. Entomol., 83(4): 1388-1394.

431
Wyatt, I.J. and P.F. White. 1977. Simple estimation of intrinsic increase rates for aphids
and tetranychid mites. J. Appl. Ecol., 14: 757-66.
Wyman, J.A., E.R. Oatman and V. Voth. 1979. Effects of varying two-spotted spider mite
infestation levels on strawberry yield. J. Econ. Entomol., 72: 747-753.
Wysoki, M. 1985. Other outdoor crops. In: W. Helle and M.W. Sabelis (eds.), Spider mites.
Their biology, natural enemies and control. Vol.1B. pp. 375-384. Elsevier Science
Publishing B.V., Amsterdam, The Netherlands.
Yaninek, J.S., A.P. Gutierrez and H.R. Herren. 1989. Dynamics of Mononychellus tanajoa
(Acari: Tetranychidae) in Africa: experimental evidence of temperature and host
plant effects on population on growth rates. Environ. Entomol., 18: 633-640.
Youngman, R.R. and M.M. Barnes. 1986. Interaction of spider mites (Acari: Tetranychidae)
and water stress on gas-exchange rates and water potential of almond leaves.
Environ. Entomol., 15: 594-597.
Zar, J.H. 1984. Biostatistical Analysis. 2 ed. Prentice-Hall Inc., Englewood Cliffs, N.J.
U.S.A. 718pp. •
Zattler, F. 1951. 25 Jahre der deutschen Hopfenforschung. Jubilaumfestschrift der
Deutscher Gesellschaft fur Hopfenforschung E.V., 91pp. (cited from Neve, 1991).
Zatyko, L. and V. Martinovich. 1986. Resistance to the red spider mite (Tetranychus
urticae Koch) in the "Feherozon Synthrtic" pepper variety. Zaragoza, Spain;
Servicio de Investigacion Agraria, 125-128.
Zeleny, Hrdy, I. and P.K. Kalushkov. 1981. Population dynamics of aphid and mite
predators in hops: Bohemian hop-growing area. IOBC/ WPRS Bull. 4: 87-96.
Zoebelein, G. and U. Kniehase. 1985. Laboratory, greenhouse and field trials on the effect
of nikkomycins on insects and piles. Pflanzenschutz-Nachrichten Bayer, 38: 203-
304.

432
Appendix 3.1. Unpaired t-tests for mite densities in the middle region of treated and
untreated hop plants in the early 1991/92 growing season.
'-'Parameters '• Sampling date DF Unpaired t values
No. of mites/leaf 14/11/91 78 -2.015*
28/11/91 78 -2.164*
No. of inites/cm.2 14/11/91 78 -2.029*
28/11/91 78 -2.155*
Appendix 3.2. Unpaired t-tests for total numbers of TSSM (all stages) after re-infestation
on 10/2/93 and 24/2/93.
Date
DF Unpaired t values
10/2/93
24/2/93
12 1.2179ns
Appendix 3.3. One-factor ANOVA for surface areas of hop leaves at the height of 1.8 m.
among different blocks during the 1990/91 growing season.
Source
DF Sum of square Mean square F-test
Between groups 8905.8593 2968.6198 67.5971**
Within groups 16 702.6619 43.9164
Total- 19 9608.5212
Appendix 3.4. One-factor ANOVA for dry weights of hop leaves at the height of 1.8 m.
among different blocks during the 1990/91 growing season.
Source DF Sum of square Mean square F-test
Between groups
Within groups
Total
3
16
19
0.3776
0.0689
0.4465
0.1259
0.0043
29.2432**

433
Appendix 3.5. One-factor ANOVA for surface areas of hop leaves at the height of 1.8 m.
among different blocks during the 1991/92 growing season.
Source DF Sum of square Mean square F-test
Between groups
Within groups
Total
3
32
35
5580.9567
176786.6266
182367.5833
1860.3189
5524.5821
0.3367ns
Appendix 3.6. One-factor ANOVA for dry weights of hop leaves at the height of 1.8 m.
among different blocks during the 1991/92 growing season.
Source DF Sum of square Mean square F-test
Between groups
Within groups
Total
3
32
35
0.1745
7.9208
8.0953 -
0.0582
0.2475
0.2350ns
Appendix 3.7. One-factor ANOVA for surface areas of hop leaves at the fourth node
among different blocks during the 1992/93 growing season.
Source DF Sum of square Mean square F-test
Between groups
• Within groups
Total
3
4
7
268.0871
473.6353
741.7224
89.3624
118.4088
0.7547ns
Appendix 3.8. One-factor ANOVA for dry weights of hop leaves at the fourth node among
different blocks during the 1992/93 growing season.
Source DF Sum of square Mean square F-test
Between groups
Within groups
Total
3
4
7
0.0035
0.0219 .
0.0255
0.0012
0.0055
0.2129ns

434
Appendix 3.9. One-factor ANOVA for surface areas of hop leaves at the height of 1.8 m.
among different blocks during the 1992/93 growing season.
Source DF Sum of square Mean square F-test
Between groups
Within groups
Total
3
32
35
3186.6750 -
192105.6614
195292.3365
1062.2250
60033019
0.1769ns
Appendix 3.19. One-factor ANOVA for dry weights of hop leaves at the height of 1.8 m.
among different blocks during the 1992/93 growing season.
Source DF Sum of square Mean square F-test
Between groups
Within groups
Total
3
32
35
0.0536 -
7.7982
7.8519
0.0179
0.2437
0.0733ns
Appendix 3.11. One-factor ANOVA for log (1+x) of adult female numbers per leaf among
different foliage heights.
Source DF Sum of square Mean square F-test
Between groups
Within groups
Total
- 2
45
47
1.710
3.389
5.099
0.855
0.075
11.35**
Appendix 3.12: One-factor ANOVA for log (1+x) of adult male numbers per leaf among
different foliage heights.
Source D.F.Sum of square Mean square F-test
Between groups 2 1.052 0.526 4.349*
Within groups 45 5.441 0.121
Total 47 6.493 •

435
Appendix 3.13. One-factor ANOVA for log (1+x) of immature numbers per leaf among
different foliage heights.
Source
DF Sum of square Mean square F-test
Between groups
Within groups
Total
2
45
47
4.254
8.203
12.456
2.127
0.182
11.668**
Appendix 3.14. One-factor ANOVA for log (1+x) of egg numbers per leaf among different
foliage heights.
Source DF Sum of square Mean square F-test
Between groups
Within groups
Total
2
45
47
3.377
21.448
24.826
1.689
0.477
3•543*
Appendix 3.15. One-factor ANOVA for log (1+x) of Waal mite numbers per leaf among
different foliage heights.
Source DF Sum of square Mean square F-test
Between groups
Within groups
Total -
2
45
47
4.837
13.498
18.335
2.418
0.300
8.062**
Appendix 3.16. One-factor ANOVA for log (1+x) of Stethorus numbers per leaf among
different foliage heights.
Source DF Sum of square Mean square F-test
Between groups
Within groups
Total
2
45
47
0.201
1.361
1.562
0.100
0.030
3.321*
„

436
Appendix 3.17. One-factor_ ANOVA for log (1+x) of predatory mite numbers per leaf
among different foliage heights.
Source DF Sum of square Mean square F-test
Between groups
Within groups
Total
. 2
45
47
0.045
0.430
0.476
0.023
0.010
2.368ns
Appendix 3.18. One-factor ANOVA for log (1+x) of adult female numbers per cm.2 among
different foliage heights.
Source
DF Sum of square Mean square F-test
Between groups
Within groups
Total
2
45
47
0.001
0.002
0.003
3.066E4
4.776E-5
6.418**
Appendix 3.19. One-factor ANOVA for log (1+x) of adillt male numbers per cm.2 among
different foliage heights.
Source DF Sum of square Mean square F-test
Between groups
Within groups
Total
2
45
47
0.001
0.008
0.010
0.001
1.889E4
2.862ns.
Appendix 3.20. One-factor ANOVA for log (1+x) of immature numbers per cm.2 among
different foliage heights.
Source DF Sum of square Mean square F-test
Between groups
Within groups
Total
2
45
47
0.034
0.151
0.184
0.017
0.003
5.045*

437
Appendix 3.21. One-factor ANOVA for log (1+x) of egg numbers per cm.2 among different
- foliage heights.
Source DF Sum of square Mean square F- test
Between groups
Within groups
Total
2
45
47
0.102
0.593
0.695
0.051
0.013
3.862*
Appendix 3.22. One-factor ANOVA for log (1+x) of total mite numbers per cm.2 among
different foliage heights.
Source DF Sum of square Mean square F-test
Between groups
Within groups
Total
2
45
47 .
0.196'
0.822
1.018
0. 0 9 8
0.018
5.369**
Appendix 3.23. One-factor ANOVA for log (1+x) of Stethorus numbers per cm.2 among
different foliage heights.
Source DF Sum of square Mean square F-test
Between groups
Within groups
Total
2
45 -
47
2.466E-5
2.272E-4
2.518E-4
1.233E-5
5.048E-6
2.442ns
Appendix 3.24. One-factor ANOVA' for log (1+x) of predatory mite numbers per cm.2
among different foliage heights.
Source DF Sum of square Mean square F-test
Between groups
Within groups
Total
2
45•
47
2.735E-6
2.598E-5
2.872E-5
1.368E-6
5.774E-7
2.368ns

438
Appendix 3.25. One-factor ANOVA for log (1+x) of adult female numbers per gm. among .
different foliage heights.
Source
DF Sum of square Mean square F-test
Between groups 2 1.222 0.611 10.098**
Within groups 45 2.722 0.060
Total 47 3.943
Appendix 3.26. One-factor ANOVA for log (1+x) Of adult male numbers per gm. among
different foliage heights.
Source DF Sum of square Mean square F-test
Between groups 2 0.718 0359 3.589*
Within groups 45 4.502 0.100
Total 47 5.220
Appendix 3.27. One-factor ANOVA for log (1+x) of immature numbers per gm. among
different foliage heights. •
Source DF Sum of square Mean square F-test
Between groups
3.215 1.607 9.290**
Within groups
7.787 0.173
Total
47
11.002
Appendix 3.28. One-factor ANOVA for log (1+x) of egg numbers per gm. among different
foliage heights.
Source DF Sum of square Mean square F-test
Between groups 2 2.500 1.250 2.825ns
Within groups 45 . 19.912 0.442
Total 47 22.412

439
Appendix 3.29. One-factor ANOVA for log (14-x) of total mite numbers per gm. among
different foliage heights.
Source DF Sum of square Mean square F-test
Between groups
Within groups
Total
2
45
47
3.719
13.125
16.844
1.860
0.292
6.376**
Appendix 3.30. One-factor ANOVA for log (1+x) of Stethorus numbers per gm. among
different foliage heights.
Source DF Sum of square Mean square F-test
Between groups
Within groups
Total
2
45
47
0.138
1.028
1.166
0.069
0.023
3.018ns
Appendix 3.31. One-factor ANOVA for log (1+x) of predatory mite numbers per gm. among
different foliage heights.
Source DF Sum of square Mean square F-test
Between groups 2 0.029 . 0.014 2.464ns
Within groups 45 0.263 0.006
Total 47 0.292
Appendix 4.1. One-factor .ANOVA for total numbers of mites per leaf among different
genotypes infested artificially on the 1st- sampling occasion under glasshouse conditions.
Source DF Sum of square Mean square F-test
Between groups
Within groups
Total
25
78
103
346418.9615
740679.0
1087097.9615
13856.7585
9495.8846
1.4592ns

440
Appendix 4.2. One-factor ANOVA for log (1+x) of mite numbers per leaf among different
genotypes infested artificially on the 1st. sampling occasion under glasshouse conditions.
Source
DF Stun of square Mean square F-test
Between groups
Within groups
Total
25
78
103
14.1301
20.9271
35.0572
0.5652
0.2683
2.1066**
Appendix 4.3. One-factor ANOVA for total numbers of mites per leaf among different
genotypes infested artificially on the 2n1. sampling occasion under glasshouse conditions.
Source
DF Sum of square Mean square F-test
Between groups
Within groups
Total
25
78
103
725117.0865
671847.7500
1396964.8365
29004.6835
8613.4327
3.3674**
Appendix 4A. One-factor ANOVA for log (1+x) of mite numbers per leaf among different
genotypes infested artificially on the 2nd. sampling occasion under glasshouse conditions.
Source
DF Sum of square Mean square F-test
Between groups
Within groups
Total
25
78
103 -
11.0022
10.7676
21.7698
0.4401
0.1381
3.1879**
Appendix 4.5. One-factor ANOVA for total numbers of mites per leaf among different
genotypes infested artificially on the 3rd. sampling occasion under glasshouse conditions.
Source DF Sum of square Mean square F-test
Between groups 25 1030681.1154 41227.2446 1A0lOns
Within groups 78 2295259.0 29426.3974
Total 103 3325940.1154

441
Appendix 4.6. One-factor ANOVA for log (1+x) of mite numbers per leaf among different
genotypes infested artificially on the 3rd- sampling occasion under glasshouse conditions.
Source DF Sum of square Mean square F-test
Between groups 25 8.3681 0.3347 13479ns
'Within groups 78 16.8668 0.2162
Total 103 25.2349
Appendix 4.7. One-factor ANOVA for total numbers of mites per leaf among different
genotypes infested artificially on the 4th- sampling occasion under glasshouse conditions.
Source DF Sum of square Mean square F-test
Between groups
Within groups
Total
25
78
103
1.20136E7
79761835
1.99898E7
. 480545.9954
102258.7628
4.6993**
Appendix 4.8. One-factor ANOVA for log (1+x) of mite numbers per leaf among different
genotypes infested artificially on the 4th- sampling occasion under glasshouse conditions.
Source DF Sum of square Mean square F-test
Between groups
Within groups
Total
25
78
103
13.3496
11.6853
25.0349
0.5339
0.1498
3.5644**

442
Appendix 4.9. The mean size of eggs, adult males and adult females
reared on 26 genotypes of hops under glasshouse conditions.
Genotype
Eggs
Stages of TSSM (mm.)
Adult males Adult females
M1 0.14 0.36 0.45 M2 0.15 0.24 0.45 M3 0.15 , 0.30 0.54 M4 0.15 0.36 0.57 M5 0.15 0.30 0.54 M6 0.15 033 0.45
0.15 0.30 0.48 M8 0.15 0.30 0.51 M9 0.15 0.30 0.48 M10 0.15 0.36 0.45 Mll 0.15 0.33 0.48 M12 0.15 0.33 0.45 M13 0.15 0.33 0.48 M14 0.15 0.30 0.36 M15 0.15 0.36 0.45 M16 0.15 030 0.45 M17 0.15 030 0.48 M18 0.15 030 0.51 M19 0.15 0.33 0.48 M20 0.15 .0.33 0.51 M21 0.15 0.33 0.51 M22 0.15 030 0.48 M23 0.15 0.33 0.48 M24 0.15 0.30 0.51 M25 0.15 030 0.45 M26 0.15 033 0.45

443
Appendix 4.10. One-factor ANOVA for total mite numbers per leaf among different
genotypes in the first experiment of artificial infestations under glasshouse conditions.
Source DF Sum of square Mean square f-test
Between groups
Within groups
Total
25
78
103
2.78431E7
117858165
3.96289E7
1113723.60615
151100.21154
7.37076**
Appendix 4.11. One-factor ANOVA for numbers of mites among different genotypes in the
second experiment of artificial infestations under glasshouse conditions.
Source
DF Sum of square Mean square F-test
Between groups
Within groups
Total
25
78
103
703.0385
2802.5000
3505.5385
28.1215
35.9295
0.7827ns
Appendix 4.12. One-factor ANOVA for numbers of mites among different genotypes grown
at the Horticultural Research Centre during 1991/92 season.
Source DF Sum of square Mean square F-test
Between groups
Within groups
Total
11
60
71
10.5806
18.9921
29..5727
0.9619
03165
3.0388**
Appendix 4.13. One-factor ANOVA for numbers of mites among different genotypes grown
at the Horticultural Research Centre during 1992/93 season.
Source DF Sum of square Mean square F-test
Between groups
Within groups
Total
11
36
47
0.0313
0.1541
0.1854
0.0028
0.0043
0.6644ns

Appendix 4.14. One-factor ANOVA for numbers of mites per leaf among different
genotypes infested naturally under glasshouse conditions.
Source
DF Sum of square Mean square F-test
Between groups
Within groups
Total
25
130
155
23058.3397
59600.5000
82658.8397
922.3336
458.4654
2.0118**
Appendix 4.15. One-factor ANOVA for numbers of mites per cm.2 among different
genotypes infested naturally under glasshouse conditions.
Source DF Sum of square Mean square F-test
Between groups
Within groups
Total
25
130
155
1604.4820
3270.2575
4874.7395
64.1793
25.1558
2.5513**
Appendix 4.16. One-factor ANOVA for log (x+1) of mite numbers per cm.2 among 24
genotypes of hops infested naturally in Hop Yard No. 1 on February 6, 1992.
Source DF Sum of square Mean square F-test
Between groups
Within groups
Total
23
96
119
0.47468
1.11472
1.58940
0.02064
0.01161
1.77736*
Appendix 4.17. One-factor ANOVA for log (x+1) of mite numbers per cm.2 among 24
genotypes of hops infested naturally in Hop Yard No. 1 on February 20, 1992.
Source DF Sum of square Mean square F-test
Between groups
Within groups
Total
23
96
119
0.54950
0.84569
1.39519
0.02389
0.00881
2.7121**

445
Appendix 4.18. One-factor ANOVA for log (x+1) of mite numbers per cm.2 among 24
genotypes of hops infested naturally in Hop Yard No. 1 on March5, 1992.
Source DF Sum of square Mean square F-test
Between groups
Within groups
Total
23
%
119
1.49748
1.72013
3.21761
0.06511
0.01792
3.6336**
Appendix 4.19. One-factor ANOVA for log (x+1) of total mite numbers per cm.2 among 24
genotypes of hops infested naturally in Hop Yard No. 1 during 1991/92 season.
Source
DF Sum of square Mean square F-test
Between groups
Within groups
Total
23
96
119
2.94658
1.86514
4.81173
0.12811
0.01943
6.5940**
Appendix 4.20. One-factor ANOVA for mite numbers Per cm.2 among 24 genotypes of hops
infested naturally in Hop Yard No. 1 on November 4, 1992.
Source DF Sum of square Mean square F-test
Between groups
Within groups
Total
23
72
95
0.08788
0.12489
0.21276
0.00382
0.00173
2.2028**
Appendix 4.21. One-factor ANOVA for mite numbers per cm.2 among 24 genotypes of hops
infested naturally in Hop Yard No. 1 on November 18, 1992.
Source DF Sum of square Mean square F-test
Between groups
Within groups
Total
23
72
95
16.21937
_ 5.48054
21.69991
0.70519
0.07612
9.2644**

446
Appendix 4.22. One-factor ANOVA for total mite numbers per cm.2 among 24 genotypes.of
•. hops infested naturally in Hop Yard No. 1 during 1992/93 season.
Source DF Sum of square Mean square F-test
Between groups
Within groups
Total
23
72
95
18.34757
5.27602
23.62359
0.79772
0.07328
10.8862**
Appendix 4.23. One-factor ANOVA for damage ratings among 26 hop genotypes following
the infestations under glasshouse conditions.
Source
DF Sum of square Mean square F-test
Between groups
Within groups
Total
25
78
103
31.49038
37.12500
68.61538
1.25962
0.47596
2.6465**
•Appendix 4.24. Kruslcal-Wallis test for mean ranks of cumulative mite-days among 24 hop
genotypes grown in Hop Yard No. 1 during three growing seasons.
•
Parameters , DF # Groups # Cases H values
Adult females 23 24 72 253091ns
'Adult males 23 24 72 17.9342ns
Immatures 23 24 72 27.1780ns
Eggs 23 24 72 27388 ins
Motiles 23 24 72 27.1854ns
All stages 23 24 72 29.0282ns
Appendix 4.25. Mann-Whitney U test for mean ranks of cumulative mite-days between
two hop genotypes grown in Hop Yard No.2 during three growing seasons.
Parameters U-prime Z values
Adult females •0 9 -1.9640*
Adult. males 0 9 -1.9926*
Immatures 0 9 -1.9640*
Eggs 0 9 -1.9640*
Motiles 0 • . 9 • -1.9640*
All stages 0 • • 9 . -1.9640*

1.
447
Appendix 4.26. One-factor ANOVA for intemode lengths among 26 hop genotypes grown
under glasshouse conditions.
Source DF Sum of square Mean square F-test
Between groups
Within groups
Total
25
78
103
269.57325
624.27057
893.84382
10.78293
8.00347
1.3473ns
Appendix 4.27. One-factor ANOVA for surface areas of hop leaves among 26 genotypes
grown under glasshouse conditions.
Source DF Sum of square Mean square F-test
Between groups
Within groups
Total
25
494
519
126.33583
857.91292
984.24875
5.05343
1.73667
2.9099**
Appendix 4.28. One-factor ANOVA for numbers of leaves among 26 hop genotypes grown
under glasshouse conditions.
Source DF Sum of square Mean square F-test
Between groups
Within groups
Total
25
- 78
103
39226.00962
60179.75000
99405.75962
1569.04038
771.53526
2.0337**
Appendix 4.29. One-factor ANOVA for numbers of fillers among 26 hop genotypes grown
under glasshouse conditions.
Source DF Sum of square Mean square F-test
Between groups
Within groups
Total
25
78
103
441.16346
407.75000
848.91346
17.64654
5.22756
3•3757**

448
Appendix 4.30. One-factor ANOVA for plant heights among 26 hop genotypes grown
under glasshouse conditions.
Source
DF Sum of square Mean square F-test
Between groups
Within groups
Total
25
52
77
10652838462
2606733333
132595.71795
4261.13538
501.29487
8.500
Appendix 4.31. One-factor ANOVA for surface areas of hop leaves among 26 genotypes
grown under field conditions.
Source DF Sum of square Mean square • F-test
Between groups
Within groups
Total
25
208
233
403602.94705
430920.43931
83452338636
16144.11788
2071.73288
7.7926**
Appendix 4.32. One-factor ANOVA for dry weights of hop leaves among 26 genotypes
grown under field conditions.
Source DF Sum of square Mean square F-test
Between groups
Within groups
Total
25
208
233
22.97234
12.73264
35.70498
0.91889
0.06121
15.0110**
Appendix 433. One-factor ANOVA for numbers of cones per vine among 26 hop genotypes
grown at the Horticultural Research Centre during the 1991/92 season.
Source
DF Sum of square Mean square F-test
Between groups
Within groups
s Total
11
' 60
71
2646305.77778
4792438.66667
7438744.44444
240573.25253
79873.97778
3.0119**

449
Appendix 4.34. One-factor ANOVA for dry weight per cone among 26 hop genotypes grown
at the Horticultural Research Centre during the 1991/92 season.
Source
DF Sum of square Mean square F-test
Between groups
Within groups
Total
11
60
71
0.23689
0.35043
0.58732
0.02154
0.00584
3.6873**
Appendix 4.35. One-factor ANOVA for dry weights of cones per vine among 26 hop
genotypes grown at the Horticultural Research Centre during the 1991/92 season.
Source DF Sum of square Mean 'square F-test
Between groups
Within groups
Total
11
60
71
36077.73486
67130.92500
103208.65986
3279.79408
1118.84875
2.9314**
Appendix 4.36. One-factor ANOVA for numbers of cones per vine among 26 hop genotypes
grown at the Horticultural Research Centre during the 1992/93 season.
Source DF Sum of square Mean square F-test
Between groups
Within groups-
Total
11
60
71
4821664.13338
5122343.34356
9944007.47694
438333.10303
8537238906
5.1344**
Appendix 4.37. One-factor ANOVA for dry weight per cone among 26 hop genotypes grown
at the Horticultural Research Centre during the 1992/93 season.
Source
DF Sum of square Mean square ' F-test
_ Between groups
Within groups
Total
11 •
60
71
0.26484 •
0.13086
0.39570
0.02408
0.00218
11.0395**
Appendix 4.38. One-factor ANOVA for dry weights of cones per vine among 26 hop•
• genotypes grown at the Horticultural Research Centre during the 1992/93 season.
Source
DF Sum of square Mean square F-test
Between groups
Within groups
Total •
11
60
71
208372.89651
175281.94693
383654.84344
18942.99059
2921.36578
6.4843**

450
Appendix 4.39. One-factor ANOVA for dry weights of cones per vine among between •
different blocks of hops grown at the Horticultural Research Centre during the 1992/93
season.
•
Source
DF Sum of square Mean square F-test
Between groups 2 14853.33129 7426.66564 13895ns
Within groups 69 36880151216 5344.94945
Total 71 383654.84344
Appendix 4.40. One-factor ANOVA for dry weight per cone among between different
blocks of Nips grown at the Horticultural Research Centre during the 1992/93 season.
Source
DF Sum of square Mean square F-test
Between groups
Within groups
Total
2
69
71
0.00229
0.39341
0.39570
0.00114
0.00570
0.2006ns
Appendix 4.41. One-factor ANOVA for the number of cones per vine among between
different blocks of hops grown at the Horticultural Research Centre during the 1992/93
season.
Source DF Sum of square Mean square F-test
Between groups
Within groups
Total
2
69
71
2075633774
9736444.0995
9944007.4769
103781.6887
141107.8855
0.7355ns
Appendix 5.1. One-factor ANOVA for hatchability of TSSM among four genotypes of
hops in Experiment 1.
Source DF Sum of square Mean square F-test
Between groups
Within groups
Total
3
• 8
.11 •
0.03202
0.11784
0.14986
- 0.01067
0.01473
0.7247ns

451
Appendix 5.2. One-factor ANOVA for survival of TSSM immatures among four genotypes
of hops in Experiment 1.
Source
DF Sum of square Mean square F-test
Between groups
Within groups
Total
3
8
11
0.11811
0.12364
0.24175
0.03937
0.01545
2.5474ns
Appendix 5.3. One-factor ANOVA for sex ratio (F/M) of TSSM among four genotypes of
hops in Experiment 1.
Source • DF Sum of square Mean square F-test
Between groups
Within groups
Total
3
8
11
1.74854
10.76493
12.51347
0.58285
1.34562
0.4331ns
Appendix 5.4. One-factor ANOVA for longevity of TSSM among four genotypes of hops in
Experiment 1.
Source DF Sum of square Mean square F-test
Between groups.
Within groups
Total
3
54
57
145.09534
2385.31845
2530.4137,9
48.36511
4,4.17256
1.0949n.s
Appendix 5.5. One-factor ANOVA for the cumulative number of eggs laid by TSSM among
four genotypes of hops during the first fourth days of ovipositon in Experiment 1.
Source DF Sum of square Mean square F-test
Between groups
Within groups
Total
3
54
57
3215.3555
11016.5238
14231.8793
1071.78517
204.00970
5.2536**

452
Appendix 5.6. Daily record of the numbers of TSSM females and their
eggs on four genotypes of hops in Experiment 1.
Date M4
Females Eggs
Genotype M9 M26
Females Eggs Females Eggs M27
Females Eggs
0-11 16 7 16 13 14 30 12 41
12 16 69 16 99 14 107 12 119
13 14 119 16 170 11 178 12 160
14 14 121 16 140 11 115 12 171
15 14 111 15 115 11 126 12 152
16 14 115 13 80 11 116 12 141
17 14 112 13 65 10 111 11 156
18 12 79 12 56 7 71 11 111
• 19 11 87 9 92 6 81 11 106
20 10 76 9 77 6 78 11 81
21 9 59 9 69 6 37 9 55
22 9 54 9 60 6 32 9 46
23 9 81 7 65 . 5 31 7 41
24 8 67 7 45 3 17 6 22
25 8 56 7 28 3 14 5 12
26 8 45 6 29 2 20 5 13
27 6 46 6 39 1 6 5 14
28 6 44 4 15 1 5 3 6
29 5 28 3 6 1 0 2 • 0
30 4 18 2 0 1 0 2 1
31 4 15 0 0 ' 1 0 2 0
32 3 8 1 0 0 0
33 2 6 1 0
34 2 4 1 0
35 2 2 1 0
36 0 1 0
37 1 0
38 1 0
39 1 0
40 1 0
41 0_, 0

453
Appendix 5.7. Life-fecundity table for TSSM on four genotypes of hops in
Experiment 1.
Genotype
Ix
.M4 ma 1m tx
M9 mx
M26 M27 lxmx Ix mx 1xmx Ix mx lxmx
0-11 1.000 0.219 0.219 1.000 0.406 0.406 1.000 1.071 1.071 1.000 1.708 1.708
12 1.000 2.156 2.156 1.000 3.094 3.094 1.000 3.821 3.821 1.000 4.958 4.958
13 0.875 4.250 3.719 1.000 5.313 5.313 0.786 8.091 6357 1.000 6.667 6.667
14 0.875 4.321 3.781 1.000 4.375 4.375 0.786 5.227 4.107 1.000 7.125 7.125
15 0.875 3.964 3.469 0.938 3.833 3.594 0.786 5.727 4.500 1.000 6333 6333
16 0.875 4.107 3.594 0.813 3.077 2.500 0.786 5.273 4.143 1.000 5.875 5.875
17 0.875 4.000 3.500 0.813 2.500 2.031 0.714 5.550 3.964 0.917 7.091 6500
18 0.750 3.29.2 2.469 0.750 2.333 1.750 0.500 5.071 2.536 0.917 5.046 4.625
19 0.688 3.954 2.719 0.563 5.111 2.875 0.429 6.750 2.893 0.917 4.818 4.417
20 0.625 3.800 2.375 0.563 4.278 2.406 0.429 6.500 2.786 0.917 3.682 3375
21 0.563 3.278 1.843 0.563 3.833 2.156 0.429 3.083 1321 0.750 3.056 2.292
22 0.563 3.000 1.688 0.563 3.333 1.875 0.429 2.667 1.143 0.750 2556 1.917
23 0.563 4.500 2.531 0.438 4.643 2.031 0.357 3.100 1.107 . 0.583 2.929 1.708
24 0500 4.188 2.094 0.438 3.214 1.406 0.214 2.833 0.607 0.500 1.833 0.917
25 0500 3.500 1.750 0.438 2.000 0.875 0.214 2.333 0.500 0.417 1.200 0.500
26 0.500 2.813 1.406 0.375 2.417 0.906 0.143 5.000 0.714 0.417 1300 0542
27 0.375 3.833 1.438 0.375 3.250 1.219 0.714 3.000 0.214 0.417 1.400 0.583
28 0.375 3.667 1.375 0.250 1.875 0.469 0.071 2.500 0.179 0.250 1.000 0.250
29 0313 2.800 0.875 0.188 1.000 0.188 0.071 0.000 0.000 0.167 0.000 0.000
30 0.250 2.250 0.563 0.125 0.000 0.000 0.071 0.000 0.000 0.167 0.250 0.042
31 0.250 1.875 0.469 0.000 0.000 0.000 0.071 0.000 0.000 0.167 0.000 0.000
32 0.188 1.333 0.250 0.071 0.000 0.000 0.000 0.000 0.000
33 0.125 1.500 0.188 0.071 0.000 0.000
34 0.125 1.000 0.125 0.071 0.000 0.000
35 0.125 0.500 0.063 0.071 0.000 0.000
36 0.000 0.000 0.000 0.071 0.000 0.000
37 0.071 0.000 0.000
38 0.071 0.000 0.000
39 0.071 0.000 0.000
40 0.071 0.000 0.000
41 0.000 0.000 0.000
aThe proportion of the offsprings that were females was assumed to be 0.5.

Appendix 5.8. Reproductive parameters of TSSM on 27 hop genotypes in Test 1 of Experiment 2.
Reproductive Parameters
Genotypes Pre-reproductive
period
rm
(Birch) rm
(Wyatt and White) Ro T rc Tc Finite rate
for increase Doubling time Natality
M1 9.375 0.2952 0.3052 48.750 13.166 0.2491 15.605 1.3434 2.3476 4.1071 M2 9.000 0.3103 0.3172 39.300 11.831 0.2853 12.868 1.3638 2.2333 5.3541 M3 8.110 0.3342 0.3631 41.111 11.120 0.2933 12.669 1.3968 2.0736 5.2923 M4 10.429 0.2426 02454 • 44.786 15.671 0.1967 19.329 1.2746 2.8567 1.9248 M5 8.077 0.3424 0.3515 51.962 11538 0.2507 15.759 1.4083 2.0239 53655 M6 8.857 0.3024 03153 51.286 13.021 0.2232 17.644 1.3531 2.2917 3.0902 M7 8.750 0.3223 03541 ' 56.875 12.538 0.2613 15.463 1.3803 2.1502 4.1802 M8 8.000 0.3443 03428 50.071 11366 0.2662 14.703 1.4110 2.0128 5.3363 M9 8.429 0.3072 03305 . 32.571 11.339 0.2792 12.478 13596 2.2559 3.6657 M10 7.833 0.3335 0.3415 38.917 10.979 0.2892 12.659 1.3958 2.0780 4.8437 Mll 8.000 0.3673 0.3846 47.250 10.497 0.3456 11.156 . 1.4438 1.8867 73221 M12 8.000 0.3686 0.3779 54.375 10.841 0.3172 12598 1.4457 1.8801 6.8483 M13 8.000 0.3372 0.3352 42.813 11.141 0.2843 13.216 1.4010 2.0552 4.6960 M14 8.833 0.3308 0.3452 56.833 12213 0.2699 14.969 1.3921 2.0949 4.1624 M15 8.800 0.3172 03303 49.300 '12.289 0.2505 15558 1.3733 2.1847 3.7535 M16 8.286 0.3545. 0.3589 69.357 11.958 0.2979 14.232 1.4255 1.9549 5.1877 M17 9.444 0.2939 0.2913 . 50.889 13.371 0.2370 16.582 1.3416 2.3579 3.8069 M18 8.857 0.3315 03397 61.357 12.418 0.2815 14.622 1.3931 2.0905 4.0152 .M19 8.750 0.3276 03418 64.125 12.701 0.2692 15.454 1.3876 2.1154 3.8471 M20 8.857 0.3222 0.3351 '40.929 11520 0.2927 12.681 1.3802 2.1508 3.8592 M21 10.250 0.2794 0.2699 49.875 13.993 0.2427 16.110 1.3223 2.4803 4.01343 M22 10.600 02663 02644 ' 78.000 16360 0.1933 22541 13051 2.6023 . 3.3542 M23 8.000 '0.3307 0.3218 46.773 11.628 0.2700 14.244 1.3919 2.0956 '4.1772 M24 7.889 0.3761 0.3648 71.556 11.355 0.2817 15.158 1.4566 1.8426 6.6767 M25 9.833 0.2372 0.2748 37.278 15.255 . 0.1836 19.712 1.2677 2.9216 25711 M26 10.000 02764 02703 52.600 14.337 0.2167 18.288 13184 25072 . 4.1617 M27 8.857 0.3453 0.3491 75.786 12534 0.2660 16.270 1.4124 2.0070 4.6530

Appendix 5.9. Reproductive parameters of TSSM on 27 hop genotypes in Test 2 of Experiment 2.
Genotypes
Reproductive Parameters
Pre-reproductive rm period (Birch)
Tm
(Wyatt and White)
Ro I rc Tc Finite rate for increase
Doubling time• Natality
M1 M2 M3 M4 M5 M6 M7 M8 M9 M10 M1 f M12 M13 M14 M15 M16 M17 M18 M19 M20 M21 M 22 M23 M24.,M25b M261, M27'
16.250 16.000 17.000 17.000 16.667 . 17.000 16.500 17.000 16500 16.167
- 16.625 17.600 15.833 16.000 16.333 17.500 17.000 16.670 16.000 16.670 17.000 16.750 17.500 16.000 16.667 16.333
0.1457 0.1805 0.1436 0.1401 0.1659 0.1673 0.1814 0.1710 0.1505 0.1672
- 0.1470 0.1590 0.1644 0.1579 0.1790 0.1420 0.1675 0.1317 0.1808 0.1352 0.1582 0.1509
-
0.1457
0.1650 0.2047 0.1735 0.1799 0.1794 0.1736 0.1917 0.1898 0.1861 0.1857
- 0.1758 0.1686 0.1952 0.1873 0.1814 0.1687 0.1832 0.1703 0.1828 0.1482 0.1871 0.1449 0.1522
-
21.875 32.000 22.167 20.167 543(X) 38.250 82.000 49563 42.143 42.333
- 26.944 55.400. 36.000 31.188 61.333 27.400 53.250 16.500 52.000 14300 45.000 19.500 27.375
-
21.176 19.201 21.578 21.442 24.100 21.782 24.293 22.826 ' 24.858 22.402
22.407 25249 21.798 21.786 22.996 23.613 23.731 21.286 21.854 19.779 24.062 19.685 22.715
1.
0.1378 0.1636 0.1378 0.1333 0 .1403 0.1601 0.1575 0.1584 0.1349 0.1519
_
0.1286 0.1429 0.1450 0.1420 0.1620 0.1244 0.1503 0.1216 0.1732 0.1319 0.1453 0.1492 0.1381 .
-
22.386 21.181 22.489 - 22.529 28.492 22.768 27.973 24.638 27.737 24.663
- 25.604 28.098 24.708 24.220 25.413 26.604 26.446 23.057 22.808 20.270 26.206 19.910 23.973
-
1.15681.1978 1.1544 1.1504 1.1805 1.1821 1.19891.1865 1.1624 1.1820
1.1584 1.1723 1.1787 1.1710 1.1960 1.1505 1.1823 1.1408 1.1982 1.1448 1.1714 1.1629 1.1568
-
4.7563 3.8393 4.8259 4.9465 4.1772 4.1423 3.8203 4.0526 4.6047 4.1447
4.7143 4.3585 4.2153 4.3889 3.8715 4.9429 4.1373 5.2620 3.8330 5.1257 4.3805 45924 4.7563
-
1.9392 2.6876 2.9816 2.6304 2.6447 3.3507 3.1720 2.8264 2.4707 2.2731
- 2.3247 1.9325 2.3316 2.7060 2.9281 2.4162 3.3010 1.7891 3.0852 1.982791 3.98
2.1386 1.9463
- -
a = All immatures reaching adults were males. b = Some chemical residues were found on field hop leaves late in the season.

Appendix 5.10. Reproductive parameters of TSSM on 27 hop genotypes in Test 3 of Experiment 2.
Genotypes Reproductive Parameters
Pre-reproductive rm. period (Birch)
rm (Wyatt and White)
Ro T rc Tc Finite rate for increase
Doubling time Natality
MI 12.200 0.1614 0.1574 11.833 15.309 0.1583 15.606 1.1752 4.2937 1.7891 M2 12.000 02364 0.2392 41.929 15.804 0.2123 17595 1.2667 2.9315 3.0852 M3 12.167 0.2215 0.2379 28.125 15.064 0.2122 15.724 1.2479 3.1287 1.9279 M4 12.000 0.1927 • 0.1884 16.750 14.626 • 0.1883 14.970 1.2125 3.5963 3.8981 M5 12.500 0.2231 0.2315 46375 17.198 0.2045 18.763 1.2499 3.1062 2.1386 M6 12.000 0.2089 0.2231 32.250 16.628 0.1751 19.835 12323 3.3174 1.9453 M7 11.714 0.2238 0.2537 32.750 15589 02086 16.725 1.2508 3.0965 1.3303 M8 11.800 02395 02453 43500 15.753 0.2082 18.119 1.2706 2.8935 4.2753 M9 11571 0.2287 0.2377 26.700 14363 0.2216 14.824 1.2570 3.0302 2.7291 M10 11571 02081 0.2406 19.400 14249 0.2016 14.706 1.2313 3.3301 2.4592 Mn 11.625 02532 02672 68583 16.699 0.2179 19.407 1.2881 2.7370 3.1053 M12 10.000 02411 0.2678 43500 15.648 0.2115 17.835 1.2726 2.8743 3.1447 M13 11.250 02445 02495 43.667 15.446 02069 18256 12770 2.8344 3.0386 M14 11.600 0.257,7 01646 34.667 13.759 0.2472 14341 1.2940 2.6892 3.1902 M15 12.000 0.1912 0.1897 13.333 13547 0.1886 13.738 1.2107 3.6245 3.2481 MI6 12.000 02432 02414 41.250 15.295 02148 17.318 1.2753 2.8495 2.7384 M17 11.330 0.2399 0.2521 40.214 15.399 0.2141 17.254 1.2711 2.8887 3.8074 M18 11.800 0.2542 02557 57.250 15.922 0.2276 17.782 1.2894 2.7262 3.7087 M19 11.750. 0.1978 0.2230 16.750 14.249 0.1925 14.642 1.2187 3.5035 3.6740 M20 11.830 02113 0.2278 25.750 15.374 0.1973 16.466 1.2353 3.2797 5.3686 M21 12.000 0.1415 0.1440 6:625 13.363 0.1406 13.453 1.1520 4.8975 2.9559 .M22 12.250 0.2130 0.2106 34583 16.636 0.1693 20.935 1.2374 3.2535 4.9092 M23 12.000 0.2215 02081 29.000 15.202 0.2172 15500 1.2479 3.1287 355(X": M24a 12.000 02171 02486 33.500 16.175 0.1988 17.664 1.2425 3.1921 3.7920 M25a . - - - - - -
M26 M27 13.000 0.2163 0.2089 63.250 19.173 0.1753 23.660 1.2415 3.2039 4.0988
a = Some chemical residues were found on field hop leaves.

Appendix 511. Reproductive parameters of TSSM on 27 hop genotypes in Test 4 of Experiment 2.
Reproductive Parameters
Genotypes Pre-reproductive rm
period (Birch)
rm (Wyatt and White)
Ro T rc Tc Finite rate
for increase
Doubling time Natality
M1 11.000 0.2548 0.2604 76.000 16.997 02102 20.602 1.2902 2.7198 3.7095 M2 10.857 0.2647 0.2880 50500 14.817 02419 16.215 13030 2.6181 35835 M3 11.000 0.2427 0.2814 44.500 15.639 0.2158 17.588 1.2747 2.8554 4.2457 M4 11.800 0.2415 0.2451 54.000 16518 0.2188 18.232 1.2732 2.8696 4.2906 M5 11.000 028% 0.2956 113300 16.339 0.2468 19.176 1.3359 2.3930 6.1245 M6 13.200 0.2122 02124 74.000 20.283 0.1744 24.679 1.2364 3.2658 3.0665 M7 11.200 0.2737 02735 71500 15.600 0.2368 18.032 1.3148 25320 4.9304 M8 10.330 0.2696 0.2788 57.250 15.013 0.2287 17.699 1.3094 25705 3.6651 M9 11.000 0.2597 02702 50500 15.102 0.2348 16.703 1.2965 2.6685 3.1184 M10 11.250 0.2652 0.2583 42500 14.138 0.2553 14.688 1.3037 2.6131 4.9944 MU 12.000 0.2548 0.2550 87500 17550 0.2081 21.486 1.2902 2.7198 4.7885 M12 10.833 0.1279 0.1012 4500 11.760 0.1277 11.778 1.1364 5.4183 2.1729 M13 11500 0.24$5 0.2482 72.000 17.420 0.2169 19.715 1.2783 2.8228 4.1579 M14 11.250 0.2872 02900 113.000 16.460 0.2323 20.354 1.3327 2.4130 5.8825 M15 11.000 01767 0.2800 69.750 15.341 0.2551 16.638 1.3188 25045 5.1841 M16 11.000 0.2647 0.2708 46.750- 14525 , 0.2505 15.348 1.3030 2.6181 4.7798 M17 12.110 - 0.2021 0.2168 40.400 18.302 0.1823 20.290 1.2240 3.4290 1.7231 M18 11.000 0.2735 02498 41.000 13378 0.2671 13.902 1.3146 25338 6.0106 M19 12.000 0.2685 0.2684 82.000 16.412 02121 20.781 1.3080 25810 4.5130 M20a - - - -' - _ M21 11.000 0.2267 0.2611 30250 15.112 0.2081 16.463 1.2545 3.0569 3.6264 M22 11.000 0.2651 02661 58.250 15.333 0.2293 17.725 1.3036 2.6141 4.6709 M23 11.000 0.2716 02795 62.250 15.211 0.2554 16.177 1.3121 2.5515 4.9916 M24 11.000 0.2754 0.2625 53500 14.451 0.2595 15.336 1.3171 25163 5.3142 M25 13.000 0.2218 0.2204 96500 20.602 0.1768 25.850 1.2483 3.1244 35588 M26 13.000 0.2052 0.2071 115500 23.145 0.1561 30.424 1.2278 3.3772 2.6724 M27 12.000 0.2055 0.2103 54.773 19.480 0.1588 25.203 1.2281 3.3723 3.1871
a = All immatures reaching adults were males.

458
Appendix 5.12. Reproductive parameters of TSSM reared on three
different surface areas of leaf discs cut from 24 hop genotypes.
Reproductive parameters Large
Surface areas of leaf discs Medium Small
Field hop leaf discs Intrinsic rate of increase (Wyatt) 0.2707 0.2448 0.2408 Intrinsic rate of increase (Birch) 0.2604 0.2322 0.2228 Gross reproductive rate 120.645 73.429 52.046 Net reproductive rate 80.813 38.688 36.563 Capacity for increase 0.2109 0.2051 0.2006 Mean generation time 16.867 15.743 16.154 Cohort generation time 20.830 17.824 17.939 Pre-reproductive period 11.630 11.670 . 11.750 Finite rate of increase 1.2970 1.2610 1.2500 Doubling time 2.6610 2.9840 3.1100 Natality 4.2918 3.1102 2.6231 Mortality 4.0314 '2.8780 2.4003 Total number of eggs 161.625 77.375 73.125 Longevity (days) 32.000 22.875 23.958 Glasshouse hop leaf discs Intrinsic rate of increase (Wyatt) 0.3013 0.2854 0.2659 Intrinsic rate of increase (Birch) 0.2754 0.2613 0.2362 Gross reproductive rate 117.860 88.379 56.548 Net reproductive rate 86.031 69.127 36.663 Capacity for increase 0.2290 0.2206 0.2146 Mean generation time 16.175 16.211 15249 Cohort generation time 19.449 19.201 16.784 Pre-reproductive period 11.000 11.090 11350 • Finite rate of increase 1.3170 1.2990 1.2660 Doubling time 2.5160 2.6520 2.9340 Natality 3.9758 3.3051 2.5708 Mortality 3.7004 3.0438 23347 Total number of eggs 172.060 138254 73326 Longevity (days) 31.040. 31.208 23500

, 459
Appendix 6.1. Daily record of numbers of TSSM reaching each stage on M4 and M27 at
76%RH and three temperatures with a light intensity of 171 lux; E. = egg, L. = larva, PC. =
Protochrysalis, PN. = Protonymph, DC. = Deutochrysalis, DN. = Deutonymph, TC. =
Teleiochrysalis, MA. = Male adult, FA. = Female adult.
TSSM on M4 at 20°C
Date E. L.
Mite stages
PC. PN. DC. DN. TC. MA. FA.
0-6 7
20 10 • 10
8 14 7
4•9 .9 2
10 . 1 .9 6 •2 11 4 7 7 12 7 7 4 13 1 7 . 10 14 6 7 4 15 3 6 . 5 2 1 16 6 6 3 2 17 1 • 6 5 3 3 18 2 3' 5 4 5 19 6 5 3 6 20. 5 10 21 13 10 22 12 . 2 10 23 12 2 9 24 ... 8 2 9 25 9 2- 9 26 14 1 9 27 20 1 9 28 16 1 9 29 11 1 8 3 0. 6 1 8 31 . .8 1 7 32 4 1 7 33 4 ", 1 6 34 3 1 6 35 •0 1 6 36 1 1 6 37 -1 1 6 38 -2 1- 4 39 1 '0 3 40 0 2 41 • 1 2
TSSM on M27 at 20°C
- Mite stages
Date E. L. PC. PN. DC. DN. TC. FA. MA.
0-6 20

460
7. 10 10 8 11 3 .. - 9 10 10 10 2 9 7 11 1 5 5 7 12 1 6 8 3 13 .2 7 8 14 1 5 4 8 15 1 5 10 2 16 1 3 5 3 6 17 5 1 5 5 7 18 25 1 3 4 10 19 34 1 4 13 20 51 4 13 21 53 4 13 22 42 2 13 23 33 2 13, 24 33 2 13 25 14 2 13 26 32 2 13 27 46 2 12 28 54 2 12 29 46 2 12 30 29 2 11 31 25 2 10 32 8 2 8 33 8 2 7 34 11 2 7 35 7 2 7 36- 5 2 7 37 2 2 6 38 2 2 5 39 5 2 5 40 1 2 5 41 0 2 5
.TSSM on M4 at 25°C
-Date E. L. PC. PN.
Mite stages
DC. DN. TC. FA. MA.
0-4 5 6 7
25 10 15 3 1 21
4 7 14 8 1 17 7 9 3 15 7 10 7 11 2 5 11 3 . 4 . 4 3 14 12 14 4 6 15 13 9 6 19 14 7 3 19 15 18 2 18 16 49 1 18 17 60 1 18
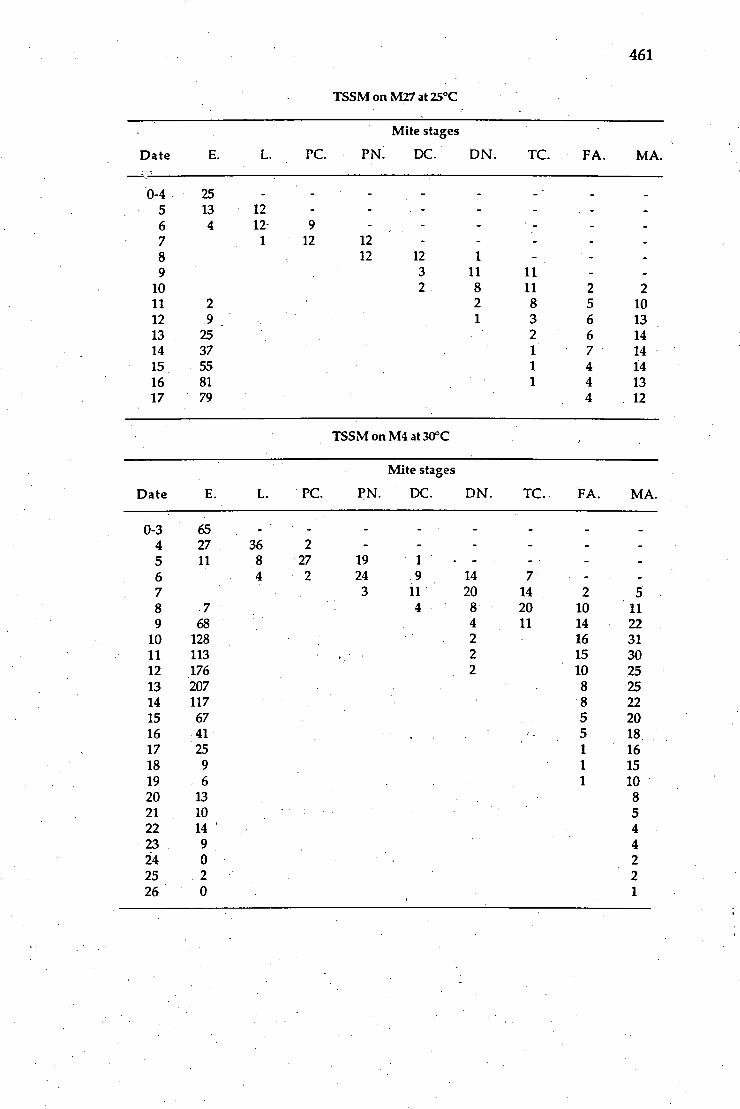
461
TSSM on M27 at 25°C
Date E. L. PC. PN.
Mite stages
DC. DN. TC. FA. MA.
0-4 25 5 13 12 6 4 12- 9 7 1 12 12 8 12 12 1 9 3 11 11
10 2 8 11 2 2 11 2 2 8 5 10 12 9 1 3 6 13 13 25 2 6 14 14 37 1 7 14 15 55 1 4 14 16 81 1 4 13 17 79 4 12
TSSM on M4 at 30°C
Mite stages
Date E. L. PC. PN. DC. DN. TC. FA. MA.
0-3 65 - 4 27 36 2 5 11 8 27 19 6 4 2 24 9 14 7 7 3 11 20 14 2 5 8 7 4 8 20 10 11 9 68 4 11 14 22
10 128 2 16 31 11 113 2 15 30 12 176 2 10 25 13 207 8 25 14 117 8 22 15 67 5 20 16 41 5 18 17 25 1 16 18 9 1 15 19 6 1 10 20 13 8 21 10 5 22 14' 4 23 9 4 24 0 2 25 2 2 26 0 1

462
TSSM on M27at 30°C
Date E. L. PC. PN.
Mite stages
DC. DN. TC. FA. MA.
0-3 65 - - 4 36 29 5 19 22 13 6 2 2 18 6 15 8 7 4 4 16 15 4 4 8 9 1 3 5 19 12 6 9 74 4 9 13 19 10 157 6 13 22 11 177 15 26 12 143 10. 23 13 253 10 20 14 230 7 20 15 189 5 19 16 108 5 17 17 65 5 15 18 52. 3 12 19 42 3 • 8 20 61 1 7 21 35 1 7 22 23 1 7 23 28 1 6 24 12 1 4 25 8 1 3 26 1 1 2
Appendix 6.2. One-factor ANOVA for developmental period from eggs to adults of TSSM
on M4 at 76°/0RH and a light intensity of 171 lux among different temperatures.
Source DF Sum of square Mean square F-test
Between groups
Within groups •
Total •
2
60
686.6413
87.7194
774.3607
343.3207
1.5124
227.0035**
Appendix 6.3. One-factor ANOVA for developmental period from eggs to adults of TSSM
on M27 at 76%R1-I, and a light intensity of 171 lux among different temperatures.
Source DF sum of square Mean square
F-test
Between groups
Within groups
Total
2
50
52
584.8265
65.6264
650.4528
292.4132
1.3125
222.7864**

463
Appendix 7.1. One-factor ANOVA for the number of ventral glands among 27 genotypes of
hops.
Source
DF Sum of square Mean square F-test
‘-- Between groups
Within groups
Total
26
189
215
182.03798
1137.36847.
1319.40645
7.00146
6.01782
1.1635ns
Appendix 7.2. One-factor ANOVA for the number of trichomes among 27 genotypes of
hops.
Source DF Sum of square Mean square F-test
Between groups
Within groups
Total
26
189
215
359.36297
907.63893
1267.00190
13.82165
4.80232
2.8781**
Appendix 7.3. One-factor ANOVA for the diameters of ventral glands among 27 genotypes
of hops.
Source
DF Sum of square Mean square F-test
Between groups
Within groups
Total
. 26
189
215
25528.90852
43258.91067
68787.81919
981.8811
228.8831
4.2899**
• Appendix 7.4. One-factor ANOVA for the basal diameters of trichomes among 27
genotypes of hops.
Source
DF Sum of square Mean square F-test
Between groups 26 10436.05497 401.38673 1.8749*•
Within groups 135 28901.17918 214.08281
Total . 161 39337.23416
Appendix 7.5. One-factor ANOVA for the length of trichomes among 27 genotypes of
hops.
Source • DF Sum of square Mean square F-test
Between groups
Within groups
Total
26
135 •
161
558643.33778
1820502.22667
2379145.56444
21486.28222
13485.20168
1.5933*

464
Appendix 7.6. One-factor ANOVA for the number of stomata per min2 among 27 genotypes
of hops.
Source - DF Sum of square Mean square F-test
Between groups
Within groups
Total
26
189
215
1.38227E10
4.20869E10
5.59096E10
5.31644E8
2.22682E8
2.3875**
Appendix 7.7. One-factor ANOVA for stomatal length among 27 genotypes of hops.
Source DF Sum of square Mean square F-test
Between groups
Within groups
Total
26
189
215
546.08214
1706.38985
2252.47199
21.00316
9.02852
2.3263**
Appendix 7.8. One-factor ANOVA for stonnatal width among 27 genotypes of hops.
Source
DF Sum of square Mean square F-test
_ Between groups 26 72.58409 -2.7917 2.7330**
Within groups 189 193.05797 1.0215
Total 215 • 265.64206
Appendix 7.9. One-factor ANOVA for the thickness of leaves among 27 genotypes of hops.
Source DF Sum of square Mean square F-test
•Between groups
Within groups
Total
26
135
•161
2211.8842
12305.1250
14517.0092
85.07247
91.14907
0.9333ns
Appendix 7.10. One-factor ANOVA for thickness of leaf veins among 27 genotypes of
hops.
Source
DF Sum of square Mean square •F-test
Between groups
Within groups
Total
26
135
161
0.56293
13.82373
14.38665
0.02165
0.10240
0.2114ns

465
Appendix 7.11. One-factor ANOVA for cuticle thickness of leaves among 27 genotypes.
Source DF Sum of square Mean square F-test
Between groups Within groups Total
26 135 161
12.35478 96.04000
108.39478
0.47518 0.71141
0.66795ns
Appendix 7.12. One-factor ANOVA for percent dry weight of leaves among 27 genotypes.
Source DF Sum of square Mean square F-test
Between groups Within groups Total
26 135 161
273.82540 482.75092 756.57632
10.53175 3.57593
2.9452**
Appendix 7.13. One-factor ANOVA for upper epidermis of leaves among 27 genotypes.
Source DF Sum of square Mean square F-test
Between groups Within groups Total
26 135 161
245.32884 1752.73000 1998.05884
9.43572 12.98319
0.72677ns
Appendix 7.14. One-factor ANOVA for lower epidermis of leaves among 27 genotypes.
Source DF Sum of square Mean square F-test
Between groups Within'groups Total
26 135 161
28.59858 144.34012
- 172.93869
1.09995 1.06919
1.02877ns
Appendix 8.1. Two-factor ANOVA for the number of adult females per leaf between two hop genotypes at three foliage densities under field conditions on December 30, 1992.
Source DF Sum of square Mean square F-test
Genotypes (A) 1 13.44444 13.44444 13.4444**
Foliage densities (B) 2 0.50000 0.25000 0.2500ns
AB 2 0.05556 0.02778 0.0278ns
Error 30 30.00000

466
Appendix 8.2. Two-factor ANOVA for the total number of mites per leaf between two hop
genotypes at three foliage densities under field conditions on January 13, 1993.
Source DF • Sum of square Mean square F-test
Genotypes (A) 1 64685.4444 64685.4444 28.3364**
Foliage densities (B) 2 26343.0556 13171.5278 5.7699**
AB 2 29651.3889 14825.6944 6.4946**
Error 30 68483.0000 2282.7667
Appendix 8.3. Two-factor ANOVA for the total number of mites per adhesive tape
between two hop genotypes at three foliage densities under field conditions on January 27,
1993.
Source DF Sum of square Mean square F-test
Genotypes (A) 1 96.69444 46.69444 3.28955ns
Foliage densities (B) 2 10.88889 5.44444 0.18522ns
AB 2 20.22222 10.11111 0.34398ns
Error 30 881.83333 29.39444
Appendix 8.4. Two-factor ANOVA for the total number of mites per leaf between two hop
genotypes at three foliage densities under field conditions on February 10,1993.
Source DF Sum of square Mean square F-test
Genotypes (A) 1 16.0000 16.0000 0.88889ns
Foliage densities (B) 2 37.5556 18.7778 1.04321ns
AB 2 8.6667 4.3333 0.24074ns
Error 30 540.0000 18.0000
Appendix 8.5. Two-factor ANOVA for the total number of mites per leaf between two hop
genotypes at three' foliage densities under field conditions on February 17, 1993.
Source DF Stun of square Mean square F-test
Genotypes (A) 1 91.1250 '91.1250 1.21732ns
Foliage densities (B) 2 158.0278 79.0139 1.05553ns
AB 2 56.2500 28.1250 • 0.37571ns
Error 66 4940.5833 74.8573

467
Appendix 8.6. Two-factor ANOVA for the total number of mites per leaf between two hop
genotypes at three foliage densities under field conditions on February 24, 1993.
Source DF Sum of square Mean square F-test
Genotypes (A) 1 50.00000 50.00000 0.08049ns
Foliage densities (B) 2 5277.52778 2638.76389 4.24765*
AB 2 817.75000 408.87500 0.65817ns
Error 66 41001.16667 ' 621.22980
Appendix 8.7. Two-factor ANOVA for the total number of mites per leaf between two hop
genotypes at three foliage densities under field conditions on March 3, 1993.
Source
DF Sum of square Mean square F-test
Genotypes (A) 1 455.01389 455.01389 1.05636ns
Foliage densities (B) 2 3130.33333 1565.16667 3.63368*
AB 2 906.77778 453.38889 1.05258ns
Error 66 28428.75000 430.73864
Appendix 8.8. Two-factor ANOVA for the total number of predatory mites per leaf
between two hop genotypes at three foliage densities under field conditions on February
17, 1993.
Source DF Sum of square Mean square F-test
Genotypes (A) 1 45.1250 45.1250 8.048**
Foliage densities (B) 2 23.4444 11.7222 2.091ns
•- AB • 2 • 2.3333 1.1667 0.208ns
•Error • 66 370.0830 . • 5.6073
Appendix 8.9. Two-factor ANOVA for the total number of predatory mites per leaf
between two hop genotypes at three foliage densities under field conditions on February
•24, 1993.
Source DF Sum of square • Mean square F-test
Genotypes (A) • 1 120.125 120.125 7:606**
Foliage densities (B) 2 183.583 91.792 5.812**
AB 2 22.750 . 11.375 0.720ns •
•Error 66 1042.417 15.794

468
Appendix 8.10. Two-factor ANOVA for the total number of predatory mites per leaf
between two hop genotypes at three foliage densities under field conditions on March 3,
1993.
Source
DF
Sum of square
Mean square
F-test
Genotypes .(A) 1 242.00000 242.00000 5.929*
Foliage densities (B) 2 443.44444 221.72200 5.432"
AB 2 142.33333 71.16700 1.744ns
Error 66 2694.00000 40.81800
Appendix 8.11. Two-factor ANOVA for the total number of mites per leaf among four hop
genotypes at two foliage densities on the first sampling occasion under glasshouse
conditions.
Source
DF Swn of square Mean square F-test
Genotypes (A) - 3 3958.562 1319.521 5.725**
Foliage densities (B) 1 682.521 682.521 2.961ns
AB 3 4376.729 1458.91 6.33**
Error 40 9219.167 230.479
Appendix 8.12. Two-factor ANOVA for the total number of mites per leaf among four hop
genotypes at two foliage densities on the second sampling occasion under glasshouse
conditions.
Source
DF Sum of square Mean square F-test
Genotypes (A) 3 33745.167 11248.389 10.39**
Foliage densities (B) 1 3816.333 3816.333 3.525ns
AB 3 31416.500 10472.167 9.673**
Error 40 43302.667 1082.567
Appendix 9.1. One-factor ANOVA for the photosynthesis rate of hop leaves among three
genotypes.
Source DF Sum of square Mean square F-test
Between groups
Within groups
Total
2
15
17
40.268
72.881
113.149
20.134
4.859
4.144*

469
Appendix 9.2. One-factor ANOVA for the stomata! conductance of hop leaves among
•three 'genotypes.
Source DF Sum of square Mean square F-test
Between groups
Within groups
Total V V
2
15
17
0.009
0.015 _
0.025
0.005
0.001
4379*
Appendix 9.3. One-factor ANOVA for the photosynthesis rate of hop leaves between
cutting and rootstock plants.
Source
DF Sum of square Mean square F-test
Between groups 1 6.313 6.313 0-513ns
• Within groups 10 123.074 12.307
Total 11 129.387
Appendix 9.4. One-factor ANOVA for the stomatal conductance of hop leaves between
cutting and rootstock plants.
Source •
DF Sum of square Mean square - F-test
Between groups. 1 0.006 0.006 3.077ns
Within groups 10 0.020 0.002
'Total 11 0.026
Appendix 9.5. One-factor ANOVA for the photosynthesis rate of hop leaves between
plastic treated and untreated plants.
Source
DF Sum of square Mean square V F-test
Between groups 1 0.096 0.096 0.036ns
Within groups 22 378.245 V 17.193 ..
. Total 23 • 378.341
Appendix 9.6. One-factor ANOVA for the stomata! conductance of hop leaves between
plastic treated and untreated plants.
Source DF
Sum of square Mean square F-test
Between groups
1
2.042E-6 .042E-6 4.571E-4rts
Within groups
22
0.098 0.004 s
Total
23
0.098

470
Appendix 9.7. One-factor ANOVA for the photosynthesis rate of hop leaves between
TSSM infested and uninfested plants for the first measurement under glasshouse
conditions.
Source DF - Sum of square Mean square F-test
Between groiips - 1 0.095 0.095 0.017ns
Within groups 10 55.008 5.501
Total 11 55.104
Appendix 9.8. One-factor ANOVA for the stomatal conductance of hop leaves between
TSSM infested and uninfested plants for the first measurement under glasshouse
conditions.
Source
DF Sum of square Mean square F-test
Between groups 1 3.741E-4 3.741E-4 0.181ns
Within groups 10 0.021 0.002
Total 11 0.021
Appendix 9.9. One-factor ANOVA for the photosynthesis rate of hop leaves between
TSSM infested and uninfested plants for the second measurement under glasshouse
conditions.
Source DF Sum of square Mean square F-test
Between i groups
1
30.600 30.600 3.752ns
Within groups
4
32.621 8.155
Total
5
63.222
•Appendix. 9.10. One-factor ANOVA for the stomatal conductance of hop leaves between
•TSSM infested and uninfested plants for the second measurement under glasshouse
conditions.
Source DF Sum of square Mean square F-test
Between groups
0.007 0.007 7.189ns
Within groups
4
0.004 0.001
Total
5
0.01-1

471 •
Appendix 9.11. One-factor ANOVA for the photosynthesis rate of hop leaves between
TSSM infested and uninfested plants under field conditions.
Source DF Sum of square Mean.square F7test
Between groups
Within groups
Total
1
12
13
29.872
119.973
149.844
29.872
9.998
2.988ns
Appendix 9.12. One-factor ANOVA for the stoma tal conductance of hop leaves between
TSSM infested and uninfested.plants under field conditions.
Source DF
Sum of square Mean square F-test
Between groups 1 3.401E-4 3.401E-4 0.18ns
Within groups 12 , 0.023 0.002
Total 13 0.023
Copyright © 2022 FDOKUMEN