Effect of improved home ventilation on asthma control and house dust mite allergen levels
10
Original article Effect of improved home ventilation on asthma control and house dust mite allergen levels The prevalence of asthma in the western world has increased over the last generation (1), in parallel with a warmer indoor microclimate (2). Increased insulation, double glazing and modern building construction have improved standards of heating and energy efficiency in homes, but with reduced ventilation (3). A warm, humid indoor environment favours the growth of the house dust mite population (4). Sensitivity to the house dust mite is the most common allergy associated with asthma in the UK (5). Studies of occupational asthma (6) and altitude (7) infer that the environment may directly affect symptoms of asthma. Accordingly, allergen avoidance has been advocated as an important aspect of asthma manage- Background: The warm, humid environment in modern homes favours the dust mite population, but the effect of improved home ventilation on asthma control has not been established. We tested the hypothesis that a domestic mechanical heat recovery ventilation system (MHRV), in addition to allergen avoidance measures, can improve asthma control by attenuating re-colonization rates. Methods: We conducted a randomized double-blind placebo-controlled parallel group trial of the installation of MHRV activated in half the homes of 120 adults with asthma, allergic to Dermatophagoides pteronyssinus. All homes had carpets steam cleaned and new bedding and mattress covers at baseline. The primary outcome was morning peak expiratory flow (PEF) at 12 months. Results: At 12 months, the primary end-point; change in mean morning PEF as compared with baseline, did not differ between the MHRV group and the control group (mean difference 13.5 l/min, 95% CI: )2.6 to 29.8, P = 0.10). However, a secondary end-point; evening mean PEF, was significantly improved in the MHRV group (mean difference 24.5 l/min, 95% CI: 8.9–40.1, P = 0.002). Indoor relative humidity was reduced in MHRV homes, but there was no difference between the groups in Der p 1 levels, compared with baseline. Conclusions: The addition of MHRV to house dust mite eradication strategies did not achieve a reduction in mite allergen levels, but did improve evening PEF. G. R. Wright 1 , S. Howieson 2 , C. McSharry 3 , A. D. McMahon 4 , R. Chaudhuri 1 , J. Thompson 5 , I. Donnelly 3 , R. G. Brooks 6 , A. Lawson 2 , L. Jolly 3 , L. McAlpine 7 , E. M. King 8 , M. D. Chapman 8 , S. Wood 5 , N. C. Thomson 1 1 Department of Respiratory Medicine, Division of Immunology, Infection and Inflammation, University of Glasgow, Glasgow, UK; 2 Department of Architecture and Building Science, University of Strathclyde, Glasgow, UK; 3 Department of Immunology, Infection and Inflammation, University of Glasgow, Glasgow, UK; 4 Robertson Centre for Biostatistics, University of Glasgow, Glasgow, UK; 5 Section of General Practice, Division of Community-Based Sciences, University of Glasgow, Glasgow, UK; 6 Department of Economics, University of Strathclyde, Glasgow, UK; 7 Department of Respiratory Medicine, Monklands General Hospital, Coatbridge, UK; 8 Indoor Biotechnologies, Inc, Charlottesville, VA, USA Key words: asthma; clinical trial; house dust mite; placebo-controlled; ventilation. Professor Neil C. Thomson Respiratory Medicine Section Division of Immunology Infection and Inflammation University of Glasgow Gartnavel General Hospital G12 OYN Glasgow UK This paper is dedicated to the memory of Dr Stuart Wood, Senior Lecturer in General Practice at the University of Glasgow, who died in March 2006. His kindness, encouragement and enthusiasm for the project are greatly missed. Accepted for publication 29 March 2008 Allergy 2009: 64: 1671–1680 Ó 2009 John Wiley & Sons A/S DOI: 10.1111/j.1398-9995.2009.02098.x 1671
Transcript of Effect of improved home ventilation on asthma control and house dust mite allergen levels
Original article
Effect of improved home ventilation on asthma control and house
dust mite allergen levels
The prevalence of asthma in the western world hasincreased over the last generation (1), in parallel with awarmer indoor microclimate (2). Increased insulation,double glazing and modern building construction haveimproved standards of heating and energy efficiency inhomes, but with reduced ventilation (3). A warm,humid indoor environment favours the growth of the
house dust mite population (4). Sensitivity to the housedust mite is the most common allergy associated withasthma in the UK (5).
Studies of occupational asthma (6) and altitude (7)infer that the environment may directly affect symptomsof asthma. Accordingly, allergen avoidance has beenadvocated as an important aspect of asthma manage-
Background: The warm, humid environment in modern homes favours the dustmite population, but the effect of improved home ventilation on asthma controlhas not been established. We tested the hypothesis that a domestic mechanicalheat recovery ventilation system (MHRV), in addition to allergen avoidancemeasures, can improve asthma control by attenuating re-colonization rates.Methods: We conducted a randomized double-blind placebo-controlled parallelgroup trial of the installation of MHRV activated in half the homes of 120 adultswith asthma, allergic to Dermatophagoides pteronyssinus. All homes had carpetssteam cleaned and new bedding and mattress covers at baseline. The primaryoutcome was morning peak expiratory flow (PEF) at 12 months.Results: At 12 months, the primary end-point; change in mean morning PEF ascompared with baseline, did not differ between the MHRV group and thecontrol group (mean difference 13.5 l/min, 95% CI: )2.6 to 29.8, P = 0.10).However, a secondary end-point; evening mean PEF, was significantly improvedin the MHRV group (mean difference 24.5 l/min, 95% CI: 8.9–40.1, P = 0.002).Indoor relative humidity was reduced in MHRV homes, but there was nodifference between the groups in Der p 1 levels, compared with baseline.Conclusions: The addition of MHRV to house dust mite eradication strategiesdid not achieve a reduction in mite allergen levels, but did improve evening PEF.
G. R. Wright1, S. Howieson2,C. McSharry3, A. D. McMahon4,R. Chaudhuri1, J. Thompson5,I. Donnelly3, R. G. Brooks6, A.Lawson2, L. Jolly3, L. McAlpine7, E.M. King8, M. D. Chapman8, S. Wood5,N. C. Thomson1
1Department of Respiratory Medicine, Division ofImmunology, Infection and Inflammation, Universityof Glasgow, Glasgow, UK; 2Department ofArchitecture and Building Science, University ofStrathclyde, Glasgow, UK; 3Department ofImmunology, Infection and Inflammation, Universityof Glasgow, Glasgow, UK; 4Robertson Centre forBiostatistics, University of Glasgow, Glasgow, UK;5Section of General Practice, Division ofCommunity-Based Sciences, University of Glasgow,Glasgow, UK; 6Department of Economics, Universityof Strathclyde, Glasgow, UK; 7Department ofRespiratory Medicine, Monklands General Hospital,Coatbridge, UK; 8Indoor Biotechnologies, Inc,Charlottesville, VA, USA
Key words: asthma; clinical trial; house dust mite;placebo-controlled; ventilation.
Professor Neil C. ThomsonRespiratory Medicine SectionDivision of ImmunologyInfection and InflammationUniversity of GlasgowGartnavel General HospitalG12 OYN GlasgowUK
This paper is dedicated to the memory of Dr StuartWood, Senior Lecturer in General Practice at theUniversity of Glasgow, who died in March 2006. Hiskindness, encouragement and enthusiasm for theproject are greatly missed.
Accepted for publication 29 March 2008
Allergy 2009: 64: 1671–1680 � 2009 John Wiley & Sons A/S
DOI: 10.1111/j.1398-9995.2009.02098.x
1671

ment, yet the evidence for its efficacy is limited (8). Largestudies of conventional measures to eradicate dust mites,such as mite-impermeable mattress covers, have notshown a benefit for asthma symptoms (9). However,Morgan et al. (10) found significant improvement inasthma when a number of allergens were targeted incombination with an educational intervention and smok-ing cessation advice. This study was not blinded and somepositive results were subjective, nevertheless it addressedthe concept of environmental control of allergens that hasrepeatedly been emphasized in statements from theGlobal Initiative for Asthma and the National AsthmaEducation and Prevention Program. Recent meta-analy-ses recommended that repeating common interventions isunlikely to be informative (9); however, more compre-hensive interventional studies on house dust mite controlare required (11), and more specifically, there is a need forstudying the health benefits of dehumidification by adouble-blind, randomized, controlled trial with adequatesample size measuring clinical outcomes in patients withasthma (12).As house dust mites thrive in moist conditions, an
additional eradication strategy would be to reduce indoorair humidity by improving ventilation. Mechanical heatrecovery ventilation (MHRV) is a method of activeventilation using both an extract and a supply fan.Outdoor air is supplied at ambient humidity into theliving room and bedroom, and extracted from the kitchenand bathroom. There is evidence that mechanical venti-lation reduces indoor air humidity and the house dustmite allergen burden (13). This randomized controlledstudy in 40 homes of HDM-sensitive asthma subjects,with mechanical ventilation, achieved significantly lowerhumidity levels and Der p 1 allergen (means: 2.05 vs5.82 lg/g dust, P < 0.001), with a trend for improvedhistamine (PC) (20) (P = 0.085) but no change insymptoms or lung function; therefore the clinical effectsof mechanical ventilation on asthma remain unproven.We tested the hypothesis that domestic MHRV, inaddition to allergen avoidance measures, can improveasthma control of subjects sensitive to house dust miteallergen, by attenuating re-colonization rates.
Methods
Participants
Participants 16–60 years of age were eligible if they had asthmafor more than 1 year, were on regular inhaled corticosteroids andhad daily symptoms. Participants were recruited from generalpractice (GP) and hospital clinics in Lanarkshire, Scotland, UK.Variable airflow obstruction of ‡12% on spirometry (14) or‡15% on peak expiratory flow (PEF) readings (15) or a symptomscore of ‡0.86 on the Asthma Control Questionnaire (ACQ) (16,17) was required for inclusion. Participants had a minimumforced expiratory volume in 1 s (FEV1) of >50% predicted atbaseline and had not had an exacerbation in the previous month.Spirometric measurements were recorded using an electronic
spirometer (Vitalograph, Buckingham, UK), before and afterinhaled salbutamol (400 lg) (18). Peak expiratory flow measure-ments were taken at home using a mini-Wright peak flow meter(Clement Clarke, Harlow, UK). Allergy to Dermatophagoidespteronyssinus was determined by positive skin prick test, definedas a wheal diameter of ‡3 mm greater than that of negativecontrol at 15 min; solutions supplied by ALK Abello (Hunger-ford, UK) (19). Participants were excluded if they were likely tomove house or had a pet that provoked their symptoms. TheLanarkshire Research Ethics Committee approved the study. Allparticipants gave written informed consent.
Study design
This was a randomized, double-blind, placebo-controlled, parallelgroup study to evaluate the effect of home installation of MHRV, inaddition to conventional eradication strategies, in adults withasthma who were sensitive to D. pteronyssinus.
MHRV system
Homes of eligible participants were surveyed to assess suitability forinstallation. Homes were excluded if installation was technicallydifficult or if there was asbestos in ceiling materials. MHRV units(HR250 or HR800) were fitted in the roof space or hallway cup-board in 120 suitable homes by �Vent-Axia�� (Crawley, UK). Theseenergy efficient units extract air continuously from the kitchen andbathroom and deliver prewarmed air via insulated ducts into thebedroom and living room (Fig. 1). The system provided anadditional 0.5 air exchanges per hour to the living room andbedroom.
Figure 1. Mechanical heat recovery ventilation system. Themechanical heat recovery unit extracts air from the kitchen andbathroom (orange ducts) and delivers outdoor air warmed byexchanging heat with outgoing air via ducts into the bedroomand living room (red ducts). As designed and installed by�Vent-Axia��.
Wright et al.
1672 � 2009 John Wiley & Sons A/S Allergy 2009: 64: 1671–1680

Clinical assessments
Participants attended a baseline visit where spirometry wasrecorded, and the ACQ (16) and St George�s Respiratory Ques-tionnaire (20) were completed. The EQ-5D questionnaire (21) wasused as a standardized generic instrument for valuing health-relatedquality of life. Each score is categorized and �quality of life years�(QALYs) can be calculated from the difference in health states dueto an intervention. Participants compiled a 2-week PEF diary priorto the visit. Nasal symptoms were recorded on a visual analoguescale (22). Serum total IgE and D. pteronyssinus and pollen-specificIgE antibody were measured by commercial enzyme-immunoassay(Sweden Diagnostics Ltd, Milton Keynes, UK) (23).
House dust allergen, humidity and other environmentalmeasurements
The architect team attended the home for a baseline visit. Thebedroom, living room floor and bed surface were vacuumed at arate of 1 m2/min to obtain complete dust samples using a Dysonmodel – DC14 (Dyson, London, UK). The dust samples were fil-tered and weighed, and a standardized soluble extract prepared. Theextract concentration of allergens from house dust mite (Der p 1,Der p 2), cat dander (Fel d1) and dog dander (Can f1) was measuredusing fluorescent multiplex array technology (Indoor Biotechnolo-gies, Charlottesville, VA, USA) (24). The microbial content of dustwas estimated by measuring soluble extract concentrations of bac-terial endotoxin and fungal b (1–3) glucan (Associates of Cape CodInc., East Falmouth, MA, USA).Temperature and humidity were recorded at 90-min intervals for
12 months in the living room and bedroom using thermohygro-graphs, �Gemini Tiny Tag Ultra two channel� data loggers (Gemini,Chichester, UK). The critical equilibrium humidity, at which nowater is gained or lost by the house dust mite, is 73% relativehumidity at 25�C (4). As maintaining relative humidity below 50%is a reasonable recommendation for reducing dust mites in the homein terms of practicability and efficacy (25), the proportion of timethat relative humidity fell below 50% was calculated.
Cigarette smoking history. A volunteered smoking history wasrecorded and objectively confirmed by quantifying plasma cotinine,a stable nicotine metabolite and an indirect measure of individualtobacco smoking. Cotinine was measured using a microplatecompetitive enzyme-immunoassay (Cozart Bioscience Ltd, Abing-don, Oxford, UK).
Allergen avoidance measures. Once baseline measurements werecomplete, allergen eradication was carried out in all homes. Carpetswere cleaned with a �Medivac� steam cleaner at the rate of 1 m2/min(Medivac Healthcare Ltd, Cambridge, UK). New pillows, duvetsand mattress covers were supplied to all participants (�Naturelle�range; Medivac Healthcare Ltd, Cambridge, UK).
Randomization and blinding
Randomization was created using a random number generator (sas
version 9 software, SAS Institute Inc. Cary, NC, USA), andperformed in sequential blocks of four using an automated tele-phone answering system at the Robertson Centre for Biostatistics,University of Glasgow, UK, by the architect team. Accordingly, afused electrical spur was switched in the roof space by the architectto activate half of the units. The unit activation device was con-cealed from the patient and the clinical research team.
To ensure blinding of intervention status, all participants weretold not to expect any significant sound or air movement. All theelectric switchgear were boxed into prevent tampering. To controlfor any audible signs, all the low-level electric motors were switchedon, but were not connected to the fans in the control group. Thefans were ceiling mounted and were relatively inaccessible.Furthermore, the air coming in had been warmed, which along withthe low flow rate would have been very difficult to detect. There-after, the topic of which group the subjects were assigned towas never brought up and the subjects were remarkably uncuriousabout this.
Follow-up
Participants were followed up at 3, 6, 9 and 12 months after ran-domization. Participants measured morning and evening PEF for2 weeks before each visit. At each visit, spirometry was performed,ACQ score was recorded and requirements for oral corticosteroids,hospitalizations, GP or Emergency Department (ED) visits and anyadverse reactions were noted. The St George�s Respiratory ques-tionnaire, the EuroQol questionnaire and nasal visual analoguescale and questionnaires were repeated at 6 and 12 months afterrandomization. At 12 months, blood samples for IgE serology, dustsamples and humidity measurements were taken and placebo unitsactivated.
Statistical analysis
The sample size was based upon a parallel group design, using astandard deviation of 40 l/min for mean morning PEF. The studywas intended to have 64 evaluable participants per group(n = 128), to have 80% power (at the 5% significance level) tocalculate a difference of 20 l/min.The primary analysis was a comparison between groups of the
change over baseline in morning PEF. Secondary end-points wereevening PEF, ACQ scores, exacerbation and hospitalization rates,spirometry, Der p 1 levels and humidity readings in the homes, IgElevels and economic evaluations. If 12-month data were not avail-able, 9-month data would be used instead. The main analyses werecarried out with ancova models adjusted for baseline severity. Theanalyses were firstly carried out on an intention-to-treat basis. A listof major protocol violators, consisting of those MHRV units thatwere prematurely activated by the electrician and any randomiza-tion errors, was created and the remaining population was denotedper the protocol set. The primary and secondary end-points wererepeated for the �per protocol� set. Binary end-points such as hos-pitalizations were compared by odds ratios, the 95% confidenceinterval and tested by Fisher�s exact test.
Results
Baseline characteristics of participants
A total of 4986 participants were invited to participate,482 attended clinical screening. Of these, 188 did not havea positive skin test to house dust mite allergens and 78were clinically unsuitable (35 were asymptomatic, 22 werelost to follow-up, 12 had low FEV1, nine were symptom-atic to their own pet). A total of 216 subjects fulfilled theclinical entry criteria (Fig. 2). Of these 216, 96 wereexcluded after a house survey which found that 53 thatdid not fulfil all housing criteria, and the reasons for
Improved home ventilation and asthma control
� 2009 John Wiley & Sons A/S Allergy 2009: 64: 1671–1680 1673

exclusion were firstly, possible asbestos in ceiling materialand secondly, technical difficulties in installing theMHRV unit. A further 43 subjects did not wish to havethe MHRV unit installed after discussing the practicaldetails of the unit with the house surveyor. Over time,recruitment and drop-out rates settled at 120 appropriatecandidates and MHRV units were installed, one subjectdefaulted and therefore 119 underwent randomization.
Baseline demographic characteristics of those random-ized were similar (Table 1).
Eighteen major protocol violators were excluded fromthe per protocol analysis as the MHRV machine hadbeen inadvertently prematurely activated by the electri-cian. Of these, five were further complicated, threehomes had delays of 6 months in randomization andwere withdrawn from follow-up. One withdrew due to ill
820 positive responses
482 clinically screened
216 clinically suitable
120 MHRV units installed
338 excluded by pre-clinical screening or non-
attendance
188 HDM skin test neg.78 clinically unsuitable.
53 houses inappropriate.43 withdrew consent.
4986 letters sent from 63practices and 2 clinics
119 randomised
47 placebo in per-protocolanalysis
54 MHRV-active in per-protocol analysis
1 non-attendance
60 MHRV - in intention-to-treat analysis
55 had 3 month data 55 had 6 month data 45 had 9 month data 53 had 12 month data
59 Control - in intention-to-treat analysis
46 had 3 month data 48 had 6 month data 38 had 9 month data 47 had 12 month data
12 had protocol violations 6 had protocol violations
Figure 2. Consort diagram: study profile.
Wright et al.
1674 � 2009 John Wiley & Sons A/S Allergy 2009: 64: 1671–1680

health. One unit appeared to have been reactivated twiceprior to randomization and was withdrawn. A furtherthree simple randomization errors were made becausethe MHRV system had already been activated by theelectrician and the randomization was not followedappropriately. These were included in the per protocolanalysis in the correct treatment arm. This was partlydue to the unusual form of a randomized clinical trialwithin an architecture study and lack of familiarity withthis procedure. In summary of loss to follow-up, 19patients did not attend the final follow-up: three majorprotocol violators were excluded by the team, onewithdrew due to ill health, one withdrew due to repeatedreactivation, five moved house and nine failed to attendappointments.
Outcomes
Clinical outcomes. A total of 100 participants, 53 MHRVand 47 placebo, attended follow-up at 12 months. Theclinical outcome measures are listed in Table 2. Theprimary end-point; change in mean morning PEF, did notdiffer between the MHRV group and the control group(mean difference: 13.5 l/min, 95% CI: )2.6 to 29.8,P = 0.10). However, there was a significant improvementin the MHRV group compared with the control group inmean evening PEF (mean difference: 24.5 l/min, 95% CI:8.9–40.1, P = 0.002) (Fig. 3).Values for spirometry, use of rescue medication, ACS,
St George�s Respiratory Questionnaire score, rhinitisscale, requirement for oral corticosteroids, GP or EDvisits or hospitalizations with asthma did not differbetween the two groups. In the economic analysis, therewas an insignificant gain of 0.02 QALYs per MHRVpatient. The �per protocol� analysis provided similarresults to the intention-to-treat analysis. No adverseevent was reported relating to the installation of theMHRV unit.
Indoor relative humidity and temperature. Mechanicalheat recovery ventilation system significantly reducedmean relative humidity in the bedrooms for a sustainedperiod from October to February (P < 0.05 each month)and in the living room from December to February(P < 0.05 each month) (Fig. 4). The median (inter-quartile range) per cent of time homes achieved areduction in the indoor relative humidity below 50%was greater in the MHRV group than in the controlgroup in the bedroom [45.1% (30.0–55.1) vs 21.0 (8.5–49.0), P = 0.001], but not in the living room [51.5%(35.4–58.7) vs 40.6% (12.8–63.5), P = 0.26].
Concentration of allergens and microbial products in housedust, and serum IgE levels. At 12 months, the changes inmean Der p 1 and Der p 2 concentrations in the bed,bedroom and living room carpets, as compared withbaseline concentrations, did not differ between the
MHRV group and the control group, nor were theredifferences in total or house dust mite specific IgE levels.There were no significant differences in secondary anal-yses of cat dander allergen (Fel d1), dog dander allergen(Can f1), b(1–3) glucan or endotoxin (Table 2).
Table 1. Baseline demographic and clinical characteristics
Characteristic MHRV group Control group
Subjects; no. 60 59Age; years 41.6 (9.6) 42.3 (10.7)Gender: female; no. 41 32Ethnicity; no.
Caucasian 58 58Asian 2 1
Smoking; no.Smoker 12 17Ex-smoker 7 13Never smoker 41 29Plasma cotinine, ng/ml 3.4 (2.0–63.0) 3.2 (2.0–68.0)
Duration of asthma; years 21.0 (9.2–30.7) 16.0 (9.0–25.0)BMI (kg/m2) 28.4 (5.5) 29.6 (6.3)Morning PEF (l/min) 414.5 (116.9) 409.1 (91.6)Evening PEF (l/min) 428.2 (112.4) 426.9 (94.9)Spirometry (% predicted)
FEV1 prebronchodilator 83.7 (18.0) 82.7 (17.7)Postbronchodilator 86.6 (18.1) 89.5 (15.6)FVC prebronchodilator 93.5 (13.6) 95.0 (15.4)
Short-acting b-agonist (daily no. puffs) 2.0 (1.0–2.7) 2.0 (1.0–3.0)Asthma control score (0–6) 1.57 (1.18–2.54) 1.86 (1.14–2.71)St George�s score (0–100%) 35.3 (23.9) 34.6 (20.4)Co-morbidity; no.
Hay fever or nasal allergy 44 47Eczema 15 14Hypertension 5 8Angina 2 3Diabetes 3 2Previous stroke 1 2Other respiratory 0 1Previous M.I. 0 1
Inhaled corticosteroid;beclomethasone equiv. lg
1000 (800–2000) 800 (400–1200)
Other asthma medication; no.b2-agonist (short-acting inhaled) 60 58b2-agonist (short-acting oral) 1 1b2-agonist (long-acting) 41 34Theophylline 4 4Anti-cholinergic 5 6Leukotriene receptor antagonist 15 9Oral steroid 4 3
Rhinitis VAS (1–10)Sneeze 4.50 (1.20–6.30) 5.00 (1.82–5.47)Nasal discharge 3.60 (0.80–6.00) 5.00 (1.35–7.22)Nasal blockage 4.7 (3.00–6.76) 5.00 (1.90–7.37)
Serum HDM IgE antibody 5.7 (1.6–13.1) 6.1 (2.3–15.2)Der p 1 (lg/g of dust)
Bed 27.6 (7.0–60.8) 29.6 (3.6–44.0)Bedroom carpet 12.7 (8.6–42.6) 17.7 (10.0–47.4)Living room carpet 8.5 (4.8–25.5) 16.8 (7.2–37.2)
The values within parenthesis are given as mean and standard deviation, or medianand inter-quartile range.MHRV, mechanical heat recovery ventilation system; no., number; HDM, house dustmite.
Improved home ventilation and asthma control
� 2009 John Wiley & Sons A/S Allergy 2009: 64: 1671–1680 1675
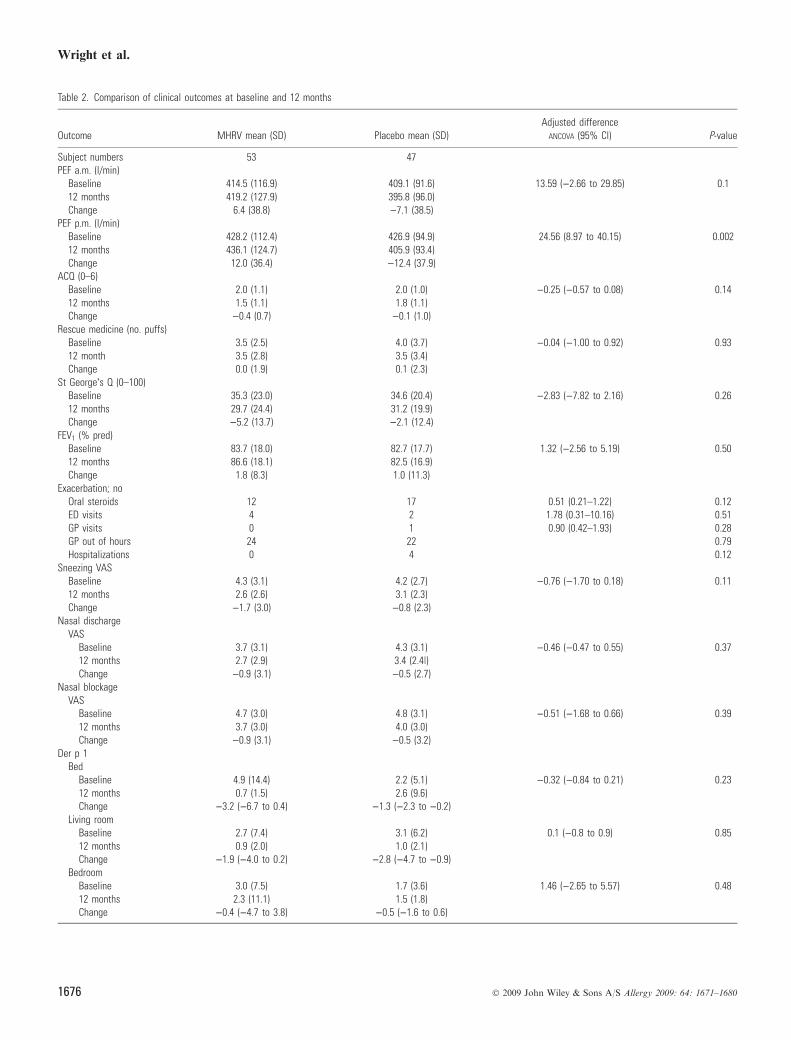
Table 2. Comparison of clinical outcomes at baseline and 12 months
Outcome MHRV mean (SD) Placebo mean (SD)Adjusted difference
ANCOVA (95% Cl) P-value
Subject numbers 53 47PEF a.m. (l/min)
Baseline 414.5 (116.9) 409.1 (91.6) 13.59 ()2.66 to 29.85) 0.112 months 419.2 (127.9) 395.8 (96.0)Change 6.4 (38.8) )7.1 (38.5)
PEF p.m. (l/min)Baseline 428.2 (112.4) 426.9 (94.9) 24.56 (8.97 to 40.15) 0.00212 months 436.1 (124.7) 405.9 (93.4)Change 12.0 (36.4) )12.4 (37.9)
ACQ (0–6)Baseline 2.0 (1.1) 2.0 (1.0) )0.25 ()0.57 to 0.08) 0.1412 months 1.5 (1.1) 1.8 (1.1)Change )0.4 (0.7) )0.1 (1.0)
Rescue medicine (no. puffs)Baseline 3.5 (2.5) 4.0 (3.7) )0.04 ()1.00 to 0.92) 0.9312 month 3.5 (2.8) 3.5 (3.4)Change 0.0 (1.9) 0.1 (2.3)
St George�s Q (0–100)Baseline 35.3 (23.0) 34.6 (20.4) )2.83 ()7.82 to 2.16) 0.2612 months 29.7 (24.4) 31.2 (19.9)Change )5.2 (13.7) )2.1 (12.4)
FEV1 (% pred)Baseline 83.7 (18.0) 82.7 (17.7) 1.32 ()2.56 to 5.19) 0.5012 months 86.6 (18.1) 82.5 (16.9)Change 1.8 (8.3) 1.0 (11.3)
Exacerbation; noOral steroids 12 17 0.51 (0.21–1.22) 0.12ED visits 4 2 1.78 (0.31–10.16) 0.51GP visits 0 1 0.90 (0.42–1.93) 0.28GP out of hours 24 22 0.79Hospitalizations 0 4 0.12
Sneezing VASBaseline 4.3 (3.1) 4.2 (2.7) )0.76 ()1.70 to 0.18) 0.1112 months 2.6 (2.6) 3.1 (2.3)Change )1.7 (3.0) )0.8 (2.3)
Nasal dischargeVAS
Baseline 3.7 (3.1) 4.3 (3.1) )0.46 ()0.47 to 0.55) 0.3712 months 2.7 (2.9) 3.4 (2.4|)Change )0.9 (3.1) )0.5 (2.7)
Nasal blockageVAS
Baseline 4.7 (3.0) 4.8 (3.1) )0.51 ()1.68 to 0.66) 0.3912 months 3.7 (3.0) 4.0 (3.0)Change )0.9 (3.1) )0.5 (3.2)
Der p 1Bed
Baseline 4.9 (14.4) 2.2 (5.1) )0.32 ()0.84 to 0.21) 0.2312 months 0.7 (1.5) 2.6 (9.6)Change )3.2 ()6.7 to 0.4) )1.3 ()2.3 to )0.2)
Living roomBaseline 2.7 (7.4) 3.1 (6.2) 0.1 ()0.8 to 0.9) 0.8512 months 0.9 (2.0) 1.0 (2.1)Change )1.9 ()4.0 to 0.2) )2.8 ()4.7 to )0.9)
BedroomBaseline 3.0 (7.5) 1.7 (3.6) 1.46 ()2.65 to 5.57) 0.4812 months 2.3 (11.1) 1.5 (1.8)Change )0.4 ()4.7 to 3.8) )0.5 ()1.6 to 0.6)
Wright et al.
1676 � 2009 John Wiley & Sons A/S Allergy 2009: 64: 1671–1680

Table 2. (Continued)
Outcome MHRV mean (SD) Placebo mean (SD)Adjusted difference
ANCOVA (95% Cl) P-value
Der p 2Bed
Baseline 1.1 (2.2) 0.9 (2.1) )0.04 ()0.16 to 0.08) 0.4912 months 0.3 (0.7) 1.0 (4.0)Change )0.6 ()1.0 to )0.3) )0.6 ()1.0 to )0.1)
Living roomBaseline 1.2 (3.1) 1.4 (3.1) 0.56 ()0.65 to 1.77) 0.3512 months 0.9 (3.3) 0.5 (1.3)Change )0.2 ()1.5 to 1.1) )1.3 ()2.4 to )0.2)
BedroomBaseline 1.7 (3.6) 1.0 (2.0) 1.07 ()1.63 to 3.76) 0.4312 months 1.6 (7.3) 0.9 (1.3)Change 0.1 ()2.4 to 2.7) )0.3 ()0.7 to 0.2)
Cat allergenBed
Baseline 2.9 (5.5) 3.3 (0.6) )0.29 ()2.63 to 2.06) 0.8012 months 3.3 (5.6) 3.4 (0.2)Difference 0.0 ()1.3 to 1.4) 0.4 ()1.7 to 2.5)
Living roomBaseline 2.1 (3.8) 2.7 (5.0) )1.81 ()4.35 to 0.73) 0.1612 months 3.5 (5.9) 4.6 (7.9)Difference 1.1 ()0.5 to 2.7) 2.9 (0.8 to 5.0)
BedroomBaseline 3.1 (5.4) 4.0 (7.8) 0.61 ()1.59 to 2.81) 0.5812 months 3.6 (5.1) 3.3 (5.6)Difference 0.3 ()1.1 to 1.8) )1.1 ()3.9 to 1.7)
Dog allergenBed
Baseline 22.2 (41.8) 21.5 (3.8) 7.22 ()8.64 to 23.07) 0.3612 months 25.4 (56.1) 11.0 (31.7)Difference )1.7 ()12.1 to 8.7) )8.4 ()23.5 to 6.7)
Living roomBaseline 97.7 (461.4) 29.8 (50.8) )3.17 ()29.3 to 23.0) 0.8112 months 41.9 (71.9) 34.8 (53.1)Difference )67.1 ()207.1 to 73.0) 5.8 ()11.9 to 23.4)
BedroomBaseline 29.8 (57.9) 26.2 (54.1) )5.20 ()22.4 to 12.0) 0.5512 months 34.4 (59.1) 26.2 (4.1)Difference )1.4 ()13.9 to 11.2) 7.2 ()6.6 to 21.1)
Mould (lg/g dust)b(1–3) glucan
Living roomBaseline 322 (453) 390 (582) )7.8 ()26.0 to 10.2) 0.3812 months 108 (111) 113 (37.2)Change )241 (486) )360 (657)
BedBaseline 347 (483) 255 (304) 22.7 ()0.4 to 45.9) 0.0512 months 99 (50.8) 77.8 (35.4)Change )273 (544) )214 (366)
BedroomBaseline 351 (966) 226 (216) )15.4 ()40.4 to 9.5) 0.2212 months 107 (39.4) 114 (64.9)Change )270 (1063) )142 (233)
Endotoxin (EU)Bed
Baseline 3539 (3213) 4479 (3475) )1187 ()2935 to 560) 0.1812 months 4583 (3450) 5952 (3617)Change 1109 (3934) 1253 (4969)
Improved home ventilation and asthma control
� 2009 John Wiley & Sons A/S Allergy 2009: 64: 1671–1680 1677

Discussion
This randomized, double-blind, placebo-controlled studyexamined the effect of the installation of domestic MHRVon asthma control in adults sensitive to house dust miteallergen. Itwas based on thehypothesis that awarm, humidenvironment favours the growth of the house dust mitepopulation and that decreasing indoor air humidity withmechanical ventilation would reduce the dust mite allergenburden and improve asthma control.
We found that the MHRV intervention reduced indoorrelative humidity in the autumn and winter months, butwith no associated effects on Der p 1 burden. We found at12 months that there was no change in morning PEF;which was our primary end-point, but there was animprovement in evening PEF. The evening PEF is asecondary outcome measure and although the observedimprovement was statistically significant, this might havebeen by statistical chance. Interpretation of this result,therefore, will need to be speculative; however, becausethe mean improvement of 24.5 l/min was also of clinicalsignificance, this should not be discounted. The morningPEF changes were internally consistent with these eveningPEF changes, but they did not quite achieve statisticalsignificance. One reason for this is probably because thestudy was insufficiently powered to demonstrate a clinicalresponse; only 100 of a projected optimum number of 128participants completed follow-up. This level of subjectattrition reflected the complexity and difficulties in projectmanaging this level of domestic intervention and shouldbe factored in any future study.
It was clear that the reduced relative humidity wasinsufficient to impact on Der p1 burden, and there wasalso no difference between the groups in change in serumhouse dust mite specific IgE antibody. Domestic dehu-midification has reduced mite allergen burden in some
Table 2. (Continued)
Outcome MHRV mean (SD) Placebo mean (SD)Adjusted difference
ANCOVA (95% Cl) P-value
Living roomBaseline 5136 (2990) 6318 (2891) 497 ()679 to 1674) 0.4012 months 7776 (2548) 6986 (2589)Change 2666 (4488) 555 (4418)
BedroomBaseline 5725 (3202) 5005 (3438) )64.6 ()1465 to 1336) 0.9212 months 6996 (3047) 6916 (2754)Change 1148 (4541) 1902 (3823)
IgE to HDMBaseline 15.8 (25.8) 20.4 (31.6) 2.09 ()5.67 to 9.85) 0.5912 months 15.5 (24.2) 16.5 (26.1)Change )0.3 (21.7) )3.8 (13.9)
Data represented as mean (SD). Values represent mean difference (CI) compared with baseline. Allergen concentration in lg/g dust.CI, confidence interval; PEF, peak expiratory flow; FEV1, forced expiratory volume in 1 s; ACQ, Asthma Control Questionnaire score (range: 0–6, with higher scores indicatingworse asthma control); St George�s Respiratory Questionnaire (range: 0–100, with higher scores indicating worse quality of life); ED, Emergency Department, GP, GeneralPractitioner; VAS, visual analogue scale (range: 1–10, with higher scores indicating worse symptoms); IgE, immunoglobulin E; Der p 1 and Der p 2, Dermatophagoidespteronyssinus allergen 1 and 2; EU, endotoxin units.
340
360
380
400
420
440
460
PE
F (
litre
s/m
in)
Morning PEF
MHRV
control
P = 0.100 P = 0.118
340
360
380
400
420
440
460
0 6 12
PE
F (
litre
s/m
in)
Time (months)
0 6 12 Time (months)
Evening PEF
MHRV
control
P = 0.015 P = 0.002
A
B
Figure 3. Morning and evening peak expiratory flow (PEF)measurements at baseline and during follow-up. (A) At 6 and12 months, the change in mean morning PEF, as compared withbaseline, did not differ between the MHRV group and thecontrol group. (B) At 6 and 12 months, the change in meanevening PEF, as compared with baseline, was significantlygreater in the MHRV (mechanical heat recovery ventilation)group compared with the control group (6 months, P = 0.015and at 12 months, P = 0.002).
Wright et al.
1678 � 2009 John Wiley & Sons A/S Allergy 2009: 64: 1671–1680

(13) but not in this, or other (26, 27) trials. Even withinoverall humidity control, minor fluctuations of humiditylevels may permit mite survival. For example, a NewZealand study (26) showed that, although active ventila-tion did reduce relative humidity to less than 50% for7 months of the year, there was no effect on mite levelsbecause values were below the critical equilibriumhumidity for mite survival for only 39% of the total of24-h periods for which measurements were made. Inanother UK study, Fletcher (27) also found no impact ofMHRV on Der p 1. It is also possible that 12 months wastoo short a period to measure a difference in seasonallyaffected mite re-colonization rates. One underlying reasonfor this variable lack of efficacy in mite control may berelated to climate (28). For ventilation to reduce indoorhumidity, the outdoor air humidity must be sufficientlylower; and this may be relevant for our study located inthe particularly humid West of Scotland and in others,for example, New Zealand (26). Based on these observa-tions, a future development in the intervention would be ahumidistat controller, set at the optimum proportion ofrelative humidity for temperature, linked to a variableflow fan unit to ensure more refined humidity suppres-sion.Although we found no effect of MHRV on mite
burden, we did not measure airborne allergen concentra-tions, and it is possible that the increased ventilationrather than the, albeit inadequate, dehumidification could
be helpful. We would suggest that ventilation and airsampling for allergen removal be considered in any futureintervention trial. There is some evidence for this concept.Burr et al. (29) recently conducted an unblinded moulderadication trial that included improved home ventilationand found symptomatic improvement in wheeze, medi-cation use and rhinitis. However, in our study nodifference between fungal glucan exposures was observedbetween the groups. Other possible factors affected byimproved ventilation would include a reduction in respi-ratory viruses (30), but in our study there was noassociated change in GP visits, and other componentsof indoor air quality, such as particulate matter orvolatile organic compounds, seem unlikely. In this case,we can speculate on some of the secondary outcomeresults of our study. We found that with the MHRVintervention, there was a more prolonged and moresignificant reduction in relative humidity in the bed-rooms, and that the Der p1 levels were lower in bedding,which is arguably the most important exposure. Theremay be some merit in considering simple improvedventilation in bedrooms of asthmatic children.
Acknowledgments
The authors are grateful for the initial planning and advicefrom Professor George Morris from the Scottish Centre for
Figure 4. Relative humidity values and temperature over 12 months. The twice monthly mean (standard deviation on one-side)relative humidity and temperature in the bedroom and living room show an annual periodicity with the lowest levels in March. MHRVreduced humidity in the bedrooms during April (P < 0.05) and then for a sustained period from October to February (P < 0.001).The humidity in the living room was significantly reduced (P < 0.05) from December to February. There was no effect of MHRV ontemperature. Placebo group; d MHRV group.
Improved home ventilation and asthma control
� 2009 John Wiley & Sons A/S Allergy 2009: 64: 1671–1680 1679

Infection and Environmental Health. They acknowledge thesecretarial support of Mrs Janice Reid and the technicalassistance of Mrs Christine Downie and her staff at MonklandsHospital Respiratory Investigation Centre. They thank Mr AlanLawson, Mr Robert Gemmel, Mr Paul McBrearty and Mr DenisDixon as part of the architect study team. They also thank theLanarkshire GPs and practice staff for their help with recruit-ment, North and South Lanarkshire Councils for arranging
asbestos checks and �Vent-Axia� for their co-operation in planningsurveys and installation of MHRV units. They thank the partic-ipants and their families for their helpful participation in thestudy. The development of the Multiplex Array for IndoorAllergens (MARIA) has been supported in part by the NationalInstitute of Environmental Health Sciences, Small BusinessInnovation Research contract ES55545.
References
1. Global Burden of Asthma. The GlobalInitiative for Asthma. Available at:http://www.ginasthma.org, 2009;Accessed May 2009.
2. Platts-Mills T, Vervloet D, Thomas W,Aalberse RC, Chapman MD. Indoorallergens and asthma: Report of theThird International Workshop. J Al-lergy Clin Immunol 1997;100:S1–S24.
3. Burberry P. Ventilation and air quality.In: Burberry P, editor. Environment andservices. London: Longman Scientificand Technical, 1992:43–55.
4. Arlian LG. Water balance and humidityrequirements of house dust mites. ExpAppl Acarol 1992;16:15–35.
5. Simpson B, Custovic A, Simpson A,Hallam CL, Walsh D, Marolia H et al.NAC Manchester Asthma and AllergyStudy: risk factors for asthma andallergic disorders. Clin Exp Allergy2001;31:391–399.
6. Papi A, Corbetta L, Fabbri LM. Whatcan we learn from late-onset and occu-pational asthma? Clin Exp Allergy1998;28:174–180.
7. Grootendorst DC, Dahlen SE, van denBos JW, Duiverman EJ, Veselic-CharvatM, Vrijlandt EJLE et al. Benefits of highaltitude allergen avoidance in atopicadolescents with moderate to severeasthma, over and above treatment withhigh dose inhaled steroids. Clin ExpAllergy 2001;31:400–408.
8. British Thoracic Society. Scottish Inter-collegiate Guidelines Network. BritishGuideline on the Management of Asth-ma. Thorax 2008;63:27–28.
9. Gøtzsche PC, Johansen HK. House dustmite control measures for asthma: sys-tematic review. Allergy 2008;63:646–659.
10. Morgan WJ, Crain EF, Gruchalla RS,O�Connor GT, Kattan M, Evans R et al.For the Inner City Asthma Group.Results of a home-based environmentalintervention in urban children with asth-ma. N Eng J Med 2004;351:1068–1080.
11. Brugge D, Rioux C, Groover T, PetersJ, Kosheleva A, Levy JI. Dust mites:using data from an intervention study tosuggest future research needs anddirections. Rev Environ Health2007;22:245–254.
12. Singh M, Bara A, Gibson P. Humiditycontrol for chronic asthma. CochrDatabase Syst Rev 2002 (2):CD003563.
13. Warner JA, Frederick JM, Bryant TN,Weich C, Raw GJ, Hunter C et al.Mechanical ventilation and high-effi-ciency vacuum cleaning: a combinedstrategy of mite and mite allergenreduction in the control of mite-sensitiveasthma. J Allergy Clin Immunol2000;105:75–82.
14. GINA Report, Global Strategy forAsthma Management and Prevention.Available at: http://www.ginas-thma.com/Guideline, 2006.
15. Venables KM, Burge PS, Davison AG,Newman Taylor AJ. Peak flow recordsin surveys: reproducibility of observer�sreports. Thorax 1984;39:828–832.
16. Juniper E, O�Byrne P, Guyatt G, FerriePJ, King DR. Development and valida-tion of a questionnaire to measureasthma control. Eur Respir J 1999;14:902–907.
17. Juniper EF, Bousquet J, Abetz L,Bateman ED, with the GOALCommittee. Identifying �well-controlled�and �not well-controlled� asthma usingthe Asthma Control Questionnaire.Respir Med 2006;100:616–621.
18. Miller M, Hankinson J, Brusasco V,Burgos F, Casaburi R, Coates A et al.�ATS/ERS Task force: standardisationof lung function testing�. 2. Standardi-sation of spirometry. Eur Respir J2005;26:319–338.
19. Rusznak C, Davies R. Diagnosingallergy. BMJ 1998;316:686–689.
20. Jones P, Quirk F, Baveystock C. The StGeorge�s Respiratory Questionnaire.Respir Med 1991;85:25–31.
21. Brooks R, with the EuroQol Group.EuroQol: the current state of play.Health Policy 2006;37:53–72.
22. Benninger MS, Anon J, Mabry RL. Themedical management of rhinosinusitis.Otolarygol Head Neck Surg1997;117:S41–S49.
23. Ahlstedt S. Understanding the useful-ness of specific IgE blood tests in allergy.Clin Exp Allergy 2002;32:11–16.
24. Earle CD, King EM, Tsay A, PittmanK, Saric B, Vailes L et al. High-throughput fluorescent multiplex arrayfor indoor allergen exposure assessment.J Allergy Clin Immunol 2007;119:428–433.
25. Arlian LG, Platts-Mills TAE. The biol-ogy of dust mites and the remediation ofmite allergens in allergic disease. JAllergy Clin Immunol 2001;107:S406–S413.
26. Crane J, Ellis I, Siebers R, Grimmet D,Lewis S, Fitzharris P et al. A pilot studyof the effect of mechanical ventilationand heat exchange on house-dust mitesand Der p 1 in New Zealand homes.Allergy 1998;53:755–762.
27. Fletcher AM, Pickering CAC, CustovicA. Reduction in humidity as a methodof controlling mites and mite allergens:the use of mechanical ventilation inBritish domestic dwellings. Clin ExpAllergy 1996;26:1051–1056.
28. Colloff MJ. Dust mite control andmechanical ventilation: when the climateis right. Clin Exp Allergy 2005;24:94–96.
29. Burr ML, Matthews IP, Arthur RA,Watson HL, Gregory CJ, Dunstan FDJet al. The effect on patients with asthmaof eradicating visible indoor mould – arandomised controlled trial. Thorax2007;62:767–772.
30. Hersoug L-G. Viruses as the causativeagent related to �dampness� and themissing link between allergen exposureand onset of allergic disease. Indoor Air2005;15:363–366.
Wright et al.
1680 � 2009 John Wiley & Sons A/S Allergy 2009: 64: 1671–1680